4.3.3. Parameter Performance Analysis
To evaluate the generalization ability of UVC-SMA under different network conditions, respectively change the node scale, node mobility speed, and node initial energy.
- (1)
Influence of Node Scale
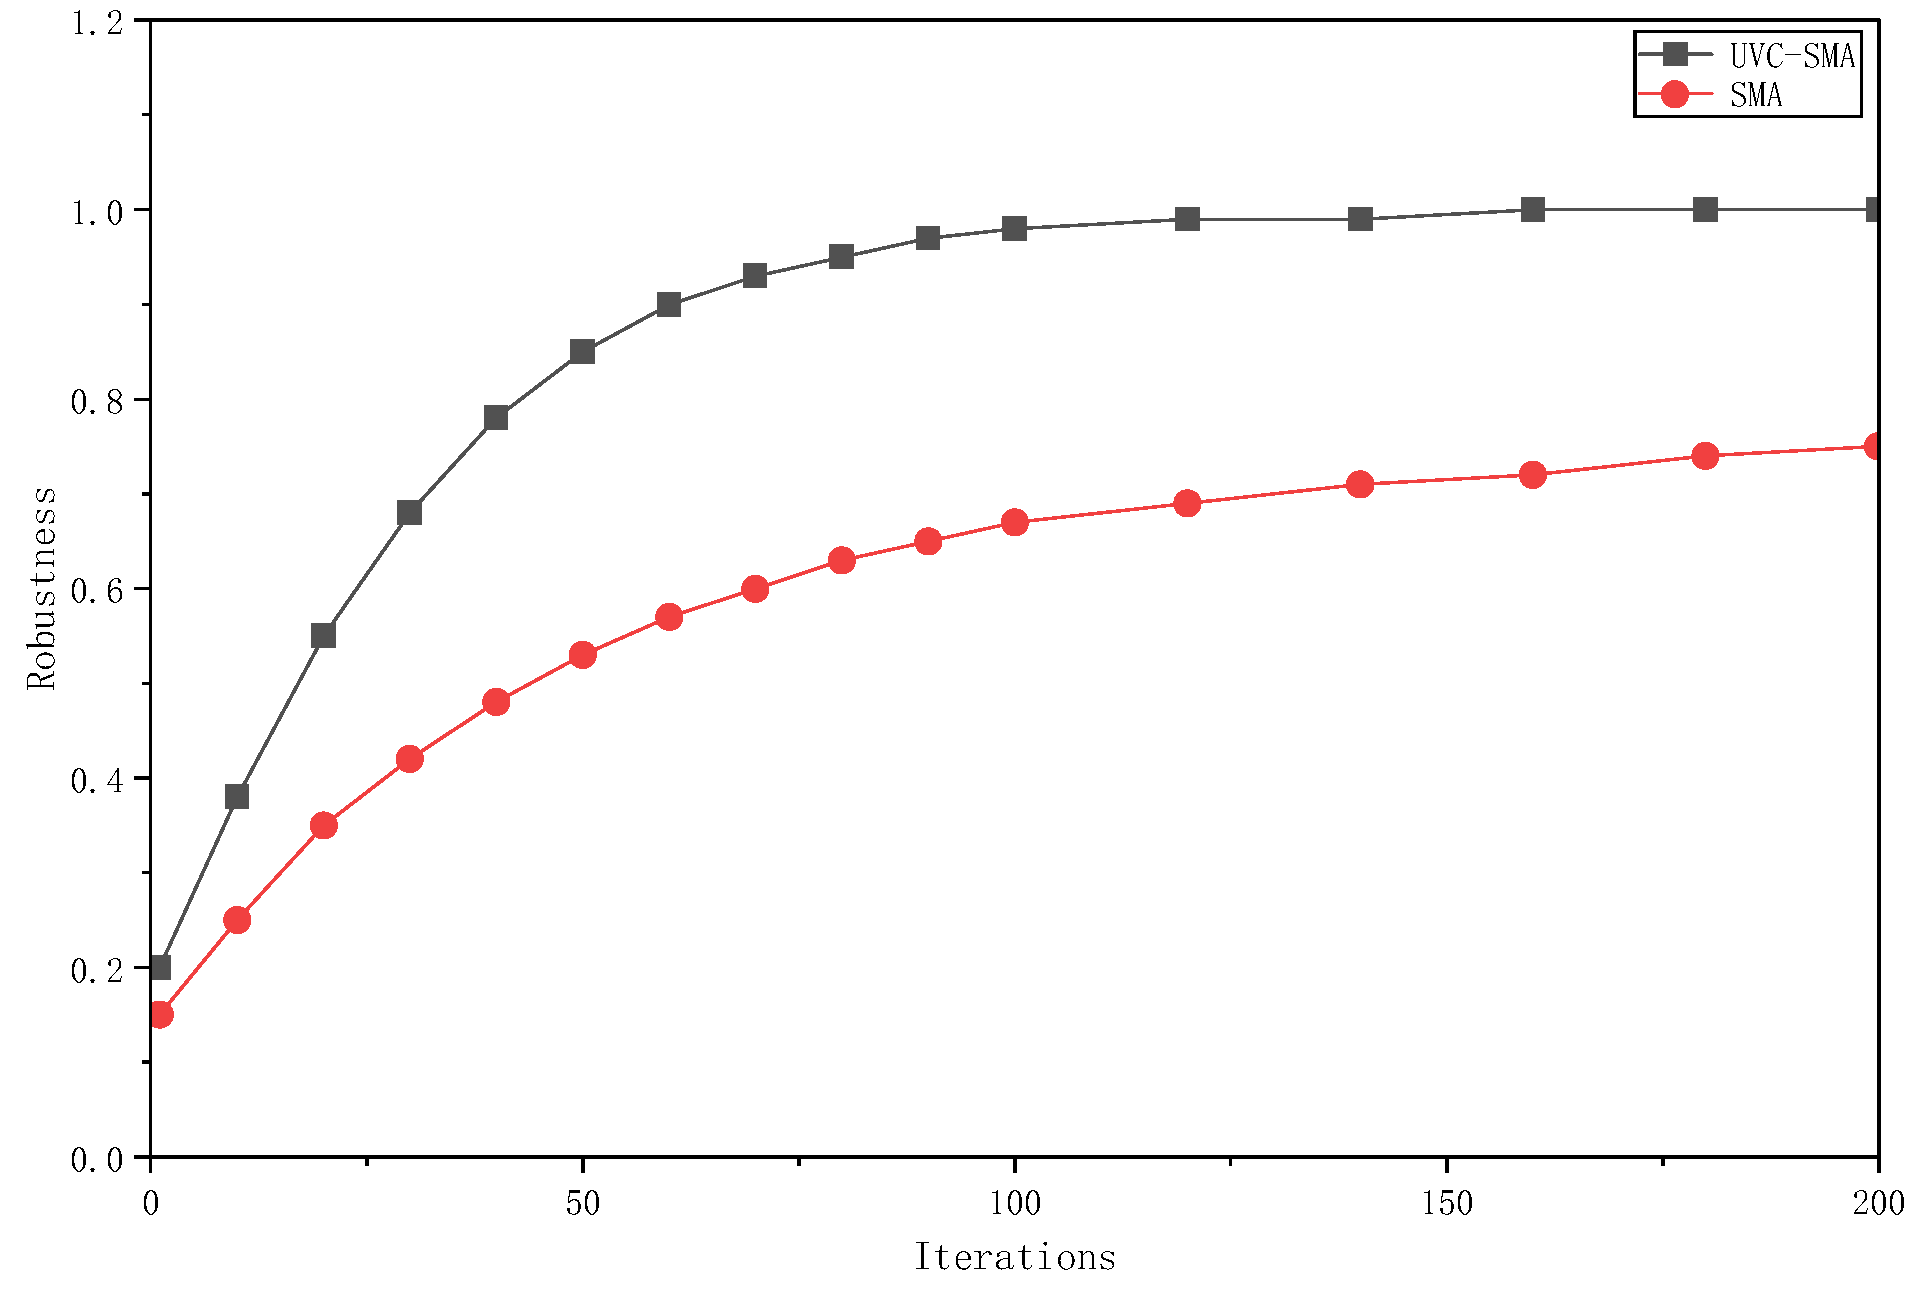
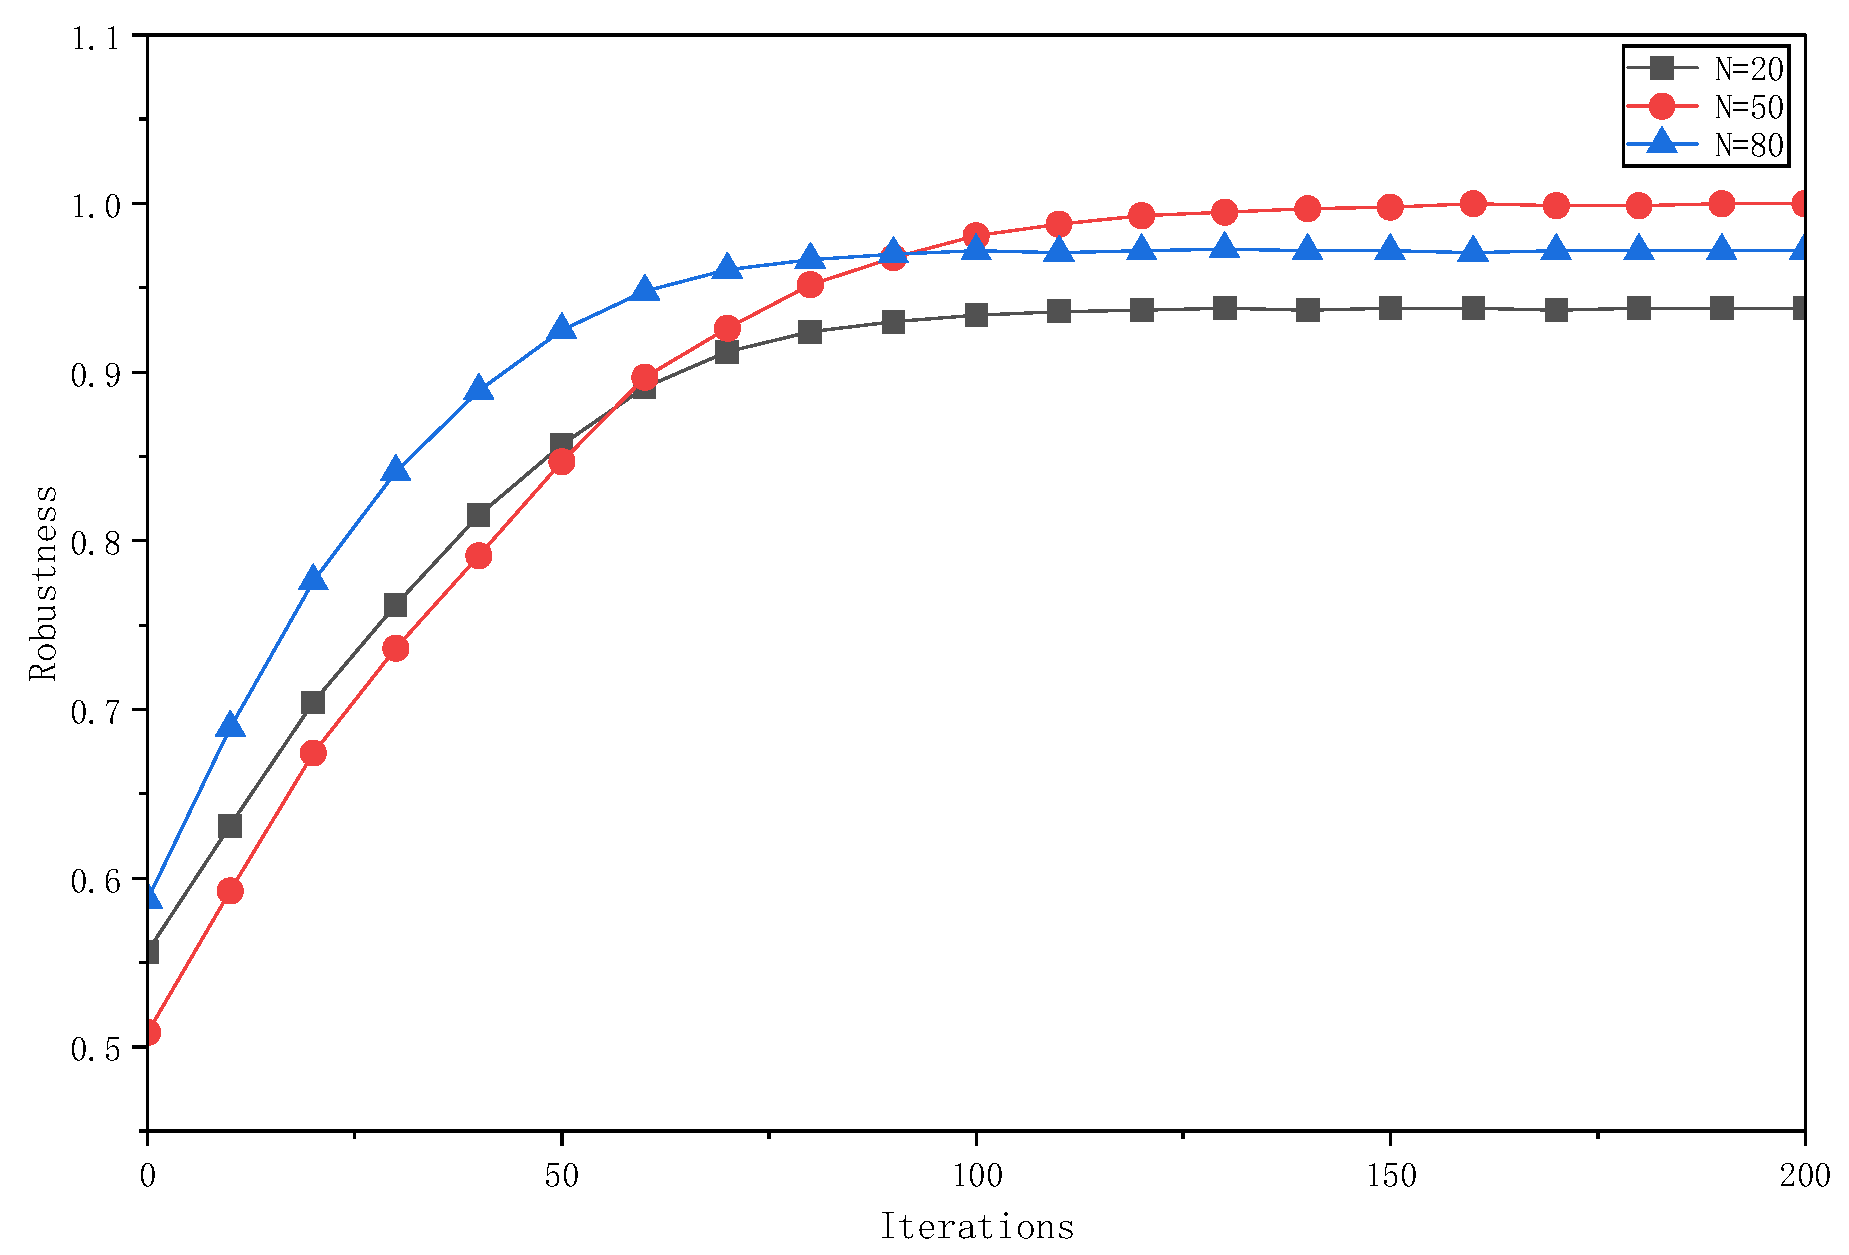
Experiments are carried out for three typical node scales: 20, 50, and 80. Each group includes 10 independent repeated simulations, and the robustness evolution curve over the full iteration period is shown in
Figure 11.
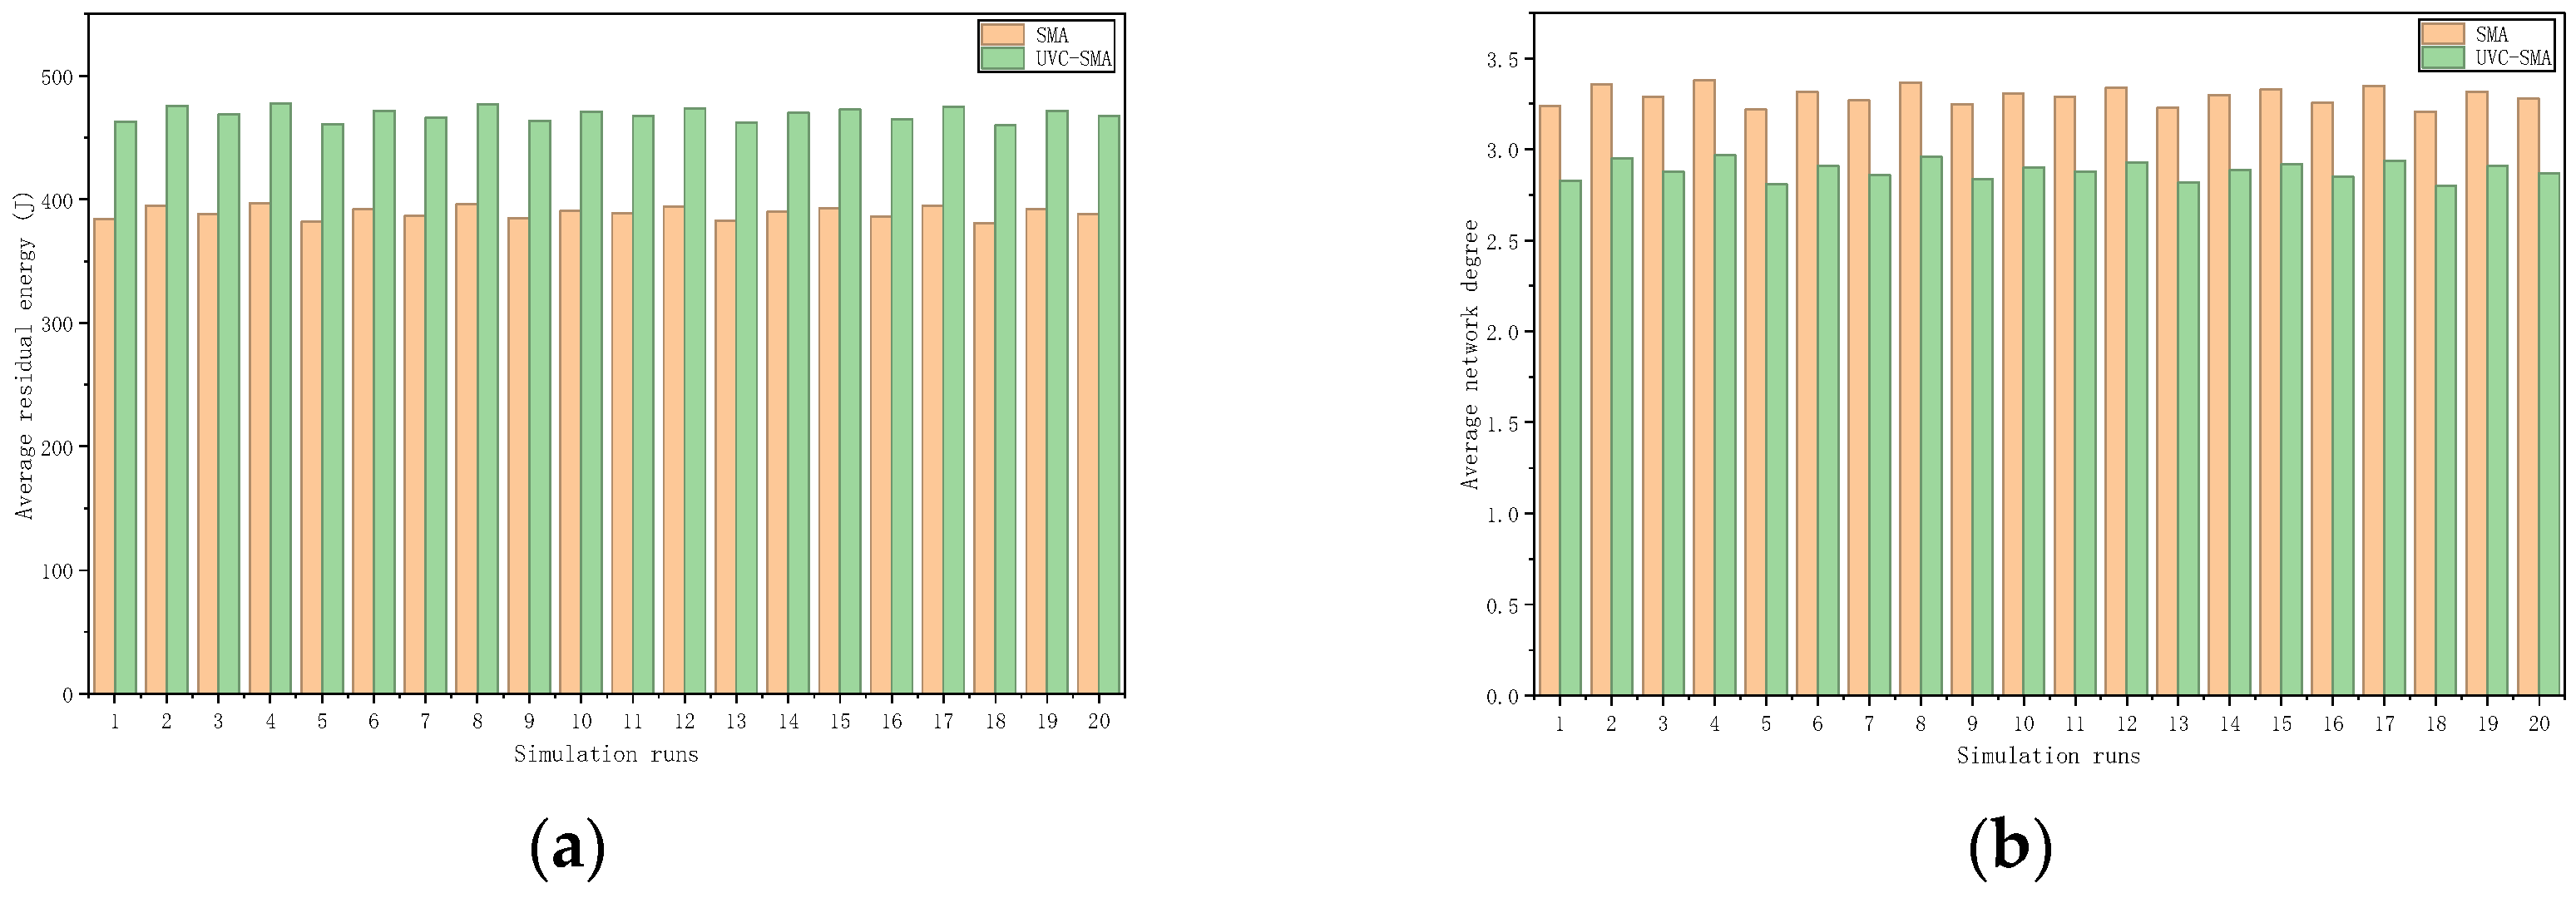
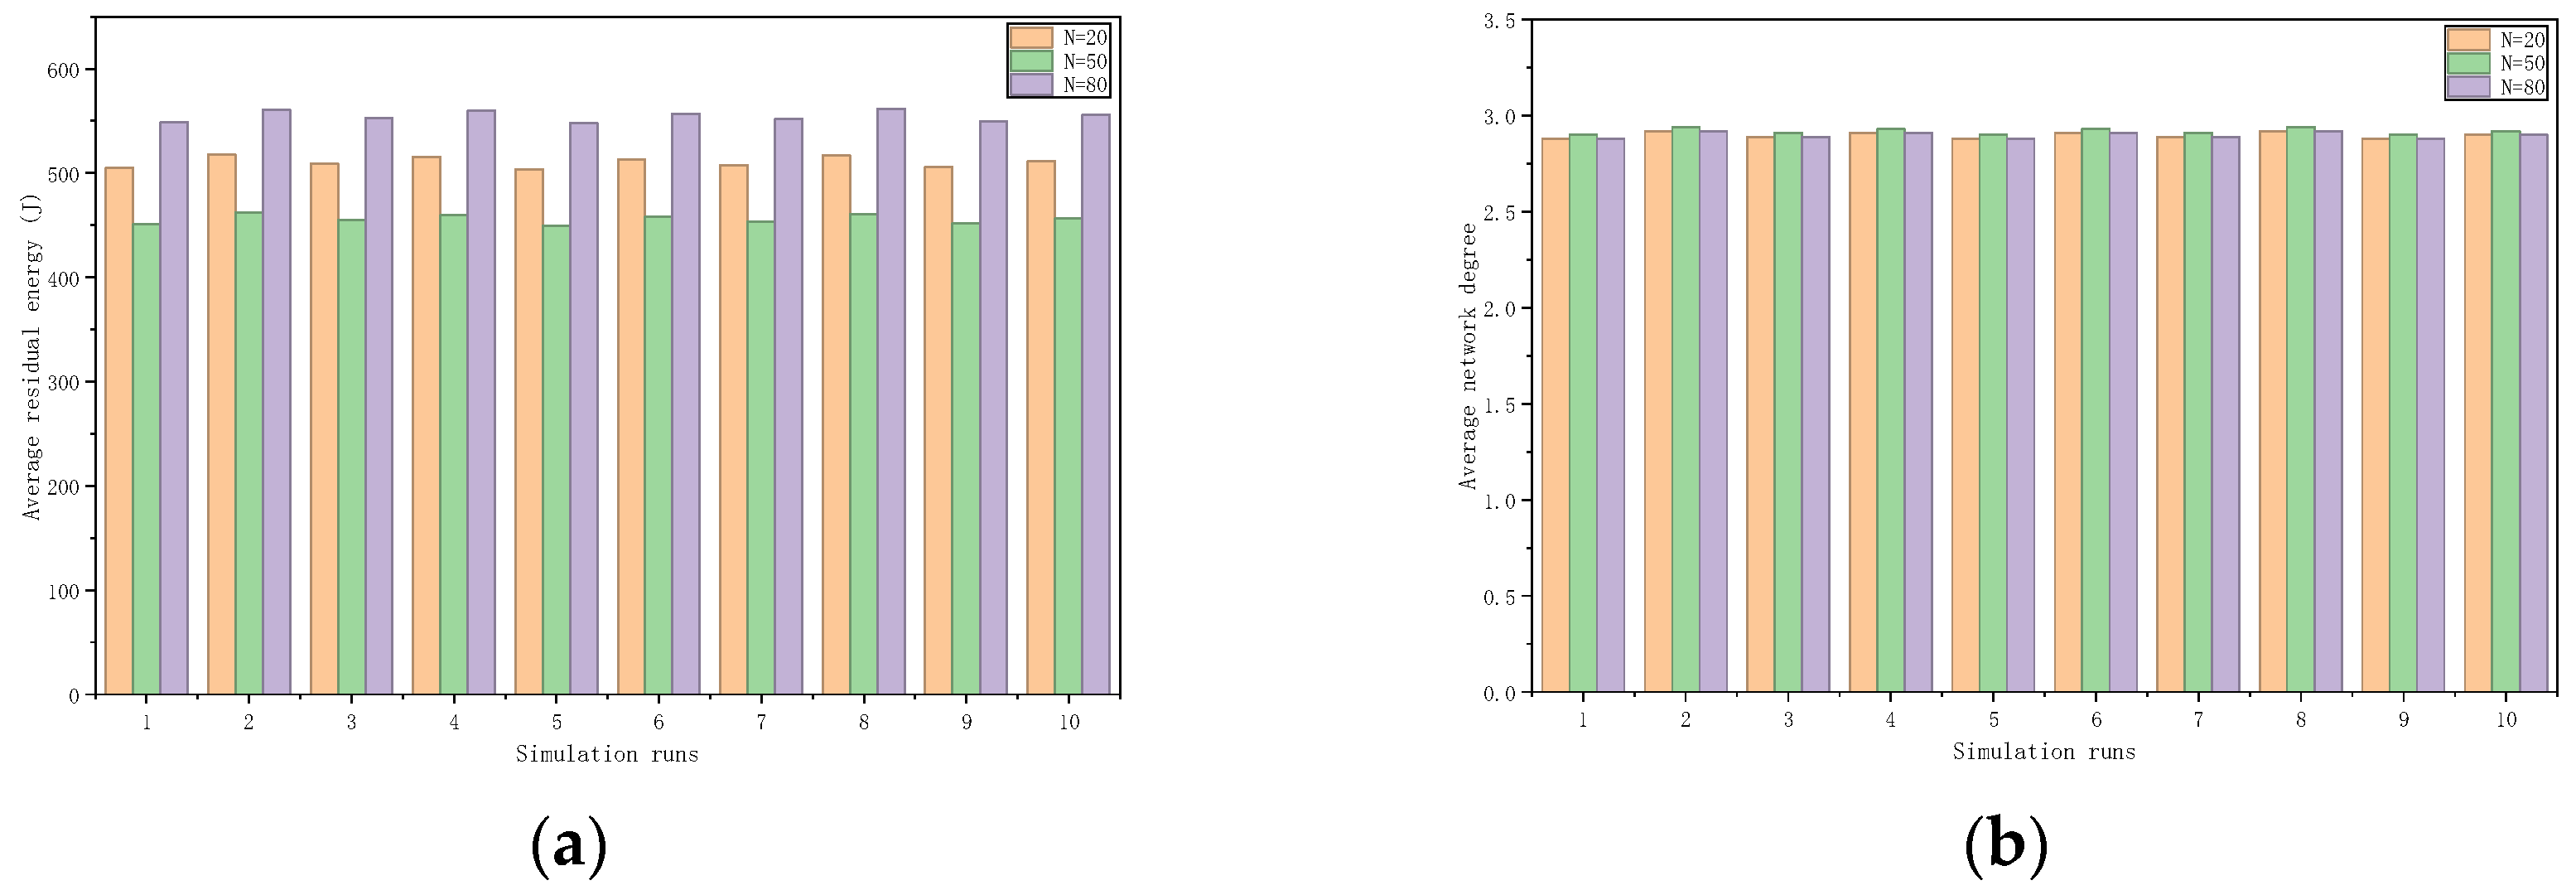
From the evolution trend, the algorithm shows convergence characteristics of rapid rise and gradual stabilization under all three scales. The 20-node small-scale scenario is limited by topological redundancy, with low initial robustness. The final steady-state robustness is 0.938 ± 0.015, the average residual energy is 511.4 ± 10.2 J, and the average degree is 2.90 ± 0.08. Under the 50-node baseline scenario, topological redundancy and energy cost achieve the optimal balance, and the steady-state robustness rises to a peak of 1.000 ± 0.000, with an average residual energy of 457.3 ± 9.6 J and an average degree of 2.92 ± 0.07. Under the 80-node medium-large scale scenario, link redundancy is significantly improved, and convergence speed is significantly accelerated. It enters the steady-state interval at about 95 iterations. The final steady-state robustness is maintained at 0.972 ± 0.011, the average residual energy is 556.1 ± 10.8 J, and the average degree is 2.90 ± 0.09.
Experiments show that node scale is positively correlated with convergence speed; link redundancy provided by high-density nodes can effectively offset the impact of local failures; 50 nodes are at the peak of service load, with the most significant energy consumption. The average degree of the algorithm is stable at around 2.9 under different scales, and the fluctuation range of 10 simulation results is less than 1.2%, indicating excellent topological construction balance.
Figure 11 presents the robustness evolution trends, and
Figure 12 shows the corresponding residual energy and node degree results, with the two metrics displayed in panel (a) and panel (b) respectively.
To further validate the parameter choices in the link cost model and pressure field formulation, we conduct additional sensitivity analysis on key weighting coefficients, in addition to the convergence threshold verification.
For the distance-to-height-difference weight ratio in Equation (2), tested ratios from 0.1/0.9 to 0.9/0.1 produce less than 2.1% variation in final robustness, verifying that the baseline 0.7/0.3 ratio is robust and not arbitrarily chosen. For the 0.1 scaling coefficient in Equation (4), values ranging from 0.05 to 0.2 yield less than 1.8% variation in final robustness, confirming a stable balance between the data rate and conductivity contributions to the pressure field.
To verify the robustness of the conclusions to threshold choices and Monte Carlo noise, we conduct sensitivity analysis on the convergence stopping thresholds. Three sets of threshold levels are tested across all node scale, mobility speed and initial energy scenarios: tight thresholds (robustness std < 0.02, degree std < 0.15), baseline thresholds (robustness std < 0.03, degree std < 0.2), and loose thresholds (robustness std < 0.04, degree std < 0.25).
The results show that the final steady-state robustness values differ by less than 1.2% across the three threshold settings, and the average node degree values differ by less than 0.8%. This confirms that the performance conclusions are robust to both threshold choices and inherent Monte Carlo noise in the random node failure tests.
- (2)
Influence of Node Mobility Speed
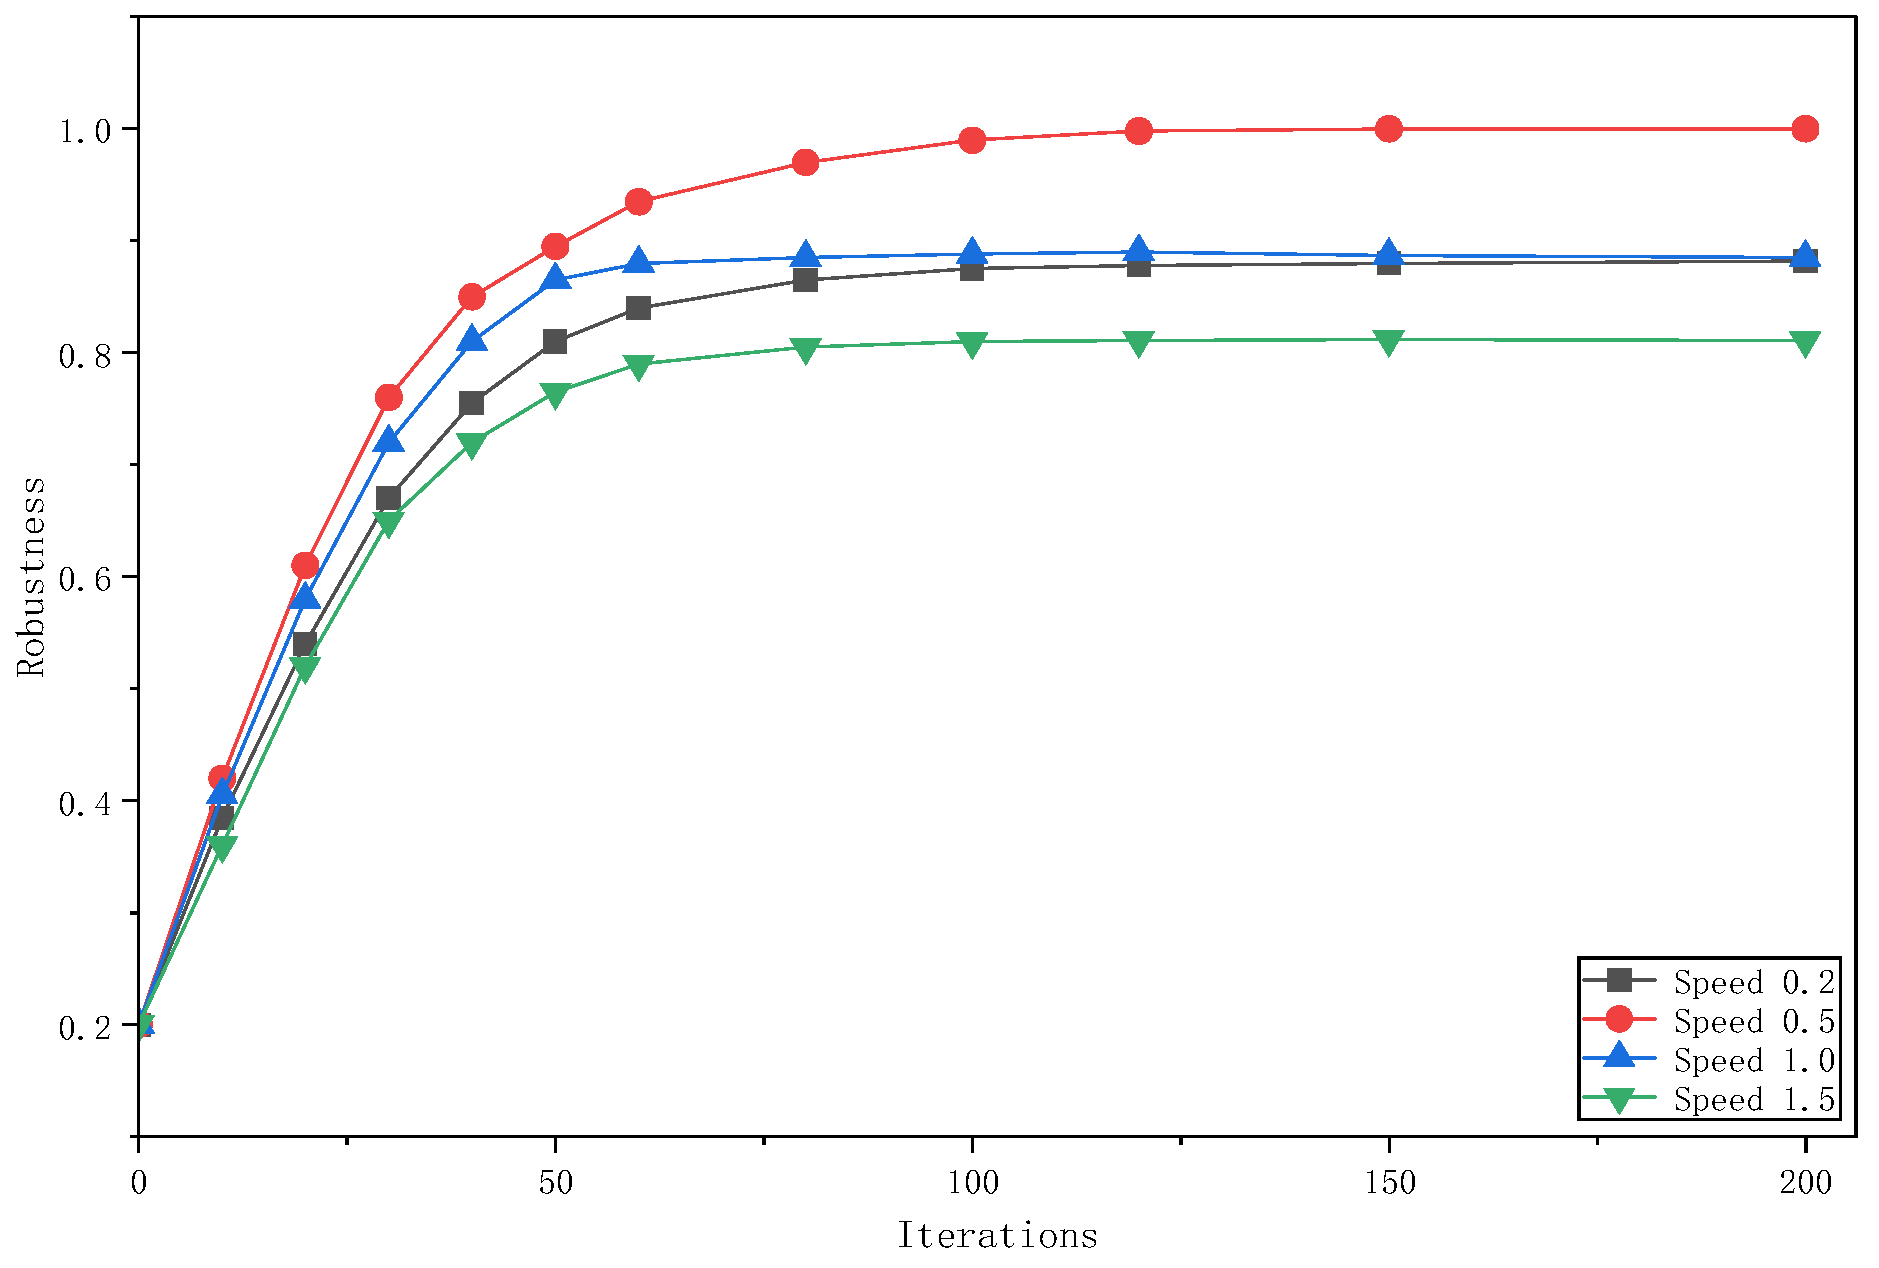
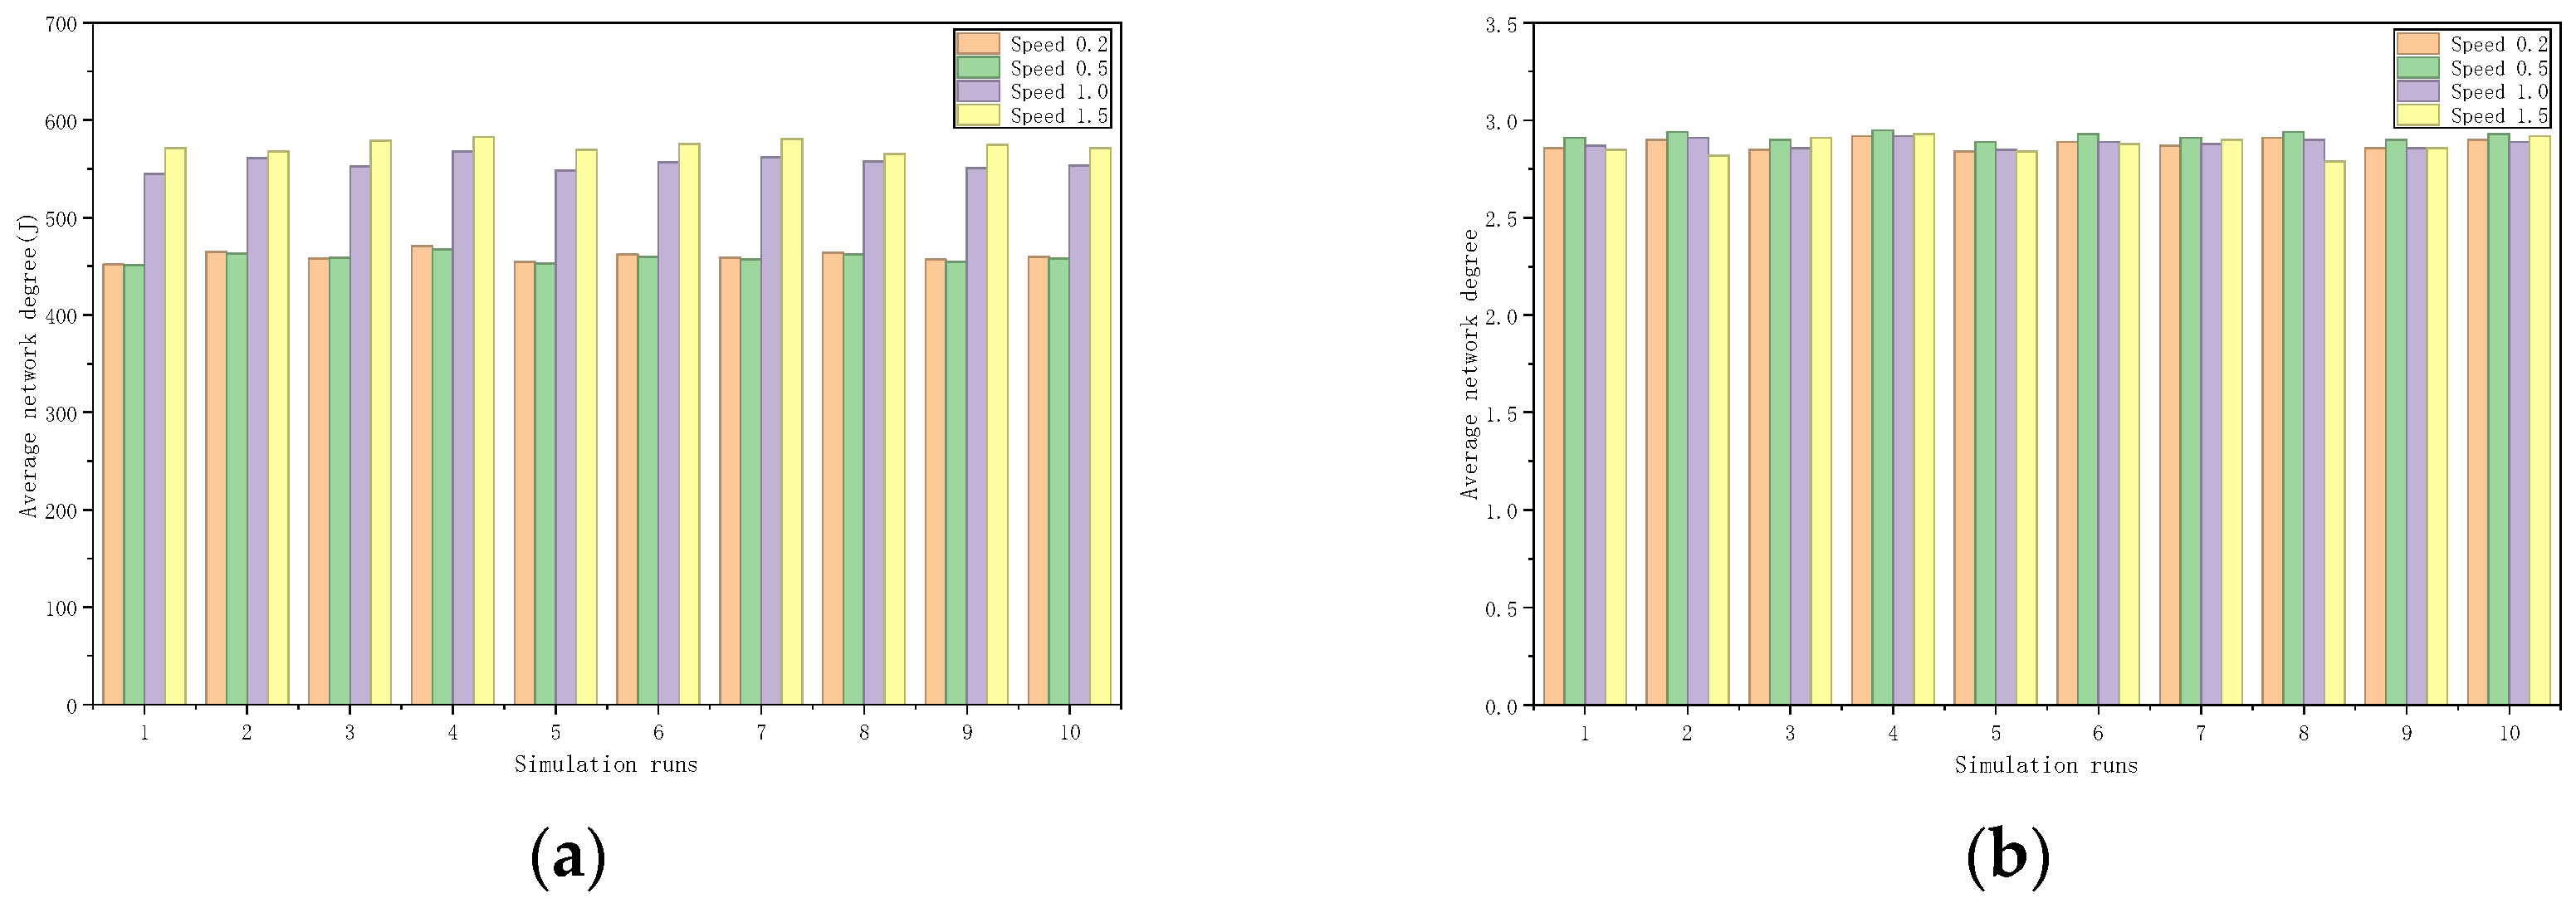
Three sets of scenarios with speed coefficients of 0.2×, 0.5×, and 1.0× are constructed, each with 10 independent repeated simulations. The statistical results show that the low-speed scenario (0.2×) requires 200 iterations to reach stability, with a robustness of 0.900 ± 0.021, an average residual energy of 458.3 ± 9.8 J, and an average node degree of 2.88 ± 0.08. The medium-speed scenario (0.5×) also requires 200 iterations, with a robustness of 1.000 ± 0.000, an average residual energy of 457.3 ± 9.6 J, and an average node degree of 2.92 ± 0.07. The high-speed scenario (1.0×) converges in only 116 ± 4 iterations, with a robustness of 0.900 ± 0.023, an average residual energy of 552.8 ± 10.5 J, and an average node degree of 2.88 ± 0.09.
Under the drastic 1.5× speed coefficient scenario, rapid node movement induces frequent link breakages. The algorithm still maintains basic source–destination connectivity, but the steady-state robustness drops to 0.811 ± 0.026, with an average residual energy of 574.2 ± 11.3 J and an average node degree of 2.87 ± 0.09. The convergence speed further increases to 94 ± 5 iterations.
The algorithm exhibits excellent adaptive capability to dynamic topology changes: performance peaks at medium speed with full robustness; at high speed, it automatically enters a fast-response mode with greatly accelerated convergence.
For consistent cross-speed comparison, all energy, robustness, and degree metrics are recorded at the 200th iteration (equivalent to 400 s of physical time, with dt = 2.0 s per iteration) across all speed scenarios. The reported convergence iteration count reflects only convergence speed, not the measurement point of energy. Under this unified time framework, cross-speed energy comparisons are valid, as all scenarios share identical per-iteration energy consumption rates and total simulation duration. Under this standard, high-speed scenarios show slightly higher residual energy due to shorter effective topology formation time.
The fluctuation of average node degree across all speed settings is less than 1.4% over 10 simulation runs, indicating strong topological stability.
These results define the applicable mobility boundary of UVC-SMA: the algorithm maintains excellent robustness and stability for scenarios with a mobility speed coefficient ≤ 1.0×. Beyond this range, ultra-drastic mobility causes topology changes to outpace the algorithm’s update period, leading to notable resilience degradation. Addressing such extreme scenarios will require integration of a node trajectory prediction module to pre-adjust conductivity prior to link breakage, which is outlined as future work.
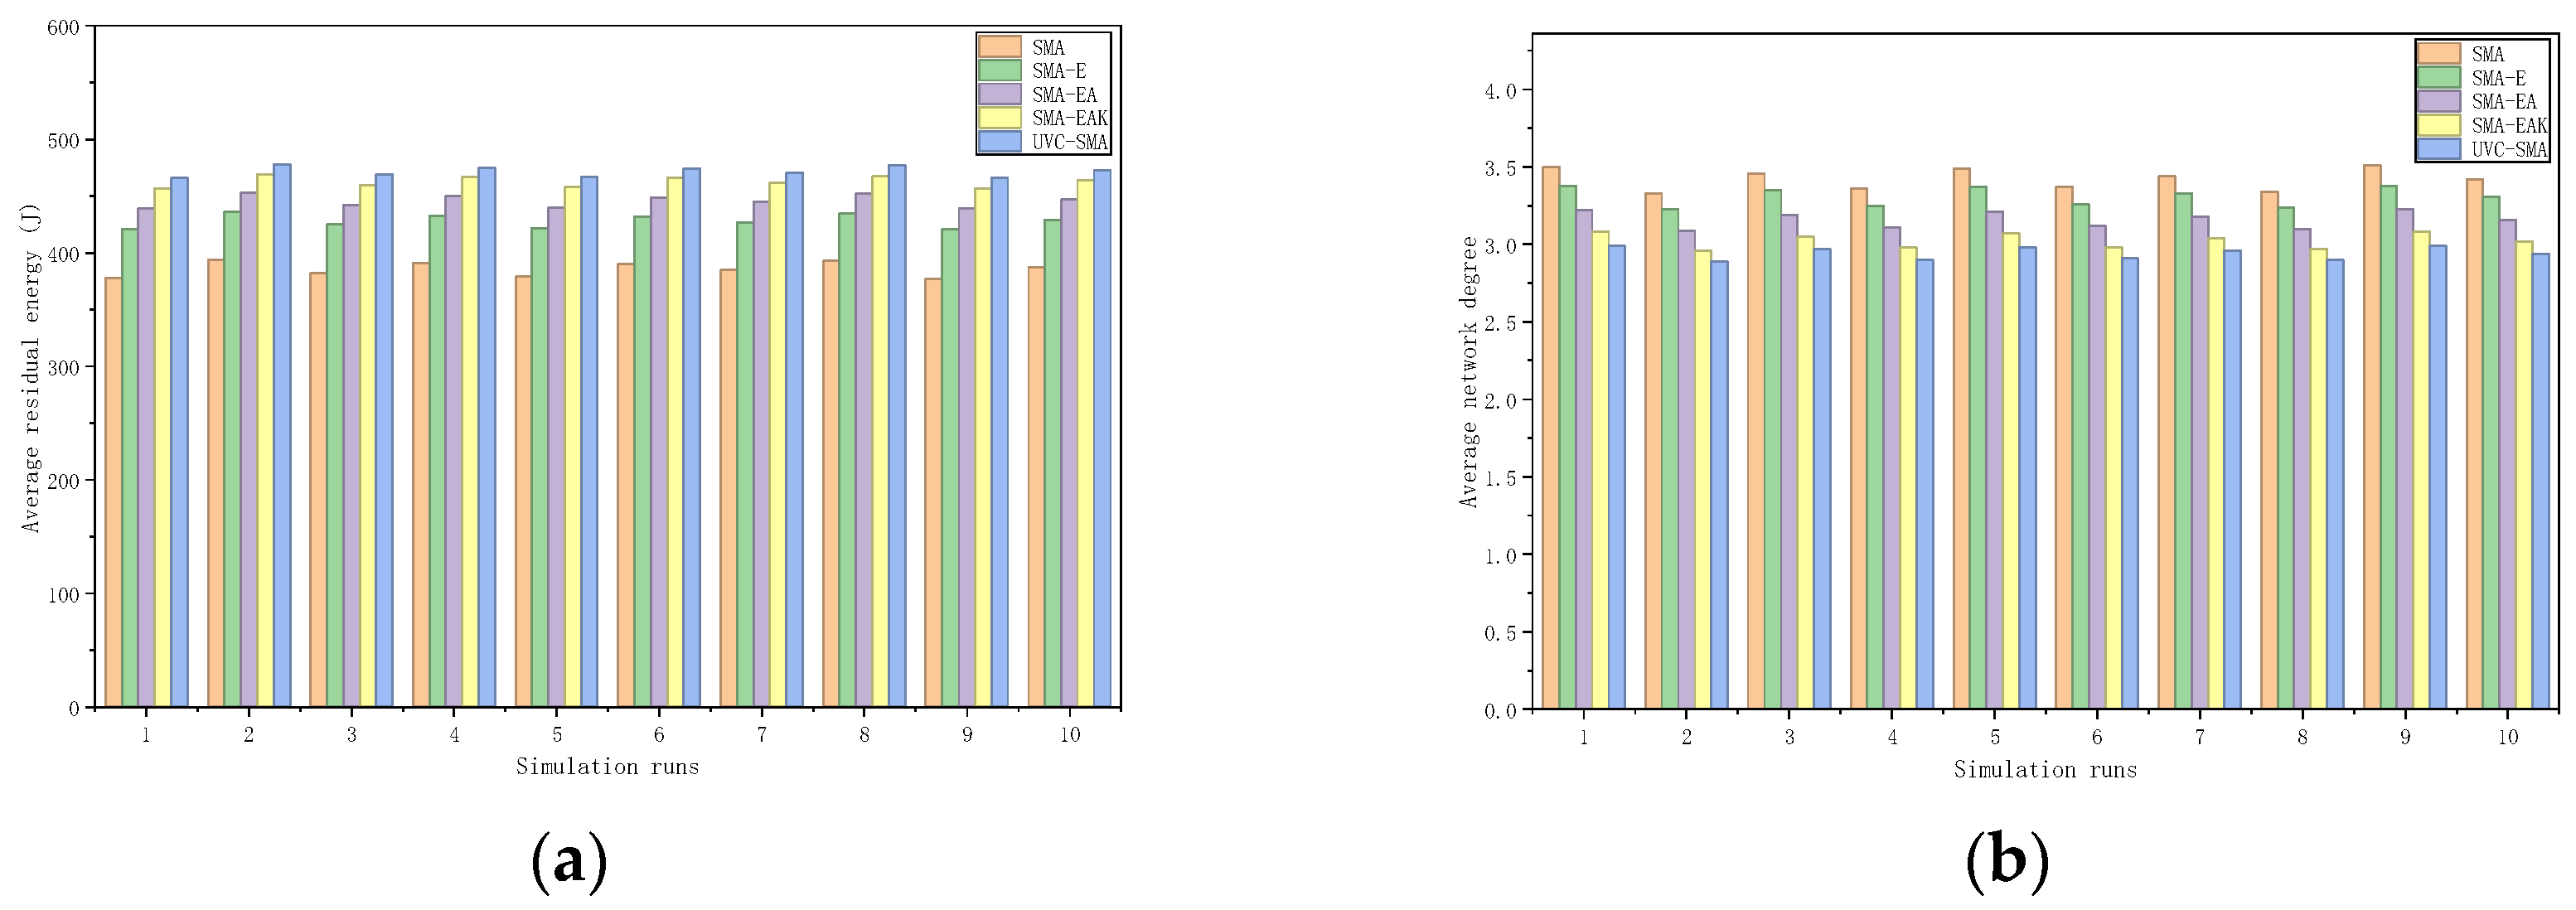
Figure 13 presents the robustness evolution under different speed coefficients, and
Figure 14 shows the corresponding residual energy and node degree results, with the two metrics displayed in panel (a) and panel (b), respectively.
- (3)
Influence of Initial Node Energy
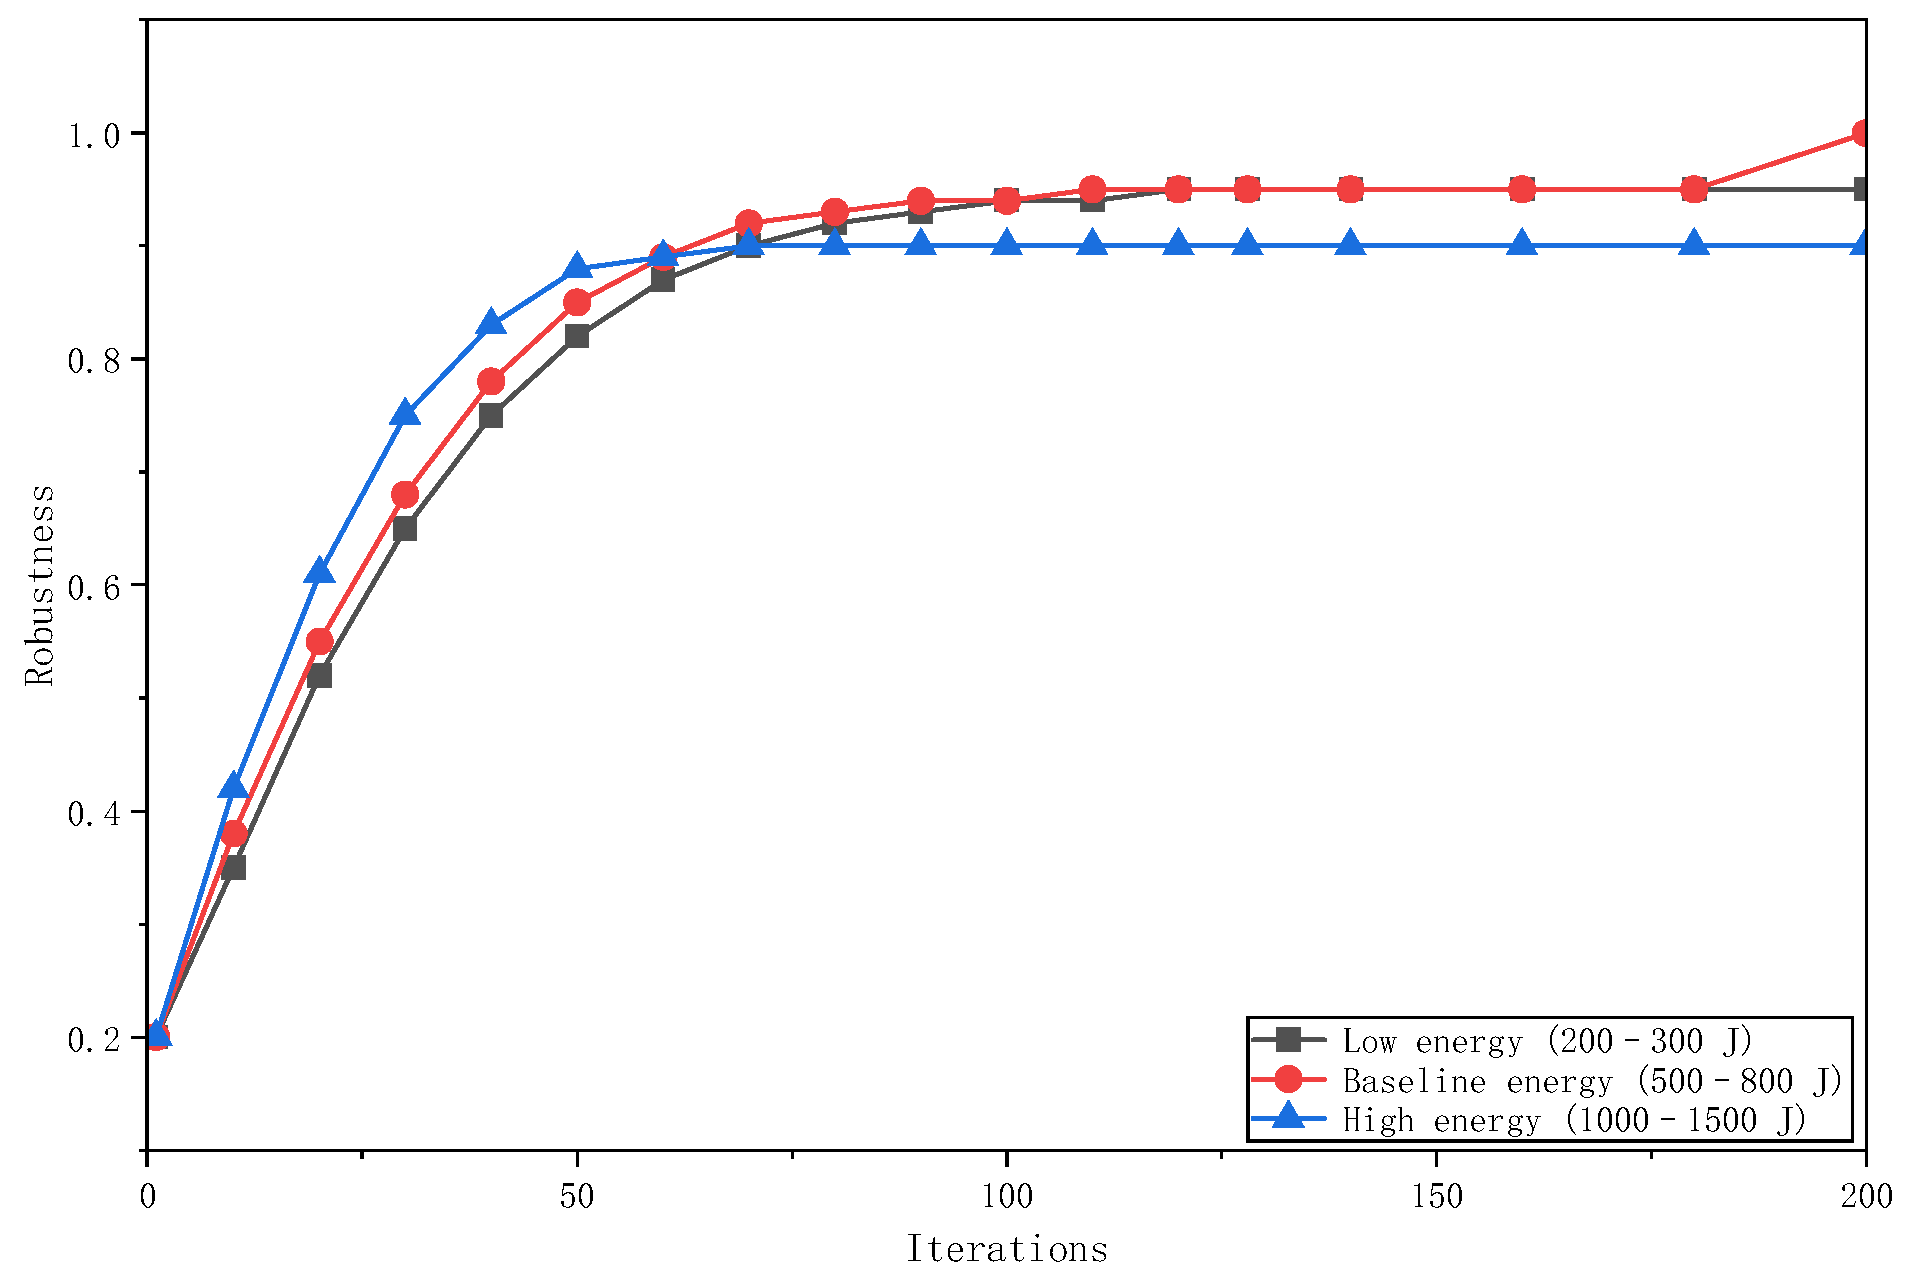
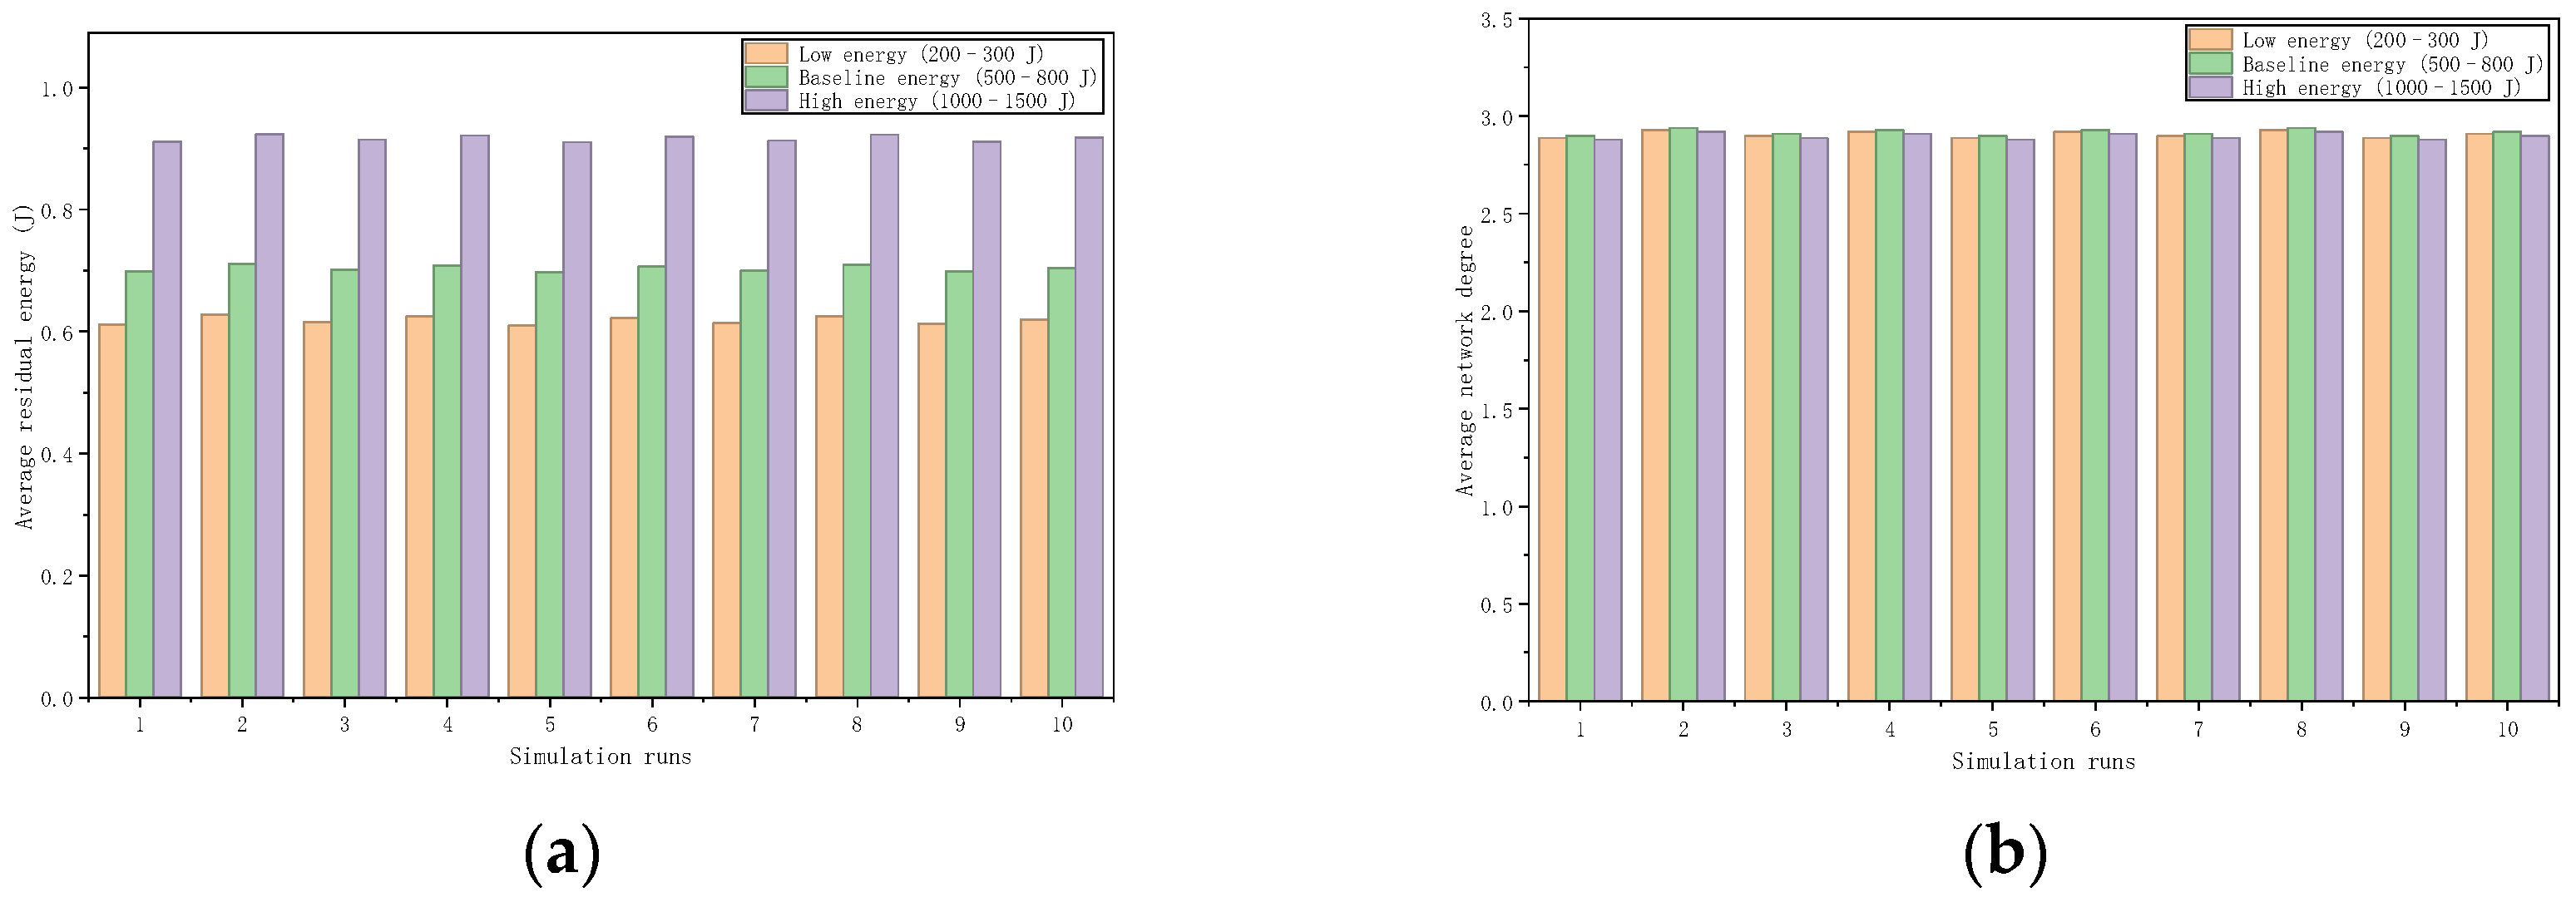
To eliminate the interference of initial total energy difference on energy consumption evaluation and verify the energy performance robustness of the algorithm under different energy storage conditions, normalized average residual energy (i.e., the ratio of network average residual energy to average initial energy) is adopted as a unified evaluation indicator. Three groups of simulation scenarios are set, including low energy (200~300 J), baseline energy (500~800 J), and high energy (1000~1500 J), and each group carries out 10 independent repeated simulations.
The low-energy configuration requires 200 iterations, with a normalized average residual energy of 0.655 ± 0.021, a network robustness of 0.950 ± 0.018, and an average node degree of 2.91 ± 0.08. The baseline-energy configuration requires 200 iterations, with a normalized average residual energy of 0.703 ± 0.019, a network robustness of 1.000 ± 0.000, and an average node degree of 2.92 ± 0.07. The high-energy configuration only requires 128 ± 5 iterations, with a normalized average residual energy of 0.916 ± 0.015, a robustness of 0.900 ± 0.020, and an average node degree of 2.90 ± 0.08.
The algorithm exhibits energy adaptive characteristics: when energy is limited, it automatically enters survival priority mode and still maintains a high robustness of 0.950; when energy is sufficient, it switches to efficiency priority mode, greatly shortening the convergence time, and energy consumption only accounts for 8.3% of the initial value. The fluctuation of average degree under different energy conditions is less than 0.7%, and topological balance is not affected by energy conditions.
Figure 15 presents the final robustness under different initial energy levels, and
Figure 16 shows the corresponding normalized residual energy and node degree results, with the two metrics displayed in panel (a) and panel (b), respectively.
4.3.4. Comparative Verification with HLP-ACO Heterogeneous Routing Algorithm
To comprehensively verify the comprehensive performance boundary and applicable scenarios of UVC-SMA in UVC/RF heterogeneous UAV scenarios, the hybrid link-aware and predictive ant colony optimization algorithm (HLP-ACO) for similar 3D heterogeneous UAV networks is selected as the horizontal comparison benchmark.
The HLP-ACO benchmark algorithm is implemented following its original hybrid link-aware and predictive ant colony framework, with only minimal adaptation to fit the UVC/RF heterogeneous scenario [
31]. The core ant colony optimization mechanism, pheromone update rules, and topology prediction logic remain identical to the original publication. Adaptations are limited to modality-specific link accessibility criteria, per-link energy consumption calculation, and matching initial conditions to the UVC-SMA experiments. HLP-ACO is selected as the primary quantitative benchmark because it belongs to the same swarm intelligence topology optimization paradigm, enabling a controlled apples-to-apples comparison. To contextualize the results against broader FANET solutions, we also provide qualitative comparison with classical standard multipath routing protocols (AOMDV, OLSR, MAODV). These network-layer protocols follow a route discovery–maintenance–repair paradigm with fundamentally different optimization time scales and metrics, making direct quantitative comparison inappropriate. All implementation details below are fully consistent with our MATLAB code.
Parameter configuration*: The algorithm uses five ants per iteration. The pheromone importance factor α = 1, the heuristic factor β = 1, and the energy factor . The pheromone evaporation coefficient is set to , the topology prediction weight is , and the pheromone intensity coefficient Q = 100. The initial pheromone value on all accessible links is uniformly set to 1.0, consistent with the upper initial conductivity range of UVC-SMA.
Initialization and random seed control: All HLP-ACO experiments use identical node initial positions, 3D mobility velocity profiles, energy configurations, and random seed sequences as those used for the UVC-SMA. This ensures that performance differences arise only from algorithm mechanisms, not initial conditions.
Heterogeneous scenario adaptation: The original single-modality HLP-ACO is adapted to the UVC/RF heterogeneous environment. Link accessibility follows the same criteria as the UVC-SMA: UVC links are available when distance is between 50 m and 150 m and both nodes are below 100 m altitude; RF links are available when distance is between 20 m and 300 m. Ants evaluate link quality separately for each modality and automatically select the lower-cost link type when both are accessible. Energy consumption is calculated per link type, consistent with the UVC-SMA energy model.
Topology prediction mechanism: topology prediction is updated every five iterations with a prediction time step of 2 s, using linear extrapolation of node velocity. The combined heuristic value integrates 70% predicted position information and 30% current position information, guiding ants to adapt to dynamic topology changes in advance.
Stopping criterion: HLP-ACO adopts exactly the same two-tier stopping framework as the UVC-SMA: fixed 200 iterations for all comparison experiments, and the same convergence rule for standalone verification.
For consistent comparison, all HLP-ACO experiments run for exactly 200 iterations, as in the UVC-SMA. The MATLAB simulation code for both algorithms will be made publicly available upon manuscript acceptance to ensure full reproducibility.
Both algorithms belong to the swarm intelligence routing framework, but there are essential differences in optimization orientation: HLP-ACO takes single-path transmission efficiency as the core optimization objective, while the UVC-SMA focuses on global topological resilience and fast fault recovery.
This comparison is carried out from five dimensions: random node failure survivability, failover response capability, scale expansion adaptability, steady-state transmission efficiency, and network-wide energy efficiency. Two core indicators, network layer connectivity robustness and transport layer packet delivery ratio, are collected simultaneously. All experimental groups uniformly control the 3D operation scenario, heterogeneous link parameters, node energy configuration and random walk mobility model to be completely consistent. Each group of experiments is independently repeated 10 times under different random seeds. All performance indicators are reported as mean ± standard deviation, and two-sample t-tests are used to verify the statistical significance of performance differences, with a significance level of α = 0.05. This ensures the fairness of the comparison process and the statistical credibility of the results.
- (1)
Comparison of Resilience Evolution Under Random Node Failure
To improve the physical fidelity of fault injection, we adopt a modality-specific failure model that reflects the distinct degradation mechanisms of UVC and RF links. Three distinct failure events are defined and used consistently throughout the analysis:
First, link interruption: a single communication link becomes temporarily unavailable due to channel fading, atmospheric obscuration, or interference, affecting only one specific link of either modality.
Second, node failure: a UAV node loses all communication capability, either temporarily (energy depletion) or permanently (hardware failure), disabling all connected links.
Third, modality-specific failure: systematic degradation affecting all links of one communication modality across the entire network.
Two categories of fault scenarios are tested for comparison: single-link random interruption and dual-link concurrent interruption, corresponding to conventional link disturbance and multi-point concurrent failures under strong interference, covering mild to severe failure levels. The single relay node failure scenario that highly overlaps with the link failure mechanism is eliminated to streamline the comparison dimensions.
To quantify the modality-specific failure mechanisms, we define explicit probability functions for both link types, calibrated against near-ground atmospheric and electromagnetic measurement data.
For the UVC links, failure probability depends on both link distance and node altitude:
where the baseline failure probability
, distance coefficient
, altitude coefficient
, and
is the ozone layer altitude threshold. Failure probability grows exponentially with distance and rises sharply above the altitude boundary, consistent with atmospheric scattering physics.
For the RF links, failure probability scales with link distance and local node density:
where the baseline failure probability
, distance exponent
, and node density coefficient
. This captures the distance-dependent path loss and density-dependent electromagnetic interference characteristics of RF channels.
For the node failure events, energy depletion disables the UVC links first when residual energy drops below 20% of initial capacity and disables both link types at 0% energy. Complete hardware failure disables both link types simultaneously, with a probability of 0.01 per node per 10 iterations.
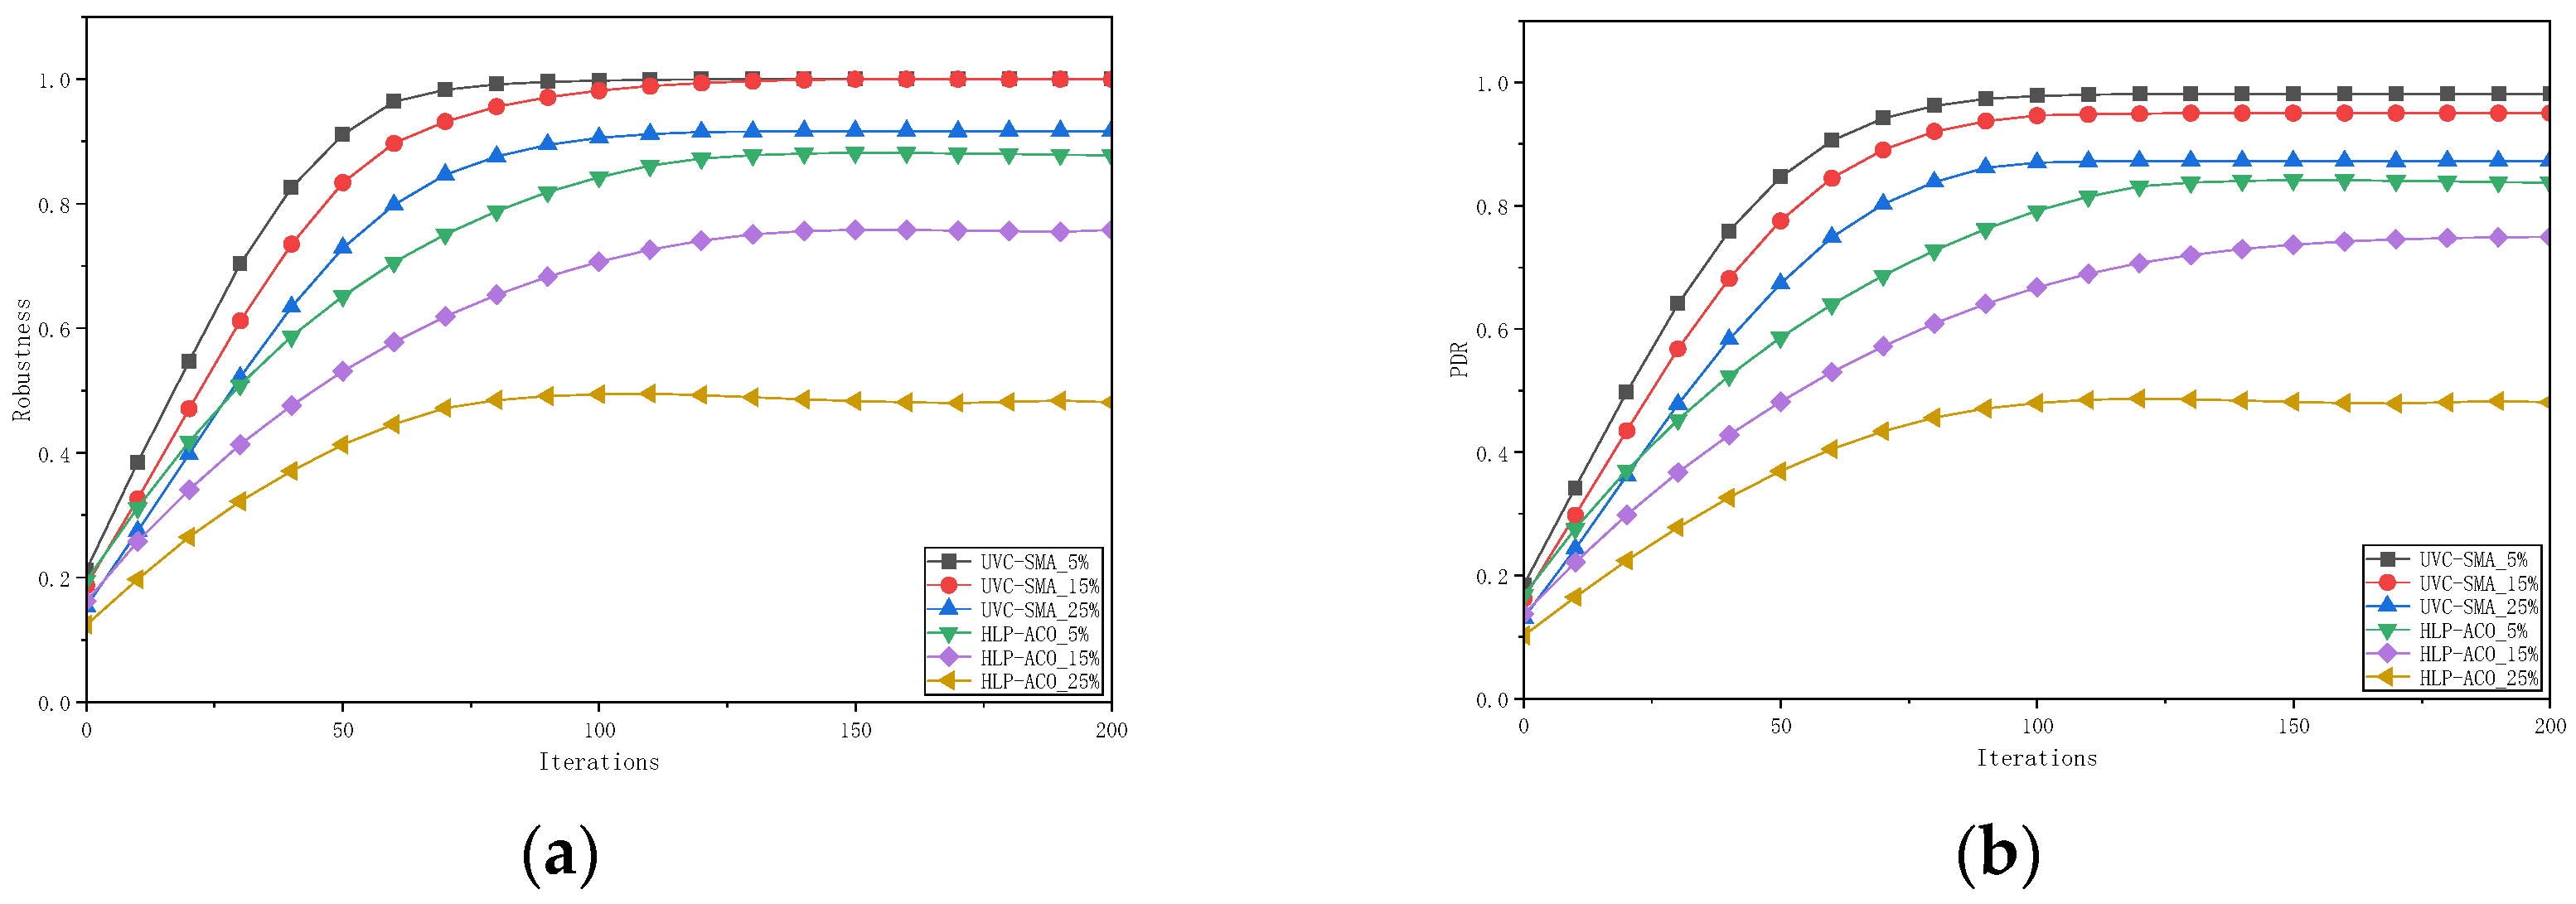
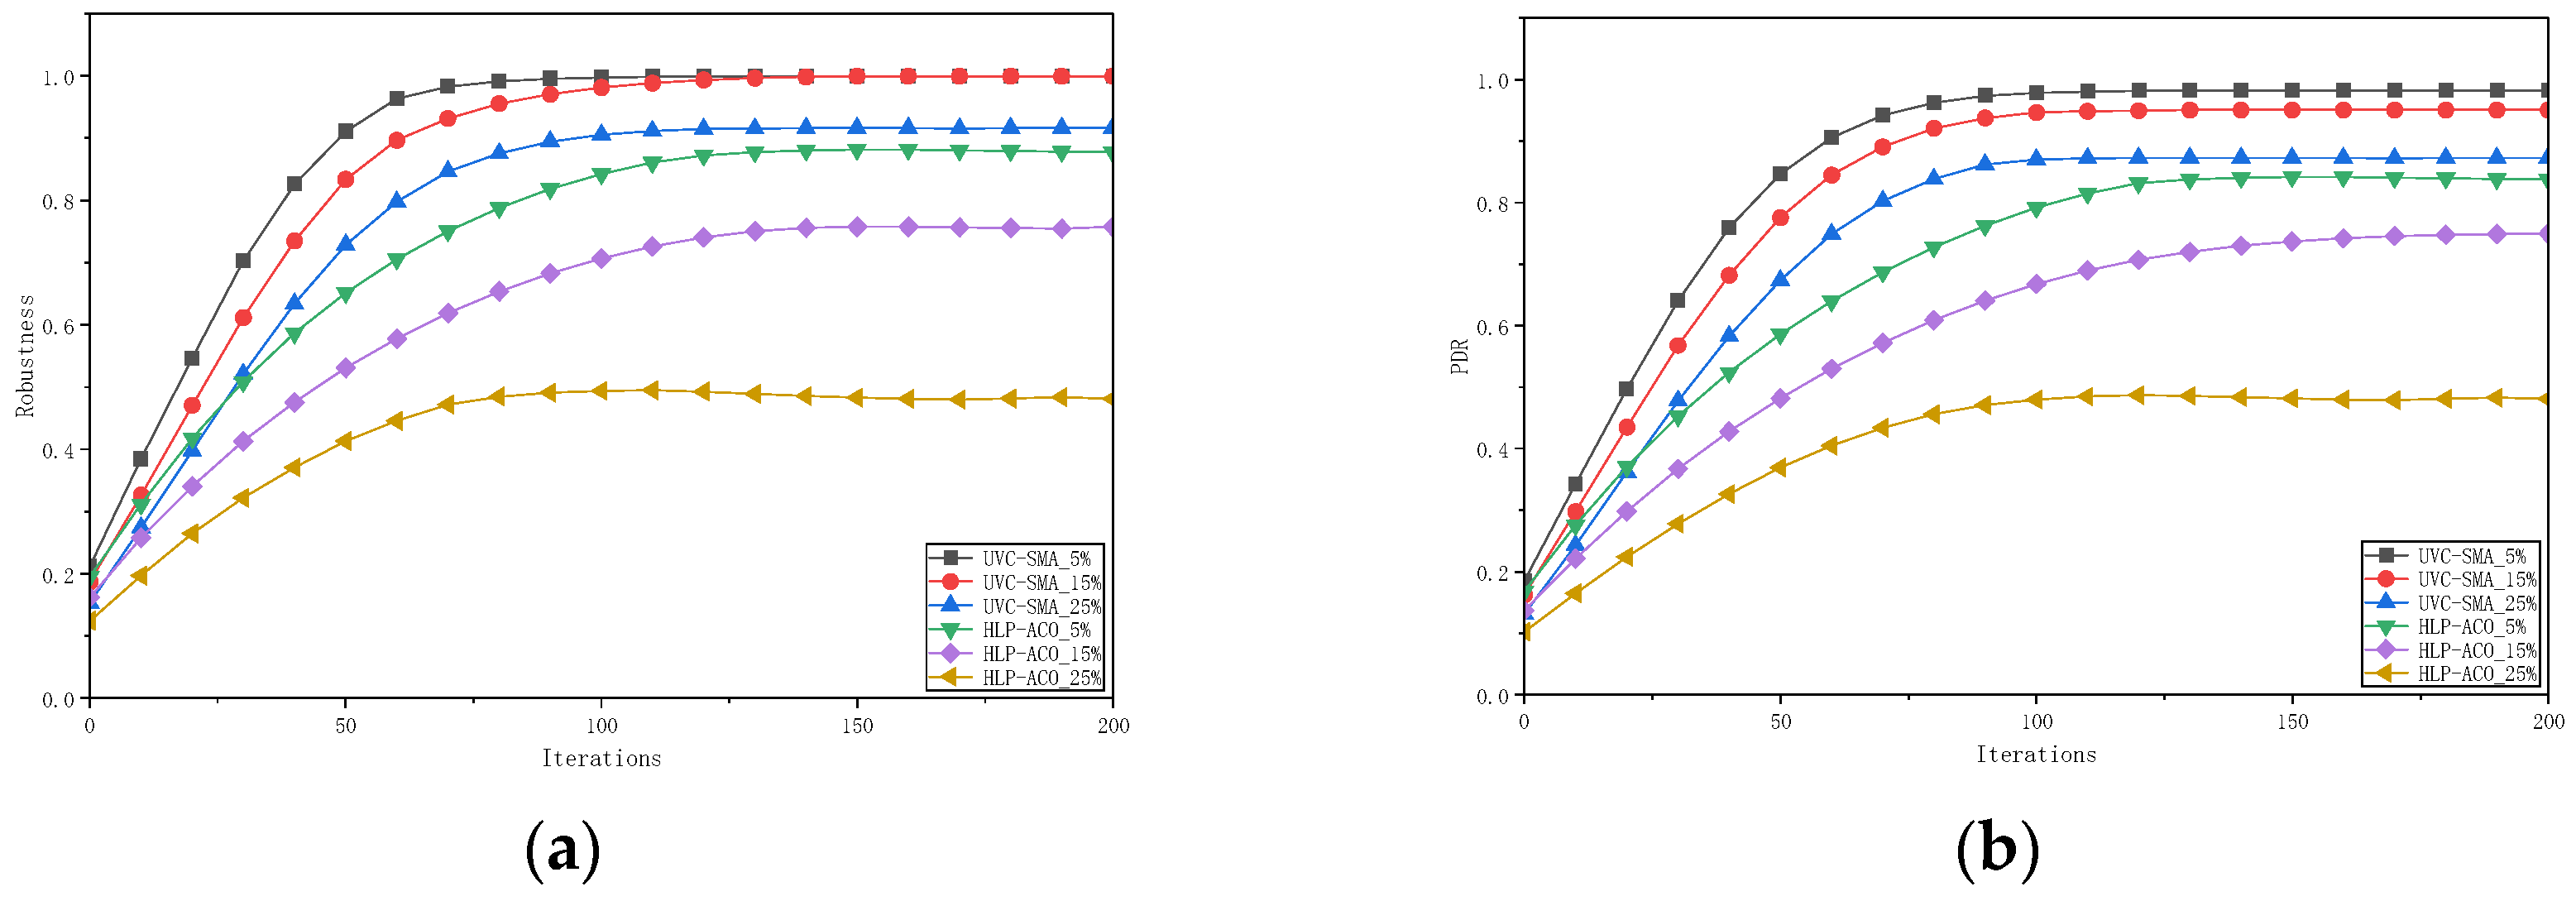
Directed fault injection is triggered every 10 iterations during the full iteration period of the algorithm, and all failures are applied to the current main transmission path. The end-to-end communication recovery delay and average packet delivery ratio are counted to compare the fault response speed and transmission continuity of the two algorithms. The results are shown in
Figure 17, with network robustness evolution in panel (a) and packet delivery ratio evolution in panel (b). Each group of scenarios is independently repeated 20 tests and the statistical mean is taken to ensure consistent comparison benchmarks. All experiments are rerun under this modality-specific failure model, and the comparative conclusions remain statistically consistent.
As can be seen from
Figure 17a, the UVC-SMA shows evolution characteristics of rapid rise and high-level stabilization after convergence under all three failure scenarios. Under 5% mild failure, the algorithm reaches robustness of 0.964 at 60 iterations and converges to 1.000 after 140 iterations. Under 15% typical failure, it breaks through 0.95 at 80 iterations and stabilizes at 1.000 after 160 iterations. The degree-betweenness weighted key node protection mechanism effectively offsets the connectivity impact of node failures. Under the 15% node failure ratio, UVC-SMA achieves a steady-state robustness of 1.000 ± 0.000 and a PDR of 0.951 ± 0.011, while HLP-ACO achieves 0.758 ± 0.031 and 0.712 ± 0.029 respectively. The robustness advantage of UVC-SMA is 24.2 percentage points, with a 95% confidence interval of [19.8, 28.6] percentage points; the PDR advantage is 23.9 percentage points, with a 95% confidence interval of [18.7, 29.1] percentage points. Two-sample
t-tests confirm both advantages are statistically significant (
p < 0.001).
Under 25% severe damage, the steady-state robustness of UVC-SMA still maintains 0.917 ± 0.019, only attenuated by 8.3% compared with the 15% scenario. The optimization rate of HLP-ACO is significantly lagging. The convergence process is accompanied by continuous small oscillations, and the higher the failure intensity, the more significant the performance attenuation. The steady-state robustness is about 0.878 under 5% failure, only 0.758 under 15% failure, and has fallen below 0.5 at 25% failure, unable to guarantee basic connectivity services.
The evolution law of packet delivery ratio in
Figure 17b is highly consistent with that of robustness. The delivery ratio of the UVC-SMA increases synchronously with topology optimization, and the steady-state PDR under the three scenarios are 0.982, 0.951 and 0.873 respectively. Effective data transmission can still be maintained under severe damage scenarios. The delivery ratio of HLP-ACO rises slowly and the steady-state value is low. It oscillates in the range of 0.4~0.5 for a long time under 25% failure, making it difficult to form stable end-to-end transmission capability.
The core of performance difference lies in different optimization paradigms. UVC-SMA adopts pre-defense logic, pre-emptively eliminates single point of failure risks through active reinforcement of key nodes, and achieves millisecond-level failover combined with primary and backup paths without shared links. Packet loss is only concentrated in the very short switching interval. HLP-ACO relies on passive route reconfiguration after failure, lacks resilience design at the global topology level, and node failures are likely to cause cascading path interruptions. Packets are continuously lost during route re-discovery, so both indicators deteriorate synchronously with the increase of failure intensity.
- (2)
Comparison of Failover Delay and Transmission Continuity
Set two types of failure scenarios: single-link random interruption and dual-link concurrent interruption, respectively corresponding to conventional link disturbance and multi-point concurrent failures under strong interference, covering mild to severe failure levels. The single relay node failure scenario that highly overlaps with the link failure mechanism is eliminated to streamline the comparison dimensions. Trigger directed fault injection every 10 iterations during the full iteration period of the algorithm, and all failures are applied to the current main transmission path. Count the end-to-end communication recovery delay and average packet delivery ratio, and compare the fault response speed and transmission continuity of the two algorithms. The results are shown in
Figure 18, with the end-to-end recovery delay shown in panel (a) and the packet delivery ratio shown in panel (b). Each group of scenarios is independently tested 20 tests and the statistical mean is calculated to ensure consistent comparison benchmarks.
From the evolution law of recovery delay in
Figure 18a, the UVC-SMA maintains millisecond-level fault response capability throughout the iteration process. When the topology is not stable in the early iteration, the recovery delays of single-link and dual-link failures are 17.2 ms and 22.5 ms respectively. As the topology gradually converges, the delay decreases rapidly and stabilizes. After convergence, the recovery delay of single-link interruption is only 7.8 ± 0.9 ms, and that of dual-link concurrent failure is only 11.3 ± 1.2 ms, meeting the requirement of seamless switching throughout the process. The failover delay advantage of the UVC-SMA over HLP-ACO is statistically significant (
p < 0.001).
The failover delay of HLP-ACO shows the characteristics of high in the early stage and gradual decline. In the initial stage of iteration, pheromone accumulation is insufficient, and full ant colony route discovery needs to be restarted after failure. The single-link interruption delay reaches 362.4 ms and exceeds 800 ms in case of dual-link concurrent failure. As the pheromone concentration gradually increases, the pathfinding efficiency is improved, but limited by the single-path architecture, it still maintains at the hundred-millisecond level after convergence, with a gap of 1~2 orders of magnitude from UVC-SMA.
The evolution trend of packet delivery ratio in
Figure 18b is consistent with the delay results. UVC-SMA relies on pre-stored multipath redundancy, with very little packet loss during failover. The steady-state PDR under the two types of fault scenarios can reach 0.991 and 0.972 respectively, both maintaining at a high level. HLP-ACO has a very low delivery ratio in the early iteration, and the initial PDR is less than 0.11 under dual-link concurrent failures. The delivery ratio rises slowly as the route gradually converges, but restricted by the passive reconfiguration mechanism, the steady-state PDR of the two types of failures is only 0.788 and 0.618, with significant loss of transmission continuity.
In essence, the UVC-SMA adopts the pre-redundancy design of “synchronously generating primary and backup paths with topology evolution”. After a fault is triggered, communication can be restored only by locally switching the forwarding table, without additional iterative calculation. HLP-ACO only outputs a single optimal path with no pre-configured backup capacity. The ant colony pathfinding process must be restarted after the primary path is interrupted, which cannot eliminate the inherent overhead of route discovery. Therefore, the higher the fault intensity, the more obvious the performance attenuation.
- (3)
Comparison of Performance Scalability Under Different Node Scales
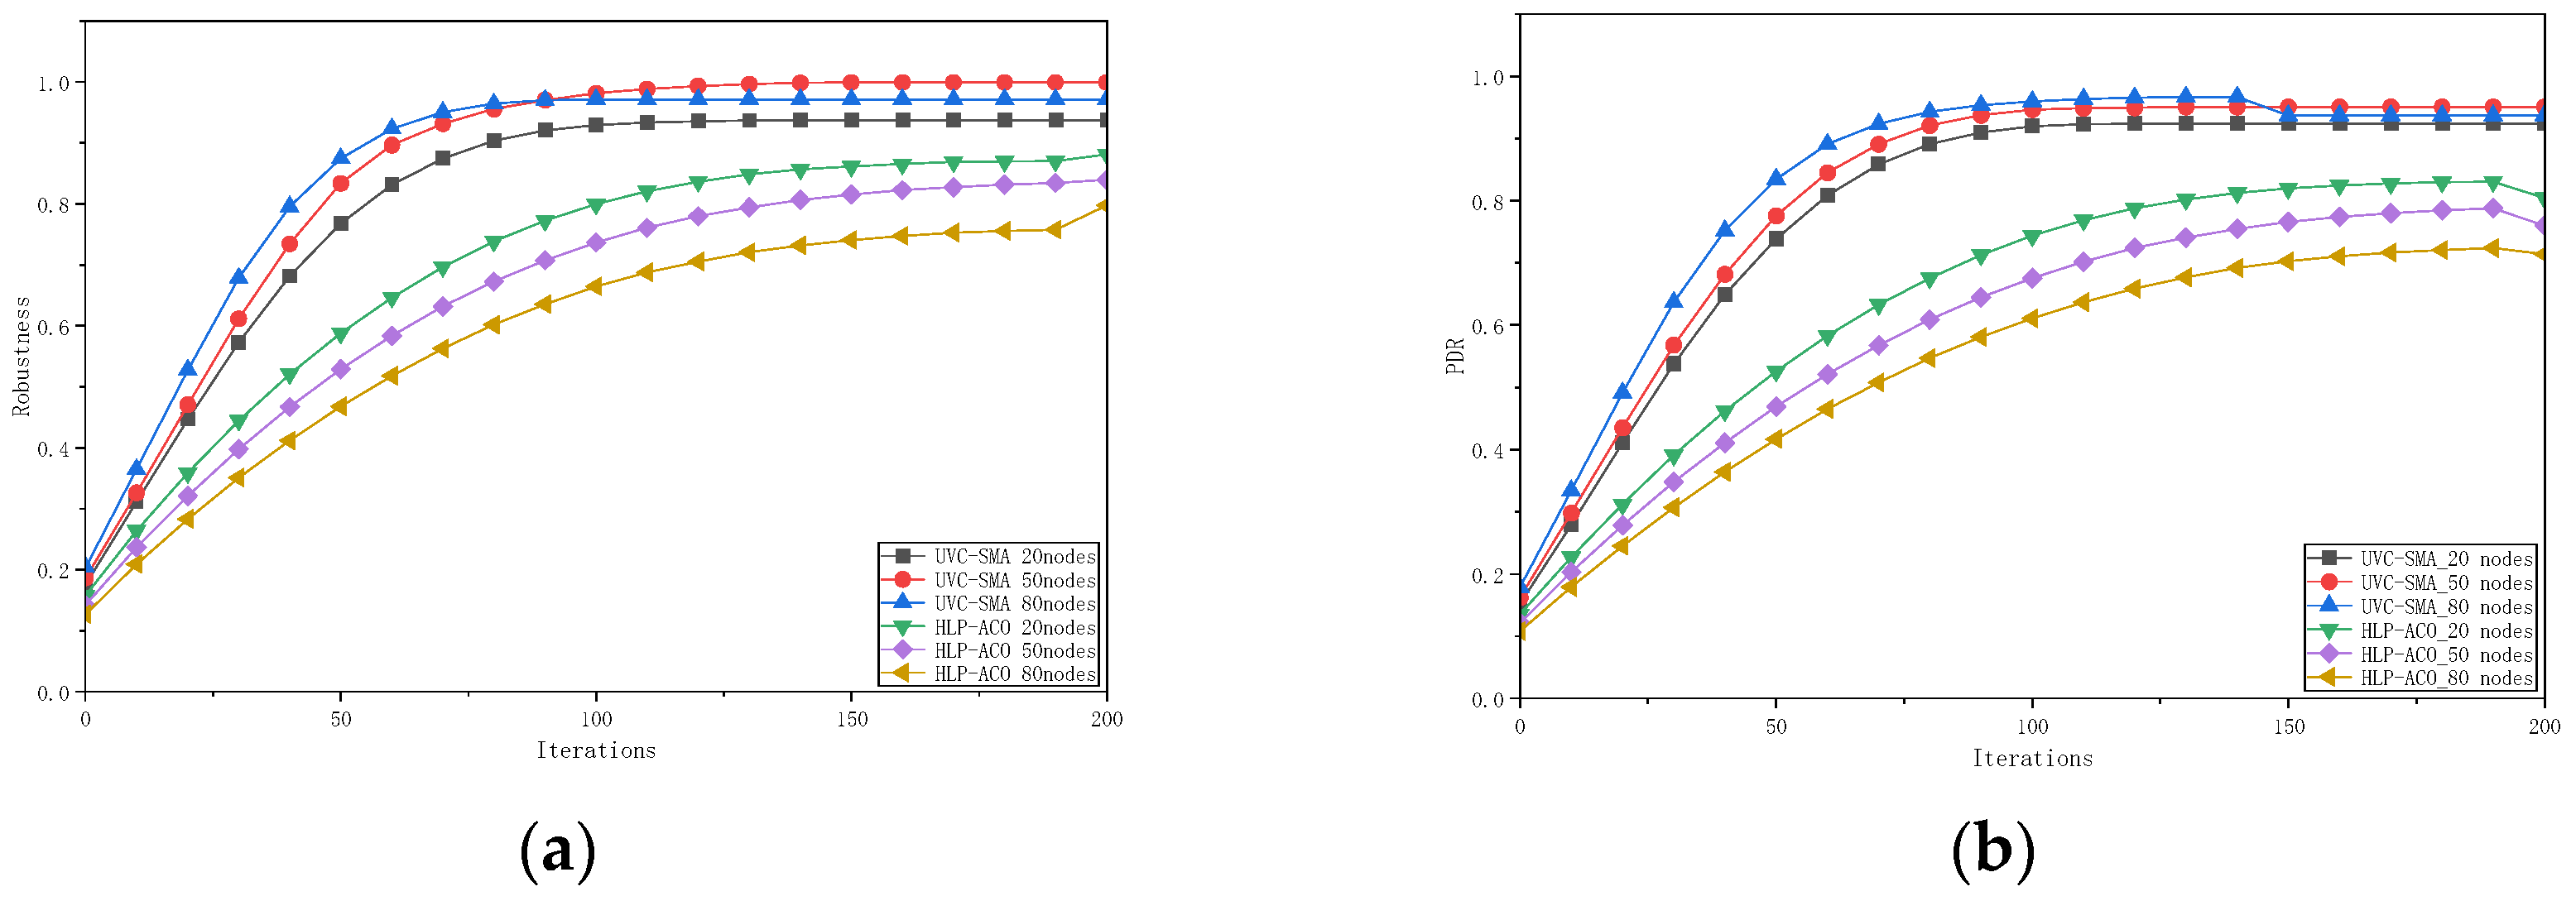
Select three groups of typical node scales (20, 50, and 80), uniformly apply 15% random node failure ratio, and compare the connectivity resilience and transmission performance of the two algorithms in the 0~200 iteration period to verify the performance retention capability of the algorithm with network scale expansion. The results are shown in
Figure 19, with network robustness evolution in panel (a) and packet delivery ratio evolution in panel (b). All experimental groups keep the 3D operation area, mobility model and energy configuration completely consistent. Failed nodes are randomly selected from the relay node set to ensure unified comparison benchmarks.
From the evolution law of robustness in
Figure 19a, the UVC-SMA shows a trend of first increasing and then slowly decreasing with the increase of node scale, and maintains fast convergence speed and small steady-state fluctuation under all scales. The 20-node small-scale scenario is limited by topological redundancy, with steady-state robustness of 0.938 ± 0.016. Under the 50-node baseline scenario, topological redundancy and energy cost achieve the optimal balance, and robustness rises to a peak of 1.000 ± 0.000. When expanded to the 80-node medium-large scale scenario, the robustness is still maintained at 0.972 ± 0.012, only attenuated by 2.8% compared with the peak, and the performance attenuation is very gentle.
The robustness of HLP-ACO continues to decrease with the increase of node scale, from 0.882 ± 0.027 for 20 nodes to 0.798 ± 0.033 for 80 nodes, with a total attenuation of 9.5%. Moreover, the larger the scale, the slower the convergence speed, and the more significant the performance fluctuation during iteration.
The scale evolution law of packet delivery ratio in
Figure 19b is highly consistent with robustness. The steady-state PDR of the UVC-SMA reaches a peak of 0.951 at 50 nodes, and still maintains 0.937 when expanded to 80 nodes, only attenuated by 1.5% compared with the peak. The scale stability of transmission quality is excellent. The steady-state PDR of HLP-ACO continues to decrease from 0.805 for 20 nodes to 0.714 for 80 nodes, with a total attenuation of 11.3%. Transmission quality degradation is obvious in large-scale scenarios.
The core of performance difference lies in the different scalability of algorithm optimization architecture. The global topology evolution of the UVC-SMA based on the conductivity matrix has natural parallel adaptability. The degree-betweenness key node protection and multipath redundancy mechanisms can be dynamically adjusted with network scale. The link redundancy gain brought by scale expansion can effectively offset the negative impact of increased failed nodes. The ant colony search space of HLP-ACO increases approximately squarely with the number of nodes, the optimization quality continues to decline under a fixed number of iterations, and path stability is further reduced, eventually leading to simultaneous attenuation of robustness and delivery ratio with increasing scale. This result confirms that the UVC-SMA has more stable resilience performance and stronger engineering adaptability in UAV swarms of different scales.
- (4)
Comparison of Steady-State Transmission Efficiency
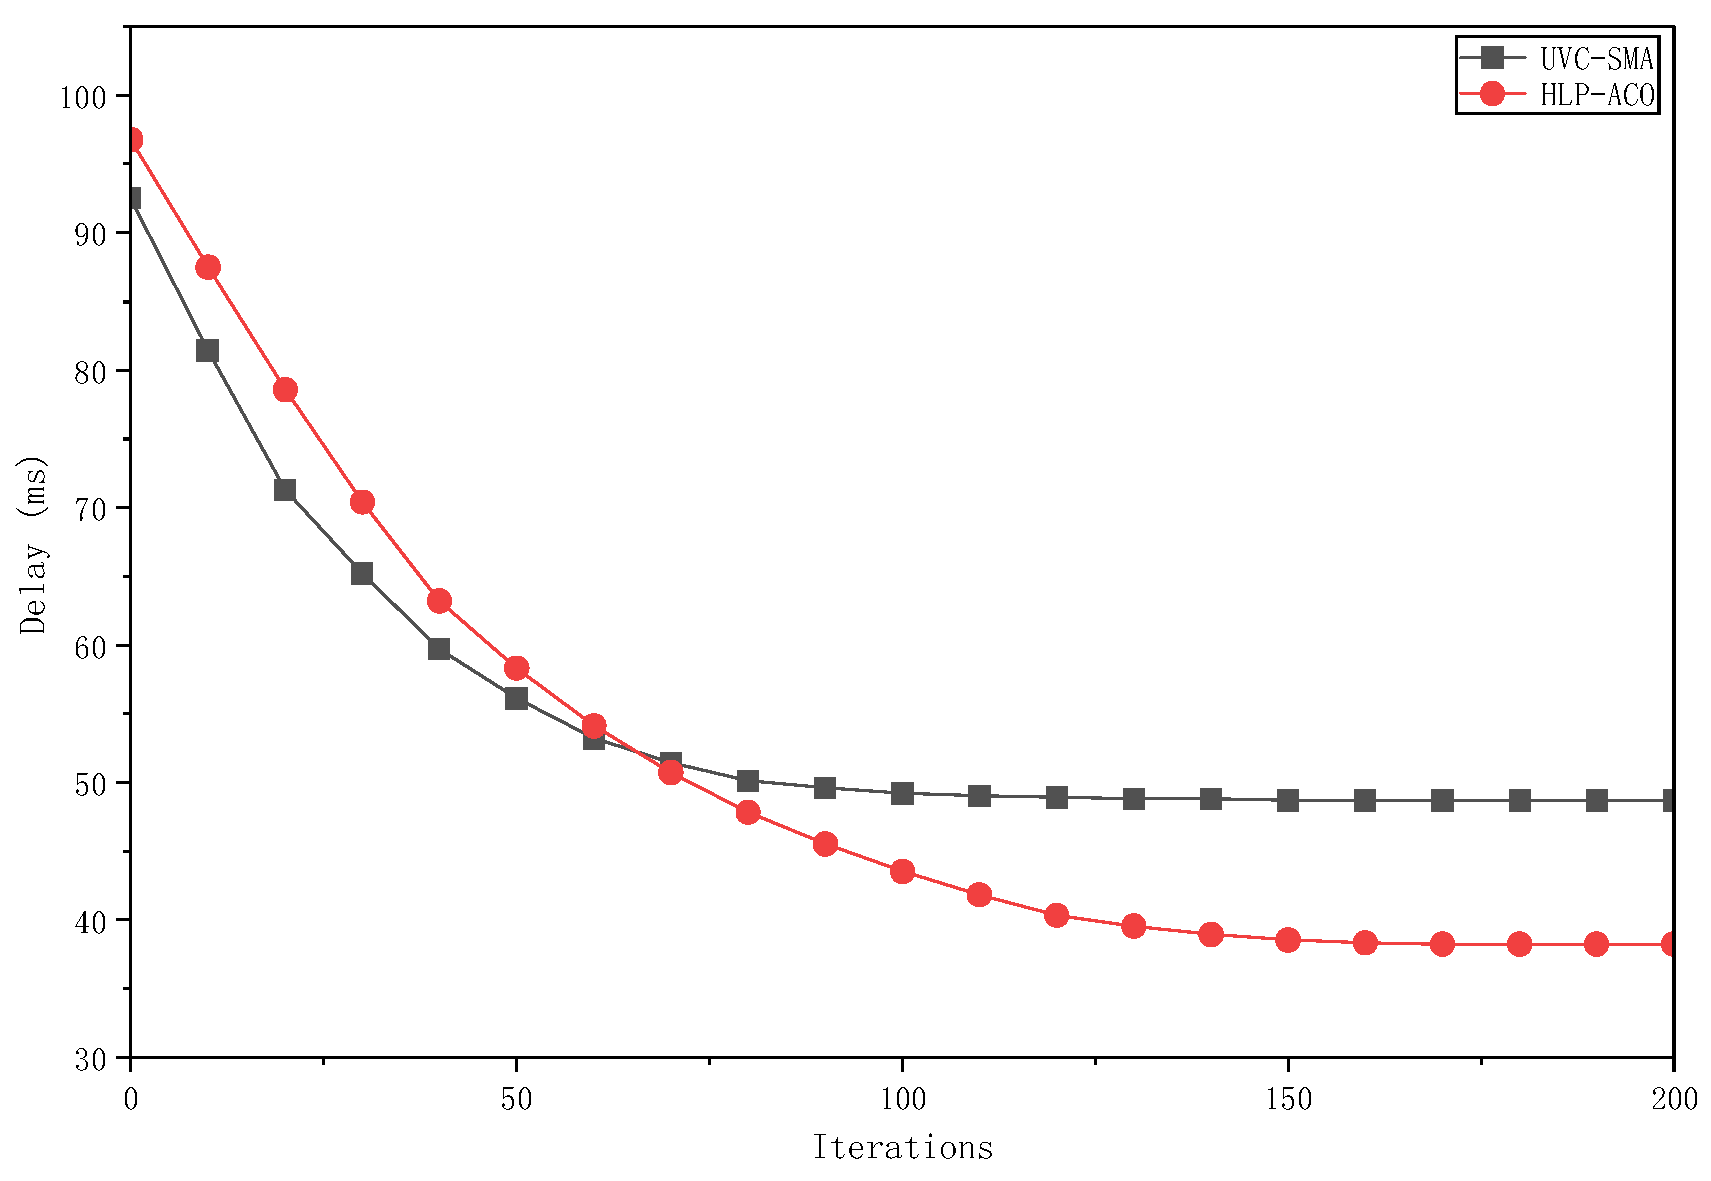
To further clarify the performance applicable boundaries of the two algorithms, supplement the comparison of end-to-end transmission efficiency in fault-free steady-state scenarios. Take the 50-node baseline scenario as the research object, count the average end-to-end transmission delay (including propagation delay and transmission delay) of the current optimal path every 10 iterations, and compare the transmission efficiency convergence characteristics of the two algorithms. The results are shown in
Figure 20.
From the evolution curve in
Figure 20, the end-to-end delay of both algorithms shows a monotonic downward trend with the progress of iteration, with a fast decline rate in the early stage and gradual stabilization in the later stage. In the early iteration, UVC-SMA relies on the link pre-screening mechanism of initial conductivity, and the delay decline rate is slightly faster than HLP-ACO. With the deepening of iteration, the positive feedback mechanism of HLP-ACO with path length and delay as direct optimization objectives gradually shows advantages. The final steady-state delay drops to 38.2 ± 2.1 ms, about 21.6% lower than UVC-SMA’s 48.7 ± 2.4 ms, with clear transmission efficiency advantages.
The core of this difference lies in the different optimization orientations of the two algorithms. HLP-ACO takes end-to-end delay and path length as the core basis for pheromone update, and the optimization process always converges to the shortest transmission path without reserving additional overhead for topological redundancy, so better steady-state transmission efficiency can be achieved. The UVC-SMA takes global topological resilience as the primary optimization objective. To ensure path redundancy and fast switching in fault scenarios, the primary path is not strictly the geometric shortest path, and a certain degree of link redundancy needs to be maintained, so the steady-state transmission delay increases slightly.
This result further confirms the scenario differentiation characteristics of the two algorithms. HLP-ACO has low computational overhead and high single-path transmission efficiency, and is more suitable for routine inspection and data backhaul scenarios with stable topology and gentle electromagnetic environment. UVC-SMA exchanges acceptable steady-state delay cost for 1~2 orders of magnitude improvement in switching speed and robustness gain in fault scenarios, and is more suitable for high-dynamic, high-confrontation extreme operation environments such as emergency rescue and tactical reconnaissance.
- (5)
Comparison of Network-wide energy efficiency
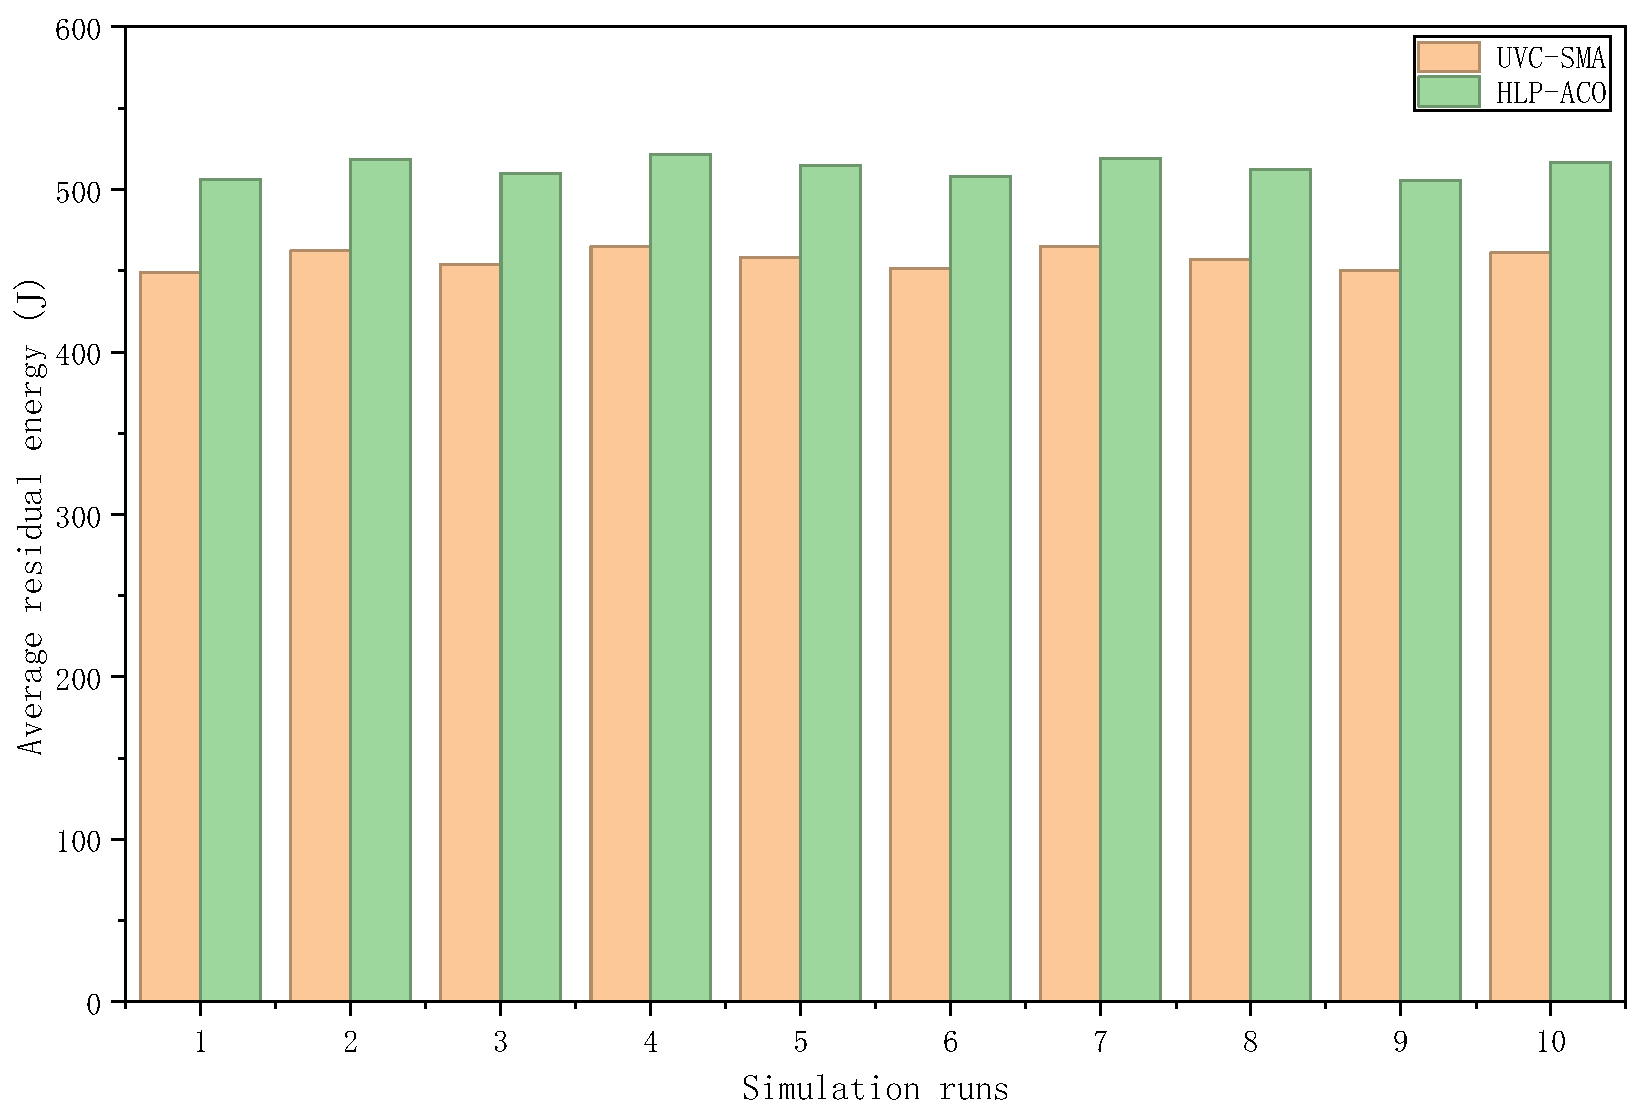
To comprehensively measure the resource consumption level of the two algorithms, based on 10 independent repeated experiments, count the average residual energy of all nodes in the network under steady state and compare their energy utilization efficiency. The results are shown in
Figure 21. All experimental groups have exactly the same initial energy configuration. The initial energy of relay nodes follows a uniform distribution of 500~800 J, and the simulation period is uniformly 200 iterations.
From the statistical results in
Figure 21, HLP-ACO has certain advantages in terms of steady-state energy efficiency. The average residual energy of 10 experiments is 513.4 ± 10.5 J, about 12.3% higher than UVC-SMA’s 457.3 ± 9.6 J. This difference is determined by their architectural designs. HLP-ACO is a single-path routing mechanism. Only links on the main transmission path generate communication and maintenance energy consumption, without bearing the additional overhead of redundant topology. UVC-SMA takes topological resilience as the core optimization objective. To support key node protection links and multipath redundant backups, richer network connections need to be maintained, so the overall energy consumption increases slightly.
Combined with the previous performance comparison, the two algorithms present a clear performance trade-off relationship. HLP-ACO enables efficient single-path transmission with low energy overhead and is suitable for normal operation scenarios with stable topology and low failure probability. The UVC-SMA trades a modest increase in energy consumption for a significant improvement in robustness and millisecond-level failover capability under node failure scenarios, and is more suitable for high-dynamic, high-risk extreme mission environments.
To further clarify the positioning of the UVC-SMA in the broader FANET research landscape, we qualitatively compare it with three classical state-of-the-art multipath routing protocols: AOMDV, OLSR, and MAODV.
Classical FANET routing protocols operate at the network layer, following the route discovery–maintenance–repair paradigm. AOMDV and MAODV are reactive multipath protocols that discover routes on demand and maintain backup paths through periodic hello packets; OLSR is a proactive protocol that precomputes routes through multipoint relays. These protocols excel at fast packet forwarding under stable topologies, but their route re-discovery process introduces significant latency and packet loss when topology changes rapidly or node failures occur.
In contrast, the UVC-SMA operates at the topology construction layer, optimizing the overall network connectivity structure through slime mold dynamics. Instead of reacting to failures after they occur, it proactively reinforces key nodes and precomputes disjoint backup paths embedded in the topology. This brings orders-of-magnitude faster failover and higher robustness under high-dynamics and high-failure scenarios, at the cost of slightly higher steady-state delay and energy overhead.
Direct quantitative comparison between the two categories is not straightforward: classical routing protocols are optimized for packet-level forwarding latency and control overhead, whereas the UVC-SMA targets topological resilience and structural energy efficiency. The optimization time scales and core indicator systems are fundamentally different. Therefore, we take HLP-ACO, a peer swarm intelligence topology optimization algorithm, as the primary quantitative benchmark, and provide this qualitative comparison to contextualize the results against broader FANET solutions.