


Abstract
Plaque rupture drives acute cardiovascular events and originates from a mechanical imbalance between fibrous cap integrity and lipid core loading. This process reflects the coupled elastic and viscous behavior of plaque components, and viscoelasticity therefore serves as a biomechanical marker for stability assessment. In this study, an intravascular photoacoustic viscoelasticity imaging (IVPAVEI) method was developed for the quantification of the plaque viscosity–elasticity ratio through phase delay analysis between the photoacoustic signal and laser pulse. A miniature probe with a diameter of 1.1 mm was integrated into the IVPAVEI system, rendering it suitable for intravascular applications. The capacity of the system to discriminate tissues with distinct viscoelastic properties was validated by resolution experiments in phantom. In situ evaluations were performed on rabbit aortic plaques, and IVPAVEI captured subtle viscoelastic changes before overt morphological lesions emerged. This minimally invasive approach thus enables the early detection of atherosclerotic plaques and holds potential for identifying lesions with high progression risk in future clinical practice.
1. Introduction
Atherosclerotic plaque rupture accounts for most acute myocardial infarctions and a substantial proportion of ischemic strokes, two clinical entities that collectively constitute the leading global contributors to cardiovascular and cerebrovascular mortality [1,2]. Early and accurate identification of vulnerable plaques is therefore essential for effective disease prevention and risk intervention [3,4]. Vulnerable lesions exhibit typical morphological characteristics, including thin fibrous caps, lipid-rich necrotic cores, and focal inflammatory infiltration [4,5]. However, morphological features alone cannot reliably determine plaque rupture susceptibility. Accumulated clinical and mechanical studies have demonstrated that the biomechanical behaviors of plaques and vessel walls act as more fundamental determinants of plaque stability [6,7]. Plaque vulnerability is predominantly regulated by fibrous cap fatigue, the cyclic deformation of lipid cores under pulsatile hemodynamic loading, and tissue energy dissipation under continuous vascular stimulation [6,8]. These dynamic mechanical responses, particularly the intrinsic viscoelastic properties of vascular tissues, cannot be quantitatively resolved by conventional imaging techniques, which only provide static anatomical and compositional information. Consequently, a thorough assessment of the plaque’s inherent biomechanical characteristics is essential for the precise early detection of atherosclerotic lesions.
Current clinical intravascular imaging modalities are incapable of achieving such comprehensive evaluation of mechanical properties. Intravascular ultrasound enables deep visualization of vascular structures but is limited by low spatial resolution and a lack of quantitative biomechanical detection capacity [3,9]. Optical coherence tomography provides high-resolution microstructural imaging of vessel walls, but its imaging depth is constrained by optical scattering, and it cannot acquire functional mechanical information about vascular lesions [10,11]. As a hybrid imaging modality, intravascular photoacoustic imaging integrates the molecular specificity of optical detection and the deep penetration advantage of ultrasound, enabling high-contrast visualization of the plaque lipid distribution and vascular microstructure [12]. Despite these merits, existing intravascular photoacoustic (PA) techniques mainly focus on the morphological and compositional analysis of atherosclerotic plaques. They generally ignore tissue viscoelastic heterogeneity and fail to quantify stability-related mechanical parameters, which greatly constrain their clinical potential for the accurate early detection of atherosclerotic plaques [13].
PA viscoelasticity imaging has recently emerged as a promising technical strategy to break through the above limitations. This technique enables noninvasive quantitative measurement of tissue viscoelastic parameters by detecting the phase delay between the acquired PA signals and the excitation laser pulses [14,15]. Upon pulsed laser excitation, the elastic components of atherosclerotic plaques produce instantaneous thermoelastic deformation, whereas viscous components induce mechanical damping and deformation hysteresis, generating a detectable phase delay between PA signals and laser excitation pulses [15]. This phase lag serves as a direct physical indicator of plaque viscoelasticity; this fact establishes a reliable theoretical basis for evaluating plaque mechanical properties. Unlike conventional elastography that only estimates tissue elastic modulus [16], PA viscoelasticity imaging can simultaneously reconstruct storage modulus (elasticity) and loss modulus (viscosity) to fully characterize the dynamic mechanical behaviors of biological tissues. This dual-parameter detection capability is particularly valuable for plaque vulnerability assessment [17,18]. Lipid-rich necrotic cores exhibit significant viscous dissipation characteristics, while fibrous caps present dominant elastic mechanical responses, which creates distinguishable mechanical features between heterogeneous plaque components [19,20]. Previous studies have verified that plaque mechanical properties are closely correlated with tissue composition and macrophage infiltration degree [17,18]. Viscoelastic parameters can effectively differentiate lipid-rich regions from fibrotic vascular tissues, and the dynamic variation in these mechanical indicators corresponds well with the pathological progression of atherosclerosis [18]. Building on these advances, intravascular photoacoustic viscoelasticity imaging (IVPAVEI) extends viscoelastic imaging principles to intracavitary detection and supports in situ mechanical evaluation of vascular walls.
In this study, we propose an IVPAVEI method that employs a miniature probe with a diameter of approximately 1.1 mm to quantitatively derive the viscosity–elasticity ratio (VER) of atherosclerotic plaques through phase delay analysis of intracavitary PA signals. A core advantage of this technique is the quantitative acquisition of the viscoelastic parameters of plaques with high resolution and high contrast, without additional mechanical excitation. By enabling the minimally invasive visualization of aortic plaques in rabbits in situ maintained on a high-fat/high-cholesterol (HFC) diet for different durations, IVPAVEI offers a robust and innovative imaging modality for the early identification of atherosclerotic plaques, thereby improving plaque detection rates.
2. Materials and Methods
2.1. Pathological Mechanisms of Viscoelastic Changes in Plaques
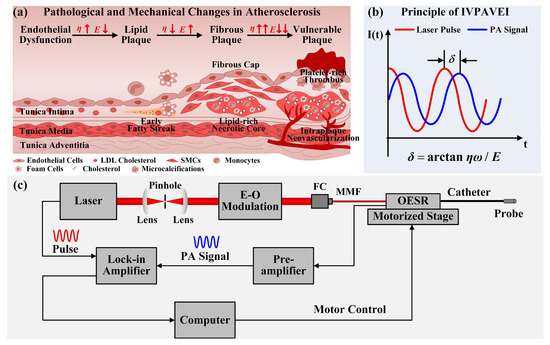
During the pathological progression of atherosclerotic plaques, elasticity and viscosity tend to vary in opposite directions [Figure 1a]. Early lipid-laden plaques contain massive lipid pools and foam cells with sparse extracellular collagen, yielding low elastic modulus and prominent viscous dissipation, which renders the tissue susceptible to persistent plastic deformation under cyclic hemodynamic loads [21,22]. In stable thick-cap fibrous plaques, compensatory collagen synthesis generates a dense fibrous cap with reinforced elastic load-bearing capacity, while the encapsulated lipid core reduces bulk viscous loss; this achieves a balanced elastic–viscous mechanical state that resists vascular stress [6,23]. For high-risk thin-cap fibrous plaques (vulnerable plaques), inflammatory secretion of matrix metalloproteinases degrades collagen and elastic fibers within the fibrous cap, drastically diminishing its elastic stiffness; the underlying lipid necrotic core remains highly viscous and deformable [3,24]. The mechanical incongruity between the weakened elastic cap and viscously compliant lipid core induces regional stress concentration and elevates plaque rupture susceptibility. Accordingly, quantitative detection of the VER signatures permits the identification of pre-morphological plaque destabilization. Although the present study focuses on the early detection of atherosclerotic plaques, IVPAVEI holds the potential to discriminate plaque types and evaluate plaque vulnerability given the dynamic alterations in mechanical properties during plaque progression.
Figure 1.
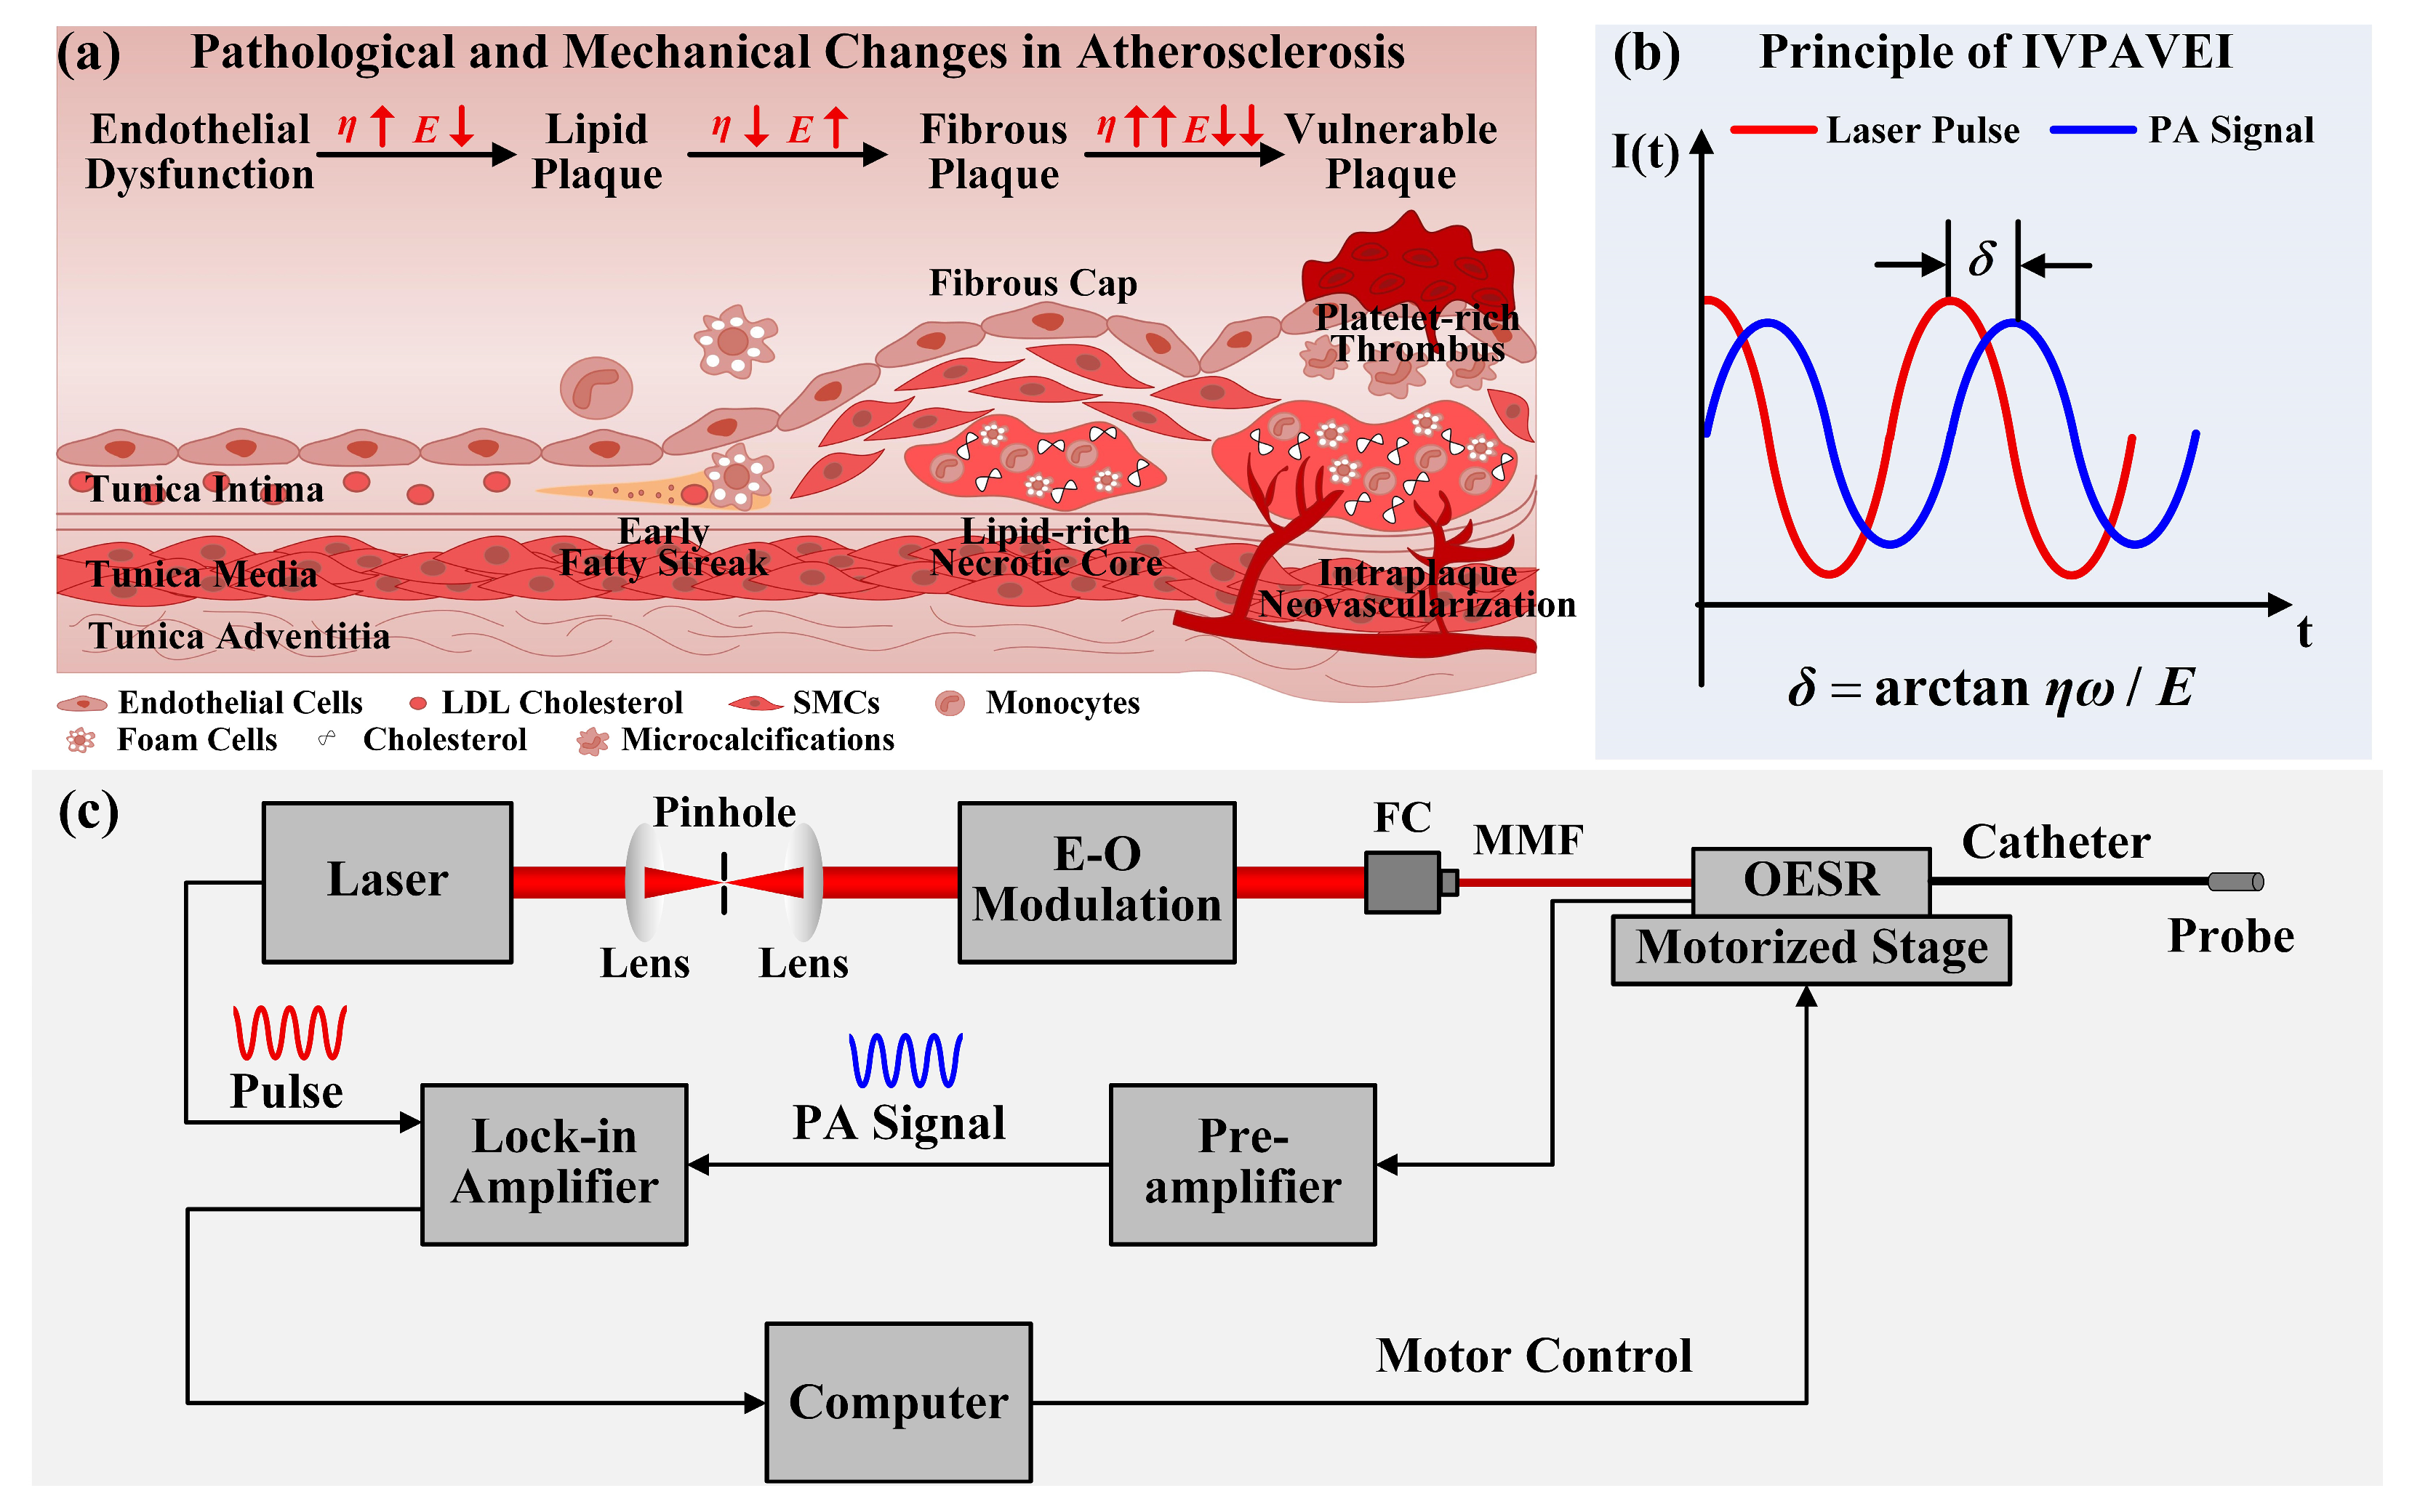
Detection principle and imaging system. (a) The pathological and mechanical changes in atherosclerosis. (b) The principle of IVPAVEI. (c) The schematic diagram of IVPAVEI imaging system, including a photograph of the intravascular probe. LDL, low-density lipoprotein; SMC, smooth muscle cell; η, viscosity coefficient; E, Young’s modulus; ω, modulation frequency; δ, phase delay; E-O Modulation, electro-optic modulator; FC, fiber couple; MMF, multi-mode fiber; OESR, opto-electric slip ring. Arrows denote: ↑, increase; ↓, decrease; ↑↑, sharp increase; ↓↓, sharp decrease.
2.2. The Principle of IVPAVEI
The basic principle of IVPAVEI is shown in Figure 1b. Due to the damping effects of the tissue, the generated PA signals exhibit a phase delay relative to the laser trigger, and the magnitude of this phase delay is directly related to the viscoelastic properties of plaques [17]. In the rheological Kelvin–Voigt model, the relationship between the phase delay δ and the VER (η/E) is , where η is the viscosity coefficient, E is the Young’s modulus, and ω is the modulation frequency (the detailed derivation is shown in Supplementary Part S1) [14]. Because the focal depth of the laser in the tissue is approximately 100 μm, precisely, the PA information reflects the average VER in the depth range of 0 to 100 μm. It should be noted that IVPAVEI depends on the phase delay of the PA signal and is independent of the absorption coefficient (Supplementary Part S2), which indicates that it is inherently independent to PA absorption imaging.
2.3. IVPAVEI Imaging System
A schematic diagram of the IVPAVEI experimental setup is shown in Figure 1c. A fiber-coupled continuous-wave laser operating at 808 nm with single-mode, polarization-maintaining output (AeroDIODE 808LD-1-2-1-PM, Talence, France, with 30 mW output power) was used as the excitation source. The laser intensity was modulated at 3 MHz using a fiber-coupled electro-optic Mach-Zehnder modulator (NIR-MX800-LN-10, iXblue Photonics, Saint-Germain-en-Laye, France). The modulator was driven by a 3 MHz sinusoidal signal from a function generator with a radio-frequency amplitude of 4.5 V peak to peak, adjusted to produce a modulation depth of approximately 90%; a direct-current bias was maintained at the quadrature point to ensure stable modulation. Furthermore, the continuous-wave laser output was sinusoidally modulated as with and . For linear absorption, the heat deposition is . The alternating component of drives the photoacoustic wave equation, yielding an acoustic pressure . At , the thermal diffusion length is approximately 0.12 μm, smaller than typical tissue absorbers, so the periodic heating is quasi-adiabatic and the resulting acoustic wave is efficiently generated [14,17,25]. The output from the modulator was collimated, spatially filtered through a 50 μm pinhole, and then coupled via a fiber coupler (PAF-X-11-PC-B, Thorlabs, Newton, NJ, USA, with an 808 nm antireflection coating) into a graded-index multi-mode fiber with a core diameter of 62.5 μm, a cladding diameter of 125 μm, and a numerical aperture of 0.27 (GIF625, Thorlabs, USA). A hybrid opto-electrical slip ring consisting of a multi-mode fiber optic rotary joint (MJX-1-62.5/125-FC/PC, Princetel, Inc., Hamilton, NJ, USA; compatible with 62.5/125 μm fiber) and an electrical slip ring (SRA-73830, Moog Inc., Elma, NY, USA, maximum rotational speed 250 rpm) was used to transmit both the 808 nm laser light and the detected electrical signals between the rotating and stationary sections. This rotary assembly was mounted on a single-axis motorized linear translation stage (MTS25-Z8, Thorlabs, USA; 25 mm travel, bidirectional repeatability ±1.5 μm, minimum incremental movement 0.05 μm) for Z-axis pullback; rotation was provided by the opto-electrical slip ring, which enabled helical scanning for intravascular three-dimensional (3D) imaging. The PA signals were carried out by a custom-made ultrasound transducer. The acquired signals were amplified using a preamplifier (SA-230F5, NF, Yokohama, Japan; DC-70 MHz bandwidth, input impedance ≥ 1 MΩ, input voltage noise ≈ 2 nV/√Hz). The amplified PA signal was demodulated at 3 MHz by a lock-in amplifier (OE2041, Sysu scientific instruments, Guangzhou, China; demodulation frequency DC-60 MHz, dynamic reserve >120 dB, phase resolution 0.001°), with the reference signal provided by the same function generator that drove the modulator. The system was operated via a LABVIEW 2018 program (National Instruments, Austin, TX, USA). MATLAB R2018a software (MathWorks, Inc., Natick, MA, USA) was used for image construction and index measurement.
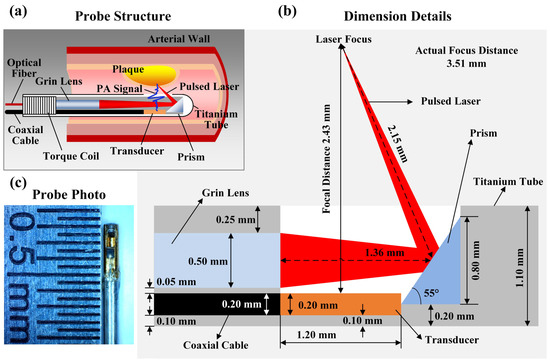
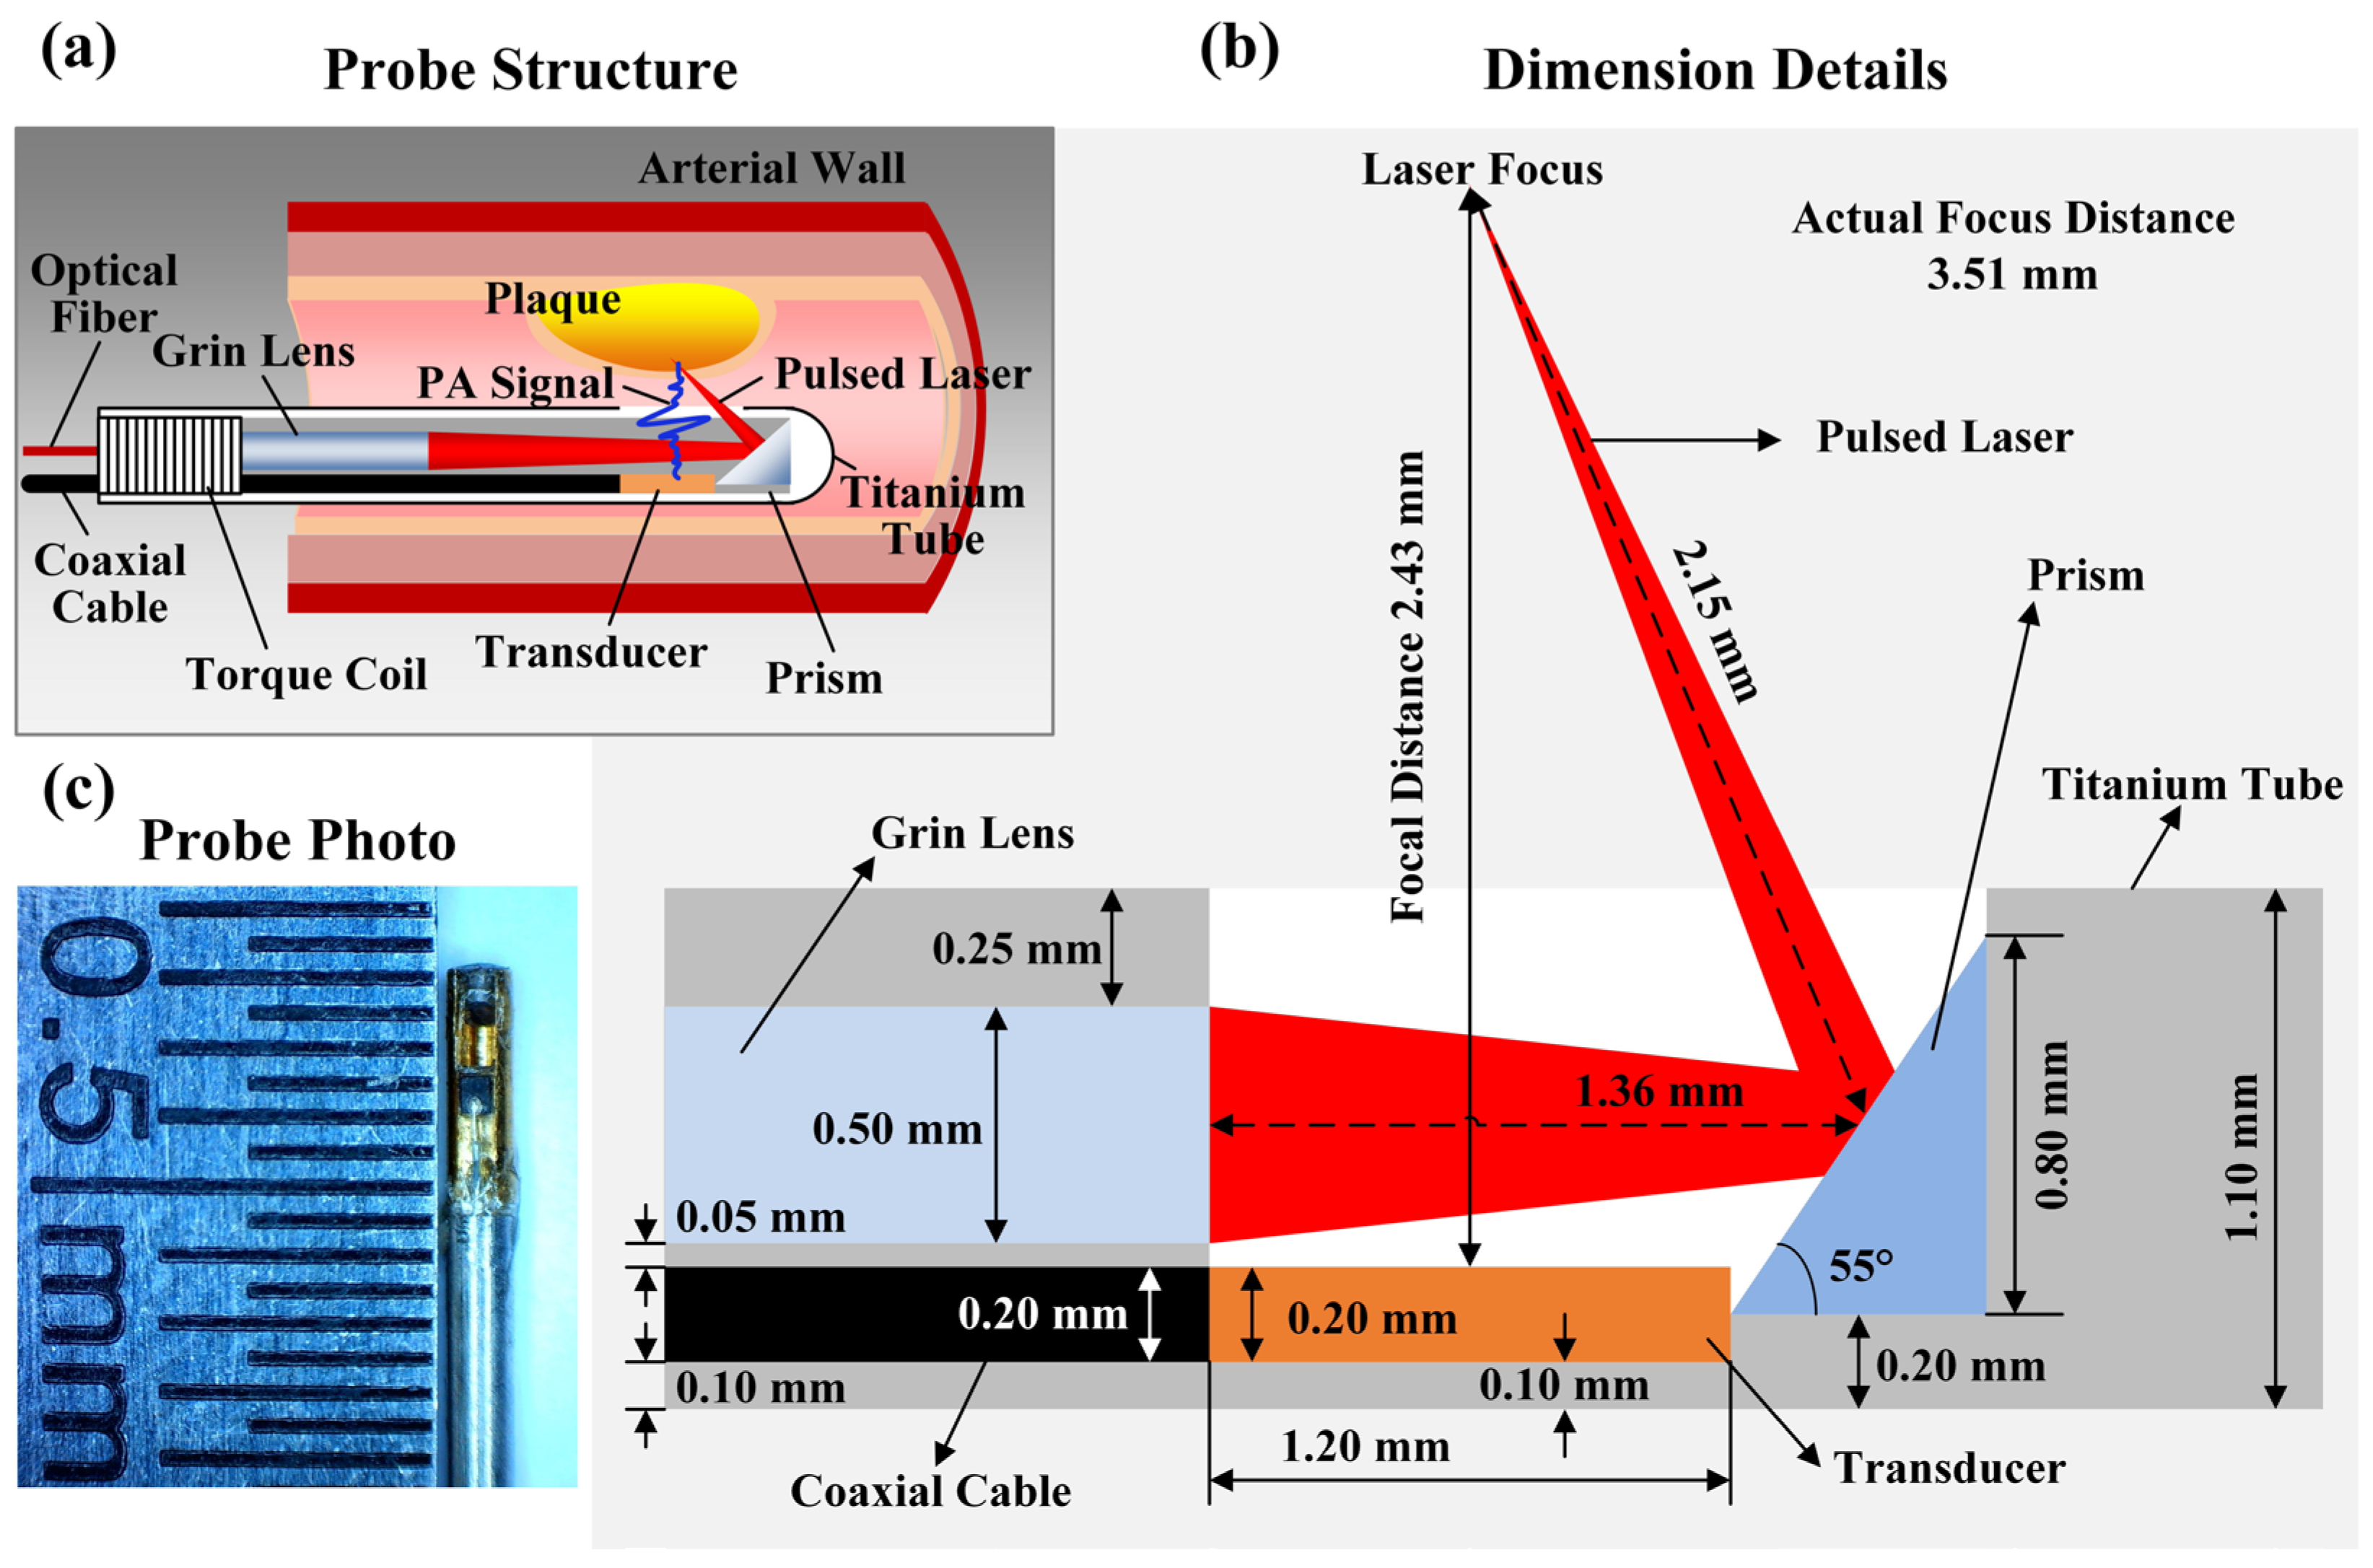
The schematic of the probe, which consists of titanium tube, multi-mode fiber, customized gradient index lens, customized prism, and customized tiny ultrasonic transducer, is shown in Figure 2a. First, the customized gradient index lens (0.5 mm diameter, 2.2 mm lens length, 3.5 mm working distance, numerical aperture = 0.46, anti-reflective coating for 808 nm, Xi’an Aofa Optoelectronics, Xi’an, China) was fixed to the multi-mode fiber with ultraviolet glue and was used to focus the output laser. Second, the customized coated prism (55° reflection angle, high-reflection coating for 808 nm, angle tolerance ≤ 5 arcmin, Nanjing Chenbo Optics, Nanjing, China) was attached to the front end of the titanium tube so that the focus laser was deflected 70° to the surface of the sample for the purposes of receiving the furthest PA signal. The optical intensity on the surface of the aortic wall was limited to 12 mJ/cm2 within the American National Standard Institute’s limits (20 mJ/cm2) [26]. The laser focus (the effective diameter was about 95.7 μm) was just immediately above the center of the transducer, and the distance was about 2.43 mm [Figure 2b]. Finally, the custom-made transducer (length × width × height = 1.2 mm × 1.0 mm × 0.2 mm, 3 MHz center frequency, 99% −6 dB bandwidth, Innosonics, Wuxi, China) was mounted on the plane to ensure that the signal receiving surface was flat, and it had a coaxial cable with an outer diameter of 200 μm, whose end was combined with bayonet nut connectors. The key to the assembling procedure was that the transducer should be placed coaxially with the optical path with respect to the coated prism. A titanium tube with a length of 15 mm and an outer diameter of 1.1 mm was used as the outer casing of the probe. All assemblies of the probe were completed under a microscope. The specific structural size of the probe is shown in Figure 2b. The actual working distance of the gradient index lens was approximately 3.51 mm. The prism was 0.1 mm higher than the transducer when installed. In addition, the protective sheath for probe was made of medical-grade colorless polyimide, featuring ultra-thin wall, favorable biocompatibility, balanced mechanical strength and flexibility, as well as good 808 nm laser transmission and PA signal permeability to facilitate navigation within tortuous blood vessels. The photograph of the probe without a protective sheath is also shown in Figure 2c.
Figure 2.
The probe of IVPAVEI. (a) Probe structure. (b) Probe dimension details. (c) Photograph of the assembled probe.
2.4. VER Calibration Process
A two-stage systematic phase calibration framework was established at a fixed modulation frequency of 3 MHz to eliminate inherent phase biases originating from optical paths, electronic circuits, and instrumental hardware. First, an ultra-thin carbon black coating (<10 µm) applied on the lateral optoacoustic window of the catheter probe was utilized for baseline referencing. The static optoelectronic baseline phase offset was determined to be δ0 ≈ (5.08 ± 0.24)° based on 10 repeated measurements, with an overall coefficient of variation (CV) of 4.72%. This baseline offset was subtracted from all raw PA phase datasets to remove system-wide static phase artifacts. Second, dedicated single-frequency calibrations were performed to quantify hardware-induced phase deviations: the intrinsic phase lag of the intravascular ultrasound transducer was characterized via pulse-echo measurements as δUT ≈ (3.02 ± 0.08)° (10 tests, CV = 2.65%), and the demodulation phase error of the lock-in amplifier was calibrated using a standard resistor–capacitor network as δLA ≈ (2.01 ± 0.03)° (10 tests, CV = 1.49%). Furthermore, the phase offset of the preamplifier was calibrated before each measurement using a reference signal of well-defined phase and subtracted from the raw phase data, with a residual static phase below 0.5°. The preamplifier bandwidth (>30 MHz) and AC-coupling cutoff (<300 kHz) were set one decade beyond the 3 MHz modulation frequency on each side to minimize phase roll-off and preserve the fidelity of viscoelasticity-related phase information. Through the calibration strategy, the residual system phase uncertainty was ultimately suppressed within 1°. In addition, the effects of other factors are as follows: First, the influence of optical path length on phase measurement was systematically evaluated. The constant phase contribution from the fixed optical path inside the delivery fiber was intrinsically incorporated into the system baseline phase δ0. In the intravascular configuration, the distance from the probe mirror to the luminal surface was mechanically constrained by the catheter sheath (approximately 2~2.5 mm). At the modulation frequency of 3 MHz, this delay translated into a phase shift of approximately 0.007°~0.009°. And a 100 μm variation in tissue depth would introduce an additional phase error of less than 10−4°, which was entirely negligible. Second, to suppress phase distortions arising from probe positional fluctuations, an internal 50 μm silicone rubber reference coating (excellent optical transmittance and acoustic transparency) with thermally stable viscoelastic properties was deposited on the catheter sheath to cancel common-mode motion-induced phase drifts via relative phase calculation. Third, systematic phase calibration could also effectively eliminate systematic phase errors caused by acoustic impedance mismatch. The phase-locked amplifier with a time constant of 30 ms had an intrinsic phase noise floor of approximately 0.5°, and only pixels with a signal-to-noise ratio greater than 15 dB were retained for VER reconstruction to ensure reliable and accurate quantification of tissue viscoelasticity. Lastly, the thermal diffusion length per modulation cycle (~0.1 μm in water) is far smaller than the optical absorption depth, so photothermal heating follows the modulated intensity with negligible thermal lag, largely suppressing thermally induced phase lag. High irradiance triggers nonlinear optical absorption and concomitant phase distortion; baseline calibration compensates phase bias from heterogeneous light deposition. The detailed system calibration workflow for IVPAVEI is presented in Supplementary Part S3.
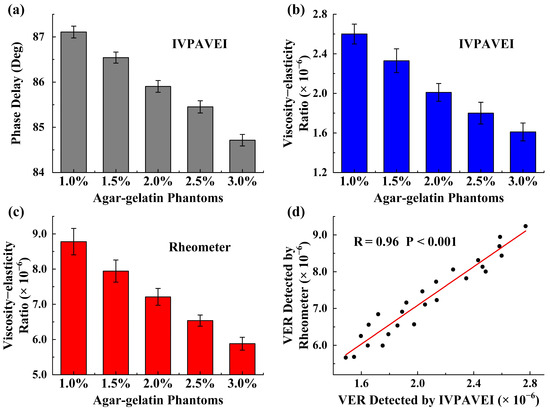
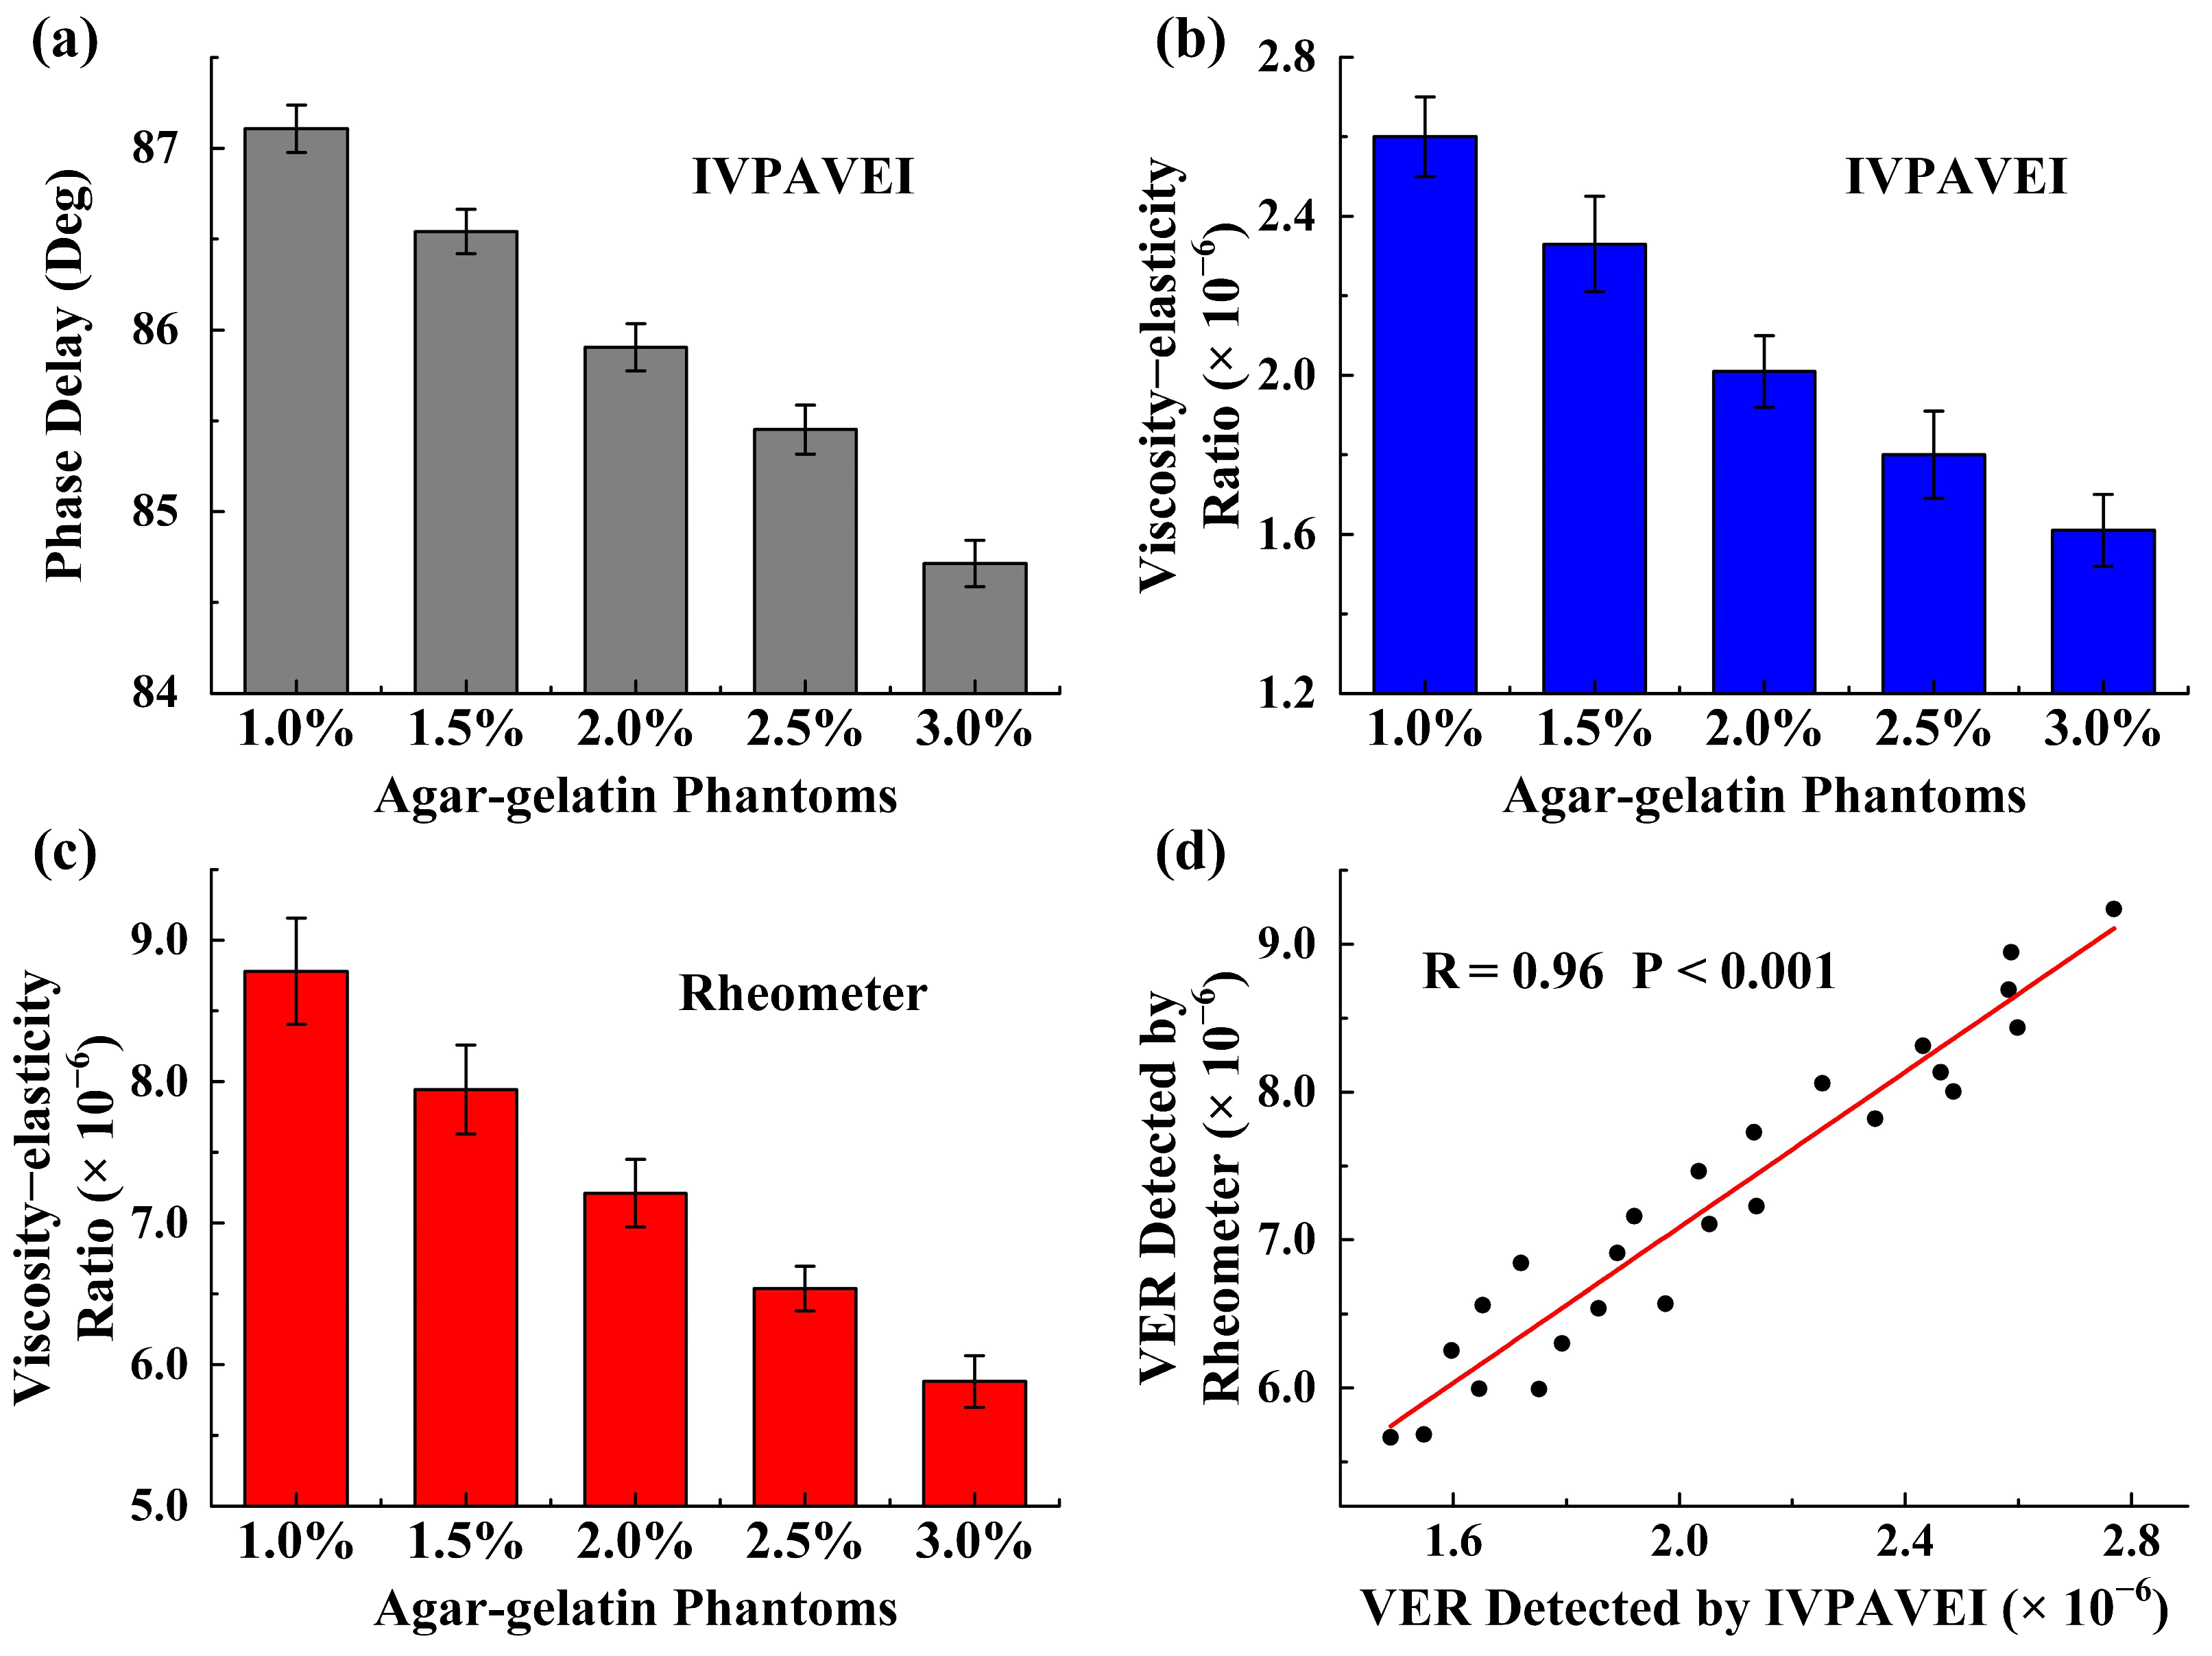
To ensure the accuracy of the VER detection of IVPAVEI system, a series of agar–gelatin phantoms with varying agar concentrations (1.0%, 1.5%, 2.0%, 2.5%, and 3.0%) was prepared (prepare 5 samples of each concentration). Agar–gelatin and ink concentrations (0.5%) were kept constant across all phantoms to ensure uniform background viscoelasticity and optical absorption. The phantoms were analyzed using the IVPAVEI system, and the VER values were recorded after calibrating the phase delay of the PA signal. Figure 3 shows the raw phase delay and system-calibrated VER values. The raw phase delay was obtained by disabling the correction modules in the latter part of the original data-processing script while keeping all other experimental and acquisition settings unchanged. As the agar–gelatin concentration increased, both the PA phase delay [Figure 3a] and the VER value [Figure 3b] decreased. The VER values were derived directly from the experimentally measured phase delays, and, therefore, the experimental phase information was implicitly contained in the VER results. Subsequently, the viscoelastic properties of these phantoms (the same phantoms) were detected by the rheometer (Anton Paar MCR 302e, Anton Paar GmbH, Graz, Austria; the rheometer parameter settings are shown in Supplementary Part S4), as illustrated in Figure 3c. The calibration curve was established by plotting the PA-derived VER against the rheometer-measured VER and performing linear regression analysis. The resulting relationship exhibited a strong linear correlation (R = 0.96, p < 0.001), which confirms that the IVPAVEI system could reliably discriminate viscoelastic differences [Figure 3d]. This calibration equation (VERR = 2.63VERPA + 0.18 × 10⁻⁶) was then applied to correct all subsequent tissue measurements. The phantom-based calibration ensured that the VER contrast reconstructed from intravascular PA signals faithfully reflected the intrinsic viscoelastic properties of atherosclerotic plaques.
Figure 3.
Calibration experiment of agar–gelatin phantoms. (a) PA raw phase delay. (b) VER distribution after system phase correction. (c) VER distribution acquired via rheometer measurements. (d) Calibration curve between the PA-derived VER against the rheometer-measured VER.
2.5. Experimental Protocol
All the procedures were performed according to a protocol approved by the Animal Study Committee of South China Normal University College of Biophotonics in Guangdong, China. Three New Zealand white rabbits (male, age 3 months, weight 2.3 to 2.8 kg) served as the experimental model of atherosclerosis. Atherosclerotic changes were induced with an HFC diet (97% normal chow, 2% lard, and 1% cholesterol). IVPAVEI was implemented on the segmental abdominal aorta of each rabbit following 0, 8, and 16 weeks of HFC feeding to reconstruct 3D VER distribution maps of vascular tissues. During the experiment, three rabbits were sedated with pentobarbital (3%, 30 mg/kg). Laparotomy was performed to expose the abdominal aorta. Then, a catheter soaked in heparin solution was inserted into the aorta to perform in situ IVPAVEI. During data acquisition, the catheter was inserted into the aortic lumen, and a 360° scan with a 0.05 mm pullback step from the proximal shoulder to the distal shoulder of the aortic specimen was performed. After the experiments and subsequent formalin fixation, the marked arterial segments were dissected. For all vessels, cross-sections of atherosclerotic plaques were sliced near the center of the marked segment for lipid with Oil Red O (to reveal lipid accumulation). Oil Red O staining was selected as the sole histological modality primarily because the rabbits in this study received 0-, 8-, and 16-week HFC diets without mechanical endothelial injury; their aortic lesions were dominated by lipid plaques, with no formation of fibrous or vulnerable plaques. Lipid core area of histological examination was quantified using Image Pro plus 7.0 software (Media Cybernetics, Rockville, Maryland).
3. Results
3.1. System Spatial Resolution and Plaque Viscoelastic Detection
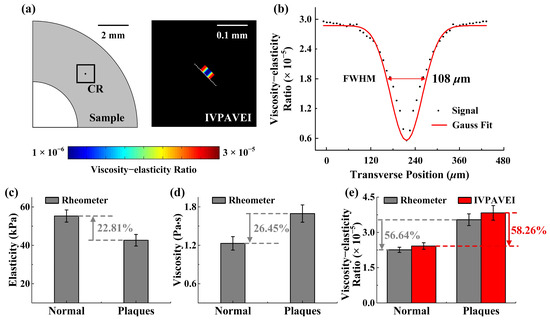
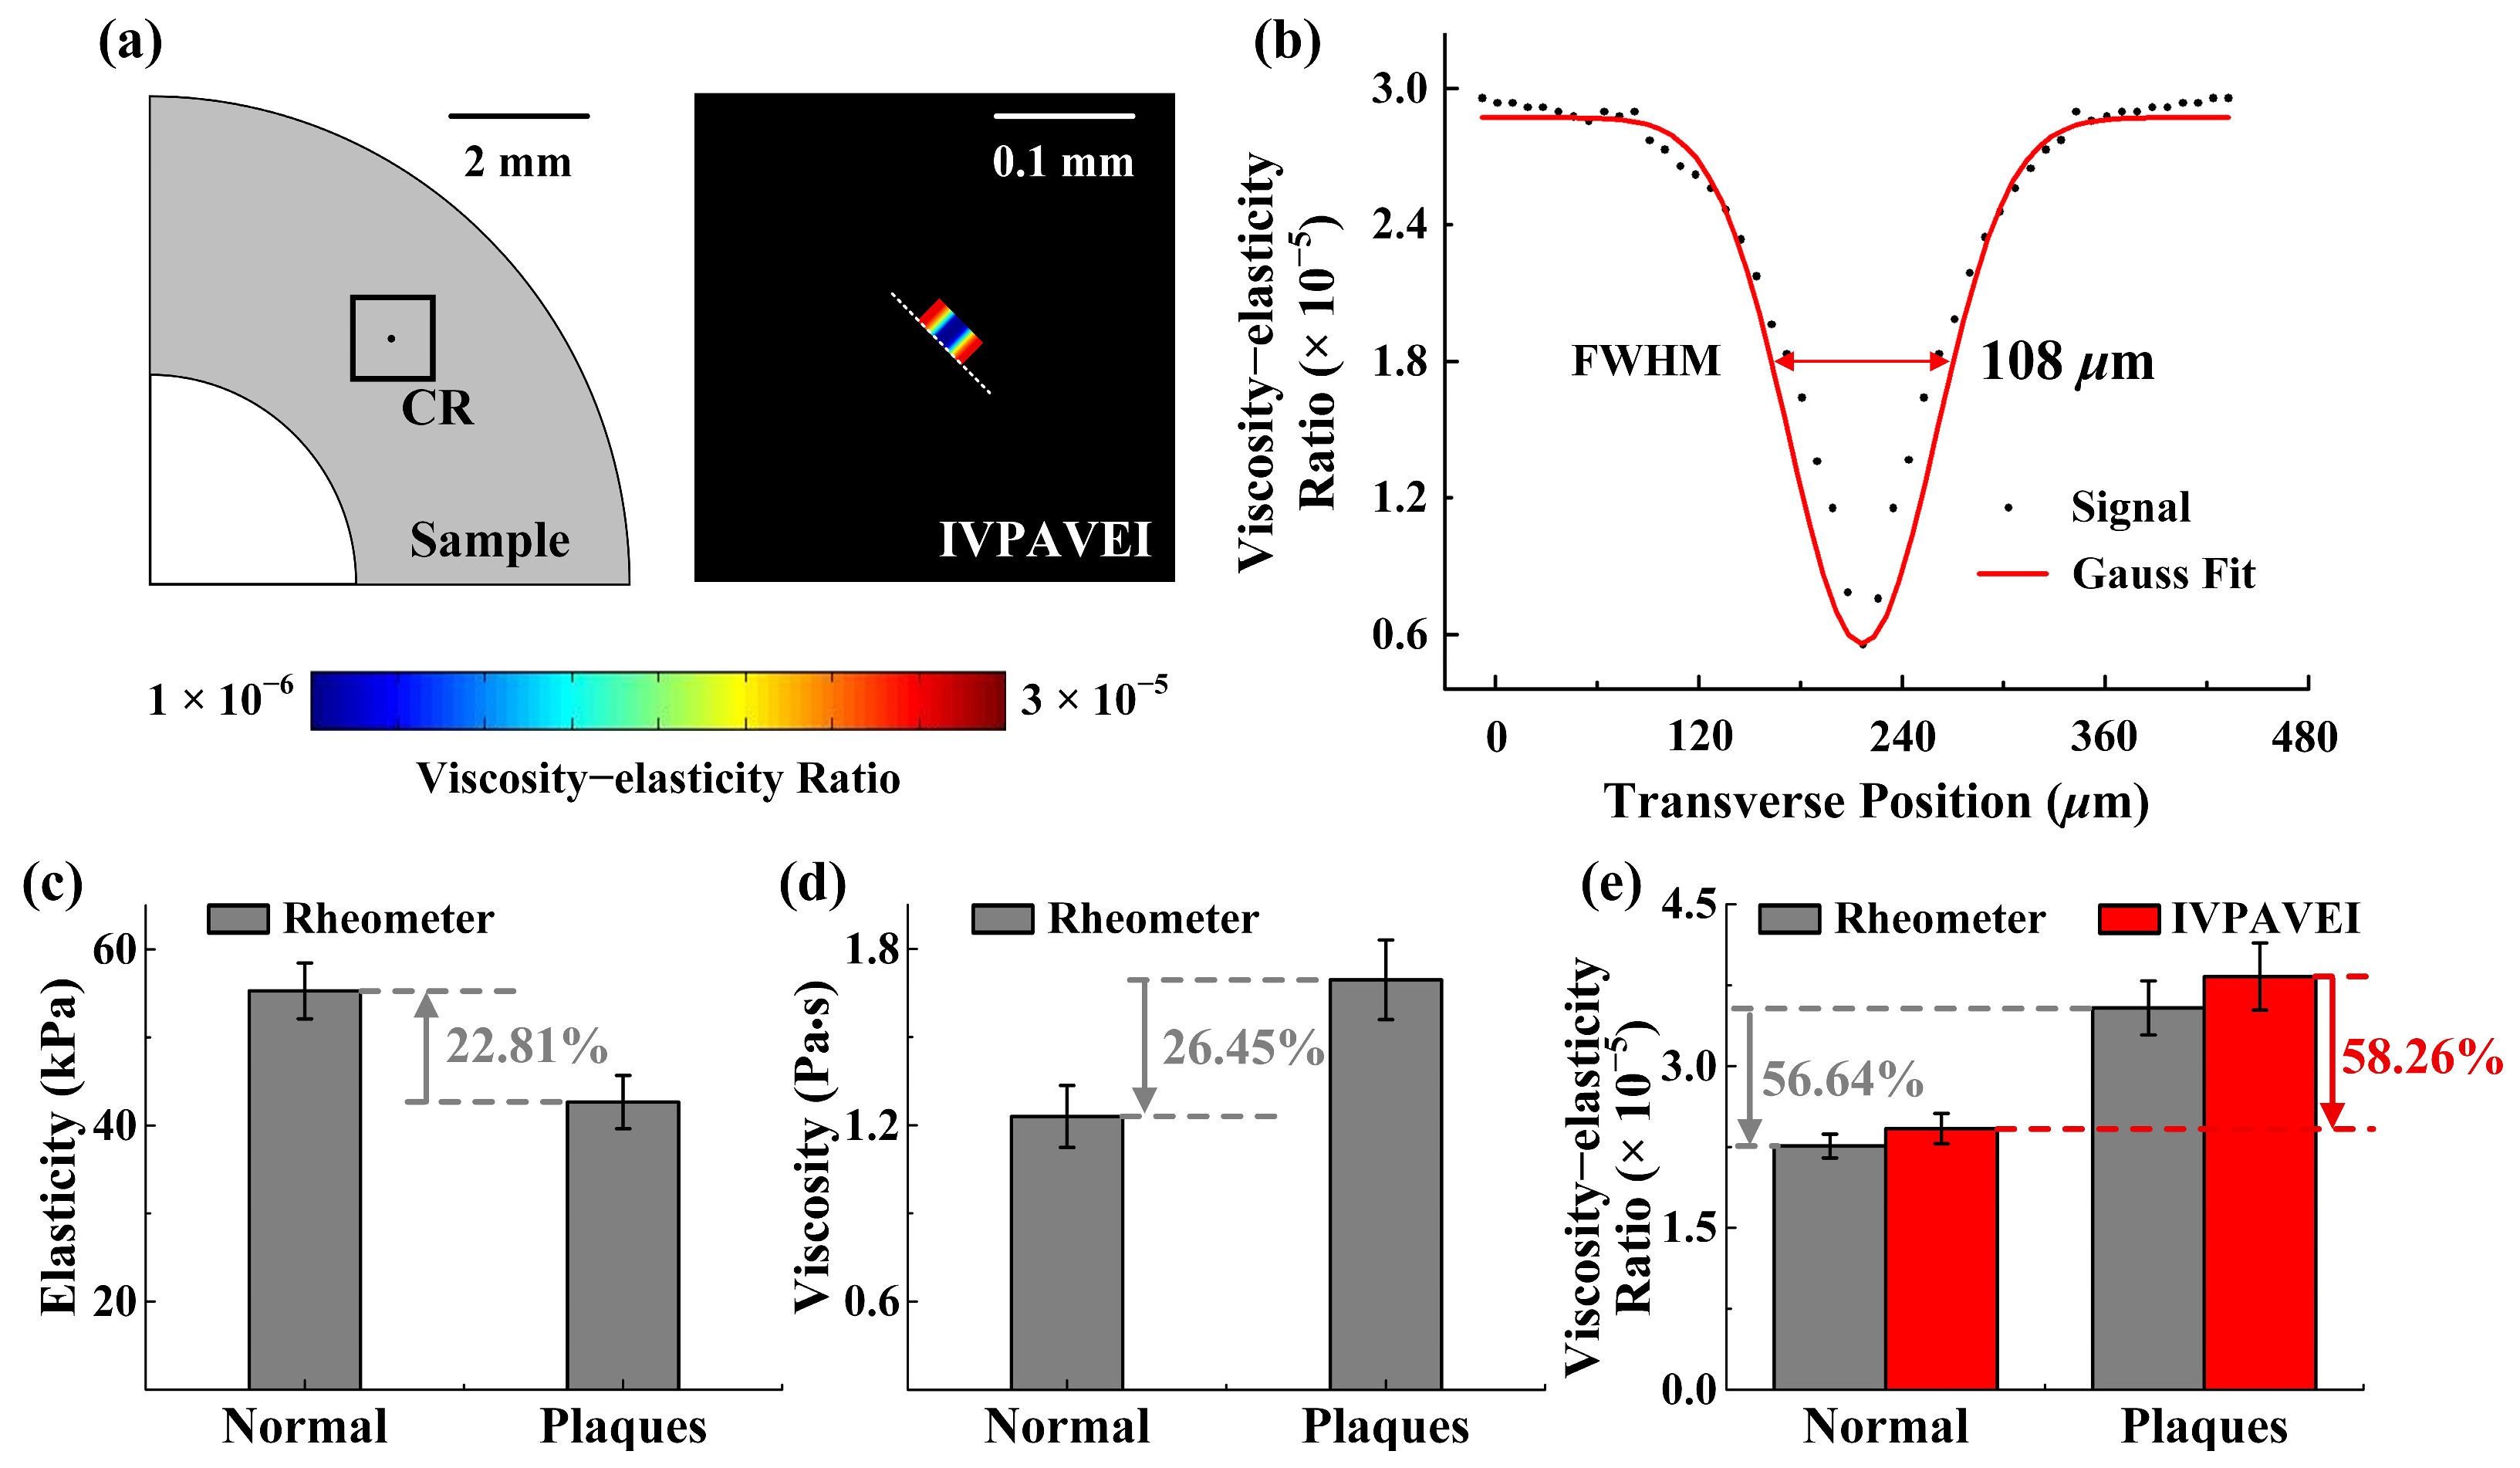
To evaluate the spatial resolution of the system, a carbon rod of approximately 60 μm in diameter was selected as the target and inserted in gelatin to estimate the transverse resolution of IVPAVEI. Figure 4a shows the schematic diagram and IVPAVEI B-scan image of the carbon rod; the image corresponds to the area enclosed by the black border in the schematic diagram. The transverse point spread function (PSF) is presented in Figure 4b. The lateral resolution of the IVPAVEI was 108 μm, which was defined as the full width half-maximum (FWHM) of the PSF. In addition, to demonstrate the magnification mechanism of IVPAVEI in detecting the mechanical properties of atherosclerotic plaques, the elasticity, viscosity and VER of the plaques were measured. Figure 4c–e show the rheometer and IVPAVEI results of the normal arteries and the lipid plaques. In the rheometer measurement, the mean values of the Young’s modulus and viscous coefficients were 55.28 kPa, 1.21 Pa·s and 42.67 kPa, 1.53 Pa·s, respectively. The difference in elasticity and viscosity was approximately 22.81% and 26.45%, respectively. However, 58.26% of the difference in VER could have been obtained from IVPAVEI (rheometer, ~56.64%), much higher than that from a single parameter. Here, we defined the difference as (Va and Vb represent the mean values of the normal vessels and lipid plaques, respectively). The results demonstrate that VER measured via IVPAVEI amplifies the opposing changes between viscosity and elasticity during atherosclerosis, enabling effective detection of atherosclerotic plaques.
Figure 4.
System characterization and parameter validation. (a) IVPAVEI images of carbon rod. (b) Lateral resolution of IVPAVEI. (c) Elasticity, (d) viscosity and (e) VER of lipid plaques and normal vessels. Elasticity and viscosity were detected by rheometer. CR, carbon rod; FWHM, full width half maximum.
3.2. Simulated Sample Experiment
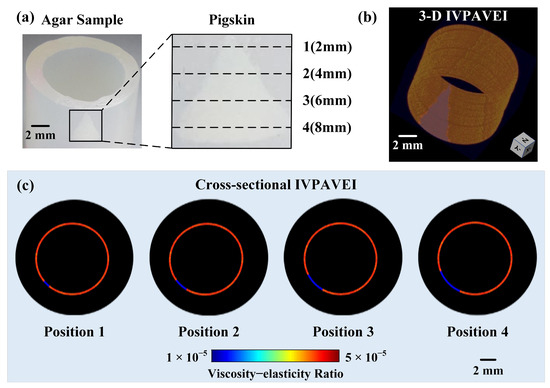
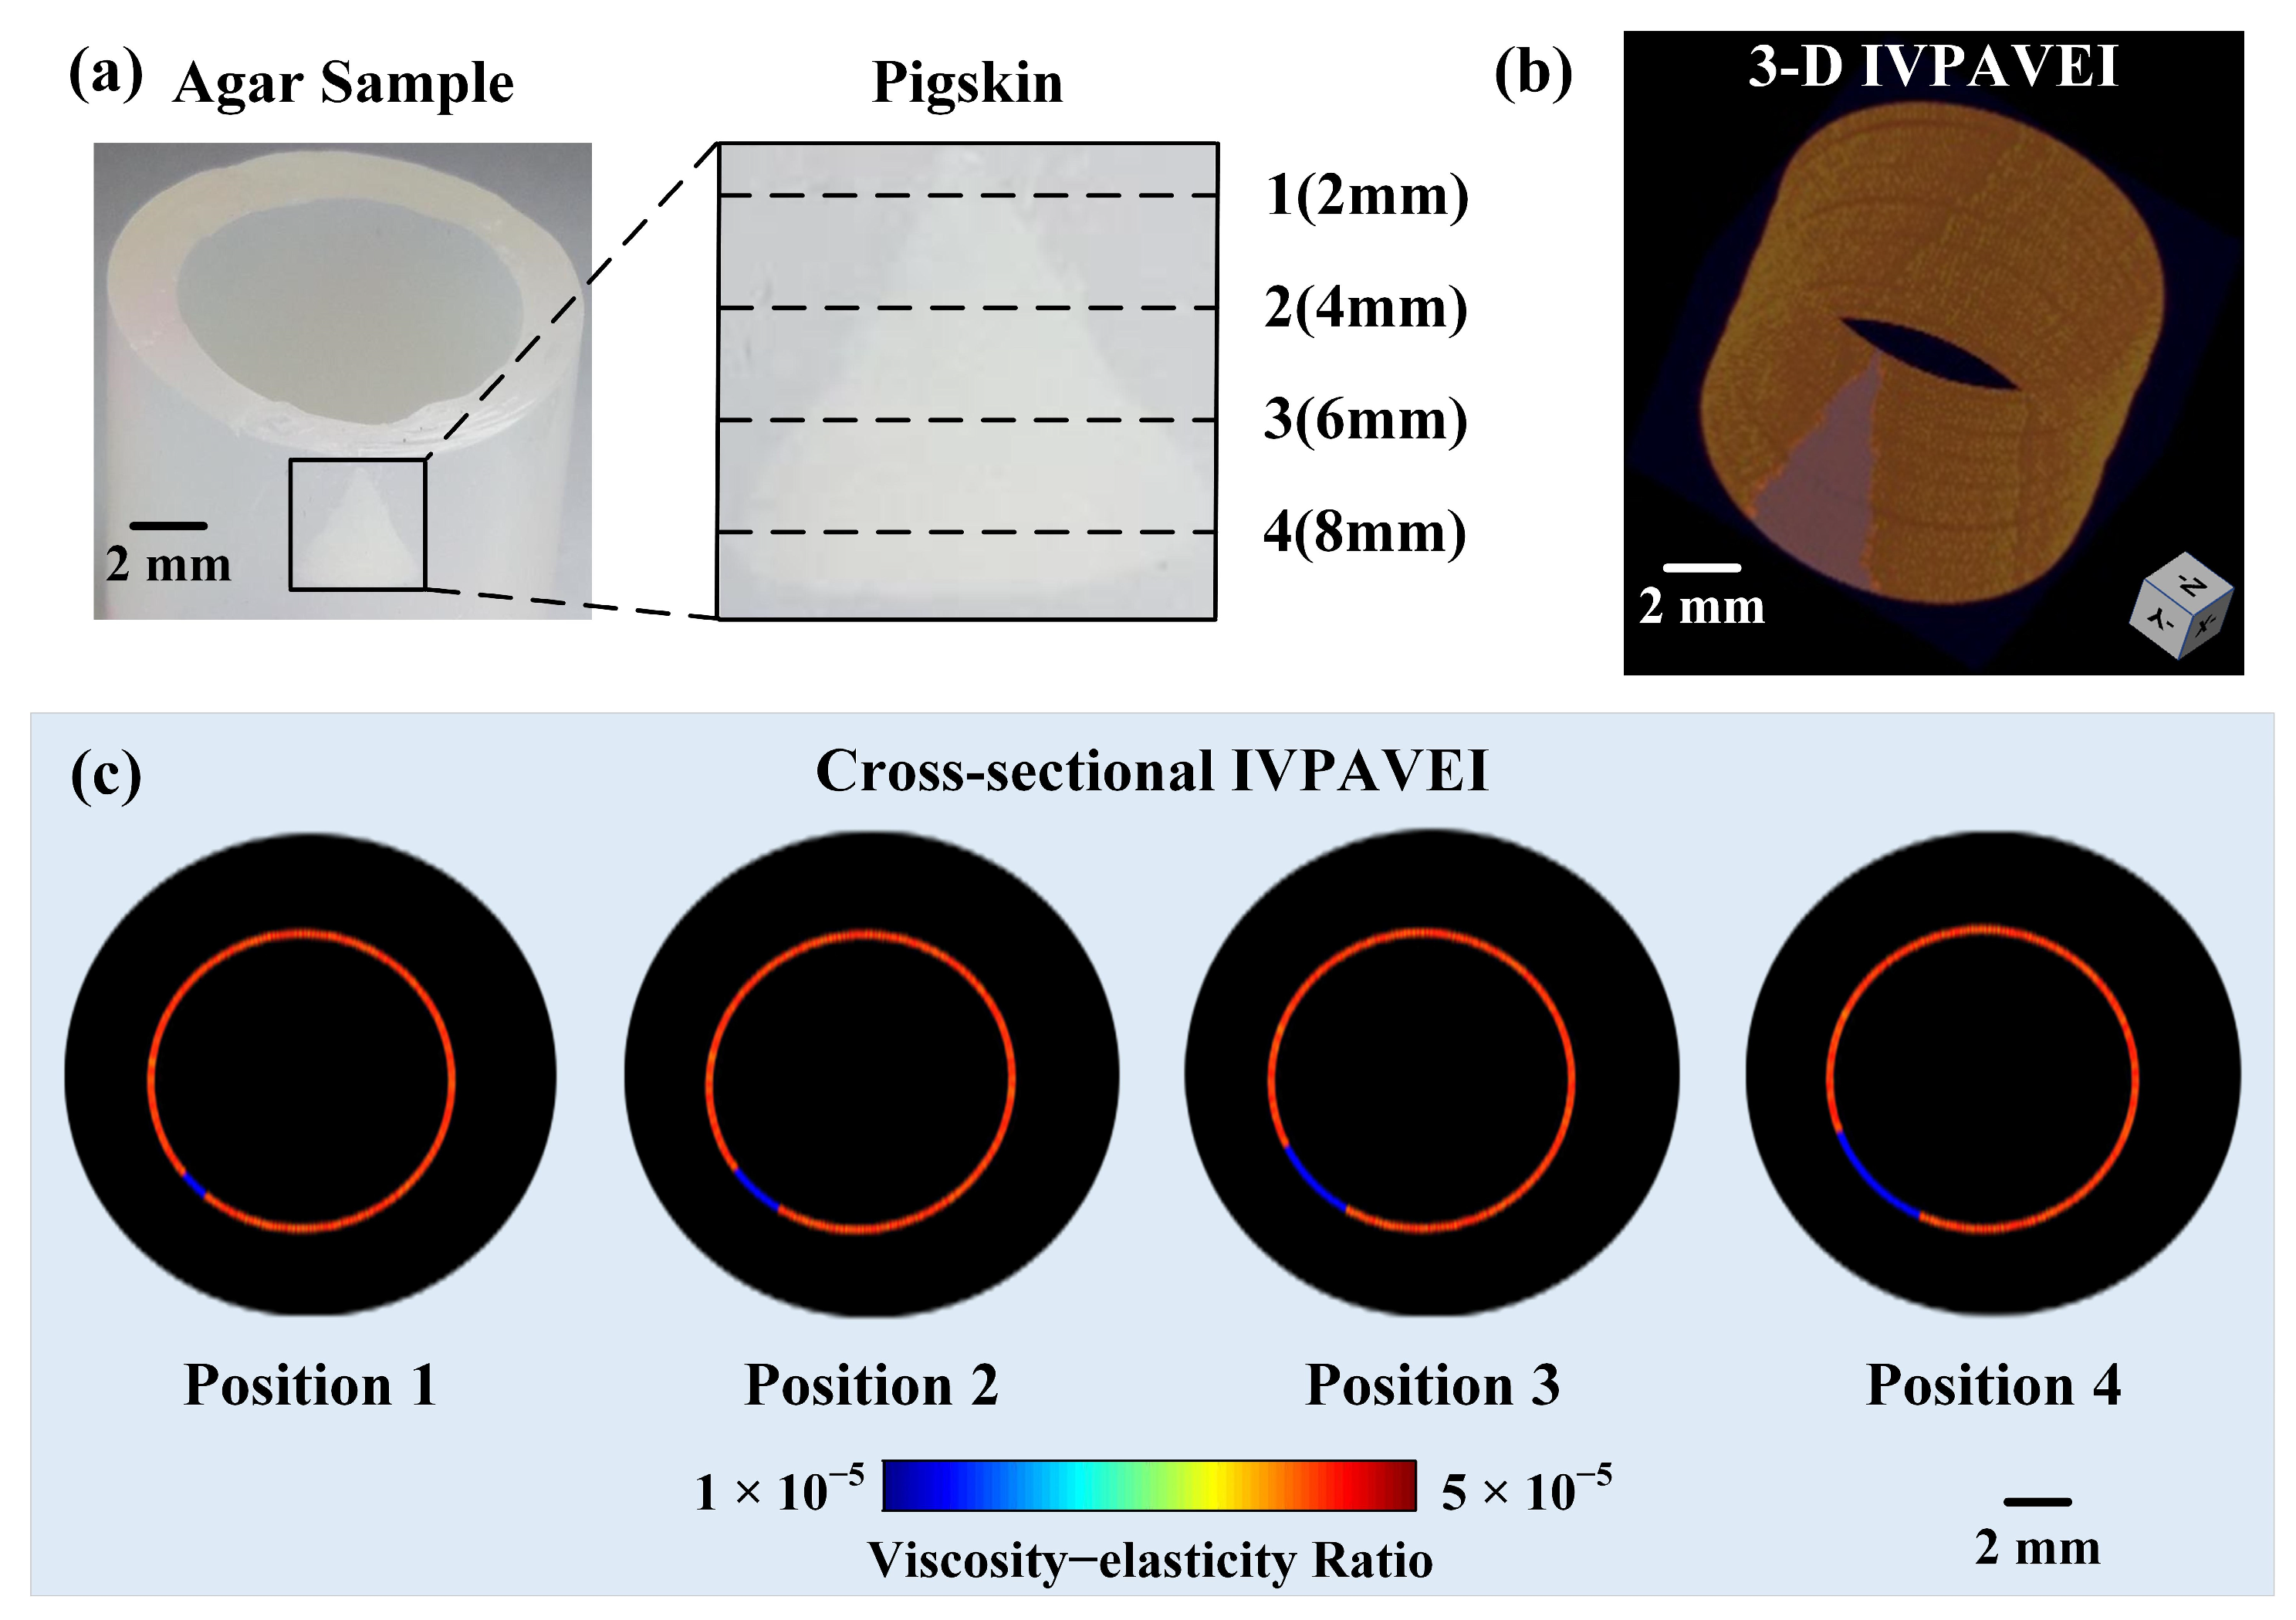
To evaluate the ability of the IVPAVEI system to resolve viscoelastic contrast in a cylindrical lumen, we performed a phantom experiment consisting of pigskin and agar (1% concentration). The structure of the phantom is illustrated in Figure 5a, in which the luminal diameter is 10 mm and the shape of the fat is triangular (height was 1 cm). In the larger picture of the fat triangle, we marked out four different positions (z = 2 mm, 4 mm, 6 mm and 8 mm). Figure 5b shows the 3D image of IVPAVEI, where the pigskin area is clearly visualized. The IVPAVEI images of the four cross-sections are shown in Figure 5c. It easily can be seen that the VER of the agar is much larger than that of the pigskin. The repeatability experiments on the pigskin–agar sample and rheometer validation results are presented in Supplementary Part S5. The quantitative phantom results confirmed that the IVPAVEI system supported endovascular imaging, providing essential technical validation for the subsequent in situ detection of rabbit aortic lesions.
Figure 5.
Simulated sample experiment. (a) Photo of pigskin–agar sample. (b) 3D IVPAVEI image of the sample in the black box. (c) Cross-sectional IVPAVEI images of the sample at four positions.
3.3. In Situ IVPAVEI of Rabbit Aortic Plaques
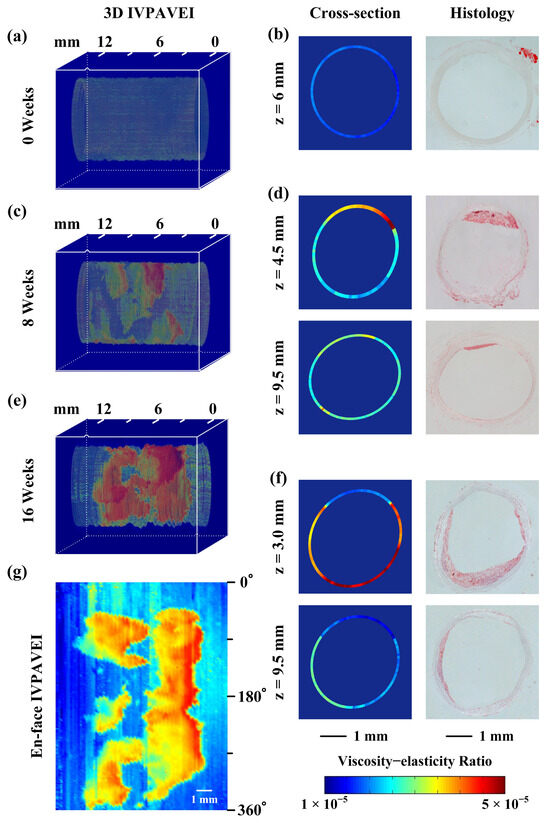
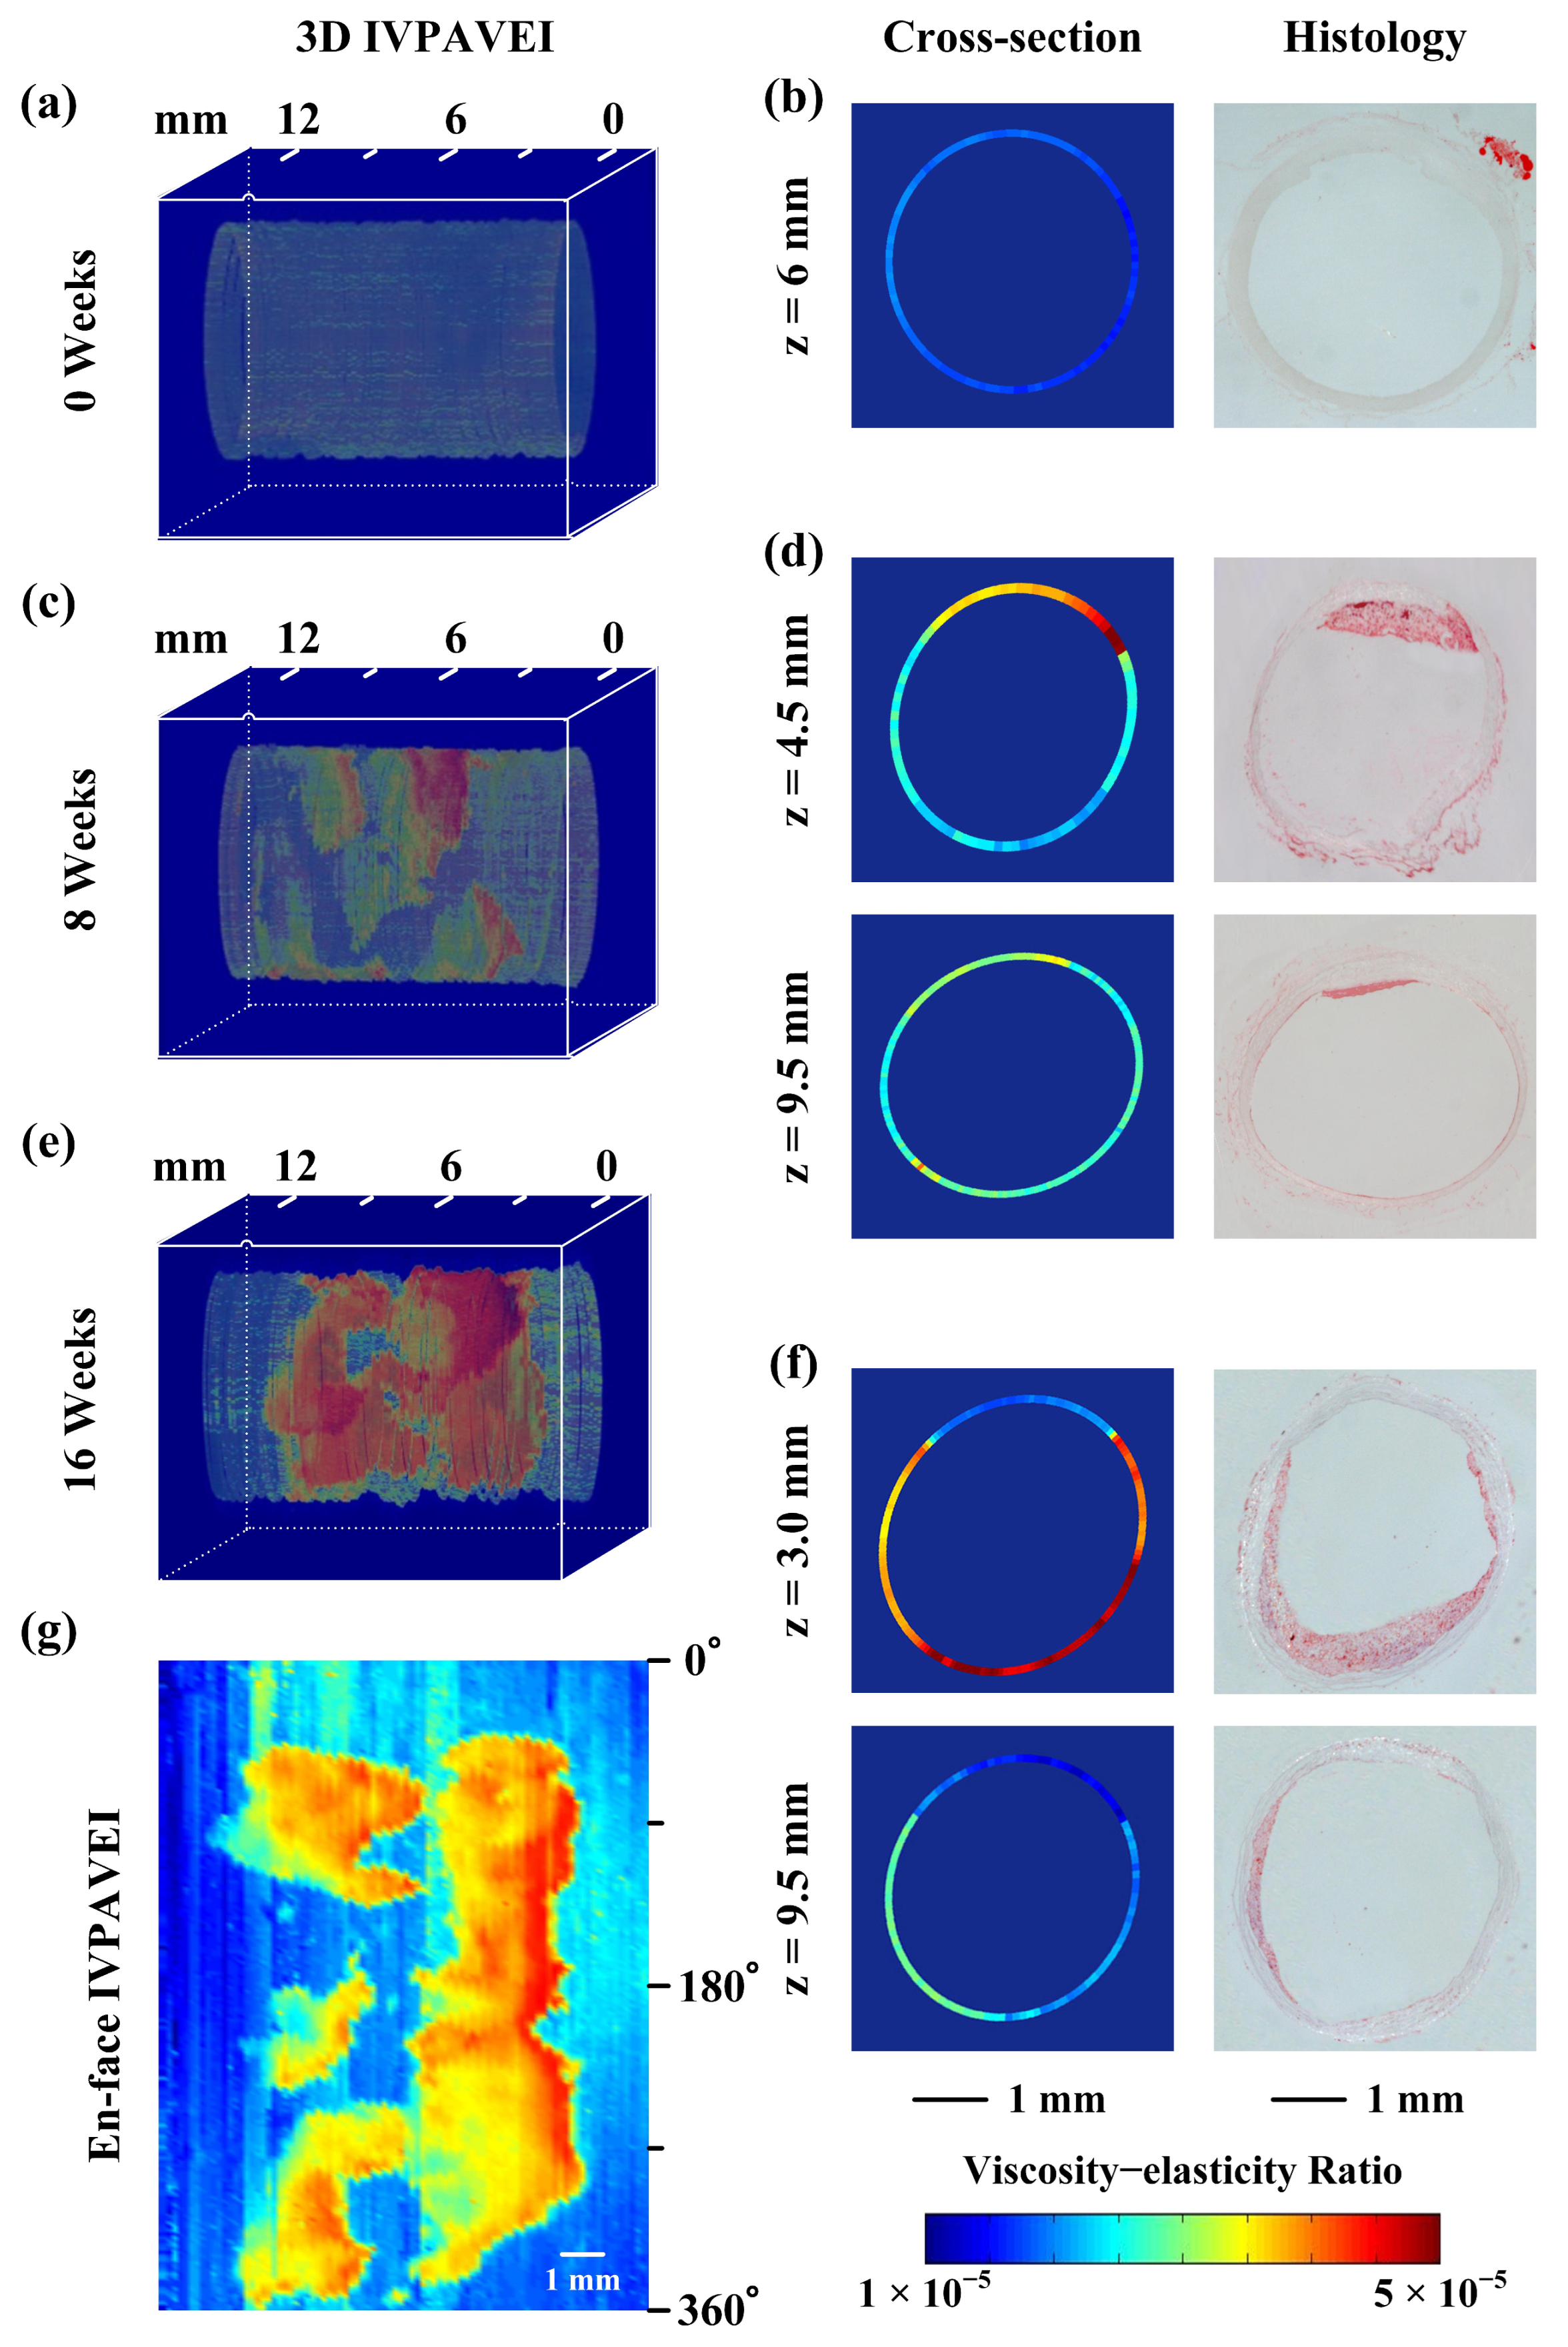
To further validate the feasibility of the IVPAVEI for biomedical applications, in situ IVPAVEI was performed on three rabbits on an HFC diet at 0, 8 and 16 weeks. Figure 6a,c,e show the 3D IVPAVEI images of the atherosclerotic aortas. The cross-sectional images at different locations demonstrated good coherency between the IVPAVEI and the histology (Oil Red O was used to stain lipids) [Figure 6b corresponds to the image of Figure 6a at z = 6 mm, Figure 6d corresponds to the image of Figure 6c at z = 4.5 mm and z = 9.5 mm, and Figure 6f corresponds to the image of Figure 6e at z = 3.0 mm and z = 9.5 mm]. Meanwhile, the lipid-rich plaques in the atherosclerotic segment suggested a significantly higher VER than that in the surrounding tissue. The VER of the plaques increased with the prolongation of the HFC diet time. Figure 6g shows the en-face IVPAVEI viewed from inside the aorta over a 360° field (16 weeks of HFC diet). In normal aortic tissues, VER fluctuations were primarily attributed to minor axial and rotational probe drifting during pullback scanning, which altered the laser incidence angle and receiving sensitivity at discrete sampling positions, causing inconsistent PA phase responses. For plaques, the jagged appearance at the lesion margins arose from a combination of limited spatial resolution, non-uniform rotational distortion, and phase errors caused by a low signal-to-noise ratio, combined with the residual smoothing effect introduced by the reconstruction algorithm. These artifacts did not affect the overall plaque characterization, as repeated measurements showed consistent edge patterns, confirming that the jagged morphology reflected system-related artifacts rather than pathological surface irregularities. In summary, in situ experiments of rabbit aortas indicated that the IVPAVEI technique had the potential for clinical detection.
Figure 6.
In situ IVPAVEI of rabbit atherosclerotic aorta. 3D IVPAVEI images of atherosclerotic aorta of rabbit fed with HFC diet for (a) 0 weeks, (c) 8 weeks and (e) 16 weeks. Cross-sectional IVPAVEI and corresponding histology (Oil Red O staining) images at the location of (b) z = 6.0 mm of (a); (d) z = 4.5 and 9.5 mm of (c), and (f) z = 3.0 and 9.5 mm of (e). (g) Corresponding en-face IVPAVEI viewed from inside the aorta over a 360° field (16 weeks of HFC diet).
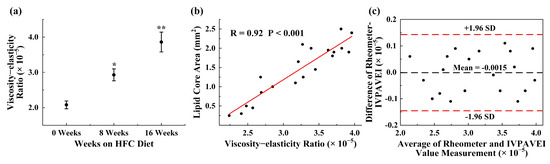
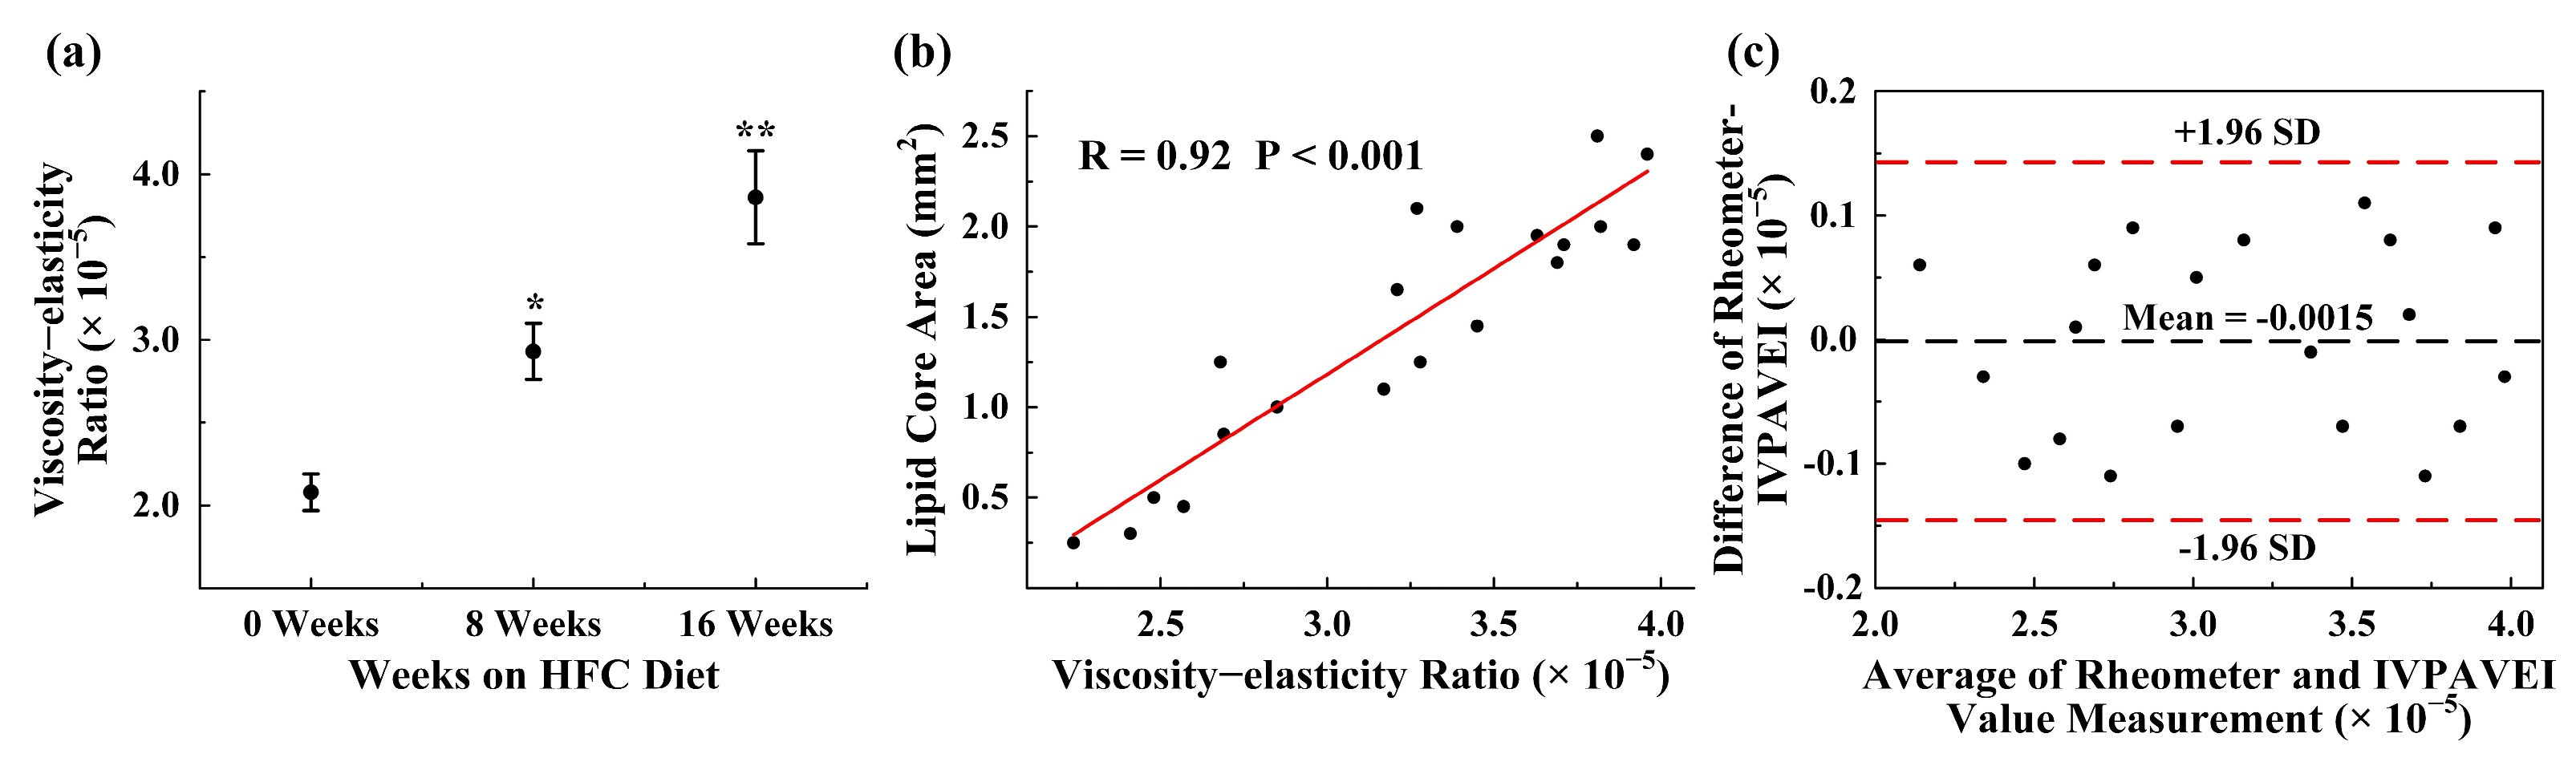
To characterize the relationship between VER and lipid core area, the VER distribution of the plaques in different periods is shown in Figure 7a. The VER in lipid plaques increased steadily; the VER for plaques after 8 and 16 weeks of an HFC diet were approximately (2.93 ± 0.17) × 10−5 and (3.86 ± 0.28) × 10−5, respectively, which were significantly higher than the VER in normal vessels [~(2.08 ± 0.11) × 10−5 at 0 weeks of the HFC diet]. The statistical significance was compared using a t-test to identify group differences, resulting in p value < 0.001. The statistical results [Figure 7b] showed that during the lipid plaque stage (8 and 16 weeks of the HFC diet), the VER value increased as the lipid core area increased (R = 0.92, p < 0.001). Figure 7c shows the results of Bland–Altman tests, which verified the excellent correlation between IVPAVEI and the rheometer for detecting the VER of atherosclerotic plaques (the specific statistical parameters are presented in Supplementary Part S6). The above results indicated that the IVPAVEI imaging system could accurately measure the VER values of plaques, thereby enabling the early identification of atherosclerotic plaques.
Figure 7.
Statistical analysis of plaques. (a) VER of plaques fed with HFC diet for different durations. * p < 0.001 for 8-week group vs 0-week group; ** p < 0.001 for 16-week group vs 8-week group. (b) High positive correlation is demonstrated between VER and lipid core area (R = 0.92, p < 0.001, n = 20). (c) Bland–Altman tests for the results between IVPAVEI and rheometer (n = 20). SD, standard deviation.
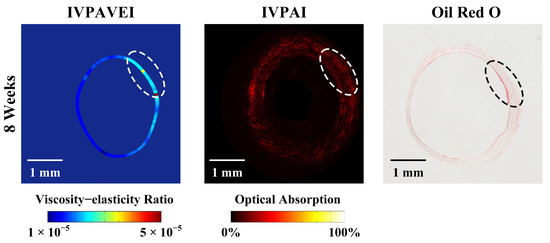
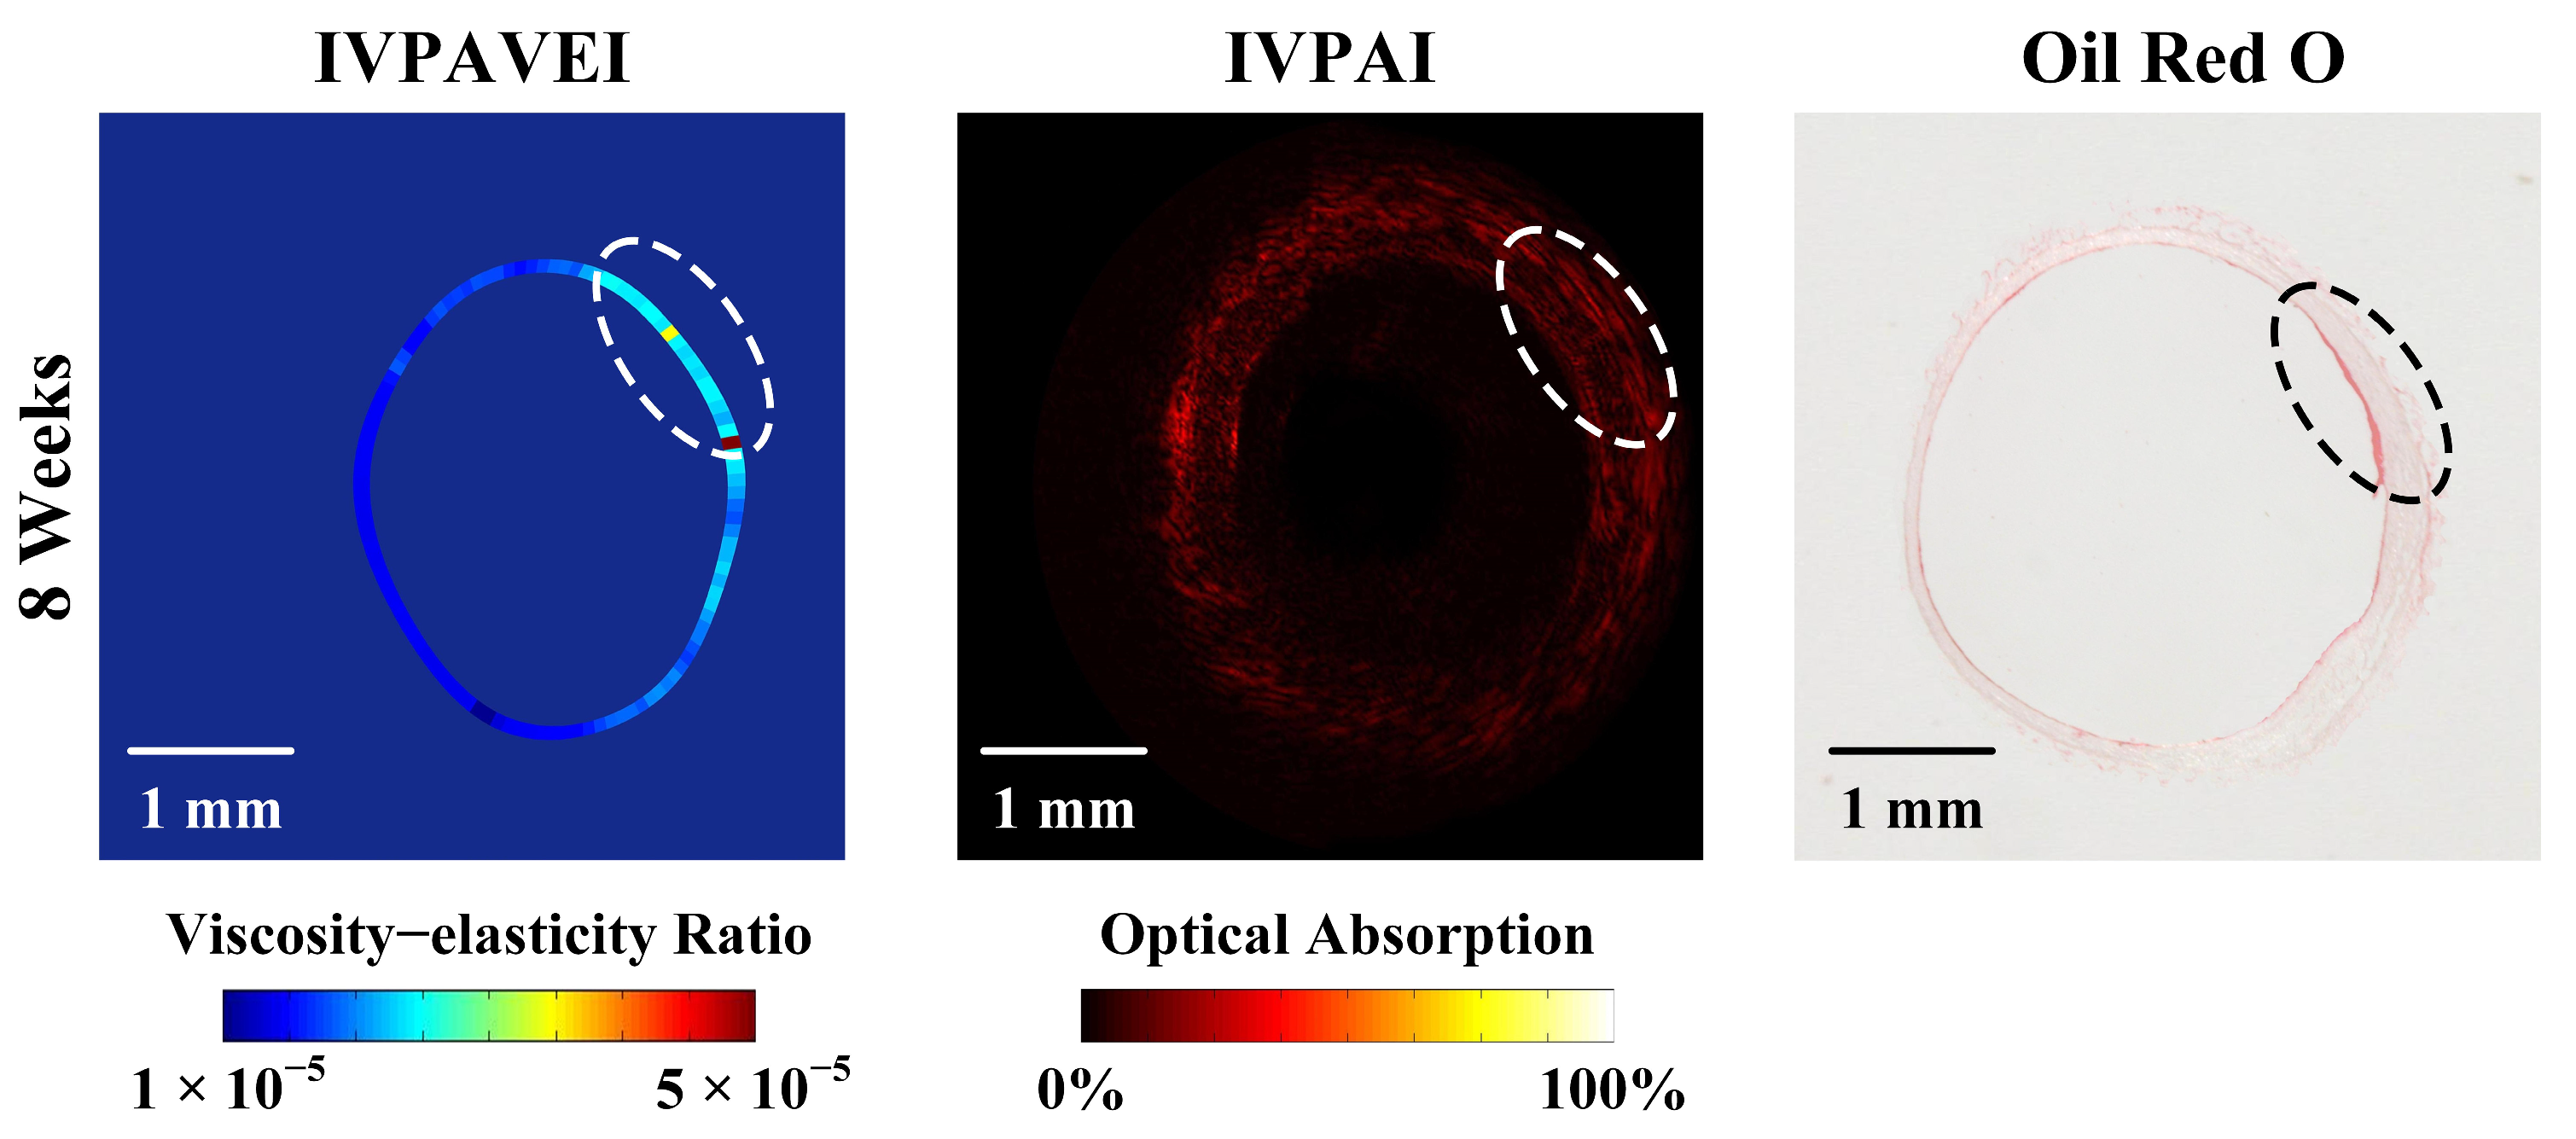
To highlight the advantages of IVPAVEI for the early detection of plaques, cross-sectional images derived from the aortas of rabbits fed an HFC diet for 8 weeks were analyzed. Corresponding intravascular PA absorption images and Oil Red O histological staining results were also provided for comparison (Figure 8). Histological verification revealed mild lipid deposition within the arterial wall, which could not be distinguished on conventional PA absorption maps (area enclosed by the dotted line). By contrast, obvious contrast differences were observable on the IVPAVEI map. This comparison demonstrated that the IVPAVEI system equipped with a 3 MHz main-frequency transducer could identify subtle early lipid lesions undetectable by standard PA absorption imaging, validating its unique superiority for the diagnosis of incipient atherosclerotic lesions.
Figure 8.
Cross-sectional IVPAVEI-IVPAI imaging of lipid plaques. IVPAI, intravascular photoacoustic absorption imaging. The dashed line indicates the region where lipids are present.
4. Discussion
In this study, we have developed an IVPAVEI system for the quantitative assessment of atherosclerotic plaques. The technique derives the VER from the phase delay of PA signals relative to the excitation laser pulse, providing a label-free, minimally invasive mechanical characterization of intraluminal tissues. The systematic diagrams are used to illustrate the hardware configuration, pathological basis, and imaging principles of this technique. Combined with resolution performance tests, agar and pigskin phantom validations, in situ imaging of rabbit abdominal aorta and quantitative statistical analysis, we have systematically validated the feasibility and stability of the proposed system for vascular lesion detection and plaque viscoelastic measurement under physiological conditions. Different from conventional intravascular PA imaging that merely relies on optical absorption contrast to provide morphological information [12], IVPAVEI focuses on tissue mechanical heterogeneity, which can serve as a complementary functional biomarker for early atherosclerosis screening and plaque progression risk. Additionally, the validation results of the rheometer demonstrate the accuracy of the IVPAVEI imaging technique for VER detection. However, it is important to acknowledge that conventional rheometers (0.1–100 Hz) and IVPAVEI (3 MHz) probe fundamentally different frequency regimes, which makes the direct comparison of VER values physically inappropriate. Nevertheless, the relative viscoelastic trends across phantoms were consistent between the two methods, and an empirical calibration curve was established (R = 0.96, p < 0.001) to enable cross-modality interpretation. The 1 Hz reference frequency was chosen for rheometer data presentation, as it corresponds to the physiological arterial pulsation rate. Importantly, the relative ranking of the VER across plaques remained unchanged across the entire 0.1–100 Hz sweep, which confirms that frequency disparity does not compromise tissue differentiation. Thus, while the VER values are not directly interchangeable, the calibration and consistent trends validate IVPAVEI for comparative viscoelastic characterization.
The core innovation of this study lies in the development of an endoscopic probe with an outer diameter of approximately 1.1 mm. Its 3 MHz ultrasonic transducer is frequency-matched to the laser repetition rate and the reference frequency of the lock-in amplifier, which facilitates the accurate extraction of phase delay information from PA signals. Under the current experimental conditions, IVPAVEI identifies distinct VER differences in early, minimally lipid-laden lesions, whereas PA absorption imaging shows no detectable response. Nevertheless, the 3 MHz transducer exhibits inherent drawbacks for conventional PA absorption imaging. Operating at a low frequency generates longer acoustic wavelengths and insufficient spatial resolution, hindering the detection of early pathological signatures such as micro lipid pools. Its narrow bandwidth severely attenuates high-frequency PA signals induced by subtle acoustic impedance mismatches between lipids, collagen and other vascular tissues, thereby deteriorating tissue contrast and blurring plaque–lumen boundaries. Accordingly, future work will focus on developing advanced ultrasonic transducers whose central frequency, bandwidth and miniaturized dimension can simultaneously satisfy the technical requirements of both intravascular PA absorption and viscoelasticity imaging. Moreover, the precise correction of acoustic-path-induced phase errors remains a limitation of the current system. Two factors render these errors non-negligible. First, the finite acoustic time of flight between the distributed tissue absorbers and the transducer produces a depth-dependent geometric phase bias that is superimposed on the measured phase. Second, this bias is comparable in magnitude to the signal of interest, because, at 3 MHz, a 1 μm change in the acoustic-path length shifts the phase by approximately 0.7°, on the order of the viscoelastic phase lag itself. Because the system operates at a single modulation frequency without independent path information, the geometric and viscoelastic phase contributions cannot be resolved. Residual errors were therefore propagated into the uncertainty bounds of the VER. Future upgrades will employ synchronously recorded pulse-echo signals to resolve the acoustic path per A-line, together with dual-frequency detection and fixed-standoff gated acquisition, which will enable pixel-wise removal of the propagation-induced phase artifact.
Another innovation of this study lies in the observation that, during the pathological progression of atherosclerotic plaques, viscosity and elasticity tend to exhibit opposite trends, and the quantitative characterization of the VER further amplifies the mechanistic insights provided by biomechanical assessment. Although the atherosclerosis model employed in this study is established in the rabbit abdominal aorta through HFC diet feeding, with a primary focus on the detection of early-stage lesions (lipid plaques), the experimental results demonstrate a strong positive correlation between VER and lipid core area (R = 0.92, p < 0.001). This finding underscores the potential of VER as a sensitive indicator of lipid accumulation. However, further investigation is warranted to extend IVPAVEI imaging and analysis to fibrous plaques, which will be essential for a more comprehensive understanding of plaque vulnerability across different pathological stages. To verify this capacity for advanced lesion identification in subsequent investigations, rabbits subjected to balloon-induced endothelial denudation combined with 16–24 weeks of HFC feeding can be used to generate fibrous and vulnerable aortic lesions [27].
In addition, we need to address the following issues to advance the clinical implementation of IVPAVEI. Firstly, the VER values are computed over the entire PA signals and the reference signals in the lock-in detector. As a result, the effect of viscoelasticity is integrated over the illuminated volume in the atherosclerotic plaque, and depth-resolved spatial information is lost. To overcome this problem, an electrically tunable lens will be used in the future to realize a fast variable-focus IVPAVEI with a large range of imaging depth, which may make it possible to obtain depth information about plaque VER distributions. In addition, optical coherence tomography can also be used to achieve the depth resolution of the PA’s mechanical response [28]. Secondly, comprehensive optimization strategies, including adaptive regularization reconstruction and sub-pixel interpolation, will be adopted to eliminate jagged image distortions and realize precise plaque boundary identification [29]. Finally, the present results serve as proof-of-concept evidence for the feasibility of IVPAVEI in identifying viscoelastic changes within early lipid-rich plaques, rather than conclusive clinical validation. Larger-cohort investigations are needed to verify the reproducibility of these findings and define quantitative diagnostic thresholds. In addition to cohort expansion, large-animal validation and pilot clinical trials will be implemented to refine the probe configuration, scanning schemes and post-processing pipelines, as well as to establish standardized clinical metrics for plaque viscoelasticity evaluation.
5. Conclusions
We have developed an IVPAVEI system for the quantitative mechanical characterization of atherosclerotic plaques. This technique derives the VER from the phase delay between the PA signal and the excitation laser pulse and integrates a miniaturized 1.1 mm diameter probe suitable for intracoronary application. Phantom and in situ rabbit experiments have validated the feasibility of the system for detecting early-stage lipid plaques, revealing a strong positive correlation between VER and lipid core area. Collectively, these findings indicate that IVPAVEI provides mechanical characterization as a complementary functional biomarker and holds promise for the early detection of atherosclerotic plaques and improved lesion diagnostic accuracy.
Supplementary Materials
The following supporting information can be downloaded at https://www.mdpi.com/article/10.3390/photonics13090887/s1, Part S1: The principle of intravascular photoacoustic viscoelasticity imaging (IVPAVEI); Part S2: Simulated sample experiment (Figure S1. Simulated sample experiment); Part S3: System calibration workflow (Table S1. System baseline phase measurement, Table S2. Piezoelectric pulse-echo phase offset measurement, and Table S3. Lock-in amplifier phase error measurement); Part S4: Rheometer measurement details [Table S4. Rheometer (Anton Paar MCR 302e) Test Parameters and Instructions]; Part S5: Quantitative analysis of IVPAVEI and rheometer measurements for pigskin and agar samples (Table S5. Quantitative VER analysis (× 10−5) of pigskin using IVPAVEI and rheometer, and Table S6. Quantitative VER analysis (× 10−5) of agar sample using IVPAVEI and rheometer); Part S6: Complete Bland–Altman analysis (Table S7. Results of the Bland−Altman analysis). References [14,30,31,32,33,34,35,36,37,38,39,40] are cited in the Supplementary Materials.
Author Contributions
Conceptualization, X.T. and P.W.; methodology, X.T.; software, H.Z.; validation, H.Z. and P.W.; formal analysis, X.T.; investigation, X.T. and H.Z.; resources, H.Z. and P.W.; data curation, X.T.; writing—original draft preparation, X.T.; writing—review and editing, X.T. and P.W.; visualization, X.T. and H.Z.; supervision, H.Z. and P.W.; project administration, P.W.; funding acquisition, P.W. All authors have read and agreed to the published version of the manuscript.
Funding
This research was supported by grants from the Zhejiang Provincial Natural Science Foundation of China (No. LTGY24H180011) and the Shaoxing Science and Technology Plan Project (No. 2023A14003).
Institutional Review Board Statement
The animal study protocol was approved by the Animal Study Committee of South China Normal University College of Biophotonics in Guangdong, China.
Informed Consent Statement
Not applicable.
Data Availability Statement
All data needed to evaluate the conclusions are presented in the paper. Raw data that support the findings of this study are available from the corresponding author upon reasonable request.
Conflicts of Interest
The authors declare no conflicts of interest.
Abbreviations
The following abbreviations are used in this manuscript:
| PA | photoacoustic |
| IVPAVEI | intravascular photoacoustic viscoelasticity imaging |
| VER | viscosity–elasticity ratio |
| 3D | three-dimensional |
| CV | coefficient of variation |
References
- Kawai, K.; Kawakami, R.; Finn, A.V.; Virmani, R. Differences in stable and unstable atherosclerotic plaque. Arterioscler. Thromb. Vasc. Biol. 2024, 44, 1474–1484. [Google Scholar] [CrossRef] [Scilit] [PubMed]
- Gianopoulos, I.; Daskalopoulou, S.S. Macrophage profiling in atherosclerosis: Understanding the unstable plaque. Basic. Res. Cardiol. 2024, 119, 35–56. [Google Scholar] [CrossRef] [Scilit] [PubMed]
- Spagnolo, M.; Giacoppo, D.; Laudani, C.; Greco, A.; Finocchiaro, S.; Mauro, M.S.; Imbesi, A.; Capodanno, D. Advances in the detection and management of vulnerable coronary plaques. Circ. Cardiovasc. Interv. 2025, 18, e015529. [Google Scholar] [CrossRef] [Scilit] [PubMed]
- Fang, F.; Wang, E.X.; Fang, M.J.; Yue, H.Y.; Yang, H.Q.; Liu, X.H. Macrophage-based pathogenesis and theranostics of vulnerable plaques. Theranostics 2025, 15, 1570–1588. [Google Scholar] [CrossRef] [Scilit] [PubMed]
- Alsaigh, T.; Evans, D.; Frankel, D.; Torkamani, A. Decoding the transcriptome of calcified atherosclerotic plaque at single-cell resolution. Commun. Biol. 2022, 5, 1084. [Google Scholar] [CrossRef] [Scilit] [PubMed]
- Jansen, I.; Cahalane, R.; Hengst, R.; Akyildiz, A.; Farrell, E.; Gijsen, F.; Aikawa, E.; van der Heiden, K.; Wissing, T. The interplay of collagen, macrophages, and microcalcification in atherosclerotic plaque cap rupture mechanics. Basic. Res. Cardiol. 2024, 119, 193–213. [Google Scholar] [CrossRef] [Scilit] [PubMed]
- Vergallo, R.; Park, S.J.; Stone, G.W.; Erlinge, D.; Porto, I.; Waksman, R.; Mintz, G.S.; D’Ascenzo, F.; Seitun, S.; Saba, L.; et al. Vulnerable or high-risk plaque: A JACC: Cardiovascular imaging position statement. JACC Cardiovasc. Imaging 2025, 18, 709–740. [Google Scholar] [CrossRef] [Scilit] [PubMed]
- Wang, Y.; Ning, J.; Johnson, J.A.; Sutton, M.A.; Lessner, S.M. Development of a quantitative mechanical test of atherosclerotic plaque stability. J. Biomech. 2011, 44, 2439–2445. [Google Scholar] [CrossRef] [Scilit] [PubMed]
- Li, C.; Deng, C.; Shi, B.; Zhao, R. Thin-cap fibroatheroma in acute coronary syndrome: Implication for intravascular imaging assessment. Int. J. Cardiol. 2024, 405, 131965. [Google Scholar] [CrossRef] [Scilit] [PubMed]
- Gruslova, A.B.; Singh, S.; Hoyt, T.; Vela, D.; Vengrenyuk, Y.; Buja, L.M.; Litovsky, S.; Michalek, J.; Maehara, A.; Kini, A.; et al. Accuracy of OCT core labs in identifying vulnerable plaque. JACC Cardiovasc. Imaging 2024, 17, 448–450. [Google Scholar] [CrossRef] [Scilit] [PubMed]
- Adriaenssens, T.; Allard-Ratick, M.P.; Thondapu, V.; Sugiyama, T.; Raffel, O.C.; Barlis, P.; Poon, E.K.W.; Araki, M.; Nakajima, A.; Minami, Y.; et al. Optical coherence tomography of coronary plaque progression and destabilization: JACC focus seminar part 3/3. J. Am. Coll. Cardiol. 2021, 78, 1275–1287. [Google Scholar] [CrossRef] [Scilit] [PubMed]
- Dijk, K.V.; Vries, M.R.D. Breaking (light) barriers: Photoacoustics in atherosclerotic diseases. J. Cell. Mol. Med. 2025, 29, e70933. [Google Scholar] [CrossRef] [Scilit] [PubMed]
- Curcio, N.; Conti, M.; Cardani, R.; Renna, L.V.; Dell’Antonio, G.; Bari, V.; Nano, G.; Matrone, G.; Mazzaccaro, D. Biomechanical assessment of vulnerable plaque: From histological evidence to ultrasound elastography and image-based computational patient-specific modelling. Front. Bioeng. Biotechnol. 2025, 13, 1478408. [Google Scholar] [CrossRef] [Scilit] [PubMed]
- Gao, G.; Yang, S.; Xing, D. Viscoelasticity imaging of biological tissues with phase-resolved photoacoustic measurement. Opt. Lett. 2011, 36, 3341–3343. [Google Scholar] [CrossRef] [Scilit] [PubMed]
- Zhao, Y.; Yang, S.; Chen, C.; Xing, D. Simultaneous optical absorption and viscoelasticity imaging based on photoacoustic lock-in measurement. Opt. Lett. 2014, 39, 2565–2568. [Google Scholar] [CrossRef] [Scilit] [PubMed]
- Pitros, C.F.; Manaki, V.; Kakisis, J.D.; Kakkos, S.K. The role of shear wave elastography in the assessment of carotid plaque vulnerability: A systematic review and meta-analysis. Int. Angiol. 2025, 44, 415–425. [Google Scholar] [CrossRef] [Scilit] [PubMed]
- Zhang, X.; Shi, X.; Wu, H.; Bai, C.; Xiu, J.; Zhao, Y. Mechanical assessment in atherosclerosis based on photoacoustic viscoelasticity imaging. Photonics 2024, 11, 471. [Google Scholar] [CrossRef] [Scilit]
- Wang, P.; Chen, Z.; Xing, D. Multi-parameter characterization of atherosclerotic plaques based on optical coherence tomography, photoacoustic and viscoelasticity imaging. Opt. Express 2020, 28, 13761–13774. [Google Scholar] [CrossRef] [Scilit] [PubMed]
- Chang, Z.; Zhou, Y.; Dong, L.; Qiao, L.R.; Yang, H.; Xu, G.K. Deciphering the complex mechanics of atherosclerotic plaques: A hybrid hierarchical theory-microrheology approach. Acta Biomater. 2024, 189, 399–412. [Google Scholar] [CrossRef] [Scilit] [PubMed]
- Lv, R.; Wang, L.; Maehara, A.; Guo, X.; Zheng, J.; Samady, H.; Giddens, D.P.; Mintz, G.S.; Stone, G.W.; Tang, D. Image-based biomechanical modeling for coronary atherosclerotic plaque progression and vulnerability prediction. Int. J. Cardiol. 2022, 352, 1–8. [Google Scholar] [CrossRef] [Scilit] [PubMed]
- Xie, J.; Wu, S.; Li, J.; Zhang, Q.; Li, S.; Chen, D.; Zheng, B.; Song, L.; Fang, F. Miniaturized fiber-end probe for laser speckle rheology of atherosclerotic plaque. ACS Appl. Mater. Interfaces 2025, 17, 55923–55931. [Google Scholar] [CrossRef] [Scilit] [PubMed]
- Zhou, Y.; Song, Y.; Liu, Z.; Li, W.; Guo, Y.; Matkovic, L.A.; Yang, X.; Ma, R.; Wan, M.; Ruan, L.; et al. The viscoelastic characteristics of in-vitro carotid plaque by Kelvin-Voigt fractional derivative modeling. J. Biomech. 2022, 141, 111210. [Google Scholar] [CrossRef] [Scilit] [PubMed]
- Savvopoulos, F.; Keeling, M.C.; Carassiti, D.; Fogell, N.A.; Patel, M.B.; Naser, J.; Gavara, N.; de Silva, R.; Krams, R. Assessment of the nano-mechanical properties of healthy and atherosclerotic coronary arteries by atomic force microscopy. J. R. Soc. Interface 2024, 21, 20230674. [Google Scholar] [CrossRef] [Scilit] [PubMed]
- Zhang, X.; Feng, H.; Han, Y.; Yuan, X.; Jiang, M.; Wang, W.; Gao, L. Plaque stabilization and regression, from mechanisms to surveillance and clinical strategies. Rev. Cardiovasc. Med. 2024, 25, 459. [Google Scholar] [CrossRef] [Scilit] [PubMed]
- Petschke, A.; La Rivière, P.J. Comparison of intensity-modulated continuous-wave lasers with a chirped modulation frequency to pulsed lasers for photoacoustic imaging applications. Biomed. Opt. Express 2010, 1, 1188–1195. [Google Scholar] [CrossRef] [Scilit] [PubMed]
- Zhang, Y.; Olick-Gibson, J.; Khadria, A.; Wang, L.V. Photoacoustic vector tomography for deep haemodynamic imaging. Nat. Biomed. Eng. 2024, 8, 701–711. [Google Scholar] [CrossRef] [Scilit] [PubMed]
- Li, T.T.; Chen, W.Q.; An, F.S.; Tian, H.B.; Zhang, J.N.; Peng, J.; Zhang, Y.; Guo, Y. Probucol attenuates inflammation and increases stability of vulnerable atherosclerotic plaques in rabbits. Tohoku J. Exp. Med. 2011, 225, 23–34. [Google Scholar] [CrossRef] [Scilit] [PubMed]
- Yang, F.; Ding, W.; Fu, X.; Chen, W.; Tang, J. Photoacoustic elasto-viscography and optical coherence microscopy for multi-parametric ex vivo brain imaging. Biomed. Opt. Express 2023, 14, 5615–5628. [Google Scholar] [CrossRef] [Scilit] [PubMed]
- Yu, L.; Zhang, X.; Chu, Y. Super-resolution reconstruction algorithm for infrared image with double regular items based on sub-pixel convolution. Appl. Sci. 2020, 10, 1109. [Google Scholar] [CrossRef] [Scilit]
- Barbora, A.; Bohar, O.; Sivan, A.A.; Magory, E.; Nause, A.; Minnes, R. Higher pulse frequency of near-infrared laser irradiation increases penetration depth for novel biomedical applications. PLoS ONE 2021, 16, e0245350. [Google Scholar] [CrossRef] [Scilit] [PubMed]
- Lian, X.; Ruddock, J.M.; Diebold, G.J. Photoacoustic transients generated by laser irradiation of thin films. Photoacoustics 2015, 3, 60–63. [Google Scholar] [CrossRef] [Scilit] [PubMed]
- Yang, F.; Chen, Z.J.; Wang, P.P.; Shi, Y.J. Phase-domain photoacoustic mechanical imaging for quantitative elastography and viscography. IEEE. Trans. Biomed. Eng. 2024, 71, 2330–2340. [Google Scholar] [CrossRef] [Scilit] [PubMed]
- Maslov, K.; Wang, L.V. Photoacoustic imaging of biological tissue with intensity-modulated continuous-wave laser. J. Biomed. Opt. 2008, 13, 024006. [Google Scholar] [CrossRef] [Scilit] [PubMed]
- Marceau, C.; Gingras, G.; Thomas, S.; Kassimi, Y.; Witzel, B. Energy-phase coupling inside sapphire-based f-2f nonlinear interferometers from 800 to 1940 nm. Appl. Opt. 2014, 53, 898–901. [Google Scholar] [CrossRef] [Scilit] [PubMed]
- Xu, Y.; Wu, S.; Zheng, W. Laser energy deposition and its dynamic uniformity for direct-drive capsules. Phys. Plasmas 2015, 22, 225. [Google Scholar] [CrossRef] [Scilit]
- Wang, P.; Ma, T.; Slipchenko, M.N.; Liang, S.S.; Hui, J.; Shung, K.K.; Roy, S.; Sturek, M.; Zhou, Q.F.; Chen, Z.P.; et al. High-speed intravascular photoacoustic imaging of lipid-laden atherosclerotic plaque enabled by a 2-kHz barium nitrite raman laser. Sci. Rep. 2014, 4, 6889. [Google Scholar] [CrossRef] [Scilit] [PubMed]
- Choi, W.Y.; Kim, Y.H.; Jo, H.G.; Pyun, J.Y.; Kwon, S.W.; Park, K.K. Single-shot waterless low-profile photoacoustic system: Near-field volumetric imaging in vivo for blood vessels based on capacitive micromachined ultrasonic transducer (CMUT). Sensors 2019, 19, 995. [Google Scholar] [CrossRef] [Scilit] [PubMed]
- Osman, M.S.; Chen, H.Y.; Creamer, K.; Minotto, J.; Liu, J.Y.; Mirg, S.; Christian, J.; Bai, X.L.; Agrawal, S.; Kothapalli, S.R. A novel matching layer design for improving the performance of transparent ultrasound transducers. IEEE. Trans. Ultrason. Ferroelectr. Freq. Control. 2022, 69, 2672–2680. [Google Scholar] [CrossRef] [Scilit] [PubMed]
- Lee, T.; Li, Q.C.; Guo, L.J. Out-coupling of longitudinal photoacoustic pulses by mitigating the phase cancellation. Sci. Rep. 2016, 6, 21511. [Google Scholar] [CrossRef] [Scilit] [PubMed]
- Lee, R.T.; Grodzinsky, A.J.; Frank, E.H.; Kamm, R.D.; Schoen, F.J. Structure-dependent dynamic mechanical behavior of fibrous caps from human atherosclerotic plaques. Circulation 1991, 83, 1764–1770. [Google Scholar] [CrossRef] [Scilit] [PubMed]
Disclaimer/Publisher’s Note: The statements, opinions and data contained in all publications are solely those of the individual author(s) and contributor(s) and not of MDPI and/or the editor(s). MDPI and/or the editor(s) disclaim responsibility for any injury to people or property resulting from any ideas, methods, instructions or products referred to in the content. |
© 2026 by the authors. Licensee MDPI, Basel, Switzerland. This article is an open access article distributed under the terms and conditions of the Creative Commons Attribution (CC BY) license.