


Abstract
Raman–Nath diffraction is produced by a thin acoustic beam. The standing sound wave acts as a thin phase grating, causing monochromatic light to interact with it and diffract into multiple orders. This phenomenon is typically used to redistribute light intensity at specific angles. The correspondence relationship applies to the spatial distribution of monochromatic light and transforms it into a spectral distribution of polychromatic light. This demonstrates that angular diffraction orders in the spatial domain correspond to wavelength orders in the spectral domain. Numerical results show that the amplitude of various spectral orders can be controlled by adjusting acoustic wave intensity. This property is proposed for use in achieving ternary digital data transmission.
1. Introduction
Spectral variance during propagation was first investigated by Wolf [1], who proposed a scaling law stating that spectral variations occur unless the degree of spectral coherence of the source satisfies this law [2]. Subsequently, other mechanisms leading to spectral changes have been suggested and experimentally verified [3,4,5]. Additionally, many related topics and applications have been proposed, such as singular optics [6] and spectral anomalies [7]. It is noteworthy that other properties of light, such as coherence and polarization, also vary after propagation or interaction with materials [8,9]. Among these findings, an important relation called the spatial–spectral correspondence relationship was introduced by one of the authors, Han [10]. This relation connects features of light waves between monochromatic and polychromatic light. The key concept is that the spatial intensity distribution of monochromatic light has a form similar to its spectral distribution under the same conditions. Since its proposal, this relation has been widely utilized, and many valuable results have been suggested and verified, including lattice spectroscopy [11], Fresnel zone spectra [12], spectral switches (SSW) [13,14], and optical rulers [15], among others.
It is well known that acousto-optic devices can be used as spatial switches for monochromatic light [16] or as spectral filters/analyzers for polychromatic light, for example, utilizing acousto-optic tunable filter (AOTF) effects in spectral imaging systems [17]. In this study, the aforementioned correspondence relation is employed to theoretically investigate Raman–Nath diffraction for polychromatic light. By carefully considering material dispersion and applying this relationship, a comprehensive model for polychromatic acoustic diffraction is derived. The numerical results demonstrate that different spectral diffraction orders can be observed, and the amplitudes of the spectral peaks can be partially controlled by adjusting the acoustic beam intensity. Leveraging this property, a ternary digital data transmission scheme is proposed. These findings thus broaden the potential applications of acousto-optic systems operating in the Raman–Nath regime. Note that below we use a scalar model to describe the acoustic and optical waves, which is appropriate for isotropic materials. For anisotropic materials, the vibration modes of sound (longitudinal or transverse) and the polarization of light must be taken into account [16,18].
2. Theory
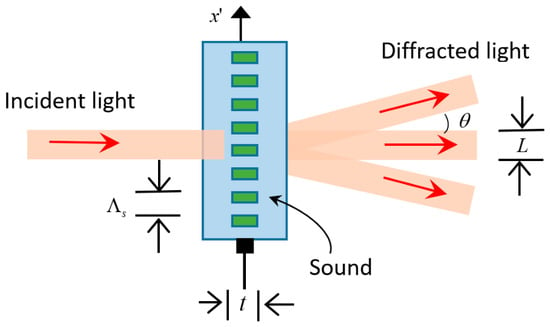
Acousto-optics describes the interaction between light and sound. The presence of sound alters the refractive index of an optical medium. Thus, a sound wave modifies the effect of the medium on light, a phenomenon known as the acousto-optic effect. Many devices utilize this effect, including optical modulators, switches, deflectors, and isolators. It is known that a thin standing acoustic beam can act as a diffraction phase grating [16], as shown in Figure 1. When a light beam impinges perpendicularly upon it, it is diffracted into multiple angular orders, a phenomenon called Raman–Nath diffraction, also illustrated in Figure 1. A harmonic plane sound wave travels through a medium, causing regions of compression and rarefaction, indicated by the green stripes in the figure. In regions where the medium is compressed, the density and refractive index increase; they decrease where the medium is rarefied. An acoustic wave creates a perturbation in the refractive index in the form of a wave, making the medium a dynamic graded-index medium. However, because optical frequencies are much higher than acoustic frequencies, it is possible to use an adiabatic approach, in which the optical propagation problem is solved at every instant of time during the relatively slow course of the acoustic cycle, treating the material as if it were a static, inhomogeneous medium.
Figure 1.
A thin acoustic beam functions as a diffraction grating.
Consider a sinusoidal acoustic plane wave with amplitude S0 traveling in the -direction through a medium with velocity , frequency , and wavelength , as shown in Figure 1. Here, the subscript s denotes all parameters associated with the sound wave. The acoustic intensity Is is
where is the mass density of the medium. The medium is assumed to be optically transparent, with a refractive index n in the absence of sound. The strain from the sinusoidal sound wave induces a perturbation in the refractive index as
where p is a phenomenological dimensionless coefficient known as the photoelastic constant. Using the relationship between and in Equation (2), can be expressed in a more compact form as
The quantity M is a merit figure for the strength of the acousto-optic effect in the material. Consequently, the medium acts as a phase grating with an inhomogeneous refractive index.
3. Numerical Results
3.1. Monochromatic Light Situation
As mentioned above, a thin, standing acoustic beam can act as a diffraction phase grating with the following phase variation distribution:
where is the wave-number, is the wavelength of light in a vacuum, and t is the thickness of the grating, as shown in Figure 1. Thus, for monochromatic light with wavelength and neglecting a constant phase term in relation to the constant refractive index in the absence of a sound wave, the transmittance function can be written as:
where is a parameter collection. Here, is the imaginary unit, and L is the width of the grating used by the light beam, as indicated in Figure 1. The function is a rectangle function defined as for and for . The Jacobi–Anger identity can be used to expand as
where , and is the Bessel function of the first kind and of the mth order. Using the Fraunhofer approximation, the far-field diffraction of the light field is
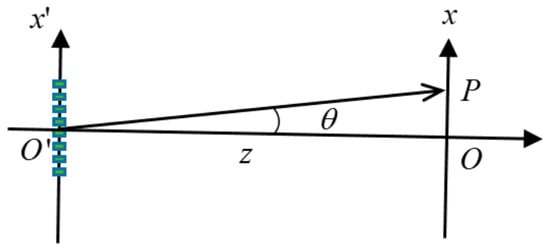
where is the Fourier transform of the transmittance function, with a spatial frequency of , using the approximation ~x/z. The sinc(x) function in Equation (7) is defined as sin(x)/x, which is the Fourier transform of a rectangle function. As shown in Figure 2, z is the distance between the acoustic grating plane and the detection plane, and θ is the angle formed between the line and the horizontal axis for a point P on the x-axis. Without loss of generality, only the x-dimension is considered.
Figure 2.
The geometry and coordinate systems used to calculate Raman–Nath diffraction.
Finally, the monochromatic diffraction intensity, given by , is
In deriving Equation (8), it is assumed that the aperture L contains many periods of phase grating, so the overlap between different diffracted orders is negligible.
It should be noted that Equation (8) applies to monochromatic light. This means we first pick a wavelength, say , and then measure the -angle dependence of the diffracted beam, i.e., . Thus, the first term in the parentheses is a variable, while the second term is a fixed parameter. Later, we will use the spatial–spatial correspondence relation to derive the spectral distribution for polychromatic light, where the interpretation will differ. Using the condition in Equation (8) yields the angles corresponding to the peaks of different orders as
A practical example helps to illustrate this concept. Using flint glass (Schott NSF-66) as the isotropic material, with a refractive index of n = 1.86 at a wavelength of μm, the other parameters are as follows: = 1.0 GHz, z = 10 cm, and .
Before beginning our numerical illustration, two conditions must be verified: that the system operates within the Raman–Nath diffraction regime and that it satisfies the far-field (Fraunhofer) condition. The first condition is checked by calculating the Klein–Cook parameter , definedas [19]. If , the acoustic beam can be treated as a thin grating, and Raman–Nath diffraction is observed. Substituting the given parameters into the definition of , we find = 1.6, which meets the requirement for the thin grating approximation.
The second far-field condition is verified by calculating the far-field factor given by the inequality [20]. Since can be at most 1, substituting all parameters into the left side of the inequality yields a value of 0.011, which satisfies the requirement of being much less than one.
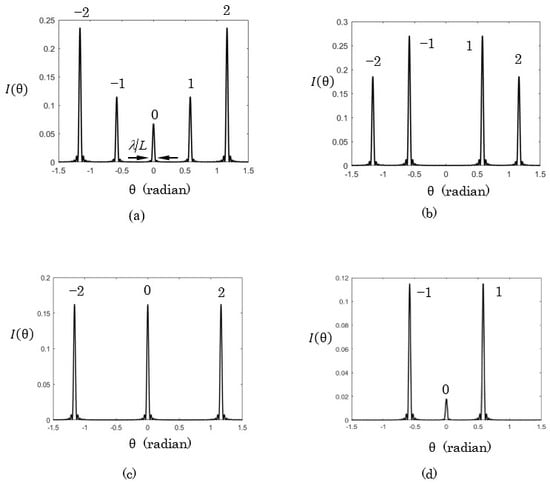
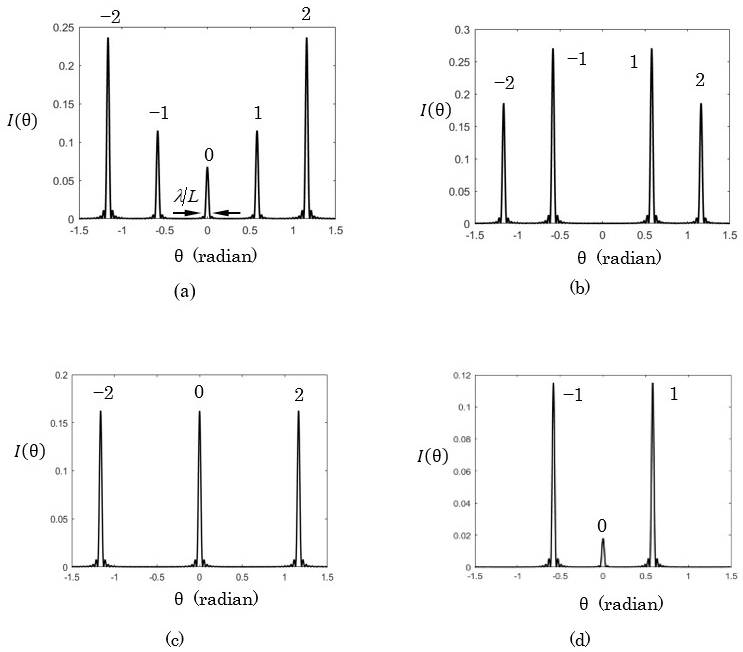
Figure 3 shows the diffraction intensity for different values of sound wave intensities. In Figure 3a–d, the intensities are 0.48 , 0.31 , 0.79 , 1.42 , respectively. It is noted that only the 0, ±1, and ±2 orders exist, as shown in Figure 3a, because the diffraction angle for the third order is already larger than 90°. In the figures, the 0, ±1, and ±2 orders are shown, as indicated in Figure 3a, and the diffraction angles for these orders are 0, ±0.58, and ±1.16 radians respectively. According to Equation (9), the diffraction angles can be varied by changing the sound wave wavelength (or frequency). From Equation (8), the intensity of order m depends on the value of ; thus, it is possible to adjust the intensity of each order by varying the value of b. If b corresponds to a root of , the mth order disappears. Figure 3b–d correspond to the vanishing 0, ±1, and ±2 orders, respectively. This property can be used to control whether light intensity is directed into specific directions. From Equation (8), the intensity width for each order is proportional to , as indicated by the zero order in Figure 3a; thus, the width is the same because and are chosen and fixed here.
Figure 3.
Far-field diffraction pattern for thin phase acoustic grating. The value of acoustic intensities in the figure are: (a) 0.48 ; (b) 0.31 ; (c) 0.79 ; (d) 1.42 .
3.2. Polychromatic Light Situation
According to the spatial–spectral relationship for mono-polychromatic light diffraction, the diffracted spectrum of a uniform incident light is directly related to the spatial intensity distribution of the monochromatic case. Here, it has a form similar to the angular distribution of the value given by Equation (8). If the incident light’s spectrum is , then the diffracted spectrum detected at a chosen angle is
where is the modifier function, or simply the modifier, and . The modifier indicates how the incident spectrum is modified. There are two points worth noting about Equation (10). First, for polychromatic spectra, the dispersion effect—that is, the wavelength-dependent refractive index of the material—must be taken into account. This is explicitly expressed by the dependence on in the relevant terms like in Equation (10). The dispersion relation of the Schott NSF-66 flint is
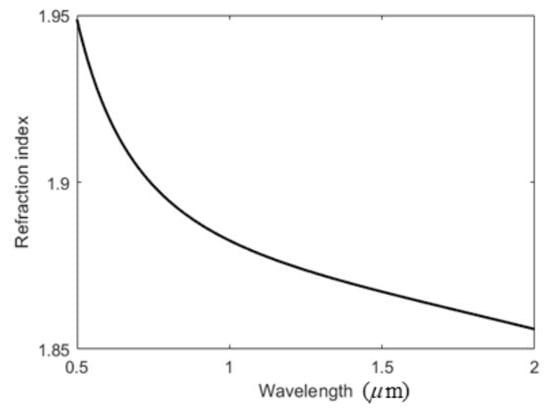
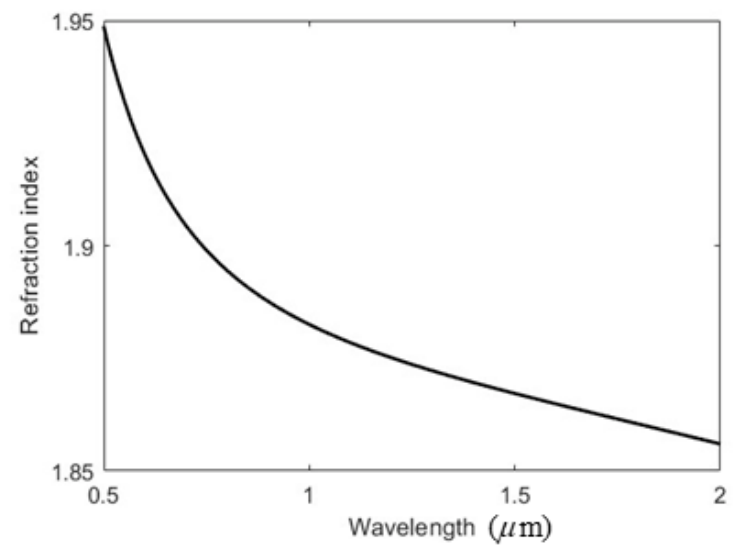
Figure 4 shows the dispersion curve over the wavelength interval from to 2.0 . The refractive index decreases as the wavelength increases, demonstrating the behavior of normal dispersion. Second, the mathematical form of is similar to in Equation (8), but their interpretations differ. In Equation (10), is derived from the product of and , which gives the diffracted spectrum at a picked angle . Thus, is a variable, and is a selected parameter for or in Equation (10). However, as mentioned above, for in Equation (8), is a variable, and is a selected parameter. Also, note that in Equation (10), the spectral orders start at 1 because the wavelength can only be positive, and the variable in the first factor of Equation (10) is also significant.
Figure 4.
Behavior of refractive index of NSF-66 versus wavelength.
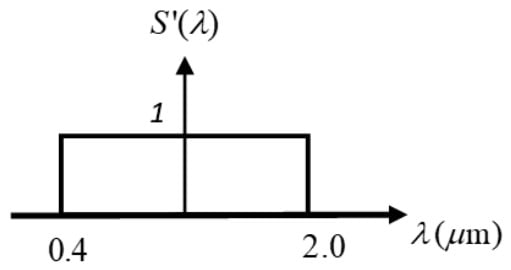
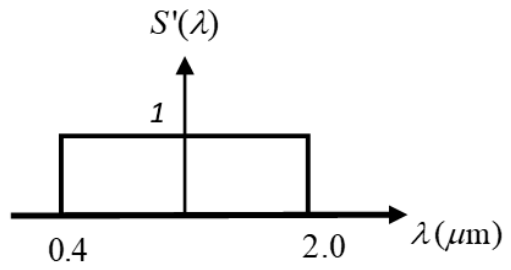
Now consider an incident spectrum with a rectangular function, which can be approximately produced by a broadband supercontinuum white light laser combined with a band-pass filter, as follows:
where is the center wavelength, and is the wavelength bandwidth. Here, and are used for numerical calculations, corresponding to a flat-top spectral distribution ranging from to 2.0 , as shown in Figure 5.
Figure 5.
The form of the incident spectrum .
Using the condition in Equation (10) again, the peak diffraction wavelengths satisfy the following condition:
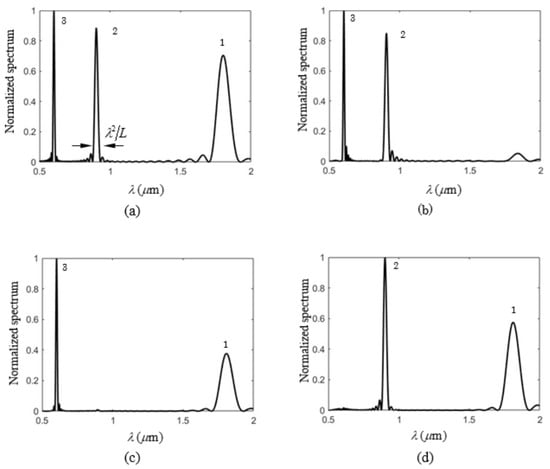
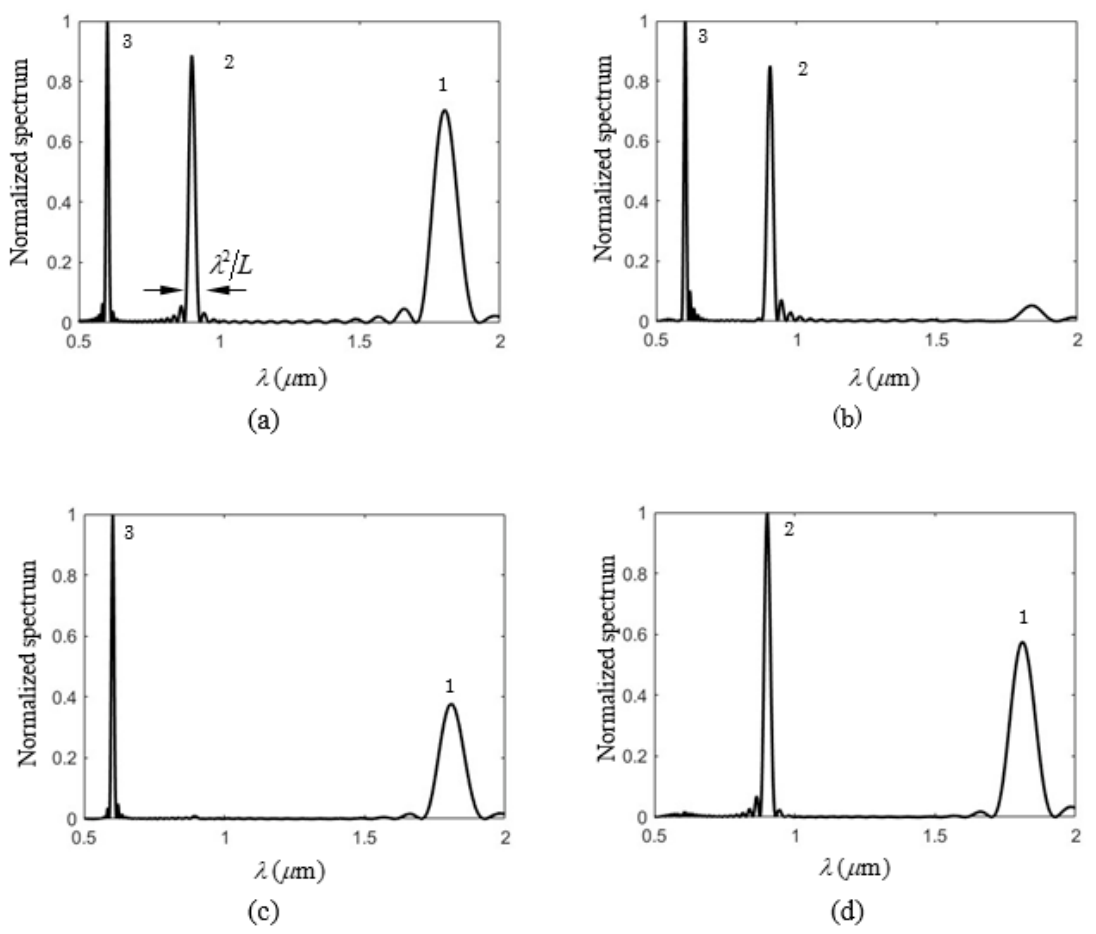
Figure 6 shows the normalized spectral distribution using the same parameters as before, with set to 0.58 radians and a sound wave intensity of Is = 1 . The wavelength peaks occur at 1.8, 0.9, and 0.6 for diffraction orders m = 1, 2, and 3, respectively, as indicated in Figure 6a. In a monochromatic wave situation, different angular orders can be made negligible by controlling the acoustic intensity. A similar effect can be found in a polychromatic wave scenario, as shown in Figure 6b–d, where the amplitude of each spectral order, m = 1, 2, and 3, is quite small or negligible compared to the other two dominant peaks. The diffraction wavelengths for orders m = 1, 2, and 3 can be neglected in Figure 6b–d, respectively. The intensities for Figure 6a–d are , 0.72 , 0.33 , and 0.19 , respectively. According to Equation (10), the bandwidth for each order is proportional to , as indicated by the second order of Figure 6a. Consequently, the bandwidth is wider for larger wavelengths (lower diffraction orders), as shown in the figures. This trend contrasts with the monochromatic case, illustrated in Figure 3, where the intensity width is the same for all diffraction orders.
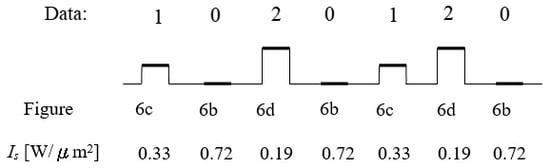
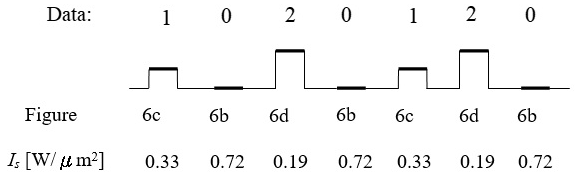
It is interesting to propose a digital data transmission scheme with this capability. Previous studies have utilized the spectral switch (SSW) effect to perform binary transmission [14]. Here, it is possible to achieve ternary transmission, as explained below. Consider a set of ternary digital data, as shown in the first row of Figure 7. In the second row, the three-level data values 0, 1, and 2 are encoded using the spectral distributions shown in Figure 6b, Figure 6c and Figure 6d, respectively, where the diffraction orders m = 1, 2, and 3 are negligible. If these data need to be transmitted to the angle , the corresponding spectra can be generated by controlling the acoustic wave intensity, as indicated in the bottom row of Figure 7. Thus, a receiver or detector positioned in that direction will receive these different spectra and decode them easily.
4. Discussion and Conclusions
In this study, we propose a ternary-level data transmission scheme utilizing acoustic Raman–Nath diffraction. We begin by introducing acousto-optic theory and then derive the angular intensity distribution for monochromatic light. The light is diffracted into specific angles corresponding to different diffraction orders. Next, we apply the correspondence relationship to the angular intensity, and the complete diffracted spectral profile is obtained by carefully considering material dispersion and the factor shown in the Fraunhofer diffraction approximation. Numerical results demonstrate that specific diffraction wavelengths can be identified for a given angle, and the angle can also be changed by varying the sound wave frequency. Since this study is based on two conditions —operating within the Raman–Nath diffraction regime and in the far field—the values of the Klein–Cook parameter and the far-field factor must be calculated and meet the required criteria.
In conclusion, this work presents a theoretical analysis of Raman–Nath diffraction, particularly in polychromatic light scenarios. Previously, acousto-optic devices have typically been used as spectral filters or analyzers for polychromatic light; here, a different application is proposed. Comparisons and interpretations of monochromatic angular intensity and polychromatic spectral distribution are emphasized. Additionally, a scheme for ternary digital data transmission is proposed, utilizing the property that different diffraction orders can be controlled by adjusting the acoustic wave intensity. We believe these results are valuable and can contribute to fields such as optical communications and spectral manipulation.
Author Contributions
Conceptualization, P.H.; methodology, J.-P.C.; validation, J.-P.C.; data curation, P.H.; writing—original draft preparation, C.-M.T.; writing—review and editing, C.-M.T.; funding acquisition, P.H. All authors have read and agreed to the published version of the manuscript.
Funding
This work was supported by the National Science and Technology Council of Taiwan under contract number NSTC 114-2221-E-005-025-MY3 and 114-2221-E-005-030-MY2.
Data Availability Statement
The data will be made available upon request.
Acknowledgments
We are thankful for the support from National Chung Hsing University.
Conflicts of Interest
The authors declare no conflicts of interest.
References
- Wolf, E. Invariance of the spectrum of light on propagation. Phys. Rev. Lett. 1986, 56, 1370–1372. [Google Scholar] [CrossRef] [Scilit] [PubMed]
- Wolf, E. Red shifts and blue shifts of spectral lines emitted by two correlated sources. Phys. Rev. Lett. 1987, 58, 2646–2648. [Google Scholar] [CrossRef] [Scilit] [PubMed]
- Pu, J.; Nemoto, S. Spectral shifts and spectral switches in diffraction of partially coherent light by a circular aperture. IEEE J. Quantum Electron. 2000, 36, 1407–1411. [Google Scholar] [CrossRef] [Scilit]
- Hsu, H.C.; Han, P. Spectra manipulation with the photorefractive effect via the spatial–spectral correspondence relationship. J. Opt. Soc. Am. A 2020, 37, 219–224. [Google Scholar] [CrossRef] [Scilit] [PubMed]
- Verma, M.; Joshi, S.; Bisht, N.; Kandpal, H.C.; Senthilkumaran, P.; Joseph, J. Effect of surface plasmons on spectral switching of polychromatic light with Au-double-slit. J. Opt. Soc. Am. A 2012, 29, 195–199. [Google Scholar] [CrossRef] [Scilit] [PubMed]
- Soskin, M.S.; Vasnetov, M.V. Singular optics. In Progress in Optics; Wolf, E., Ed.; Elsevier: Amsterdam, The Netherlands, 2001; Volume 42, pp. 219–276. [Google Scholar]
- Visser, T.D.; Wolf, E. Spectral anomalies near phase singularities in partially coherent focused wavefields. J. Opt. A Pure Appl. Opt. 2003, 5, 371–373. [Google Scholar] [CrossRef] [Scilit]
- Friberg, A.T.; Wolf, E. Relationships between the complex degrees of coherence in the space-time and in the space-frequency domains. Opt. Lett. 1995, 20, 623–625. [Google Scholar] [CrossRef] [Scilit] [PubMed]
- Joshi, S.; Yadav, B.K.; Verma, M.; Khan, M.S.; Kandpal, H.C. Effect of polarization on spectral anomalies of diffracted stochastic electromagnetic beams. J. Opt. 2013, 15, 035405. [Google Scholar] [CrossRef] [Scilit]
- Han, P. Spatial–Spectral Correspondence Relationship for Mono—Poly chromatic Light Diffraction. In Progress in Optics; Visser, T.D., Ed.; Elsevier: Amsterdam, The Netherlands, 2018; Volume 63, pp. 33–87. [Google Scholar]
- Han, P. Lattice spectroscopy. Opt. Lett. 2009, 34, 1303–1305. [Google Scholar] [CrossRef] [Scilit] [PubMed]
- Han, P.; Hsieh, T.H.; Liu, Y.L. Spatial-Spectral (space-wavenumber) correspondence relationship and Fresnel zone spectra. J. Opt. Soc. Am. A 2017, 34, 356–360. [Google Scholar] [CrossRef] [Scilit] [PubMed]
- Pu, J.; Zhang, H.; Nemoto, S. Spectral shifts and spectral switches of partially coherent light passing through an aperture. Opt. Commun. 1999, 162, 57–63. [Google Scholar] [CrossRef] [Scilit]
- Chang, J.P.; Weng, J.H.; Hsu, H.C.; Lee, P.Y.; Han, P. A Data Transmission Method with Spectral Switches via Electroabsorption. Appl. Sci. 2024, 12, 979. [Google Scholar]
- Chang, J.-P.; Tsai, C.-M.; Ding, P.; Pu, J.; Han, P. Scalable optical frequency rulers with the Faraday effect. Photonics 2024, 11, 127. [Google Scholar] [CrossRef] [Scilit]
- Saleh, B.E.A.; Teich, M.C. Fundamentals of Photonics, 2nd ed.; John Wiley & Sons: New York, NY, USA, 2007; p. 806, 828. [Google Scholar]
- Batshev, V.; Machikhin, A.; Gorevoy, A.; Martynov, G.; Khokhlov, D.; Boritko, S.; Pozhar, V.; Lomonov, V. Spectral Imaging Experiments with Various Optical Schemes Based on the Same AOTF. Materials 2021, 14, 2984. [Google Scholar] [CrossRef] [Scilit] [PubMed]
- Kinashi, K.; Yamazaki, I.; Singh, S.K.; Tsutsumi, N.; Sakai, W.; Jackin, B.J. Highly efficient rewritable thin polarization holograms through paraxial recording in azocarbazole copolymer-based composite films. Mater. Adv. 2025, 6, 2269. [Google Scholar] [CrossRef] [Scilit]
- Kwiek, P.; Molkenstruck, W.; Reibold, R. Determination of the Klein-Cook parameter in ultrasound light diffraction. Ultrasonics 1996, 34, 801. [Google Scholar] [CrossRef] [Scilit]
- Hecht, E. Optics, 4th ed.; Addison-Wesley: Reading, MA, USA, 2002; p. 452. [Google Scholar]
Disclaimer/Publisher’s Note: The statements, opinions and data contained in all publications are solely those of the individual author(s) and contributor(s) and not of MDPI and/or the editor(s). MDPI and/or the editor(s) disclaim responsibility for any injury to people or property resulting from any ideas, methods, instructions or products referred to in the content. |
© 2026 by the authors. Licensee MDPI, Basel, Switzerland. This article is an open access article distributed under the terms and conditions of the Creative Commons Attribution (CC BY) license.