


Abstract
Efficient laser cleaning of glazed ceramic tiles requires the ink layer to be removed without damaging the brittle glaze. We investigated the removal of acrylic ink using a 1064 nm, 10 ns Nd:YAG laser operating at 1 Hz. The lens-to-sample working distance L, pulse energy, and pulse number were varied, and the cleaned regions were evaluated by optical microscopy (OM), scanning electron microscopy and energy-dispersive X-ray spectroscopy (SEM–EDS), theoretical analysis, and COMSOL simulation. At L = 20 cm, the sample was close to the nominal focal plane, and the high local fluence removed the ink rapidly, but it also produced whitening, depressions, micro-pits, and glaze damage. Increasing L to 25–30 cm enlarged the measured spot diameter, lowered the average fluence, and widened the controllable cleaning range. Two low-damage conditions were identified at L = 30 cm: 30.80 J/cm2 with 3 pulses and 41.00 J/cm2 with 2 pulses. SEM–EDS showed that cleaning quality cannot be judged from exposed area or carbon content alone; morphology, preservation of the native glaze microstructure, the C/O ratio, and recovery of substrate-related elements must be considered together. Under the stated model assumptions, the calculated local temperature exceeded the acrylic decomposition temperature, and the thermoelastic stress reached tens to hundreds of MPa. These results make thermal decomposition and stress-assisted interfacial separation physically plausible. However, the present data do not separate thermoelastic stress from pressure-wave loading. Likewise, visible air breakdown and non-monotonic cleaning at high pulse energy only suggest possible plasma-related attenuation because plasma density and transmitted laser energy were not measured. The reported combinations should therefore be regarded as a system-specific process window rather than a universal optimum.
1. Introduction
Ink, graffiti, and polymer-based markings are common contaminants on ceramic tiles and other architectural surfaces. Their removal is difficult because a glazed tile is not an ideal smooth plate. Glaze porosity, roughness, wetting behavior, and local topography all influence cleanability [1]. Commercial glazed porcelain tiles are also multilayer systems in which the ceramic body, engobe, and vitreous glaze affect permeability and surface integrity [2]. In addition, glaze composition and particle-size distribution can create pores, protrusions, and heterogeneous glassy features even when the surface appears smooth [3]. These characteristics mean that a cleaned region should be compared with the native glaze morphology rather than judged only by visual smoothness. Laser cleaning has already been applied to graffiti on marble [4], paint layers on white marble [5], and fouling on porcelain insulators [6], but each application requires careful parameter control to remove the contaminant while preserving the substrate.
Laser cleaning is attractive because it is non-contact, spatially selective, and compatible with automated processing. Its removal mechanism, however, is rarely singular. Depending on the material and irradiation conditions, dry cleaning, liquid-assisted cleaning, thermal decomposition, photomechanical removal, plasma-assisted effects, and interfacial delamination may occur together [7,8,9]. The same energy that removes a coating can also heat, roughen, crack, or discolor the substrate. Substrate protection is therefore a central engineering requirement [10]. Dynamic monitoring based on optical images, acoustic signals, plasma spectra, or thermal radiation can help identify the transition from effective cleaning to over-cleaning [11].
Studies on coated engineering substrates provide useful comparisons. For aircraft-skin paint, 1064 nm nanosecond pulses have been used to relate process parameters to coating removal and substrate microstructure [12]. For acrylic polyurethane coatings on aluminum alloys, cleaning quality has been assessed by combining SEM, residual-composition analysis, and thermal modeling [13]. Other studies show that scanning speed and fluence can shift the balance among ablation, thermal stress, pressure-assisted removal, and possible plasma shielding [14,15,16]. Plasma-generated pressure waves can also extend the mechanical effect beyond the optical spot [17,18], while plume absorption and scattering can reduce the energy reaching the target at excessive pulse energy [19]. COMSOL-based analyses further indicate that polymer-bond cleavage, particle generation, heating, and mechanical loading may coexist during pulsed-laser paint removal [20]. These studies show why nominal pulse energy alone is not sufficient to define a cleaning window.
Acrylic ink on a glazed ceramic tile presents an additional challenge. The ink contains pigments and fillers dispersed in a polymer matrix, and their distribution may change during aging or irradiation [21]. SEM and EDS are useful for distinguishing incomplete coating removal from surface melting or carbon-containing residue [22]. Carbon content has also been used as a practical indicator of residual organic coating, although it must be interpreted together with morphology and substrate damage [23]. Similar multi-indicator approaches have been applied to resin-matrix composite coatings [24], and recent reviews emphasize the coupled effects of process parameters, substrate properties, and damage mechanisms in polymer-contaminant removal [25]. Nevertheless, acrylic-ink cleaning on brittle glazed tiles remains less understood. The present study therefore combines macroscopic imaging, SEM–EDS, simplified physical analysis, and COMSOL simulation to link process parameters with cleaning quality. The main contribution is an evidence-based parameter–mechanism–quality framework: working distance is related to measured spot size and fluence; cleaning quality is assessed with both morphological and elemental indicators; and direct observations are separated from simulation-supported interpretations and unresolved hypotheses.
2. Experimental Equipment and Materials
2.1. Materials and Sample Preparation
Commercial glazed ceramic tiles coated with an acrylic-based ink were used as the cleaning targets. The tile consisted of a ceramic body covered by a vitreous glaze. The ink layer contained acrylic resin, pigments, fillers, and organic additives. Samples were cut to a suitable size, and only loose dust and weakly attached particles were removed before irradiation. The ink-coated region itself was left unchanged so that the laser interacted directly with the deposited layer. After cleaning, the samples were stored in a clean environment before OM, SEM, and EDS characterization.
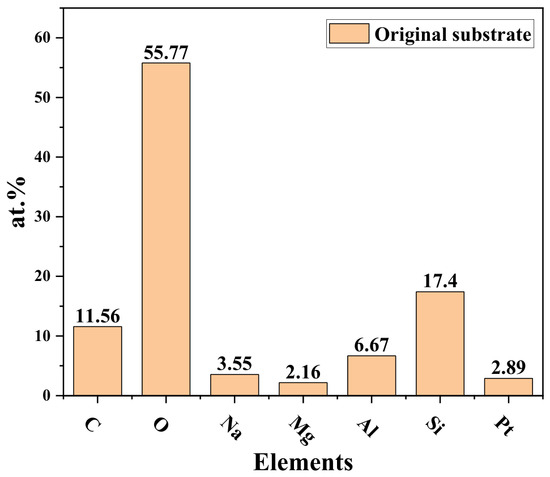
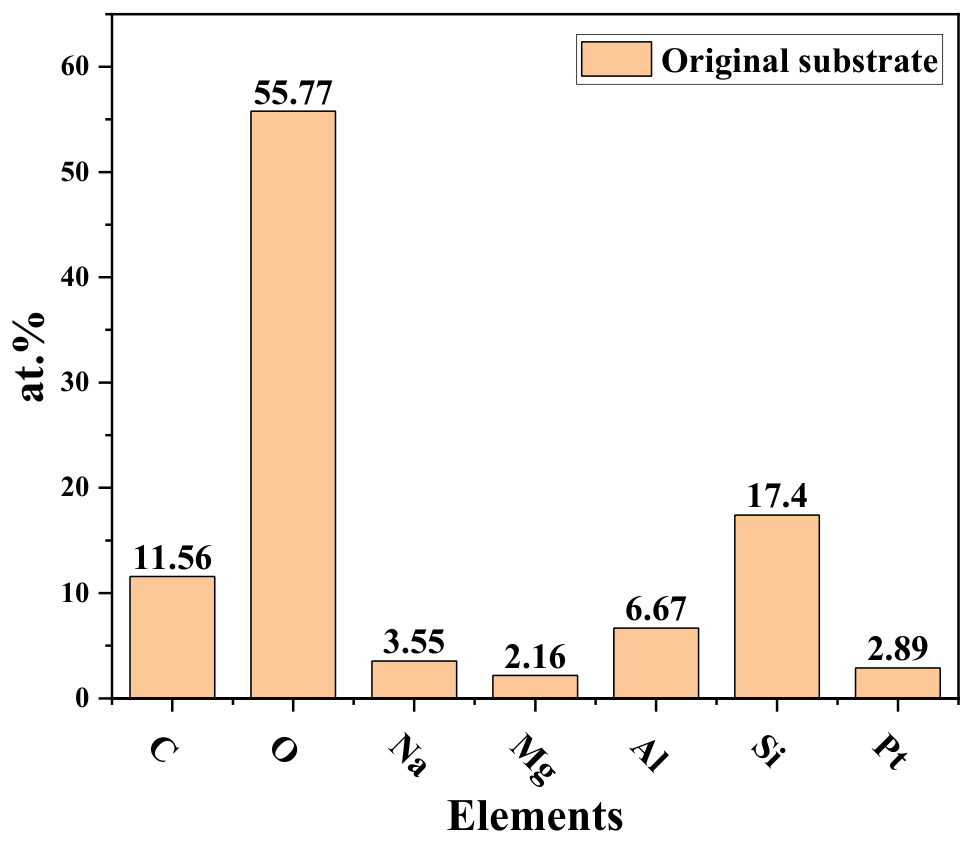
The pristine tile served as the reference for both morphology and composition. SEM showed that the native glaze was heterogeneous, with protrusions, depressions, and micron-scale pores. A cleaned surface was therefore evaluated by its similarity to this native texture, not by smoothness alone. EDS detected O, Si, Al, Na, Mg, C, and Pt. The oxygen and carbon contents were approximately 55.77 at.% and 11.56 at.%, respectively, giving a reference C/O ratio of about 0.21. This value was used only as a semi-quantitative indicator of residual carbon-containing material.
2.2. Laser Cleaning Equipment and Experimental Parameters
The experiments used a 1064 nm Nd:YAG laser with a pulse width of 10 ns and a repetition frequency of 1 Hz. Pulse energies of 0.6, 0.8, and 1.0 J were applied for 1–5 pulses. The beam was focused in ambient air by a lens with a nominal focal length of f = 200 mm. The incident beam diameter at the lens was approximately D = 3.2 mm at the 1/e2 intensity level. In this manuscript, the working distance L is the axial distance from the principal plane of the focusing lens to the sample surface. It is not the distance from the focal plane. Thus, L = 20 cm placed the sample close to the nominal focal plane, whereas L = 25 and 30 cm placed it approximately 5 and 10 cm beyond that plane.
The measured spot diameters at L = 20, 25, and 30 cm were approximately 86 μm, 788 μm, and 1.57 mm, respectively. These measured values were used to calculate the average fluence. At 0.6 J, the corresponding fluences were approximately 1.03 × 10⁴, 1.23 × 10², and 30.80 J/cm2. The three experimental controls had distinct roles: working distance changed spot size and fluence, pulse energy changed the incident energy and the likelihood of beam-path breakdown, and pulse number changed the accumulated removal and damage. Visible emission and air-breakdown flashes were recorded qualitatively, but plasma density and transmitted laser energy were not measured.
2.3. Characterization Methods
OM was first used to compare the exposed ceramic area, residual ink, cleaning boundary, surface whitening, color change, and visible crater formation. This rapid screening showed how cleaning changed with working distance, pulse energy, spot size, and pulse number. Because the pristine glaze already contained pores and protrusions, OM alone could not reliably distinguish effective cleaning from slight substrate damage.
Selected regions were therefore examined by SEM at both the spot center and the cleaning boundary. The analysis focused on micro-pits, roughened areas, residual coating, spherical redeposited particles, delamination features, and damaged glaze. EDS was then used to compare elemental composition before and after cleaning. Carbon content and the C/O ratio were treated as semi-quantitative indicators because the ink was carbon-rich and the glaze was dominated by oxygen-, silicon-, and aluminum-containing compounds. EDS cannot determine the bonding state of carbon; accordingly, the detected material is described only as carbon-containing residue or redeposited species.
3. Mechanism Analysis and Numerical Simulation
3.1. Simplified Physical Framework for Pulsed Laser Cleaning
Section 3.1 is intended as an interpretive framework, not as a fully calibrated predictive model. It addresses three questions: how the working distance changes the fluence, which thermal or mechanical processes are physically plausible, and when additional energy changes effective cleaning into incomplete cleaning or substrate damage. Equations (1)–(3) are standard fluence, Gaussian-beam, and short-pulse energy-balance relations. Equation (4) is the classical critical-electron-density relation. Equations (5)–(7) provide a simplified description of possible plasma-related attenuation [14,15,19]. Equations (8)–(10) estimate a possible pressure contribution and its lateral decay [15,16,17,18]. Equations (11)–(14) describe thresholded removal, the pulse number required to expose the substrate, and the onset of substrate damage [20,22,23,24]. The parameters in the phenomenological relations were not independently fitted in the present experiments. The equations are therefore used to organize the observed regime transitions and to test physical plausibility; they do not prove a unique removal mechanism. In particular, direct pressure-wave measurements were not performed.
3.1.1. Pulse Laser Energy and Spot Fluence
For a pulse energy E distributed over a measured spot area A, the average pulse fluence is:
Here, F is the average pulse fluence. For a circular spot of measured diameter d, A = πd2/4. This simple relation explains the large change in fluence with working distance. At 0.6 J, the measured diameters of 86 μm, 788 μm, and 1.57 mm correspond to approximately 1.03 × 10⁴, 1.23 × 10², and 30.80 J/cm2, respectively.
The focused-beam waist can also be checked with the standard Gaussian-beam relation:
In Equation (2), ω0 is the waist radius, M2 is the beam-quality factor, λ is the wavelength, f is the focal length, and D is the incident 1/e2 beam diameter at the lens. Using f = 200 mm, D ≈ 3.2 mm, and M2 ≈ 1 gives a waist diameter close to the measured 86 μm value. This calculation is used only as a consistency check. All reported fluences were calculated from the measured spot diameters.
3.1.2. Single-Pulse Heating in the Acrylic Ink Layer
Part of the incident energy is absorbed by the ink and converted into heat. If α is the absorption coefficient, R is the reflectivity, δ is the optical penetration depth, ρ is the density, and Cp is the heat capacity, the approximate adiabatic temperature rise during one short pulse can be written as:
Equation (3) shows that a high local fluence can rapidly raise the temperature and make acrylic decomposition possible. The 1 Hz repetition rate gives a 1 s interval between pulses, so inter-pulse heat accumulation was limited in the present experiments. Local peak temperature and spatially averaged temperature should therefore not be confused. In the simulations, the local peak exceeded 800 K, whereas the average surface temperatures were approximately 480 and 550 K at 30.80 and 41.00 J/cm2, respectively.
3.1.3. Possible Plasma Formation and Energy Attenuation
At high pulse energy, visible emission and air-breakdown flashes appeared along the beam path. Such a breakdown can consume or redirect part of the laser energy through ionization, inverse-bremsstrahlung absorption, scattering, and plume expansion before the pulse reaches the ink. Because electron density and laser transmission were not measured, the following relations describe only a possible attenuation pathway. For an angular frequency ω = 2πc/λ, the critical electron density is:
Equation (5) is an energy-balance estimate for avalanche growth [19]. Here, n0 is the neutral number density, ℓeff is an effective interaction length, Eion is an effective ionization energy, η is the electron-energy coupling efficiency, ne0 is the initial free-electron density, and nc is defined by Equation (4). This expression was not used as a measured breakdown threshold; it provides only an order-of-magnitude interpretation.
When F exceeds the assumed breakdown level Fplasma, the transmitted fraction may decrease. A bounded phenomenological transmission coefficient is written as:
Here, Fsat is a shielding-saturation fluence and p > 0 controls how rapidly the transmission decreases. Equation (6) is motivated by reported nanosecond plasma-shielding behavior [14,15,19], but Fsat and p were not fitted in this study.
The effective fluence reaching the ink is then:
Equations (5)–(7) show how a higher nominal pulse energy could produce less cleaning if beam-path attenuation becomes important. They do not demonstrate that plasma shielding occurred in a particular experiment. In this work, plasma-related attenuation remains a hypothesis supported only by visible breakdown and non-monotonic cleaning behavior.
3.1.4. Possible Transient Pressure and Interfacial Separation
A plasma plume or rapidly expanding decomposition products can apply a short mechanical load to the coating. In the simplified pressure description, the initial plume volume is Vp = Aflp, where lp is a characteristic axial expansion length that may be approximated by the optical penetration depth δ. If the absorbed energy U = ηE E is related to the average plume pressure P0 by U = P0Vp/(γp − 1), Equation (8) follows [15,16,17,18]. This is an energy-based estimate, not a measured shock-wave pressure.
Defining β ≡ (γp − 1)/lp gives P0 = βFeff. Because lp and the fraction of absorbed energy converted into plume internal energy are uncertain, β is an effective fitting parameter rather than a universal material constant.
For r ≥ ω0, the lateral pressure contribution is approximated by the empirical near-field relation:
The exponent n ≈ 2–3 represents idealized geometric spreading [15,17,18] and was not determined experimentally here. If σadh is the interfacial adhesion strength, the condition P(Rc) = σadh gives Equation (10). The resulting Rc is only an estimate of the radius over which a pressure contribution could reach the adhesion level. Thermoelastic stress and other interfacial stresses may produce similar separation features, so this relation cannot identify the stress source by itself.
When no strong beam-path attenuation is evident, Feff ≈ F. Localized heating can then decompose and soften the ink, while thermoelastic stress can promote interfacial separation. A pressure-wave contribution is possible but unresolved. For this reason, Equations (8)–(10) are interpreted together with SEM, EDS, and thermoelastic simulation rather than as proof of shock-wave-dominated cleaning.
3.1.5. Removal Depth and Substrate Damage Criterion
The single-pulse removal depth is represented by the standard logarithmic ablation relation [20,22,23,24]:
Here, Frem is the effective threshold for ink removal. Equation (11) assumes constant optical properties, a fixed penetration depth, and no moving boundary during one pulse. It is therefore a simplified description of the trend rather than a complete ablation model.
If the ink thickness is h, the fluence is constant, and interactions between pulses are neglected, the cumulative removal depth after N pulses is NΔz. Complete removal requires:
The corresponding minimum pulse number is:
If F ≤ Frem, the logarithmic removal depth is zero or negative in this simplified model, so complete removal cannot be reached by increasing the pulse number alone.
When NΔz ≥ h, the glaze is exposed. Direct ablation damage is then expected when:
where Fdam is the fluence at which the exposed glaze begins to be damaged.
Even below Fdam, applying more pulses than required for coating removal increases repeated thermal and mechanical loading. Because no roughness-based fatigue coefficient was measured, this additional risk is discussed qualitatively rather than represented by a fitted damage law.
3.1.6. Relationship Between Theory and Experimental Observations
A practical process window must satisfy three conditions. First, the pulse number must be sufficient to expose the glaze but should not greatly exceed the required value. Second, the incident fluence should remain below the glaze-damage level. Third, the effective fluence at the target must remain high enough for removal without entering a regime of strong beam-path breakdown. At L = 30 cm, the observations are consistent with Frem < F < Fdam and Feff ≈ F when no obvious breakdown was seen. Increasing fluence reduces the pulse number required for removal, but it also narrows the margin before substrate modification. The representative low-damage conditions were 30.80 J/cm2 with 3 pulses and 41.00 J/cm2 with 2 pulses.
At L = 30 cm, both parameter combinations removed most of the ink while limiting visible and microscopic glaze modification. They define an experimental window for the present ink–tile system. Their qualitative agreement with the simplified framework supports the proposed regime sequence, but it does not validate every assumption or establish a unique mechanism.
3.2. Numerical Simulation Model
COMSOL Multiphysics 5.4 was used to calculate the transient thermal and thermoelastic responses of the ink-coated tile. The two-dimensional multilayer domain contained air, acrylic ink, ceramic glaze, and the ceramic body. A time-dependent laser heat input was applied at the center of the ink layer, and transient heat transfer was coupled to solid mechanics through thermal expansion. The main outputs were local and average temperature, stress distribution, and average stress evolution.
Because the repetition frequency was only 1 Hz, the model treated a single pulse and focused on the near-optimal fluences of 30.80 and 41.00 J/cm2. The extreme near-focus condition of 1.03 × 10⁴ J/cm2 was not simulated quantitatively. At that fluence, air breakdown, material ejection, phase change, plume interaction, and a moving boundary would violate the assumptions of the present thermal–mechanical model. Table 1 summarizes the model settings and their intended range of use.
Table 1.
Summary of the COMSOL model settings and applicability.
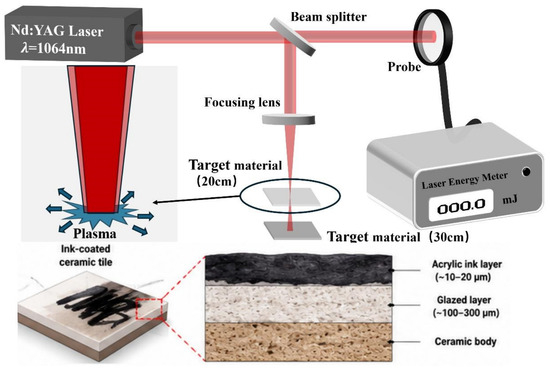
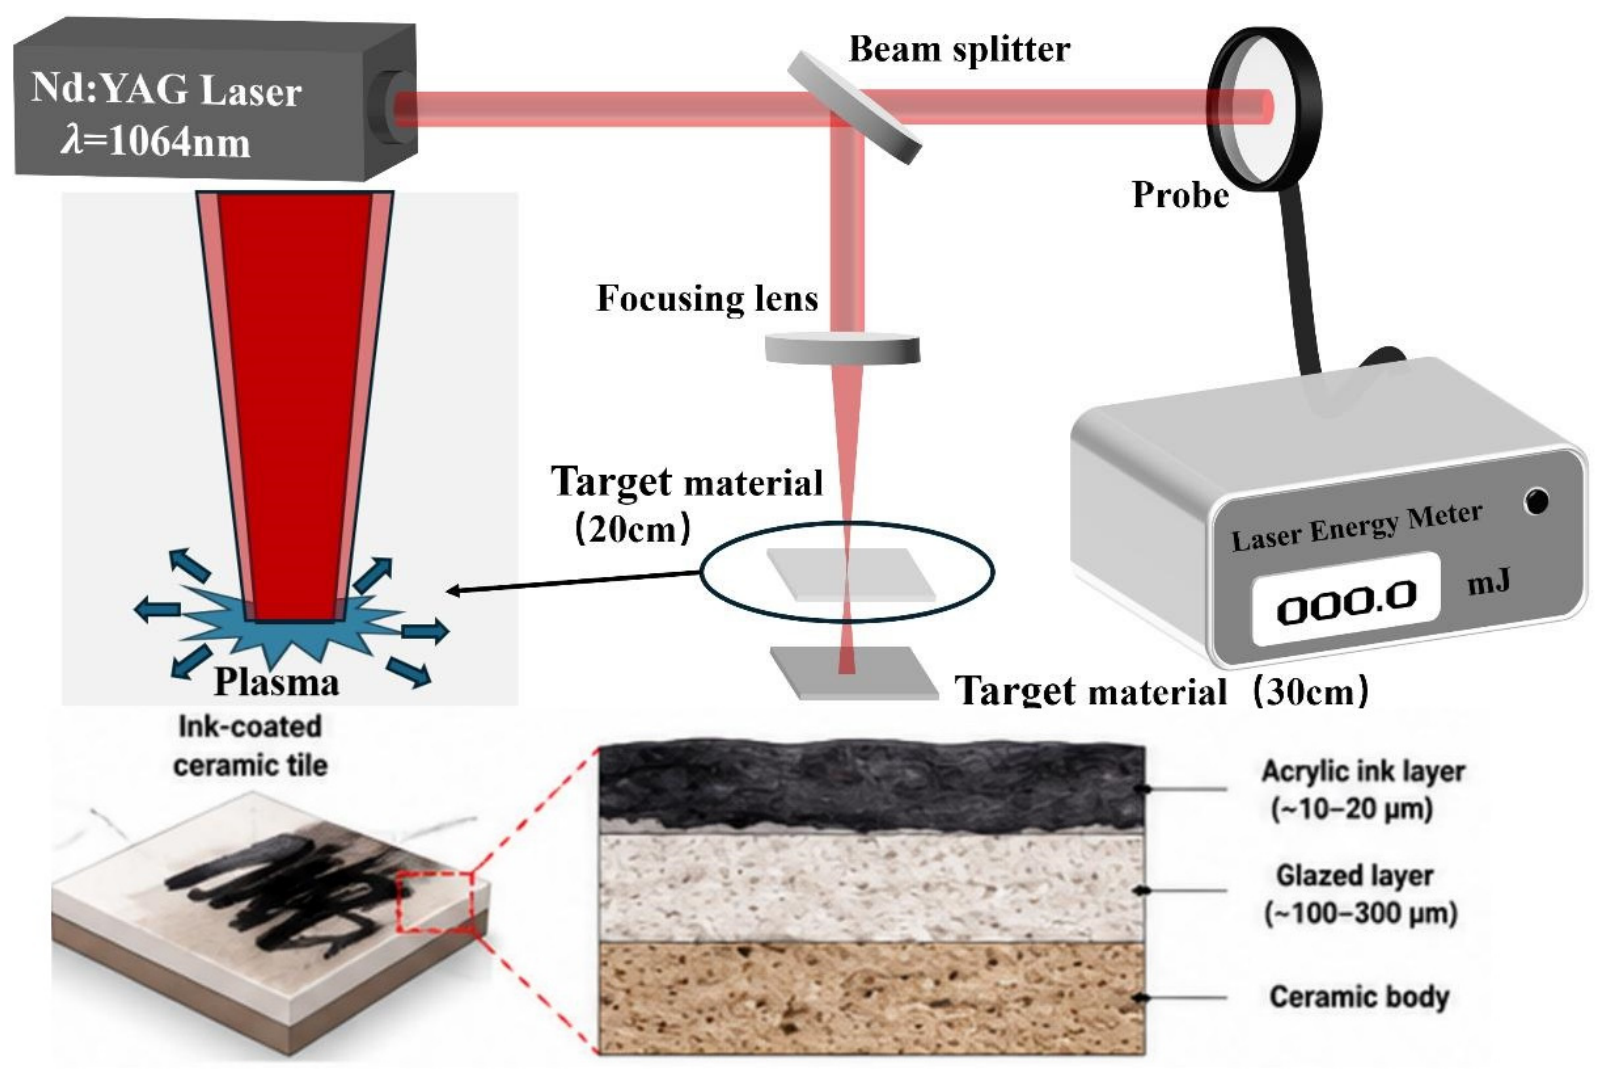
Figure 1.
Schematic illustration of the nanosecond pulsed laser cleaning system and the acrylic-ink-coated ceramic tile sample. The focusing lens had a nominal focal length of 200 mm, the incident 1/e2 beam diameter at the lens was approximately 3.2 mm, and L denotes the lens-to-sample working distance.
3.3. Simulation Results and Mechanistic Interpretation
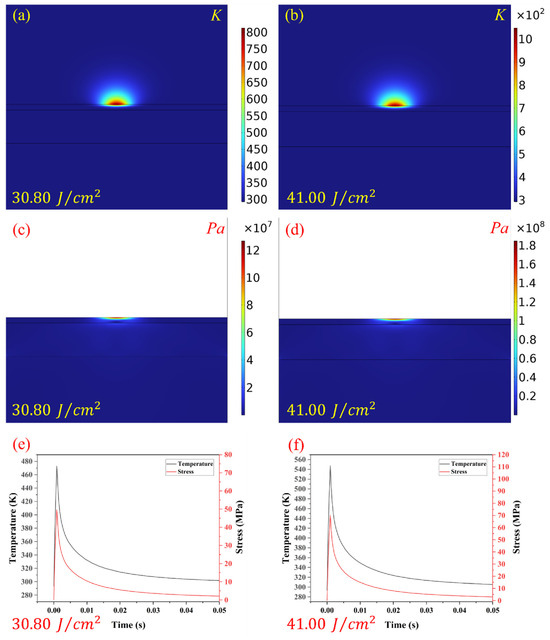
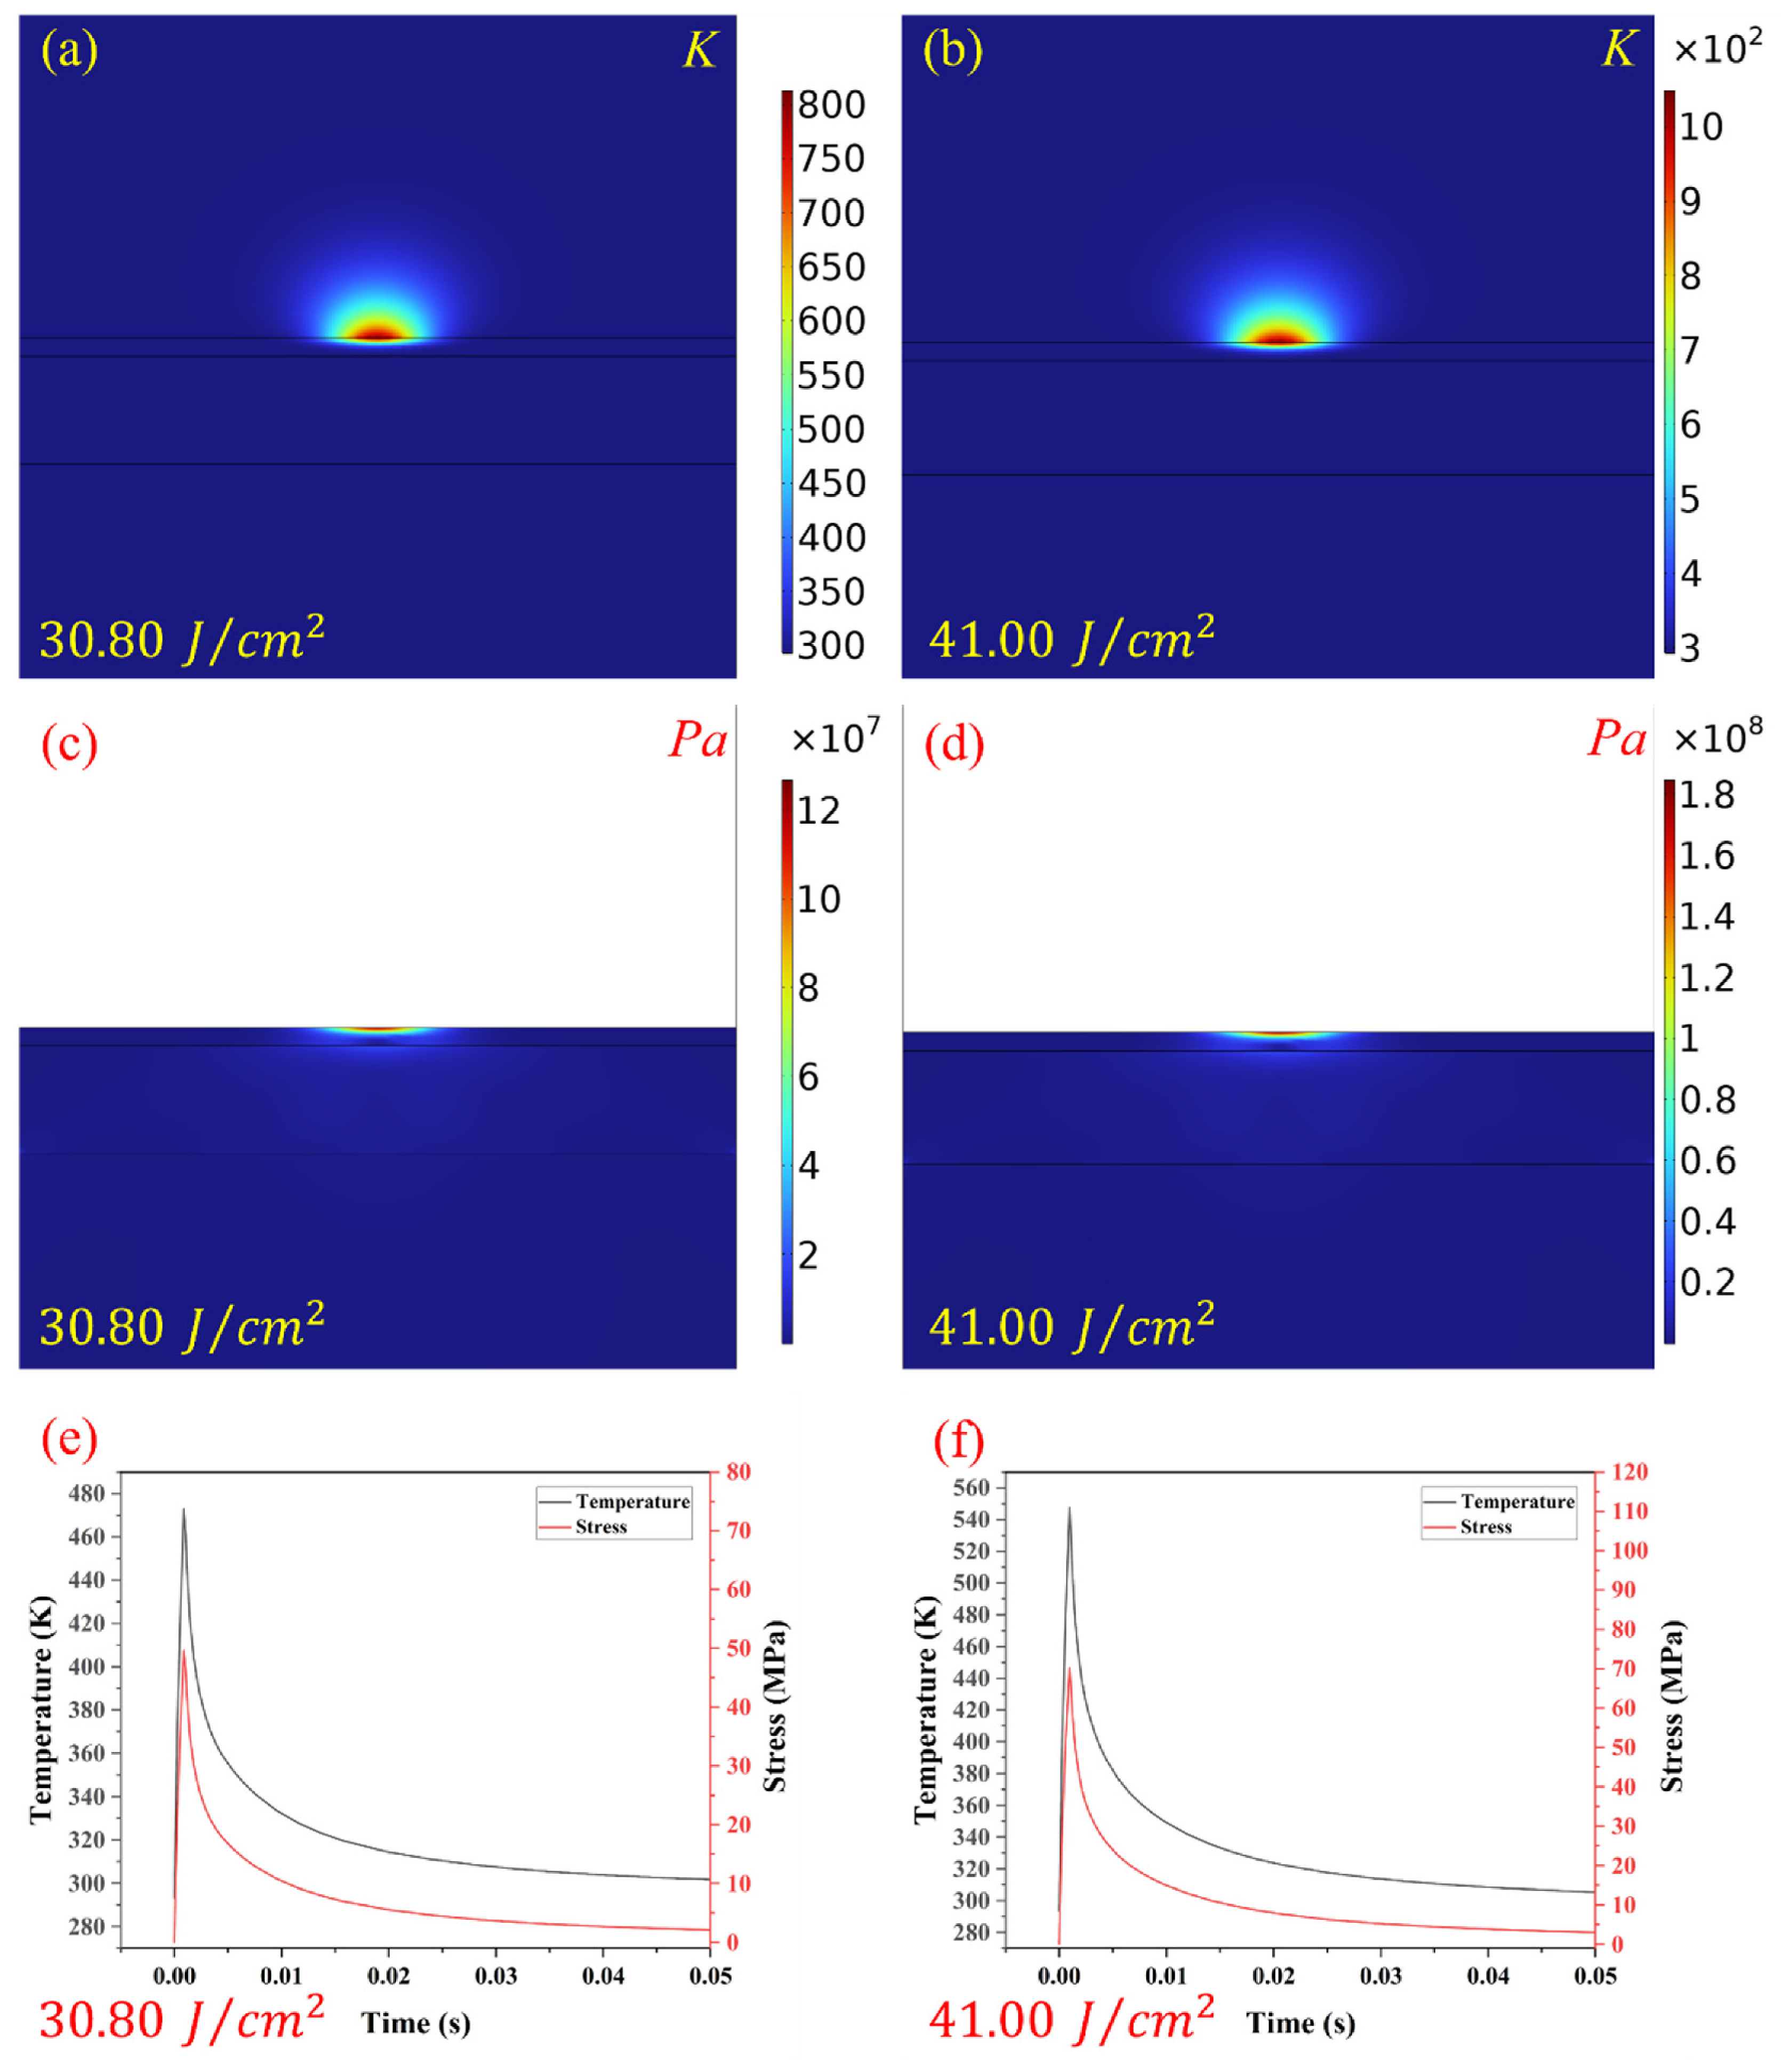
Figure 2 presents the calculated single-pulse response at 30.80 and 41.00 J/cm2. These simulations were used to examine whether the low-damage experimental window was physically consistent with localized heating and thermoelastic loading. They were not intended to reproduce the severe near-focus over-cleaning condition.
Figure 2.
Simulated temperature, stress, and average response curves under pulsed laser irradiation in the near-optimal fluence regime. (a,b) Temperature fields at 30.80 and 41.00 J/cm2; (c,d) stress fields at 30.80 and 41.00 J/cm2; (e,f) average temperature and stress curves at 30.80 and 41.00 J/cm2.
At both fluences, the calculated local peak temperature exceeded 800 K, above the reported acrylic decomposition temperature of approximately 573 K. The average surface temperatures were much lower, approximately 480 and 550 K, confirming that the heating was strongly localized in the model. The calculated thermoelastic stress was concentrated near the irradiated region and reached tens to hundreds of MPa. These results show that thermal decomposition and thermoelastic loading are physically plausible contributors to ink weakening and interfacial separation.
The interpretation is intentionally limited. SEM observations of lifted boundaries and stacked residual layers show that separation occurred, but they do not reveal whether the driving load was mainly thermoelastic stress, pressure-wave loading, or a combination of both. The COMSOL model includes thermoelastic stress but no measured shock-pressure input. Similarly, the smaller cleaned area at 1.0 J and the visible breakdown flashes are consistent with reduced target-surface energy, but they do not prove plasma shielding because electron density, plume absorption, and transmitted pulse energy were not measured.
4. Results and Discussion
4.1. Macroscopic Cleaning Behavior
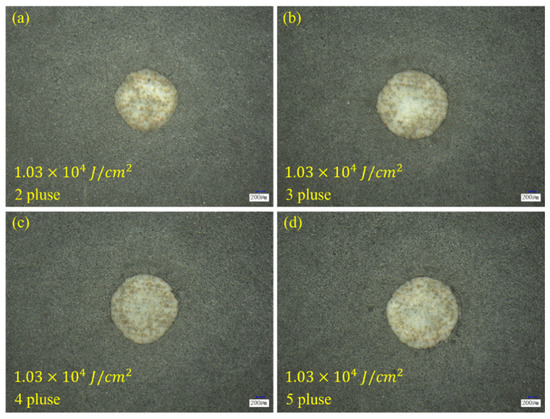
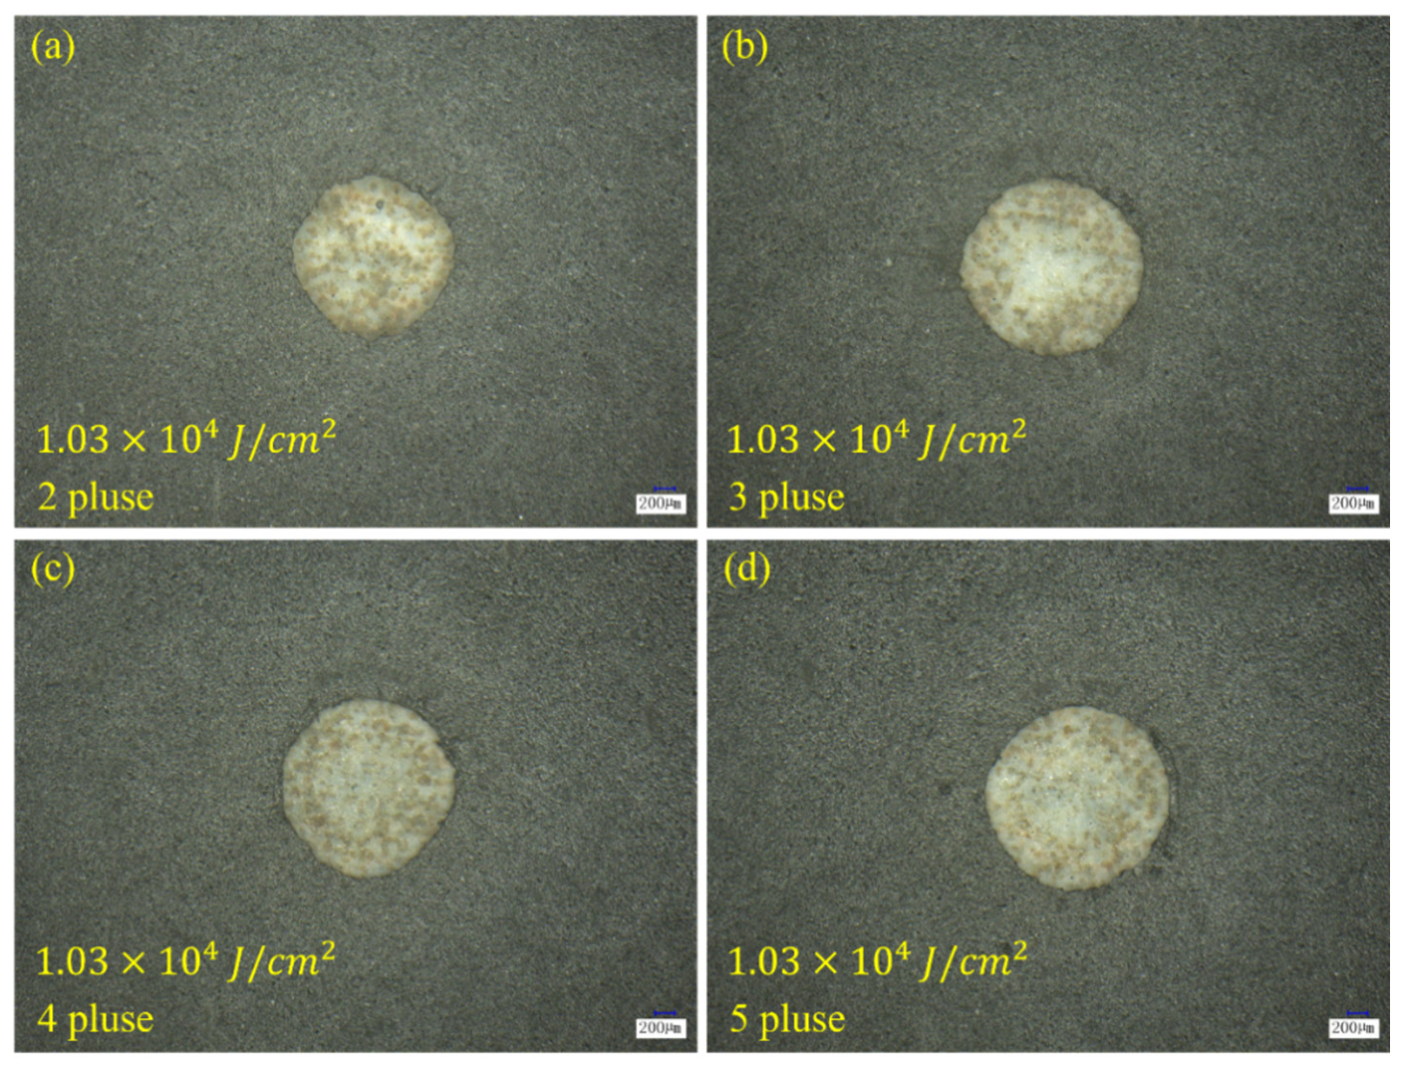
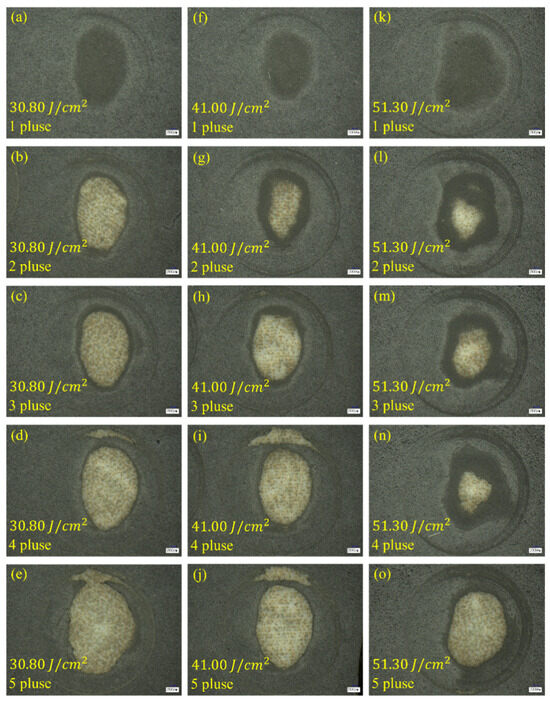
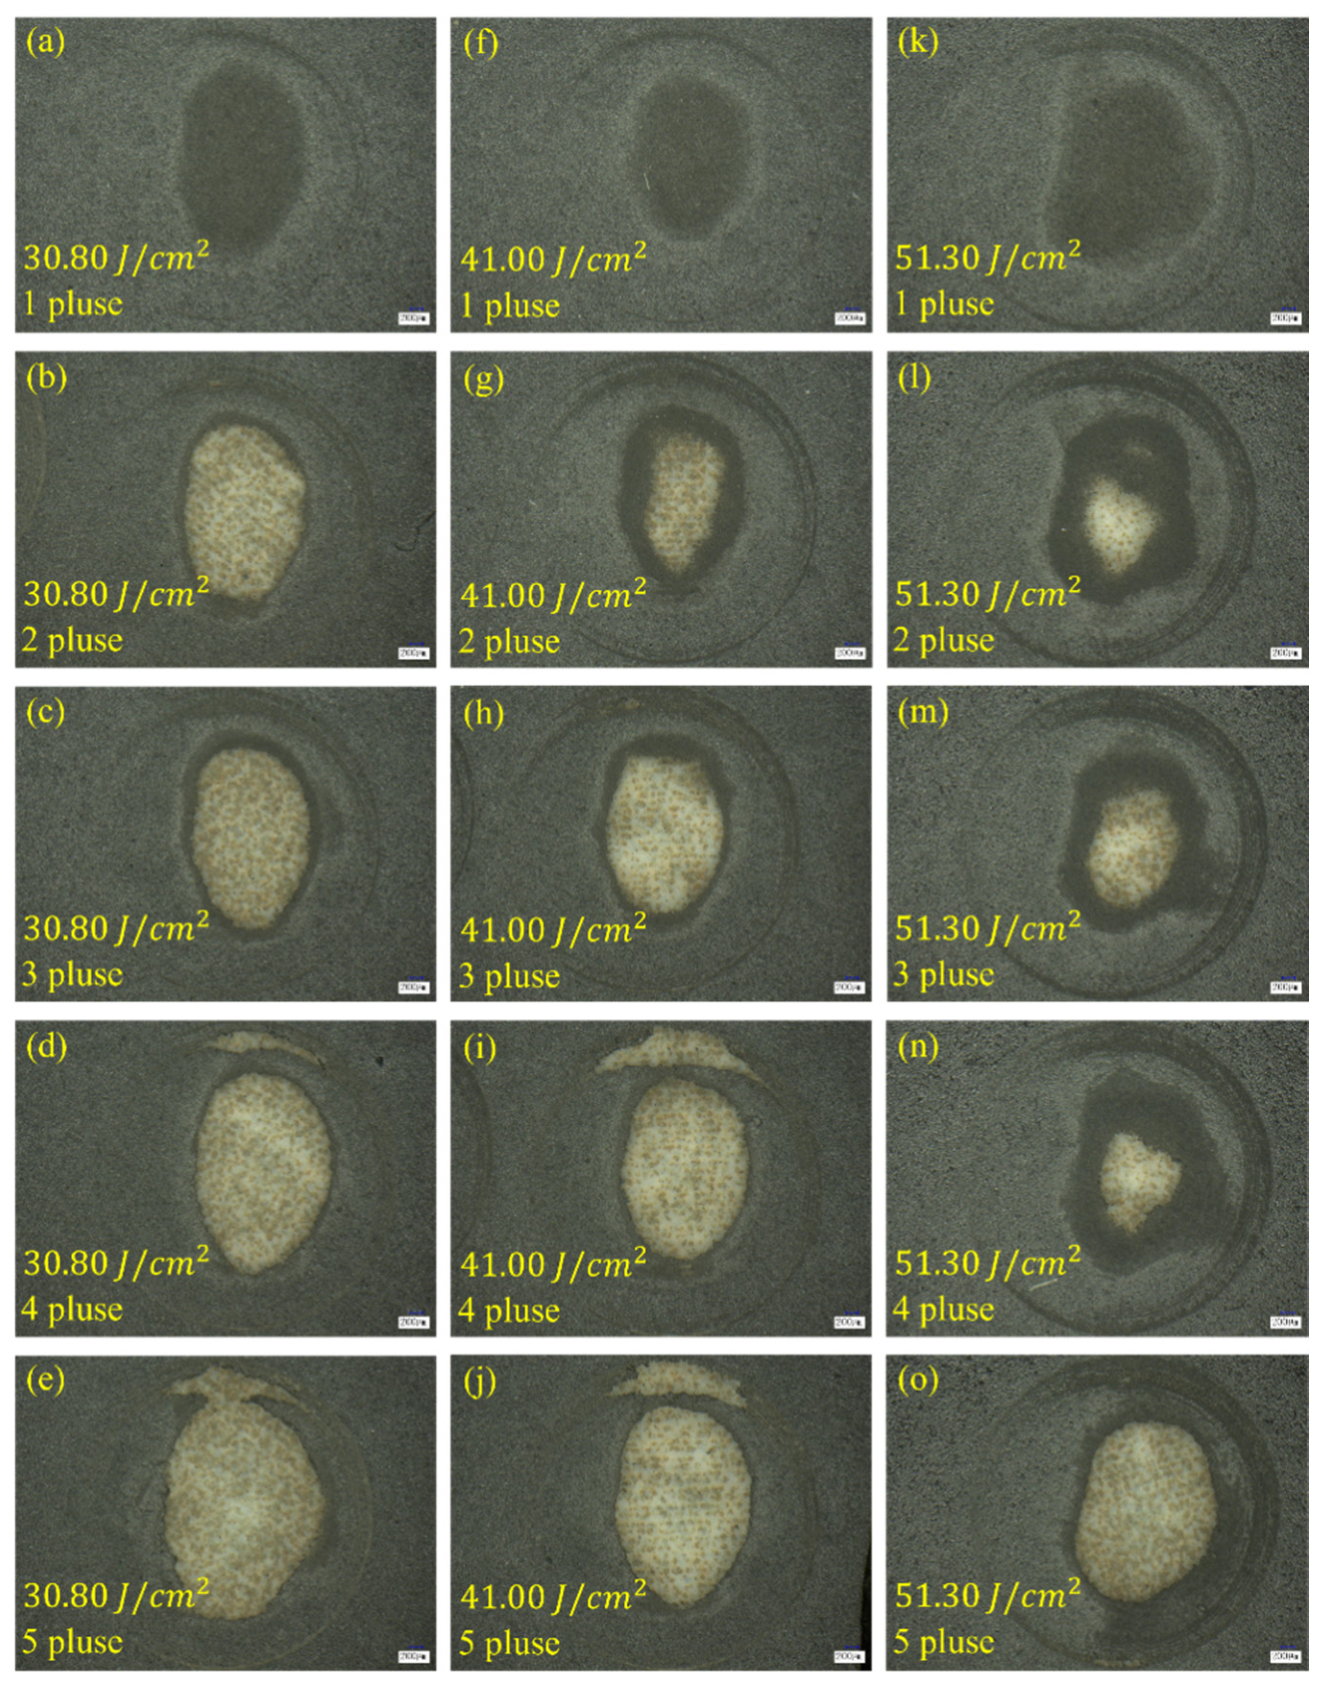
Figure 3, Figure 4 and Figure 5 compare the macroscopic cleaning results at different working distances, pulse energies, and pulse numbers. Working distance affected the process through the measured spot diameter and the resulting average fluence. At L = 20 cm, the 86 μm spot produced approximately 1.03 × 10⁴ J/cm2 at 0.6 J. The ink was removed quickly, but the exposed region also showed whitening, a central depression, and surface brightening. These directly observed features identify this condition as over-cleaning with glaze modification. No shock pressure was measured under this condition.
Figure 3.
Macroscopic morphologies after laser cleaning at a 20 cm working distance, corresponding to an 86 μm spot diameter and a fluence of 1.03 × 10⁴ J/cm2 under the 0.6 J pulse condition. (a–d) Cleaning results after 2, 3, 4, and 5 pulses, respectively, showing progressive enlargement of the cleaned area and increasing substrate damage.
Figure 4.
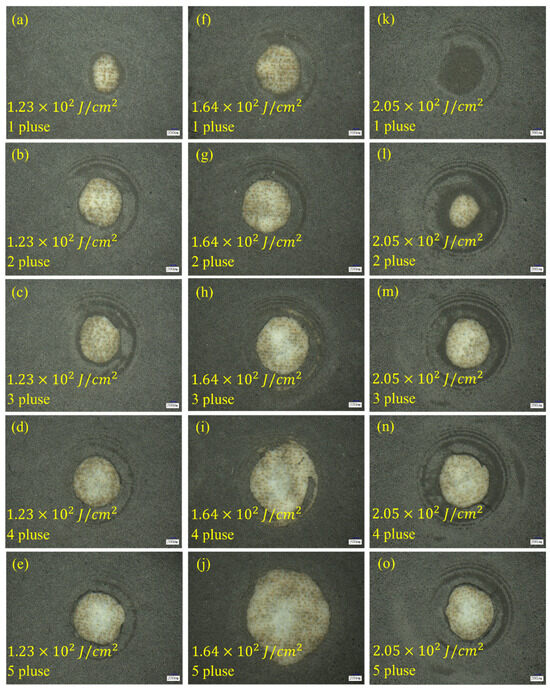
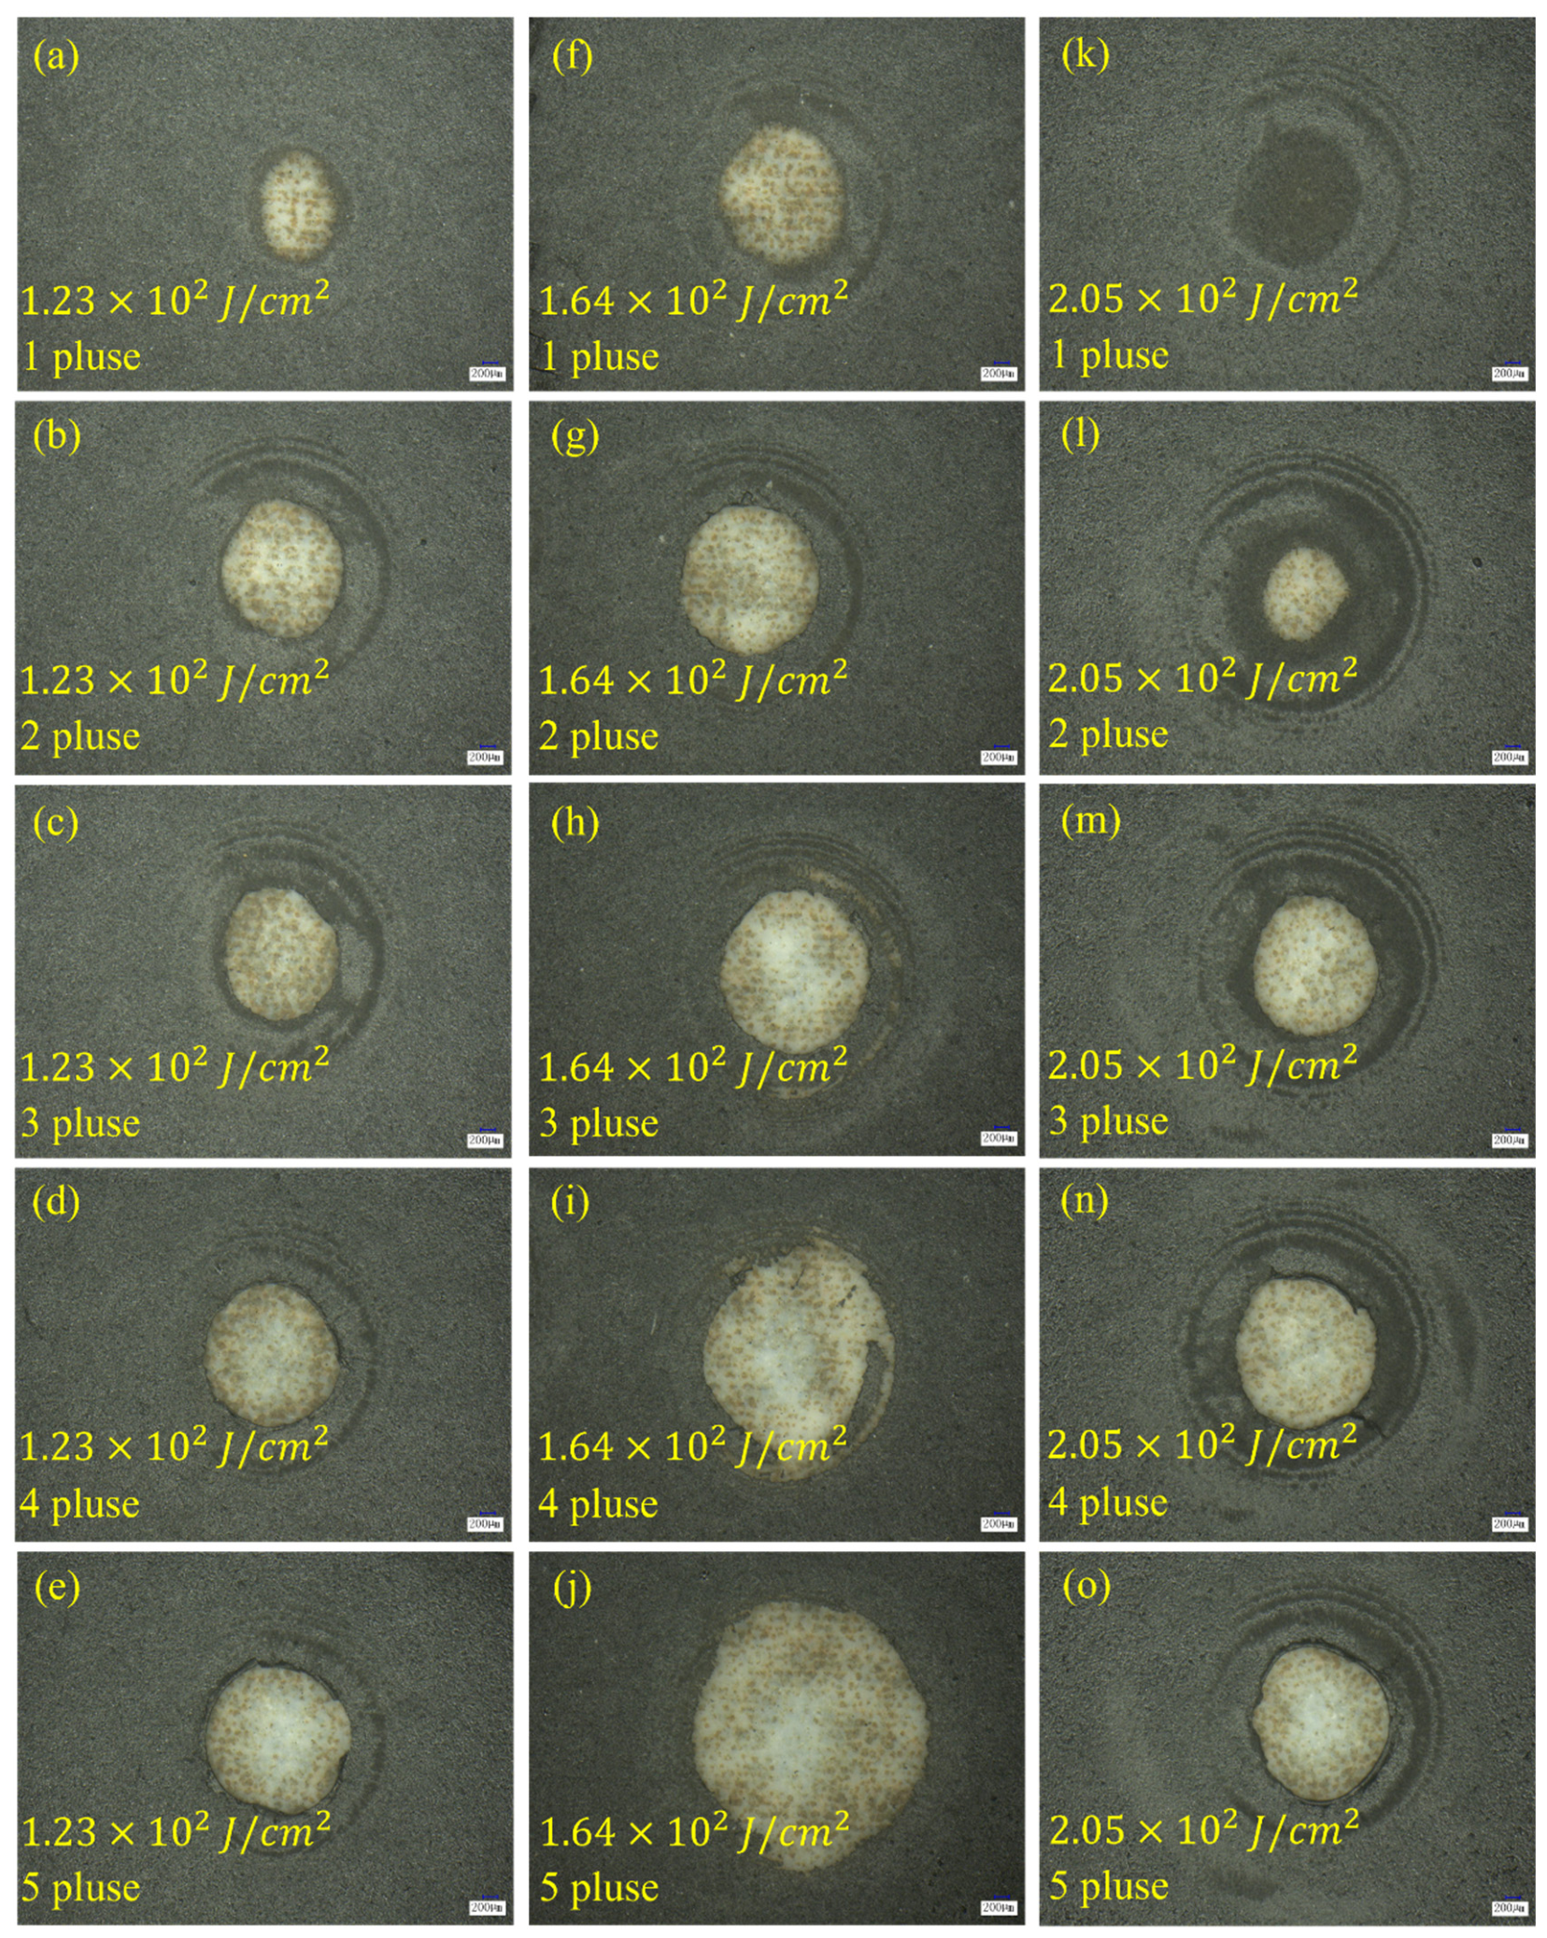
Macroscopic morphologies after laser cleaning at a 25 cm working distance, corresponding to a 788 μm spot diameter, under different fluences and pulse numbers. (a–e) 1.23 × 10² J/cm2 with 1–5 pulses; (f–j) 1.64 × 10² J/cm2 with 1–5 pulses; (k–o) 2.05 × 10² J/cm2 with 1–5 pulses.
Figure 5.
Macroscopic morphologies after laser cleaning at a 30 cm working distance, corresponding to a 1.57 mm spot diameter, under different fluences and pulse numbers. (a–e) 30.80 J/cm2 with 1–5 pulses; (f–j) 41.00 J/cm2 with 1–5 pulses; (k–o) 51.30 J/cm2 with 1–5 pulses.
At L = 25 cm, the spot diameter increased to about 788 μm, and the fluence decreased. Relatively effective cleaning was obtained at 1.23 × 10² J/cm2 with 1–3 pulses and at 1.64 × 10² J/cm2 with 1 pulse. These conditions removed most of the ink with less visible substrate modification than the 20 cm condition. Lower exposure left residual ink, whereas additional pulses or higher fluence produced whitening, depressions, and more obvious glaze damage.
At L = 30 cm, the spot diameter increased to approximately 1.57 mm. The cleaned regions became more elliptical, but the larger spot provided the widest controllable range. At 30.80 J/cm2, 2–4 pulses produced surfaces close to the pristine glaze in macroscopic appearance. One pulse was generally insufficient, while excessive pulse accumulation caused roughening or local damage.
The macroscopic comparison reveals a clear trade-off. The smallest spot area, approximately 0.0058 mm2, gave rapid removal but severe substrate modification. Increasing the spot area to about 0.49 or 1.94 mm2 lowered the average fluence and widened the usable range. The 1.94 mm2 conditions were selected for detailed SEM and EDS analysis. Increasing the nominal pulse energy to 1.0 J did not always increase the cleaned area. Visible beam-path emission and breakdown flashes appeared at the same time. This coincidence is consistent with possible energy loss before the target, but it is not direct evidence of plasma shielding. Shot-to-shot beam variation and plume–surface interaction may also contribute.
The macroscopic results can be summarized in three regimes: (i) insufficient cleaning, in which low fluence or too few pulses leave ink residue; (ii) effective cleaning, in which the ink is removed while the glaze remains close to its native appearance; and (iii) over-cleaning, in which excessive fluence or pulse accumulation produces whitening, depressions, or roughening. The 20 cm condition was excluded because of severe glaze damage. The most promising window occurred at L = 30 cm with moderate pulse accumulation.
4.2. Microscopic Morphology Evolution
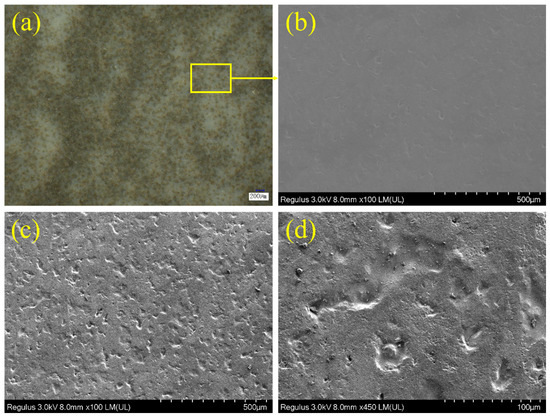
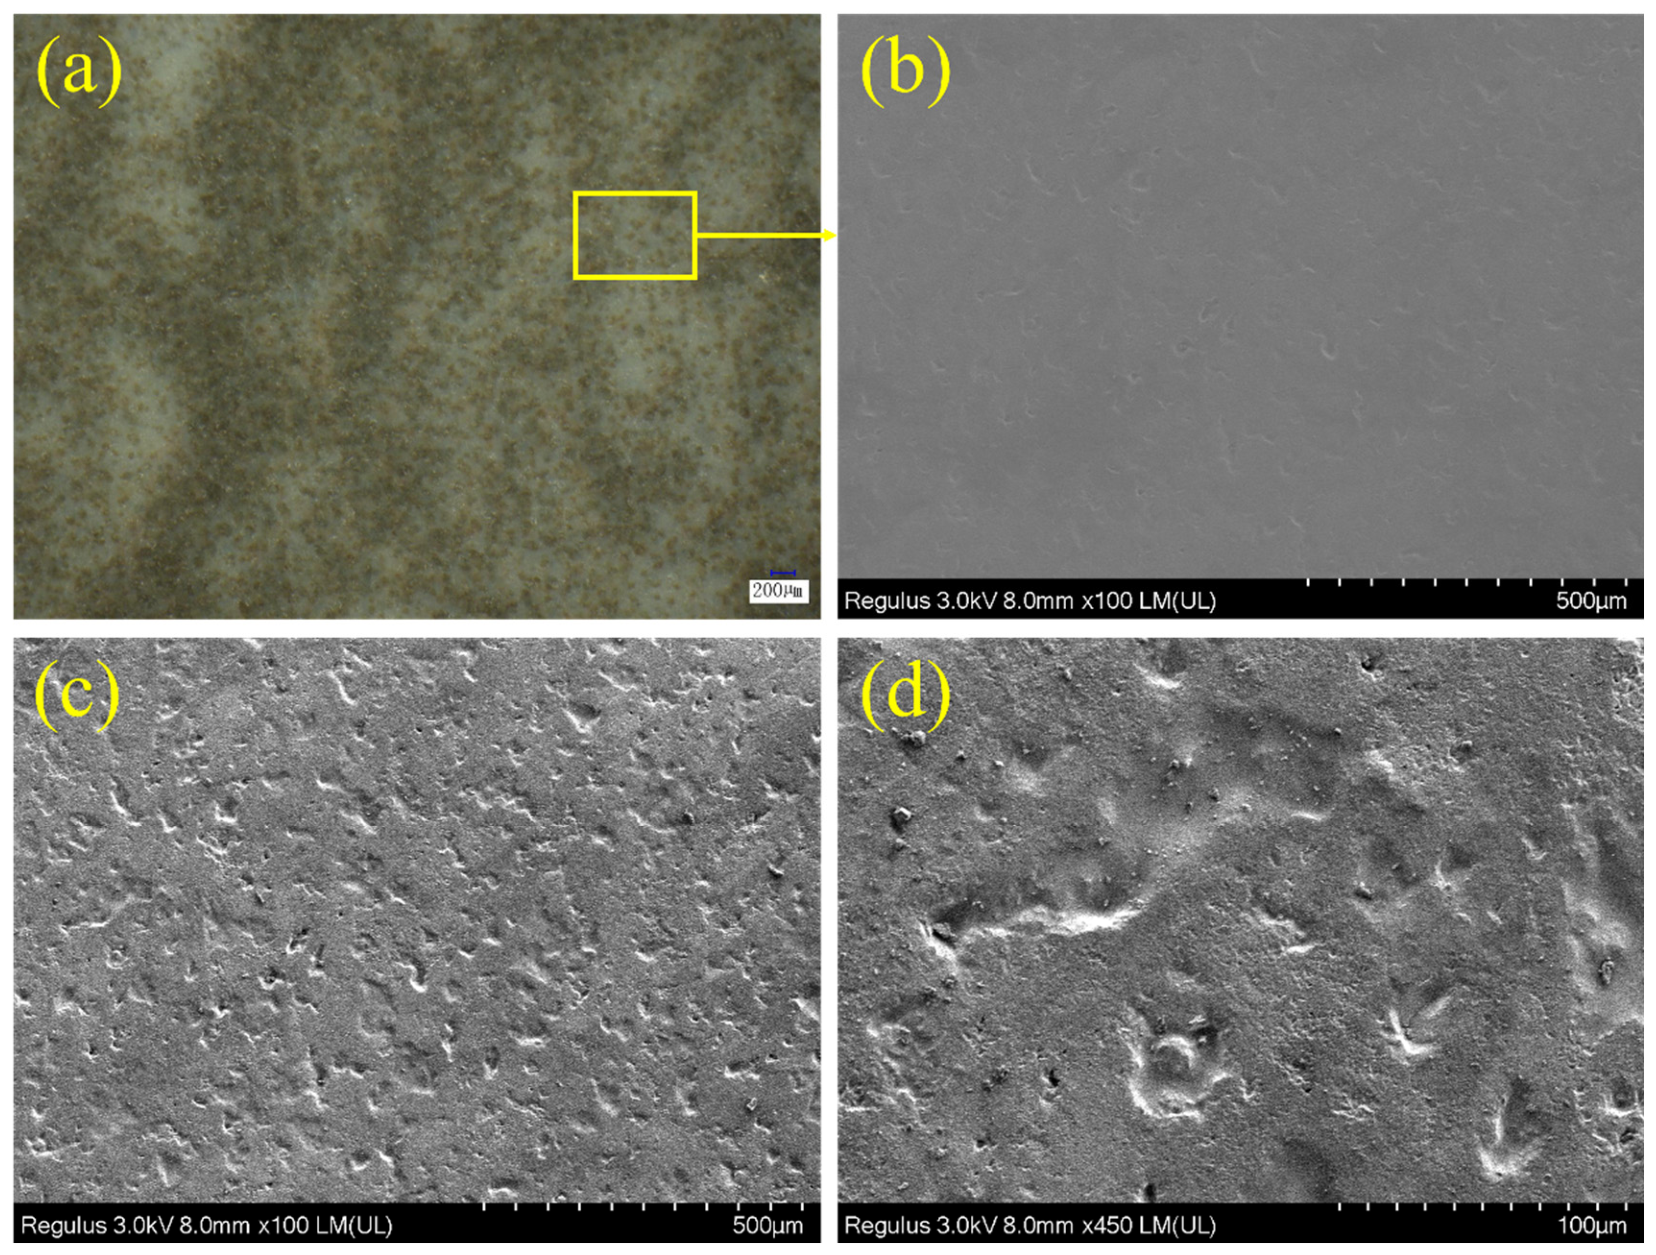
SEM was used to distinguish residual coating from actual glaze modification. Representative conditions were selected from the macroscopic screening: high-fluence cases documented damage, intermediate cases showed the transition toward controlled cleaning, near-optimal cases defined the practical window, and 1.0 J cases examined reduced cleaning when visible beam-path breakdown was present. The pristine glaze in Figure 6 contained protrusions, depressions, and pores, so successful cleaning was judged by similarity to this native structure rather than by smoothness alone. SEM cannot by itself verify plasma shielding or identify the origin of transient stress.
Figure 6.
SEM morphology of the pristine glazed ceramic surface. (a) Optical image of the original surface; (b,c) SEM images at different magnifications; (d) Enlarged view showing characteristic protrusions, depressions, and pores of the glaze layer.
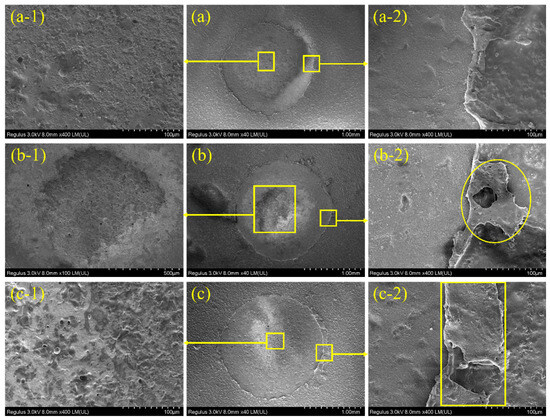
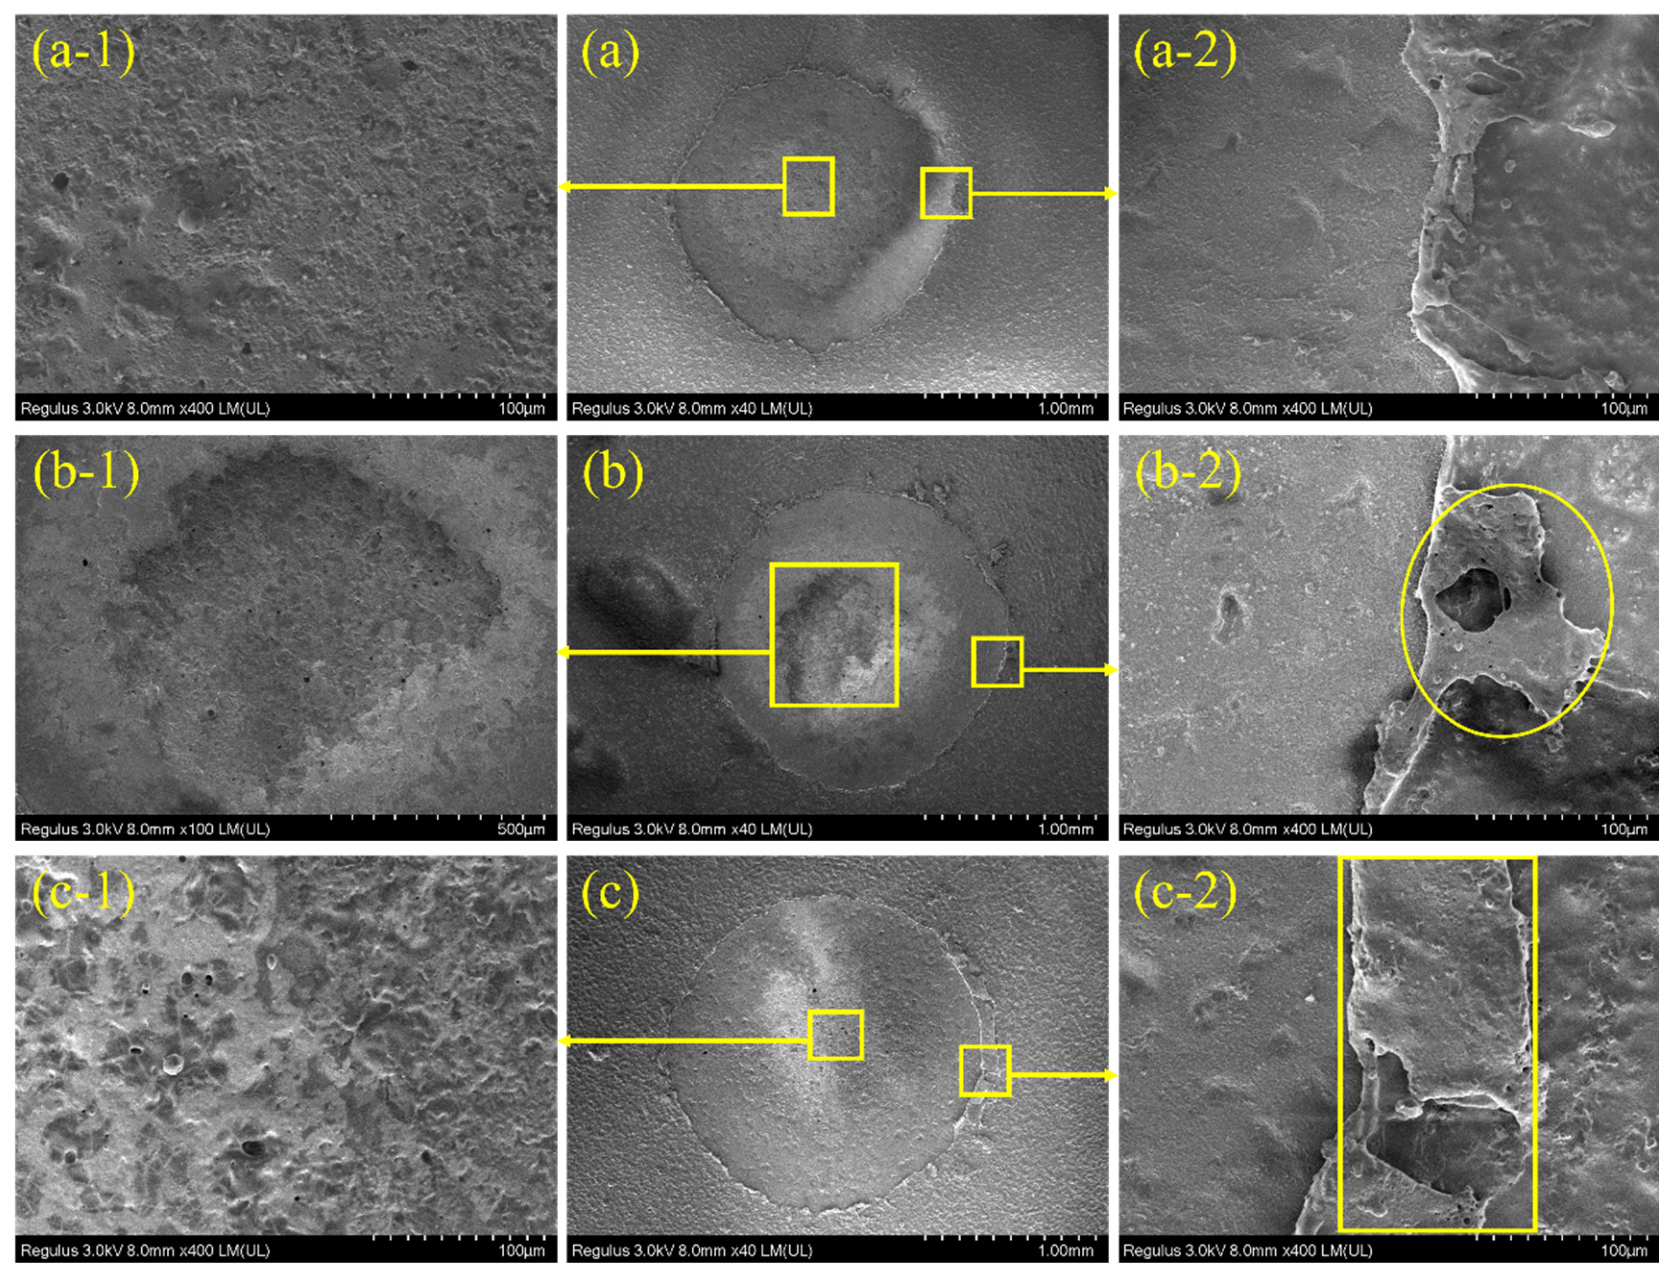
For the 86 μm spot, the fluence was approximately 1.03 × 10⁴ J/cm2 at 0.6 J (as shown in Figure 7). SEM confirmed that rapid ink removal was accompanied by severe substrate modification. Native protrusions disappeared from many cleaned centers and were replaced by pits, depressions, and rough damaged regions. As the pulse number increased, lifted or stacked ink fragments accumulated near the cleaning front. These features demonstrate interfacial or near-interfacial separation, but they do not distinguish thermoelastic loading from pressure-wave loading.
Figure 7.
SEM morphologies at an 86 μm spot diameter and 1.03 × 10⁴ J/cm2. (a–c) Overall morphologies after 2, 4, and 5 pulses, respectively. (a-1–c-1) Enlarged views of the cleaned centers. (a-2–c-2) Enlarged views of the cleaning boundaries, showing coating delamination, residual fragments, and micro-pit formation.
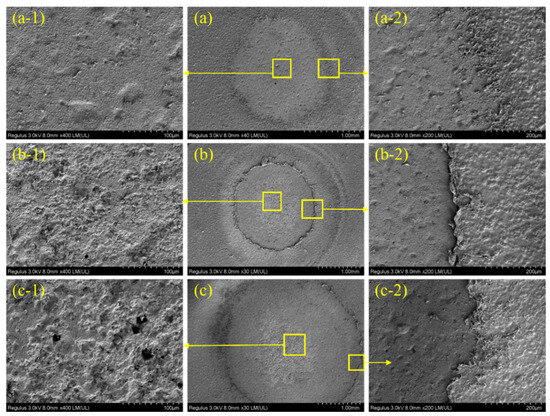
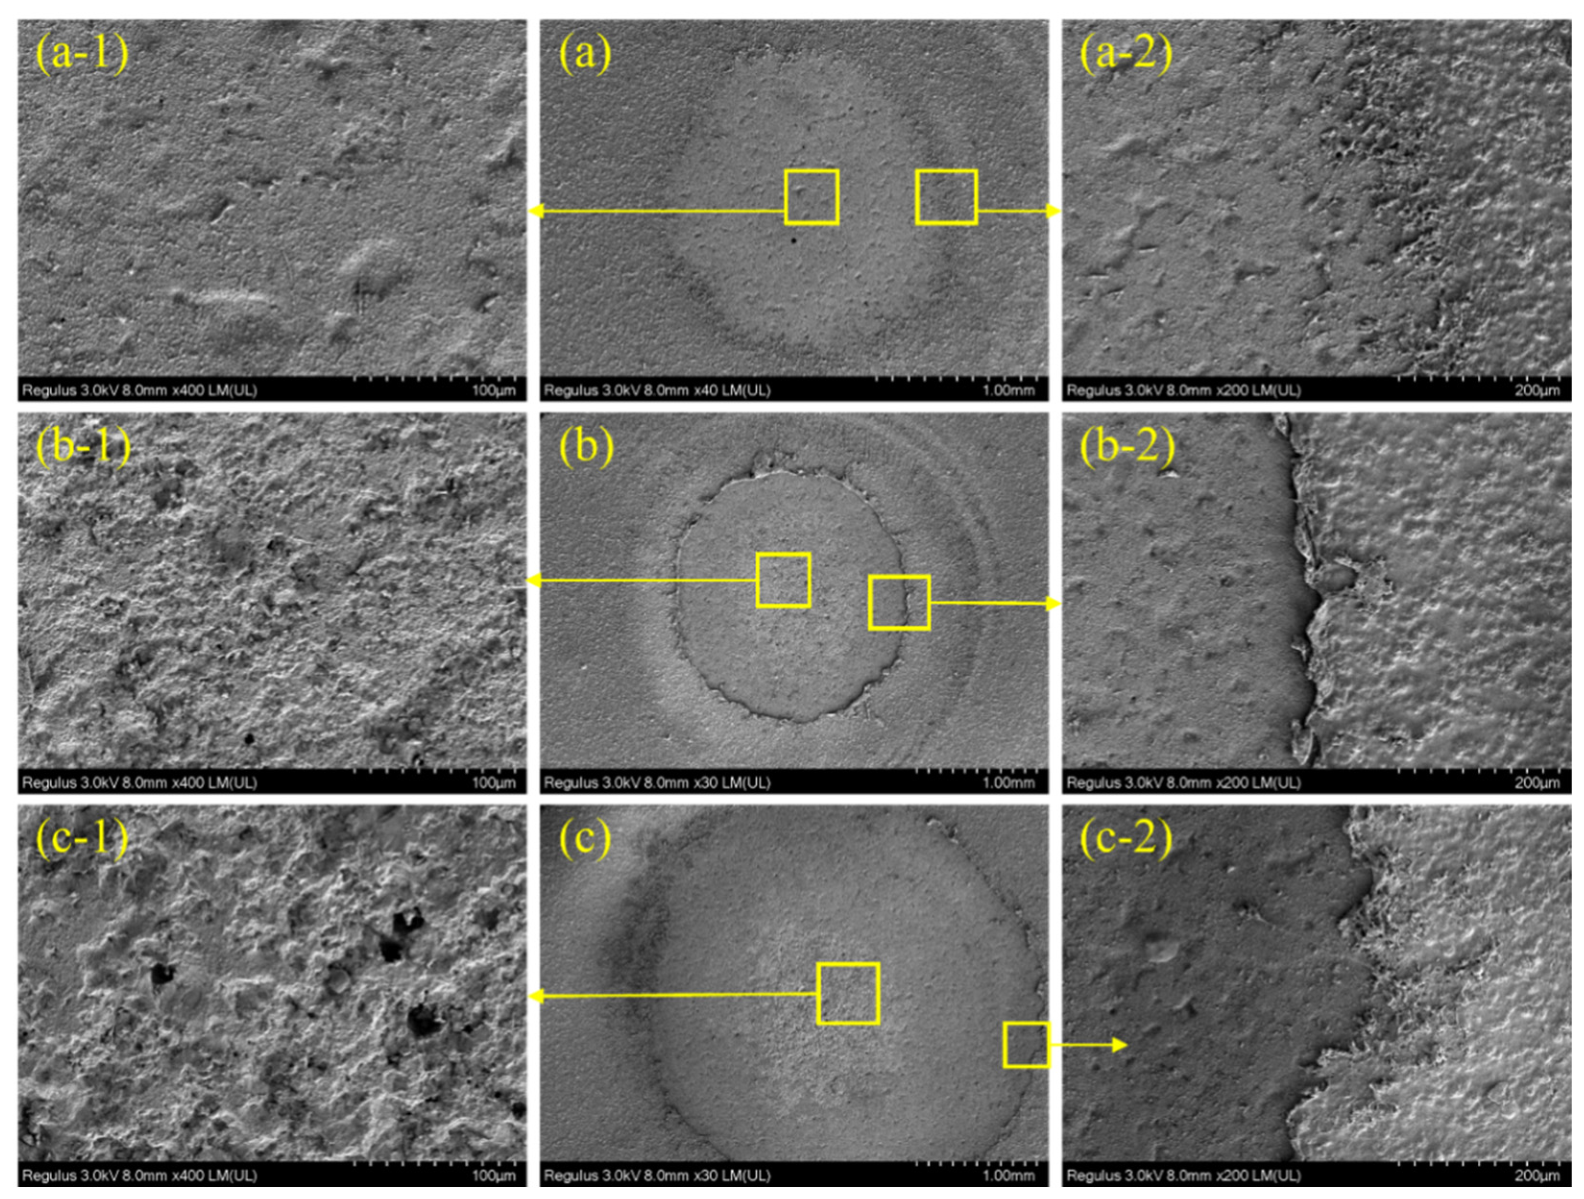
At 1.23 × 10² J/cm2 with a 788 μm spot (as shown in Figure 8), substrate damage was markedly lower than at the near-focus condition. One pulse produced a surface closest to the pristine glaze. Two and three pulses enlarged the cleaned area but also increased boundary contrast and local roughening. The sequence shows that pulse accumulation can improve removal and then begin to modify the exposed substrate.
Figure 8.
SEM morphologies at a 788 μm spot diameter and a fluence of 1.23 × 10² J/cm2 under different pulse numbers. (a–c) Overall SEM morphologies after 1, 2, and 3 pulses, respectively; (a-1–c-1) Enlarged views of the cleaned centers; (a-2–c-2) Enlarged views of the cleaning boundaries.
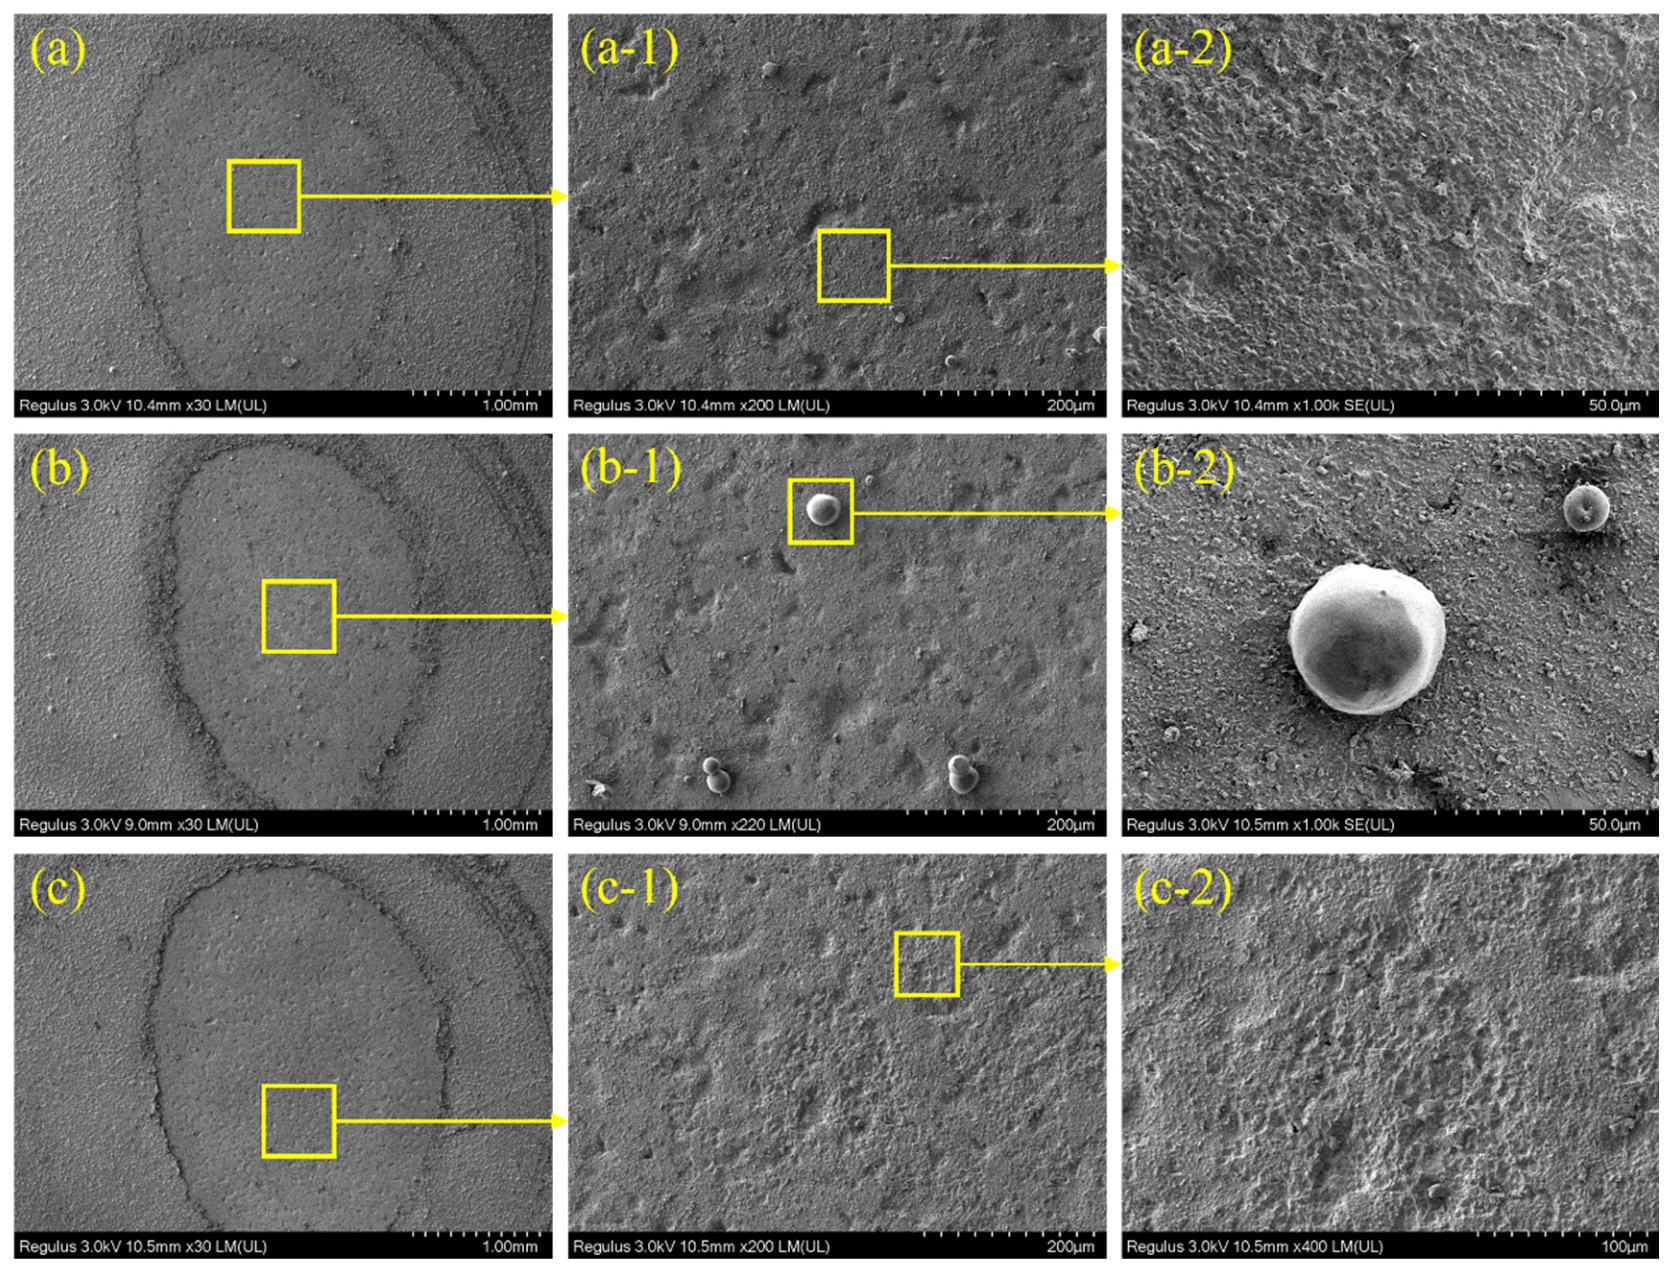
At 1.64 × 10² J/cm2 with the same 788 μm spot (as shown in Figure 9), one pulse again produced a surface close to the pristine glaze. Additional pulses enlarged the cleaned region but gradually intensified roughening. The five-pulse condition showed the clearest evidence of over-processing, confirming that the pulse number must be limited after the glaze becomes exposed.
Figure 9.
SEM morphologies after laser cleaning at a 788 μm spot diameter and a fluence of 1.64 × 10² J/cm2. (a–c) Overall morphologies after 1, 2, and 5 pulses, respectively; (a-1–c-1) enlarged views of the cleaned centers; (a-2–c-2) enlarged views of the cleaning boundaries, showing progressive enlargement of the cleaned region and increased surface roughening with pulse number.
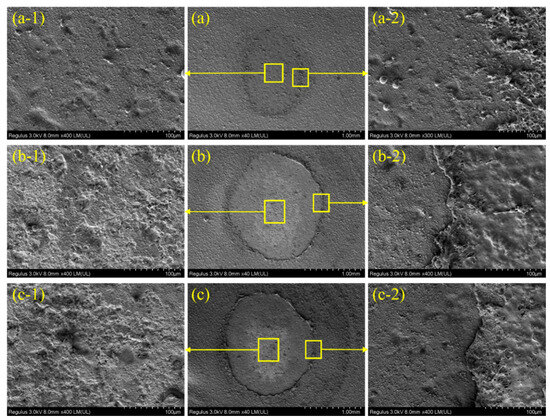
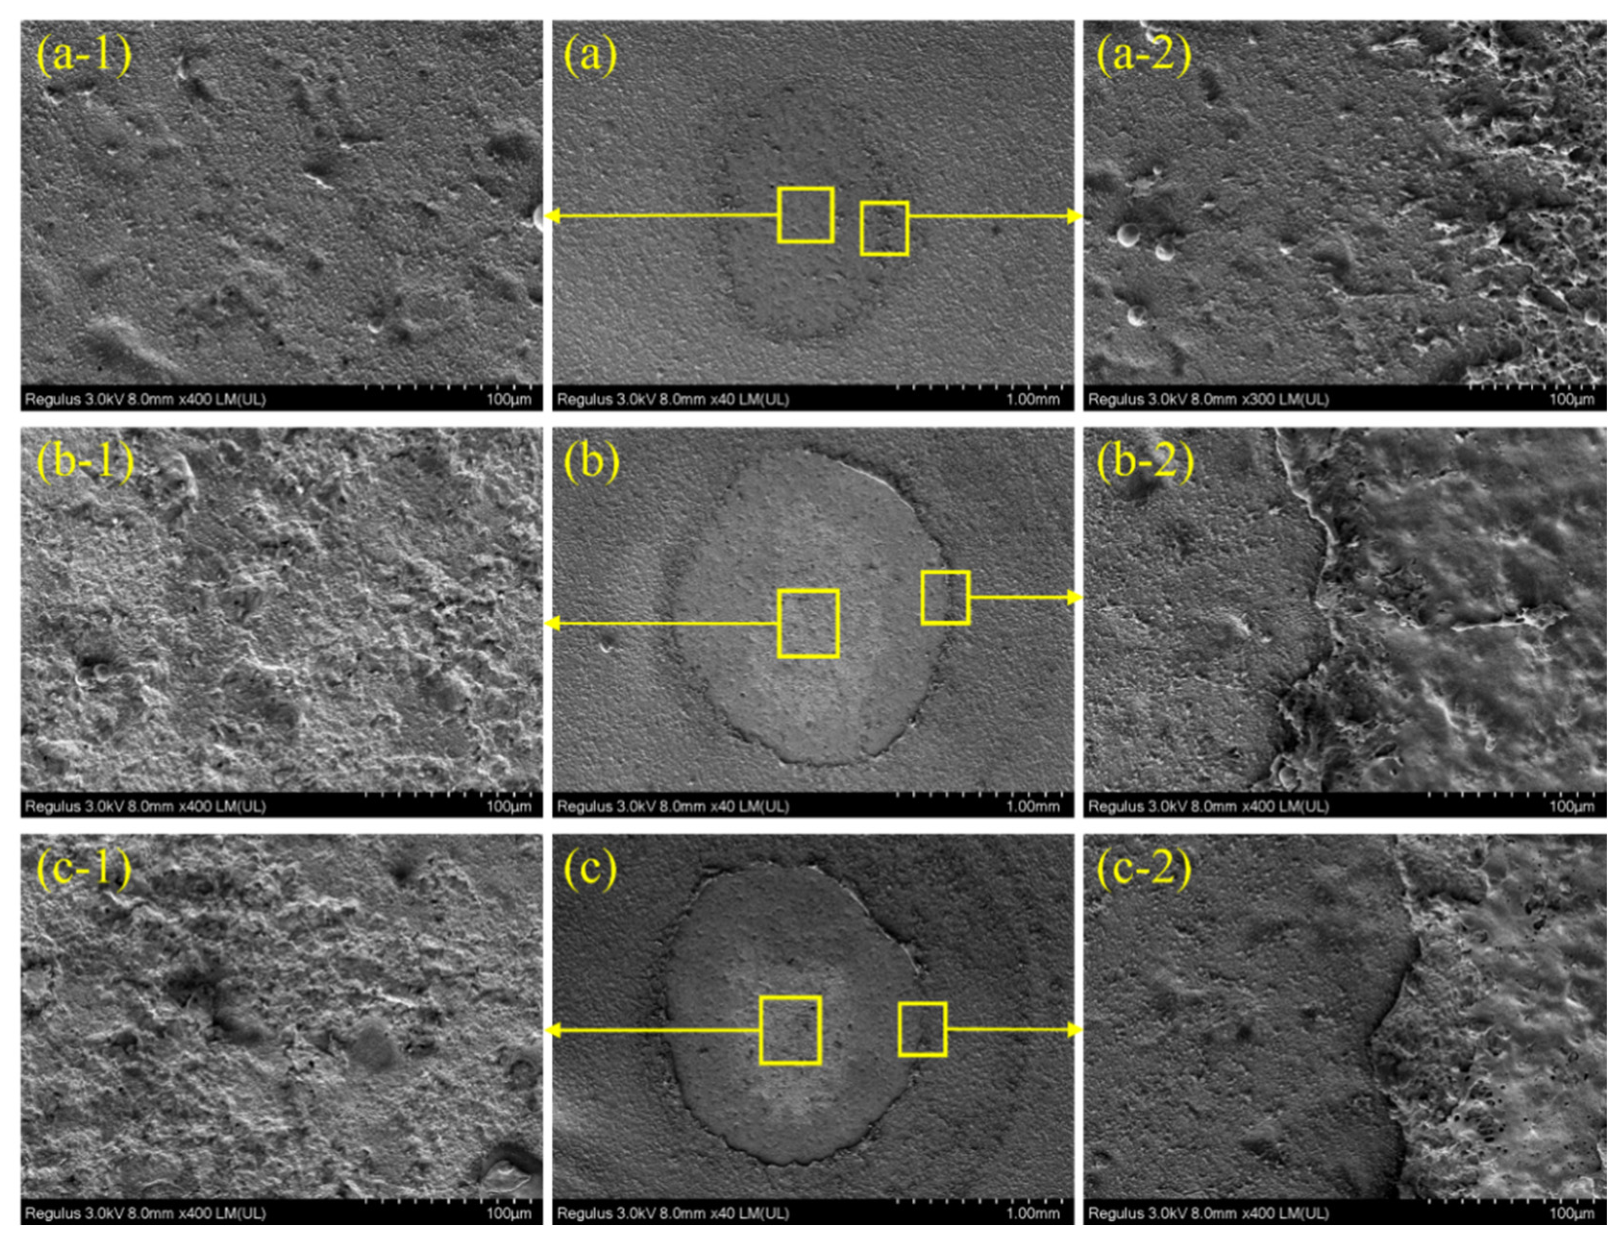
At 30.80 J/cm2 with the 1.57 mm spot (as shown in Figure 10), the cleaned region developed progressively as the pulse number increased from 2 to 4.
Figure 10.
SEM morphologies after laser cleaning at a 1.57 mm spot diameter and a fluence of 30.80 J/cm2. (a–c) Overall morphologies after 2, 3, and 4 pulses, respectively; (a-1–c-1) enlarged views of the cleaned centers; (a-2–c-2) enlarged views of the cleaning boundaries, showing gradual deepening of the cleaned region and increased substrate modification with pulse accumulation.
Two pulses left more residual material, whereas three pulses exposed a surface close to the original glaze with limited modification. Four pulses produced a larger depression and more obvious damage. This sequence identifies three pulses as the best balance for this fluence.
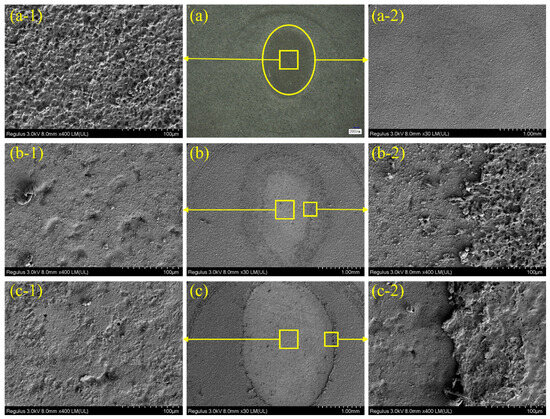
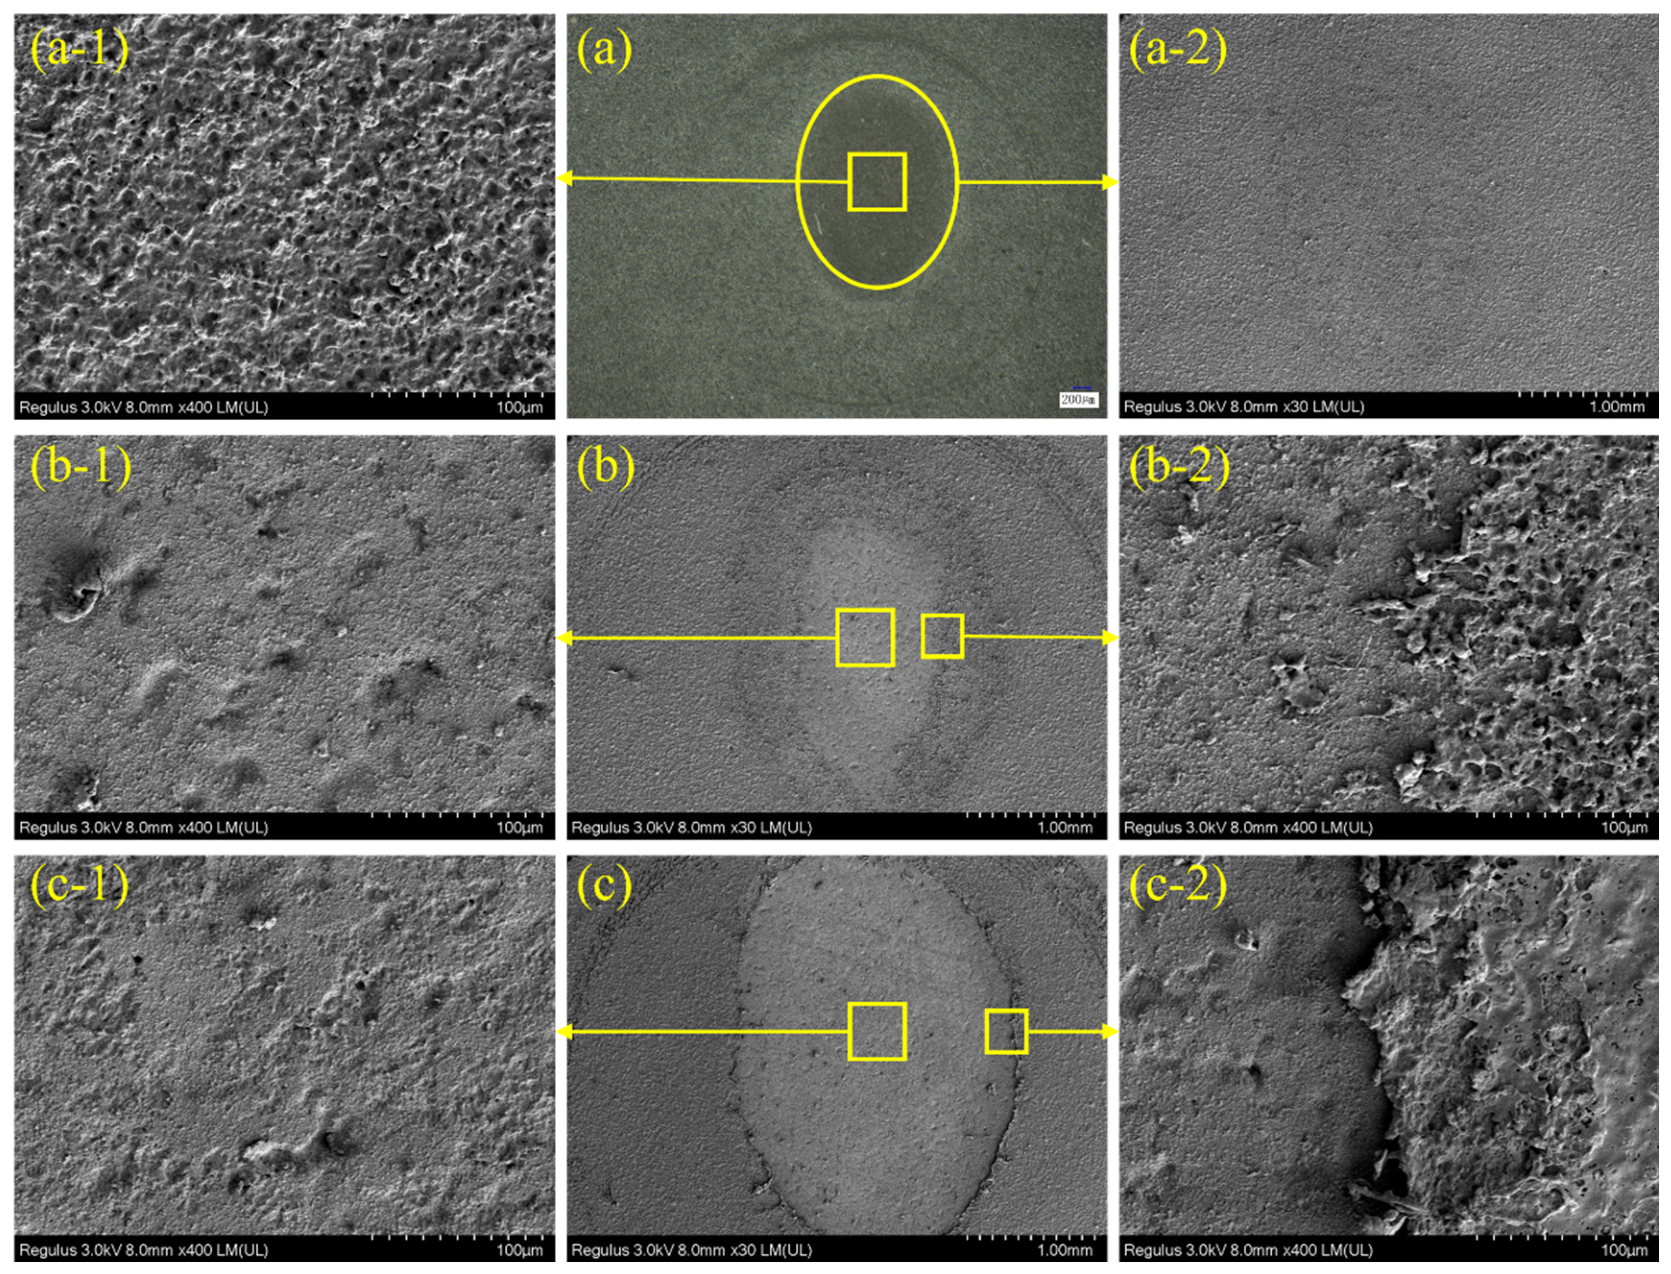
At 41.00 J/cm2 with the 1.57 mm spot (as shown in Figure 11), one pulse was insufficient, two pulses exposed a surface close to the pristine glaze, and five pulses caused stronger roughening and boundary contrast. The higher fluence therefore required fewer pulses but also reduced the margin before over-cleaning.
Figure 11.
SEM morphologies after laser cleaning at a 1.57 mm spot diameter and a fluence of 41.00 J/cm2. (a–c) Overall morphologies after 1, 2, and 5 pulses, respectively; (a-1–c-1) enlarged views of the cleaned centers; (a-2–c-2) enlarged views of the cleaning boundaries, showing incomplete ink removal after one pulse, effective substrate exposure after two pulses, and increased roughening and boundary contrast after five pulses.
Smooth spherical particles were observed in some regions processed with the 1.57 mm spot. Their shape is consistent with localized melting, ejection, and resolidification of acrylic-derived material, but their chemical phase was not independently identified. They are therefore described as redeposited carbon-containing particles rather than assigned to a specific compound.
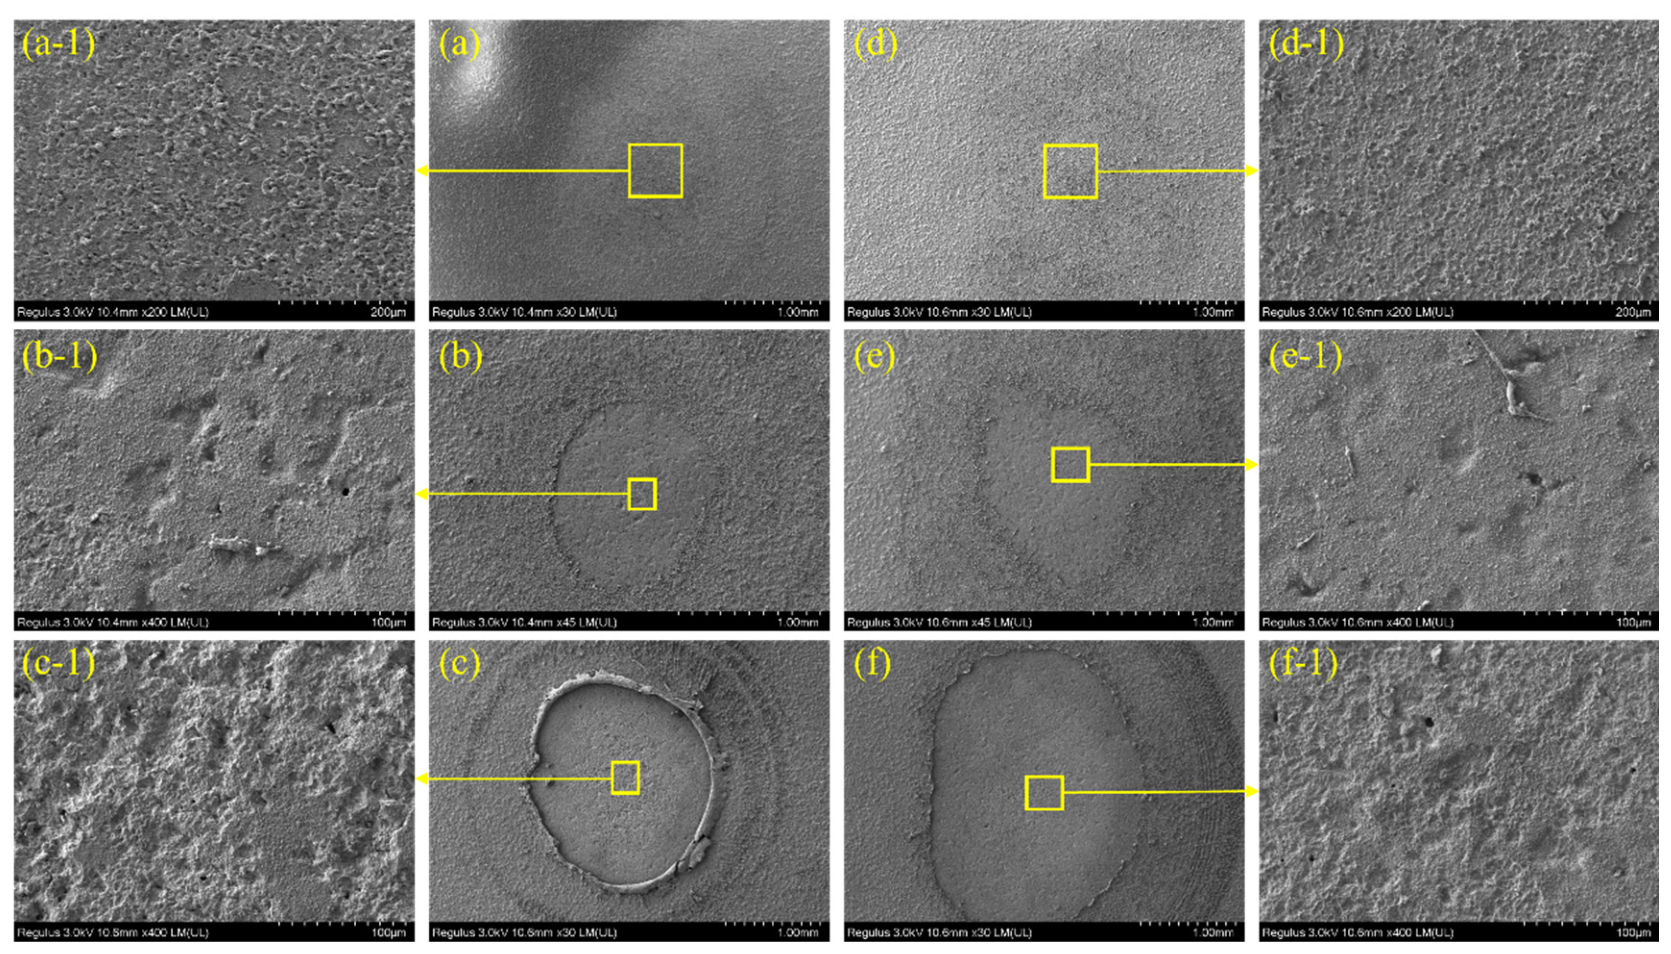
The 1.0 J comparison in Figure 12 is consistent with possible beam-path attenuation, but it does not verify plasma shielding.
Figure 12.
SEM morphologies after laser cleaning at 1.0 J pulse energy. (a) 788 μm spot diameter, 1 pulse; (a-1) enlarged view of the boxed region in (a); (b) 788 μm spot diameter, 2 pulses; (b-1) enlarged view of the boxed region in (b); (c) 788 μm spot diameter, 5 pulses; (c-1) enlarged view of the boxed region in (c); (d) 1.57 mm spot diameter, 1 pulse; (d-1) enlarged view of the boxed region in (d); (e) 1.57 mm spot diameter, 2 pulses; (e-1) enlarged view of the boxed region in (e); (f) 1.57 mm spot diameter, 5 pulses; (f-1) enlarged view of the boxed region in (f). Reduced cleaning was observed with visible air breakdown, possibly due to plasma shielding.
Although the nominal pulse energy was higher, the exposed ceramic area could be smaller than at lower pulse energy. Together with visible beam-path breakdown, this result shows that nominal energy does not necessarily equal the energy delivered to the target. The observed morphology alone cannot identify the attenuation mechanism. Direct confirmation would require transmitted-energy measurement and time-resolved plasma diagnostics.
Taken together, the SEM results explain the selection of the final process window. Low pulse numbers leave residual ink, intermediate pulse numbers recover a surface close to the native glaze, and excessive pulse accumulation produces particles, pits, depressions, or roughened boundaries. The best SEM-supported conditions were 30.80 J/cm2 with 3 pulses and 41.00 J/cm2 with 2 pulses.
4.3. Elemental Composition Analysis
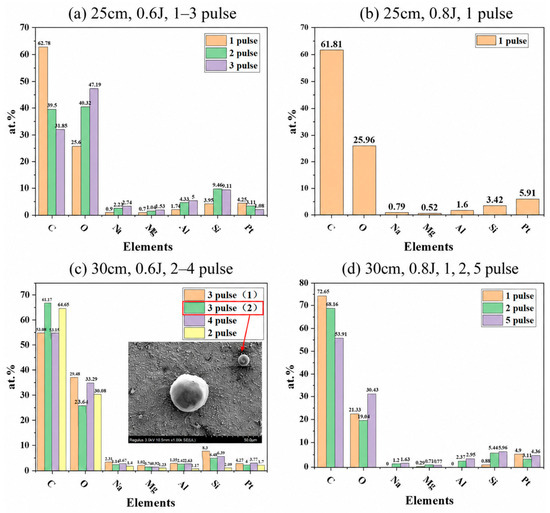
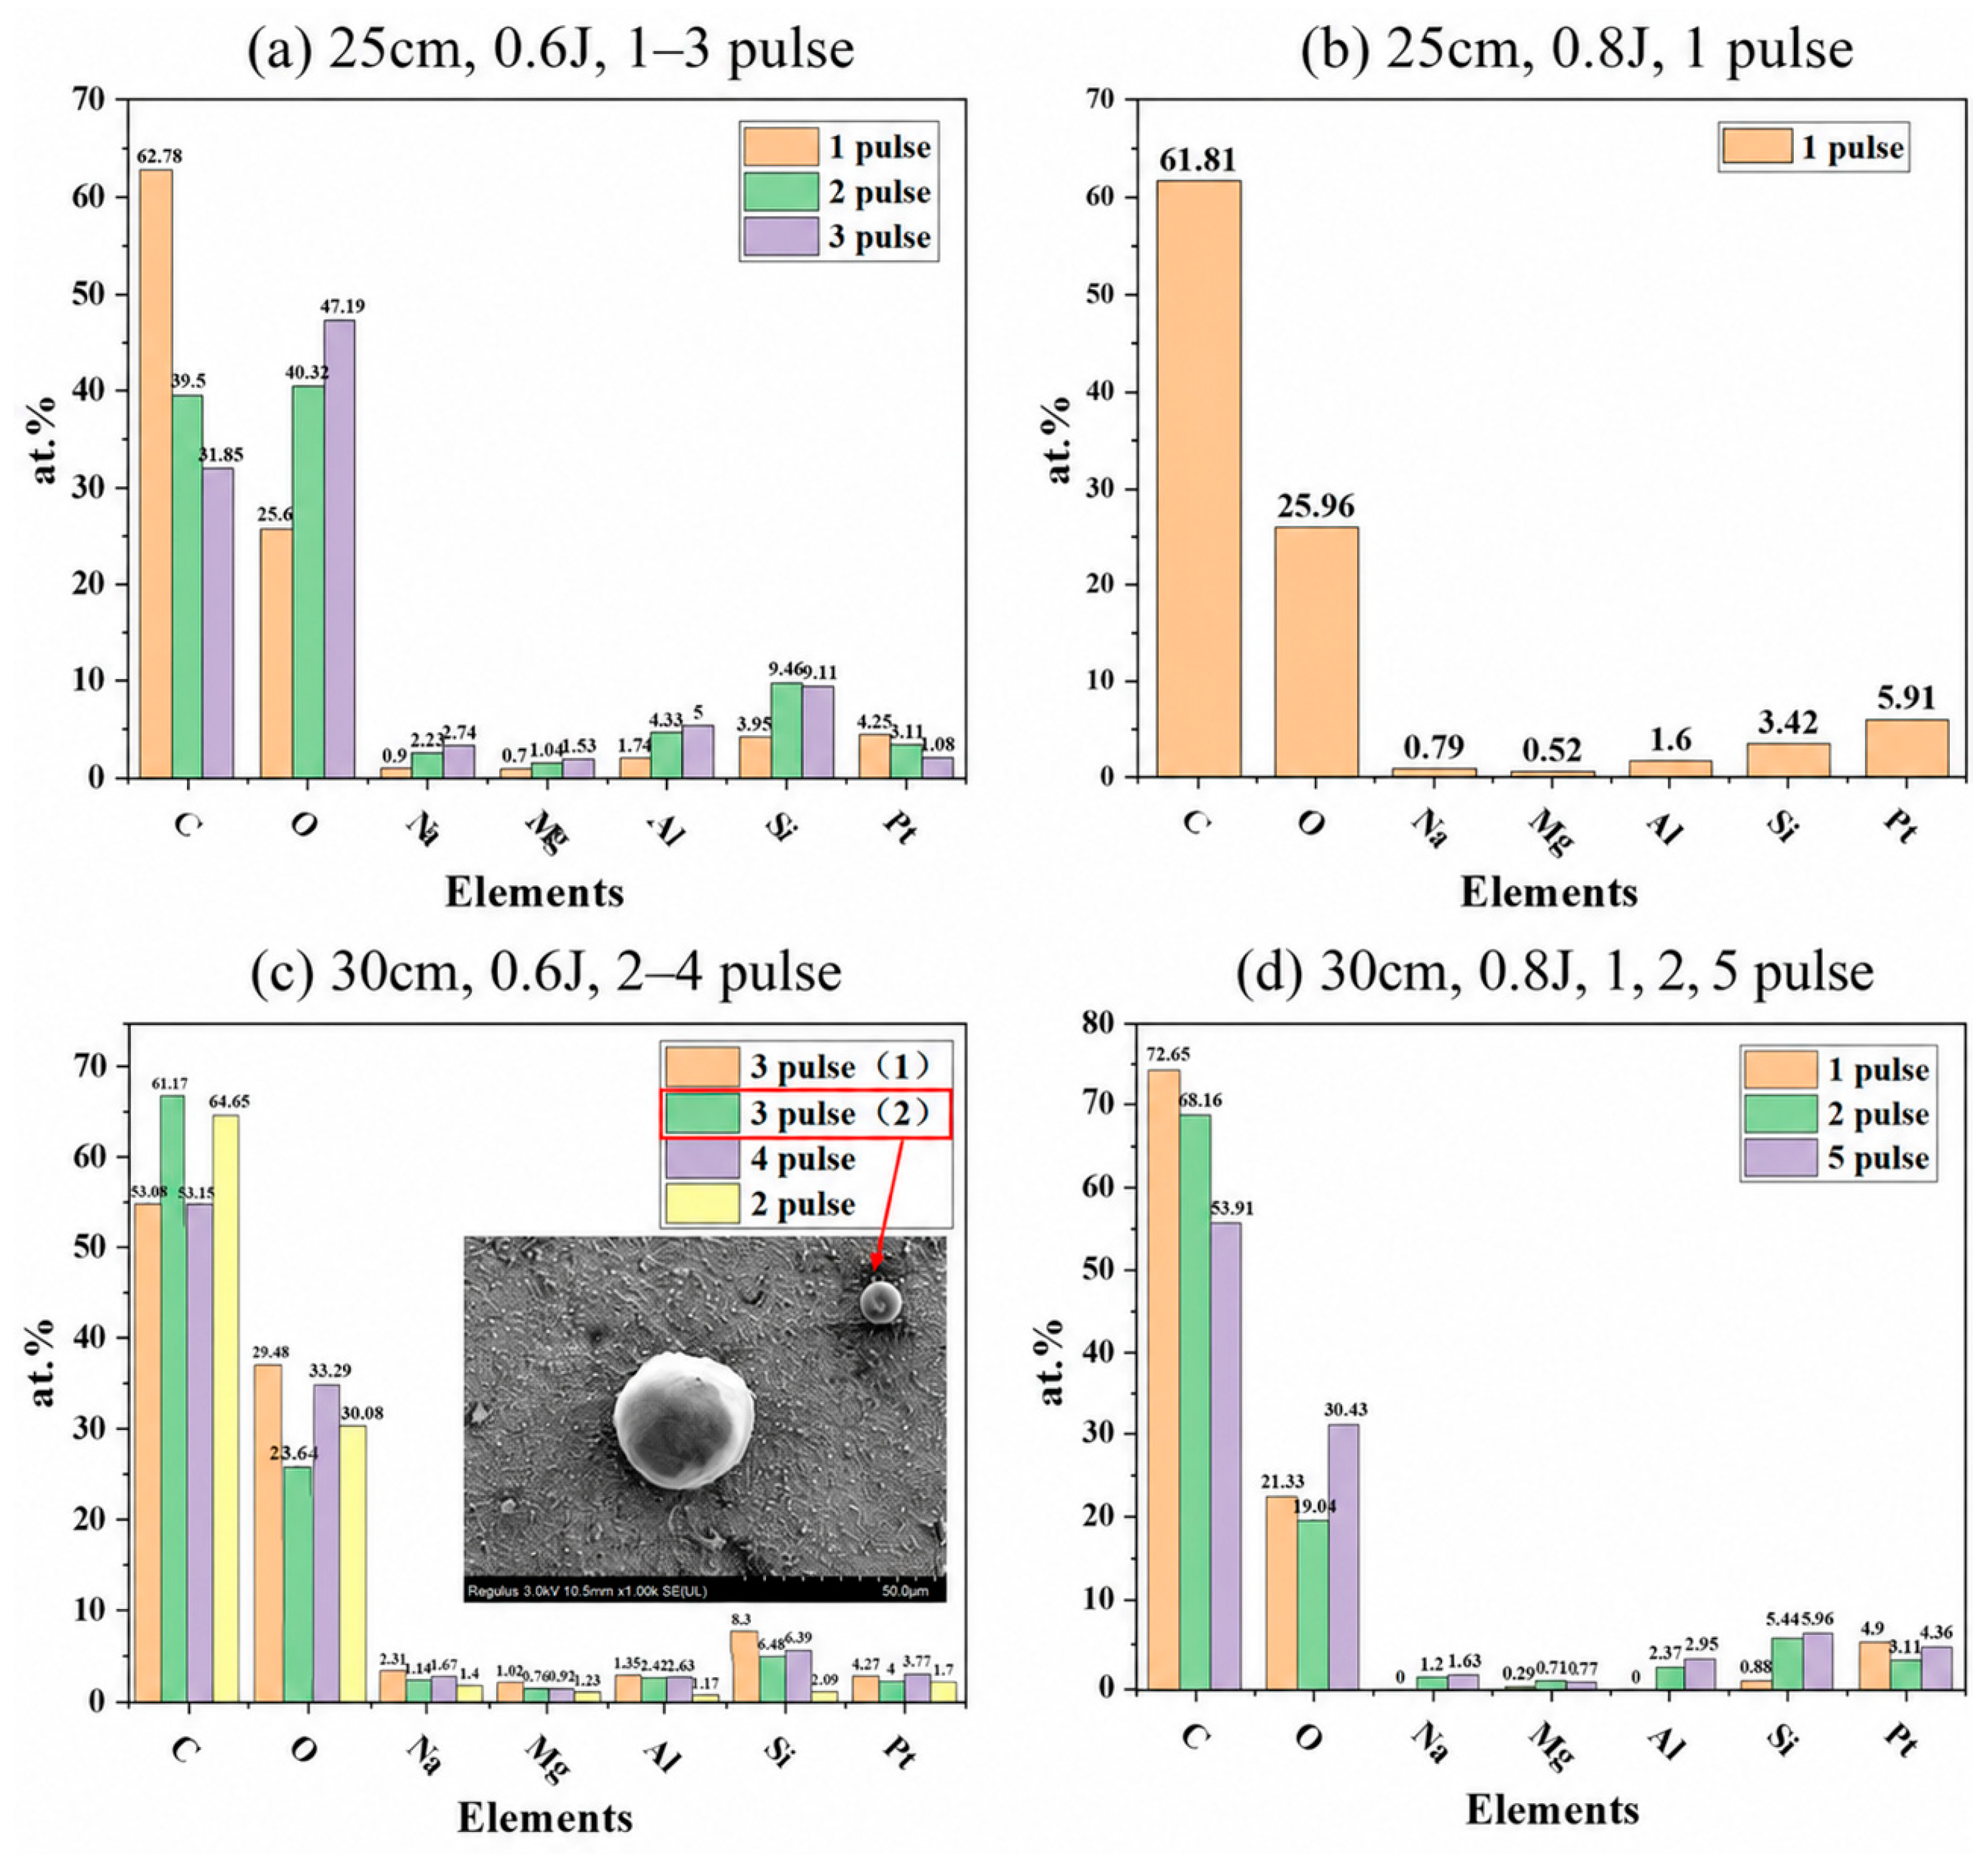
EDS was used to compare the pristine glaze with representative cleaned regions selected from the SEM analysis (as shown in Figure 13). The purpose was not to analyze every pulse condition, but to determine whether surfaces with similar macroscopic appearance differed in residual carbon or recovery of substrate-related elements.
Figure 13.
EDS elemental composition of the pristine glazed ceramic substrate.
The selected EDS measurements served three comparisons. First, the pristine glaze provided the reference C/O ratio and substrate-element pattern. Second, incompletely cleaned regions showed whether visually dark areas retained carbon-rich material. Third, near-optimal and over-cleaned regions showed whether a lower carbon signal was accompanied by recovery of the native substrate composition or by damage-related elemental deviation. This approach avoids treating any single EDS value as a complete measure of cleaning quality.
Figure 14 confirms that residual carbon content alone is not sufficient to identify the optimum. Some regions with low carbon still showed SEM evidence of surface damage or deviations in substrate-related elements, which indicates over-cleaning. Other regions retained more carbon because the ink was only partly removed or because carbon-containing material was redeposited. Cleaning quality must therefore be evaluated by combining morphology, microstructural preservation, C/O ratio, and recovery of substrate-related elements. Because EDS cannot determine carbon bonding, Raman spectroscopy or XPS would be required to identify the chemical state of the residue.
Figure 14.
EDS elemental compositions of selected laser-cleaned regions, showing residual carbon and substrate-element changes under different cleaning conditions.
Among the tested conditions, 30.80 J/cm2 with 3 pulses gave the closest overall agreement with the pristine morphology and substrate-related elemental pattern. The 41.00 J/cm2, 2-pulse condition also preserved a glaze-like morphology but showed a small compositional deviation. These two combinations define the low-damage process window, with the 30.80 J/cm2, 3-pulse condition providing the best multi-indicator balance.
4.4. Applicability and Limitations
The reported process window is specific to the tested acrylic ink, glazed ceramic tile, 1064 nm nanosecond laser, and single-spot irradiation geometry. It should not be presented as a universal laser-cleaning recipe. Its broader value is methodological: measure the spot size, calculate the corresponding fluence, screen the macroscopic response, verify the exposed surface by SEM and EDS, and interpret mechanisms according to the strength of the available evidence.
In practice, the optimum depends on coating thickness, pigment and filler content, adhesion strength, surface roughness, porosity, optical absorption, thermal conductivity, and the thermal-shock resistance of both the contaminant and the substrate. These factors can change the removal threshold, damage threshold, redeposition tendency, and number of pulses required. Consequently, an ideal solution based on only two or three process variables is difficult to justify while the relative contributions of thermal decomposition, thermoelastic stress, pressure-wave loading, and plasma-related attenuation remain incompletely resolved.
Thicker or more strongly adhered coatings may require higher effective fluence, repeated scanning, or greater pulse overlap, but these changes also increase the risks of overheating, redeposition, microcracking, and glaze degradation. More fragile substrates require a lower fluence and tighter control of pulse accumulation. Future work should therefore combine transmitted-energy measurement, time-resolved plasma diagnostics, direct pressure or acoustic measurements, surface-temperature measurement, and chemical-state analysis by Raman spectroscopy or XPS. These measurements would help separate the competing mechanisms and support transferable process optimization.
5. Conclusions
This study linked working distance, measured spot size, fluence, and pulse number to the cleaning quality of acrylic ink on glazed ceramic tiles. Near the nominal focal plane at L = 20 cm, the high fluence removed the ink rapidly but also caused whitening, pits, depressions, and severe glaze modification. Increasing L enlarged the spot and improved process control. The best multi-indicator condition was 30.80 J/cm2 with 3 pulses at L = 30 cm; 41.00 J/cm2 with 2 pulses provided a second low-damage combination. OM, SEM, and EDS showed that no single metric was sufficient. Reliable evaluation required the exposed-area morphology, preservation of the native glaze microstructure, C/O ratio, and recovery of substrate-related elements to be considered together. The simulations showed that localized acrylic decomposition and substantial thermoelastic stress were physically plausible under the low-damage conditions. However, the present evidence does not determine the relative contributions of thermoelastic stress and pressure-wave loading. Visible beam-path breakdown and reduced cleaning at high pulse energy are consistent with possible plasma-related attenuation, but this mechanism was not measured directly. The reported parameters should therefore be treated as a system-specific process window and as a practical workflow for balancing removal efficiency with substrate preservation, not as a universal optimum.
Author Contributions
Conceptualization, A.L.; methodology, H.Z.; software, K.Y.; validation, T.L.; supervision, J.H. All authors have read and agreed to the published version of the manuscript.
Funding
National MCF Energy R&D Program (2024YFE03190004); Innovation Center for Special Optical Glass Materials Technology (CXZX-TZGXBL-KYJJ-2025-06).
Data Availability Statement
The data supporting the findings of this study are available within the article.
Conflicts of Interest
The authors declare no conflicts of interest.
References
- Cedillo-González, E.I.; Chierici, P.; Buttazzo, M.; Siligardi, C.; Blasi, E.; Ardizzoni, A. Correlating the physico-chemical properties of two conventional glazed porcelain stoneware tiles in relation to cleanability and sanitization. Mater. Today Commun. 2023, 34, 105191. [Google Scholar] [CrossRef] [Scilit] [PubMed]
- Nieves, L.J.; Nastri, S.; Lot, A.V.; Melchiades, F.G.; Marsola, G.A.; Flauzino, I.S.; Innocentini, M.D.M.; Boschi, A.O. Influence of engobe and glaze layers on the evolution of porosity and permeability of single-fired porcelain tiles. Appl. Clay Sci. 2022, 228, 106635. [Google Scholar] [CrossRef] [Scilit]
- Yıldız, B. Effect of particle size distribution on the properties of celsian based glazes. J. Aust. Ceram. Soc. 2024, 60, 1495–1504. [Google Scholar] [CrossRef] [Scilit]
- Suzuki, A.; Riminesi, C.; Ricci, M.; Vettori, S.; Salvadori, B. Testing of a new Yb: YAG fiber laser system for the removal of graphic vandalism from marble. Herit. Sci. 2023, 11, 132. [Google Scholar] [CrossRef] [Scilit]
- Bian, T.; Bai, Y.; Yu, L.; Xu, Z. Laser cleaning of paint layers on white marble surface based on cooperative use of laser-induced breakdown spectroscopy and image binarization. J. Cult. Herit. 2023, 62, 124–133. [Google Scholar] [CrossRef] [Scilit]
- Fang, C.; Hu, T.; Pu, Z.; Li, P.; Wu, T.; Jiang, J.; Sun, A.; Zhang, Y. Effect of laser cleaning parameters on surface filth removal of porcelain insulator. Photonics 2023, 10, 269. [Google Scholar] [CrossRef] [Scilit]
- Tam, A.C.; Leung, W.P.; Zapka, W.; Ziemlich, W. Laser-cleaning techniques for removal of surface particulates. J. Appl. Phys. 1992, 71, 3515–3523. [Google Scholar] [CrossRef] [Scilit]
- Zhu, G.; Xu, Z.; Jin, Y.; Chen, X.; Yang, L.; Xu, J.; Shan, D.; Chen, Y.; Guo, B. Mechanism and application of laser cleaning: A review. Opt. Lasers Eng. 2022, 157, 107130. [Google Scholar] [CrossRef] [Scilit]
- Zhou, Z.; Sun, W.; Wu, J.; Chen, H.; Zhang, F.; Wang, S. The fundamental mechanisms of laser cleaning technology and its typical applications in industry. Processes 2023, 11, 1445. [Google Scholar] [CrossRef] [Scilit]
- Hou, L.; Yin, F.; Wang, S.; Sun, J.; Yin, H. A review of thermal effects and substrate damage control in laser cleaning. Opt. Laser Technol. 2024, 174, 110613. [Google Scholar] [CrossRef] [Scilit]
- Li, Z.; Wang, S.; Zheng, W.; Wang, Y.; Pan, Y. A review of dynamic monitoring technology and application research of laser cleaning interface. Measurement 2024, 238, 115311. [Google Scholar] [CrossRef] [Scilit]
- Li, J.; Yang, J.; Liu, J.; Chen, H.; Duan, Y.; Pan, X. Research on laser cleaning technology for aircraft skin surface paint layer. Materials 2024, 17, 2414. [Google Scholar] [CrossRef] [Scilit] [PubMed]
- Huang, X.; Shen, Y.; He, Z.; Tao, J.; Shu, S.; Xiong, W.; Shen, Z. Multi-perspective evaluations of laser-removal quality of acrylic polyurethane coatings on aluminum alloy substrate. Coatings 2023, 13, 359. [Google Scholar] [CrossRef] [Scilit]
- Zhang, T.; Liu, T.; Ban, G.; Zou, J.; Zhang, Z.; Liu, Y.; Zhong, C. Effect of scanning speed on laser cleaning of composite paint layer on aluminum alloy. Opt. Laser Technol. 2024, 171, 110470. [Google Scholar]
- Li, Y.; Li, J.; Dong, H.; Zhang, W.; Jin, G. Mechanism of paint removal by nanosecond pulsed laser plasma shock: Simulation and experiment. Appl. Opt. 2023, 62, 2855–2861. [Google Scholar] [CrossRef] [Scilit] [PubMed]
- Li, Y.; Li, J.; Dong, H.; Zhang, W.; Jin, G. Simulation and experimental study of nanosecond pulse laser removal of epoxy paint on 6061 aluminum alloy surface. Photonics 2024, 11, 25. [Google Scholar] [CrossRef] [Scilit] [PubMed]
- Li, S.; He, C.; Xie, N.; Xiao, J.; Zhao, J.; Han, J.; Feng, G.; Song, Q. The spatial phase transition of micro/nano particles and its effect on the cleaning efficiency of laser-plasma shock wave cleaning. Sci. Rep. 2023, 13, 14517. [Google Scholar] [CrossRef] [Scilit] [PubMed]
- Lee, J.M.; Watkins, K.G. Removal of small particles on silicon wafer by laser-induced airborne plasma shock waves. J. Appl. Phys. 2001, 89, 6496–6500. [Google Scholar] [CrossRef] [Scilit]
- Mao, X.; Chan, W.T.; Caetano, M.; Shannon, M.A.; Russo, R.E. Preferential vaporization and plasma shielding during nano-second laser ablation. Appl. Surf. Sci. 1996, 96, 126–130. [Google Scholar] [CrossRef] [Scilit]
- Zhao, H.; Qiao, Y.; Du, X.; Wang, S.; Zhang, Q.; Zang, Y.; Cai, Z. Paint removal with pulsed laser: Theory simulation and mechanism analysis. Appl. Sci. 2019, 9, 5500. [Google Scholar] [CrossRef] [Scilit]
- Barni, D.; Raimondo, L.; Galli, A.; Caglio, S.; Mostoni, S.; D’Arienzo, M.; Martini, M.; Sassella, A. Separating pigments and fillers from the polymer matrix in acrylic colors subjected to natural aging. Eur. Phys. J. Plus 2022, 137, 926. [Google Scholar] [CrossRef] [Scilit]
- Zhang, D.; Xu, J.; Li, Z.; Li, K.; Wang, C.; Shan, D.; Guo, B. Removal mechanism of blue paint on aluminum alloy substrate during surface cleaning using nanosecond pulsed laser. Opt. Laser Technol. 2022, 149, 107882. [Google Scholar] [CrossRef] [Scilit]
- Wang, X.; Ding, Y.; Chen, Q.; Li, H.; Wang, L.; Wang, M. Laser Cleaning Process for Low-Pressure Turbine Blade Paint Removal with Remelting Suppression. Coatings 2025, 15, 1054. [Google Scholar] [CrossRef] [Scilit]
- Gu, J.; Su, X.; Li, W.; Jin, Y.; Xu, J.; Guo, B. Process and mechanism of paint stripping on CFRP by UV nanosecond laser. Opt. Laser Technol. 2024, 171, 110461. [Google Scholar] [CrossRef] [Scilit]
- Gu, J.; Su, X.; Jin, Y.; Zhang, D.; Li, W.; Xu, J.; Guo, B. Research progress and prospects of laser cleaning for CFRP: A review. Compos. Part A Appl. Sci. Manuf. 2024, 185, 108349. [Google Scholar] [CrossRef] [Scilit]
Disclaimer/Publisher’s Note: The statements, opinions and data contained in all publications are solely those of the individual author(s) and contributor(s) and not of MDPI and/or the editor(s). MDPI and/or the editor(s) disclaim responsibility for any injury to people or property resulting from any ideas, methods, instructions or products referred to in the content. |
© 2026 by the authors. Licensee MDPI, Basel, Switzerland. This article is an open access article distributed under the terms and conditions of the Creative Commons Attribution (CC BY) license.