


Abstract
Accurate pressure measurement under high-temperature conditions is challenging for silica-diaphragm-based fiber-optic Fabry–Perot (F-P) sensors because temperature causes both optical cavity length (OCL) baseline drift and pressure-sensitivity variation. In this work, a structurally simple and readily fabricated silica-diaphragm-based fiber-optic F-P pressure sensor was developed, and a neural-network-assisted compensation strategy was proposed to suppress the residual errors of conventional analytical compensation. A temperature-dependent response model was established to describe OCL drift and sensitivity variation. The OCL was demodulated from reflection spectra using an FFT-assisted dual-peak and MMSE refinement method, and static pressure measurements were performed over 25–400 °C and 0–2.4 MPa. Based on the experimentally verified response characteristics, a fitting-based compensation method considering both OCL drift and sensitivity variation was first implemented. A lightweight neural network was then constructed using the OCL variation, , and ambient temperature as physically meaningful input features. Compared with fixed-sensitivity compensation and drift-and-sensitivity fitting compensation, whose maximum full-scale errors were 7.10% F.S. and 2.74% F.S., respectively, the proposed method reduced the maximum error to 0.90% F.S. with an RMSE of 0.0045 MPa. Additional validation at the independent intermediate temperatures of 150, 250, and 350 °C further confirmed the generalization capability of the proposed NNC model between calibrated temperature gradients, achieving an overall RMSE of 0.0055 MPa and a maximum full-scale error below 0.77% F.S. The proposed approach provides a high-accuracy and practical solution for high-temperature pressure monitoring using simple fabricated silica-diaphragm F-P sensors.
1. Introduction
Fiber-optic sensors offer distinct advantages, including compact size, immunity to electromagnetic interference, corrosion resistance, passive remote transmission, and ease of integration. They have therefore been widely applied in aerospace structural monitoring [1,2], marine environmental sensing [3,4], chemical parameter detection [5], and nuclear-energy and energy-system monitoring [6,7,8]. Among these application scenarios, high-temperature pressure measurement is particularly important for the safe operation and condition evaluation of aero-engines, gas turbines, high-temperature fluid transport systems, and energy-conversion equipment. Fiber-optic Fabry–Perot (F-P) pressure sensors have attracted considerable attention for harsh-environment pressure measurement owing to their compact structure, high sensitivity, electromagnetic immunity, and high-temperature capability [9,10,11].
According to their pressure-sensing mechanisms, fiber-optic F-P pressure sensors can generally be categorized into open-cavity and diaphragm-based types. Open-cavity sensors determine pressure through variations in the optical cavity length (OCL) induced by the pressure-dependent refractive index of the gas inside the cavity, and they generally feature a simple structure and good high-temperature tolerance [12]. However, because their pressure response is governed by the refractive index of the gas inside the cavity, open-cavity sensors may introduce substantial measurement errors when applied to mixed gases, for which the refractive-index response is often difficult to characterize accurately. Moreover, even when the gas composition is fixed, the coupled dependence of refractive index on temperature and pressure can complicate temperature–pressure decoupling under high-temperature conditions. Guo et al. [13] developed an open-cavity F-P temperature–pressure sensor based on hollow-core Bragg fiber and evaluated it over a temperature range of 25–600 °C. After temperature–pressure decoupling, the pressure full-scale error over the entire temperature range remained 4% F.S.
In comparison, diaphragm-based F-P pressure sensors measure pressure through pressure-induced diaphragm deflection and the resulting cavity-length variation. Because the sensing cavity is isolated from the measured gas by the diaphragm, the pressure response of such sensors is not directly affected by refractive-index variations caused by changes in gas composition. Nevertheless, under high-temperature conditions, the temperature effect in a diaphragm-based sensor cannot be attributed solely to the thermal drift of the zero-pressure OCL. Increasing temperature causes thermal expansion and baseline OCL variation, and may also affect diaphragm deformation through changes in the elastic properties of the diaphragm material, residual stress, and packaging state. Consequently, the pressure sensitivity may vary with temperature. Therefore, if only the zero-pressure OCL drift is corrected while the pressure sensitivity calibrated at room temperature is retained for pressure conversion, systematic errors may still occur, particularly at elevated temperatures and high pressures. Several compensation strategies have been reported to suppress temperature cross-sensitivity in diaphragm-based or MEMS F-P pressure sensors. Yao et al. [14] proposed a wavelength-conversion-based temperature compensation method for an optical-fiber MEMS F-P pressure sensor. By converting the output wavelength measured at different temperatures to that at a target temperature and then applying the corresponding calibration relationship, the pressure measurement error was reduced from 1.98% F.S. to 0.38% F.S. over 5–45 °C and 0–4 MPa. However, the validation temperature range was relatively limited, and the reported results also indicated that the pressure–wavelength relationships at different temperature–pressure conditions were not completely identical. Jia et al. [15] introduced a fiber Bragg grating (FBG) as a temperature-sensitive element in a MEMS F-P pressure sensor and limited the maximum compensated pressure error to within 1.05% F.S. over 20–350 °C and 0–0.5 MPa. Li et al. [16] further developed a self-temperature-compensated MEMS fiber-optic pressure sensor, in which multiple F-P cavities were used to separately extract pressure and temperature information for simultaneous measurement. These studies demonstrate that temperature compensation can markedly improve the accuracy of F-P pressure sensing. However, for conventional silica-diaphragm-based F-P pressure sensors operating at high temperatures, the simultaneous treatment of baseline OCL drift and temperature-dependent pressure sensitivity still requires further investigation.
In recent years, fiber-optic F-P pressure sensors for broader temperature and pressure ranges have been further developed. Li et al. [17] developed a batch-producible all-silica diaphragm-based F-P pressure sensor using silica-wafer direct bonding and CO2-laser fusion. The sensor operated under a pressure of 1 MPa at temperatures up to 800 °C and exhibited a low thermal drift of 0.435 nm/°C, demonstrating the high-temperature potential of all-silica pressure-sensing structures. Guo et al. [18] combined a open-cavity F-P pressure sensor, a thermocouple, and a three-wavelength demodulation system to realize pressure measurement over 100–700 °C and 0–5 MPa, with a maximum pressure-indication error of approximately 0.13 MPa. Liang et al. [19] developed an FPI-FBG cascaded sensor with Vernier-effect-enhanced pressure response and completed temperature–pressure measurements up to 700 °C and 5 MPa; after temperature compensation, the maximum full-scale pressure error over the entire temperature range was 5.68% F.S. More recently, Liang et al. [20] proposed a cavity–grating integrated all-fiber high-temperature pressure sensor with enhanced fringe contrast and pressure sensitivity, reducing the maximum full-scale pressure error to 2.95% F.S. at temperatures up to 700 °C and pressures up to 5 MPa.
Beyond silica-based sensing structures, sapphire-diaphragm-based F-P pressure sensors have also been investigated for high-temperature pressure measurement. Duan et al. [21] developed a sapphire diaphragm-based F-P pressure sensor with a membrane–hole–base configuration fabricated by three-layer direct bonding. The sensor achieved pressure measurement over 0–10 MPa within a temperature range of 20–370 °C, with a reported full-temperature-range error below 2.312% F.S. Liao et al. [22] developed a temperature-compensated dual-cavity F-P pressure sensor based on sapphire MEMS technology. Using sapphire direct bonding, end-face lens coupling, and high-temperature packaging, the sensor achieved temperature–pressure measurement over 25–1500 °C and 0–1 MPa, with a reported pressure accuracy of 0.86% F.S. Sapphire-based MEMS sensors offer clear advantages for extremely high-temperature applications; however, compared with conventional silica-fiber structures, their sensor-head fabrication, direct bonding, and high-temperature packaging processes generally increase fabrication complexity and may increase manufacturing cost. Therefore, for high-temperature applications that do not require operation above 1000 °C, silica-diaphragm-based F-P pressure sensors remain attractive because of their simple structure and relatively low fabrication complexity. For such sensors, simultaneously compensating for OCL drift, temperature-dependent pressure sensitivity, and the residual response deviations remaining after analytical fitting is essential for high-accuracy high-temperature pressure measurement.
Data-driven methods provide a potential route for describing nonlinear relationships in complex sensor responses. Liu et al. [23] employed an artificial-bee-colony-optimized long short-term memory network for temperature demodulation of an interferometric fiber-optic sensor. Wang et al. [24] applied deep belief networks with ensemble learning to temperature demodulation in a fiber-optic F-P sensor. Chen et al. [25] introduced a neural-network algorithm into a multi-peak wavelength-tracking demodulation system for F-P interferometric sensors. Bai et al. [26] further employed sparse spectral features for F-P sensor demodulation. These studies demonstrate that neural networks can learn nonlinear response relationships from interference spectra or physically related features that are difficult to explicitly represent using conventional analytical models. However, existing studies have mainly focused on temperature or cavity-length demodulation. Neural-network-assisted compensation of temperature-induced OCL drift, pressure-sensitivity variation, and residual analytical-compensation errors in high-temperature diaphragm-based F-P pressure sensors remains insufficiently investigated.
In this work, a silica-diaphragm-based fiber-optic F-P pressure sensor was fabricated for high-temperature pressure measurement, and its temperature cross-sensitivity was addressed through analytical and neural-network-assisted compensation. First, a silica diaphragm pressure-sensitive structure was constructed by fiber splicing and precision polishing, and a theoretical framework was established to describe the temperature-induced OCL baseline drift and pressure-sensitivity variation. Subsequently, an FFT-assisted dual-peak and MMSE refinement method was employed to demodulate the OCL from the reflection spectrum, and static experiments conducted at different temperatures and pressures were used to verify the predicted OCL drift and sensitivity variation. Based on these characteristics, a fitting-based compensation method simultaneously considering OCL drift and pressure-sensitivity variation was established. Furthermore, a neural-network-assisted compensation method was proposed using the OCL variation, , and ambient temperature, , as physically meaningful input features to correct the residual response deviations remaining after analytical fitting. Experimental results obtained over 25–400 °C and 0–2.4 MPa show that the proposed method reduces the pressure-demodulation RMSE to 0.0045 MPa and the maximum full-scale error to 0.90% F.S. This work provides an effective solution for high-accuracy pressure measurement using structurally simple and readily fabricated silica-diaphragm-based fiber-optic F-P sensors in high-temperature environments.
2. Principle
2.1. Sensor Fabrication and High-Temperature Pressure-Sensing Mechanism
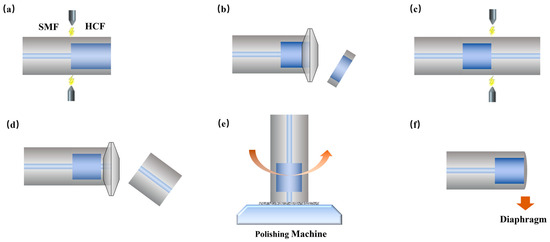
To achieve pressure measurement under high-temperature conditions, a silica-diaphragm-based fiber-optic Fabry–Perot (F-P) pressure sensor was fabricated in this work. The fabrication procedure is illustrated in Figure 1. The sensor mainly consists of a single-mode fiber (SMF), a hollow-core fiber (HCF), and a fused-silica diaphragm located at the distal end of the sensor.
Figure 1.
Fabrication procedure of the silica-diaphragm-based fiber-optic F-P pressure sensor: (a) fusion splicing of the SMF and HCF; (b) precise cleaving of the HCF; (c) fusion splicing of the second SMF segment; (d) cleaving of the terminal SMF segment; (e) polishing of the terminal silica diaphragm; (f) fabricated diaphragm-based sensor tip.
First, the end faces of the SMF and HCF were cleaved to obtain flat surfaces for fusion splicing. The SMF and HCF were then fusion-spliced using a fiber splicer. To reduce structural collapse and deformation of the HCF during fusion splicing, the arc power and discharge duration were controlled; the parameters used in this work were +10 bit and 320 ms, respectively. After the first splicing step, the HCF was precisely cleaved to the required length under microscopic observation. Subsequently, the other end of the HCF was fusion-spliced to a second SMF segment using the same splicing parameters, thereby forming an SMF–HCF–SMF composite structure. Finally, the terminal SMF segment was cleaved and gradually polished to form a pressure-sensitive fused-silica diaphragm at the sensor tip. After polishing, the sensor was ultrasonically cleaned in an ethanol solution to remove polishing debris and surface contamination. The final thickness of the fabricated fused-silica diaphragm was approximately 4 μm.
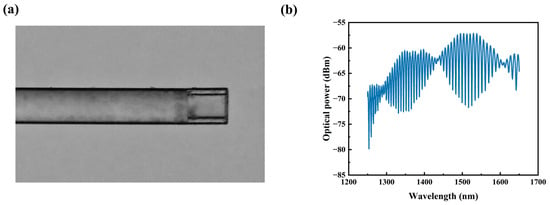
Figure 2a presents a microscopic image of the fabricated sensor tip, in which the thin fused-silica diaphragm formed at the distal end can be observed. Figure 2b shows a typical reflection spectrum of the fabricated sensor. Clear interference fringes can be observed in the spectrum, confirming the formation of the F-P interference cavity. Because the interference fringes within the wavelength range from 1500 to 1570 nm exhibit good visibility, this spectral interval was selected as the input spectrum for subsequent OCL demodulation.
Figure 2.
Fabricated sensor tip and its reflection spectrum: (a) microscopic image of the silica-diaphragm-based F-P sensor tip; (b) typical reflection spectrum of the fabricated sensor.
When an external pressure is applied to the terminal fused-silica diaphragm, the diaphragm deflects toward the interior of the F-P cavity under the pressure difference, thereby reducing the geometric length of the air cavity. For a clamped circular diaphragm subjected to a uniformly distributed pressure, the maximum central deflection under the small-deflection approximation can be expressed as:
where is the maximum central deflection of the diaphragm, is the applied pressure, is the effective pressure-sensitive radius of the diaphragm, is the diaphragm thickness, is the Poisson’s ratio of fused silica, and is the Young’s modulus of fused silica. Equation (1) indicates that the central deflection is approximately proportional to the applied pressure and inversely proportional to the cube of the diaphragm thickness. Therefore, reducing the thickness of the fused-silica diaphragm to several micrometers increases its deflection response under the same applied pressure.
In this work, the optical cavity length (OCL) is used to characterize the response of the pressure-sensitive F-P cavity. For the air cavity formed by the HCF, the OCL can be expressed as: .
where is the refractive index of the medium inside the air cavity and is the geometric length of the air cavity. At a fixed temperature, the pressure-induced OCL variation is dominated by the cavity-length change caused by diaphragm deflection, whereas the corresponding variation in the refractive index of the cavity medium is treated as a secondary contribution. Therefore, the pressure-induced OCL variation can be approximately expressed as:
The negative sign indicates that an increase in external pressure causes the diaphragm to deflect inward, thereby decreasing both the geometric length and the OCL of the air cavity. Accordingly, the pressure sensitivity of the sensor at a fixed temperature can be defined as:
Since the OCL of the fabricated sensor decreases with increasing applied pressure, is negative. For convenience in comparing the pressure responses at different temperatures, the magnitude of the pressure sensitivity, , is used in the subsequent analysis.
When the sensor operates in a high-temperature environment, temperature variation causes a baseline drift in the OCL of the air cavity even when the external pressure remains unchanged. According to Equation (2), the temperature sensitivity of the OCL under the zero-pressure condition can be expressed as:
where is the temperature sensitivity of the OCL under the zero-pressure condition, and is the effective thermal expansion coefficient associated with the geometric-length variation in the air cavity. In the present analysis, the OCL variation caused by the temperature dependence of the air refractive index is considered a secondary contribution compared with the cavity-length variation induced by structural thermal expansion. Therefore, the approximate relationship on the right-hand side of Equation (4) is used to describe the temperature-induced baseline drift of the OCL.
However, the temperature effect on the pressure response is not limited to the baseline drift of the OCL. For a diaphragm-based F-P pressure sensor, the deflection response of the diaphragm is also affected by variations in its thermomechanical properties. In particular, the Young’s modulus of the fused-silica diaphragm varies with temperature, thereby changing the diaphragm deflection produced by the same applied pressure and consequently causing a variation in pressure sensitivity. Considering the temperature dependence of the relevant optical, geometric, and mechanical parameters, the magnitude of the pressure sensitivity at temperature can be expressed as:
where is the magnitude of the pressure sensitivity at temperature , is the temperature-dependent refractive index of the cavity medium, is the temperature-dependent Poisson’s ratio of the fused-silica diaphragm, is the temperature-dependent Young’s modulus of the fused-silica diaphragm, and , denote the effective pressure-sensitive radius and thickness of the diaphragm at temperature , respectively. In the approximate relationship, and represent the pressure-sensitivity magnitude and Young’s modulus at 25 °C, respectively. This approximation assumes that, within the investigated temperature range, the contributions from variations in refractive index, Poisson’s ratio, and diaphragm geometry are relatively small, and is used to describe the principal influence of the temperature-dependent Young’s modulus on the sensitivity variation.
Previous studies have systematically investigated the temperature dependence of the elastic constants of vitreous silica and reported that the Young’s modulus of fused silica increases with increasing temperature over the temperature range relevant to this work [27]. Therefore, under the same applied pressure, an increase in temperature weakens the deflection response of the diaphragm and reduces the magnitude of the pressure sensitivity. It should be noted that the experimentally calibrated pressure sensitivity may also be affected by residual stress, fabrication deviations, packaging conditions, and measurement fluctuations. Therefore, Equation (5) is used to interpret the principal physical tendency of the pressure-sensitivity variation rather than to serve as a complete analytical compensation model.
For the fabricated sensor, if the zero-pressure OCL and the corresponding pressure sensitivity at a given temperature are known, the applied pressure can be calculated as:
where is the OCL measured at temperature and pressure , and is the zero-pressure OCL at the same temperature. Since the OCL decreases with increasing pressure in the fabricated sensor, and ; therefore, the pressure calculated using Equation (6) is positive.
In summary, the silica-diaphragm-based fiber-optic F-P pressure sensor is affected by both temperature-induced OCL baseline drift and temperature-dependent pressure sensitivity under high-temperature conditions. The OCL baseline drift introduces an offset error in pressure demodulation, whereas the pressure-sensitivity variation produces a scale-dependent error that becomes more pronounced as the applied pressure increases. Based on this response mechanism, three pressure-demodulation strategies are subsequently compared after OCL determination: fixed 25 °C sensitivity compensation, drift-and-sensitivity fitting compensation, and neural-network-assisted compensation.
2.2. OCL Demodulation Based on the FFT-Assisted Dual-Peak and MMSE Refinement Method
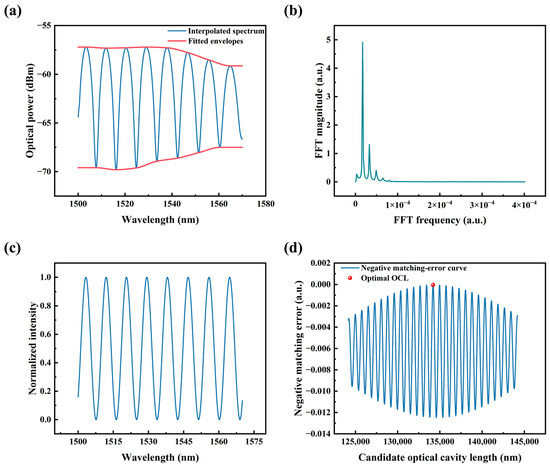
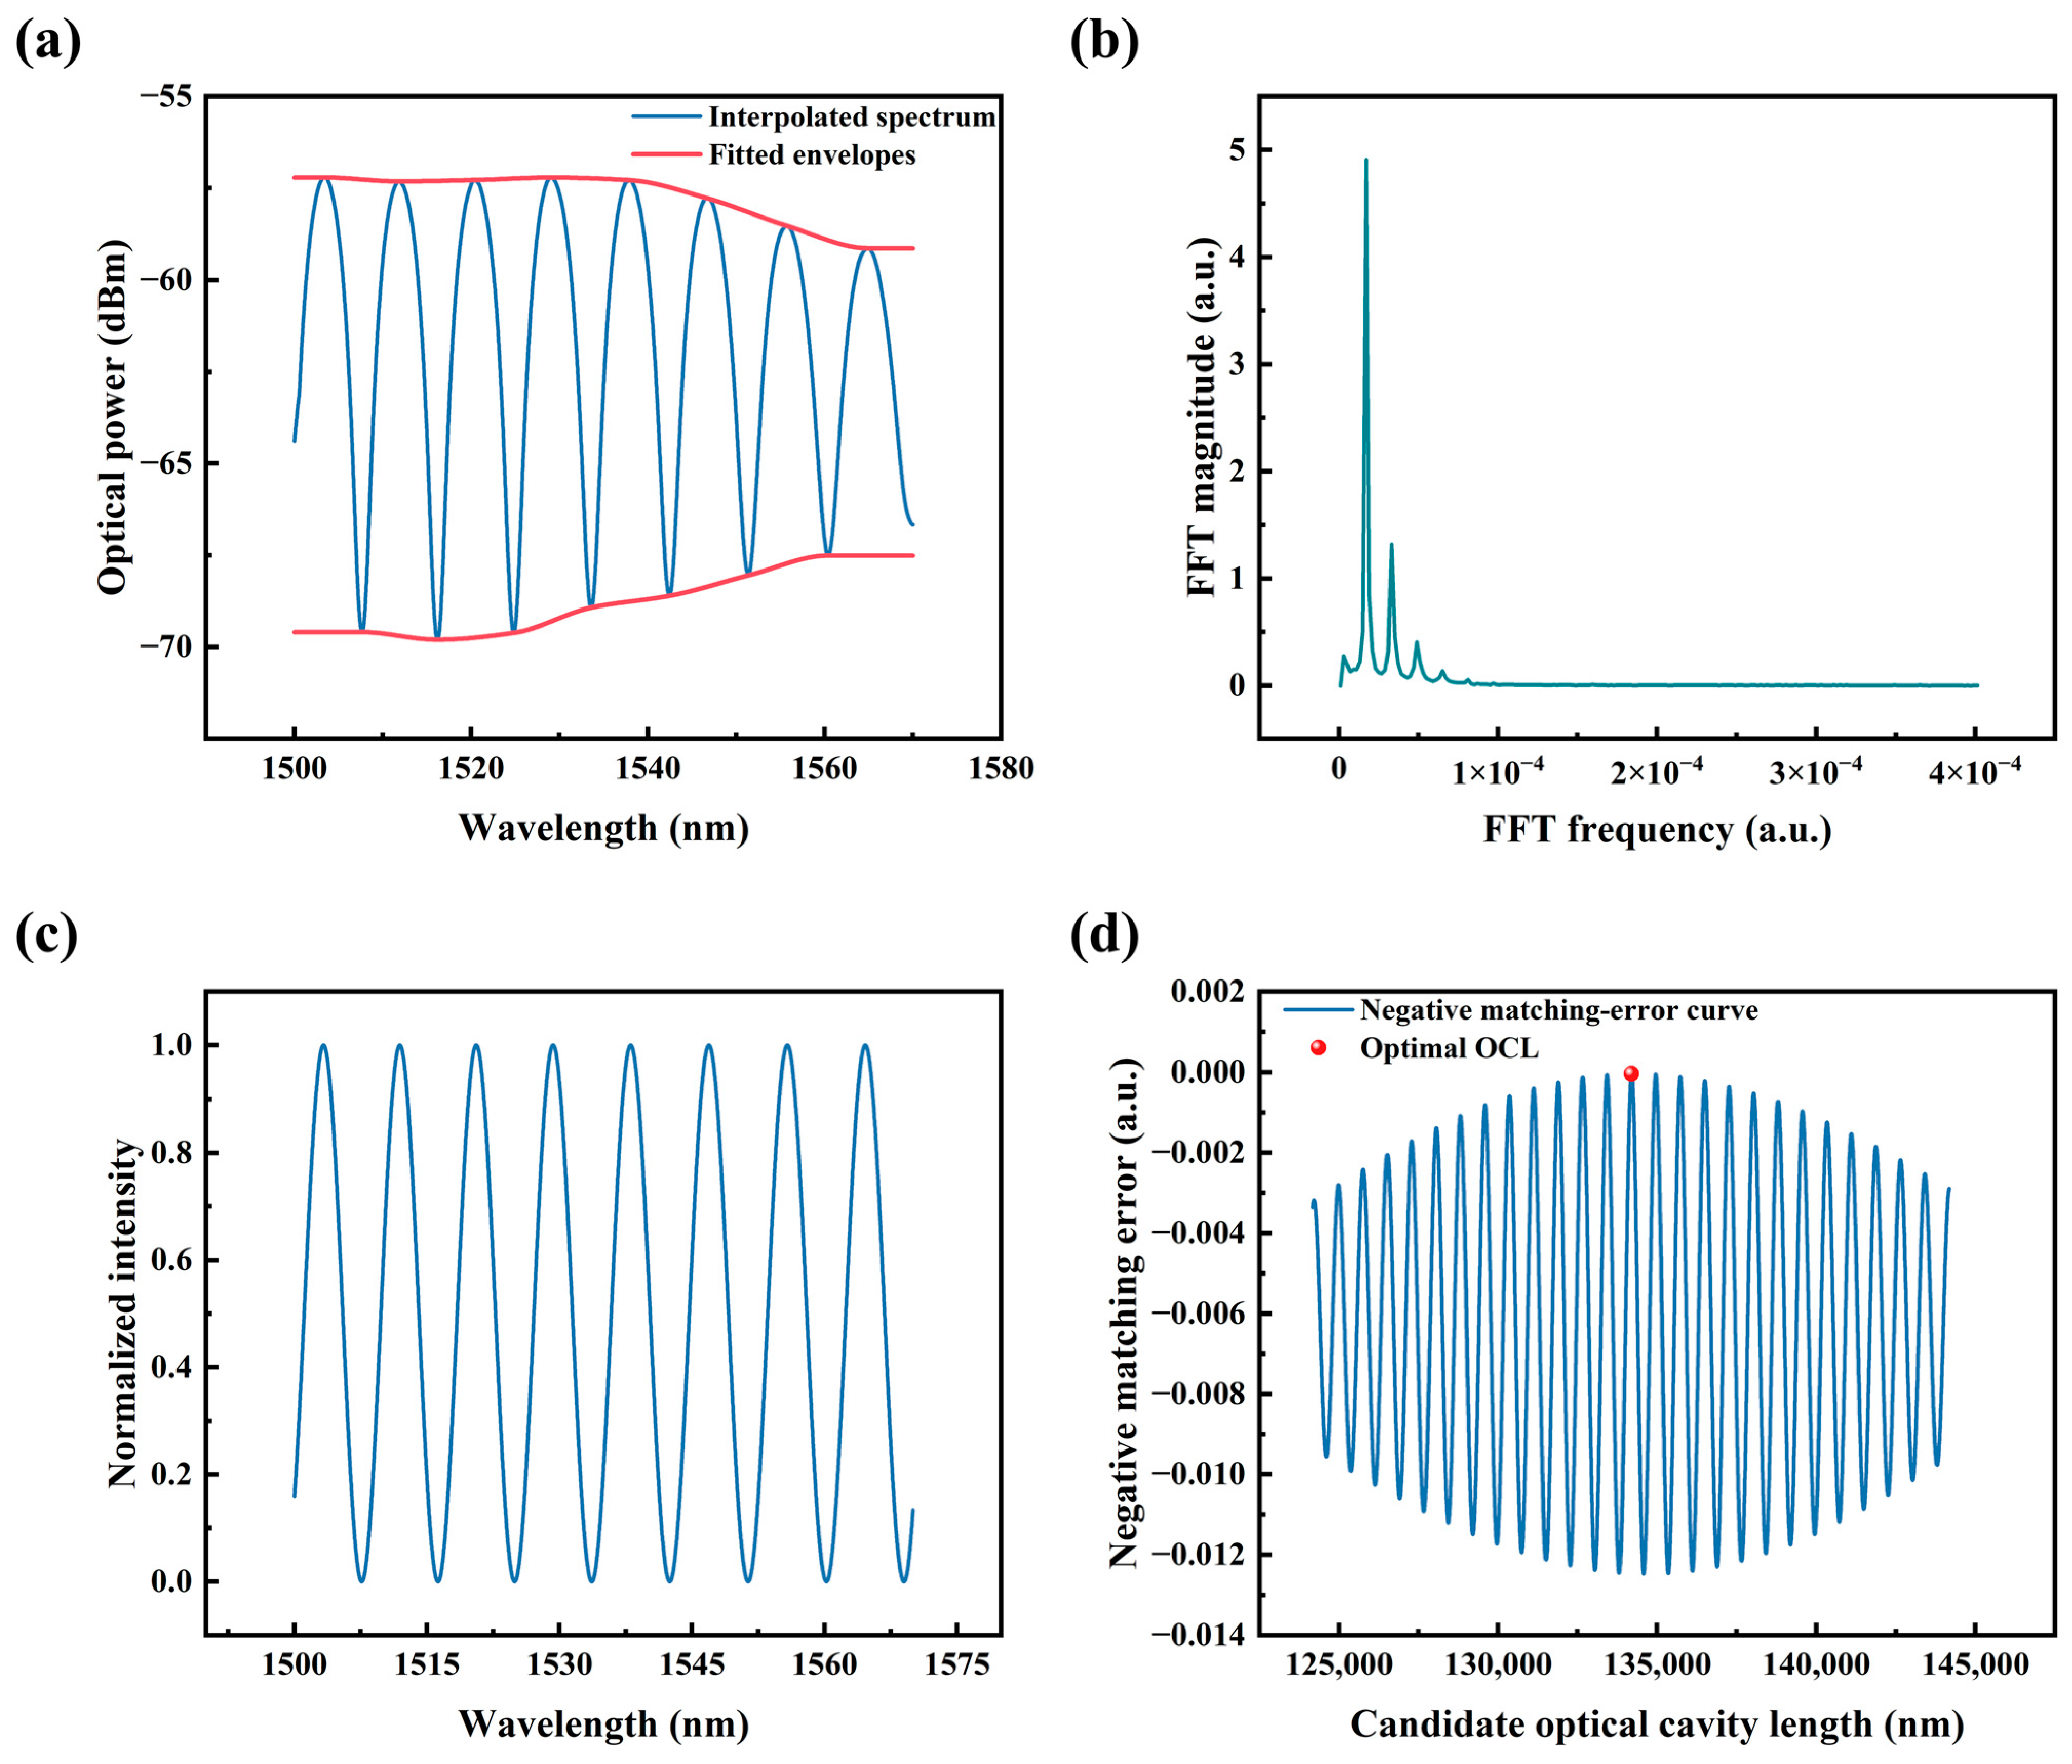
To accurately determine the optical cavity length (OCL) of the silica-diaphragm-based fiber-optic F-P pressure sensor, an FFT-assisted dual-peak estimation and MMSE refinement method was employed to demodulate the measured reflection spectrum, as illustrated in Figure 3. In this procedure, fast Fourier transform (FFT) and frequency-domain filtering are used to identify and extract the dominant interference component associated with the pressure-sensitive cavity. After the target interference signal is reconstructed and normalized, the dual-peak method is first used to obtain an approximate OCL, and an MMSE-based matching process is then performed to further refine the OCL estimation.
Figure 3.
FFT-assisted dual-peak and MMSE refinement procedure for OCL demodulation: (a) smoothed and interpolated reflection spectrum with fitted envelopes; (b) FFT magnitude spectrum used for selecting the target interference component; (c) normalized target interference signal reconstructed after frequency-domain filtering and inverse FFT; (d) negative matching-error curve and the determined optimal OCL.
For a low-finesse F-P interferometric cavity, the reflection spectrum can be expressed as:
where is the reflected spectral intensity of the sensor, is the incident wavelength, represents the background component, is the interference modulation amplitude, is the initial phase, and OCLis the optical cavity length of the pressure-sensitive F-P cavity. When the external pressure induces deformation of the terminal diaphragm, the OCL of the pressure-sensitive cavity varies accordingly, resulting in a phase shift in the reflection interference spectrum. Therefore, the OCL can be obtained through spectral demodulation.
First, the reflection spectrum acquired by the optical spectrum analyzer was smoothed and cubic-spline interpolated within the selected wavelength range. In this work, the spectrum from 1500 to 1570 nm was selected for OCL demodulation. Figure 3a shows the smoothed and interpolated reflection spectrum together with its fitted envelopes. Although clear interference fringes can be observed in this wavelength range, noticeable envelope variation remains owing to the diaphragm-related reflection and possible multiple-reflection interference. Therefore, further extraction of the target interference component is required before accurate OCL matching.
The interpolated wavelength-domain interference signal was then directly processed using FFT, and the corresponding frequency-domain magnitude spectrum is shown in Figure 3b. The dominant peak with the highest magnitude corresponds to the primary interference component generated by the pressure-sensitive F-P cavity. The two smaller peaks located on the right side of the dominant peak are mainly associated with additional multiple-reflection interference generated by the reflective interfaces at the sensor tip, and their frequency positions are approximately integer multiples of that of the dominant peak. To suppress the influence of these undesired components, a band-pass filter was applied around the dominant peak, retaining only the frequency component corresponding to the pressure-sensitive primary cavity.
After frequency-domain filtering, an inverse fast Fourier transform (IFFT) was performed on the retained frequency component to reconstruct the interference signal associated with the pressure-sensitive F-P cavity. Since the reconstructed signal still exhibits a certain envelope variation, it was further normalized before cavity-length calculation. Specifically, the lower envelope was first subtracted from the reconstructed signal, and the resulting signal was then divided by its upper envelope. This normalization process can be expressed as:
where is the reconstructed target interference signal obtained by IFFT, is its lower envelope, is the upper envelope of the signal after subtraction of the lower envelope, and is the normalized interference signal. Figure 3c presents the target interference signal after frequency-domain filtering, IFFT reconstruction, and envelope normalization.
After obtaining the normalized interference signal, the OCL of the pressure-sensitive F-P cavity was first estimated using the dual-peak method. For two adjacent interference peaks in Figure 3c, with corresponding wavelengths of and , the approximate OCL, denoted as , can be calculated as:
where and are the wavelengths corresponding to two adjacent peaks in the normalized interference signal, and is the approximate optical cavity length obtained by the dual-peak method. Although this method can rapidly determine the approximate position of the target OCL, its accuracy may be limited by spectral sampling interval, peak-positioning error, and signal noise. Therefore, an MMSE-based refinement procedure was further employed.
In the MMSE refinement process, a series of candidate optical cavity lengths, denoted as , were established within a narrow range centered on . According to Equation (9), a normalized reference interference spectrum was generated for each candidate OCL and matched with the normalized target interference signal . The mean square error between them can be expressed as:
where is the number of spectral sampling points used for matching, is the normalized target interference intensity at the -th wavelength sampling point, and is the reference interference intensity corresponding to the candidate optical cavity length . A smaller MSE indicates a higher similarity between the reference spectrum and the target interference signal, and the corresponding candidate OCL is closer to the actual cavity length.
Figure 3d shows the MMSE refinement result. To present the optimal OCL as a distinct peak, the negative value of the calculated MSE is plotted in this figure. Therefore, the position corresponding to the maximum value of the negative matching-error curve represents the finally demodulated OCL, as indicated by the red marker.
Through this process, FFT and frequency-domain filtering extract the target interference component associated with the pressure-sensitive primary cavity, the dual-peak method rapidly determines an approximate OCL, and the MMSE refinement further improves the accuracy of cavity-length demodulation. The obtained OCL is subsequently used for the characterization of the pressure response, the investigation of temperature-dependent sensitivity variation, and the comparison of different pressure compensation methods.
2.3. Neural-Network-Assisted High-Temperature Pressure Compensation Method
As discussed above, the silica-diaphragm-based fiber-optic F-P pressure sensor is affected by both temperature-induced OCL drift and temperature-dependent pressure sensitivity under high-temperature conditions. A basic compensation method that only corrects the temperature-induced OCL baseline drift while retaining the pressure sensitivity calibrated at room temperature inevitably introduces considerable demodulation errors at elevated temperatures and high pressures. Further compensation based on fitted relationships for both OCL drift and pressure-sensitivity variation can significantly reduce these errors. However, such analytical fitting still relies on models established from limited calibration data. Non-ideal factors in practical sensors, including residual stress in the diaphragm, fabrication deviations, temperature-dependent equivalent mechanical properties, and measurement fluctuations, may cause subtle deviations from the fitted model and result in residual errors at specific discrete operating conditions.
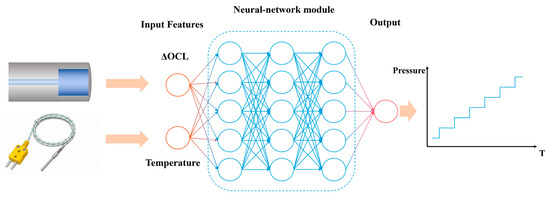
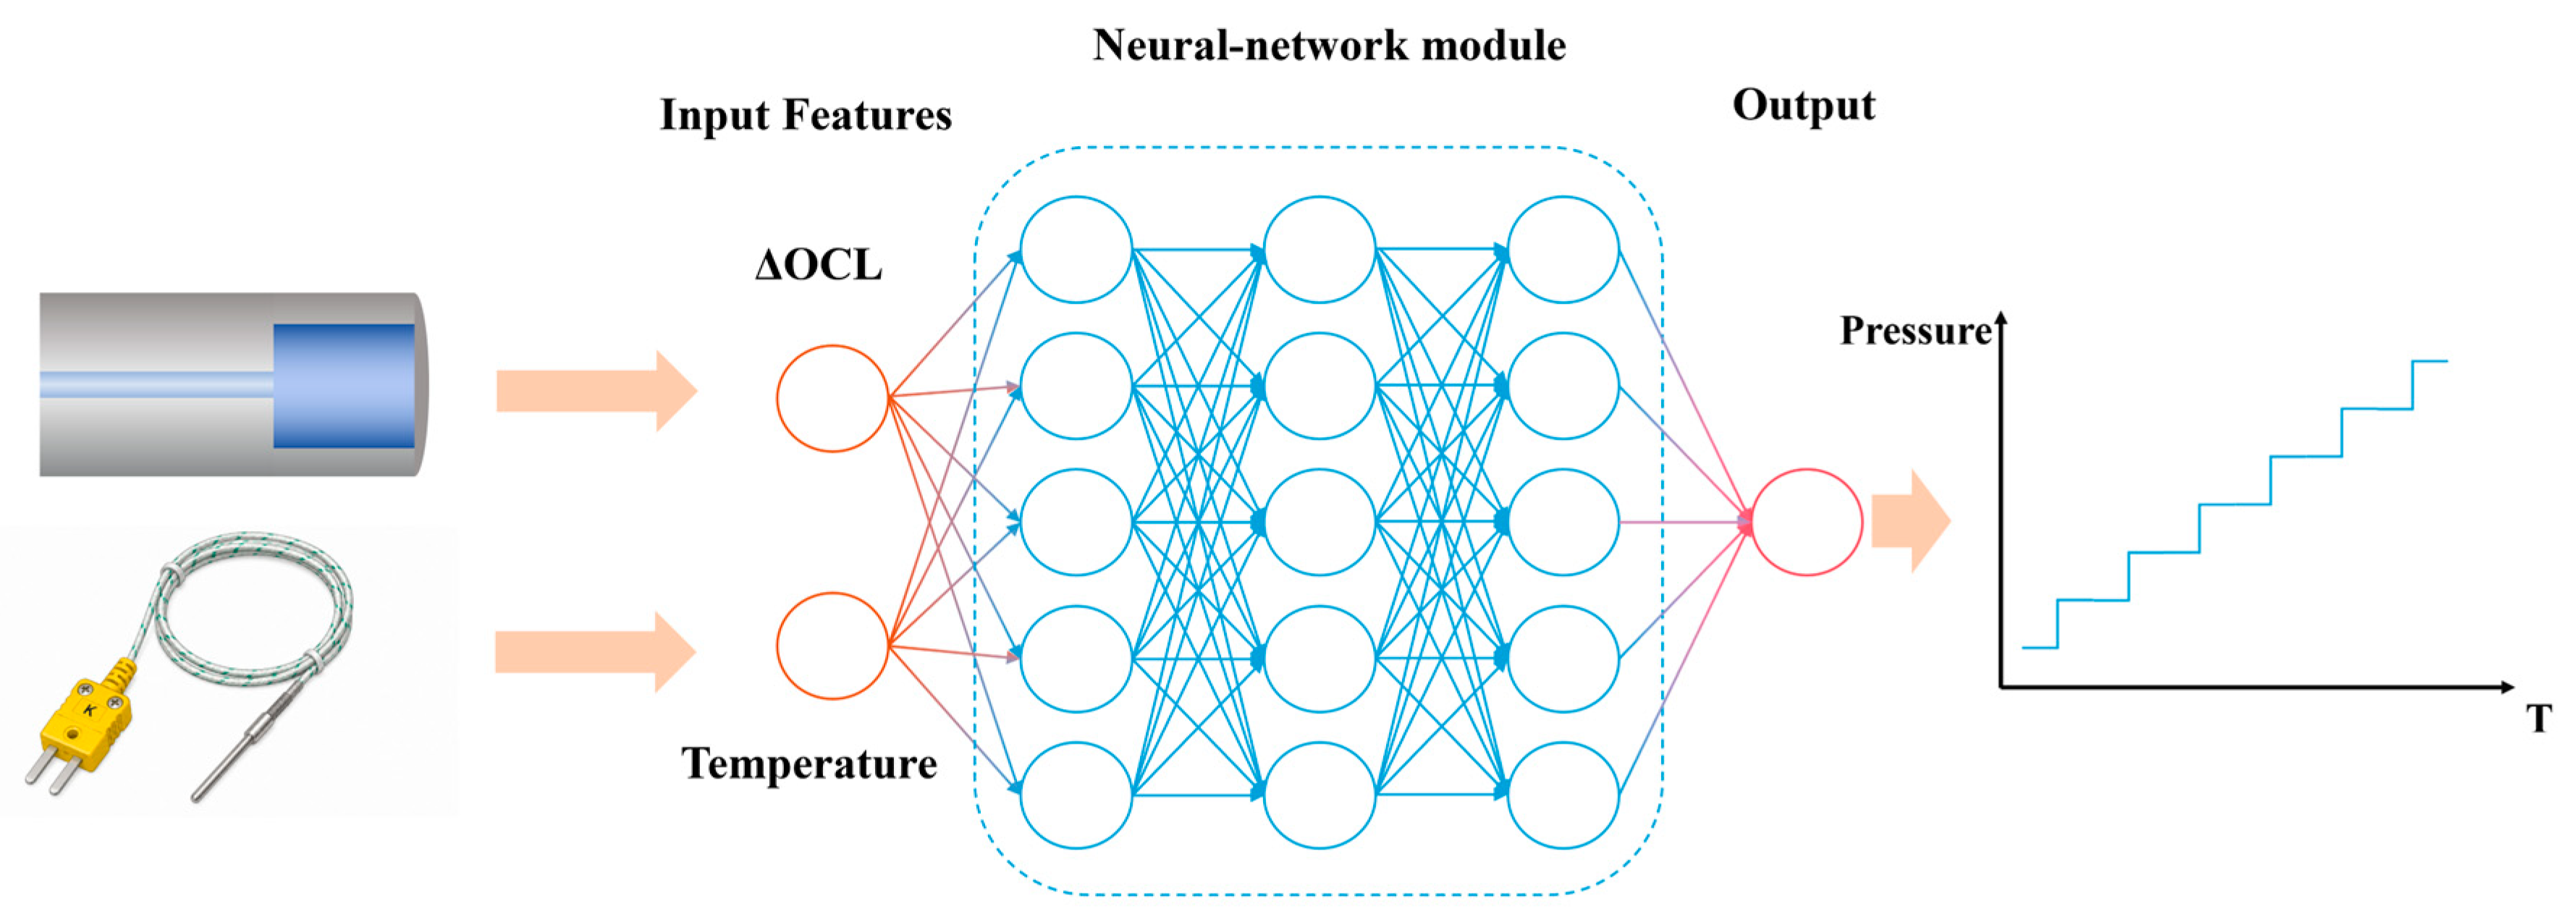
To further improve the pressure demodulation accuracy under high-temperature conditions, a neural-network-assisted pressure compensation method based on physically meaningful input features is introduced in this work. As shown in Figure 4, after the OCL is obtained using the FFT-assisted dual-peak estimation and MMSE refinement method, the corresponding optical cavity length variation, , is calculated and combined with the environmental temperature, , as the input of the network, while the predicted pressure, , is used as the output. Here, is defined as the OCL variation relative to the zero-pressure OCL at the same temperature, namely . Therefore, mainly characterizes the pressure-induced response variation in the pressure-sensitive cavity after removing the temperature-dependent baseline OCL drift. Meanwhile, provides information mainly associated with temperature-dependent pressure sensitivity, as well as other residual thermal effects. Therefore, the proposed model is a lightweight two-input–one-output pressure compensation network with clear physical meaning, which preserves interpretability while learning residual nonlinear errors that are difficult to describe using conventional fitting-based compensation methods.
Figure 4.
Schematic diagram of the neural-network-assisted pressure compensation method using the OCL variation, , and ambient temperature, , as physical input features.
A fully connected feedforward neural network, namely a multilayer perceptron (MLP), was employed to implement the high-temperature pressure compensation. For the -th sample, the input feature vector is defined as , and the corresponding pressure prediction can be expressed as:
where is the predicted pressure of the -th sample, and denotes the nonlinear mapping function determined by the trainable parameter set .
For the -th hidden layer of the MLP, the output can be expressed as:
where is the network input, is the output of the -th hidden layer, and are the weight matrix and bias vector of the corresponding layer, respectively, denotes the activation function, represents the dropout operation, and is the number of hidden layers. Through these nonlinear transformations, the MLP learns the practical relationship between and applied pressure at different temperatures. The neural-network module shown in Figure 4 is a schematic representation of this nonlinear compensation process, while its specific configuration is determined through subsequent hyperparameter optimization.
The dataset used for model training and performance evaluation was obtained from static calibration experiments conducted under different temperature and pressure conditions. The investigated temperatures were 25, 100, 200, 300, and 400 °C, and the applied pressure was varied from 0 to 2.4 MPa with an increment of 0.15 MPa. This pressure range corresponded to 17 pressure levels at each temperature. At each temperature–pressure operating condition, the reflection spectrum of the sensor was repeatedly acquired 20 times, and the corresponding OCL values were individually demodulated using the FFT-assisted dual-peak and MMSE refinement method. Therefore, the complete dataset contained 1700 samples. The calculated values and the corresponding temperatures were then used as the network inputs, while the reference pressures were used as the supervised labels to construct the neural-network-based pressure compensation dataset.
To ensure consistent coverage of all temperature–pressure operating conditions in the training, validation, and test sets, the 20 repeated samples acquired at each operating condition were randomly divided at a ratio of 6:2:2. Accordingly, each operating condition contained 12 training samples, 4 validation samples, and 4 test samples. Consequently, the dataset consisted of 1020 training samples, 340 validation samples, and 340 independent test samples. The training set was used to update the model parameters, the validation set was used for hyperparameter selection and monitoring of the training process, and the test set was used to evaluate the final pressure compensation performance. Before model training, both the input features and output labels were standardized using the statistical parameters of the training set, and the same transformation parameters were subsequently applied to the validation and test sets.
To obtain an appropriate network architecture and training configuration for high-temperature pressure compensation, Optuna (version 4.8.0) was employed for automatic hyperparameter optimization of the MLP model. The searched hyperparameters included the number of hidden layers, the number of neurons in each hidden layer, activation function, dropout ratio, batch size, learning rate, weight decay, optimizer, and loss function. In particular, the loss function was selected through optimization among MSE, Smooth L1, and Huber losses. A total of 600 Optuna trials were conducted, and the model configuration yielding the lowest pressure prediction RMSE on the validation set was selected as the optimal configuration. The corresponding hyperparameter optimization results, model convergence behavior, and pressure demodulation performance comparison between the proposed neural-network method and conventional compensation methods are presented in the following section.
3. Results
3.1. Experimental Setup and Static OCL Response Characteristics
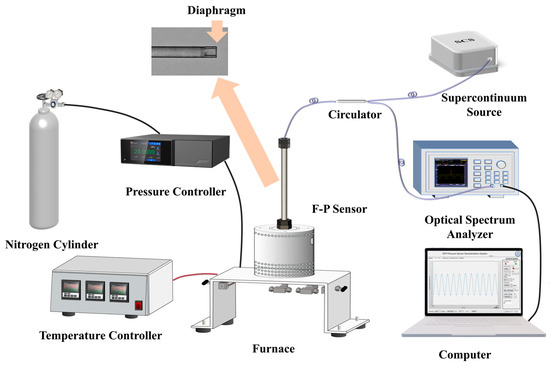
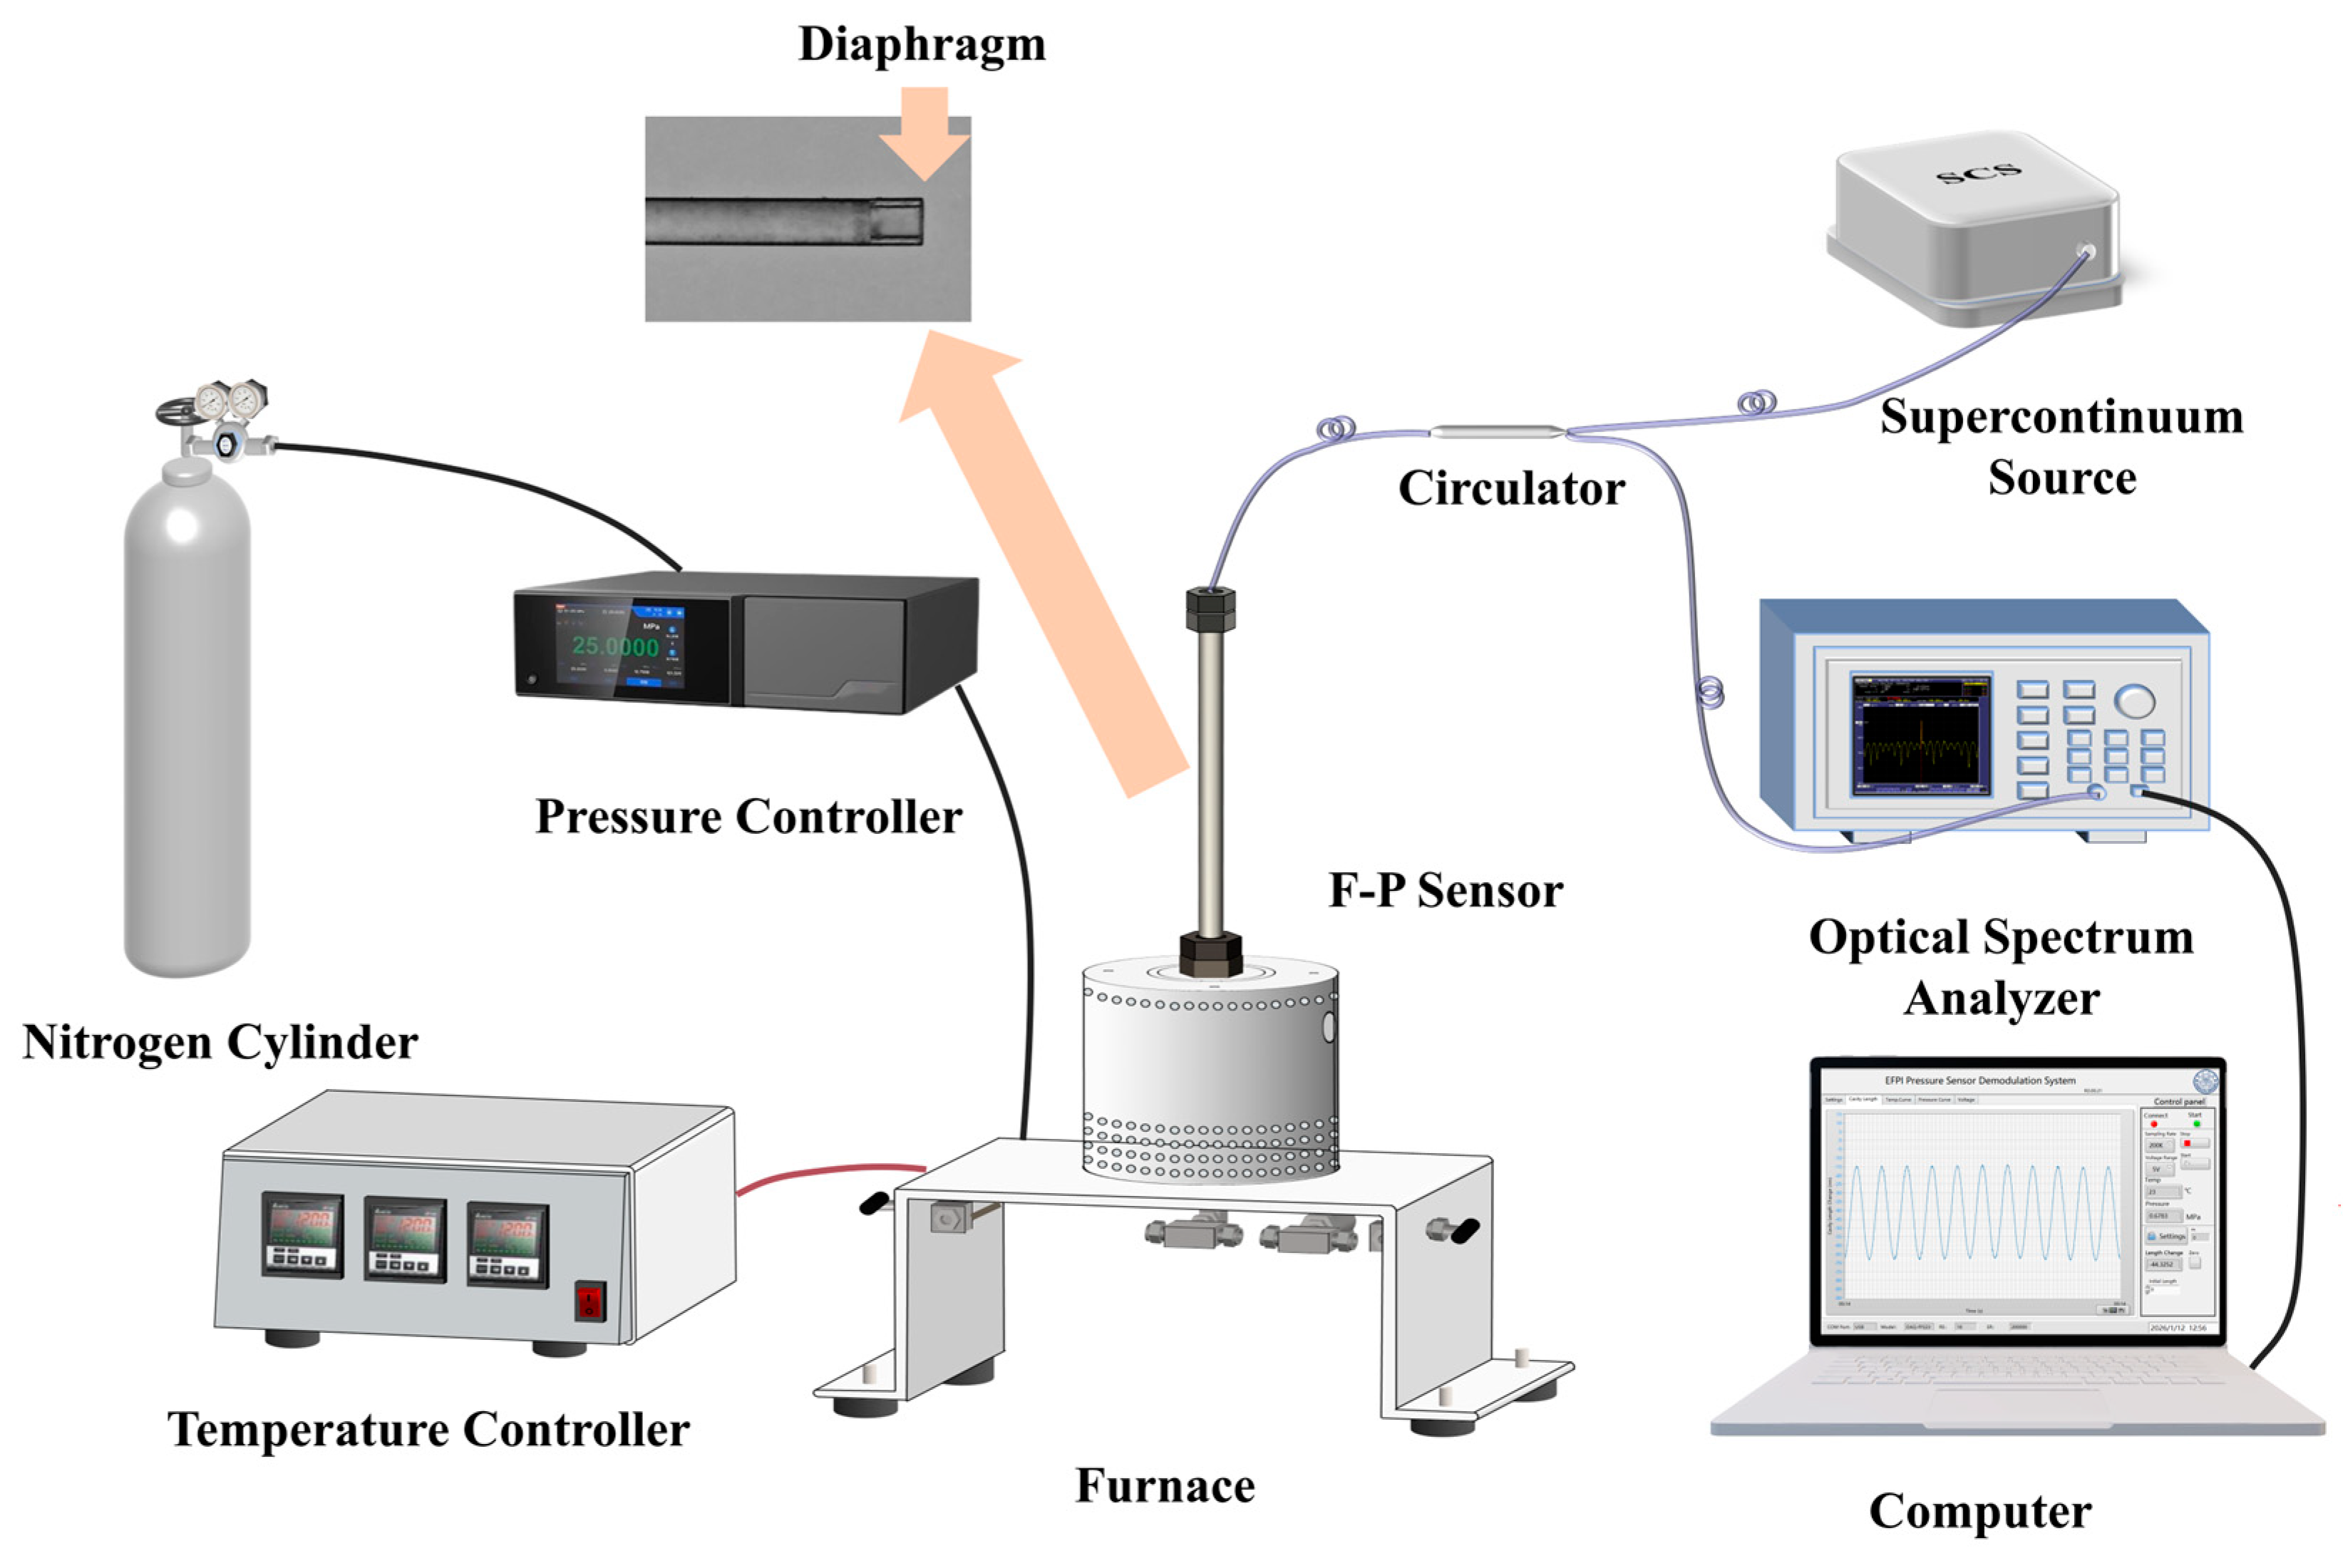
To evaluate the pressure response of the fabricated silica-diaphragm-based fiber-optic F-P sensor under high-temperature conditions and to establish an experimental basis for subsequent pressure compensation, a high-temperature pressure testing system was constructed, as illustrated in Figure 5. The system mainly consists of an optical demodulation module, a temperature-control module, and a pressure-loading module.
Figure 5.
Experimental setup for high-temperature pressure measurement of the silica-diaphragm-based fiber-optic F-P sensor.
In the optical demodulation module, broadband light emitted from a supercontinuum source (SCS; SUPERK COMPACT, NKT Photonics, Birkerød, Denmark) is launched into the F-P sensor through an optical circulator. The reflected spectrum from the sensor returns through the circulator and is acquired by an optical spectrum analyzer (OSA; AQ6370D, Yokogawa, Hachioji, Japan). The acquired spectral data are subsequently transferred to a computer, where the OCL is determined using the FFT-assisted dual-peak and MMSE refinement method. In the current experimental system, the average time required for a complete single-spectrum demodulation cycle was approximately 11 s, including OSA spectral scanning, spectral-data transfer to the computer, FFT-based spectral processing, dual-peak estimation, and MMSE-based OCL refinement. This time was mainly limited by the OSA scanning and data-transfer process, as well as the exhaustive search for the best-matched cavity length according to the MMSE criterion.
In the temperature and pressure loading module, the sensor is placed inside a high-temperature furnace, whose temperature is regulated by a temperature controller. Two K-type thermocouples are positioned close to the sensor inside the furnace to accurately monitor and verify the actual temperature state around the sensing region. High-purity nitrogen is supplied from a gas cylinder, and the applied pressure is regulated and stabilized using a pressure controller (ConST860, ConST, Beijing, China). Static pressure calibration experiments were conducted at 25, 100, 200, 300, and 400 °C. At each temperature, the applied pressure was varied from 0 to 2.4 MPa in increments of 0.15 MPa. For each temperature–pressure operating point, nitrogen was introduced until the target pressure was reached, and the reflection spectrum was acquired only after the monitored temperature readings became stable. The acquired reflection spectra were then processed using the FFT-assisted dual-peak and MMSE refinement method to obtain the corresponding OCL values.
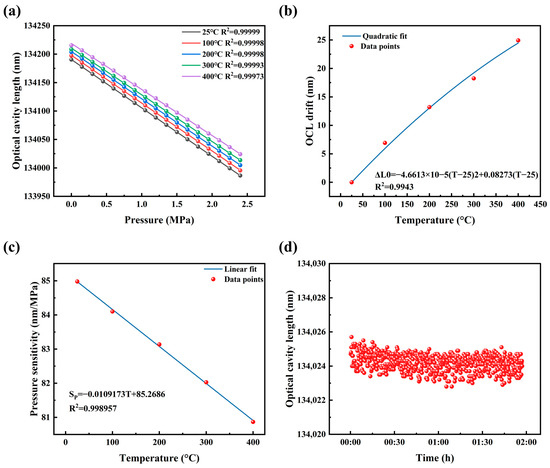
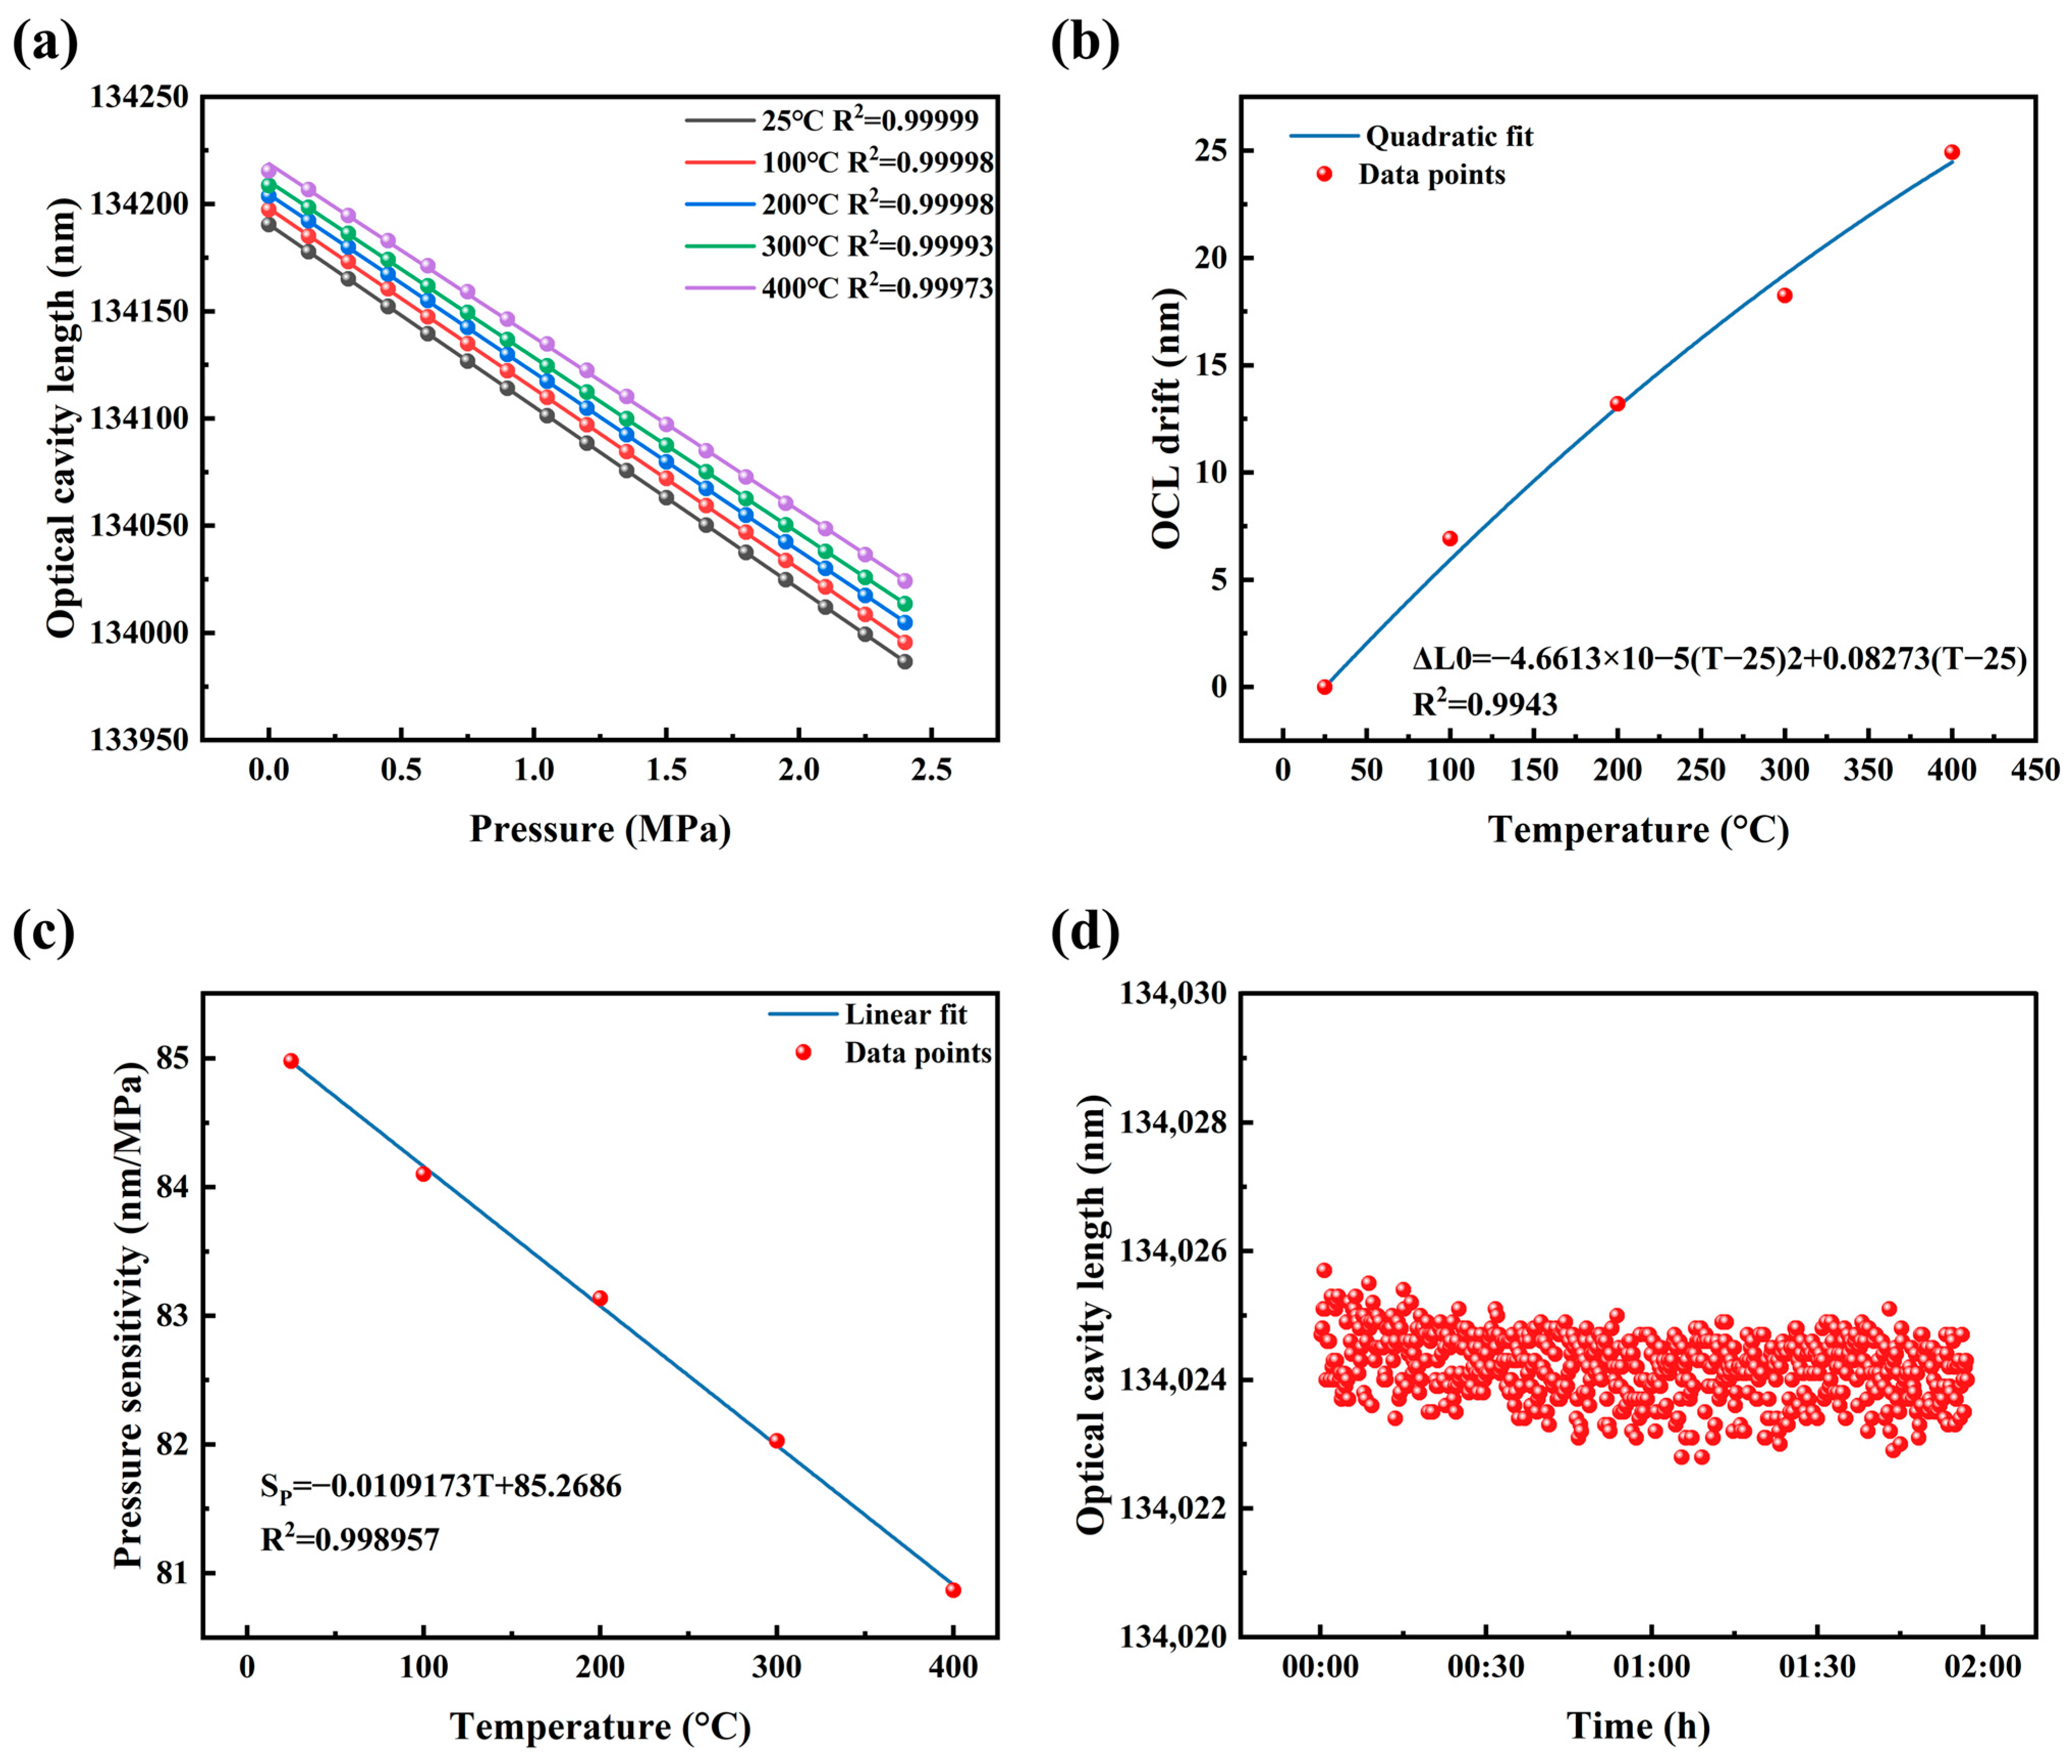
Figure 6a shows the OCL response of the sensor to applied pressure at different temperatures. At all investigated temperatures, the OCL decreases approximately linearly with increasing pressure. The coefficients of determination, , are 0.99999, 0.99998, 0.99998, 0.99993, and 0.99973 at 25, 100, 200, 300, and 400 °C, respectively, demonstrating that the fabricated sensor maintains excellent pressure-response linearity throughout the investigated temperature range.
Figure 6.
(a) OCL responses to applied pressure at different temperatures; (b) zero-pressure OCL drift as a function of temperature; (c) pressure sensitivity magnitude as a function of temperature; (d) OCL stability during continuous monitoring at 400 °C and 2.4 MPa.
Figure 6b presents the zero-pressure OCL drift as a function of temperature, corresponding to the temperature-induced baseline variation discussed in the sensing mechanism section. As the temperature increases from 25 to 400 °C, the zero-pressure OCL drift gradually increases and reaches approximately 24.9 nm at 400 °C. To reduce the fitting error in subsequent temperature-drift compensation, a quadratic fitting relationship is employed, as shown in the figure. The fitted result yields an value of 0.9943, confirming the pronounced influence of temperature on the OCL baseline.
Figure 6c shows the variation in the pressure sensitivity magnitude with temperature, corresponding to the temperature-dependent sensitivity variation described above. Since the OCL decreases with increasing pressure, the sensitivity magnitude, , is used for comparison. As the temperature increases from 25 to 400 °C, decreases from approximately 85.0 to 80.9 nm/MPa. The linear fitting result shown in Figure 6c gives an value of 0.998957, indicating a stable decrease in pressure sensitivity with increasing temperature. The results in Figure 6b,c experimentally confirm that both the OCL baseline drift and the pressure-sensitivity variation should be considered in high-temperature pressure demodulation.
In addition, a continuous 2 h stability test was conducted at 400 °C and 2.4 MPa to evaluate the stability of the sensor output and OCL demodulation result, as shown in Figure 6d. During the test, the OCL remains within a narrow fluctuation range, with only a few discrete points showing relatively larger deviations. These isolated deviations may be mainly attributed to short-term fluctuations during the spectral acquisition process. Because each spectrum requires approximately 11 s for acquisition and data transfer, slight temperature or pressure fluctuations may occur during this interval. In addition, short-term intensity fluctuations of the supercontinuum source and spectral-acquisition noise of the OSA may slightly affect the local envelope of the interference spectrum, resulting in occasional deviations in the demodulated OCL. The maximum peak-to-peak fluctuation over the entire test is approximately 2.9 nm, while the overall trend drift over 2 h is approximately 0.52 nm. Based on the pressure sensitivity magnitude of approximately 80.9 nm/MPa at 400 °C, the overall OCL drift corresponds to a pressure variation of approximately 0.0064 MPa, equivalent to only 0.27% F.S. over the 2.4 MPa full-scale range. These results demonstrate good short-term stability of the fabricated sensor under high-temperature and high-pressure conditions.
Overall, the fabricated silica-diaphragm-based fiber-optic F-P pressure sensor exhibits excellent linear pressure response and good short-term stability over the investigated ranges of 25–400 °C and 0–2.4 MPa. Meanwhile, the static calibration results clearly reveal both temperature-induced OCL baseline drift and temperature-dependent pressure-sensitivity degradation. These characteristics provide the experimental motivation for the following comparison among the fixed room-temperature sensitivity method, the fitting-based compensation method considering both OCL drift and sensitivity variation, and the proposed neural-network-assisted compensation method.
3.2. Hyperparameter Optimization and Model Training Performance
To optimize the neural-network-based pressure compensation model, Optuna was employed to search the architecture and major training parameters of the MLP, with the validation RMSE used as the evaluation criterion. The searched parameters included the number of hidden layers, hidden dimension, activation function, optimizer, loss function, and learning rate.
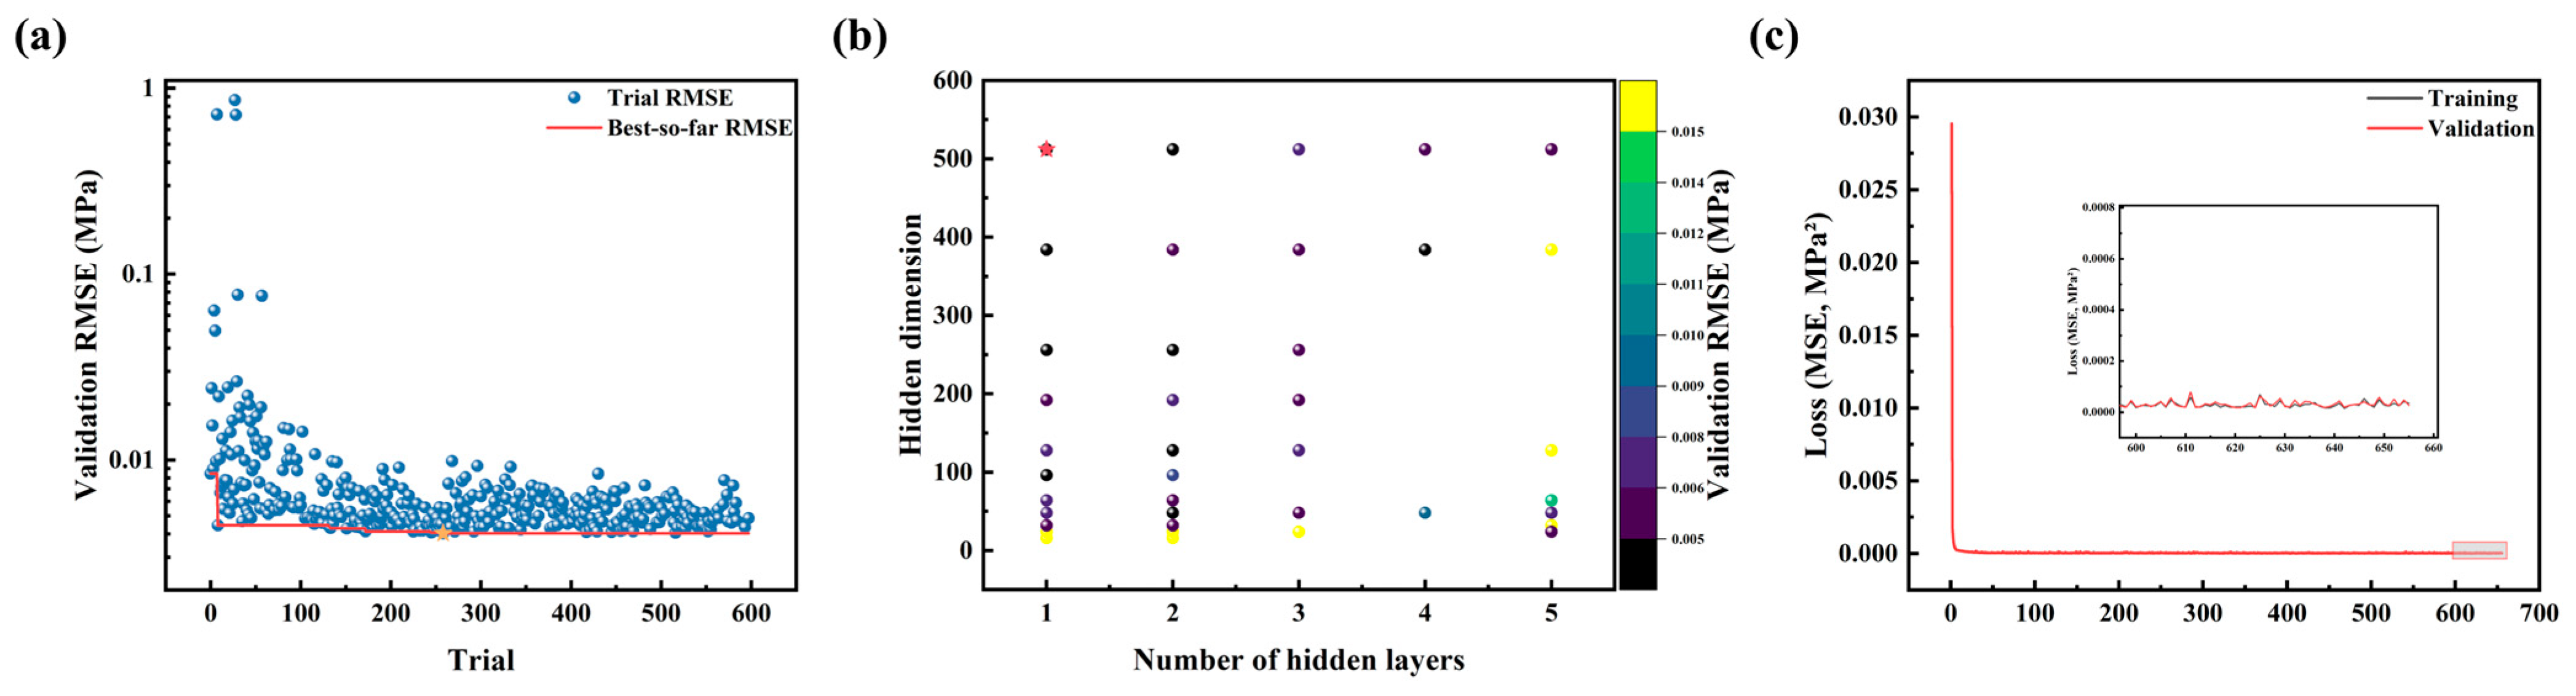
Figure 7a shows the validation RMSE obtained during 600 Optuna trials. In the early stage of the search, the validation errors vary considerably owing to the different hyperparameter combinations. As the search proceeds, trial results with relatively low RMSE become increasingly concentrated, and the best-so-far RMSE curve gradually stabilizes. The lowest validation RMSE of 0.004037 MPa is obtained at Trial 258.
Figure 7.
(a) Validation RMSE and best-so-far RMSE during the Optuna search; (b) influence of hidden-layer number and hidden dimension on the validation RMSE; (c) training and validation MSE loss curves used for convergence analysis.
Figure 7b illustrates the influence of the number of hidden layers and hidden dimension on the validation RMSE, where the color represents the RMSE corresponding to each network configuration and the red star indicates the optimal structure. The optimal configuration consists of one hidden layer with 512 neurons, indicating that a shallow MLP is sufficient for learning the nonlinear pressure compensation relationship based on and temperature in the present dataset.
For the convergence analysis shown in Figure 7c, a ReduceLROnPlateau learning-rate scheduler was used to reduce late-stage oscillations in the loss curves. Figure 7c presents the training and validation MSE loss curves under this training setting. Both curves decrease rapidly during the initial training stage and then converge to a low-error region. As shown in the inset, only slight fluctuations are observed during the late training stage, and the training and validation curves remain close to each other without obvious divergence. These results indicate stable convergence behavior and no evident overfitting.
The optimal hyperparameter configuration obtained from the Optuna search is summarized in Table 1.
Table 1.
Optimal hyperparameter configuration of the neural-network-assisted pressure compensation model.
Based on the optimal model, the pressure demodulation performance of the neural-network-assisted method is further compared with that of the two conventional compensation methods in the following section.
3.3. Comparison of Pressure Demodulation Performance Using Different Compensation Methods
To evaluate the influence of temperature-dependent sensitivity on high-temperature pressure measurement and to verify the effectiveness of the neural-network-assisted method, three temperature-compensation strategies were compared for pressure demodulation. For a fair comparison, the three compensation strategies were evaluated using the same independent test samples, and no newly acquired spectra were introduced for the comparison. The first strategy compensates for the zero-pressure OCL drift while retaining the pressure sensitivity calibrated at 25 °C for pressure calculation, and is referred to as fixed-sensitivity compensation (FSC). The second strategy incorporates both the quadratic fitting relationship of OCL drift and the linear fitting relationship of pressure-sensitivity variation, and is referred to as drift-and-sensitivity fitting compensation (DSFC). The third strategy employs the neural-network model with and temperature as inputs to predict the applied pressure, and is referred to as neural-network-assisted compensation (NNC). In addition, to further evaluate the generalization capability of the proposed NNC model between the calibrated temperature gradients, additional independent intermediate-temperature validation experiments were conducted at 150, 250, and 350 °C using the same pressure-loading and spectral-acquisition procedure.
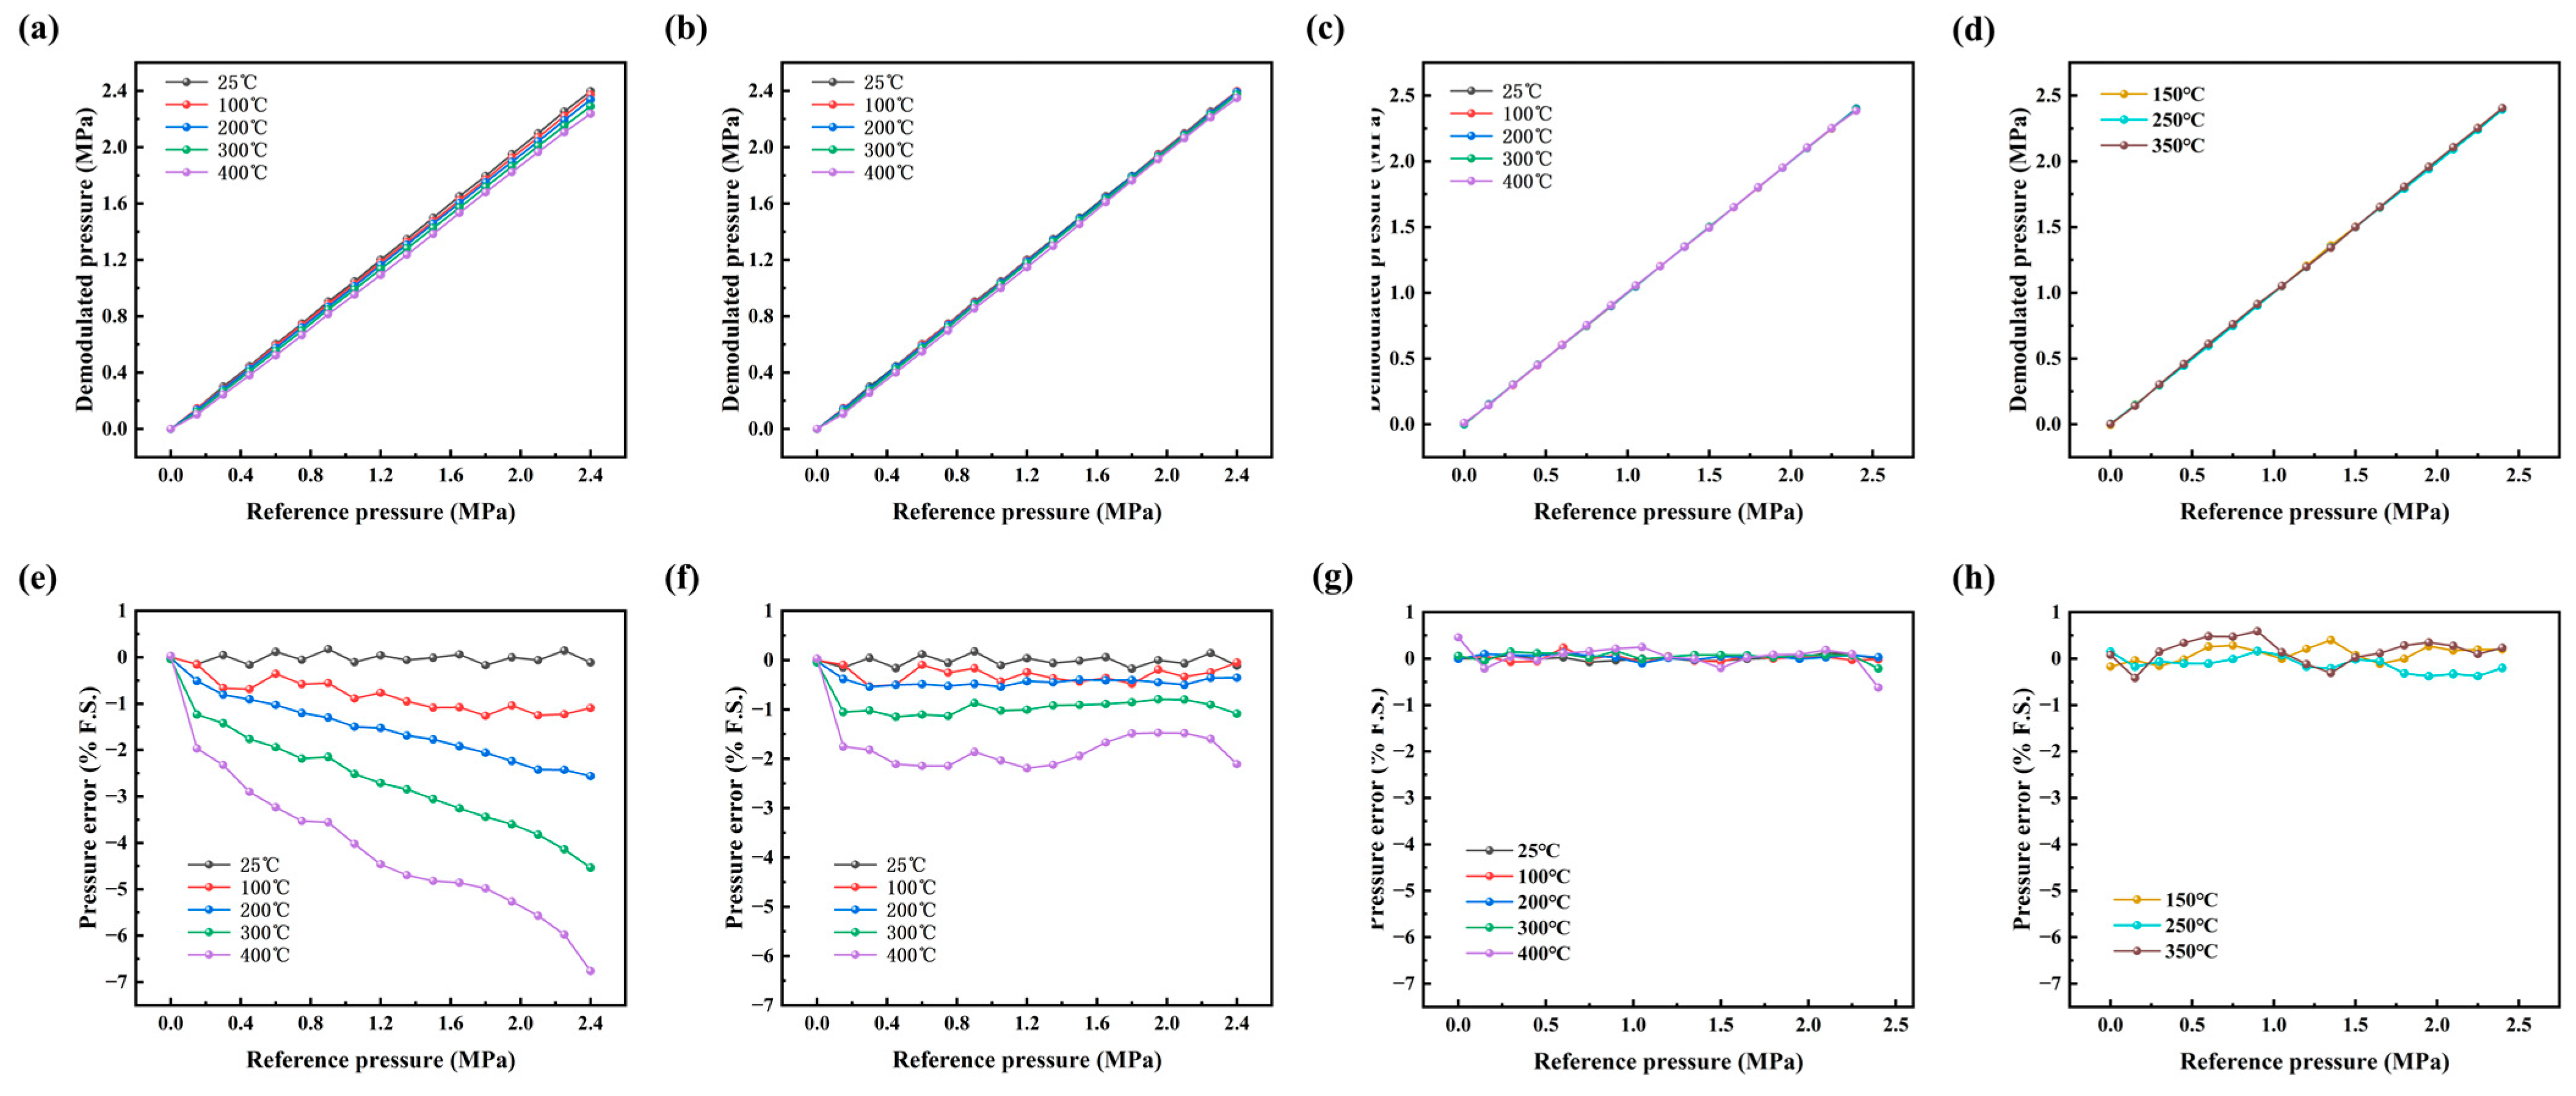
Figure 8a,e show the demodulated pressure results and corresponding full-scale errors obtained using FSC, respectively. Although the zero-pressure OCL drift is compensated, the use of a fixed pressure sensitivity leads to an increasing deviation from the reference pressure as the temperature increases. The error becomes particularly pronounced at elevated temperatures and high pressures, reaching nearly −7% F.S. at 400 °C and 2.4 MPa. This result indicates that compensation for OCL baseline drift alone is insufficient for accurate pressure demodulation under high-temperature conditions.
Figure 8.
(a) Demodulated pressure obtained using fixed-sensitivity compensation (FSC); (b) demodulated pressure obtained using drift-and-sensitivity fitting compensation (DSFC); (c) demodulated pressure obtained using neural-network-assisted compensation (NNC); (d) demodulated pressure obtained using NNC at additional independent temperature points of 150, 250, and 350 °C; (e–h) corresponding full-scale pressure errors obtained using FSC, DSFC, NNC, and NNC at the independent temperature points, respectively.
Figure 8b,f present the results obtained using DSFC. Compared with FSC, the demodulated pressure curves at different temperatures are considerably closer to the reference pressure, and the temperature-induced systematic deviation is markedly reduced. However, residual negative errors remain at elevated temperatures. These errors can be attributed to the fitting residuals of the OCL-drift and pressure-sensitivity variation models. In addition, non-ideal factors, such as residual stress in the diaphragm, fabrication deviations, and temperature-dependent equivalent mechanical properties, may cause the actual response of the sensor to deviate slightly from the fitted relationships.
Figure 8c,g show the pressure demodulation results and full-scale errors obtained using NNC. After neural-network-assisted compensation, the demodulated pressure curves at different temperatures nearly overlap with the reference relationship. The corresponding full-scale errors fluctuate slightly around zero and do not exhibit a systematic increase with either temperature or pressure. This indicates that NNC can further compensate for the residual response deviations that are not sufficiently represented by the analytical fitting relationships.
To further verify the interpolation capability of the proposed NNC model between calibrated temperature gradients, the validation results at the independent intermediate temperatures of 150, 250, and 350 °C are shown in Figure 8d,h. Compared with the NNC results obtained at the calibrated temperatures, the overall prediction accuracy at the independent intermediate temperatures decreases slightly. Nevertheless, the NNC model still maintains high pressure-demodulation accuracy, with an overall RMSE of 0.005533 MPa and a maximum full-scale error below 0.77% F.S. This error level remains markedly lower than those obtained using FSC and DSFC, indicating that the proposed physically guided NNC method can effectively learn the nonlinear mapping among temperature, OCL variation, and pressure even with a relatively limited number of calibration samples, and can provide reliable pressure demodulation at unseen temperature points between the calibrated temperature gradients.
In Figure 8, each plotted point represents the mean demodulation result of repeated independent samples at the corresponding temperature–pressure operating condition. The quantitative performance metrics of the three temperature-compensation strategies at the calibrated temperatures and the additional NNC validation results at the independent intermediate temperatures are summarized in Table 2.
Table 2.
Quantitative comparison of pressure demodulation performance using different compensation methods at calibrated and independent intermediate temperatures.
4. Discussion
The experimental results demonstrate that, under high-temperature conditions, the silica-diaphragm-based fiber-optic F-P pressure sensor exhibits not only a zero-pressure OCL baseline drift but also a temperature-dependent variation in pressure sensitivity. When only the OCL drift was corrected while the room-temperature pressure sensitivity was retained, the maximum full-scale error remained as high as 7.10% F.S. After both the OCL drift and the pressure-sensitivity variation were considered, the fitting-based compensation method reduced the maximum full-scale error to 2.74% F.S. Furthermore, by using and temperature T as physically meaningful inputs, the proposed neural-network-assisted compensation method further decreased the maximum full-scale error to 0.90% F.S. and the pressure-demodulation RMSE to 0.0045 MPa. These results indicate that the neural network can effectively compensate for residual response deviations that cannot be sufficiently represented by analytical fitting relationships, thereby improving the high-temperature pressure demodulation accuracy of the silica-diaphragm-based sensor.
To further evaluate the high-temperature pressure-measurement performance of the proposed method, several representative silica-based fiber-optic F-P pressure sensors were selected for comparison, as summarized in Table 3.
Table 3.
Performance comparison of representative silica-based fiber-optic F-P pressure sensors for high-temperature pressure measurement.
As shown in Table 3, previously reported silica-based fiber-optic F-P pressure sensors have improved high-temperature pressure measurement through different routes, including all-silica structural design, FBG-assisted temperature compensation, open-cavity pressure sensing, Vernier-effect enhancement, and cavity–grating integration. These approaches provide important advantages in terms of high-temperature tolerance, pressure range, sensitivity enhancement, or multiparameter measurement capability. In comparison, the present work focuses on improving the pressure-demodulation accuracy of a simple silica-diaphragm-based F-P sensor through a more targeted compensation strategy. Specifically, the proposed method considers not only the zero-pressure OCL baseline drift but also the temperature-dependent pressure sensitivity and the residual nonlinear response deviations that remain after analytical fitting. Therefore, within the investigated range of 25–400 °C and 0–2.4 MPa, the neural-network-assisted compensation method achieves a relatively low maximum full-scale error of 0.90% F.S. and an RMSE of 0.0045 MPa. This indicates that physically guided neural-network compensation can be an effective complement to conventional analytical compensation when the sensor response contains both temperature-dependent sensitivity variation and residual nonideal deviations. Nevertheless, the achievable compensation accuracy is still closely related to the intrinsic stability of the sensor structure, the repeatability of OCL demodulation, the coverage of calibration data, and possible changes in diaphragm mechanical response after long-term thermal exposure or repeated thermal cycling.
The results reported in this study were obtained from static calibration experiments within the investigated temperature range of 25–400 °C. For a thin fused-silica diaphragm, repeated thermal cycling or prolonged exposure to more severe high-temperature conditions may alter its mechanical response and reduce measurement repeatability. Such changes would affect any compensation relationship established from the original calibration data, including both analytical fitting and neural-network-based compensation. Therefore, after exposure to more severe high-temperature conditions or significant thermal cycling, the sensor should be recalibrated and the corresponding compensation model should be updated before accurate pressure measurement is performed.
5. Conclusions
In this work, a structurally simple and readily fabricated silica-diaphragm-based fiber-optic Fabry–Perot pressure sensor was developed for high-temperature pressure measurement, and a neural-network-assisted compensation method was proposed to improve its pressure demodulation accuracy. Theoretical analysis and static experiments conducted over 25–400 °C and 0–2.4 MPa demonstrated that the sensor response is affected not only by temperature-induced OCL baseline drift but also by temperature-dependent pressure-sensitivity variation. Therefore, correction of OCL drift alone is insufficient for accurate pressure measurement under high-temperature conditions. The OCL was accurately demodulated from the reflection spectrum using the FFT-assisted dual-peak and MMSE refinement method, and three compensation strategies were compared. The maximum full-scale errors obtained using fixed 25 °C sensitivity compensation, drift-and-sensitivity fitting compensation, and neural-network-assisted compensation were 7.10% F.S., 2.74% F.S., and 0.90% F.S., respectively. In particular, the proposed neural-network-assisted method, which uses and ambient temperature as physically meaningful input features, achieved a pressure-demodulation RMSE of 0.0045 MPa. Furthermore, the additional validation results at the independent intermediate temperatures of 150, 250, and 350 °C demonstrate that the proposed NNC model maintains good generalization capability between calibrated temperature gradients, with an overall RMSE of 0.0055 MPa and a maximum full-scale error below 0.77% F.S. These results demonstrate that physical-feature-based neural-network compensation can effectively correct residual nonlinear response deviations while preserving a simple silica-diaphragm sensing structure. Owing to its low structural complexity, ease of customized fabrication, and improved high-temperature pressure demodulation accuracy, the proposed sensor and compensation method may offer promising application potential for pressure monitoring in high-temperature engineering environments.
Author Contributions
Conceptualization, Z.L. (Zhaoyi Li), Z.H. and C.X.; Methodology, Z.L. (Zhaoyi Li), S.G., Z.H. and C.X.; Software, Z.L. (Zhaoyi Li); Validation, Z.L. (Zhaoyi Li), S.G., R.L., H.Z. and Q.Z.; Formal analysis, Z.L. (Zhaoyi Li), S.G. and H.Z.; Investigation, Z.L. (Zhaoyi Li), S.G., R.L., Z.Z., H.Z., E.W. and Q.Z.; Data curation, Z.L. (Zhaoyi Li) and S.G.; Visualization, Z.L. (Zhaoyi Li); Writing—original draft preparation, Z.L. (Zhaoyi Li); Writing—review and editing, Z.L. (Zhaoyi Li), S.G., R.L., Z.Z., H.Z., E.W., Q.Z., Z.L. (Zhichun Liu), Z.H. and C.X.; Supervision, Z.H. and C.X.; Project administration, Z.H. and C.X.; Funding acquisition, Z.H. and C.X. All authors have read and agreed to the published version of the manuscript.
Funding
This research received no external funding.
Institutional Review Board Statement
Not applicable.
Informed Consent Statement
Not applicable.
Data Availability Statement
The data presented in this study are available on request from the corresponding author.
Conflicts of Interest
The authors declare no conflicts of interest.
References
- Brindisi, A.; Vendittozzi, C.; Bellini, C.; Di Cocco, V.D.; Travascio, L.; Di Palma, L.D.; Belardo, M.; Concilio, A. Fiber Bragg Grating Bonding Characterization under Long-Period Cyclic Loading. Photonics 2023, 10, 906. [Google Scholar] [CrossRef] [Scilit]
- Brindisi, A.; Vendittozzi, C.; Travascio, L.; Di Palma, L.; Ignarra, M.; Fiorillo, V.; Concilio, A. A Preliminary Assessment of an FBG-Based Hard Landing Monitoring System. Photonics 2021, 8, 450. [Google Scholar] [CrossRef] [Scilit]
- Li, G.; Wang, Y.; Yan, M.; Xu, T.; Shi, A.; Liu, Y.; Li, X.; Li, F. Fiber Bragg Grating Salinity Sensor Array Based on Fiber Tapering and HF Etching. Photonics 2023, 10, 1315. [Google Scholar] [CrossRef] [Scilit]
- Zhou, L.; Yu, Y.; Huang, H.; Tao, Y.; Wen, K.; Li, G.; Yang, J.; Zhang, Z. Salinity Sensing Characteristics Based on Optical Microfiber Coupler Interferometer. Photonics 2020, 7, 77. [Google Scholar] [CrossRef] [Scilit]
- Engholm, M.; Hammarling, K.; Andersson, H.; Sandberg, M.; Nilsson, H.-E. A Bio-Compatible Fiber Optic pH Sensor Based on a Thin Core Interferometric Technique. Photonics 2019, 6, 11. [Google Scholar] [CrossRef] [Scilit]
- Kim, J.H.; Kim, S.; Song, S.; Lim, T.; Park, J.H.; Kim, J.; Pyeon, C.H.; Hwang, S.W.; Lee, B. Gamma-ray Spectroscopy Using Inorganic Scintillator Coated with Reduced Graphene Oxide in Fiber-Optic Radiation Sensor. Photonics 2021, 8, 543. [Google Scholar] [CrossRef] [Scilit]
- Perrot, J.; Morana, A.; Marin, E.; Ouerdane, Y.; Boukenter, A.; Bertrand, J.; Girard, S. Combined Radiation and Temperature Effects on Brillouin-Based Optical Fiber Sensors. Photonics 2023, 10, 1349. [Google Scholar] [CrossRef] [Scilit]
- Uddin, N.; Sheng, Q.; Lee, S.; Reinke, M.L.; Donovan, D.; Shafer, M.; Han, M. Multichannel Fiber-Optic Silicon Fabry–Pérot Interferometric Bolometer System for Plasma Radiation Measurements. Photonics 2021, 8, 344. [Google Scholar] [CrossRef] [Scilit]
- Li, W.; Liang, T.; Jia, P.; Lei, C.; Hong, Y.; Li, Y.; Yao, Z.; Liu, W.; Xiong, J. Fiber-optic Fabry-Perot pressure sensor based on sapphire direct bonding for high-temperature applications. Appl. Opt. 2019, 58, 1662–1666. [Google Scholar] [PubMed]
- Xu, X.; Wang, F.; Han, G.; Tang, H.; Zhou, W.; Lei, X.; Liu, X. All-Ceramic Fiber Fabry-Perot Cavity High-Temperature Pulsating Pressure Sensor Based on HTCC. Sensors 2025, 25, 3678. [Google Scholar] [PubMed]
- Zhang, Y.; Yuan, L.; Lan, X.; Kaur, A.; Huang, J.; Xiao, H. High-temperature fiber-optic Fabry-Perot interferometric pressure sensor fabricated by femtosecond laser. Opt. Lett. 2013, 38, 4609–4612. [Google Scholar] [CrossRef] [Scilit] [PubMed]
- Liang, H.; Jia, P.; Liu, J.; Fang, G.; Li, Z.; Hong, Y.; Liang, T.; Xiong, J. Diaphragm-Free Fiber-Optic Fabry-Perot Interferometric Gas Pressure Sensor for High Temperature Application. Sensors 2018, 18, 1011. [Google Scholar] [CrossRef] [Scilit] [PubMed]
- Guo, M.; Zhang, Q.; Su, Z.; Zhu, H.; Liang, R.; Zhang, C.; Wang, B.; Guo, B.; Zheng, Y.; Chen, J.; et al. Simultaneous Measurement of Gas Pressure and Temperature Sensor Based on F-P Interference Using Hollow Core Bragg Fiber. IEEE Sens. J. 2024, 24, 39028–39034. [Google Scholar] [CrossRef] [Scilit]
- Yao, G.; Li, Y.; Shang, Q.; Fan, H. Research on Temperature Compensation of Optical Fiber MEMS Pressure Sensor Based on Conversion Method. Photonics 2022, 10, 22. [Google Scholar] [CrossRef] [Scilit]
- Jia, P.; Liang, H.; Fang, G.; Qian, J.; Feng, F.; Liang, T.; Xiong, J. Batch-producible MEMS fiber-optic Fabry-Perot pressure sensor for high-temperature application. Appl. Opt. 2018, 57, 6687–6692. [Google Scholar] [CrossRef] [Scilit] [PubMed]
- Li, K.; Wang, Y.; Li, G.; Xu, Z.; Liu, Y.; Shi, A.; Yu, X.; Li, F. Optical Fiber Pressure Sensor with Self-Temperature Compensation Structure Based on MEMS for High Temperature and High Pressure Environment. Photonics 2025, 12, 258. [Google Scholar] [CrossRef] [Scilit]
- Li, J.; Jia, P.; Fang, G.; Wang, J.; Qian, J.; Ren, Q.; Xiong, J. Batch-producible all-silica fiber-optic Fabry–Perot pressure sensor for high-temperature applications up to 800 °C. Sens. Actuators A Phys. 2022, 334, 113363. [Google Scholar] [CrossRef] [Scilit]
- Guo, M.; Zhang, Q.; Zhu, H.; Liang, R.; Zheng, Y.; Zhu, X.; Wang, E.; Li, Z.; Xue, C.; Hai, Z. Performance Study of F-P Pressure Sensor Based on Three-Wavelength Demodulation: High-Temperature, High-Pressure, and High-Dynamic Measurements. Sensors 2024, 24, 5313. [Google Scholar] [CrossRef] [Scilit] [PubMed]
- Liang, R.; Zhu, H.; Zhu, X.; Guo, M.; Zhang, Q.; Su, Z.; Chen, J.; Hai, Z.; Zheng, Y.; Xue, C. FPI-FBG Cascaded High-Temperature Pressure Sensor up to 700 °C Based on Vernier Effect Utilizing Femtosecond Laser. IEEE Sens. J. 2024, 24, 28818–28826. [Google Scholar] [CrossRef] [Scilit]
- Liang, R.; Zhu, H.; Zhang, Q.; Zhu, X.; Wang, E.; Li, Z.; Zhao, Y.; Gao, L.; Liu, Z.; Hai, Z.; et al. Cavity-Grate Integrated All-Fiber-Optic High-Temperature Pressure Sensor with Enhanced Contrast and Sensitivity. IEEE Trans. Instrum. Meas. 2026, 75, 9510310. [Google Scholar] [CrossRef] [Scilit]
- Duan, B.; Hai, Z.; Guo, M.; Zheng, Y.; Chen, J.; Bai, J.; Su, Z.; Liang, R.; Zhu, H.; Zhang, Q.; et al. A Large-Range and High-Sensitivity Fiber-Optic Fabry-Perot Pressure Sensor Based on a Membrane-Hole-Base Structure. Micromachines 2024, 15, 174. [Google Scholar] [CrossRef] [Scilit] [PubMed]
- Liao, Y.; Liu, J.; Dai, Y.; Wang, J.; Wan, S.; Zhang, L.; Wang, H.; Jia, P. Temperature-compensated fiber-optic Fabry-Perot pressure sensor based on sapphire MEMS technology for high temperature environment up to 1500 °C. Opt. Express. 2025, 33, 19453–19463. [Google Scholar] [CrossRef] [Scilit] [PubMed]
- Liu, H.; Zhou, C.; Pang, Y.; Chen, X.; Pan, Z.; Wang, L.; Fan, D. Temperature Demodulation for an Interferometric Fiber-Optic Sensor Based on Artificial Bee Colony–Long Short-Term Memory. Photonics 2023, 10, 1157. [Google Scholar] [CrossRef] [Scilit] [PubMed]
- Wang, L.; Liu, H.; Pan, Z.; Xu, Y.; Fan, D.; Zhou, C.; Li, Y. Temperature demodulation for optical fiber F-P sensor based on DBNs with ensemble learning. Opt. Laser Technol. 2023, 162, 109275. [Google Scholar] [CrossRef] [Scilit]
- Chen, S.; Yao, F.; Ren, S.; Yang, J.; Yang, Q.; Yuan, S.; Wang, G.; Huang, M. Fabry-Perot interferometric sensor demodulation system utilizing multi-peak wavelength tracking and neural network algorithm. Opt. Express 2022, 30, 24461–24480. [Google Scholar] [PubMed]
- Bai, J.; Cao, S.; Chai, H.; Zheng, Y.; Xue, C. Ultrahigh-Speed Demodulation for Fabry-Pérot Sensors Based on Spatio-Temporal Features of Sparse Spectra. J. Light. Technol. 2025, 43, 6957–6968. [Google Scholar] [CrossRef] [Scilit]
- Spinner, S.A.M. Temperature Dependence of Elastic Constants of Vitreous Silica. J. Am. Ceram. Soc. 2006, 45, 394–397. [Google Scholar] [CrossRef] [Scilit]
- Zhu, Y.; Zhou, J.; Jin, T.; Wu, X.; Zhu, M.; Zhang, L.; Pang, F.; Zhang, D.; Wei, H.; Zheng, S.; et al. High-temperature-resistant gas pressure sensor based on an all-silica Fabry-Perot interferometer. Appl. Opt. 2025, 64, 5688–5697. [Google Scholar] [CrossRef] [Scilit] [PubMed]

Disclaimer/Publisher’s Note: The statements, opinions and data contained in all publications are solely those of the individual author(s) and contributor(s) and not of MDPI and/or the editor(s). MDPI and/or the editor(s) disclaim responsibility for any injury to people or property resulting from any ideas, methods, instructions or products referred to in the content. |
© 2026 by the authors. Licensee MDPI, Basel, Switzerland. This article is an open access article distributed under the terms and conditions of the Creative Commons Attribution (CC BY) license.