


Abstract
Spin squeezing can suppress quantum projection noise via interparticle entanglement, therefore enabling measurement sensitivities beyond the standard quantum limit. In practice, however, the Gaussian and finite intensity profiles of the optical probe beam induce spatially inhomogeneous atom-light interactions. As polarized atoms move within a vapor cell, they experience position-dependent optical intensities, generating transit noise that limits spin squeezing performance. Here, we investigate the transit noise in a coated rubidium vapor cell through combined theoretical analysis and experimental measurements. By varying the probe beam diameter, we quantify the dependence of transit noise on beam size and atomic Larmor frequency. Our results show that, for a vapor cell with fixed dimensions, the transit noise increases as the probe beam spot area decreases. Moreover, when the Larmor frequency is below the characteristic linewidth of the transit noise, the noise contribution becomes larger. We further calculated and measured spin squeezing for different beam sizes and found an experimental difference of dB between 2 mm and 0.6 mm, similar to the theoretical prediction of dB. Theoretical analysis under conditions of stronger squeezing shows that transit noise becomes an even more critical limiting factor. These results provide practical guidance for optimizing probe beam parameters and suppressing transit noise in spin squeezing experiments.
1. Introduction
Precision measurement is important for both fundamental physics research [1,2] and practical applications in external field sensing [3,4]. Atoms have received much attention in the field of precision measurement due to their advantages, such as simple energy level structures, narrow transition linewidths, sensitivity to various external fields, and ease of state manipulation and readout [5,6,7,8]. The core advantage of quantum precision measurement is the possibility to harness quantum properties like coherence and entanglement [9] to surpass the precision limit of classical measurement techniques—the standard quantum limit (SQL). Among these, spin squeezing [10,11], as a technique for quantum entanglement, can utilize correlations between particles [12] to suppress noise, thereby breaking the SQL. In recent years, the field of spin squeezing has witnessed significant progress in applications such as atomic clocks [13,14], atom interferometers [15], and atomic magnetometers [16,17].
Spin-squeezed states have been extensively investigated in a wide range of physical platforms [18,19,20,21,22,23,24]. Hot atomic ensembles are particularly attractive for precision measurements owing to their large atom numbers. However, in thermal vapors, the rapid atomic motion causes atoms to repeatedly enter and exit the probe beam region, giving rise to transit noise. Moreover, the spatially varying intensity of the probe beam leads to temporally and spatially inhomogeneous atom-light interactions as atoms move across the beam profile. Consequently, the realization of spin squeezing in such systems requires effective suppression of transit noise and interaction inhomogeneity. In 2020, Tang et al. [25] employed a variable-diameter flat-top probe beam to investigate atomic transit noise in an unpolarized vapor in a coated cell. They demonstrated that the total spin noise power scales inversely with the beam area, whereas the Ramsey peak power remains independent of it. In 2023, Wang et al. [26] utilized a similar flat-top configuration to precisely control the effective atom number in an atomic superheterodyne microwave receiver, revealing that transit noise constitutes a fundamental limitation to its sensitivity. In 2024, Yang et al. [27] studied transit noise in a Rydberg receiver and showed that its spectral bandwidth scales inversely with the beam waist, while the noise amplitude depends on the probe intensity. In the same year, Bærentsen et al. [28] compared the flat-top and Gaussian probing of a Cs ensemble and identified spatially uniform illumination as an effective approach for suppressing transit noise. Despite these advances, the role of transit noise in spin squeezing experiments, to the best of our knowledge, has not been studied.
In this work, we investigated the influence of atomic transit noise on spin squeezing with polarized atoms by varying the diameter of a Gaussian probe beam, combining theoretical analysis with experimental measurements. Although the qualitative trend of larger transit noise for smaller probe beams is physically intuitive, its effect on spin squeezing is not determined solely by the transit noise background. In QND-based spin squeezing, the atomic transit process also modifies the temporal correlation of the detected optical signal and thereby affects the conditional variance reduction. In particular, we found that as the laser beam size varies, the change in the degree of spin squeezing in decibels (dB) is larger than the corresponding change in the transit noise level. First, we measured the atomic spin noise spectra at different Larmor frequencies and beam sizes, and the results show that the transit noise increases for smaller beam diameters and becomes more pronounced at lower Larmor frequencies. Then, we evaluated the achievable spin squeezing at a Larmor frequency of 500 kHz, observing an experimental difference of dB between probe beam diameters of 0.6 mm and 2 mm, similar to the theoretical value of dB, both far exceeding the corresponding changes in the level of transit noise (less than 1 dB). These findings demonstrate that transit noise constitutes a significant limitation to spin squeezing and that the probe beam size plays a crucial role in determining the maximum achievable squeezing.
2. Theory
2.1. The Input-Output Relation of a Quantum Nondemolition Measurement
The coated 87Rb vapor cell used in our experiment contains about atoms. In such a large atomic ensemble, the atoms are individually indistinguishable, and the atomic state of the entire system can be described by a collective spin operator. The collective angular momentum operator of the atomic ensemble is defined as:
where , is the dimensionless spin operator of the i-th atom, and is the total number of atoms in the vapor cell.
We assume that the atoms are optically pumped into the stretched state of the hyperfine manifold and are highly polarized along the x-direction. In this case, the angular momentum component is treated as the classical component, ; the orthogonal components and exhibit quantum fluctuations, satisfying and [29] and are called the quantum components since the angular momentum in the x-direction is much larger than those in the y- and z-directions. We describe the atomic ensemble in this state as a coherent spin state (CSS). For such a highly polarized atomic ensemble, according to the Holstein–Primakoff (HP) approximation [30], we can define the two quantum components as a pair of canonically conjugate operators:
For the quantum state of light, we employ the Stokes operators to describe the polarization state. For a light beam propagating along the z-direction, the Stokes operators can be defined as:
where and denote the photon numbers in the x and y linear polarizations, and denote the photon numbers in the and linear polarizations, and denote the photon numbers in the left and right circular polarization modes. As can be seen, is a dimensionless quantity. We can also define the Stokes vector per unit time, , whose dimension is , satisfying , where T is the total duration of the probe light. Similar to the collective spin operator of atoms, the Stokes operators of light can also define a pair of canonically conjugate operators:
In our system, the effective Hamiltonian for the atom-light interaction [31] can be written (schematically) as:
where is the scalar term (AC Stark shift), is the vector term and is the tensor term. In our theory and experiments, we consider only the vector interaction term, which represents the Faraday interaction between light and atoms, enabling the exchange of information between light and atoms [10,29]. The scalar term is included in an effective frequency shift. For the detuning used in the experiment, the tensor contribution was much smaller than the vector contribution and is neglected in the following analysis. In the far-detuned case, the Hamiltonian can be approximated as [22,31,32]:
where , ℏ is the reduced Planck constant, c is the speed of light, is the nature width of the excited state, is the wavelength, A is the area of the atom-light interaction, is the detuning of the probe, is the vector interaction coefficient, is the Stokes operator density of the propagating light field with units of inverse length and is the number density. According to the Heisenberg equation of motion and the propagation equation for Stokes operators, and after replacing the atomic collective spin operators and Stokes operators with their respective canonical quadrature operators, the differential equation for the atomic spin operator can be expressed as:
and the input-output relation for the atom-light interaction is obtained [33]:
where is the effective atom-light coupling strength in the idealized homogeneous coupling limit. A more detailed expression for , showing its relationship to the optical power, is presented in Appendix A. More generally, however, atom-light coupling may vary in time and is then denoted by , which represents the instantaneous atom-light coupling strength. This time dependence can arise, for example, from temporal modulation of the probe or from the fact that atoms experience different local probe intensities at different times. Its explicit dependence on the atomic motion will be introduced in the following subsection. The effective coupling may be regarded as the spatially and temporally averaged value of the instantaneous coupling .
From the input-output relation, it can be seen that remains constant during the interaction process, so the interaction is non-demolishing with respect to . Meanwhile, acquires information about through the interaction. Therefore, by measuring , one can achieve a quantum nondemolition [34,35,36] (QND) measurement of . The above derivation neglects the presence of an external magnetic field, so the Larmor frequency is zero. By applying an external magnetic field, the measurement frequency can be shifted away from zero. Therefore, after adding a bias magnetic field along the x direction, the Hamiltonian can be expressed as:
where is the Larmor frequency. In the presence of a bias magnetic field, the atomic quadratures precess at the Larmor frequency , so that the measured collective spin component becomes a rotating quadrature:
2.2. Theoretical Model
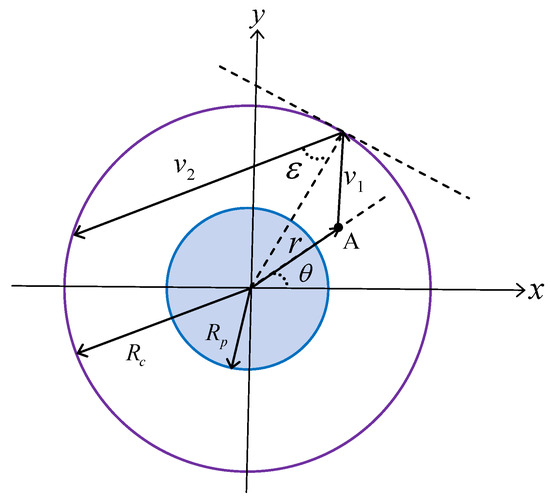
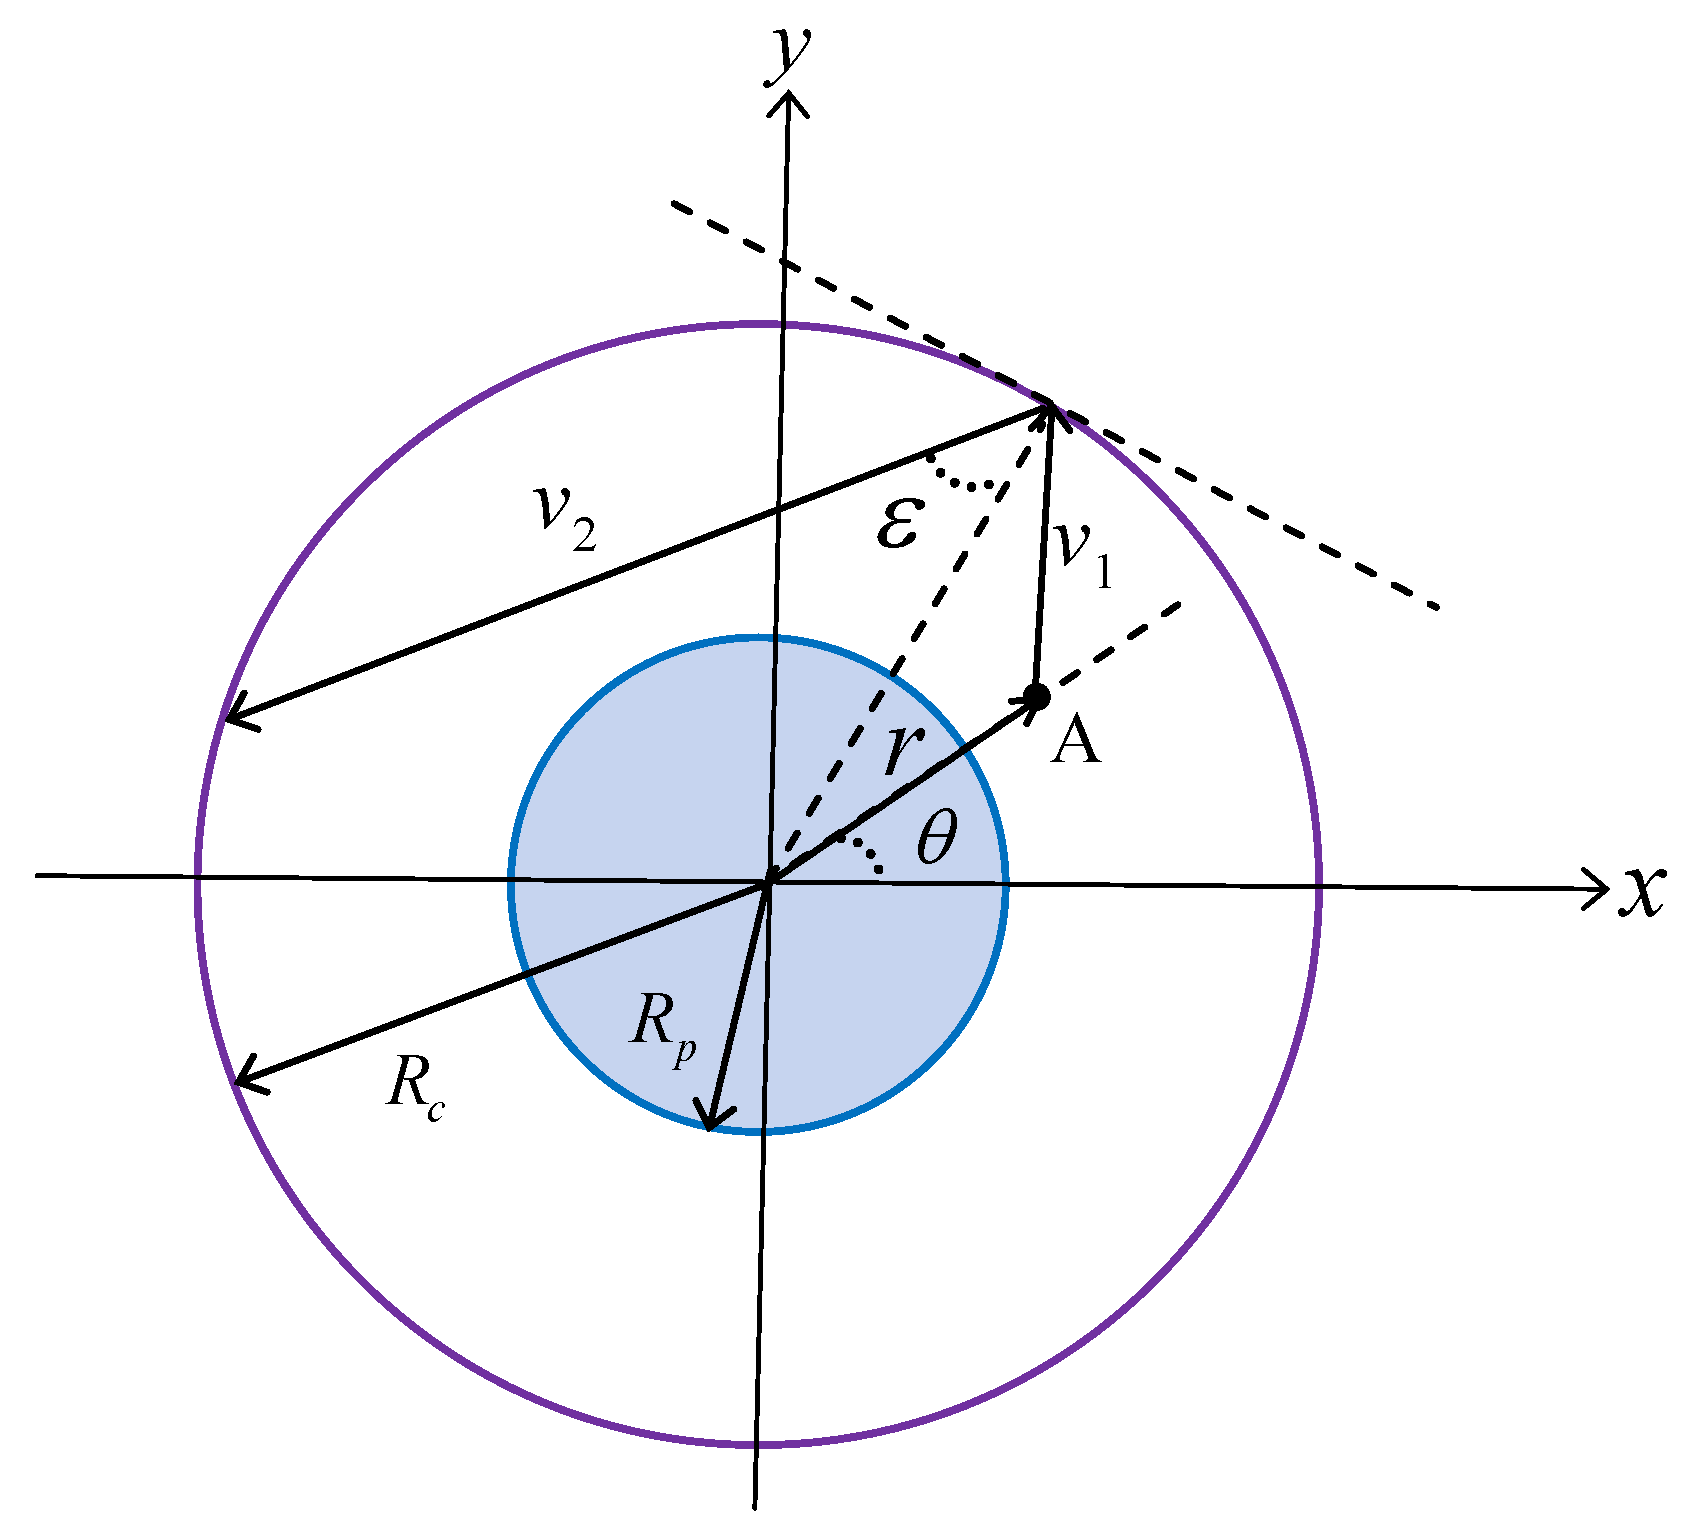
We employ the Monte Carlo method to simulate the motion of atoms in the coated cell, tracking random motion and wall collisions. For a Gaussian probe beam propagating along the z-axis, since the cell length is much shorter than the Rayleigh length, we assume that the intensity is uniform along z and varies mainly in the transverse plane. Based on the simplified model, the schematic diagram of atomic motion is shown in Figure 1. The cell has an effective cross-sectional radius , and the probe beam with radius is centered within the cell. We assume that at the initial time, the atoms are uniformly distributed throughout the volume of the cell. The initial position of the atom is the point A, which is described using polar coordinates , where the square of the radial coordinate, , is uniformly distributed in the range , and the polar angle is uniformly distributed in the range . The speed of the atom follows a two-dimensional Maxwell-Boltzmann distribution:
where , is the Boltzmann constant, m is the mass of a 87Rb atom, and T is the temperature of the vapor.
Figure 1.
Schematic diagram of atomic motion inside a rubidium vapor cell. The blue area is the region covered by the light spot; the dashed lines are the tangent and normal lines, respectively.
We further consider the description of atomic collisions within the coated cell. During their high-speed motion, atoms experience both atom-atom and atom-wall collisions. Given that for our operating temperature the mean free path of the atoms is significantly larger than the dimensions of the vapor cell, the rate of atom-atom collisions is negligible compared to that of atom-wall collisions. Therefore, we omit the former to simplify the model. The collision process between atoms and the cell wall is simulated with a diffuse reflection model based on Knudsen’s cosine law [37,38]. This law assumes that after the collision, the reflection direction follows a specific angular distribution: The probability of a reflection angle (relative to the normal of the wall) is proportional to . In the simulation implementation, a collision is identified when the atomic trajectory intersects the boundary of the cell, and the post-collision direction of the atom is randomly sampled according to this distribution. The speed after collision is denoted by . Since atoms with higher velocities are more likely to collide with the cell wall during their motion, a flux-weighted speed distribution is adopted so that the speed distribution of atoms after collisions matches the initial two-dimensional Maxwell-Boltzmann distribution, preserving the system’s thermal equilibrium. The flux-weighted velocity distribution can be expressed as:
In the Monte Carlo simulation, the atom-light coupling is not treated as a constant. Instead, for each atom, the instantaneous coupling strength is determined by the local probe intensity along its trajectory inside the Gaussian probe beam. As a result, the coupling fluctuates in time as the atom moves across regions with different optical intensities, which gives rise to transit-induced coupling inhomogeneity.
The decoherence of atomic spins arises primarily from various relaxation mechanisms, including atom-atom collisions, atom-wall collisions, and spontaneous emission. These effects lead to the decay of ground-state coherence, thereby shortening the coherence lifetime. In this simulation, two main decoherence mechanisms are considered: atom-wall collisions and spontaneous emission. As for the decoherence induced by atom-wall collisions, we adopt one of the classical approaches, namely, random phase resetting: when an atom collides with the rubidium cell wall, its spin state is randomly reset with a certain probability to simulate the random decoherence caused by the collision. For the decoherence induced by spontaneous emission, we use to denote the decay rate. However, if spontaneous emission is modeled merely as a classical exponential decay term, it would violate the fundamental commutation relations satisfied by the spin operators in quantum mechanics, leading to unphysical results. Therefore, a Langevin noise term [39] is introduced to maintain the completeness of quantum mechanics. The equations of motion for the atomic collective spin operator and can now be written as:
where and are Langevin noise operators with appropriate variance. The decay rate includes contributions from probe-induced decoherence and other relaxation processes. In particular, the probe-induced part depends on the local probe intensity along the atomic trajectory. For different probe beam sizes at a fixed total optical power, the higher local intensity of a smaller beam is automatically compensated by the shorter residence time of the atoms inside the beam, so the spatially and temporally averaged spontaneous-emission-induced decoherence remains approximately unchanged. In the presence of Larmor precession, the measured spin component rotates in time, so the atom-light interaction is no longer a QND measurement of a fixed atomic quadrature . To recover an effective QND measurement, the atom-light coupling can be modulated in time; i.e., is modulated at twice the Larmor frequency. In practice, this corresponds to a stroboscopic probing scheme, in which the same atomic quadrature is repeatedly measured [10,11,24]. In this way, the measurement remains effectively QND despite the Larmor evolution.
2.3. Degree of Spin Squeezing
There are various definitions of spin squeezing parameters. In this paper, we adopt the spin squeezing parameter proposed by Wineland et al. [29,40], which is given by
which denotes the ratio between the phase resolution of the squeezed state and that of an ideal coherent spin state, which indicates the metrological gain of the entangled state.
By extracting the atomic spin information from the light signal, the degree of spin squeezing can be computed via covariance and conditional variance analysis. The raw data are processed in three steps. The first step is performing a covariance analysis on the signal , which is represented as a matrix , where n is the number of samplings, and N indicates the number of repeated measurements. After processing the covariance, an matrix is obtained. Its diagonal elements correspond to the variances in the measured signals at different times, while the off-diagonal elements represent the degree of correlation between signals at different times. Second, the conditional variance is calculated. The conditional spin squeezing in a QND measurement arises from the Faraday interaction between light and atoms, which entangles them and imprints atomic information onto the light signal. This constitutes a form of forward-predictive conditional spin squeezing. According to the definition of conditional variance, under the measurement result of , the conditional variance of the atomic spin can be expressed as:
where is the correlation strength between and . Finally, the projection noise limit (PNL) needs to be calibrated. Experimentally, the PNL is calibrated at 4/5 times [33] the thermal state noise to evaluate the squeezing; theoretically, the stationary-atom noise can be used as the SQL reference.
3. Experimental Setup
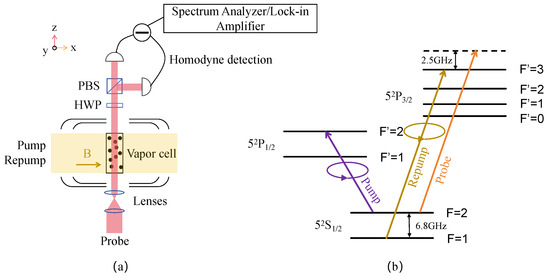
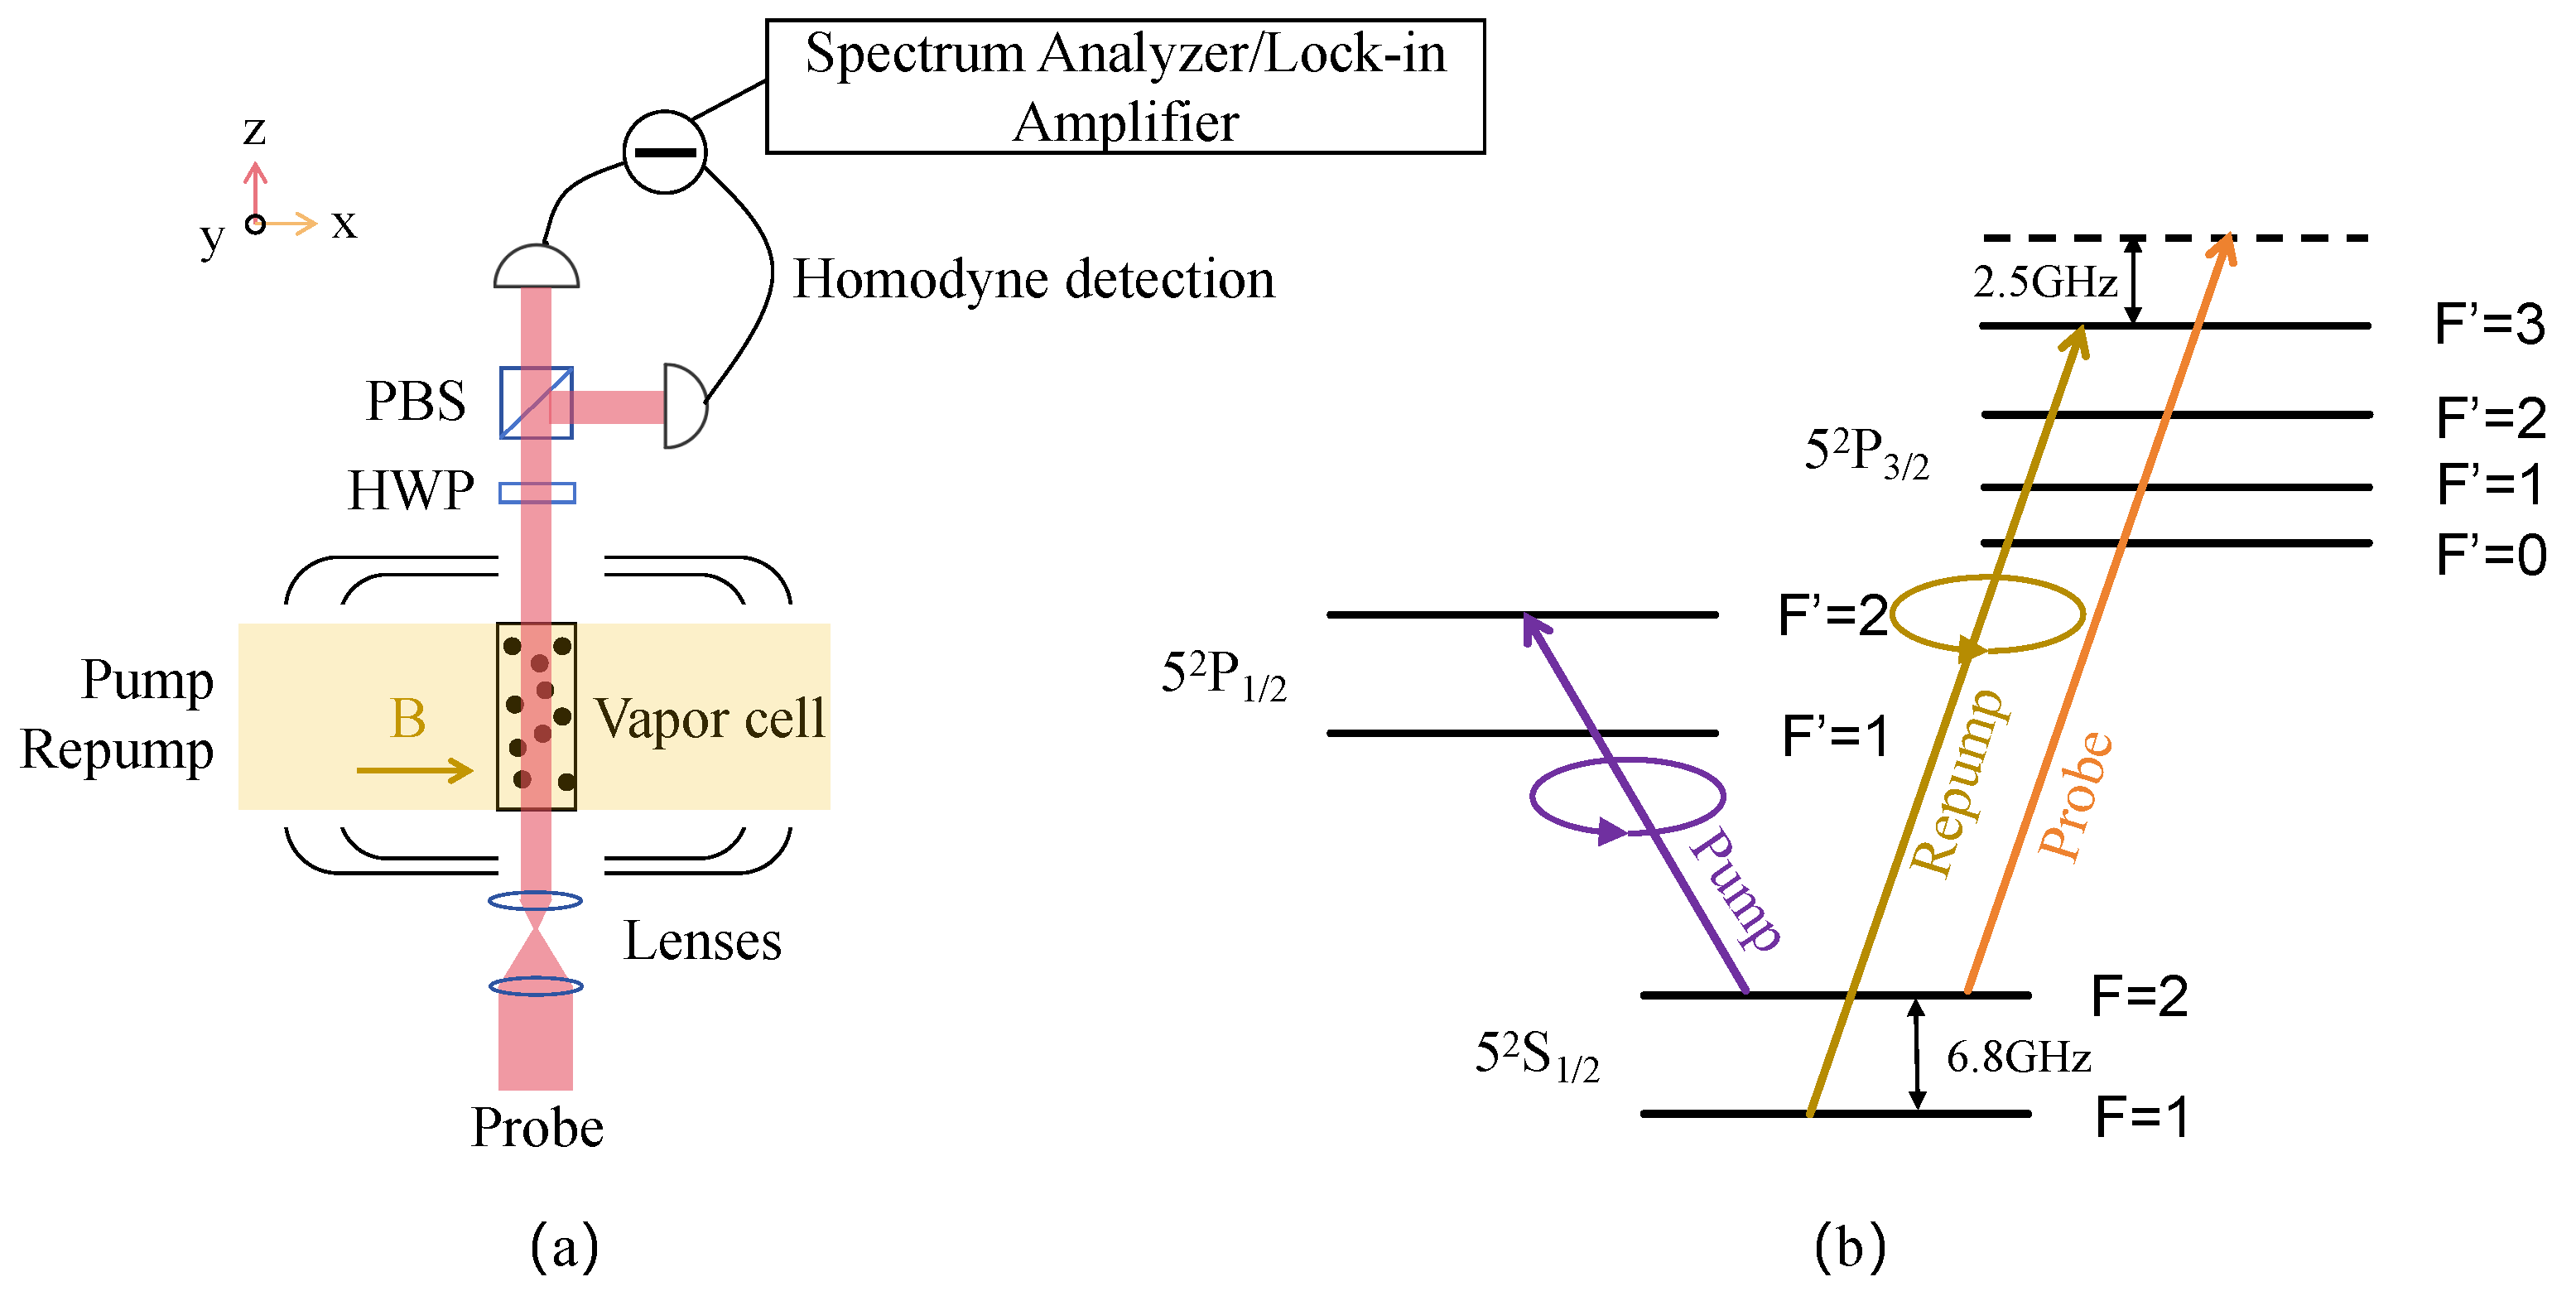
The experimental setup and optical configuration for QND measurement are shown in Figure 2a. A 87Rb vapor cell was positioned within a five-layer magnetic shield, which was used to shield against the geomagnetic field and external stray magnetic fields. A carefully designed coil assembly between the cell and the magnetic shield generated a bias magnetic field along the x-axis, whose amplitude determined the Larmor precession frequency of the atomic spins. The cell, with dimensions of , was coated with an anti-relaxation coating and maintained at 58 °C and contained approximately atoms. However, in our theoretical simulations, for simplicity, we used a cylindrical cell shape with equal cross-sectional areas, an approximation that proved to maintain good agreement with the experiment using rectangular cells [25]. This approximation was valid because the transit noise spectrum is governed primarily by the statistics of atoms crossing through the probe beam and is therefore much more sensitive to the beam size than to the detailed shape of the cell cross-section.
Figure 2.
(a) Experimental setup for quantum nondemolition measurement. PBS: polarizing beam splitter; HWP: half-wave plate. (b) Energy level diagram of the interaction between the light fields and 87Rb atoms. The arrows indicate the energy levels coupled by the pump, repump, and probe beams; the circles (attached to the arrows) denote circularly polarized light.
Three laser fields interacted with the 87Rb atoms: the pump and repump beams propagated along the x-axis, while a probe beam propagated along the z-axis. The corresponding energy level diagram is shown in Figure 2b. The 795 nm pump beam and the 780 nm repump beam, both circularly polarized, coupled to the D1 and D2 lines, respectively, and optically pumped the atoms into the desired polarized state. A holding magnetic field of about 0.7 Gauss was applied along the polarized spin direction corresponding to a 500 kHz Larmor frequency, around which the spin noise was measured via a lock-in amplifier. This frequency was chosen as a compromise between increased technical noise at lower frequencies and magnetic field inhomogeneity at higher fields. The 780 nm probe beam was linearly polarized, which coupled the 87Rb atoms to the transition. We locked the probe beam at a blue detuning of 2.5 GHz using the dichroic atomic vapor laser lock (DAVLL) technique [41] and a fiber electro-optic modulator (EOM) for frequency shifting. In this experiment, the peak power of the probe beam was 5 mW. With a duty cycle of 0.1 in stroboscopic probing, the time-averaged power of the probe light was 500 W. The probe beam with a Gaussian-profile passed through a lens group and then entered the 87Rb vapor cell to interact with the atoms. The beam diameter was measured using a Thorlabs BP209-VIS/M beam profiler, which defined the beam diameter as the width at which the intensity drops to of the peak value. In the theoretical model, the same definition for the beam diameter was adopted. After exiting the cell, the beam traveled through a half-wave plate and a polarizing beam splitter followed by a balanced detector to measure the Faraday rotation signal. The output signal was fed into either a spectrum analyzer or a lock-in amplifier for spectral analysis.
4. Results
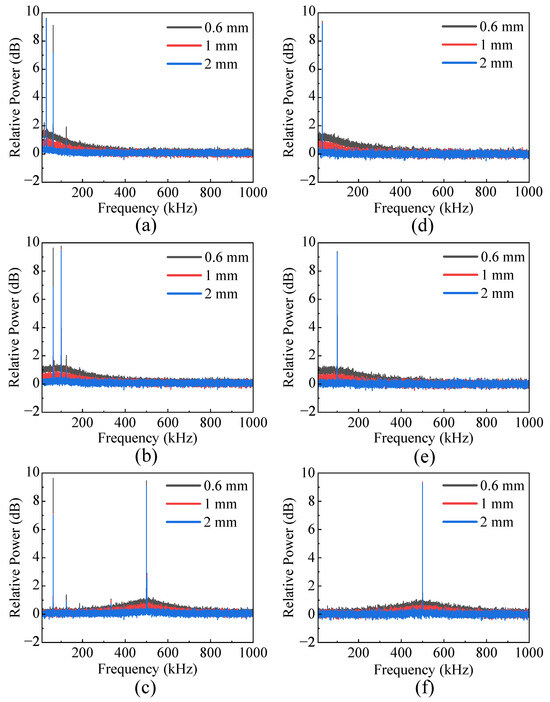
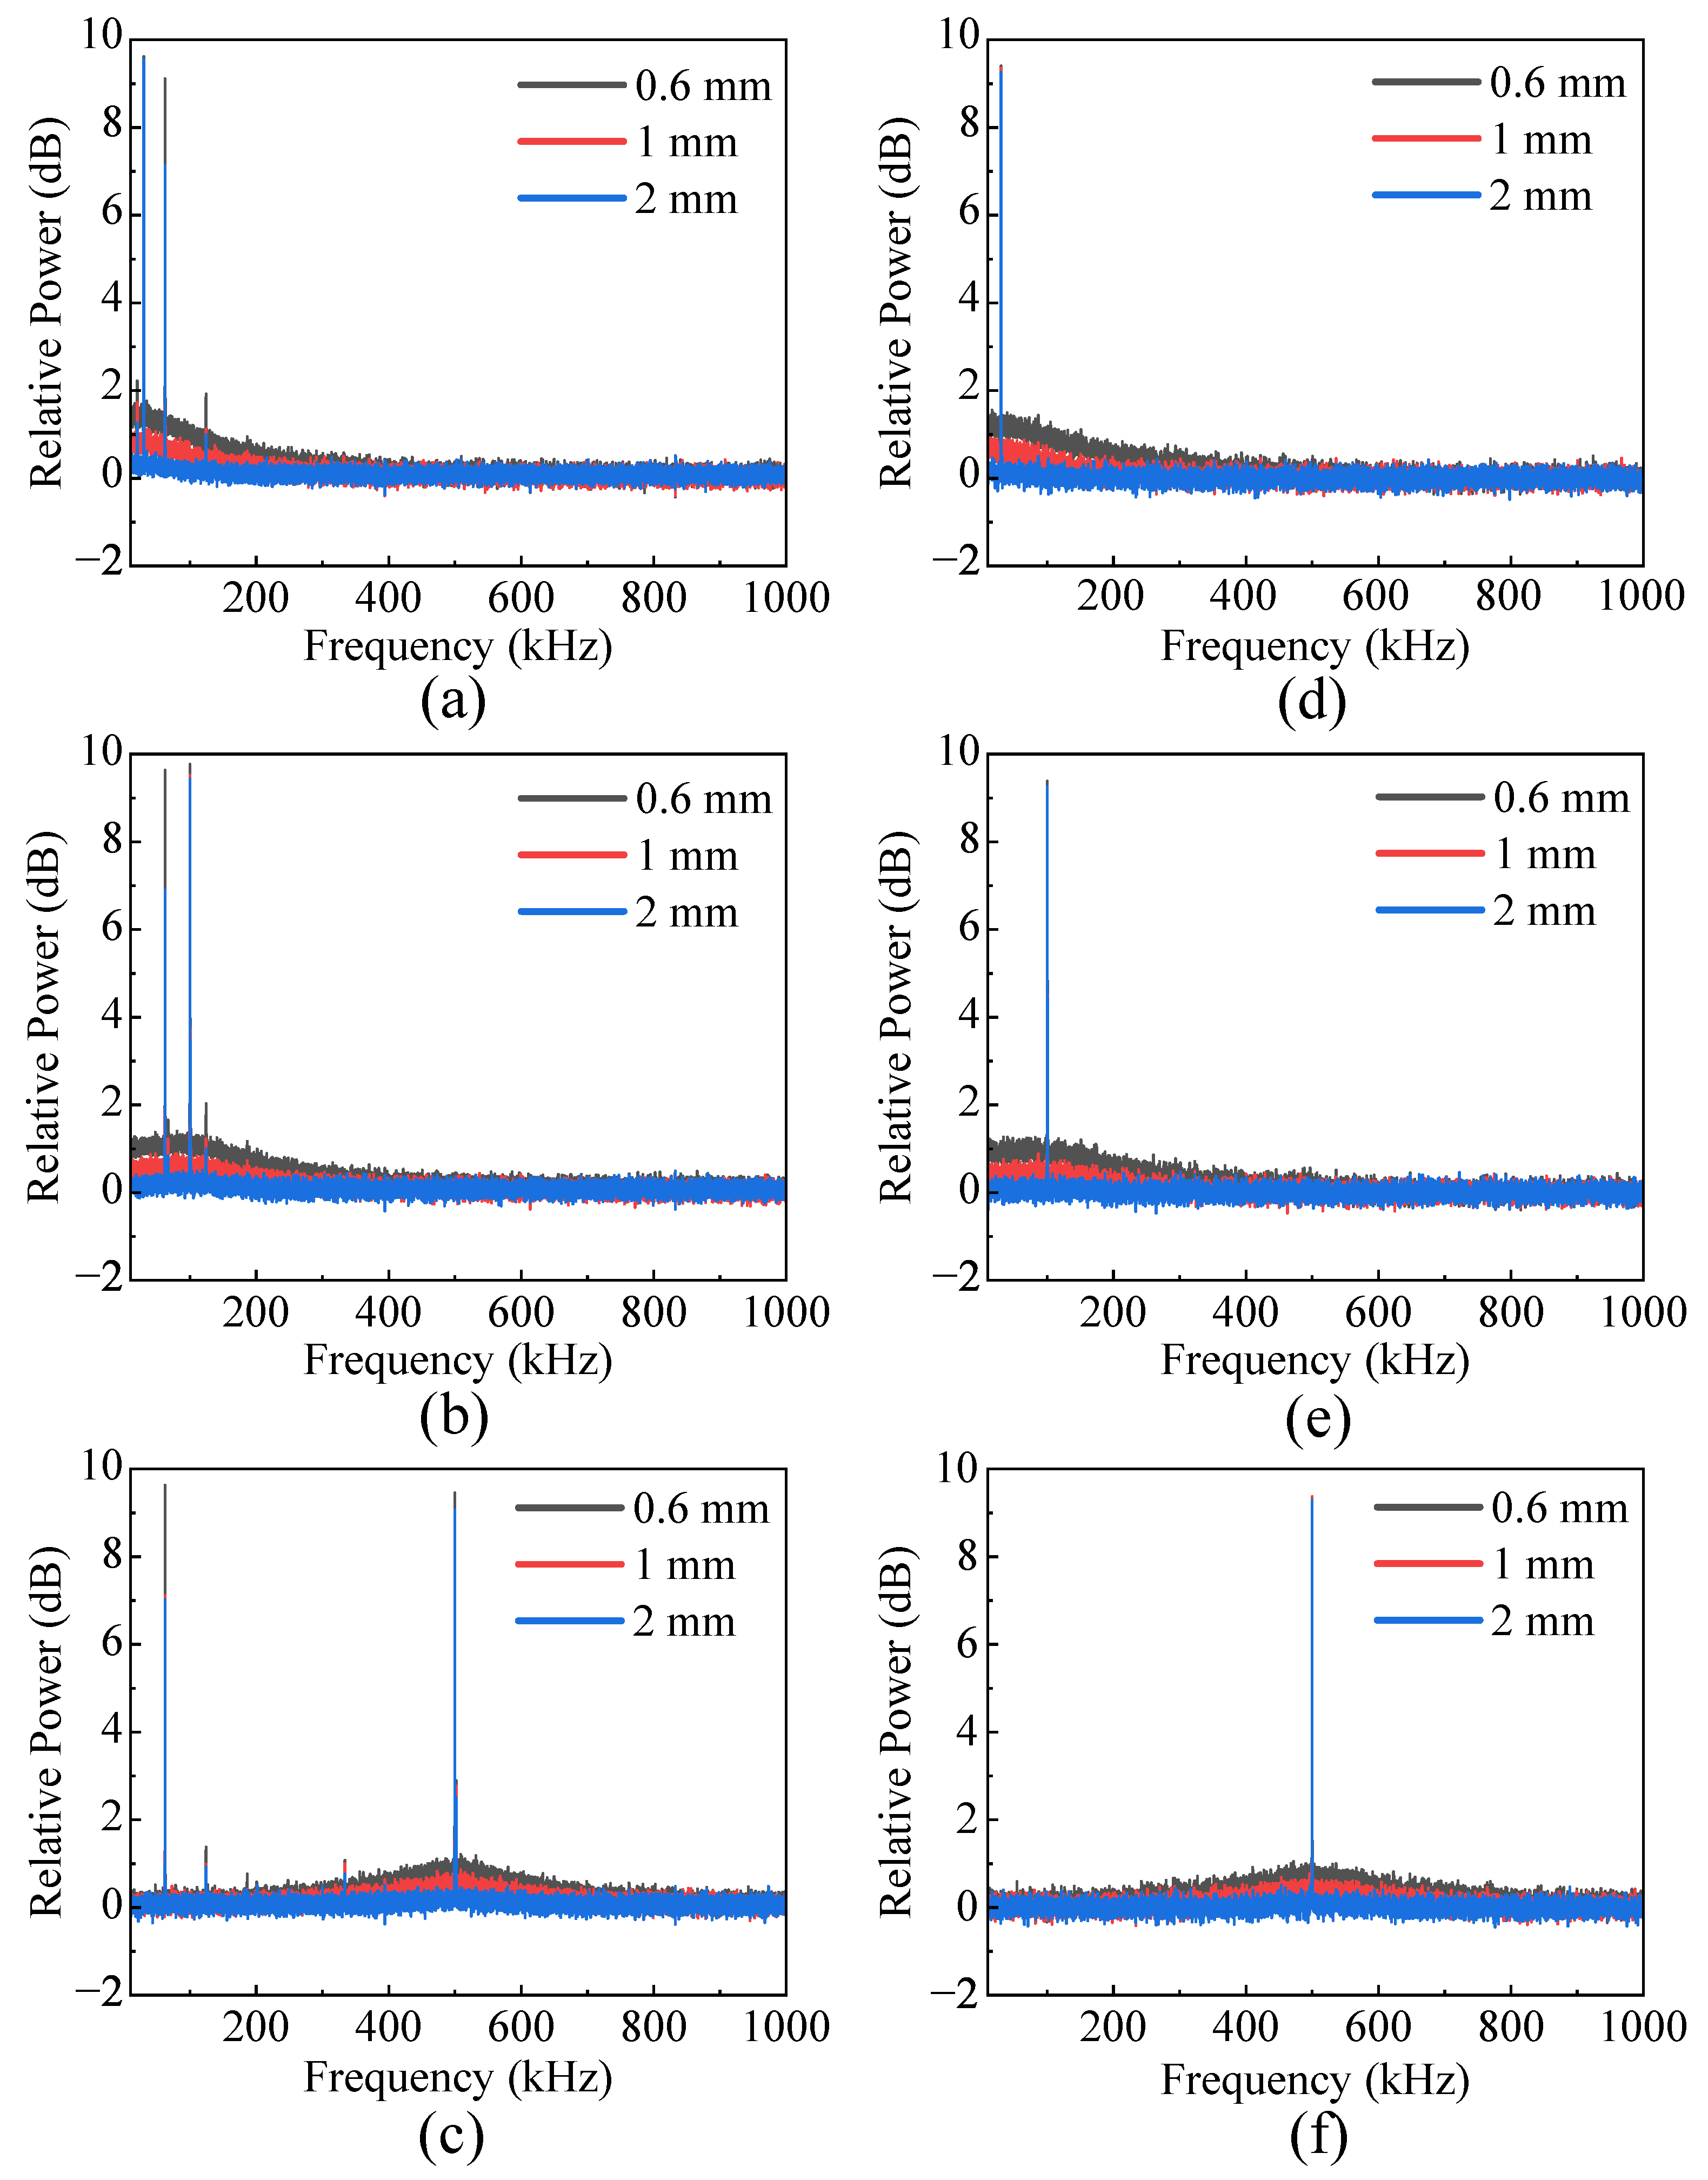
The atomic spin noise spectra corresponding to Larmor frequencies of 30 kHz, 100 kHz, and 500 kHz are shown in Figure 3. The left panels represent the experimental spectra (averaged over 5000 measurements) measured with a spectrum analyzer, while the right panels show the corresponding Monte Carlo simulations (averaged over 2500 runs, which was a trade-off between SNR and computational load, as detailed in Appendix B). The experimental results are in good qualitative agreement with the theoretical predictions. However, in the measured spectra, in addition to the narrow resonance peaks at the Larmor frequency, several spurious peaks (e.g., at 62 kHz and 124 kHz) were observed. These arose from environmental electromagnetic interference coupled into the detection system, and the spurious noises fluctuated over time (see Appendix C for a detailed discussion). All spectra exhibit a characteristic structure consisting of narrow peaks superimposed on a broad background. The narrow peaks correspond to the intrinsic atomic spin projection noise centered at the Larmor frequency, and the integrated absolute noise (area in linear scale) is contributed by all the atoms in the vapor cell, independent of the beam size [25]. Their linewidths are determined by the coherence lifetime of the atomic ground state. In contrast, the broad background originates from atomic transit noise, which arises from atoms moving into and out of the probe beam and experiencing position-dependent atom-light coupling. A smaller probe beam diameter leads to a more pronounced broad background, reflecting the enhanced contribution of atomic transit noise. This work focuses mainly on the influence of the broad background structure on spin squeezing.
Figure 3.
Atomic spin noise spectra at different Larmor frequencies and probe beam sizes. Experiment (left panels) for Larmor frequencies of (a) 30 kHz; (b) 100 kHz; (c) 500 kHz. Monte Carlo simulation (right panels) for Larmor frequencies of (d) 30 kHz; (e) 100 kHz; (f) 500 kHz.
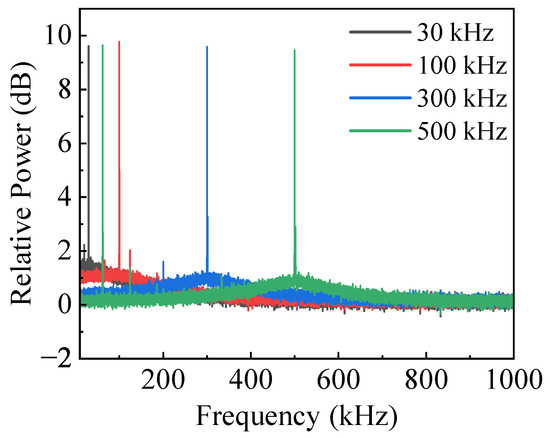
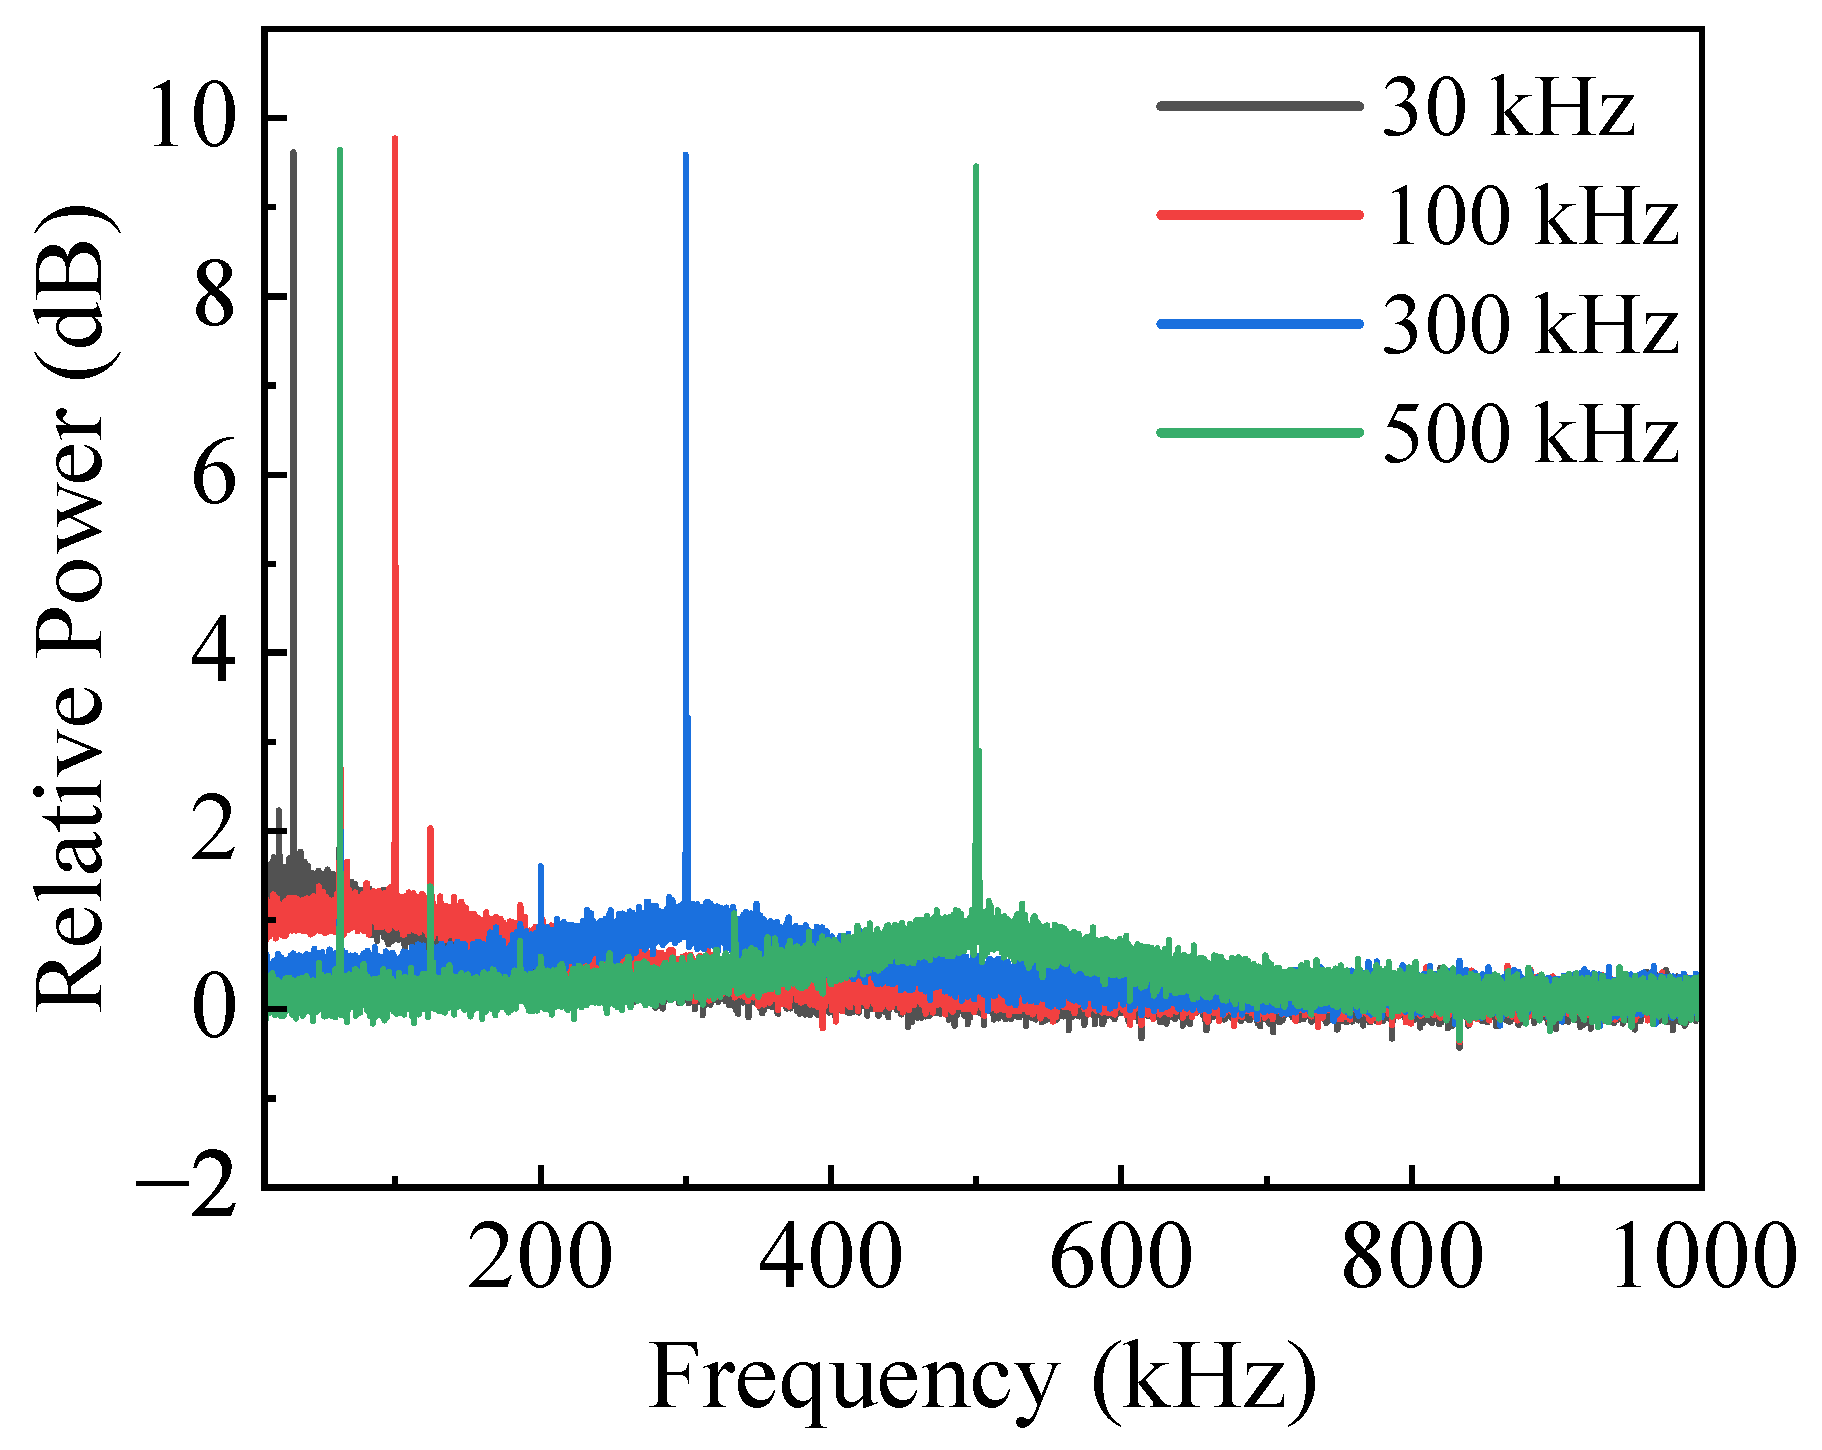
As shown in Figure 4, when the diameter of the beam is 0.6 mm, the visibility of this broad structure is strongly affected by the Larmor frequency. At relatively low Larmor frequencies, the width of the transit noise background is broad enough that the negative frequency component overlaps significantly with the positive frequency component in the detection band (a detailed explanation of this overlap is provided in Appendix D). This overlap causes the two components to add together, thereby elevating the observed broad background. As the Larmor frequency increases, the overlap is progressively reduced, and the broad background correspondingly becomes less pronounced.
Figure 4.
Variation in atomic transit noise with Larmor frequency in experiments.
In our spin squeezing experiment, the Larmor precession frequency was set to 500 kHz. At this frequency, the transit noise was slightly lower than that at lower Larmor frequencies. Experimentally, a lock-in amplifier selected a narrow detection window centered at this frequency, effectively suppressing out-of-band noise. In the theoretical model, we explicitly simulated this lock-in detection process by demodulating the probe signal and extracting the spectral component around 500 kHz, thereby ensuring a consistent comparison between theory and experiment.
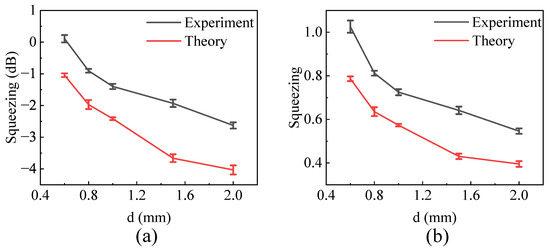
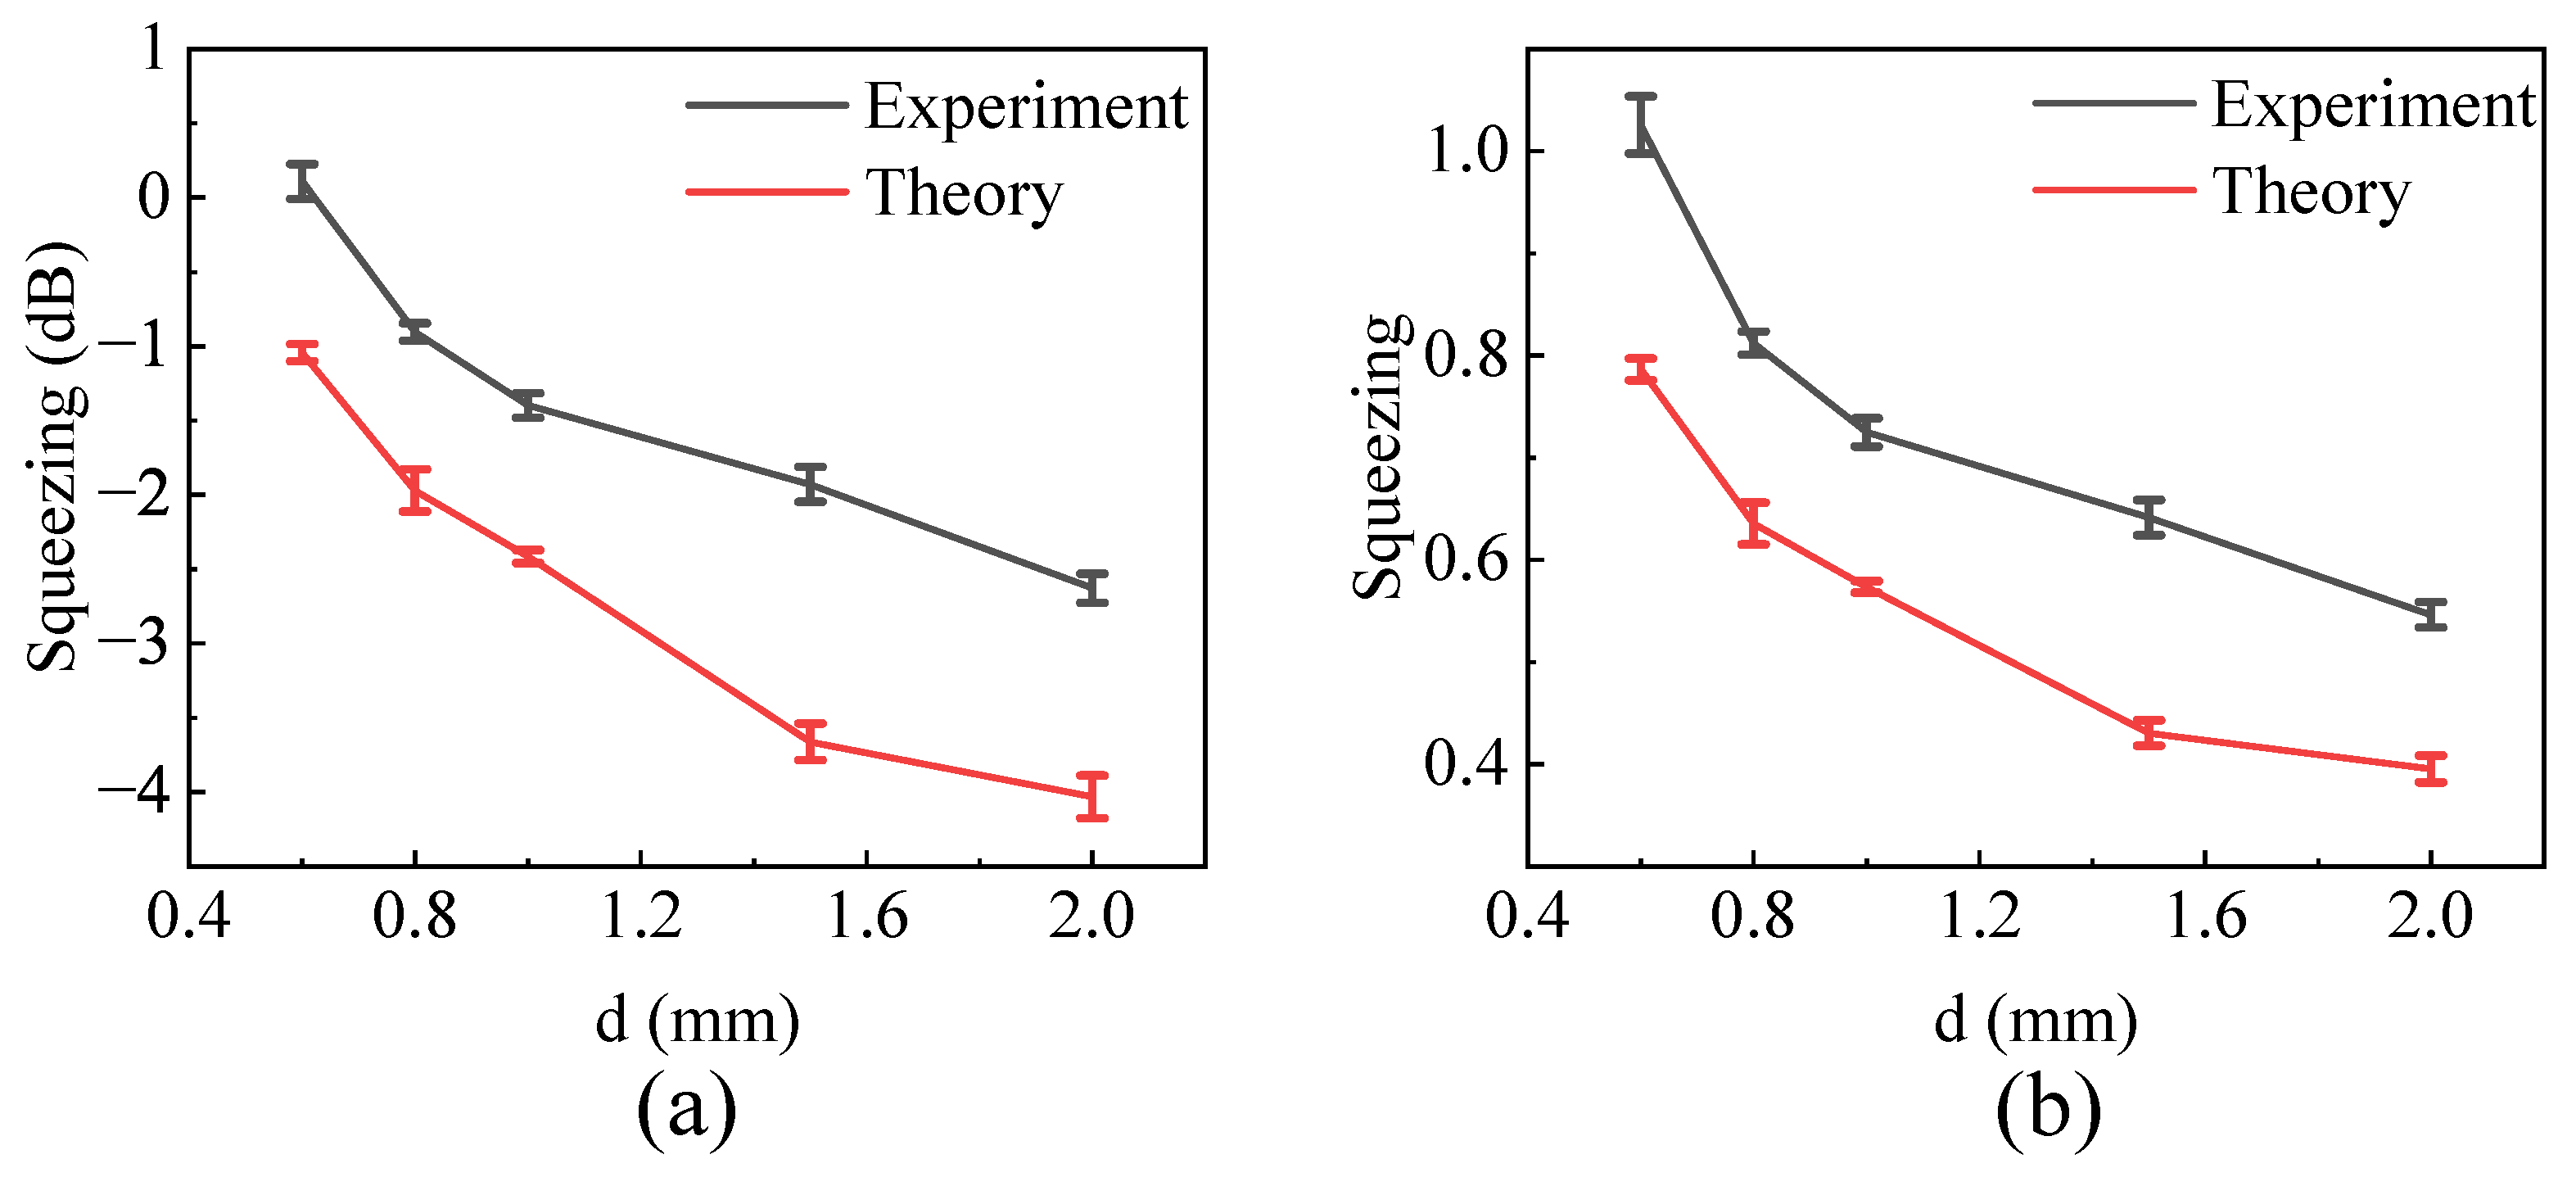
Squeezing parameters at 500 kHz for different probe beam diameters were further explored, and the results are shown in Figure 5. In our experiment, we employed a retrodiction technique [33] to increase spin squeezing, based on the past quantum state formalism introduced by K. Mølmer et al. [42] to improve the estimation of the conditional quantum state. In this formalism, the quantum state of a system at time t depends not only on the measurement record obtained before t but also on the information acquired after t, thereby enabling a more accurate estimate of the system state at time t. Each squeezing value plotted is the average of five independent experimental runs; the error bars correspond to the standard deviation of these runs. A difference of dB was observed between the 0.6 mm and 2 mm beams experimentally, similar to a theoretical prediction of dB. The 0.3 dB difference (between 2.7 dB and 3 dB) is at the level of the combined theoretical and experimental uncertainties.
Figure 5.
Calculated and measured spin squeezing at Larmor frequency of 500 kHz for different probe beam diameters. Both the experimental and theoretical values of the effective atom–light interaction strength are , with total laser power fixed. Here, the squeezing was evaluated using a retrodictive estimator based on the past quantum state techniques, which improved the inference of the conditional atomic state from the measurement record. The corresponding effective was 2.26 in the experiment, and the theoretical value differs from it by 0.22%, where is the transverse relaxation time. (a) Logarithmic scale; (b) linear scale.
As the ratio between the probe beam radius and the vapor cell radius decreases, the squeezing performance increasingly degrades. When the beam is much smaller than the cell size, atoms experience stronger spatial variations in the light intensity during their motion, leading to intensified transit-induced fluctuations. Consequently, transit noise plays a more significant role in limiting the attainable squeezing, highlighting the importance of matching the probe beam size to the cell size. We note that when the beam size was 2 mm, there was a 1.4 dB discrepancy in spin squeezing between theory and experiment, which arose from experimental imperfections that were not fully captured in the model, including less-than-unity atomic polarization (0.22 dB), coherence loss (0.27 dB) and other technical noise such as electromagnetic noise.
Furthermore, the observed change in the degree of spin squeezing with beam sizes cannot be explained solely by the change in the transit-noise background. In our experiment, although the spin squeezing differs by about 2.7 dB between probe-beam sizes of 0.6 mm and 2 mm, the corresponding change in the transit-noise background at the Larmor frequency is significantly smaller (about 0.7 dB). This indicates that the degradation of squeezing is influenced by more than the net transit-noise level alone. In QND-based spin squeezing, another important contribution arises from the temporal decorrelation of the atomic spin projection signal induced by the transit process itself. As atoms move out of the probe beam, they cease to contribute to the measured signal, while atoms entering the beam can contribute new (different) spin projection signal. As a result, the temporal correlation of the QND readout is weakened, which worsens the conditional variance and further limits the achievable spin squeezing, especially for smaller probe beams.
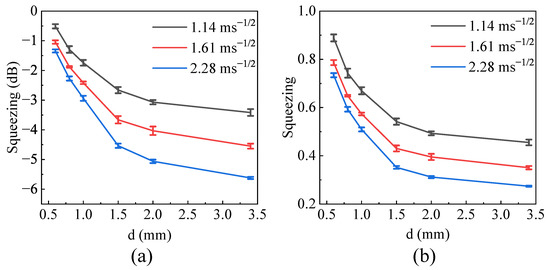
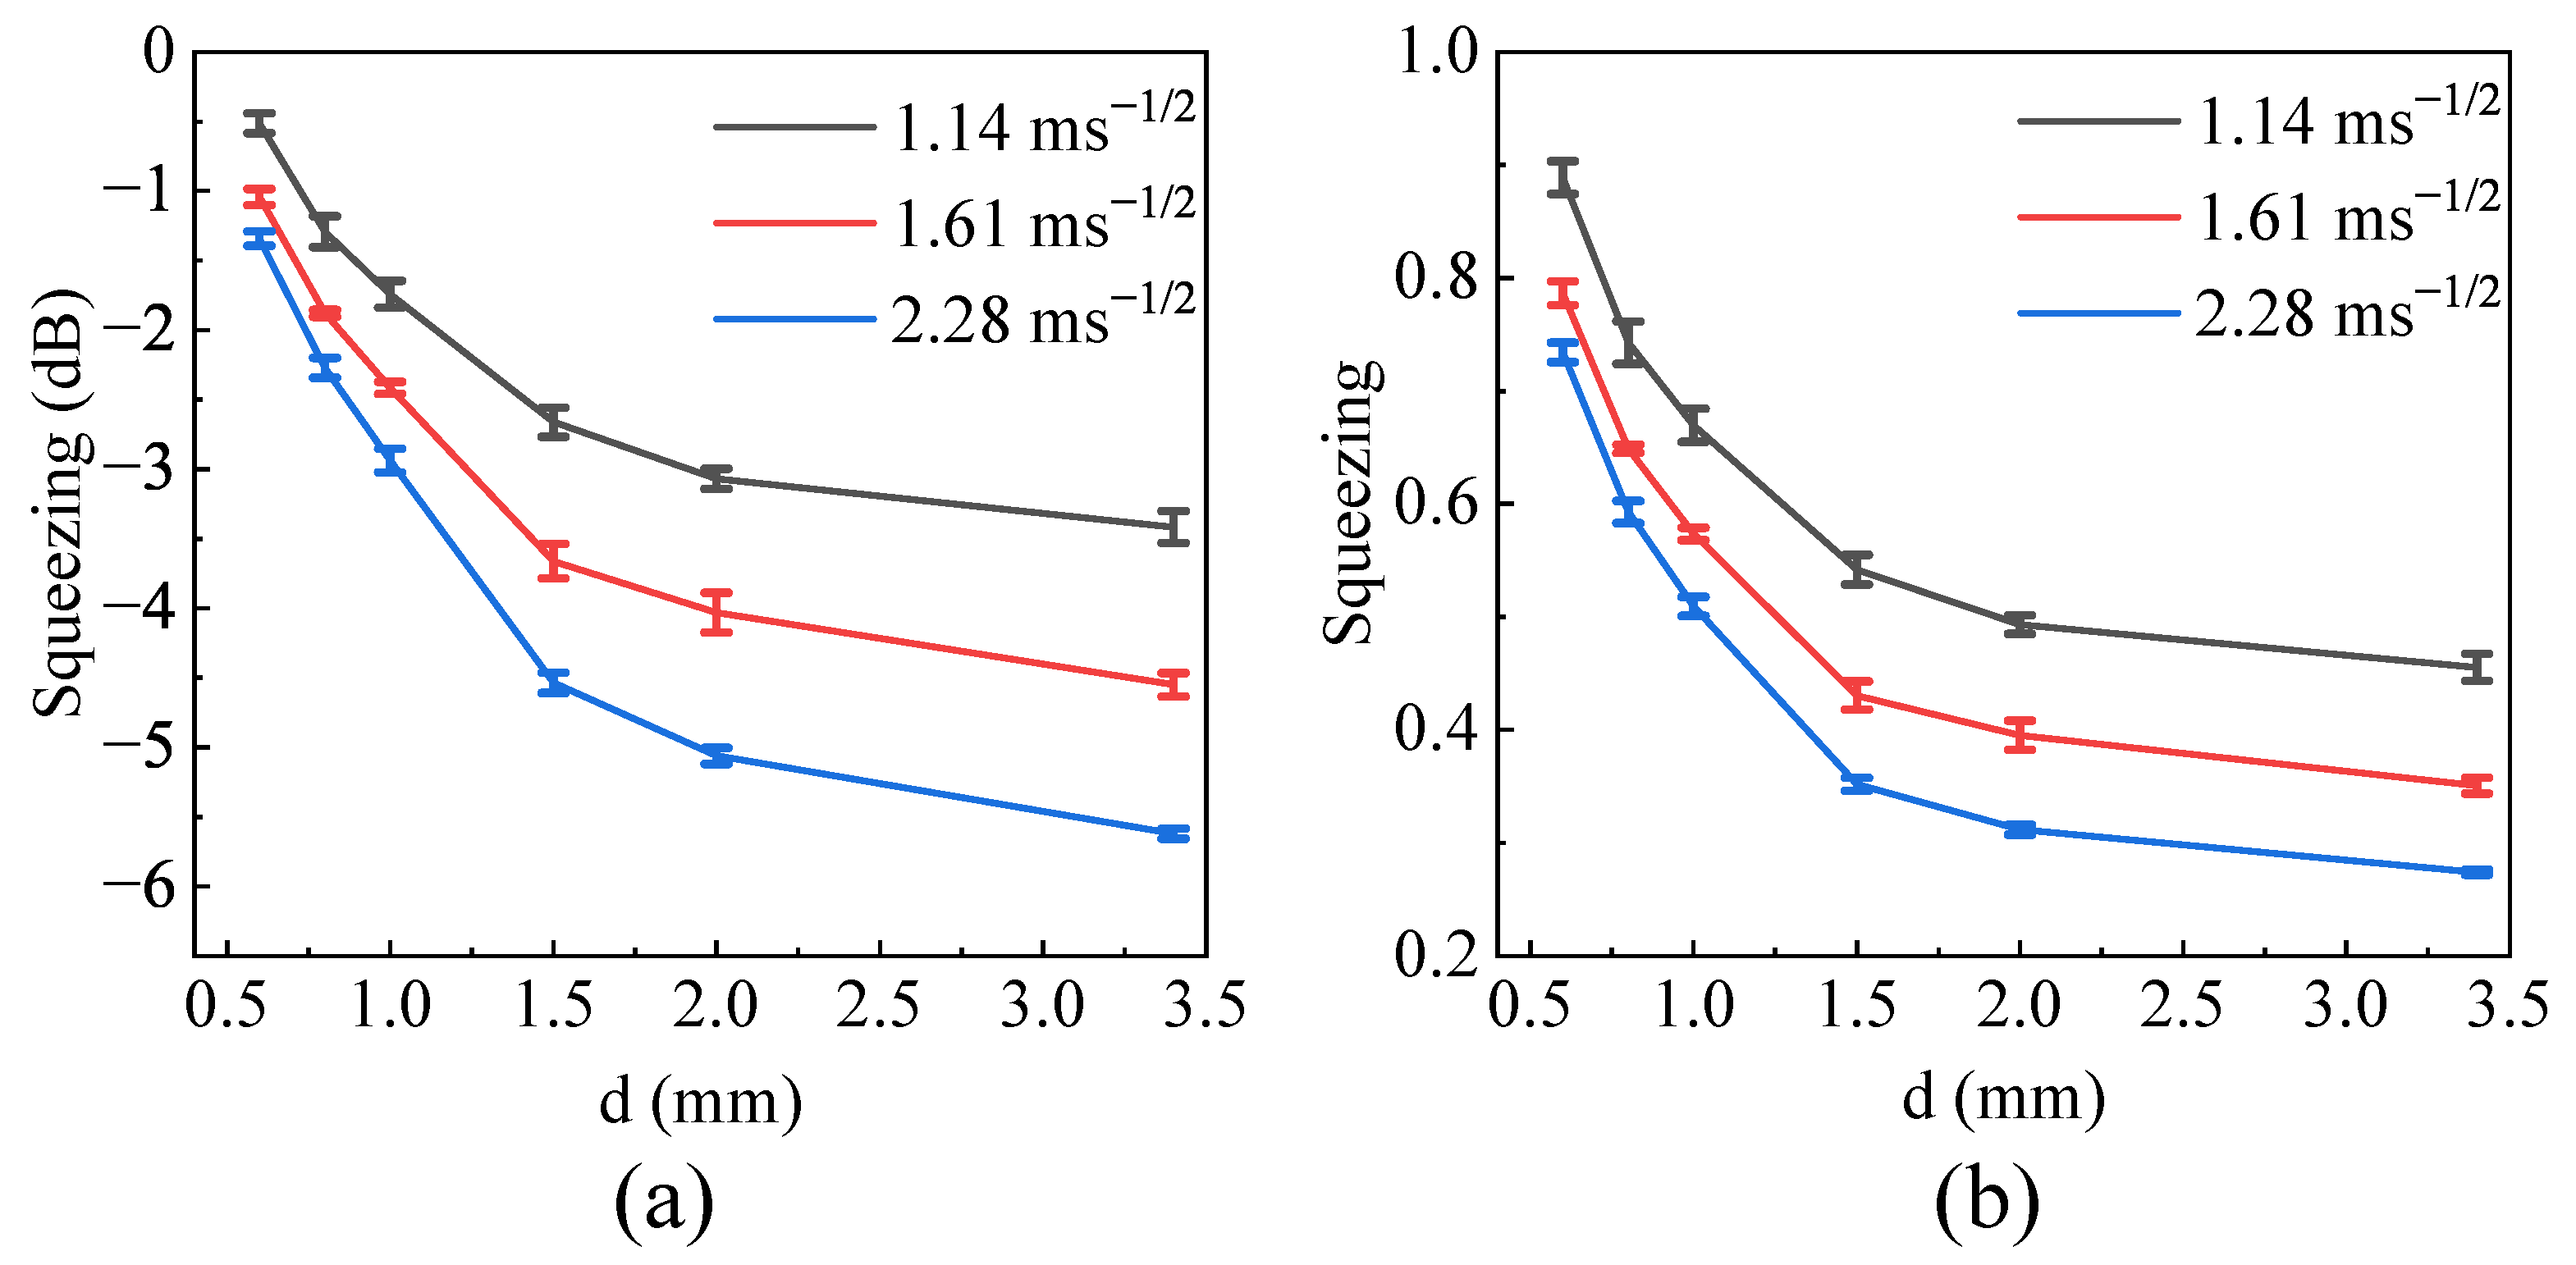
In principle, a stronger atom-light interaction leads to a higher degree of spin squeezing, since more atomic spin information is imprinted onto the probe field during the QND measurement. However, in our experiment, increasing the probe beam power beyond the current value would have driven the photodiode out of its linear response region for photon-shot-noise-limited performance. Therefore, the behavior of transit noise at higher optical intensities was not characterized experimentally. Instead, we performed a theoretical analysis of this regime, the results of which are presented in Figure 6. The values , , and represent the effective atom-light interaction strength . In a stronger interaction regime, the requirement for spatially homogeneous coupling becomes increasingly stringent. For a Gaussian probe beam, atoms traversing different intensity regions experience substantially different interaction strengths, and the resulting transit-induced fluctuations are correspondingly amplified. As the coupling strength increases, these inhomogeneities can no longer be treated as a small perturbation but instead constitute the dominant factor limiting the attainable spin squeezing. Overall, while stronger probing is beneficial for enhancing the QND measurement strength, it also renders the experiment more susceptible to transit noise.
Figure 6.
Theoretical study of spin squeezing versus beam size under higher probe intensity conditions (labeled with effective atom-light interaction strength , see text). At each , total laser power is fixed for different beam diameters. (a) Logarithmic scale; (b) linear scale.
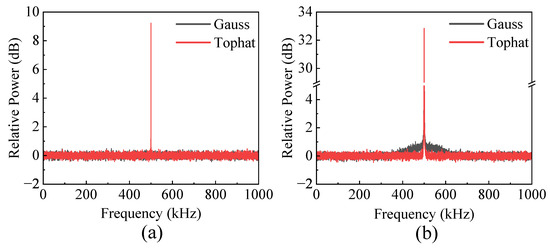
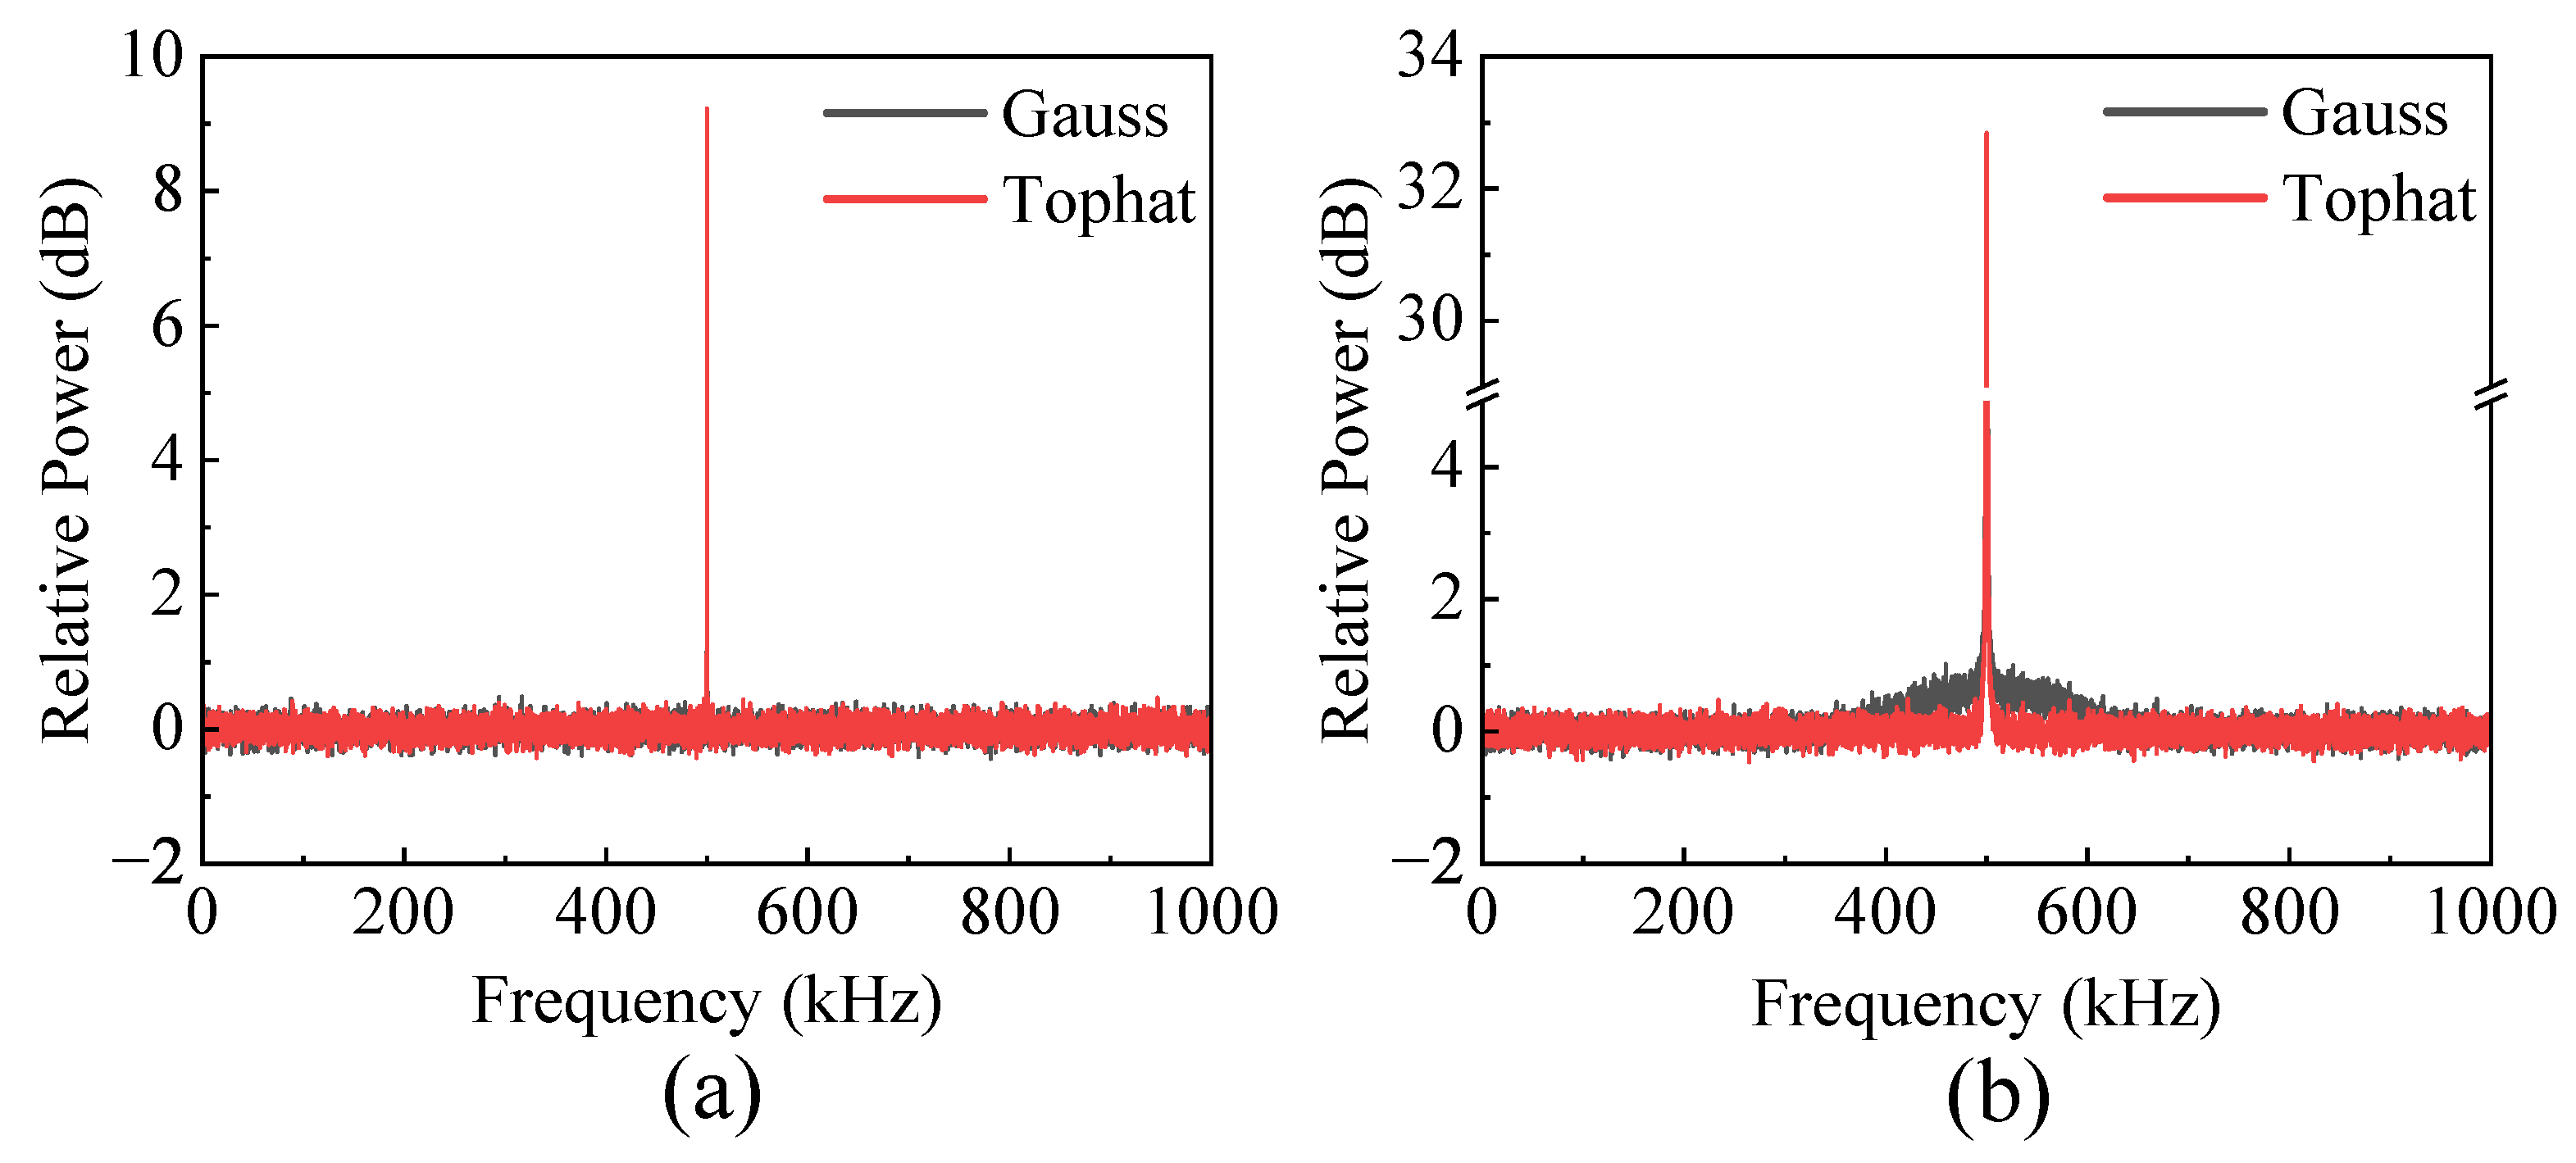
To fully exploit the advantages of strong atom-light coupling, the interaction must be made more spatially uniform, for example, by expanding the probe beam relative to the atomic sample size or by using a beam profile with improved transverse homogeneity. However, we theoretically calculated the atomic transit noise spectra for a 3.4 mm tophat beam and Gaussian beam (same size of the vapor cell) at a Larmor frequency of 500 kHz. The results are shown in Figure 7. For a relatively small coupling strength () similar to that in our experiment, we did not observe an obvious difference between the two beam shapes in terms of transit noise contribution. In addition, we calculated the spin squeezing achievable with the tophat beam (beam size of 3.4 mm) as 4.75 dB and that with the Gaussian beam as 4.54 dB. Therefore, within the parameter regime in our experiment, neither beam shape exhibited a clear advantage over the other. For larger coupling strengths, the difference is slightly larger (Figure 7b). Overall, the difference between the two beam shapes is relatively small, which is due to the effect of motional averaging of the atoms in a coated cell. These results demonstrate that, in the strong coupling regime, suppressing transit noise via increasing the probe beam size is essential for achieving higher levels of spin squeezing.
Figure 7.
Theoretical study of atomic spin noise spectra for Gaussian probe beam and tophat probe beam for (a) low coupling strength ; (b) high coupling strength .
5. Conclusions
In summary, we theoretically and experimentally investigated transit noise in a coated vapor cell and found good qualitative agreement between experiment and theory. We showed that the transit noise background becomes larger for smaller probe beams and has a stronger influence at lower Larmor frequencies under otherwise identical conditions. Moreover, its effect on spin squeezing is not determined solely by the transit noise background at the detection frequency but also by transit-induced decorrelation in the QND readout. Our results therefore suggest that, under the present experimental conditions, using a probe beam comparable to the cell cross-section is beneficial for suppressing transit-noise-induced degradation in spin squeezing. More broadly, this work provides insight into transit-related limitations in hot atom quantum sensors and may be relevant to other thermal atomic ensemble platforms, including optical magnetometers, electric field sensors, and atomic clocks.
Author Contributions
Conceptualization, Y.J., P.L., Y.X., Y.W. and J.D.; Methodology, Y.J., P.L. and J.D.; Validation, Y.J. and P.L.; Formal analysis, Y.J. and P.L.; Investigation, Y.J. and P.L.; Resources, Y.J.; Data curation, Y.J., P.L. and J.D.; Writing—original draft, Y.J. and P.L.; Writing—review & editing, Y.X., Y.W. and J.D.; Visualization, Y.J.; Supervision, Y.X., Y.W. and J.D.; Project administration, Y.X. and J.D.; Funding acquisition, Y.X. and Y.W. All authors have read and agreed to the published version of the manuscript.
Funding
This research was funded by the Innovation Program for Quantum Science and Technology under grant No. 2023ZD0300900, National Natural Science Foundation of China (grant Nos. 12027806, 12161141018 and 62505164), Fund for Shanxi “1331 Project”, and talent introduction program of Sichuan University of Science & Engineering (No. H40125120).
Data Availability Statement
Data underlying the results presented in this paper are not publicly available at this time but may be obtained from the authors upon reasonable request.
Acknowledgments
We thank Mingyong Jing for helpful discussions.
Conflicts of Interest
The authors declare no conflicts of interest.
Appendix A
The strength of the atom-light interaction can be expressed as [11,31,32]:
where is the nature width of the excited state, is the probe wavelength, A is the atom-light interaction area, P is the optical power and is the detuning of the probe. is the vector interaction coefficient [32] and can be expressed as:
Here, and are the energy level differences between and and between and in the hyperfine structure of the excited state , respectively. Equation (A1) gives the effective coupling strength in the homogeneous coupling approximation. In the Monte Carlo model, the instantaneous coupling is obtained by replacing the uniform probe intensity with the local intensity sampled along the atomic trajectory.
Appendix B
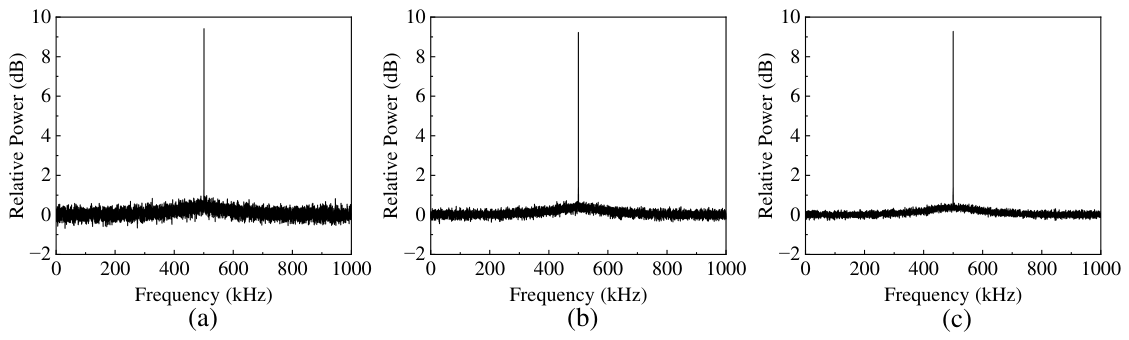
Figure A1 shows the simulated noise spectra for a 1 mm beam at a 500 kHz Larmor frequency, obtained with 1000, 2500 and 5000 averages. As the figure shows, increasing the number of averages improves the signal-to-noise ratio (SNR), but does not change the overall spectral structure. However, running the simulation with 5000 averages takes approximately twice the time of 2500 averages, making it computationally heavy. Therefore, considering that the improvement from 2500 to 5000 averages is marginal, we chose 2500 averaging times.
Figure A1.
Calculated atomic spin noise spectra at different averaging numbers for a 1 mm beam at 500 kHz Larmor frequency. Monte Carlo simulation for averaging numbers of (a) 1000; (b) 2500; (c) 5000.
Appendix C
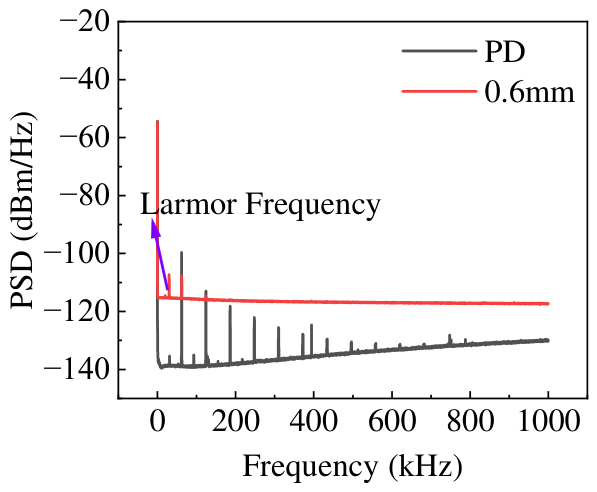
Figure A2 shows two spectra: the background noise of the photodetector (black curve) and the measured noise spectrum for a 0.6 mm beam at a 30 kHz Larmor frequency (red curve, taken from Figure 3). In the measured spectrum, distinct peaks at 62 kHz and 124 kHz are clearly visible, and these noise peaks rise above the atomic spin noise. These peaks originate from environmental electromagnetic interference (EMI) that couples into the detection system. The EMI strength varies over time and cannot be removed by simply subtracting the background light noise. However, the data used to extract the degree of spin squeezing are demodulated at the Larmor frequency, which was chosen away from the EMI frequency.
Figure A2.
Background noise of the photodetector (black) and measured noise spectrum for 0.6 mm beam at 30 kHz Larmor frequency (red). PSD: power spectral density.
Appendix D
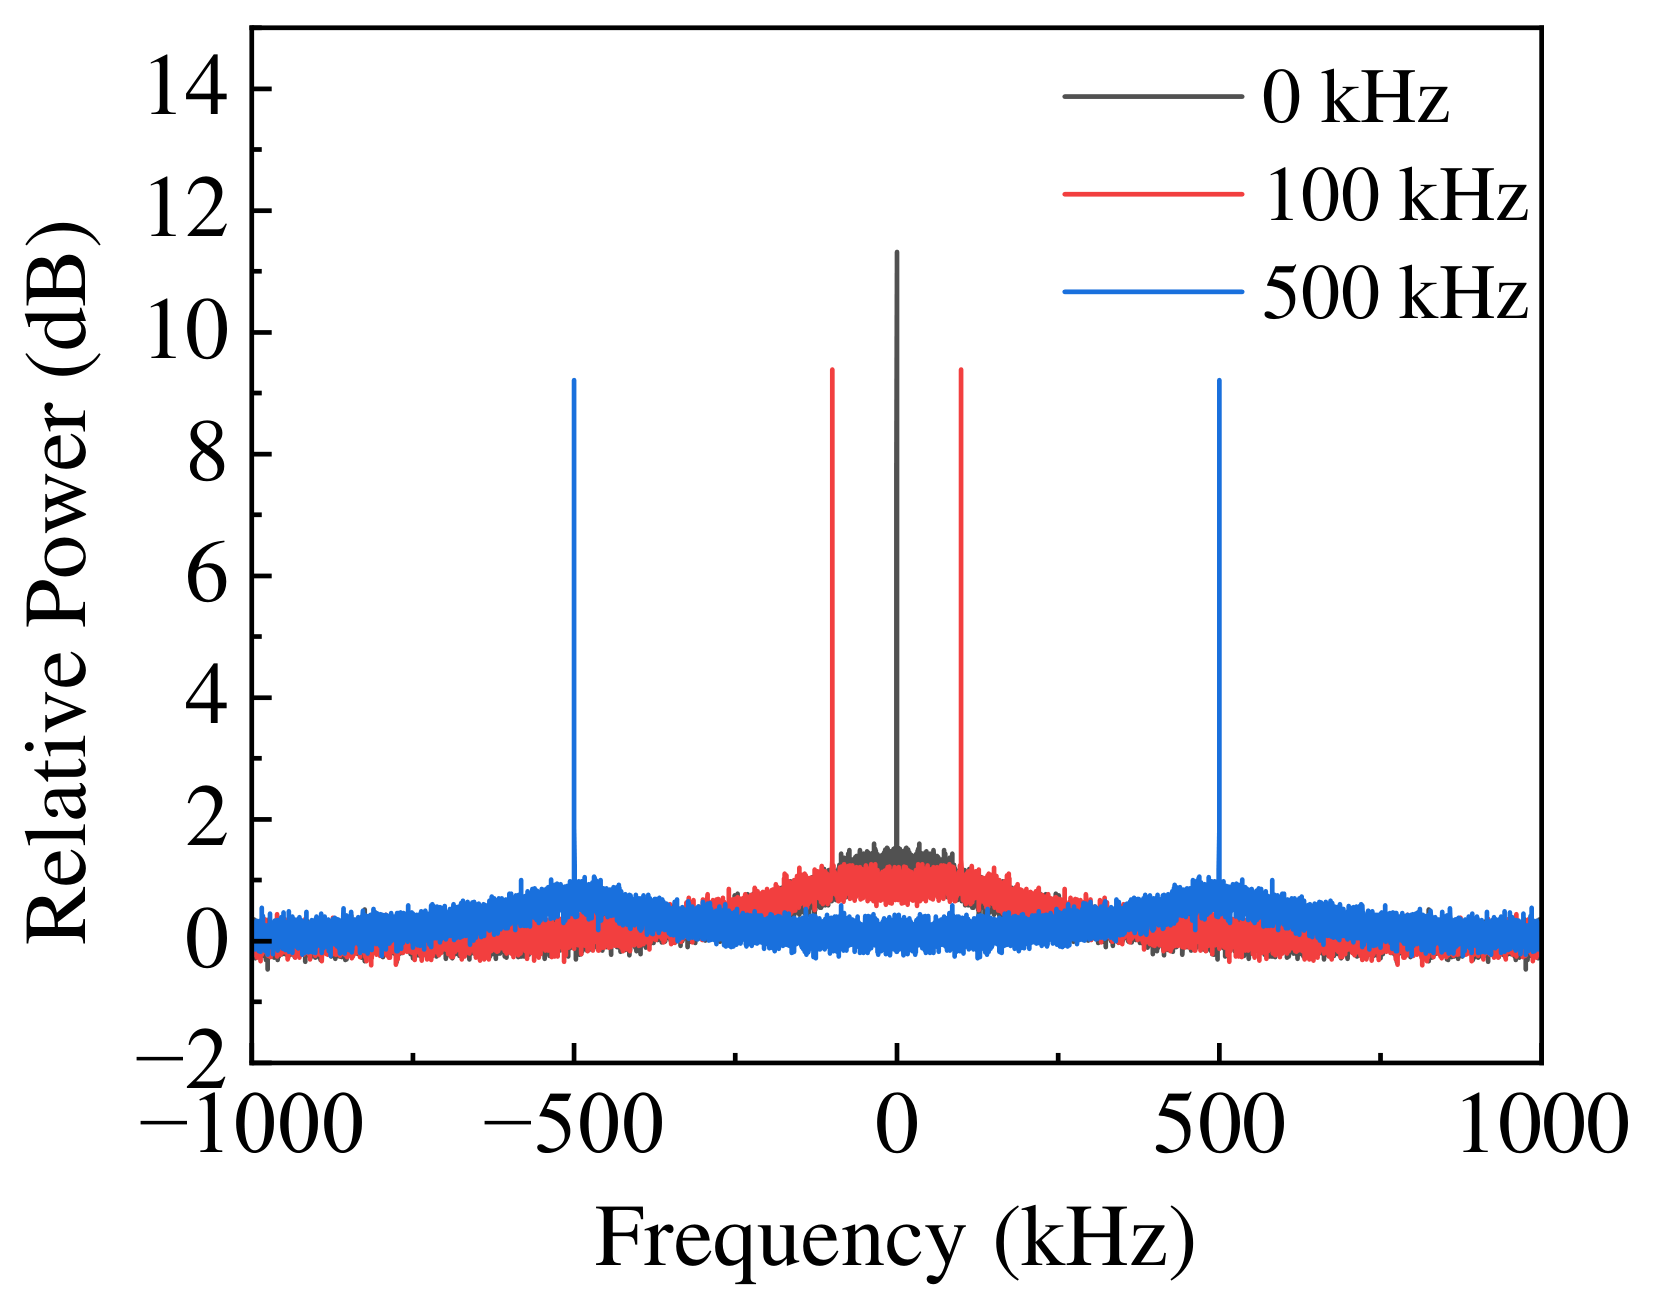
The positive-negative frequency overlap effect at low Larmor frequencies is illustrated in Figure A3, which shows the theoretically calculated atomic noise spectra for a 0.6 mm beam at Larmor frequencies of 0 kHz (black), 100 kHz (red), and 500 kHz (blue). The Larmor precession of the atomic spin produces an oscillatory signal at frequency , whose Fourier spectrum ideally contains two symmetric sidebands at and . However, in actual measurements, we recorded only a single sideband by using heterodyne detection and filtering. When the Larmor frequency is lower than the width of the broad structure in the noise spectrum contributed by the transit process, the positive and negative sidebands overlap, leading to an apparent increase in the measured noise level. This effect is clearly shown by the red curve in the figure.
Figure A3.
Calculated atomic noise spectra for a 0.6 mm beam at Larmor frequencies of 0 kHz, 100 kHz, and 500 kHz.
References
- Zhan, M.; Xie, X. Precision measurement physics: Physics that precision matters. Natl. Sci. Rev. 2020, 7, 1795. [Google Scholar] [CrossRef] [Scilit]
- Wang, Y.; Huang, Y.; Guo, C.; Jiang, M.; Kang, X.; Su, H.; Qin, Y.; Ji, W.; Hu, D.; Peng, X.; et al. Search for exotic parity-violation interactions with quantum spin amplifiers. Sci. Adv. 2023, 9, eade0353. [Google Scholar] [CrossRef] [Scilit]
- d’Armagnac de Castanet, Q.; Des Cognets, C.; Arguel, R.; Templier, S.; Jarlaud, V.; Ménoret, V.; Desruelle, B.; Bouyer, P.; Battelier, B. Atom interferometry at arbitrary orientations and rotation rates. Nat. Commun. 2024, 15, 6406. [Google Scholar] [CrossRef] [Scilit]
- Li, C.-Y.; Chen, L.-K.; Yang, X.; Xu, Z.-Y.; Huang, M.-Q.; Luo, Y.; Zhao, Y.-H.; Niu, X.-W.; Liu, Z.-W.; Yao, H.-J.; et al. Drift-free continuous gravity measurement and application analysis of a high-precision atom gravimeter. Phys. Rev. Appl. 2025, 24, 014045. [Google Scholar] [CrossRef] [Scilit]
- Hinkley, N.; Sherman, J.A.; Phillips, N.B.; Schioppo, M.; Lemke, N.D.; Beloy, K.; Pizzocaro, M.; Oates, C.W.; Ludlow, A.D. An atomic clock with 10−18 instability. Science 2013, 341, 1215–1218. [Google Scholar] [CrossRef] [Scilit]
- Bloom, B.J.; Nicholson, T.L.; Williams, J.R.; Campbell, S.; Bishof, M.; Zhang, X.; Zhang, W.; Bromley, S.; Ye, J. An optical lattice clock with accuracy and stability at the 10−18 level. Nature 2014, 506, 71–75. [Google Scholar] [CrossRef] [Scilit] [PubMed]
- Facon, A.; Dietsche, E.K.; Grosso, D.; Haroche, S.; Raimond, J.M.; Brune, M.; Gleyzes, S. A sensitive electrometer based on a Rydberg atom in a Schrödinger-cat state. Nature 2016, 535, 262–265. [Google Scholar] [CrossRef] [Scilit] [PubMed]
- Kominis, I.K.; Kornack, T.W.; Allred, J.C.; Romalis, M.V. A subfemtotesla multichannel atomic magnetometer. Nature 2003, 422, 596–599. [Google Scholar] [CrossRef] [Scilit] [PubMed]
- Pezzè, L.; Smerzi, A.; Oberthaler, M.K.; Schmied, R.; Treutlein, P. Quantum metrology with nonclassical states of atomic ensembles. Rev. Mod. Phys. 2018, 90, 035005. [Google Scholar] [CrossRef] [Scilit]
- Vasilakis, G.; Shen, H.; Jensen, K.; Balabas, M.; Salart, D.; Chen, B.; Polzik, E.S. Generation of a squeezed state of an oscillator by stroboscopic back-action-evading measurement. Nat. Phys. 2015, 11, 389–392. [Google Scholar] [CrossRef] [Scilit]
- Bao, H.; Duan, J.; Jin, S.; Lu, X.; Li, P.; Qu, W.; Wang, M.; Novikova, I.; Mikhailov, E.E.; Zhao, K.F.; et al. Spin squeezing of 1011 atoms by prediction and retrodiction measurements. Nature 2020, 581, 159–163. [Google Scholar] [CrossRef] [Scilit]
- Hosten, O.; Engelsen, N.J.; Krishnakumar, R.; Kasevich, M.A. Measurement noise 100 times lower than the quantum-projection limit using entangled atoms. Nature 2016, 529, 505–508. [Google Scholar] [CrossRef] [Scilit]
- Ludlow, A.D.; Boyd, M.M.; Ye, J.; Peik, E.; Schmidt, P.O. Optical atomic clocks. Rev. Mod. Phys. 2015, 87, 637–701. [Google Scholar] [CrossRef] [Scilit]
- Robinson, J.M.; Miklos, M.; Tso, Y.M.; Kennedy, C.J.; Bothwell, T.; Kedar, D.; Thompson, J.K.; Ye, J. Direct comparison of two spin-squeezed optical clock ensembles at the 10−17 level. Nat. Phys. 2024, 20, 208–213. [Google Scholar] [CrossRef] [Scilit]
- Malia, B.K.; Wu, Y.; Martínez-Rincón, J.; Kasevich, M.A. Distributed quantum sensing with mode-entangled spin-squeezed atomic states. Nature 2022, 612, 661–665. [Google Scholar] [CrossRef] [Scilit] [PubMed]
- Allred, J.; Lyman, R.; Kornack, T.; Romalis, M.V. High-sensitivity atomic magnetometer unaffected by spin-exchange relaxation. Phys. Rev. Lett. 2002, 89, 130801. [Google Scholar] [CrossRef] [Scilit] [PubMed]
- Martin Ciurana, F.; Colangelo, G.; Slodička, L.; Sewell, R.; Mitchell, M. Entanglement-enhanced radio-frequency field detection and waveform sensing. Phys. Rev. Lett. 2017, 119, 043603. [Google Scholar] [CrossRef] [Scilit]
- Koschorreck, M.; Napolitano, M.; Dubost, B.; Mitchell, M. Sub-projection-noise sensitivity in broadband atomic magnetometry. Phys. Rev. Lett. 2010, 104, 093602. [Google Scholar] [CrossRef] [Scilit]
- Leroux, I.D.; Schleier-Smith, M.H.; Vuletić, V. Implementation of cavity squeezing of a collective atomic spin. Phys. Rev. Lett. 2010, 104, 073602. [Google Scholar] [CrossRef] [Scilit]
- Luo, X.-Y.; Zou, Y.-Q.; Wu, L.-N.; Liu, Q.; Han, M.-F.; Tey, M.K.; You, L. Deterministic entanglement generation from driving through quantum phase transitions. Science 2017, 355, 620–623. [Google Scholar] [CrossRef] [Scilit]
- Franke, J.; Muleady, S.R.; Kaubruegger, R.; Kranzl, F.; Blatt, R.; Rey, A.M.; Joshi, M.K.; Roos, C.F. Quantum-enhanced sensing on optical transitions through finite-range interactions. Nature 2023, 621, 740–745. [Google Scholar] [CrossRef] [Scilit]
- Jin, S.; Duan, J.; Zhang, Y.; Zhang, X.; Bao, H.; Shen, H.; Xiao, L.; Jia, S.; Wang, M.; Xiao, Y. Concurrent spin squeezing and light squeezing in an atomic ensemble. Phys. Rev. Lett. 2024, 133, 173604. [Google Scholar] [CrossRef] [Scilit] [PubMed]
- Hines, J.A.; Rajagopal, S.V.; Moreau, G.L.; Wahrman, M.D.; Lewis, N.A.; Marković, O.; Schleier-Smith, M. Spin squeezing by Rydberg dressing in an array of atomic ensembles. Phys. Rev. Lett. 2023, 131, 063401. [Google Scholar] [CrossRef] [Scilit] [PubMed]
- Duan, J.; Hu, Z.; Lu, X.; Xiao, L.; Jia, S.; Mølmer, K.; Xiao, Y. Concurrent spin squeezing and field tracking with machine learning. Nat. Phys. 2025, 21, 909–915. [Google Scholar] [CrossRef] [Scilit]
- Tang, Y.; Wen, Y.; Cai, L.; Zhao, K. Spin-noise spectrum of hot vapor atoms in an anti-relaxation-coated cell. Phys. Rev. A 2020, 101, 013821. [Google Scholar] [CrossRef] [Scilit]
- Wang, Z.; Jing, M.; Zhang, P.; Yuan, S.; Zhang, H.; Zhang, L.; Xiao, L.; Jia, S. Noise analysis of the atomic superheterodyne receiver based on flat-top laser beams. Opt. Express 2023, 31, 19909–19917. [Google Scholar] [CrossRef] [Scilit]
- Yang, X.; Zeng, G.; Li, J.; Tian, Z.; Ji, Y.; Hu, J.; Song, X.; Jiao, Y. Investigation of Atomic Transit Noise in Rydberg Receiver. J. Quantum Opt. 2024, 30, 92–98. (In Chinese) [Google Scholar]
- Bærentsen, C.; Fedorov, S.A.; Østfeldt, C.; Balabas, M.V.; Zeuthen, E.; Polzik, E.S. Squeezed light from an oscillator measured at the rate of oscillation. Nat. Commun. 2024, 15, 4146. [Google Scholar] [CrossRef] [Scilit]
- Hammerer, K.; Sørensen, A.S.; Polzik, E.S. Quantum interface between light and atomic ensembles. Rev. Mod. Phys. 2010, 82, 1041–1093. [Google Scholar] [CrossRef] [Scilit]
- Holstein, T.; Primakoff, H. Field dependence of the intrinsic domain magnetization of a ferromagnet. Phys. Rev. 1940, 58, 1098–1113. [Google Scholar] [CrossRef] [Scilit]
- Julsgaard, B. Entanglement and Quantum Interactions with Macroscopic Gas Samples. Ph.D. Thesis, University of Aarhus, Aarhus, Denmark, 2003. [Google Scholar]
- Jin, S. Joint Control of Spin Squeezing and Light Squeezing in a Hot Atomic Ensemble. Ph.D. Thesis, Fudan University, Shanghai, China, 2023. (In Chinese) [Google Scholar]
- Bao, H. Experimental Study of Spin Squeezing in Large Scale Coated Rubidium Vapor Cell. Ph.D. Thesis, Fudan University, Shanghai, China, 2019. (In Chinese) [Google Scholar]
- Bohnet, J.G.; Cox, K.C.; Norcia, M.A.; Weiner, J.M.; Chen, Z.; Thompson, J.K. Reduced spin measurement back-action for a phase sensitivity ten times beyond the standard quantum limit. Nat. Photonics 2014, 8, 731–736. [Google Scholar] [CrossRef] [Scilit]
- Sewell, R.J.; Koschorreck, M.; Napolitano, M.; Dubost, B.; Behbood, N.; Mitchell, M.W. Magnetic sensitivity beyond the projection noise limit by spin squeezing. Phys. Rev. Lett. 2012, 109, 253605. [Google Scholar] [CrossRef] [Scilit]
- Schleier-Smith, M.H.; Leroux, I.D.; Vuletić, V. States of an ensemble of two-level atoms with reduced quantum uncertainty. Phys. Rev. Lett. 2010, 104, 073604. [Google Scholar] [CrossRef] [Scilit] [PubMed]
- Xu, Z.-X.; Qu, W.-Z.; Gao, R.; Hu, X.-H.; Xiao, Y.-H. Linewidth of electromagnetically induced transparency under motional averaging in a coated vapor cell. Chin. Phys. B 2013, 22, 033202. [Google Scholar] [CrossRef] [Scilit]
- Steckelmacher, W. Knudsen flow 75 years on: The current state of the art for flow of rarefied gases in tubes and systems. Rep. Prog. Phys. 1986, 49, 1083–1107. [Google Scholar] [CrossRef] [Scilit]
- Krauter, H. Generation and Application of Entanglement of Room Temperature Ensembles of Atoms. Ph.D. Thesis, University of Copenhagen, Copenhagen, Denmark, 2011. [Google Scholar]
- Wineland, D.J.; Bollinger, J.J.; Itano, W.M.; Heinzen, D.J. Squeezed atomic states and projection noise in spectroscopy. Phys. Rev. A 1994, 50, 67–88. [Google Scholar] [CrossRef] [Scilit]
- Marchant, A.L.; Händel, S.; Wiles, T.P.; Hopkins, S.A.; Adams, C.S.; Cornish, S.L. Off-resonance laser frequency stabilization using the Faraday effect. Opt. Lett. 2010, 36, 64–66. [Google Scholar] [CrossRef] [Scilit]
- Gammelmark, S.; Julsgaard, B.; Mølmer, K. Past Quantum States of a Monitored System. Phys. Rev. Lett. 2013, 111, 160401. [Google Scholar] [CrossRef] [Scilit]
Disclaimer/Publisher’s Note: The statements, opinions and data contained in all publications are solely those of the individual author(s) and contributor(s) and not of MDPI and/or the editor(s). MDPI and/or the editor(s) disclaim responsibility for any injury to people or property resulting from any ideas, methods, instructions or products referred to in the content. |
© 2026 by the authors. Licensee MDPI, Basel, Switzerland. This article is an open access article distributed under the terms and conditions of the Creative Commons Attribution (CC BY) license.