


Abstract
Multi-wavelength lensless microscopy enables high-speed, wide-field, and high-throughput imaging, making it highly attractive for modern biomedical applications. However, its practical performance is often limited by unreliable autofocusing and wavelength-dependent phase inconsistencies, which together degrade reconstruction fidelity in complex environments. To explicitly address these two limitations, we present a fully scanning-free computational microscopy framework using a static four-wavelength Light-Emitting Diode (LED) illumination module that sequentially switches between wavelengths to provide strong spectral constraints. For robust geometric parameter estimation, we develop an Adaptive-Weighted Multi-wavelength Autofocus (A-WMAF) scheme that exploits the differential defocus sensitivities of multiple wavelengths to yield a single, sharply peaked autofocus curve and thereby reliably determines the sample–sensor distance. To mitigate chromatic phase inconsistencies, we further introduce an iterative optical-path-difference (OPD)–domain adaptive fusion strategy that fuses multi-wavelength phase estimates in a physically consistent OPD space, suppressing wavelength-dependent artifacts and reconstruction noise. With only four raw holograms acquired within seconds, the proposed method achieves high-fidelity quantitative phase reconstruction with a Phase Structural Similarity Index Measure (SSIM) of 0.9942 and a quantitative OPD accuracy of 95.0%, as well as a measured lateral resolution of 1.23 µm, surpassing the Nyquist–Shannon sampling limit. Experimental demonstrations on fixed biological samples and long-term live-cell monitoring validate that the proposed framework simultaneously achieves reliable autofocusing and chromaticity-robust phase fusion, highlighting its potential for high-throughput biomedical imaging and clinical diagnostics.
1. Introduction
1.1. Research Background and Significance
Optical microscopy is an indispensable tool in core fields such as life science research, clinical diagnostics, and materials science [1,2]. However, conventional optical microscopy has long been constrained by the inherent physical trade-off between its Field of View (FOV) and spatial resolution [3,4]. High Numerical Aperture (NA) objectives, while providing high resolution, are restricted to an extremely small FOV. This fundamentally limits its efficiency in high-throughput, large-area sample screening, such as in digital pathology or large-scale cell monitoring [5,6].
1.2. Development of Computational Microscopy Technologies
To overcome the intrinsic trade-off between FOV and resolution in conventional microscopy, a broad class of computational microscopy techniques has emerged in recent years [6,7]. Beyond computational reconstruction, the field of adaptive optics (AO) has also provided powerful solutions to the resolution–FOV trade-off by dynamically correcting wavefront aberrations to maintain high image quality over large volumes [8,9,10]. By utilizing active optical elements such as deformable mirrors, AO-enhanced microscopy can achieve diffraction-limited performance even in thick, scattering biological specimens. In parallel, rather than relying on complex hardware correction, other methods jointly design optical encoding and numerical reconstruction. Rather than relying solely on high-NA objectives, these methods jointly design optical encoding and numerical reconstruction to effectively decouple resolution from FOV. From a system perspective, modern computational microscopy can be broadly grouped into two branches: (i) lens-based systems, which retain imaging optics but synthetically extend the space–bandwidth product via angular or spatial multiplexing (e.g., Fourier ptychographic microscopy (FPM) and related synthetic-aperture techniques [11,12]); and (ii) lensless/on-chip systems, which remove imaging lenses and recover the sample from its diffracted intensity using wave-optics models (e.g., digital holography, coded ptychography, and lensless on-chip microscopy (LOCM) [13]). In the lensless/on-chip branch, LOCM replaces conventional lenses with computational algorithms, enabling giga-pixel-scale FOV without sacrificing resolution [14,15]. However, in its original single-frame form, the achievable resolution is still fundamentally limited by the pixel size of the sensor. To break this limitation, researchers have developed various multi-frame fusion techniques that introduce controlled diversity and thereby realize pixel super-resolution (PSR) [16]. Mainstream PSR strategies typically introduce diversity in space, angle, or spectrum to provide the additional information required for algorithmic reconstruction [17,18]. Specifically, space diversity refers to lateral shifts of the sample or illumination pattern, as exploited in scanning ptychography and coded-aperture LOCM [19]. Angle diversity is realized by varying the illumination angle while keeping the sample fixed, as in lens-based FPM and related synthetic-aperture techniques [12]. Spectrum diversity, in contrast, leverages the fact that waves of different wavelengths diffract with different characteristic scales to provide complementary phase-contrast constraints for phase retrieval [20]. The iOPDF framework proposed in this work falls into the spectrum-diversity-based, lensless/on-chip computational microscopy category. Mechanical scanning techniques, exemplified by Ptychography, acquire a large number of partially overlapping diffraction patterns (often hundreds of frames) by mechanically translating the sample or the illumination probe in space [21]. This high information redundancy provides excellent algorithm convergence, noise robustness, and quantitative phase retrieval capabilities, enabling sub-wavelength resolution and high-fidelity reconstruction of complex, challenging objects. However, as discussed in the work of Jiang et al. [22], this reliance on mechanical translation stages presents two inherent challenges: first, the acquisition process is time-consuming (taking several minutes), making it unsuitable for observing rapid dynamic processes (e.g., in living cells); second, the complex mechanical setup increases system cost and bulk, and may introduce vibrational noise. To address the speed limitation, researchers have turned to non-scanning techniques, replacing mechanical motion with angular diversity or wavelength diversity. A representative angular diversity technique is FPM [23]. FPM illuminates the sample from different angles using a programmable Light-Emitting Diode (LED) array, synthetically stitching together a high-resolution image in the Fourier domain. As demonstrated in the pioneering work of Zheng et al. [24], FPM eliminates the need for mechanical scanning, dramatically increasing acquisition speed, and has been successfully applied to wide-FOV, high-resolution digital pathology and live-cell imaging. However, FPM and its related synthetic aperture methods typically model reconstruction based on a 2D thin-sample transformation. This presents difficulties when processing samples with 3D thickness or slow-varying phase features [20].
Another important non-scanning approach is spectrum diversity. This class of methods exploits the physical fact that light of different wavelengths accumulates phase at different rates during free-space propagation (approximately ) to provide additional, complementary constraints for phase retrieval [25]. From a hardware perspective, spectrum-diversity systems can be remarkably simple: acquisition can often be completed by sequentially switching several differently colored LEDs or tuning the emission wavelength of a laser, without any moving parts [26]. However, as pointed out in recent lensless imaging reviews [16], shifting the complexity from mechanics to computation introduces two core challenges for wavelength-scanning lensless imaging. First, accurately estimating the propagation distance from a stack of multi-wavelength holograms is non-trivial, and naïve single-wavelength autofocus metrics often yield inconsistent or ambiguous depth estimates [27]. Second, most existing wavelength-scanning algorithms still struggle with recovering slowly varying phase components: low-frequency information is intrinsically ill-conditioned in transport-of-intensity-type formulations, so spectrum diversity alone cannot fully restore the missing low-frequency content, and residual low-frequency artifacts may remain if phase fusion is not handled carefully [16].
1.3. Motivation and Contributions of This Work
The above limitations highlight the need for a simple, scanning-free, and robust multi-wavelength computational microscopy system that can (i) accurately estimate geometric parameters such as the sample–sensor distance from multi-wavelength measurements and (ii) perform high-fidelity phase fusion across wavelengths without introducing additional low-frequency artifacts. In this work, we address these challenges through a static four-wavelength LED illumination architecture and a new computational framework termed iOPDF. Our method integrates (i) an Adaptive-Weighted Multi-wavelength Autofocus (A-WMAF) algorithm that jointly analyzes the autofocus behavior across wavelengths to yield a single, robust estimate of the propagation distance [28] and (ii) a physically interpretable OPD-domain adaptive fusion strategy that fuses multi-wavelength phase estimates in a common optical-path-difference space, thereby mitigating wavelength-dependent phase inconsistencies and enhancing reconstruction quality [29]. The proposed approach achieves high-resolution, high-throughput quantitative phase imaging while maintaining a simple and compact hardware design.
The main contributions of this work include: It requires only four frames to complete data acquisition within seconds, providing the hardware foundation for high-throughput dynamic monitoring. This algorithm integrates an enhanced A-WMAF module, which adapts and builds upon the autofocusing concepts presented in [28]. A dynamic registration module is also integrated within the iterative loop to correct for displacements, while simultaneously performing adaptive fusion in the optical path difference (OPD) physical domain, fundamentally solving the problem of phase inconsistency [29].
2. Materials and Methods
2.1. System Design and Feasibility Analysis
The theoretical foundation of this study is coherent diffraction imaging, which aims to numerically recover the complete complex amplitude of a sample from its far-field diffraction intensity patterns. According to the Nyquist–Shannon sampling theorem, the resolution of conventional lensless imaging systems is fundamentally limited by the pixel size of the image sensor. To overcome this limitation, we employ a multi-wavelength illumination strategy, which exploits wavelength-dependent diffraction diversity to mitigate pixel aliasing, thereby enabling pixel super-resolution imaging by fusing information collected under different wavelengths. The core of our approach is a static, scanning-free computational microscopy system. The feasibility of the system is established on an accurate physical model of wave propagation based on the angular spectrum method [30]. This model describes the diffraction of light from the sample plane to the detector plane for different illumination wavelengths. The wavelength dependence of the propagation operator in this model is the physical origin of axial chromatic aberration: as light of different wavelengths propagates in free space, their corresponding diffraction patterns exhibit differences in scaling and effective focal distance. On the one hand, this provides rich constraints for phase retrieval; on the other hand, it poses significant challenges for the registration and fusion capabilities of the reconstruction algorithm. Building on a detailed understanding of this physical model, this study presents a static imaging system and a robust reconstruction algorithm designed to leverage the advantages of wavelength diversity while simultaneously overcoming the challenges it introduces.
2.2. Scanning-Free Multi-Wavelength LED Setup and Data Acquisition
The imaging apparatus is a compact and static lensless microscope, comprising an illumination unit, a sample stage, and a Complementary Metal-Oxide-Semiconductor (CMOS) detection module. The illumination unit consists of an integrated module with four independently and electronically controlled LEDs, with center wavelengths of 632 nm, 575 nm, 520 nm, and 474 nm, respectively. The sample holding unit is a fixed mechanical stage that can stably support standard microscope slides or Petri dishes. The detection unit primarily utilizes a high-resolution CMOS image sensor (AR1335, ON Semiconductor, Phoenix, AZ, USA) with a pixel size of 1.1 µm for static imaging and resolution validation. For the live-cell monitoring in Section 3.5, a different sensor (IMX226, Sony Semiconductor Solutions Corporation, Atsugi-shi, Japan) with a 1.85 µm pixel pitch was employed to demonstrate hardware adaptability. In both configurations, the sensor is positioned several millimeters below the sample stage to capture near-field diffraction holograms. Acquisition of a raw data set is rapid and fully automated. After placing the sample on the stage, the control software sequentially triggers the four LEDs for stroboscopic illumination. For each monochromatic illumination, the CMOS sensor is synchronized for a single exposure to capture a full-frame diffraction pattern; the average exposure time for each monochromatic frame is typically 10 ms. Including the electronic switching delay of the multi-wavelength LED module and the sensor readout, the total acquisition time for a complete four-wavelength dataset is approximately 1 s. Compared to the typical migration and morphological change timescales of mammalian cells (usually on the order of micrometers per hour), this 1-s acquisition window is sufficiently short to ensure that any cell-induced displacement is negligible relative to the system’s spatial resolution (1.23 µm). This effectively eliminates motion blur and provides a robust foundation for high-temporal-resolution monitoring of dynamic biological processes. The entire multi-spectral data set, which contains four holograms recorded under different wavelengths, is thus acquired within seconds, enabling quasi-real-time capture of the sample’s state.
2.3. Numerical Simulation Setup
To systematically evaluate the performance of the proposed reconstruction algorithm, we conducted numerical simulations under controlled conditions. The ground-truth sample was a complex object field, which was numerically propagated using the angular spectrum method to generate four ideal diffraction patterns corresponding to the four illumination wavelengths. To emulate realistic experimental conditions, Gaussian white noise was added to each simulated diffraction pattern. In addition, sub-pixel random lateral shifts were introduced across different wavelengths to test the algorithm’s robustness to misalignment and sensor-level perturbations. These simulated holograms served as the input for validating the effectiveness of the iOPDF reconstruction framework.
2.4. Biological Sample Preparation and Comparative Imaging
To validate the system performance on real biological specimens, we prepared two representative transparent phase samples that are typically challenging for bright-field microscopy: fixed HeLa cells and unstained mouse kidney tissue slices. HeLa cells were cultured in Dulbecco’s Modified Eagle Medium (DMEM) supplemented with 10% fetal bovine serum and 1% penicillin–streptomycin (Gibco, Carlsbad, CA, USA) in a humidified incubator at 37 °C with 5% CO2. Cells were grown on 35 mm glass-bottom dishes (NEST, Wuxi, China) until reaching approximately 70–80% confluency. Prior to imaging, the cells were fixed with 4% paraformaldehyde (Biosharp, Hefei, China) for 15 min at room temperature, followed by three washes with phosphate-buffered saline. The unstained mouse kidney tissue slices (Tianjian, Xinxiang, China) underwent standard deparaffinization and rehydration before imaging. For live-cell dynamic monitoring, HeLa cells were cultured to full confluency, after which a linear wound was generated by scratching the monolayer with a sterile 200 µL pipette tip. Detached cells were removed by three washes with PBS, and the dish was replenished with fresh medium before being placed on the imaging system for long-term observation. To enable quantitative comparison, images of the same fields of view were also captured using a commercial inverted microscope (Axio Observer A1, Carl Zeiss AG, Oberkochen, Germany) equipped with 5× and 10×, 0.4 NA phase-contrast objectives. These conventional microscope images served as the reference standard for evaluating the fidelity of the iOPDF reconstruction.
2.5. iOPDF Reconstruction Framework
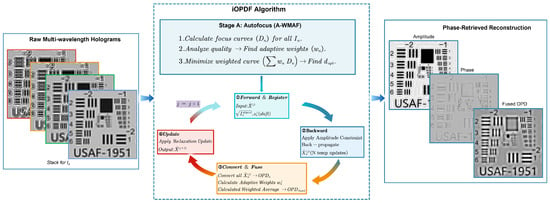
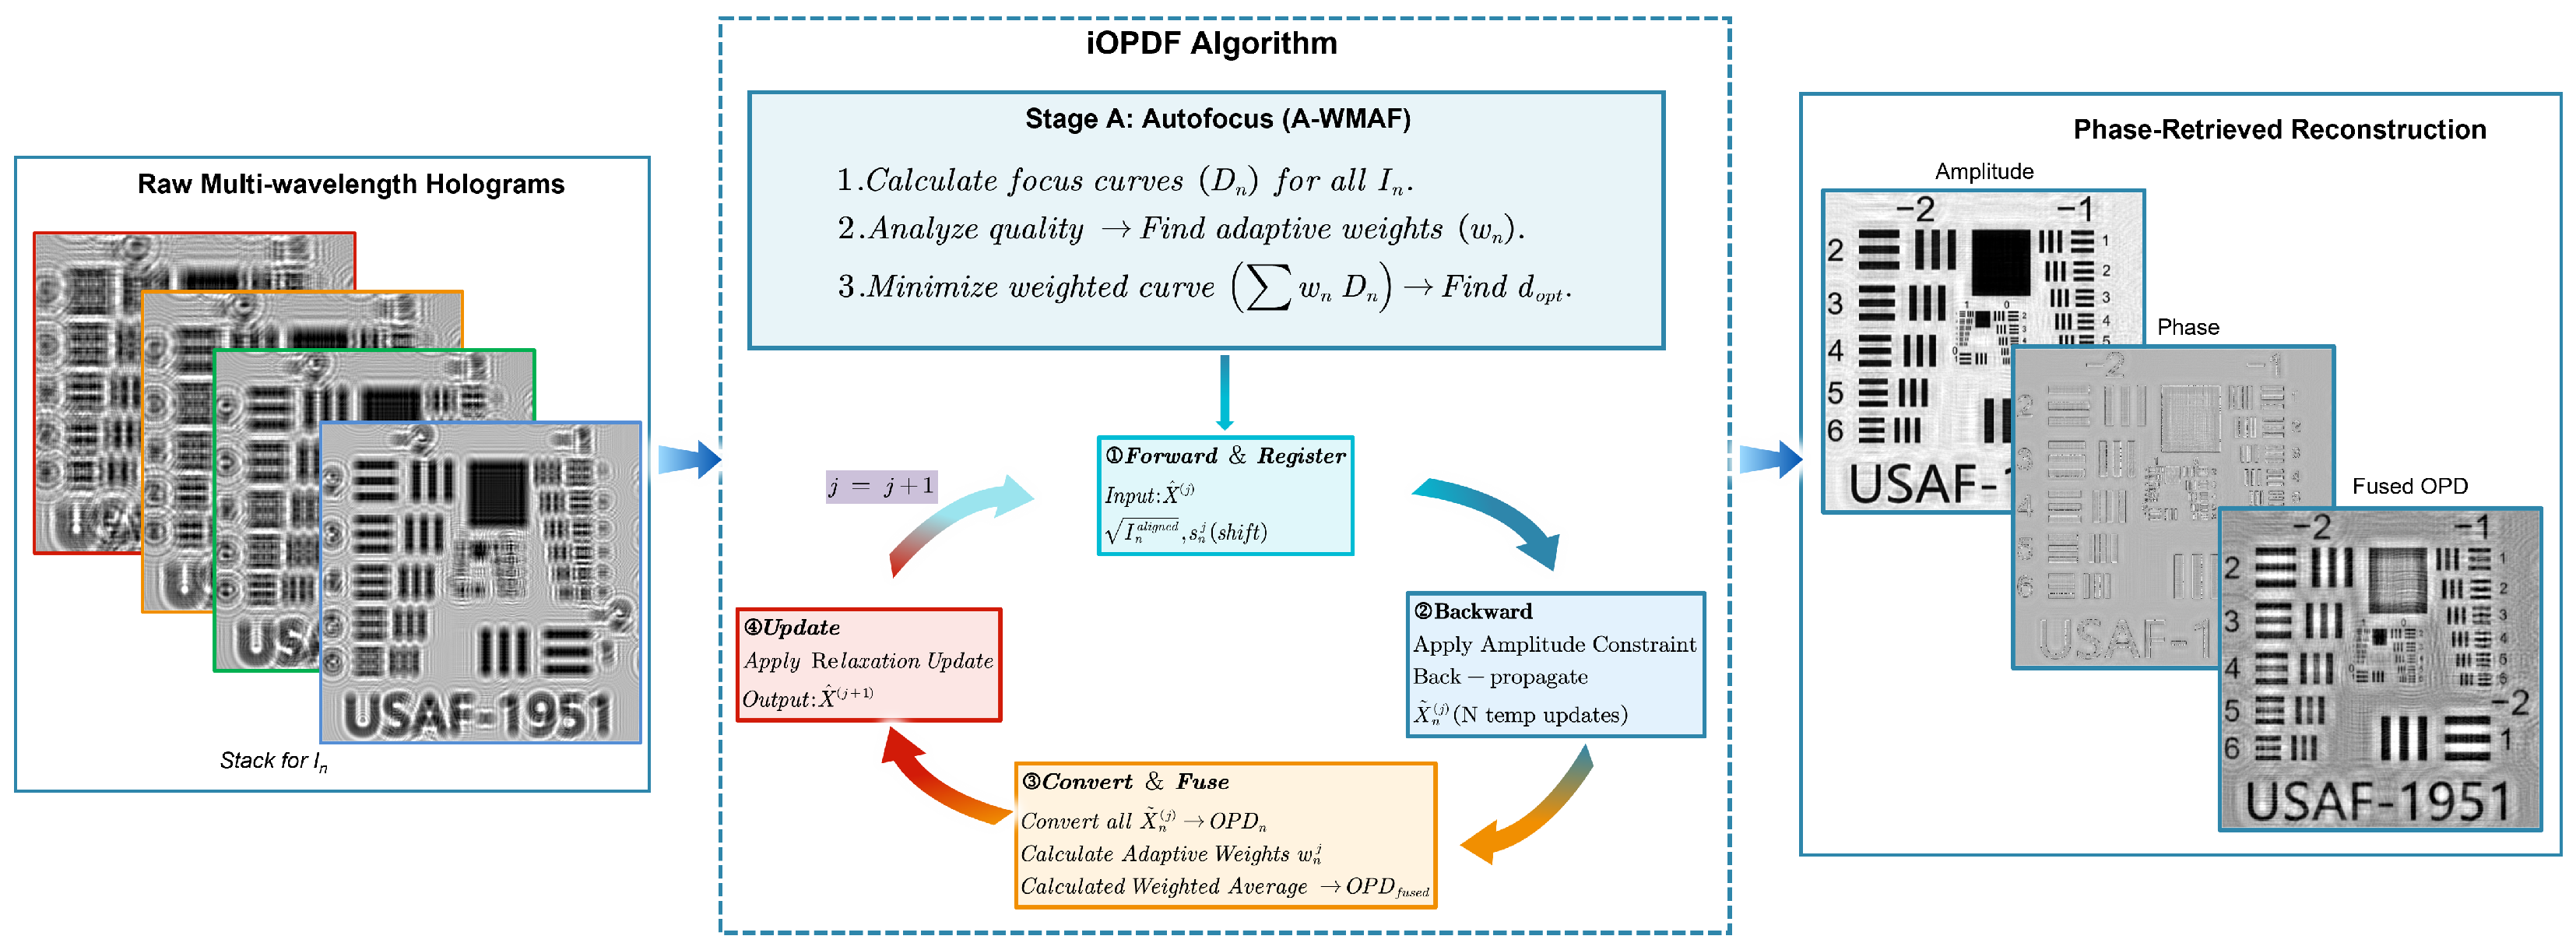
The proposed iOPDF framework integrates geometric parameter estimation, multi-wavelength phase retrieval, and OPD-domain adaptive fusion into a unified iterative pipeline (Figure 1). The workflow proceeds as follows:
Figure 1.
Iterative reconstruction flowchart of the iOPDF algorithm. The A-WMAF autofocusing module, which calculates the optimal propagation distance from the raw multi-wavelength holograms; and The iOPDF iterative phase retrieval loop. This loop cycles through four steps (Forward Propagation & Register, Backward Propagation & Constraint, OPD Convert & Fuse, and Relaxation Update) to reconstruct the final high-resolution amplitude, phase, and OPD images from the raw data.
- (i)
- Multi-wavelength data acquisition: Four wavelength-specific diffraction holograms are captured sequentially. These measurements form the input to the reconstruction.
- (ii)
- Geometric parameter optimization via A-WMAF: The first stage estimates the optimal sample–sensor distance . The Adaptive-Weighted Multi-wavelength Autofocus (A-WMAF) module fuses wavelength-specific autofocus metrics to determine a stable global minimum (details in Section 2.6). The resulting is used for all subsequent propagation operations.
- (iii)
- Initialization: An initial complex field is constructed by back-propagating the square root of the measured intensity to the sample plane using .
- (iv)
- Alternating-projection update: At iteration k, the complex field for wavelength is forward-propagated to the sensor plane. Its amplitude is updated with the measurement while preserving the phase, followed by back-propagation to the sample plane.
- (v)
- Dynamic multi-channel registration: To correct sub-pixel lateral misalignments, each updated complex field is registered to the reference wavelength using Fourier-based sub-pixel alignment [31]. This ensures spatial consistency prior to fusion.
- (vi)
- OPD-domain adaptive fusion: The registered phase maps are converted into OPD and fused using adaptive reliability weights (details in Section 2.7). This yields a physically consistent OPD estimate shared across all wavelengths, suppressing artifacts.
- (vii)
- Phase redistribution: The fused OPD map is converted back into wavelength-specific phases for the next iteration [30,32].
- (viii)
- Convergence: Steps (iv)–(vii) are repeated until the reconstruction error falls below a predefined threshold. The final output includes both amplitude and quantitative phase.
2.6. Adaptive-Weighted Multi-Wavelength Autofocus
Standard autofocus metrics exhibit wavelength-dependent sensitivity, where shorter wavelengths generally yield sharper peaks but lower noise tolerance [28]. To optimally integrate these complementary responses, A-WMAF assigns an adaptive weight to each channel, yielding a fused metric as shown in Equation (1):
where represents the focus metric for the n-th wavelength, defined here as the local curvature (second-order derivative) of the image sharpness function. This curvature-based metric is utilized because it exhibits a sharper and more unambiguous peak at the focal plane compared to raw sharpness values. The weights are automatically determined from the local curvature of around its minimum. Intuitively, a steeper minimum implies higher Fisher information regarding d [30], where perturbations in d yield larger changes in . We regularize these curvature estimates by smoothing and normalizing the weights such that . This prevents noisy channels from dominating the fusion. The optimal distance is finally selected according to Equation (2):
As validated in Section 3.1, this curvature-based weighting significantly improves geometric estimation robustness under low-contrast conditions.
2.7. OPD-Domain Adaptive Fusion Strategy
To resolve the wavelength-dependent phase scaling (), we perform fusion in the unified OPD domain rather than the phase domain. Phase estimates are first converted to OPD values using Equation (3):
This transformation ensures that all wavelengths are represented in a shared, physically interpretable domain. Following sub-pixel registration, the fused OPD estimate is computed as described in Equation (4):
where is a pixel-wise adaptive reliability weight derived from local gradient statistics. Sharper and less noisy regions contribute more to the final estimate. This strategy effectively suppresses wavelength-dependent phase inconsistencies and artifacts, as demonstrated in Section 3.3.
3. Results
3.1. Simulation Results and Algorithm Robustness Validation
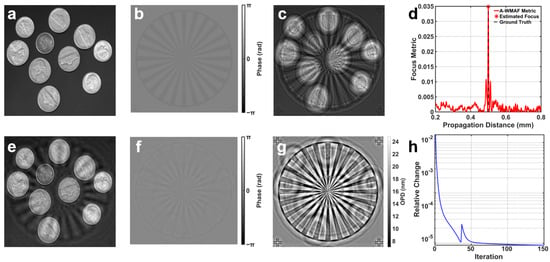
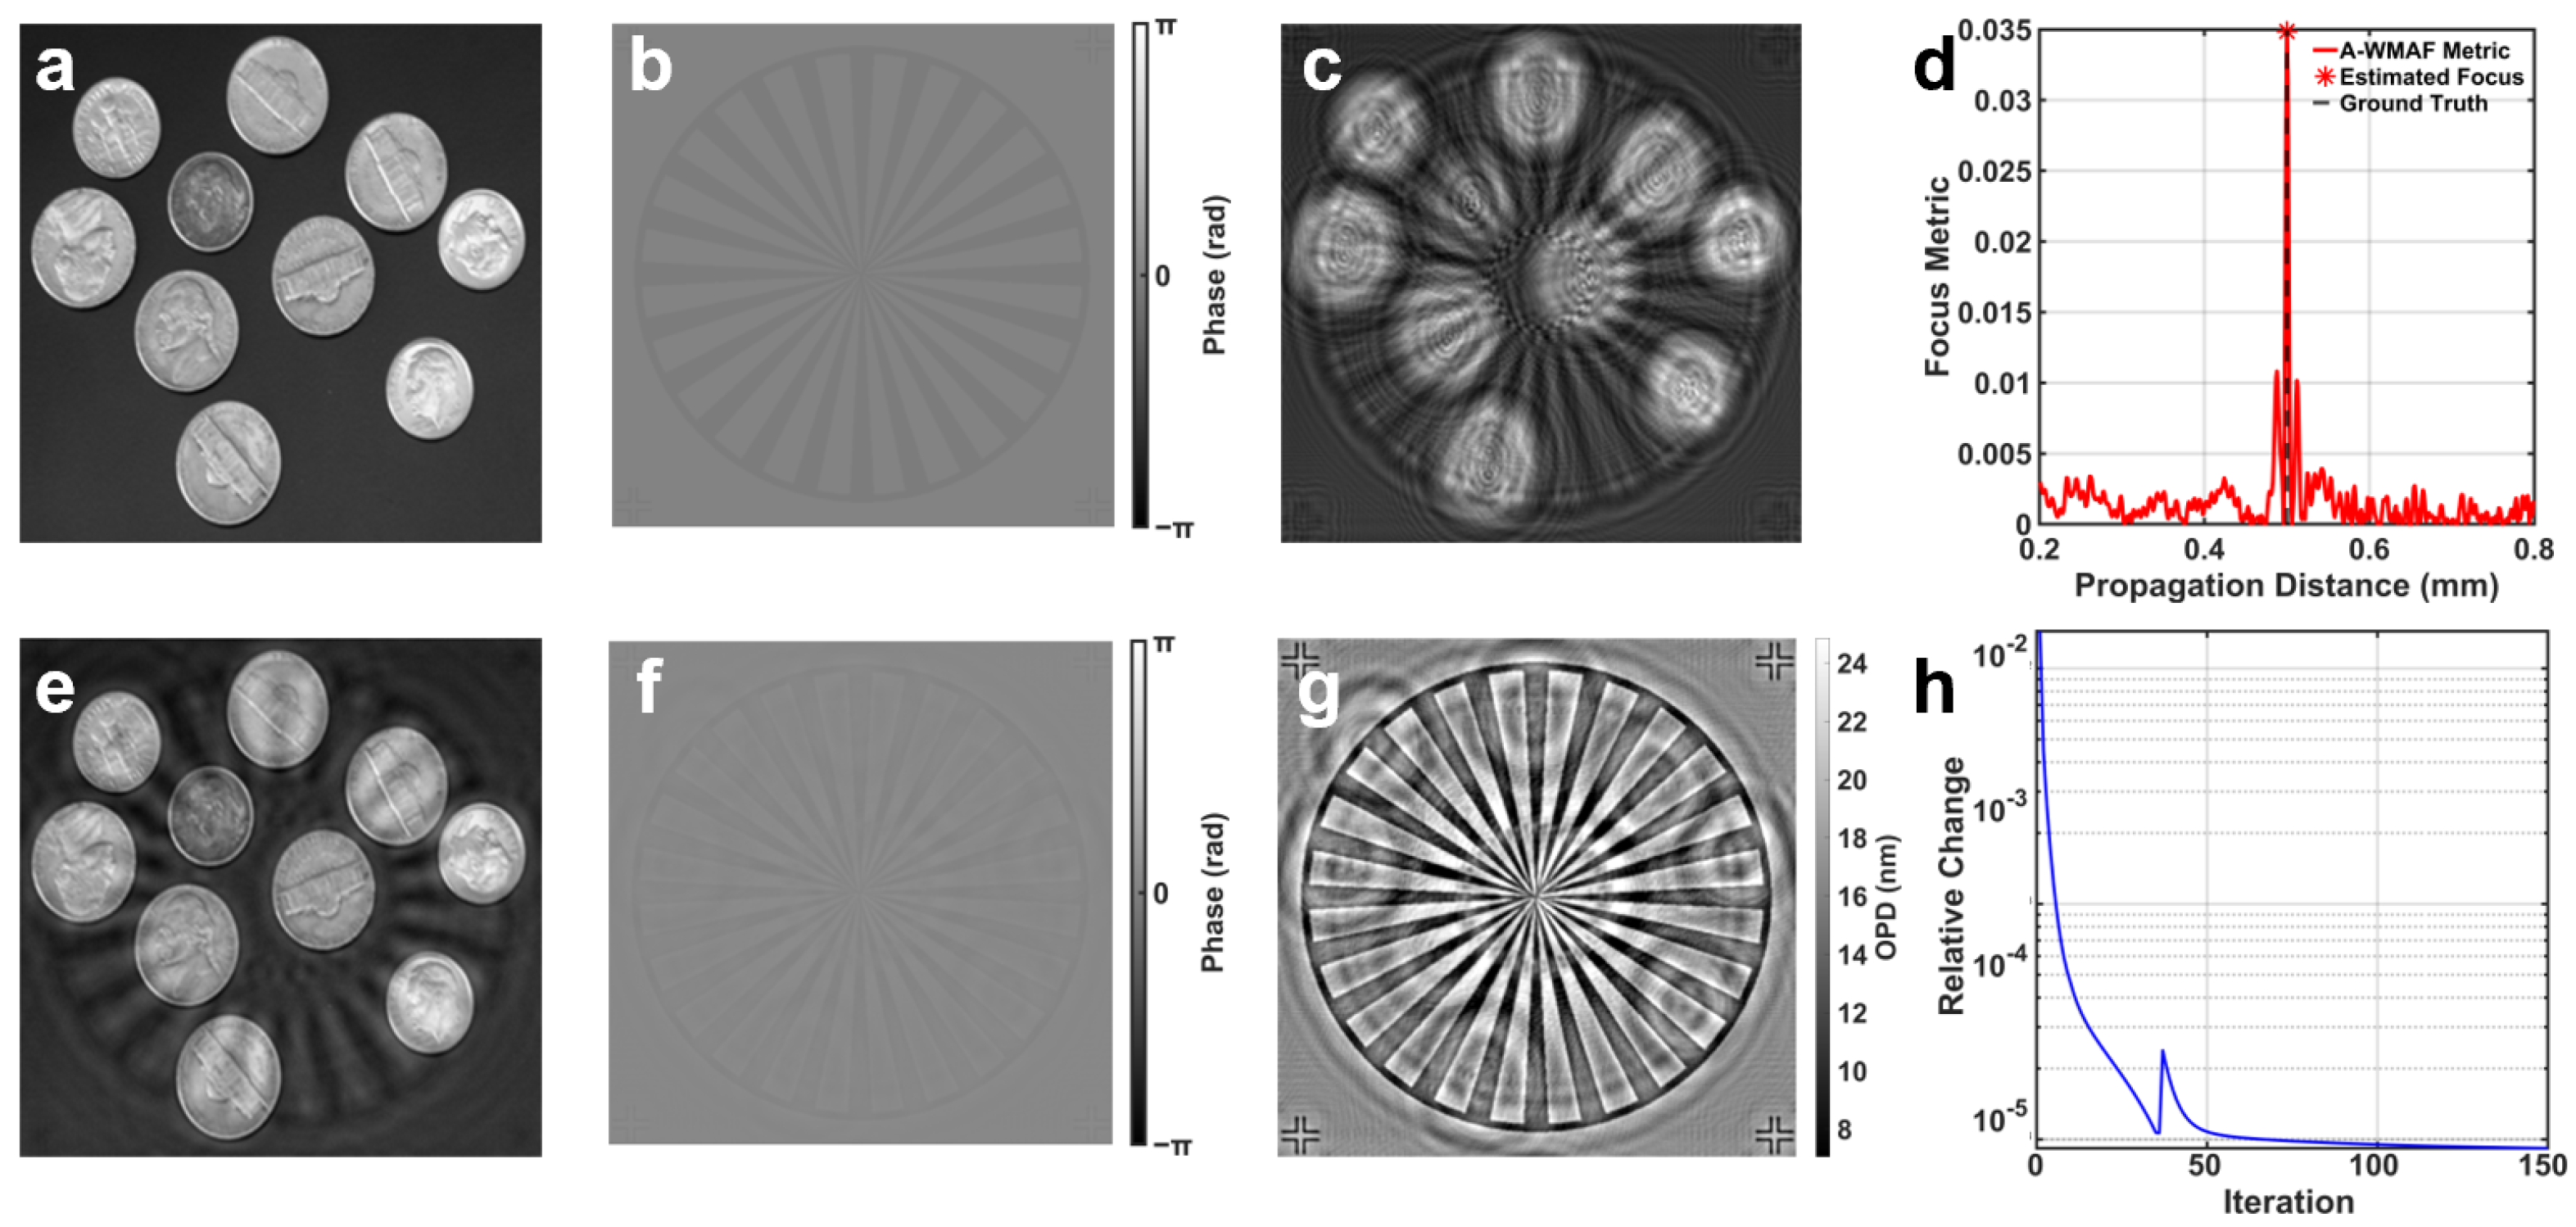
To validate the effectiveness and robustness of the proposed iOPDF algorithm under controlled conditions, we first performed numerical simulations. The parameters used in the simulation were consistent with those of the subsequent experimental setup to ensure the relevance of the results. The ground truth sample used in the simulation was a high-resolution digital phantom containing complex amplitude and phase features derived from standard test patterns, designed to simulate a challenging low-contrast, weak-phase object (Figure 2a,b). We used this complex field to generate four diffraction patterns corresponding to different wavelengths, to which a low level of Gaussian white noise was added (an example is shown in Figure 2c). A critical first step of this algorithm is to accurately determine the propagation distance from this challenging input data. The performance of the A-WMAF module is presented in Figure 2d. As shown, the focus metric curve exhibits a sharp, unambiguous peak at the true focal plane, confirming the high sensitivity and precision of the curvature-based geometric estimation. We employ a metric based on the second derivative (curvature) of image sharpness, which exhibits a sharp peak at the true focus. As shown, the metric curve forms a clear, unambiguous peak at the ground truth propagation distance (0.5 mm), which the algorithm successfully identifies as the optimal focus (indicated by the red star in Figure 2d, coinciding with the black dashed ground-truth line). This result validates the robustness of our autofocusing strategy, which is essential for the subsequent high-fidelity reconstruction. Using the optimal distance determined by A-WMAF, we then performed phase retrieval. The final reconstructed amplitude and phase are shown in Figure 2e,f, respectively. Visually, the reconstructions exhibit excellent agreement with the ground truth, accurately recovering both the fine details of the low-contrast amplitude and the subtle variations of the weak phase profile without significant artifacts. This high fidelity is further confirmed by the clean, artifact-free fused OPD map (Figure 2g), which serves as the primary quantitative output of our multi-wavelength fusion strategy, providing a high-contrast representation of the sample’s phase information. Quantitative analysis corroborates the superior visual quality. The root-mean-square error (RMSE) for the reconstructed amplitude was 0.0735, and the phase RMSE reached an excellent 0.1950 rad. Furthermore, the Structural Similarity Index Measure (SSIM) reached 0.9024 for the amplitude and a near-perfect 0.9942 for the phase. These metrics quantify the low measurement error of our method even in the presence of Gaussian white noise. Finally, the convergence behavior is illustrated by the relative change curve (Figure 2h), where “Relative Change” is defined as the normalized norm of the difference between successive complex fields, . The “Iteration Number” refers to the number of update cycles within the iOPDF loop. As shown, the relative change decreases rapidly, reaching a converged state after approximately 50 iterations.
Figure 2.
Numerical validation of the iOPDF algorithm using a digital phantom. (a,b) Ground truth amplitude and phase profiles of the simulated complex object; (c) Representative raw diffraction hologram captured under 528 nm illumination; (d) Weighted multi-wavelength autofocus (A-WMAF) curve calculated via the second-order derivative (curvature) of the sharpness metric, where the red star indicates the estimated focus and the black dashed line represents the ground truth; (e,f) Reconstructed amplitude and phase images using the iOPDF framework; (g) Resulting fused OPD map (unit: nm); (h) Convergence curve showing the relative change as a function of the iteration number, demonstrating stable numerical performance.
Collectively, these simulation results provide strong evidence for the iOPDF algorithm’s accuracy, robustness, and stability.
3.2. Experimental System Performance Validation
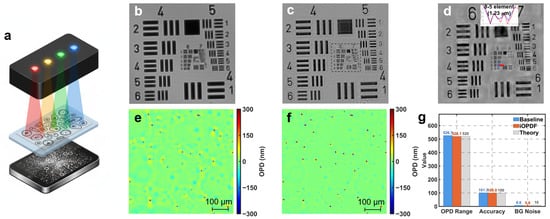
After validating the effectiveness of the iOPDF algorithm through numerical simulations, we further validated its performance on our real experimental system. The schematic of our static multi-wavelength lensless imaging system is illustrated in Figure 3a, which features a multi-spectral LED module for sequential illumination. We first used a standard United States Air Force (USAF) 1951 resolution target as the test specimen to quantify the system’s spatial resolution. The experimental imaging performance of the system is shown in Figure 3. As shown in Figure 3b, after inputting a blurry raw diffraction pattern (not shown for brevity) into our iOPDF algorithm, we obtained a high-resolution reconstructed amplitude image. In the figure, the line pairs from various groups, both large and small, are clearly recovered. To objectively quantify the spatial resolution of the system, we analyzed the finest resolvable details in the reconstructed image, as shown in Figure 3c,d. Figure 3d is a magnified view of the region in the dashed box from Figure 3c. We performed a line profile analysis on the finest resolvable structure (Group 8, Element 5) which corresponds to a half-pitch resolution of 1.23 µm. As shown in the inset plot of Figure 3d, its amplitude profile curve exhibits clearly distinguishable peaks and valleys with sufficient contrast to be clearly identified. Considering the 1.1 µm pixel size of the CMOS sensor used, the corresponding Nyquist–Shannon sampling limit is 2.2 µm. The achieved 1.23 µm resolution successfully surpasses this physical sampling limit, clearly demonstrating the PSR capability of our method enabled by multi-wavelength diversity.
Figure 3.
iOPDF system design and experimental performance validation. (a) Schematic of the static multi-wavelength lensless imaging system. (b) Reconstructed amplitude image of a USAF resolution target. (c) Magnified view of the dashed box region in (b). (d) Further magnified view of (c) with an inset amplitude profile. (e) OPD map of 2 µm microspheres reconstructed using the traditional baseline method. (f) OPD map of the same microsphere data reconstructed using our iOPDF method. The colorbars in (e) and (f) indicate the OPD in nanometers (nm). (g) Quantitative performance comparison between the iOPDF method and the baseline method.
3.3. Performance Evaluation of OPD-Domain Adaptive Fusion
To further isolate and validate the superiority of our algorithm’s core innovation—the OPD-domain adaptive fusion strategy—we conducted a comparative experiment using 2 µm polystyrene microspheres, which are strong phase objects. We designed a baseline method as a control group, which uses traditional complex-field averaging to fuse the multi-wavelength information, while all other parameters (such as the autofocusing distance) were kept identical to our iOPDF method. The reconstruction results are compared in Figure 3e–g. As shown in Figure 3e, the OPD map reconstructed by the traditional baseline method is inundated with strong ring-like artifacts and high-frequency noise caused by the phase inconsistency between different wavelengths. In stark contrast, the OPD map reconstructed by our iOPDF method (Figure 3f) shows a clean and smooth background, with the microsphere signals clearly recovered, demonstrating excellent artifact suppression. The quantitative bar chart in Figure 3g further confirms this advantage. In terms of accuracy, the iOPDF method’s measured OPD peak-to-peak value (517.7 nm) almost perfectly matches the theoretical value (520 nm), achieving 95.0% accuracy, whereas the baseline method shows a clear deviation (484.4 nm, 93.2% accuracy). To provide a quantitative assessment of measurement noise, we calculated the standard deviation of the background region in the reconstructed OPD maps. The results, summarized in Figure 3g, show that the iOPDF method significantly suppresses background noise to 8.6 nm, achieving a 20.4% reduction compared to the baseline method (10.8 nm). This suppression of coherent artifacts effectively increases the signal-to-noise ratio (SNR) and enhances the measurement confidence for charactering subtle phase objects. This comparison strongly proves that the iOPDF fusion strategy is key to achieving high-fidelity, high-accuracy quantitative phase imaging.
3.4. Application to Biological Sample Imaging
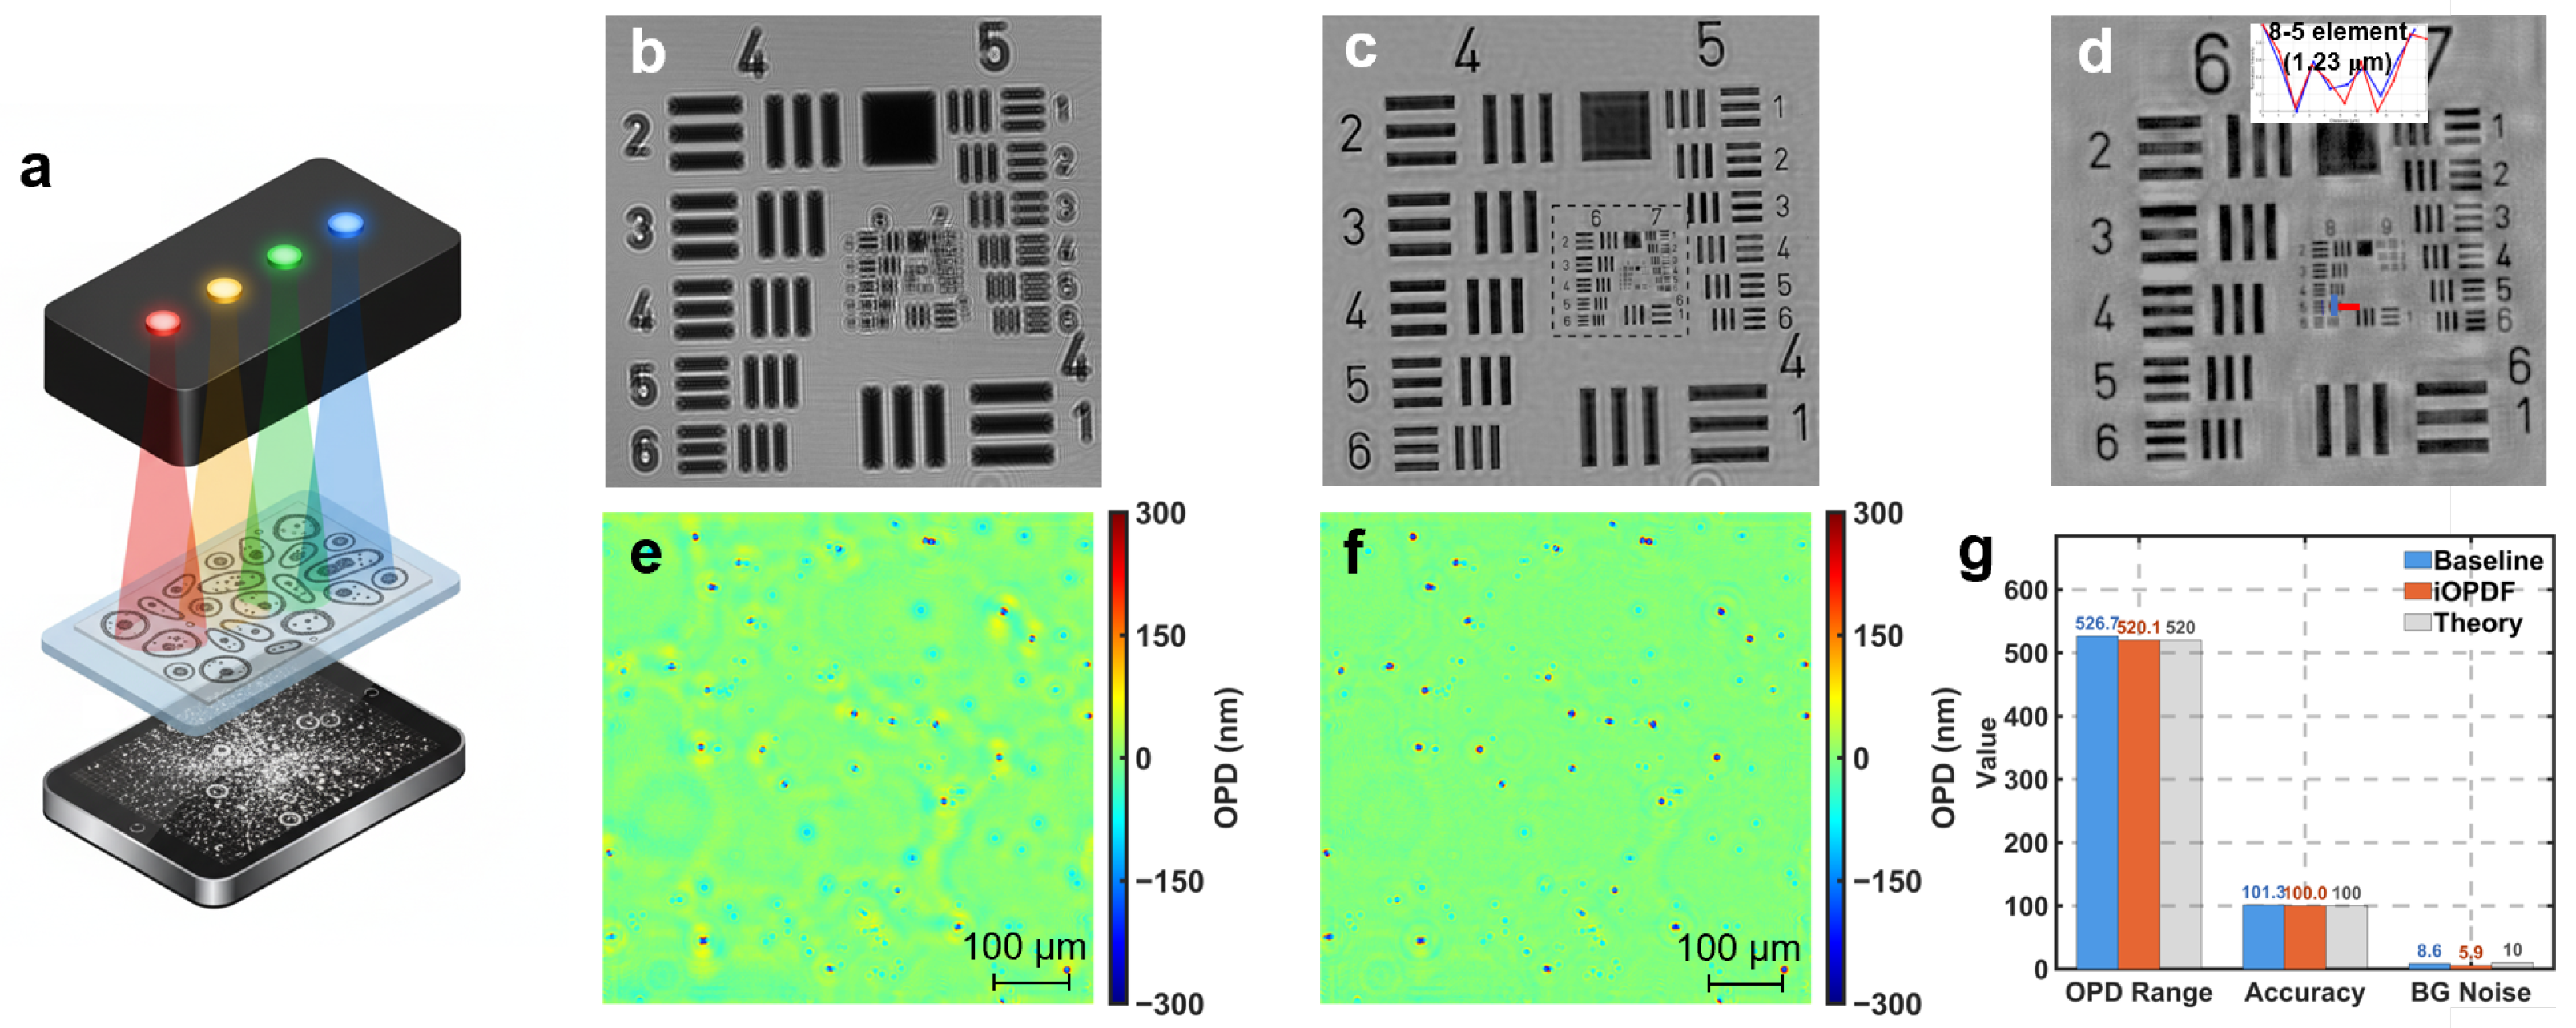
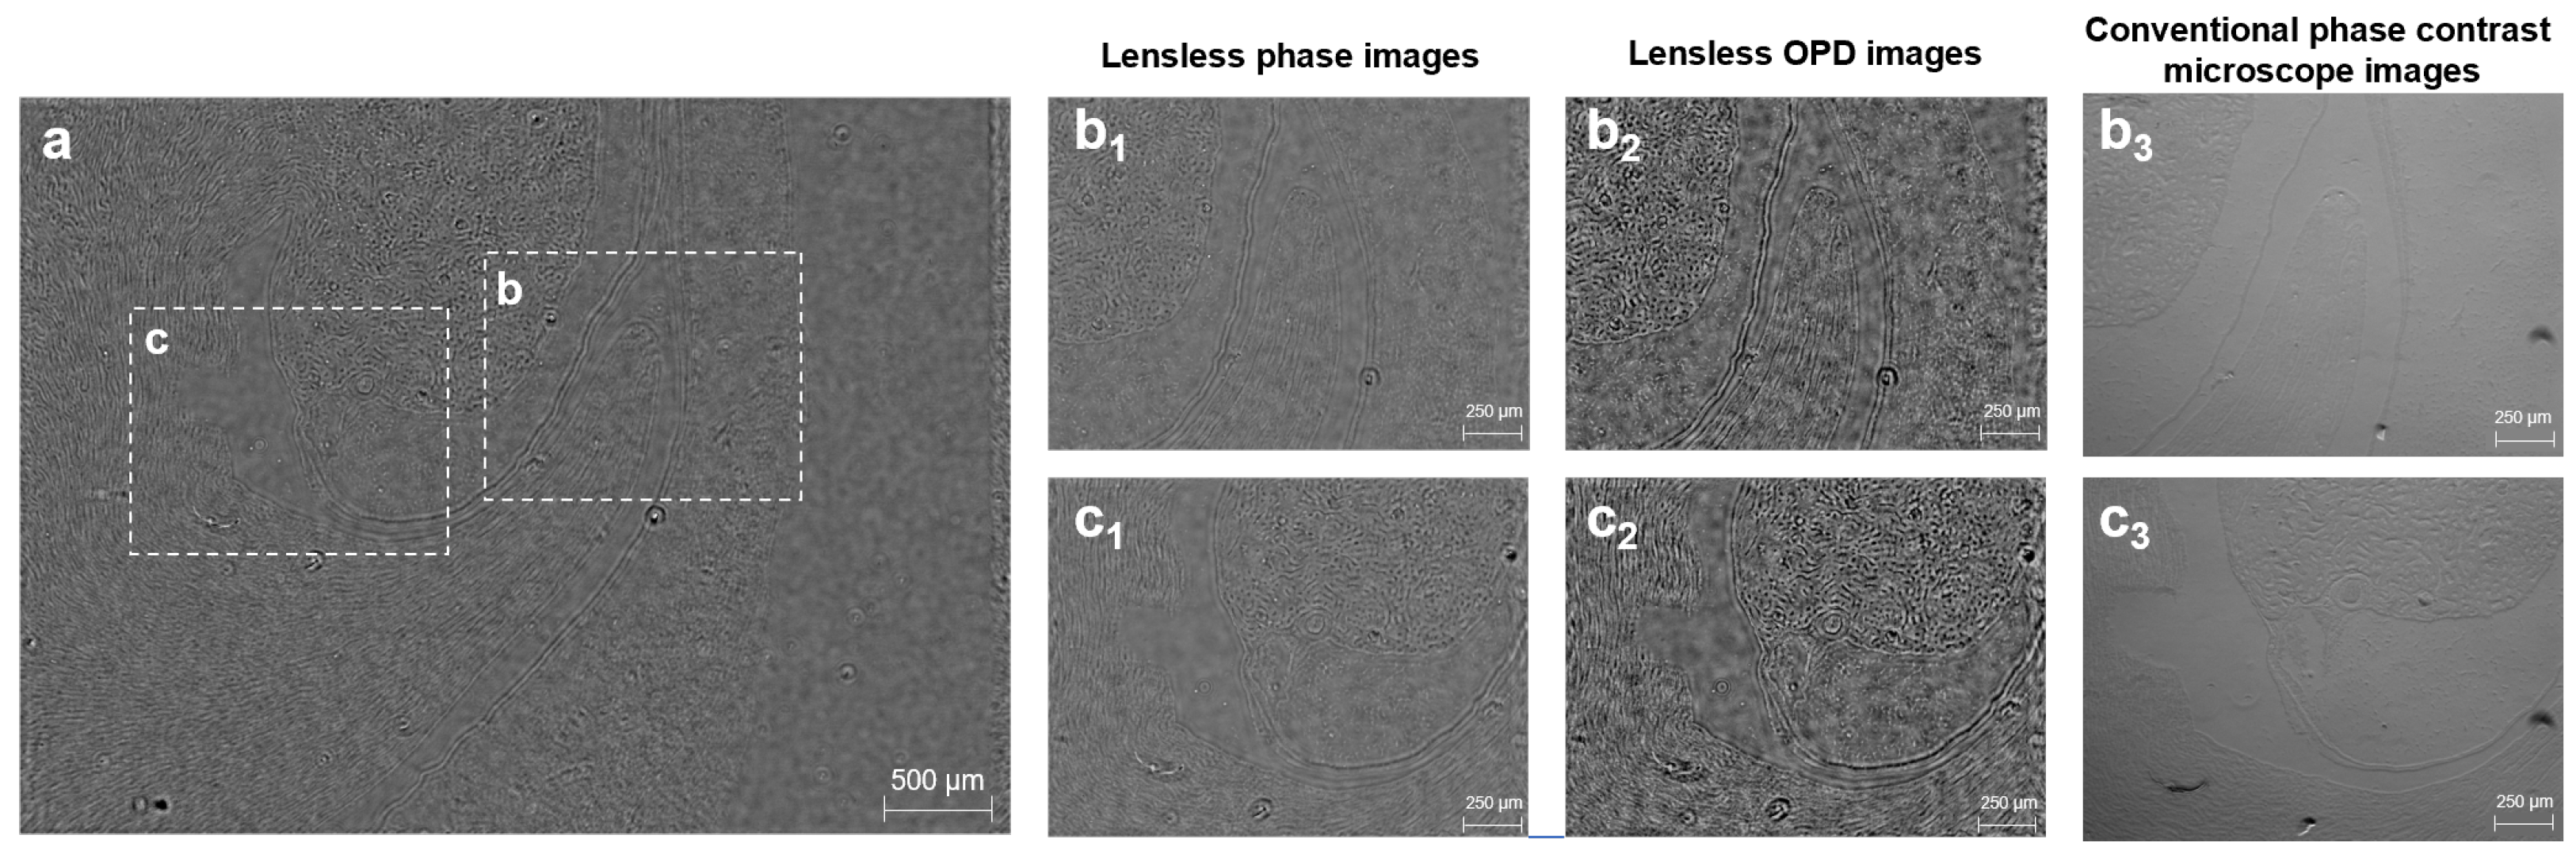
To comprehensively demonstrate the performance of the iOPDF system in real-world biological applications, we validated its imaging capabilities at both the single-cell and tissue levels. We selected two typical transparent phase specimens that are challenging to observe under conventional bright-field microscopy: fixed HeLa cells and an unstained mouse kidney tissue slice. First, to evaluate the system’s ability to resolve fine structures at the single-cell level, we imaged the HeLa cell sample, with the results shown in Figure 4. As illustrated in Figure 4a, our lensless system can acquire and reconstruct a large FOV quantitative phase map, clearly showing the macroscopic distribution of the HeLa cells in the culture dish, which highlights its potential for high-throughput cell screening. For a detailed assessment of the reconstruction quality, we selected two representative regions (indicated by dashed boxes ’b’ and ’c’ in Figure 4a) and compared our results with the “gold standard” images from a conventional phase contrast microscope. As shown in Figure 4b,e, our iOPDF algorithm successfully reconstructed high-quality quantitative phase maps of the cells, in which the contours, morphology, and some internal structural variations of individual cells are clearly discernible. Their corresponding OPD maps (Figure 4c,f) further provide quantitative information about the sample’s physical thickness/density. Importantly, a high degree of morphological consistency is observed when comparing our reconstructed results with the conventional phase contrast microscope images of the same regions (Figure 4d,g).
Figure 4.
Lensless reconstruction of HeLa cells and comparison with conventional phase contrast microscopy. (a) A large field-of-view quantitative phase map of HeLa cells reconstructed by our method, with dashed boxes indicating regions ’b’ and ’c’ for magnified analysis. (b1,c1) Reconstructed phase maps of regions ’b’ and ’c’. (b2,c2) Their corresponding OPD maps. (b3,c3) Conventional phase contrast microscope images of the same regions.
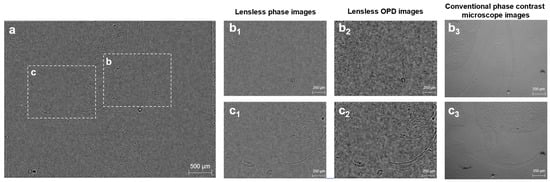
Subsequently, to further demonstrate the system’s imaging performance on more complex biological tissues, we performed label-free imaging of an unstained mouse kidney tissue slice, with the results shown in Figure 5. Similarly, our system was able to acquire a centimeter-scale large FOV quantitative phase map (Figure 5a), presenting the overall macrostructure of the kidney tissue. In the magnified views, our algorithm successfully reconstructed high-quality quantitative phase maps (Figure 5b,e) and their corresponding OPD maps (Figure 5c,f). In these label-free phase images, key histological structures such as glomeruli and convoluted tubules are clearly resolved. The results are in excellent agreement with the images from a conventional phase contrast microscope (Figure 5d,g) in terms of tissue architecture.
Figure 5.
Lensless reconstruction of an unstained mouse kidney tissue slice and comparison with conventional phase contrast microscopy. (a) A large field-of-view quantitative phase map of the mouse kidney slice reconstructed by our method, with dashed boxes indicating regions ’b’ and ’c’ for magnified analysis. (b1,c1) Reconstructed phase maps of regions ’b’ and ’c’. (b2,c2) Their corresponding OPD maps. (b3,c3) Conventional phase contrast microscope images of the same regions.
In summary, from individual HeLa cells to complex kidney tissues, the experimental results strongly demonstrate that our lensless computational method is capable of label-free, high-contrast, large-FOV imaging for multi-scale, complex biological samples, with performance comparable to that of established conventional phase imaging techniques.
3.5. Live-Cell Dynamic Monitoring
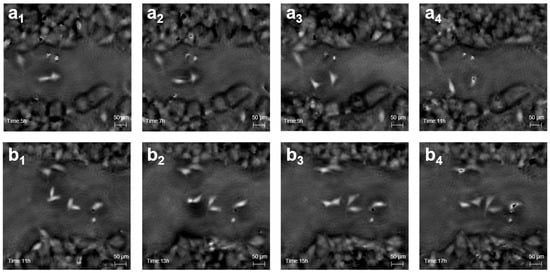
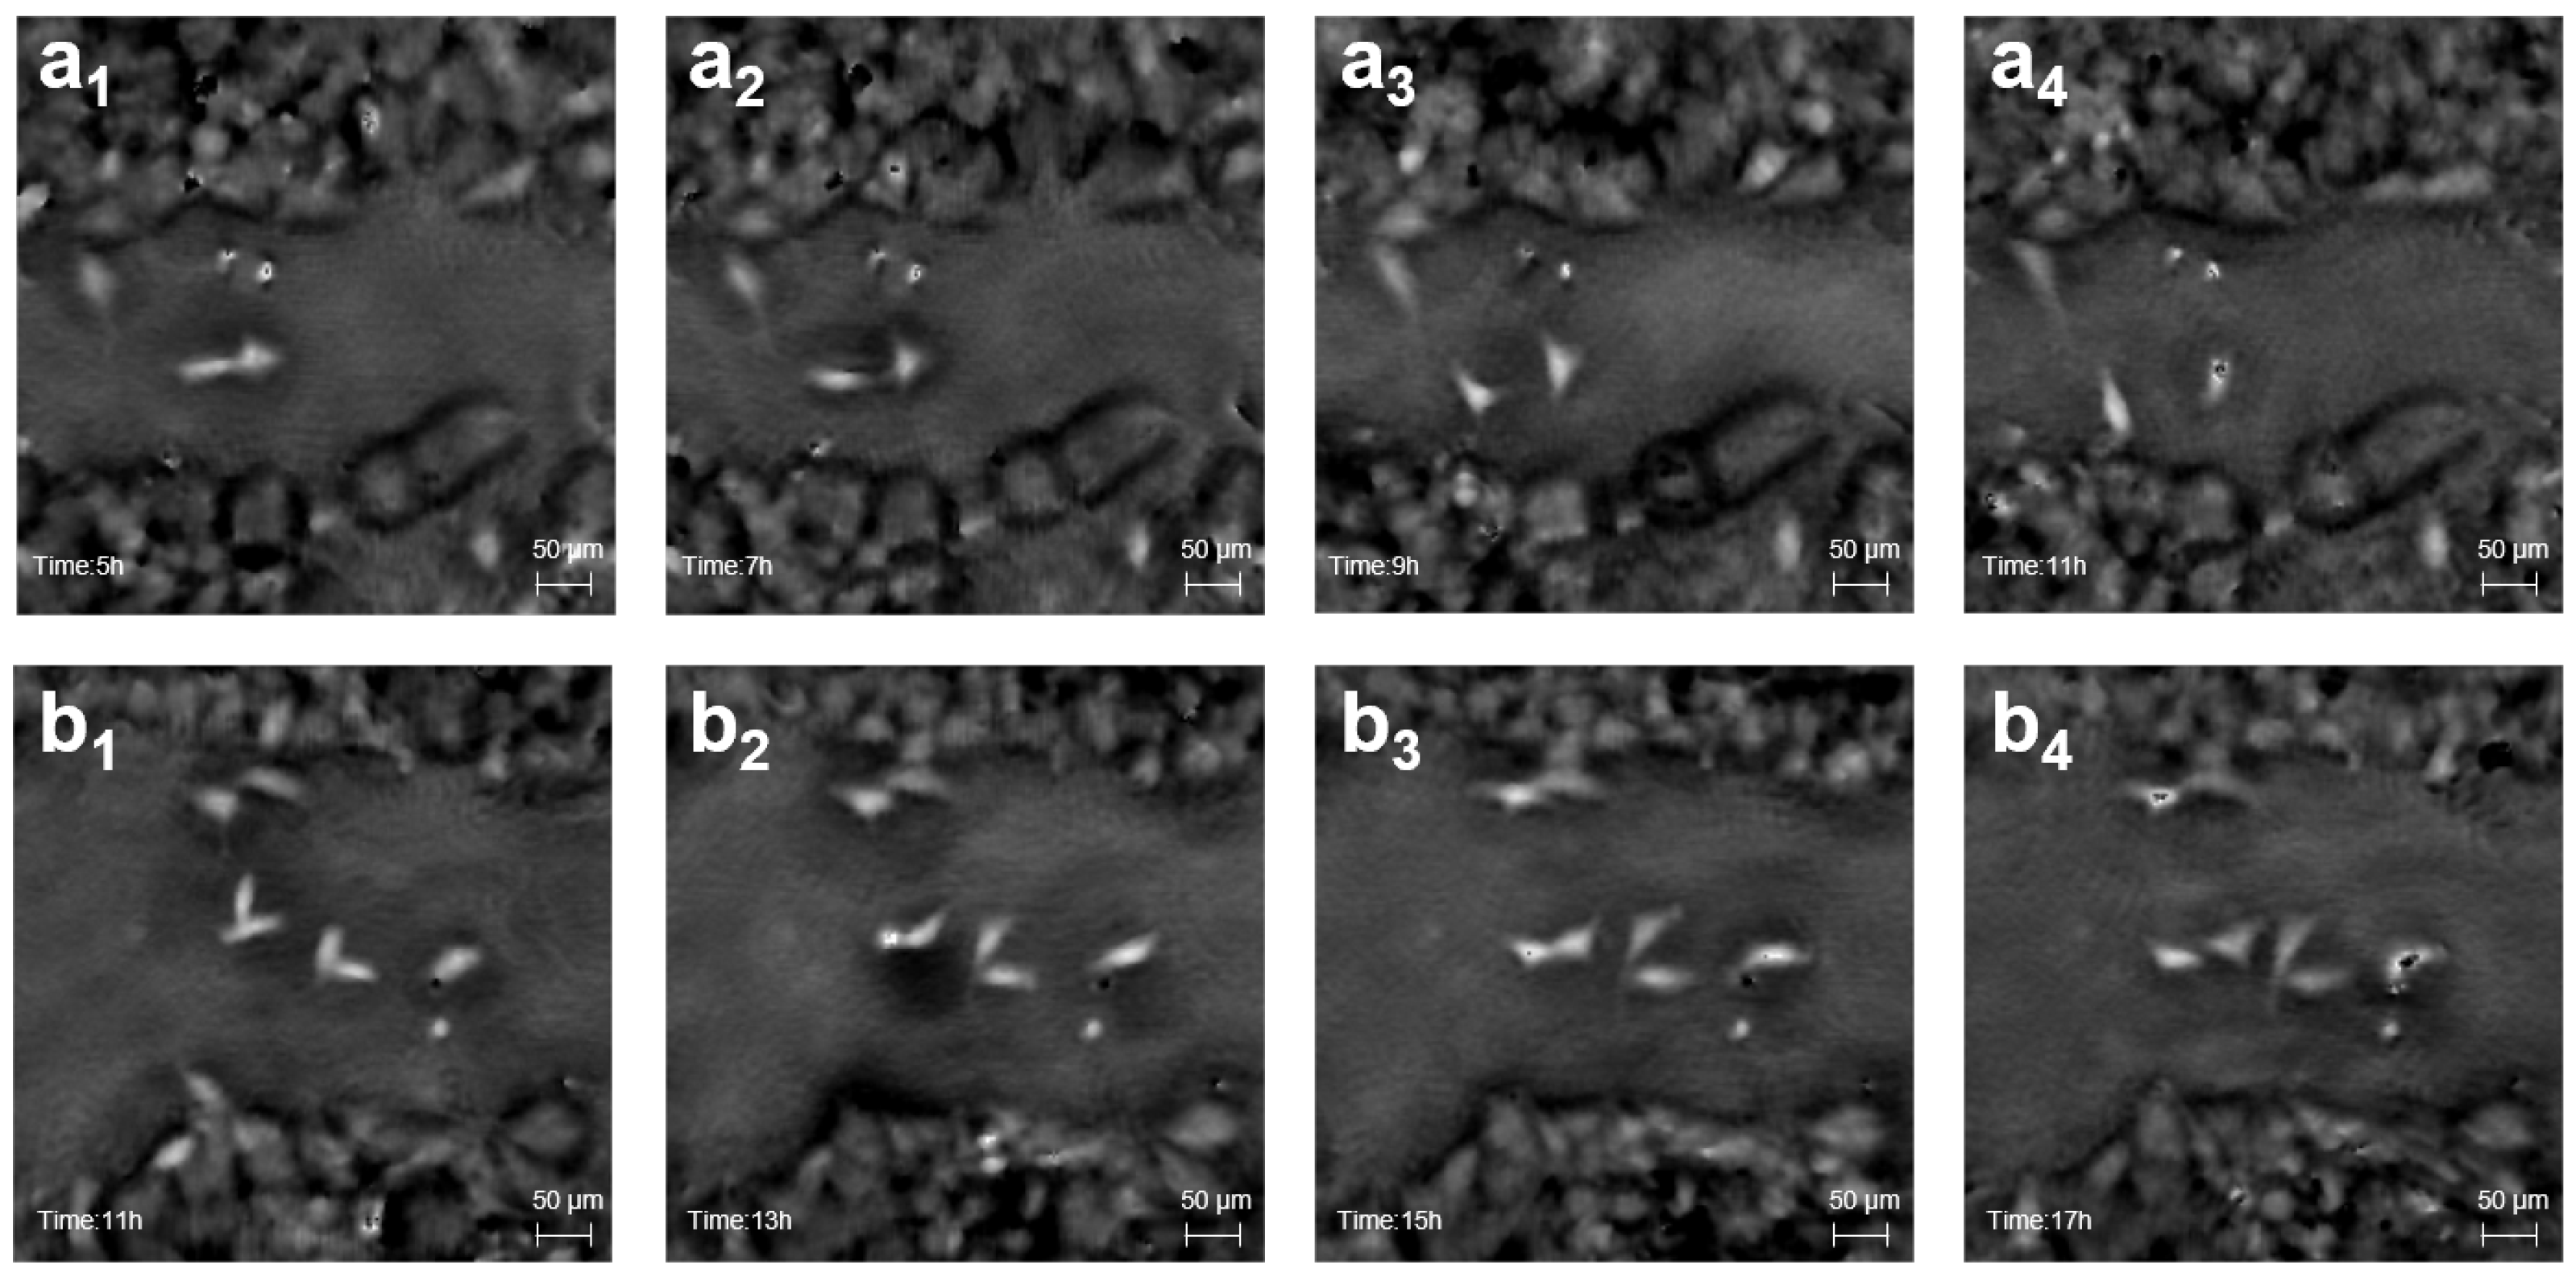
To validate the system’s capability for long-term monitoring, we performed continuous dynamic imaging of live HeLa cells across a large FOV of 7.4 mm × 5.5 mm. To further challenge the hardware adaptability of our iOPDF algorithm, this experiment utilized a different CMOS sensor with a larger pixel pitch (1.85 µm), providing nearly three times the pixel area of the 1.1 µm sensor used in static imaging. Despite the significantly reduced sampling density, our algorithm successfully recovered clear cellular dynamic processes from this data, as demonstrated in Figure 6 and Supplementary Video S1.
Figure 6.
Dynamic monitoring of live HeLa cells by the iOPDF system. (a1–a4,b1–b4) Reconstructed OPD sequences from two different fields of view with a 2-h capture interval between each frame. The sequence clearly records cell migration and morphological changes. This experiment was performed using a 1.85 µm pixel pitch sensor.
Figure 6 presents the reconstructed OPD image sequence of two representative regions over a 14-h period (with a 2-h interval between frames). From the figure, the dynamic behavior of the cells, including cell migration, morphological contraction and extension, and cell proliferation (mitosis) (e.g., in Figure 6(a1–a4)), can be clearly observed. Despite the use of a lower-resolution sensor, the OPD image in Figure 6c still clearly delineates the cell contours and general density distribution, with background artifacts being effectively suppressed. This series of results collectively demonstrates that the iOPDF algorithm is not only capable of high-resolution imaging under ideal static conditions but also possesses sufficient robustness to adapt to different hardware configurations and be successfully applied to live-cell dynamic monitoring, which demands high temporal resolution and system stability.
While the quantitative fidelity of the OPD maps produced by our system has been established in previous sections using standard targets, the dynamic results presented here primarily serve to demonstrate the system’s long-term stability and hardware-agnostic robustness. A more exhaustive quantitative investigation into the biological dynamics (e.g., statistical analysis of cell migration and proliferation kinetics) is beyond the scope of this methodological study and will be the focus of our future work.
4. Discussion
4.1. Summary of Achievements and Analysis
The iOPDF algorithm achieves reliable, high-fidelity phase retrieval by combining accurate geometric estimation, dynamic multi-channel registration, and OPD-domain adaptive fusion. In real experiments, the system achieves a spatial resolution of 1.23 µm (Figure 3b–d), surpassing the Nyquist–Shannon sampling limit of the image sensor. Furthermore, the method successfully produces high-contrast, label-free quantitative phase images of complex biological specimens, including HeLa cells (Figure 4) and unstained kidney tissue slices (Figure 5). It also supports long-term monitoring of live-cell dynamics (Figure 6), demonstrating strong robustness to hardware variability and environmental perturbations. A significant contributor to this robustness is the system’s inherent resistance to sample-stage tilt. By combining a precision-machined fixed mounting structure with the dynamic multi-channel registration module (Section 2.5), the iOPDF framework effectively identifies and compensates for sub-pixel lateral shifts or minor geometric distortions induced by residual non-parallelism. This synergy between hardware stability and algorithmic correction ensures high-fidelity reconstruction even across a large 7.4 mm × 5.5 mm FOV without requiring active tilt-stage adjustment. This gap likely arises from physical factors not fully modeled in simulation, such as partial LED coherence, CMOS sensor readout noise, and weak system aberrations introduced by sample substrates or illumination inhomogeneity. In this work, we validated the proposed static iOPDF framework through rigorous simulations and experiments. The consistency between the theoretical model and experimental outcomes (e.g., the matching OPD values in Figure 3g) confirms the accuracy of the algorithm. Furthermore, the successful reconstruction of both static tissue slices and dynamic live cells demonstrates the system’s versatility and robustness against environmental perturbations. While the experimental results align well with simulations, a moderate discrepancy in residual noise levels persists (e.g., 8.6 nm experimental vs. ideal simulation), likely arising from unmodeled physical factors such as partial LED coherence and sensor readout noise.
4.2. Comparison with Related Technologies
Compared with traditional scanning-based computational microscopy techniques, such as ptychography, the principal advantage of our system lies in its acquisition speed and mechanical stability. Conventional ptychography typically requires hundreds of overlapping diffraction measurements acquired through mechanical translation of either the sample or the illumination probe [33]. This process increases system complexity, prolongs acquisition time, and introduces sensitivity to mechanical vibrations. In contrast, our static approach requires only four exposures, completing multi-wavelength acquisition within seconds. This high temporal resolution enables applications such as live-cell dynamic monitoring (Figure 6), which are challenging for conventional scanning methods. Relative to other multi-wavelength lensless imaging approaches, the proposed method exhibits superior robustness and quantitative accuracy. Many existing methods suffer from severe artifacts caused by phase inconsistencies () and inter-wavelength misregistration [34,35]. As demonstrated in our ablation study, traditional complex-field averaging introduces strong background artifacts and yields limited quantitative accuracy (93.2%; 484.4 nm measured vs. 520 nm theoretical). In contrast, our OPD-domain adaptive fusion strategy (Figure 3f) eliminates these inconsistencies and achieves > 95% quantitative accuracy (517.7 nm measured). These results highlight the necessity and superiority of performing fusion in the physically consistent OPD domain.
4.3. Limitations and Future Outlook
While our current architecture is robust against typical mechanical tilts, for future applications involving highly non-planar or curved substrates, the iOPDF framework can be further extended by implementing a tile-wise local autofocusing strategy. This would involve estimating a spatially varying distance map to provide more granular geometric compensation across extreme topological variations. Future improvements will focus on two major directions. The first is computational optimization. By implementing the iOPDF algorithm on GPU-based parallel architectures, near real-time reconstruction can be achieved, further enabling high-speed dynamic imaging. The second direction concerns functional expansion. Inspired by Fourier ptychographic microscopy [36], the static multi-wavelength LED array can be extended to a hybrid multi-angle and multi-wavelength illumination design. Combined with the iOPDF framework, such a system could potentially support high-throughput three-dimensional diffraction tomography, offering volumetric quantitative phase information with minimal hardware complexity.
5. Conclusions
In this work, we have presented a scanning-free computational microscopy framework enabled by a simple static multi-wavelength LED illumination system. Building on this compact hardware design, we developed the iOPDF algorithm, which addresses two long-standing challenges in multi-wavelength lensless imaging: robust geometric parameter estimation and wavelength-dependent phase inconsistencies. The proposed A-WMAF module provides reliable and accurate determination of the optimal propagation distance, while the dynamic registration and OPD-domain adaptive fusion strategies effectively suppress artifacts arising from misalignment and the intrinsic scaling across wavelengths. Through extensive numerical simulations and real experiments, we demonstrated that the iOPDF method achieves high-fidelity quantitative phase imaging (SSIM of 0.9942) and a spatial resolution of 1.23 µm, surpassing the physical sampling limit of the image sensor. The method was successfully applied to complex biological specimens, including fixed cells and unstained tissue slices, and was further validated in long-term live-cell monitoring experiments, highlighting its robustness under both high-resolution and dynamic-imaging conditions. Overall, this combination of minimalist hardware and a physically grounded, robust computational algorithm provides a powerful, low-cost, and high-throughput solution for quantitative phase imaging. We anticipate that the proposed approach will be broadly useful in biomedical research, drug screening, and clinical diagnostics, and serves as a promising foundation for future developments such as multi-angle multi-wavelength illumination and high-throughput 3D diffraction tomography.
Supplementary Materials
The following supporting information can be downloaded at https://www.mdpi.com/article/10.3390/photonics13030213/s1, Video S1: Dynamic monitoring of live HeLa cells.
Author Contributions
Conceptualization, J.W. and P.S.; Methodology, J.W. and Y.L. (Yining Li); Software, J.W., Y.L. (Yining Li) and Y.L. (Yuheng Luo); Validation, J.W.; Formal analysis, J.W. and Y.L. (Yuheng Luo); Investigation, J.W.; Data curation, J.W. and Y.L. (Yining Li); Writing—original draft preparation, J.W.; Writing—review and editing, J.W., P.S. and Q.X.; Visualization, J.W.; Supervision, P.S., L.P. and Q.X.; Funding acquisition, P.S., and Q.X. All authors have read and agreed to the published version of the manuscript.
Funding
This research was funded by the Guangzhou National Laboratory (Grant No. GZNL2024A01029) and the National Natural Science Foundation of China (Grant No. 62505056).
Institutional Review Board Statement
Ethical review and approval were not required according to institutional guidelines because this study used a standard commercial cell line (HeLa) and commercially purchased mouse kidney tissue sections, without involving new animal experiments or human participants.
Informed Consent Statement
Not applicable.
Data Availability Statement
The data presented in this study are available from the corresponding author upon reasonable request.
Acknowledgments
The authors thank the School of Physics at Nankai University and the Guangzhou National Laboratory for technical support.
Conflicts of Interest
The authors declare no conflicts of interest. The funders had no role in the design of the study; in the collection, analyses, or interpretation of data; in the writing of the manuscript; or in the decision to publish the results.
Abbreviations
The following abbreviations are used in this manuscript:
| AO | Adaptive Optics |
| A-WMAF | Adaptive-Weighted Multi-wavelength Autofocus |
| CMOS | Complementary Metal-Oxide-Semiconductor |
| DMEM | Dulbecco’s Modified Eagle Medium |
| FOV | Field of View |
| FPM | Fourier Ptychographic Microscopy |
| iOPDF | Iterative Optical-Path-Difference Fusion |
| LOCM | Lensless On-Chip Microscopy |
| LED | Light-Emitting Diode |
| NA | Numerical Aperture |
| OPD | Optical Path Difference |
| PSR | Pixel Super-Resolution |
| RMSE | Root-Mean-Square Error |
| SSIM | Structural Similarity Index Measure |
| SNR | Signal-to-Noise Ratio |
| USAF | United States Air Force |
References
- Davidson, M.W.; Abramowitz, M. Optical microscopy. Encycl. Imaging Sci. Technol. 2002, 2, 120. [Google Scholar] [CrossRef] [Scilit]
- Webb, R.H. Confocal optical microscopy. Rep. Prog. Phys. 1996, 59, 427. [Google Scholar] [CrossRef] [Scilit]
- Park, J.; Brady, D.J.; Zheng, G.; Tian, L.; Gao, L. Review of bio-optical imaging systems with a high space-bandwidth product. Adv. Photonics 2021, 3, 044001. [Google Scholar] [CrossRef] [Scilit]
- Lohmann, A.W.; Dorsch, R.G.; Mendlovic, D.; Zalevsky, Z.; Ferreira, C. Space–bandwidth product of optical signals and systems. J. Opt. Soc. Am. A 1996, 13, 470–473. [Google Scholar] [CrossRef] [Scilit]
- Wollman, R.; Stuurman, N. High throughput microscopy: From raw images to discoveries. J. Cell Sci. 2007, 120, 3715–3722. [Google Scholar] [CrossRef] [Scilit]
- Chen, D.; Wang, L.; Luo, X.; Xie, H.; Chen, X. Resolution and Contrast Enhancement for Lensless Digital Holographic Microscopy and Its Application in Biomedicine. Photonics 2022, 9, 358. [Google Scholar] [CrossRef] [Scilit]
- Ozcan, A.; McLeod, E. Lensless Imaging and Sensing. Annu. Rev. Biomed. Eng. 2016, 18, 77–102. [Google Scholar] [CrossRef] [Scilit] [PubMed]
- Stockbridge, C.; Lu, Y.; Moore, J.; Hoffman, S.; Paxman, R.; Toussaint, K.; Bifano, T. Focusing through dynamic scattering media. Opt. Express 2012, 20, 15086–15092. [Google Scholar] [CrossRef] [Scilit]
- Samarkin, V.; Alexandrov, A.; Galaktionov, I.; Kudryashov, A.; Nikitin, A.; Rukosuev, A.; Toporovsky, V.; Sheldakova, J. Wide-Aperture Bimorph Deformable Mirror for Beam Focusing in 4.2 PW Ti:Sa Laser. Appl. Sci. 2022, 12, 1144. [Google Scholar] [CrossRef] [Scilit]
- Pfeiffer, N.; Chapman, G.H.; Kaminska, B. Optical imaging of structures within highly scattering material using an incoherent beam and a spatial filter. In Proceedings of the Optical Interactions with Tissues and Cells XXI, San Francisco, CA, USA, 25–27 January 2010; Jansen, E.D., Thomas, R.J., Eds.; International Society for Optics and Photonics, SPIE: Bellingham, WA, USA, 2010; Volume 7562, p. 756208. [Google Scholar]
- Bian, L.; Suo, J.; Dai, Q.; Chen, F. Fourier ptychography for high space-bandwidth product microscopy. Adv. Opt. Technol. 2017, 6, 449–457. [Google Scholar] [CrossRef] [Scilit]
- Konda, P.C.; Loetgering, L.; Zhou, K.C.; Xu, S.; Harvey, A.R.; Horstmeyer, R. Fourier ptychography: Current applications and future promises. Opt. Express 2020, 28, 9603–9630. [Google Scholar] [CrossRef] [Scilit]
- Wu, Y.; Ozcan, A. Lensless digital holographic microscopy and its applications in biomedicine and environmental monitoring. Methods 2018, 136, 4–16. [Google Scholar] [CrossRef] [Scilit]
- Wang, T.; Jiang, S.; Song, P.; Wang, R.; Yang, L.; Zhang, T.; Zheng, G. Optical ptychography for biomedical imaging: Recent progress and future directions [Invited]. Biomed. Opt. Express 2023, 14, 489–532. [Google Scholar] [CrossRef] [Scilit]
- McLeod, E.; Luo, W.; Mudanyali, O.; Greenbaum, A.; Ozcan, A. Toward giga-pixel nanoscopy on a chip: A computational wide-field look at the nano-scale without the use of lenses. Lab Chip 2013, 13, 2028–2035. [Google Scholar] [CrossRef] [Scilit]
- Boominathan, V.; Robinson, J.T.; Waller, L.; Veeraraghavan, A. Recent advances in lensless imaging. Optica 2022, 9, 1–16. [Google Scholar] [CrossRef] [Scilit] [PubMed]
- Astratov, V.N.; Sahel, Y.B.; Eldar, Y.C.; Huang, L.; Ozcan, A.; Zheludev, N.; Zhao, J.; Burns, Z.; Liu, Z.; Narimanov, E.; et al. Roadmap on Label-Free Super-Resolution Imaging. Laser Photonics Rev. 2023, 17, 2200029. [Google Scholar] [CrossRef] [Scilit] [PubMed]
- Zheng, G.; Shen, C.; Jiang, S.; Song, P.; Yang, C. Concept, Implementations and Applications of Fourier Ptychography. Nat. Rev. Phys. 2021, 3, 207–223. [Google Scholar] [CrossRef] [Scilit]
- Gao, P.; Yuan, C. Resolution enhancement of digital holographic microscopy via synthetic aperture: A review. Light. Adv. Manuf. 2022, 3, 105. [Google Scholar] [CrossRef] [Scilit]
- Guo, C.; Ma, H.; Ding, J.; Shao, X.; Peng, S. Spatially coded wavelength-scanning lensless on-chip microscopy for pixel-super-resolved quantitative phase imaging. Opt. Lett. 2025, 50, 2767–2770. [Google Scholar] [CrossRef] [Scilit] [PubMed]
- Jiang, S.; Guo, C.; Song, P.; Zhou, N.; Bian, Z.; Zhu, J.; Wang, R.; Dong, P.; Zhang, Z.; Liao, J.; et al. Resolution-Enhanced Parallel Coded Ptychography for High-Throughput Optical Imaging. ACS Photonics 2021, 8, 3261–3271. [Google Scholar] [CrossRef] [Scilit]
- Jiang, S.; Guo, C.; Bian, Z.; Wang, R.; Zhu, J.; Song, P.; Hu, P.; Hu, D.; Zhang, Z.; Hoshino, K.; et al. Ptychographic sensor for large-scale lensless microbial monitoring with high spatiotemporal resolution. Biosens. Bioelectron. 2022, 196, 113699. [Google Scholar] [CrossRef] [Scilit]
- Sun, J.; Zuo, C.; Zhang, L.; Chen, Q. Resolution-Enhanced Fourier Ptychographic Microscopy Based on High-Numerical-Aperture Illuminations. Sci. Rep. 2017, 7, 1187. [Google Scholar] [CrossRef] [Scilit]
- Zheng, G.; Horstmeyer, R.; Yang, C. Wide-Field, High-Resolution Fourier Ptychographic Microscopy. Nat. Photonics 2013, 7, 739–745. [Google Scholar] [CrossRef] [Scilit]
- Song, P.; Wang, R.; Zhu, J.; Wang, T.; Bian, Z.; Zhang, Z.; Hoshino, K.; Murphy, M.; Jiang, S.; Guo, C.; et al. Super-resolved multispectral lensless microscopy via angle-tilted, wavelength-multiplexed ptychographic modulation. Opt. Lett. 2020, 45, 3486–3489. [Google Scholar] [CrossRef] [Scilit] [PubMed]
- Zhou, Y.; Wu, J.; Suo, J.; Han, X.; Zheng, G.; Dai, Q. Single-shot lensless imaging via simultaneous multi-angle LED illumination. Opt. Express 2018, 26, 21418–21432. [Google Scholar] [CrossRef] [Scilit] [PubMed]
- Zuo, C.; Sun, J.; Zhang, J.; Hu, Y.; Chen, Q. Lensless phase microscopy and diffraction tomography with multi-angle and multi-wavelength illuminations using a LED matrix. Opt. Express 2015, 23, 14314–14328. [Google Scholar] [CrossRef] [Scilit] [PubMed]
- Liu, J.; Zhao, Y.; Guo, C.; Zhao, W.; Zhang, Y.; Guo, C.; Li, H. Robust autofocusing method for multi-wavelength lensless imaging. Opt. Express 2019, 27, 23814–23829. [Google Scholar] [CrossRef] [Scilit]
- Li, Z.; Zhou, X.; Gao, S.; Wang, Y.; Huang, G.; Qiao, Z.; Li, Y.; Liu, S.; Liu, Z. High-fidelity pixel-super-resolved lensless on-chip microscopy via height scanning and synthetic aperture. Opt. Lett. 2025, 50, 3257–3260. [Google Scholar] [CrossRef] [Scilit]
- Gerchberg, R.W. A practical algorithm for the determination of phase from image and diffraction plane pictures. Optik 1972, 35, 237–246. [Google Scholar]
- Foroosh, H.; Zerubia, J.; Berthod, M. Extension of phase correlation to subpixel registration. IEEE Trans. Image Process. 2002, 11, 188–200. [Google Scholar] [CrossRef] [Scilit]
- Fienup, J.R. Phase retrieval algorithms: A personal tour. Appl. Opt. 2013, 52, 45–56. [Google Scholar] [CrossRef] [Scilit] [PubMed]
- Rodenburg, J. Ptychography and Related Diffractive Imaging Methods. Adv. Imaging Electron Phys. 2008, 150, 87–184. [Google Scholar] [CrossRef] [Scilit]
- Ferraro, P.; Miccio, L.; Grilli, S.; Paturzo, M.; De Nicola, S.; Finizio, A.; Osellame, R.; Laporta, P. Quantitative Phase Microscopy of microstructures with extended measurement range and correction of chromatic aberrations by multiwavelength digital holography. Opt. Express 2007, 15, 14591–14600. [Google Scholar] [CrossRef] [Scilit] [PubMed]
- Liu, Y.; Liu, Q.; Li, Y.; Xu, B.; Zhang, J.; He, Z. High-resolution multi-wavelength lensless diffraction imaging with adaptive dispersion correction. Opt. Express 2021, 29, 7197–7209. [Google Scholar] [CrossRef] [Scilit]
- Pan, A.; Zuo, C.; Yao, B. High-resolution and large field-of-view Fourier ptychographic microscopy and its applications in biomedicine. Rep. Prog. Phys. 2020, 83, 096101. [Google Scholar] [CrossRef] [Scilit]
Disclaimer/Publisher’s Note: The statements, opinions and data contained in all publications are solely those of the individual author(s) and contributor(s) and not of MDPI and/or the editor(s). MDPI and/or the editor(s) disclaim responsibility for any injury to people or property resulting from any ideas, methods, instructions or products referred to in the content. |
© 2026 by the authors. Licensee MDPI, Basel, Switzerland. This article is an open access article distributed under the terms and conditions of the Creative Commons Attribution (CC BY) license.