


Abstract
The attosecond (10−18 s) light pulse represents the fastest time scale currently mastered by the scientific community, which enables the observation of electron dynamics within atoms and molecules, offering powerful tools to probe chemical reaction mechanisms and advance research in photovoltaic materials and biological processes. In this work, we investigate the generation of visible attosecond optical pulses via spectral broadening in Hollow-Core Fiber (HCF), followed by coherent recombination using a Three-Channel Light Field Synthesizer (TCLFS). The influence of the input pulse duration on Group Delay Dispersion (GDD), Third-Order Dispersion (TOD), and spectral broadening is systematically analyzed. Furthermore, the effects of GDD, TOD, and the carrier–envelope phase (CEP) on waveform synthesis are quantitatively examined for the first time. These findings provide valuable insights into dispersion management strategies essential for developing high-quality visible attosecond light sources, paving the way for future applications in ultrafast spectroscopy and light field-driven electron dynamics.
1. Introduction
Attosecond science has revolutionized our ability to probe and control electron dynamics in matter [1]. The generation and application of attosecond pulses in the visible regime are even more critical for investigating valence electron dynamics in fields such as photosynthesis and solar energy technologies [2]. For instance, understanding and optimizing processes such as charge transfer in photovoltaic materials or energy capture and conversion in photosynthetic systems requires tools capable of resolving electron dynamics on their native time scales—femtoseconds to attoseconds—and at visible wavelengths where these processes predominantly occur [3]. However, widely used attosecond sources based on high-harmonic generation (HHG) typically operate in the extreme ultraviolet (XUV) or soft X-ray regimes. While these sources are ideal for probing deeply bound electrons, they are less suitable for directly tracking valence electron dynamics, which are often initiated or probed by visible light [4].
In recent decades, significant progress has been made in few-cycle ultrafast pulse control techniques [5]. 1983, Froehly et al. first proposed the Fourier synthesis method (4f optical structure), a classical pulse shaping technique that splits the input pulse into three spectral bands with a beam splitter and then recombines them using a low-dispersion optical system to achieve a precise modulation of the dispersion of each spectral component [6]. Optical elements such as high-reflection silver mirrors, broadband complementary chirped mirrors, and multi-pass reflection mirrors are widely used for pulse modulation. This method not only enables the precise manipulation of the time-domain profile of pulses but also has greatly facilitated the study of ultrafast dynamics in atomic, molecular, condensed-matter, and fluid systems.
Several approaches have been developed to address this need for visible wavelength attosecond pulses. Among them, gas-filled Hollow-Core Fiber (HCF) technology represents a mature post-compression technique, yielding optical pulses with an exceptionally high beam quality. This method has seen extensive application in the 800 nm and mid-infrared spectral regions. For instance, Anderson et al. utilized a krypton-filled Hollow-Core Fiber to compress an 800 nm pulse to 5.7 fs [7], while Wang et al. employed a similar approach to compress 4 μm pulses to 21.5 fs [8]. Through nonlinear optical processes such as Self-Phase Modulation (SPM) and Self-Steepening Effects (SS) [9], gas-filled HCFs can significantly broaden the infrared pulse spectrum into the visible and even UV range.
When combined with spatial light modulators (SLMs), HCF-based systems allow a precise and dynamic control of the amplitude, phase, and polarization of the broadband laser pulses, enabling the generation of tailored visible attosecond optical pulses. Furthermore, multi-channel optical synthesis techniques, in which the broadband spectrum is divided and recombined with controlled relative phases, enable the generation of sub-cycle optical waveforms. More recently, HCF-based soliton self-compression has emerged as a powerful technique, leveraging nonlinear dynamics in gas-filled HCFs to directly compress input laser pulses to durations as short as 350 attoseconds, spanning from the deep ultraviolet to the near-infrared [10,11]. These advancements signify a shift towards more compact and potentially more efficient sources of visible attosecond pulses.
Although, the soliton self-compression regime is a rapidly advancing technique capable of generating sub-cycle pulses, the conventional HCF spectral-broadening approach is particularly advantageous for multi-channel light field synthesis, as it allows the broadened spectrum to be divided into multiple spectral bands that can be independently phase- and delay-controlled before recombination. This enables the deterministic construction and tuning of the optical waveform, which is essential for applications requiring tailored light field profiles. The primary objective of this work is to establish a quantitative dispersion-tolerance framework specifically for synthesis-based attosecond waveform generation.
Despite the significant developments in this approach, a critical barrier persists: a lack of comprehensive and quantitative understanding of how nonlinear propagation conditions in gas-filled HCFs influence higher-order dispersion and thus the synthesized waveform quality. Specifically, the role of higher-order dispersion (particularly Group Delay Dispersion (GDD) and Third-Order Dispersion (TOD)) and carrier-envelope phase (CEP) stability in these systems is not yet fully quantified. GDD and TOD significantly affect the time-domain characteristics. Moreover, the CEP is crucial for attosecond pulses, as it determines the precise light field waveform under the pulse envelope and significantly influences light field-driven dynamics. Although both passive and active stabilization techniques have been demonstrated, their effectiveness in the context of HCF-generated visible pulses, especially against perturbations and accumulated material dispersion, requires deeper investigation. The absence of a quantitative framework linking input pulse conditions, nonlinear spectral broadening, higher-order dispersion, and CEP stability currently limits the reliable generation of high-fidelity, intense visible attosecond pulses for groundbreaking experiments.
In this work, we address this critical gap by presenting a systematic numerical investigation of the effects of GDD, TOD, and CEP stability on the generation of visible attosecond pulses via gas-filled HCF combined with TCLFS. We analyze the physical origins of GDD and TOD introduced during HCF propagation and reconstruct the resulting time-domain waveforms through multi-channel synthesis. Furthermore, we examine how input pulse duration and CEP stability influence the output pulse characteristics, revealing the intrinsic connection between input conditions and compression efficiency. By quantifying the tolerances and requirements for these key parameters, this study provides essential insights for developing robust and high-quality visible attosecond sources. This foundational work is a necessary step towards unlocking the full potential of attosecond science in studying valence electron dynamics, with profound implications for fields ranging from materials science and photochemistry to renewable energy research.
2. Theoretical Model
To model pulse propagation through a HCF, we employ the Generalized Nonlinear Schrödinger Equation (GNLSE) [12]:
where z is the distance the pulse travels in the fiber, is the amount of time that elapses with the pulse moving at the group velocity , the amount of time in the frame of reference degree, is the pulse time-domain amplitude, and is the loss factor of the medium [13]:
where is the core radius and is the ratio of the refractive indices of the outer (fused silica) and inner (gaseous) media of the HCF. represents the kth order dispersion of the medium, represents the nonlinear coefficient of the medium, where is the nonlinear refractive index, and is a constant depending on the type of gas. is the effective area of the fiber core.
The left-hand side of Equation (1) describes the dispersion effects during pulse transmission, including the loss (second term) and the dispersion of each order (third term). The right side of Equation (1) describes the nonlinear effects in pulse transmission, including SPM (first term) and SS effects (second term). Equation (1) is a nonlinear partial differential equation, which in general cannot be solved analytically in an effective way and can only be solved using numerical methods. Commonly used numerical methods include the finite difference method in the frequency domain, which takes the Fourier transform of Equation (1) into the frequency domain to get
where the linear operator can be written as . For a given , it acts directly in the frequency domain with no approximation. The time-domain waveform of the pulse initially coupled into the HCF is assumed to be Gaussian, of the form , where is the full width half maximum (FWHM) of the time-domain pulse intensity, is the peak power of the pulse, and is the pulse energy. When the pulse is transmitted in the HCF, using the Clausius–Mossotti equation, the refractive index of an inner gas filled in a hollow-core optical fiber varies with pressure p and temperature T as follows:
where is the vacuum dielectric constant, is the ideal gas constant, is Avogadro’s constant, and is the molecular polarization of the noble gas:
where and are the temperature and pressure under standard conditions, respectively, and is the refractive index of the corresponding state. The propagation constant of the impulse in the HCF can be found from .
In our simulation, the pulse behavior is assessed at each stage—broadening in the HCF and recombination in the synthesizer. We focus on quantifying the effects of GDD, TOD, and CEP on the output pulse duration of both its envelope and transient field structure. Furthermore, we consider how different input pulse durations affect the output pulse, as the pulse compression efficiency is highly correlated with the input conditions. In our simulation, the evolution of the input pulse duration is all assumed to be from normal dispersion, not anomalous dispersion, such that self-compression or optical soliton in HCF is not included.
Please note that in this paper there are two kinds of pulse durations when we talk about the synthesized output pulse: the pulse duration of the pulse envelope and the pulse duration of the transient field structure. We use “field pulse duration” for the transient field to explicitly distinguish between these two definitions.
3. Isolated Attosecond Visible Pulse Generation Configuration
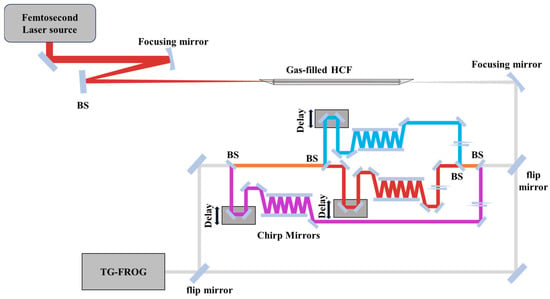
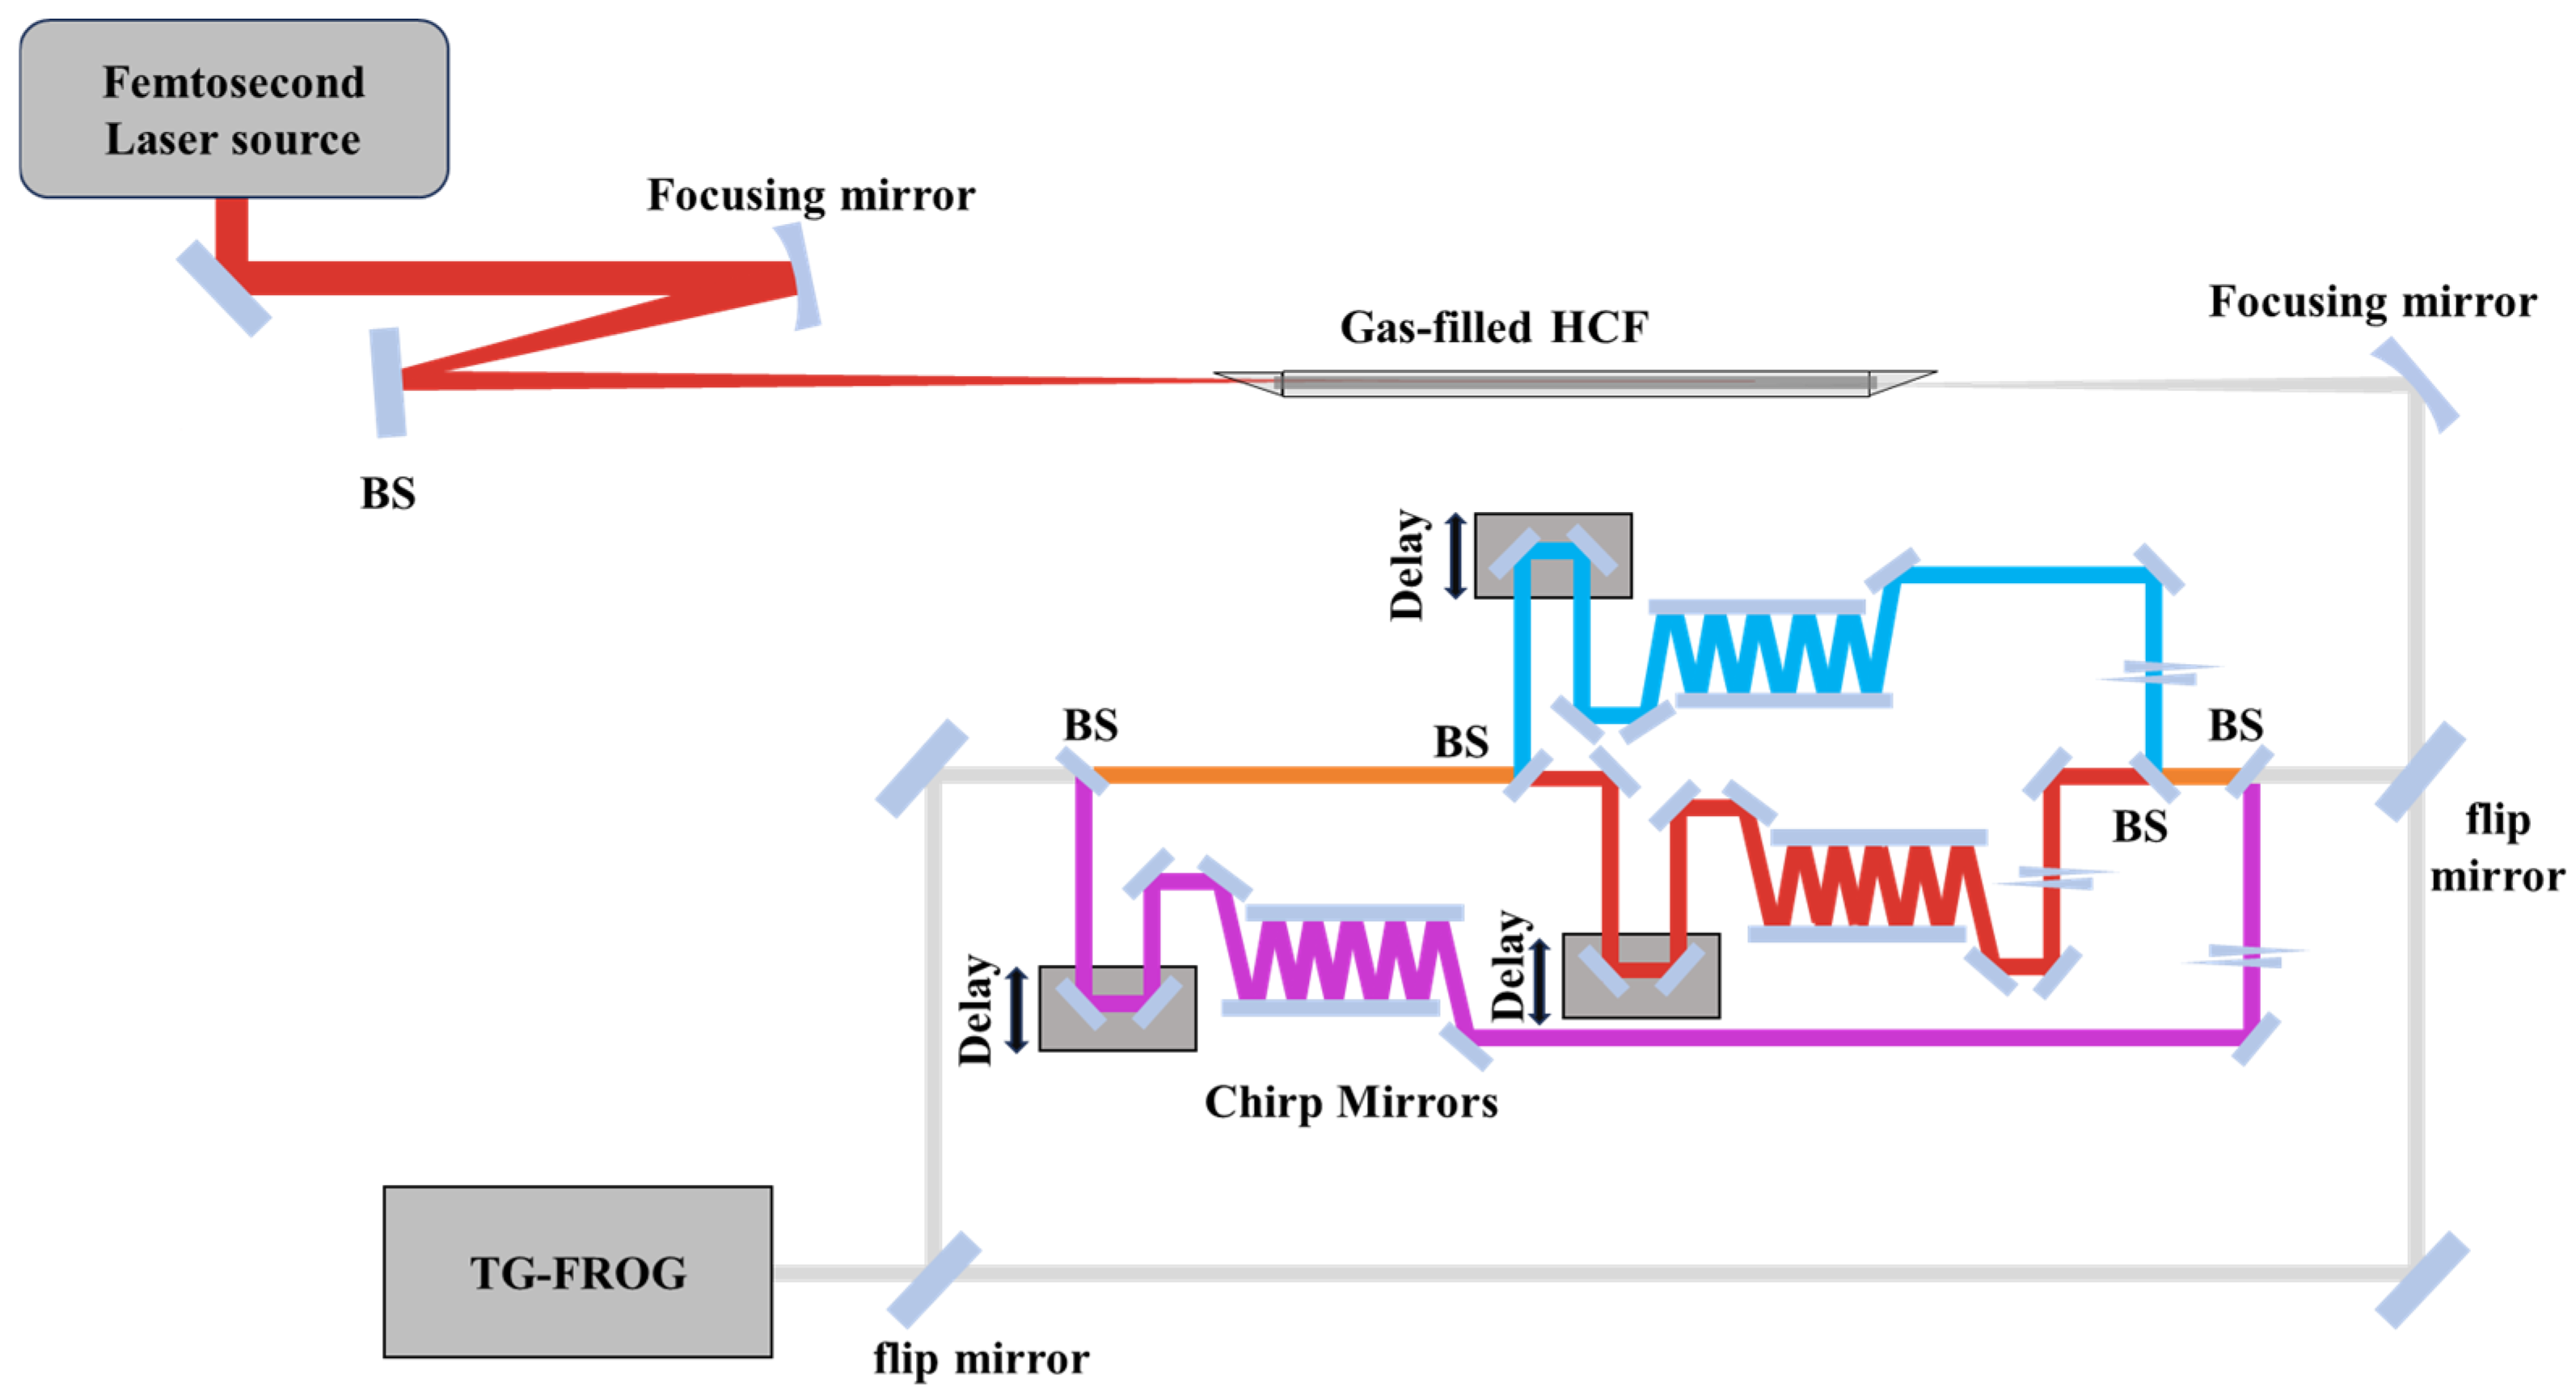
Figure 1 depicts a typical schematic of Attosecond Visible Pulse Generation via gas-filled Hollow-Core Fiber and a Light Field Synthesizer. The simulation in the paper is all based on this configuration. It integrates a gas-filled HCF for pulse broadening and a Three-Channel Light Field Synthesizer (TCLFS) for generating attosecond visible pulses. In the first stage, an ultrashort femtosecond laser pulse is coupled with a Hollow-Core Fiber (HCF) using a concave mirror. The HCF, usually around 1 m long, filled with a kind of noble gas (helium or neon), is enclosed in a pressure-tight cell terminated with fused silica windows oriented at the Brewster angle to minimize reflection losses.
Figure 1.
Schematic of Attosecond Visible Pulse Generation via gas-filled Hollow-Core Fiber and Three-Channel Light Field Synthesizer used in the simulation.
Spectral broadening via Self-Phase Modulation (SPM) could yield a supercontinuum white light (typically in the experiment, the transmission efficiency can be >50% with good coupling). The broadened spectrum is then directed to the TCLFS, where three spectral channels are created using dichroic beam splitters (DBSs) optimized for minimal Group Delay Dispersion. Each channel spans ~0.5 octaves: (i) ChNIR (near-infrared, 700–1100 nm), (ii) Chvis (visible, 450–700 nm), and (iii) Chvis–UV (visible–ultraviolet, 300–450 nm). Pulse compression within each channel is achieved using negatively chirped mirror pairs designed to compensate GDD across the respective bandwidths. The fine-tuning of optical path lengths is performed using motorized translation stages to ensure temporal overlap of the three channels at the output.
The recombined pulse, after the pre-compensation of GDD to the Fourier transform limit, is a coherent superposition of the phases of light waves of different frequency components, thus generating supercontinuum ultra-short pulses close to the Fourier transform limit. By precisely controlling the relative amplitude, time delay and phase of each channel, synthetic optical pulses with field pulse durations in the hundreds of attoseconds can be generated. This visible attosecond pulse provides unprecedented high-temporal-resolution observational capabilities for probing quantum processes, such as electron dynamics and ultrafast electronic transitions between atomic shells, and is of significant value for applications in ultrafast spectroscopy, attosecond science, and quantum information processing.
4. The Nonlinearity of Gas-Filled HCF
The simulation employs a laser pulse with a central wavelength of 800 nm, repetition rate of 1 kHz, and pulse energy of 3 mJ. To achieve efficient spectral broadening in a gas-filled HCF with minimal ionization losses, the peak intensity must remain below the photoionization threshold Ith of the inert gas [14]. Using Ith ≈ 1014 W/cm2 for noble gases [15], based on our laser parameters, a core radius of ≥150 μm ensures negligible ionization effects. Here, we use a core radius of 300 μm in the simulation, since a larger core radius reduces the peak optical intensity, helping maintain the pulse intensity below the ionization threshold of noble gases and thereby minimizing plasma-induced losses and phase distortions. A sufficiently large core also promotes stable fundamental-mode propagation, improving beam quality. Conversely, excessively large cores reduce nonlinear interaction strength and limit spectral broadening efficiency. The nonlinear refractive indices (n2) of helium and neon under standard conditions are 4 × 10⁻²⁵ m2/W and 7 × 10⁻²⁴ m2/W, respectively [16,17,18].
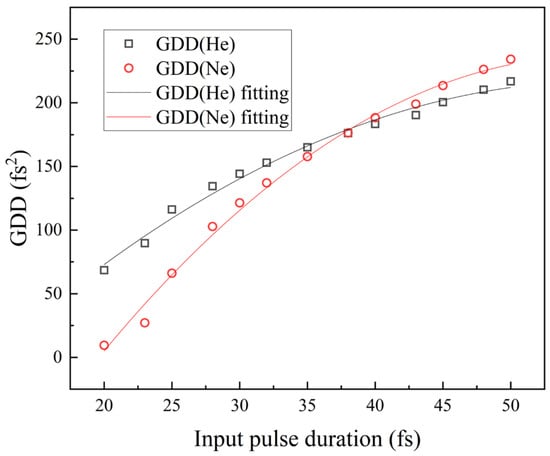
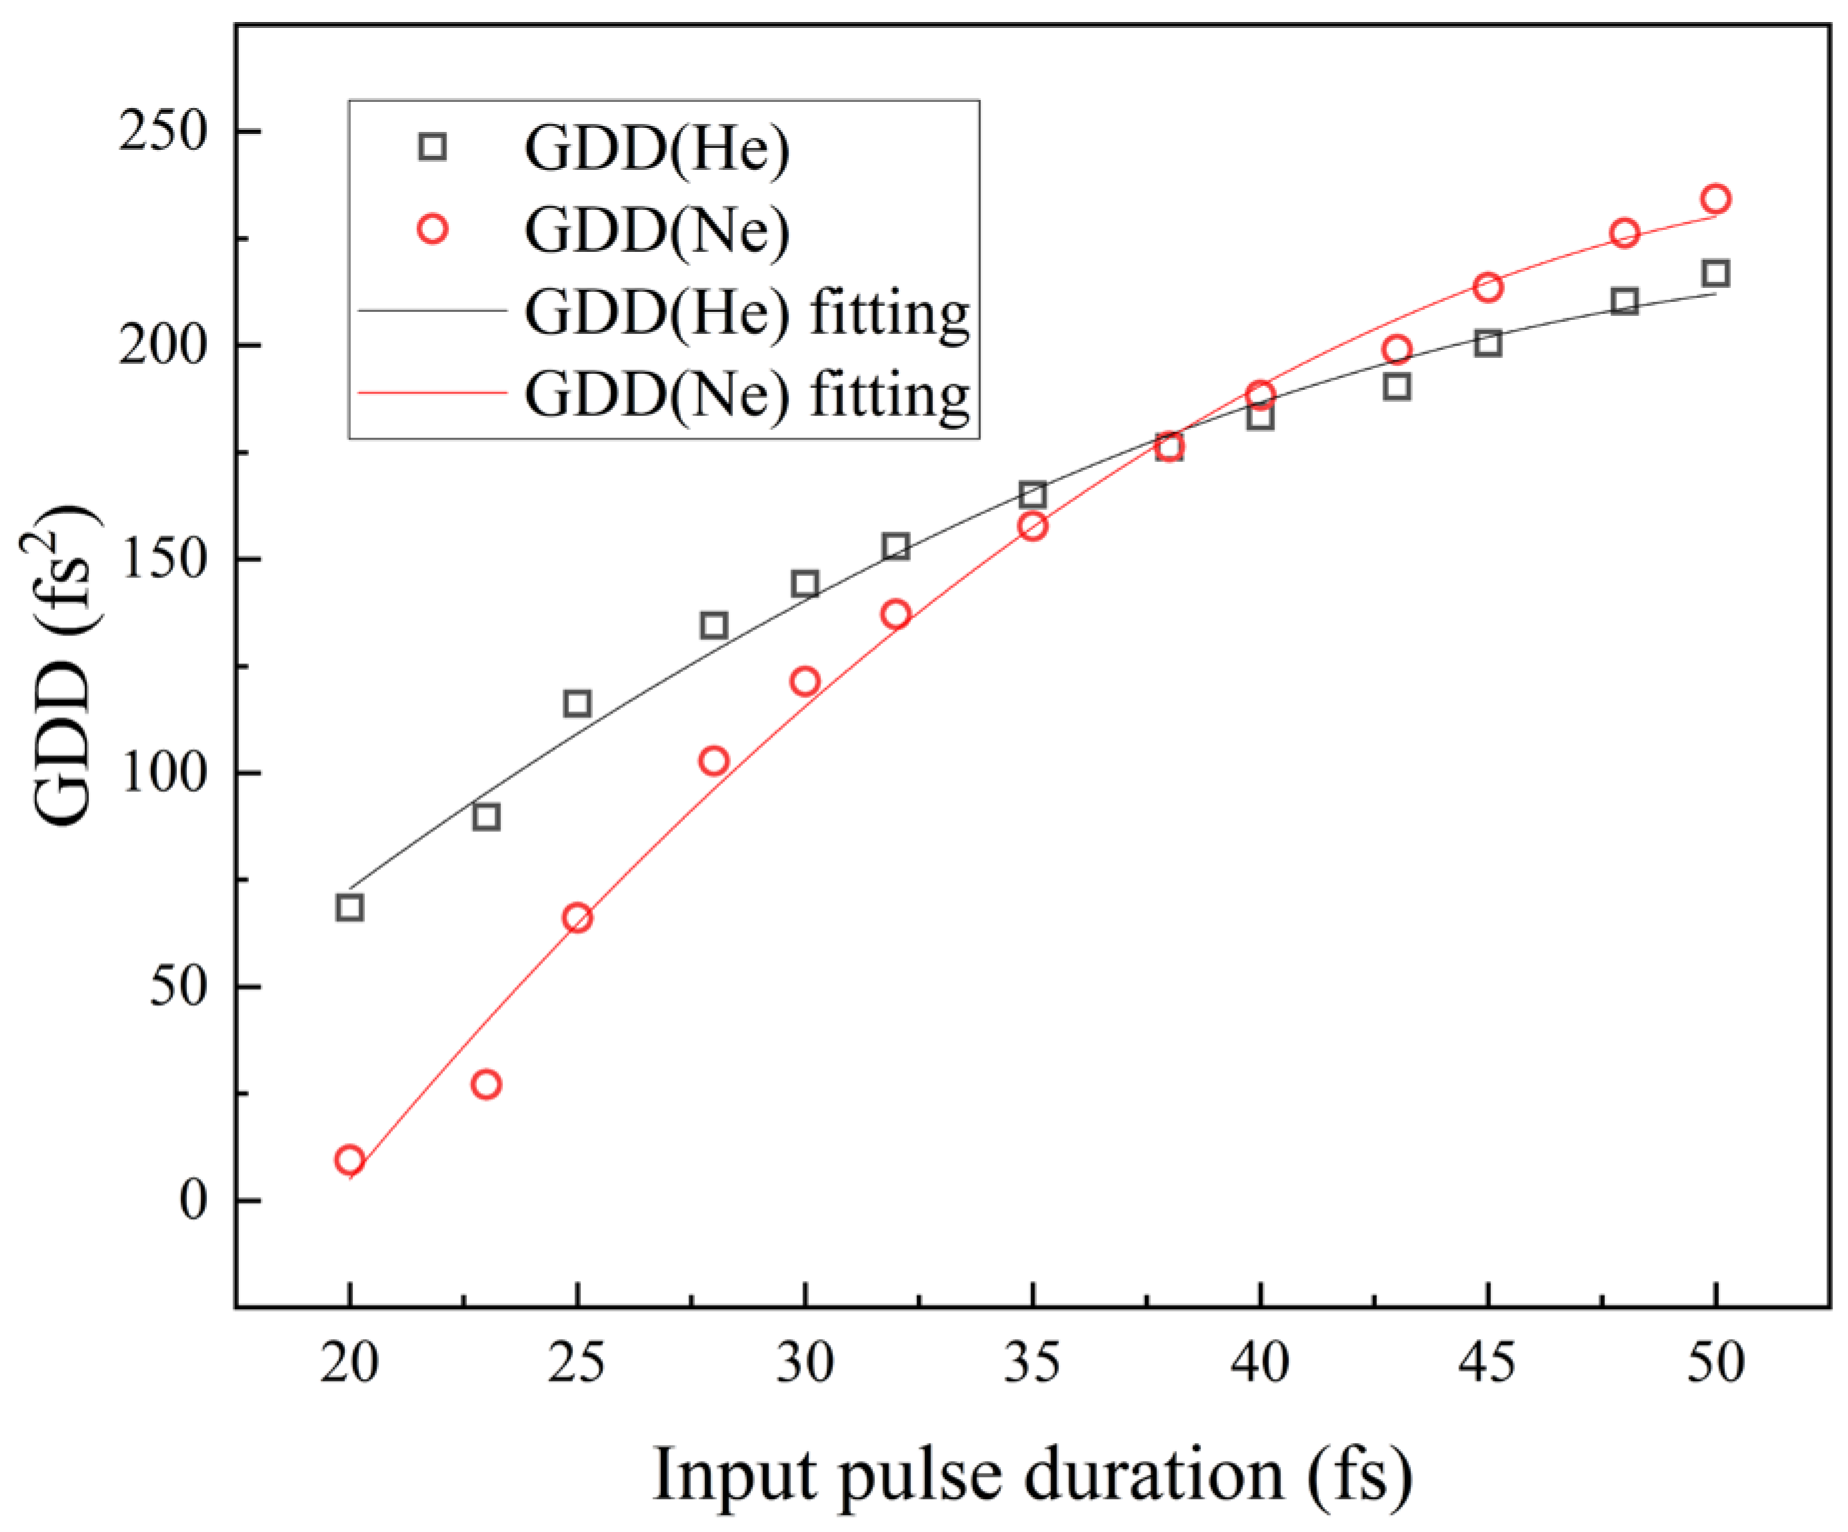
We numerically investigate the Second- and Third-Order Dispersion (GDD and TOD) characteristics of femtosecond pulses propagating through HCFs filled with different inert gases. The SPM nonlinear propagation effects induce spectral broadening, accompanied by dispersive phase accumulation. The gas pressure in the HCF is also a critical parameter governing the extent of spectral broadening. Here, a pressure of 2.2 bar is adopted, as it yields an efficient spectral broadening while maintaining a good spatial mode quality, consistent with our experimental observations using the setup schematic shown in Figure 1. Figure 2 depicts the calculated GDDs as functions of input pulse durations for helium- and neon-filled HCFs. In general, it increases with longer input pulse durations due to the reduced peak power, which weakens nonlinear phase modulation and allows linear dispersion to dominate. The GDD varies similarly for He and Ne gas, but for helium-filled HCF it is higher at the beginning, then rises slower than that with neon-filled HCF and gets smaller after 38 fs. In addition, the GDD first increases steeply, then slows down. This is because, as the input pulse duration increases (for the same energy), the peak power drops such that nonlinear phase weakens and the linear positive β2 contribution dominates, so the GDD increases slower as expected.
Figure 2.
The output Group Delay Dispersion (GDD) after broadening in helium-filled (black squares) and neon-filled (red circles) HCFs as a function of input pulse duration.
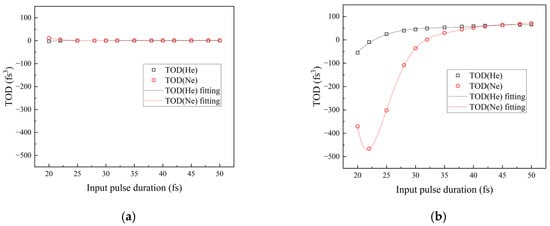
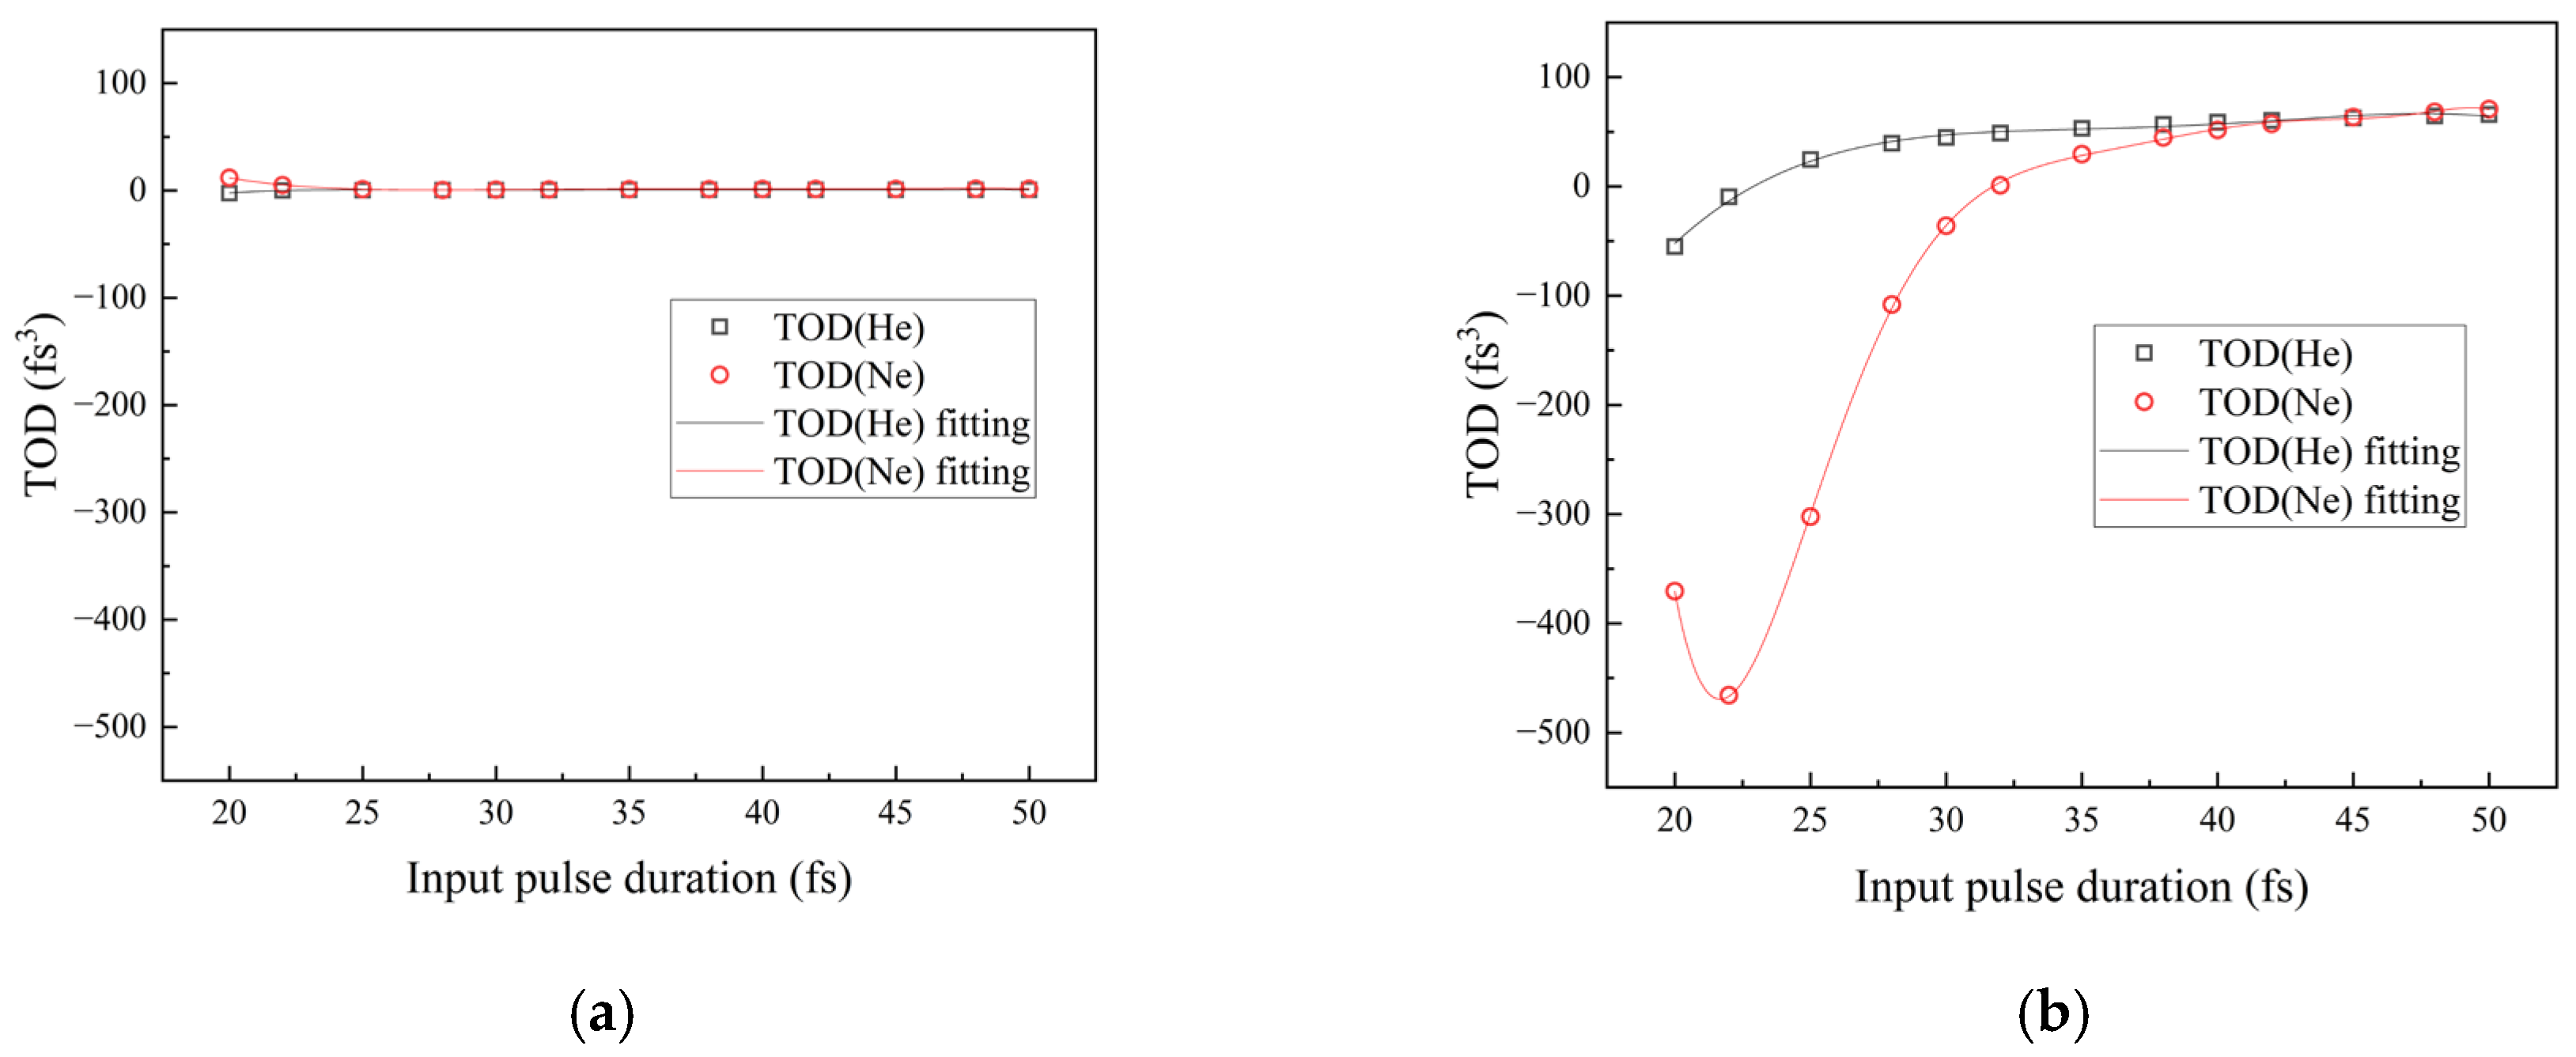
Figure 3 presents the TODs as functions of input pulse durations when SPM only is applied (Figure 3a) and when both SPM and SS are applied (Figure 3b). It clearly shows that the negative TOD mainly originates from the SS effect, which is as expected. Figure 3b shows that the TOD of He is much less than that of Ne. And the TOD of Ne rises more steeply than that with He when the input pulse is shorter (<35 fs). So, the output TOD is more sensitive to the input pulse duration when using Ne-filled HCF, especially when the pulse is shorter. The significantly smaller TOD observed for helium compared to neon originates from helium’s much weaker nonlinear response. Owing to its nearly one-order-of-magnitude lower nonlinear refractive index, helium accumulates substantially less of the nonlinear phase during HCF propagation, resulting in a reduced self-steepening-induced temporal asymmetry and hence a smaller TOD. In contrast, neon exhibits a much steeper increase in TOD for short input pulses (<35 fs), where the higher peak power strongly enhances self-steepening. This leads to pronounced asymmetric spectral broadening and a rapid buildup of negative TOD. As the input pulse duration increases, the nonlinear effects weaken and linear gas dispersion dominates, causing the TOD to approach small positive values and become less sensitive to pulse duration for both gases. The TOD will result in several side pulses—asymmetric temporal profile, which take some energy away from the pulse and affect the perfect pulse compression. An additional negative TOD can be compensated by propagation through a water cell to increase the amount of positive TOD in the pulse without influence the GDD [19].
Figure 3.
The output TOD after broadening in helium-filled (black squares) and neon-filled (red circles) HCFs as a function of input pulse duration, with SPM only (a) or SPM and SS (b).
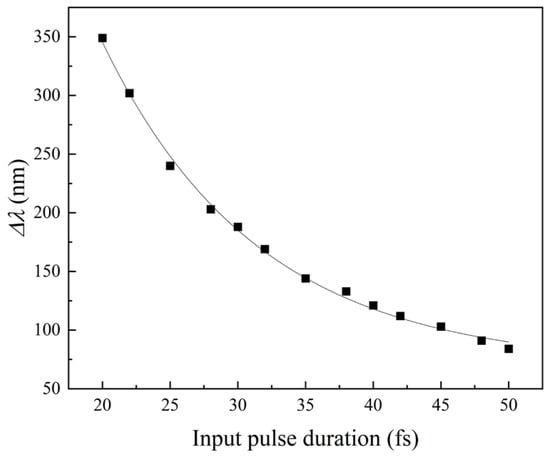
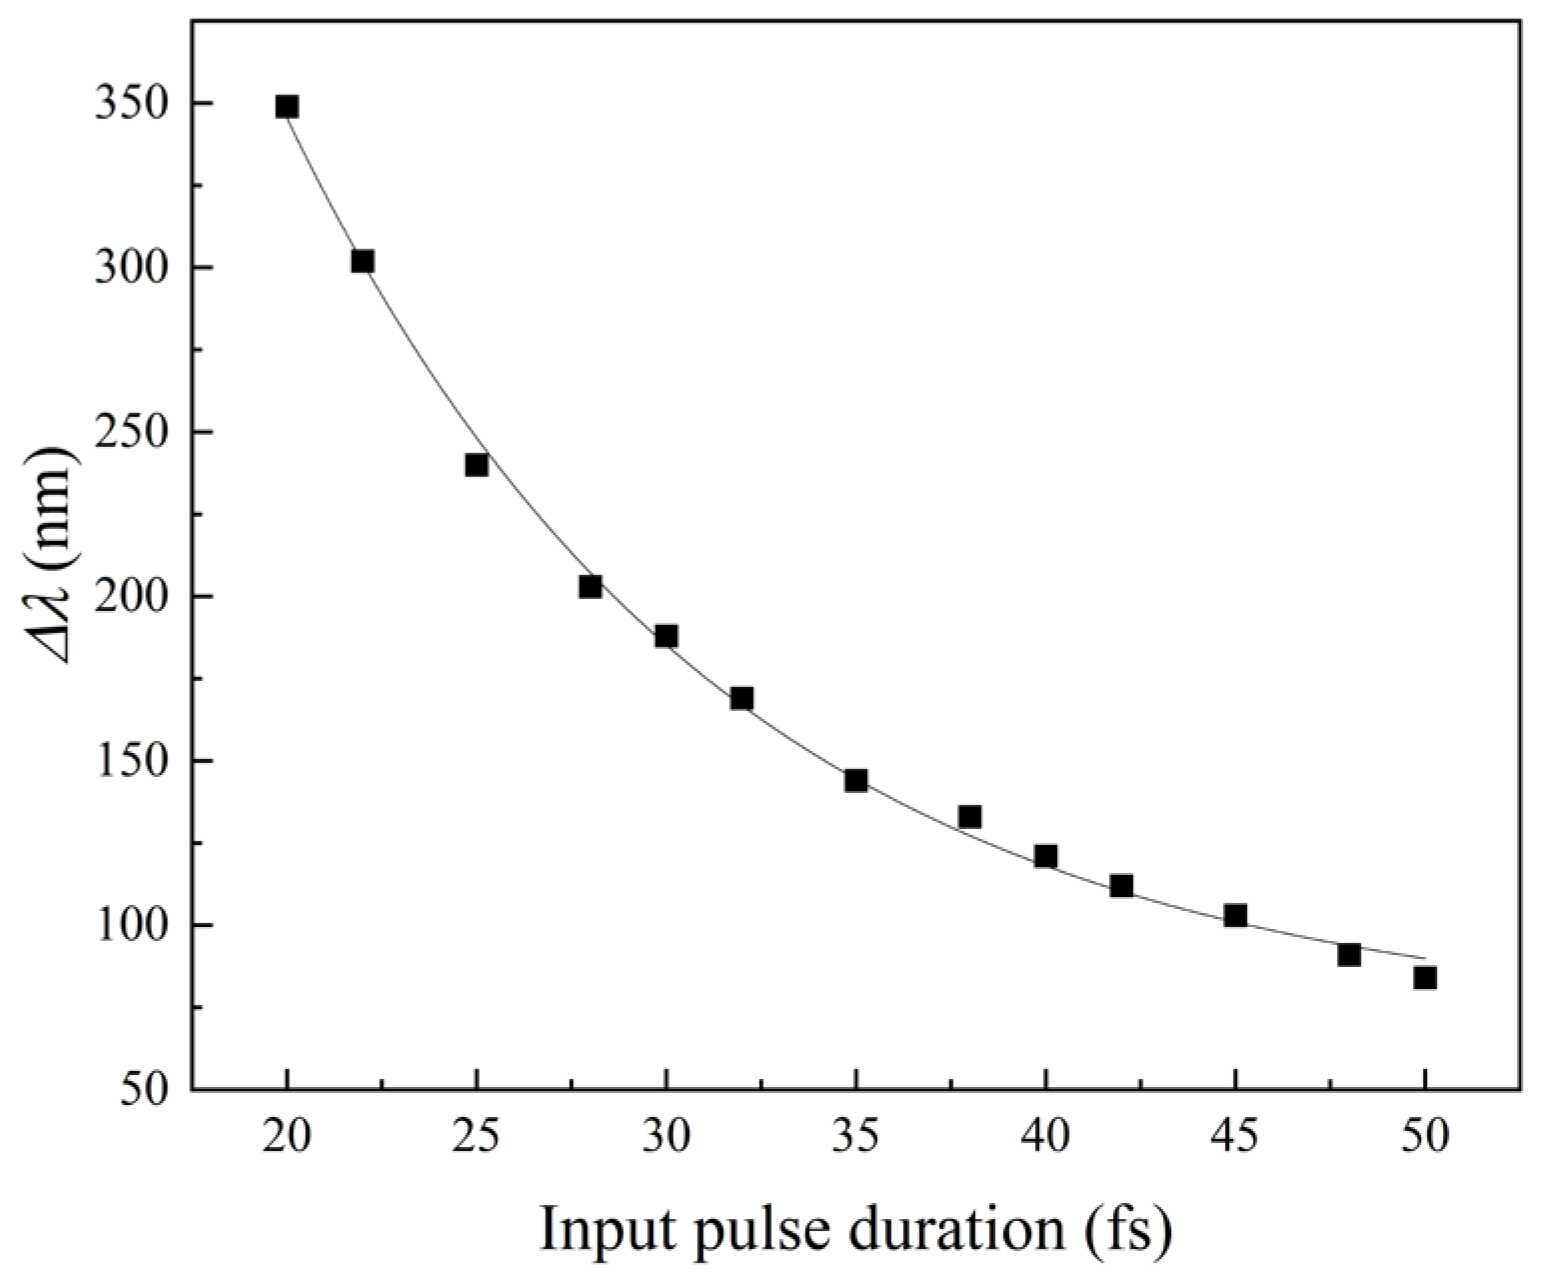
The spectral broadening in the Hollow-Core Fiber (HCF) directly determines the minimum achievable pulse duration after compression. Therefore, we investigated how the input pulse duration influences the output spectral bandwidth, as illustrated in Figure 4. The result shows that the spectral bandwidth decreases exponentially with increasing input pulse duration. The trend arises from the strong dependence of nonlinear phase accumulation on the peak power: shorter input pulses enhance the SPM and SS effect, leading to an increased spectral asymmetry and larger higher-order dispersion, whereas longer pulses experience weaker nonlinear reshaping and are increasingly governed by linear gas and waveguide dispersion.
Figure 4.
The output spectral bandwidth versus input pulse duration in helium-filled HCF. The spectral bandwidth decreases exponentially following y = Aexp(−x/t) + b, with A = 1568.3 ± 129.0, t = 11.5 ± 0.6.
5. Dispersion Effects on the Temporal Profile of Synthesized Attosecond Pulse
To generate a visible attosecond optical pulse, the broadened supercontinuum light from HCF is sent to the multi-channel optical field synthesizer, then separated into different channels. In each channel, the pulses are compressed to near their Fourier limit with negatively chirped mirror pairs to compensate for the GDDs, then the compressed pulses are coherently synthesized. A four-channel synthesizer has already been reported in [20] which can provide a neat isolated attosecond optical pulse. Here, we propose a three-channel version for its simplicity and effectiveness and compare the synthesized pulse with that of the four-channel synthesizer. Also, we thoroughly study how the high-order dispersions affect the synthesized pulse for the first time.
5.1. Light Field Synthesis Without Dispersion
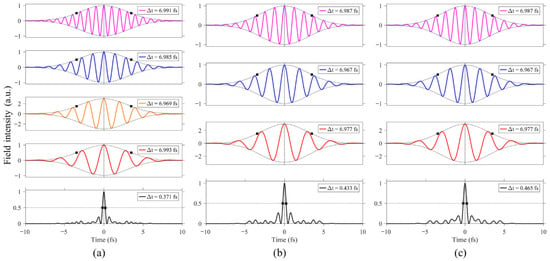
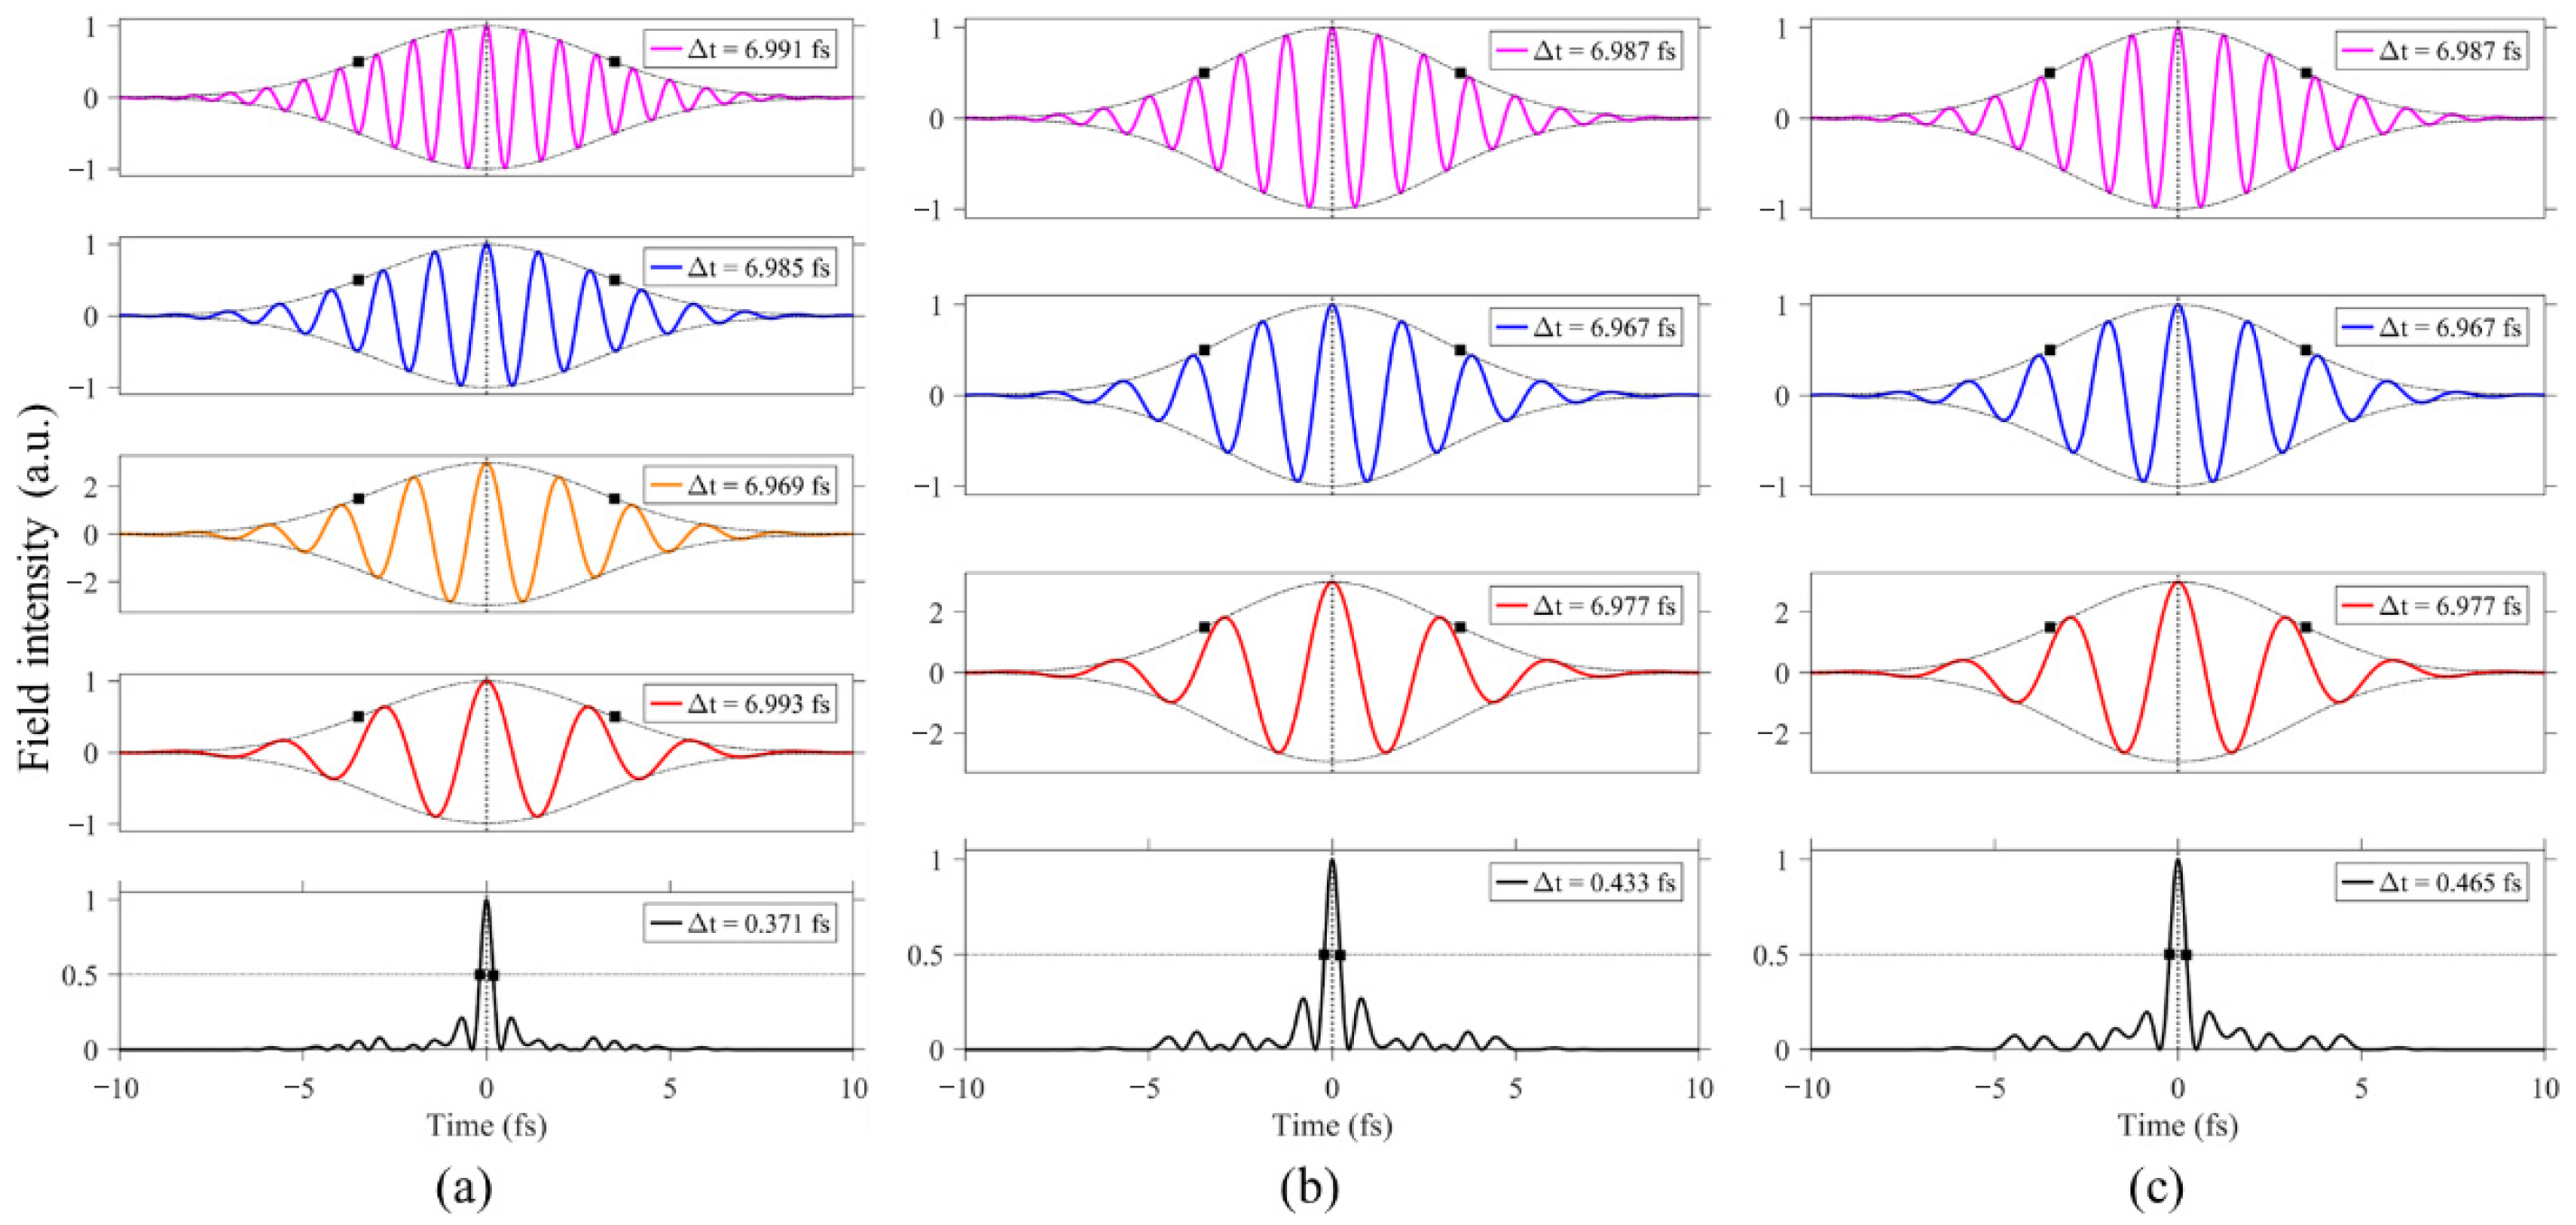
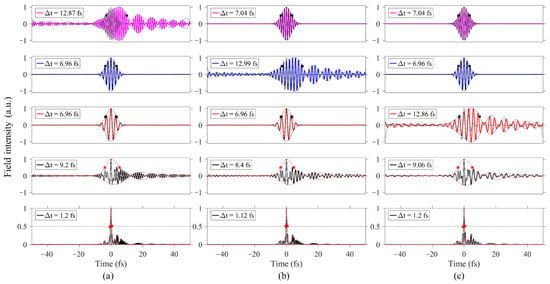
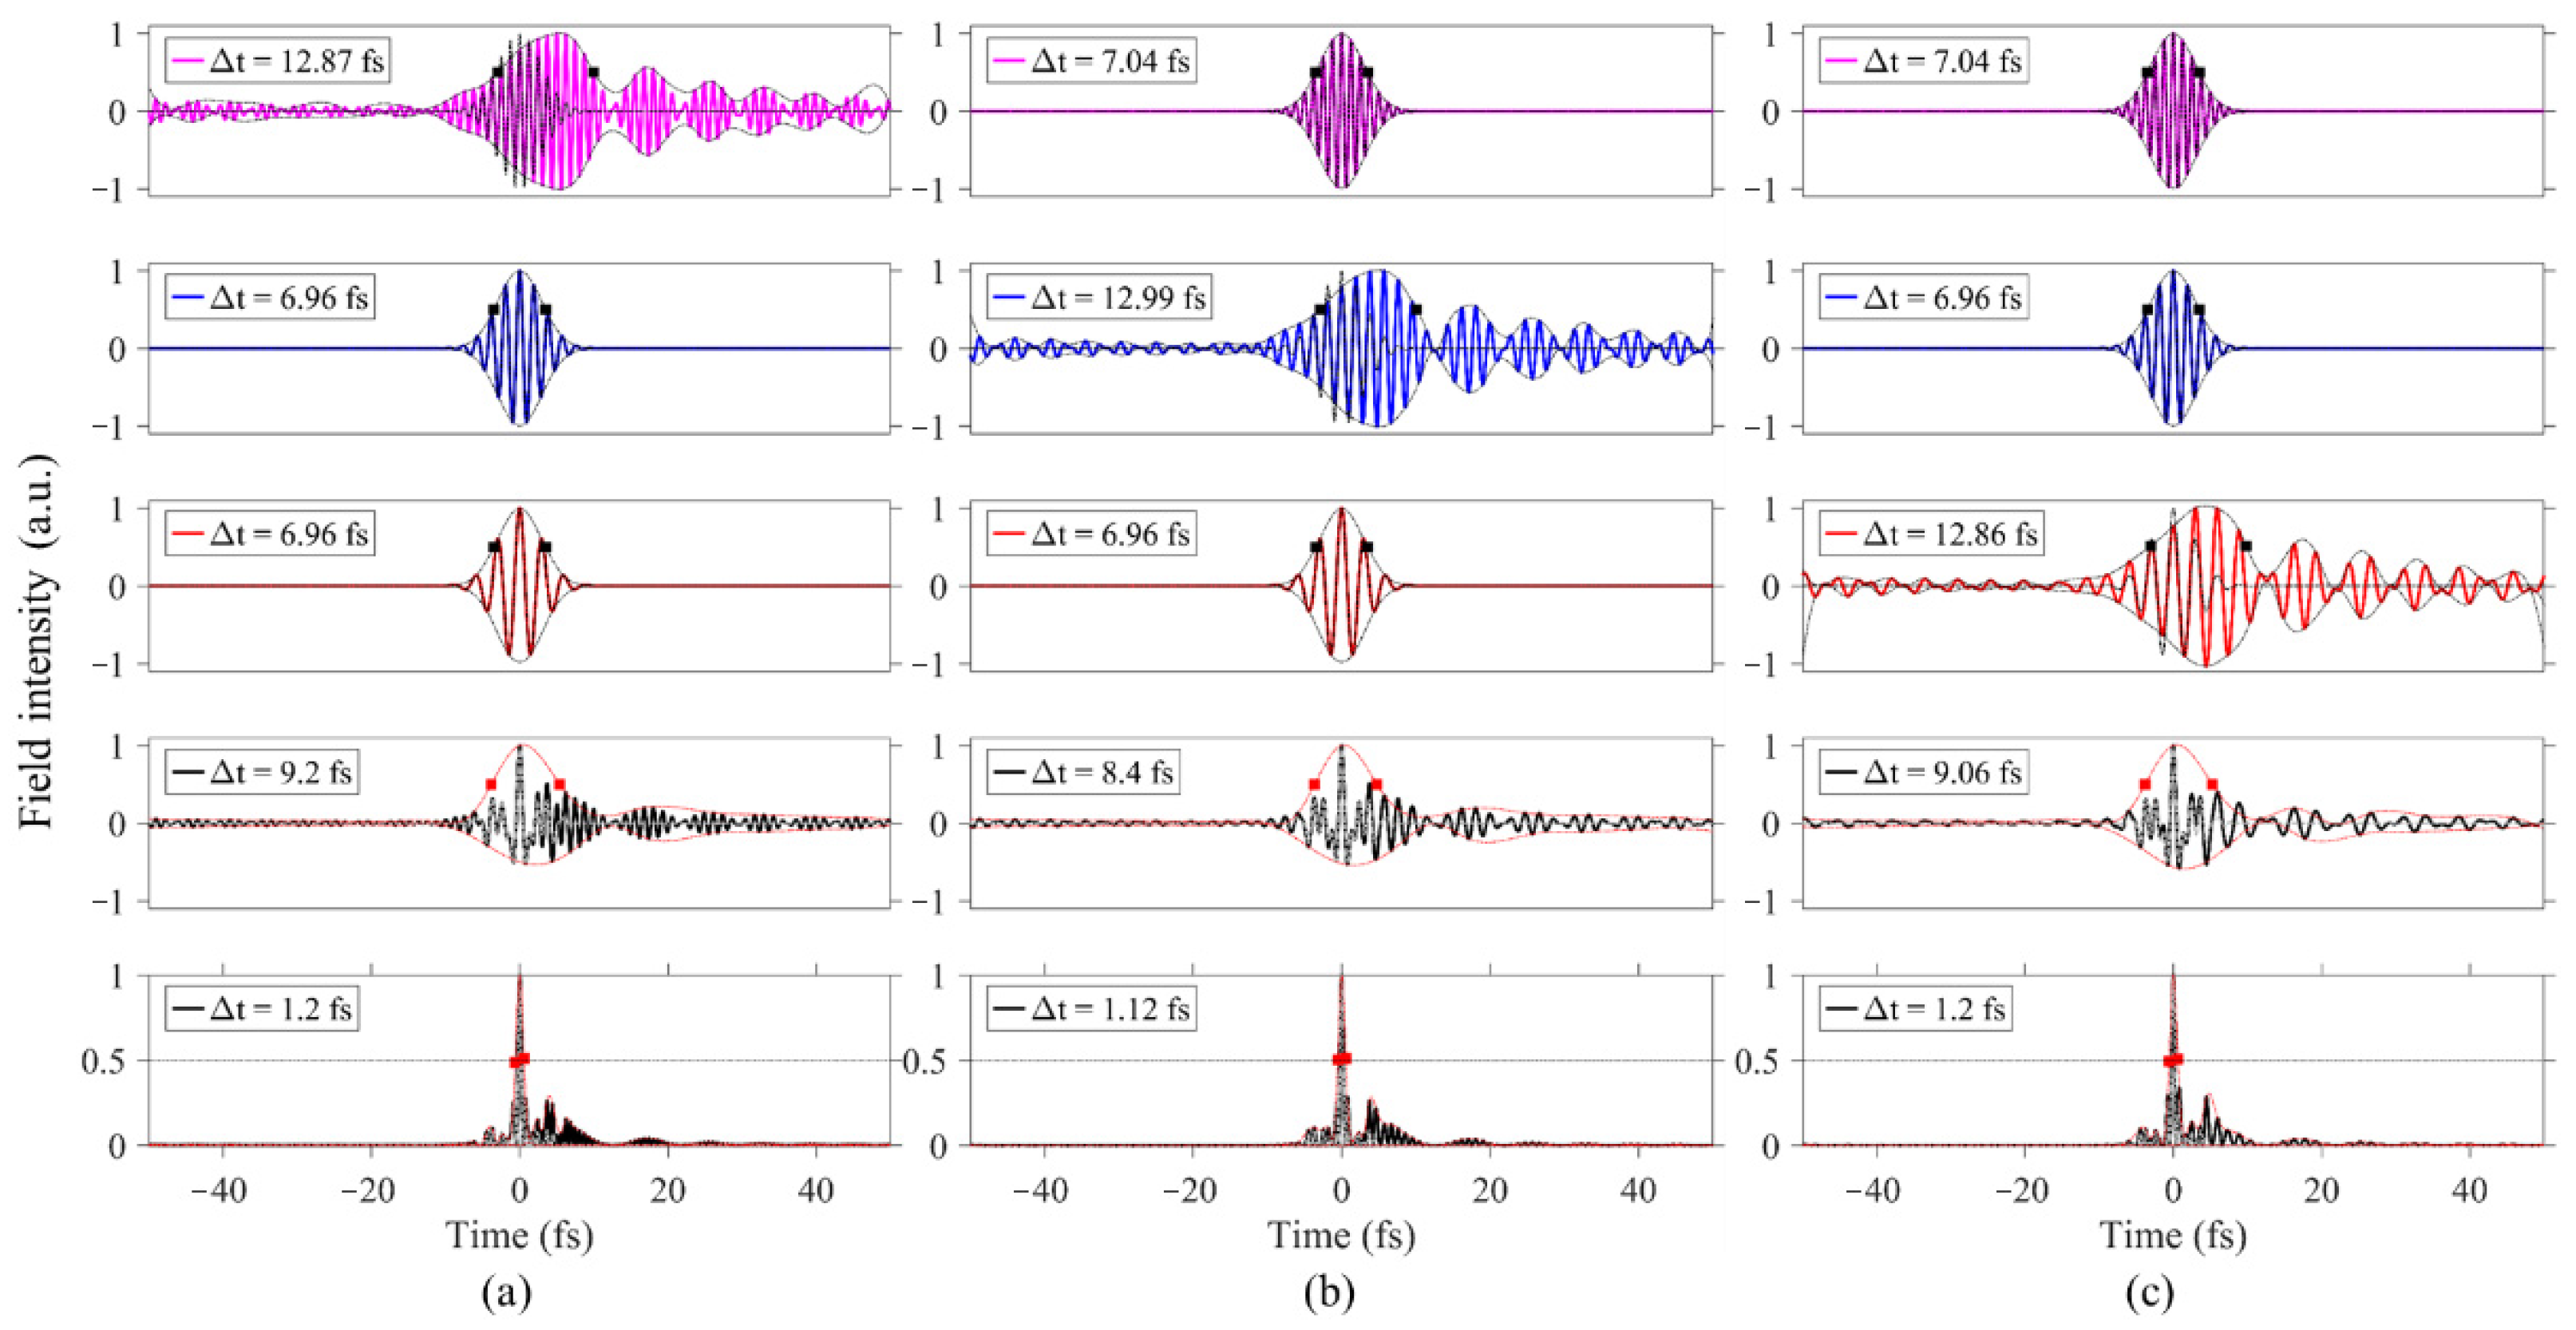
Figure 5 presents the simulation results for the four-channel and three-channel optical field synthesizer. The pulse duration of each channel is assumed to be 7 fs (FWHM), which is slightly larger than their Fourier limit to ensure it can be achieved in the experiment. In each column, there are three or four panels showing the light field of each spectrum band, and the black dashed lines show their upper and lower envelope. The bottom panel in each column shows the synthesized field intensity. The first column shows the simulation results for the four-channel optical field synthesis with an intensity ratio of 1:1:1:1, while the second column in the middle displays the results for the three-channel configuration, with an intensity ratio of 1:1:1. As observed from the comparison, the four-channel setup achieves a slightly better performance, with 371 as the isolated transient light field. The three-channel configuration also results in an isolated attosecond light field, though with a longer FWHM field pulse duration of 433 as and higher “side-peaks” (the peaks before or after the central maximum field peak). However, this is still useful for generating attosecond optical pulses. In the third column, it shows the synthesized result of the three-channel configuration, but with an intensity ratio of 1:1:3 (the long wavelength channel, red channel, is with ×3 intensity); this can clearly decrease the side-peaks compared with an equal intensity ratio, although the field pulse duration is a little bit longer. But the lower side-peak is highly beneficial for nonlinear effects when the transient field peak plays a key role. Thus, we demonstrate that high-quality pulse synthesis can be achieved even with fewer channels. Based on these results, we chose to proceed with the three-channel optical synthesizer for further simulations due to its simplicity and effectiveness in generating isolated attosecond pulses.
Figure 5.
The comparison of the synthesized attosecond pulse between four channels and three channels: (a) four channels; the spectrum is ch0: 250–350 nm, ch1: 350–500 nm, ch2: 500–700 nm, ch3: 700–1000 nm; the amplitude ratio for the four channels is 1:1:1:1; (b) three channels; the spectrum is ch0: 300–450 nm, ch1: 450–700 nm, ch2: 700–1100 nm; the amplitude ratio for the three channels is 1:1:1; (c) three channels; the spectrum is the same as that of (b), but with the amplitude ratio of 1:1:3. The black squares in the figure are the FWHM points of the pulse envelopes.
5.2. Light Field Synthesis with Dispersion
The broadening output pulse from gas-filled HCF has some GDDs and TODs. In this section, we will study how these higher-order dispersions influence the synthesized pulse.
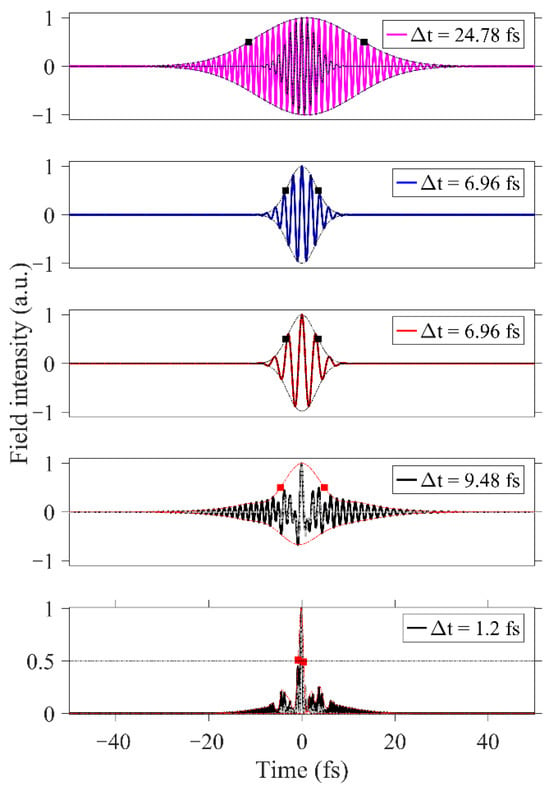
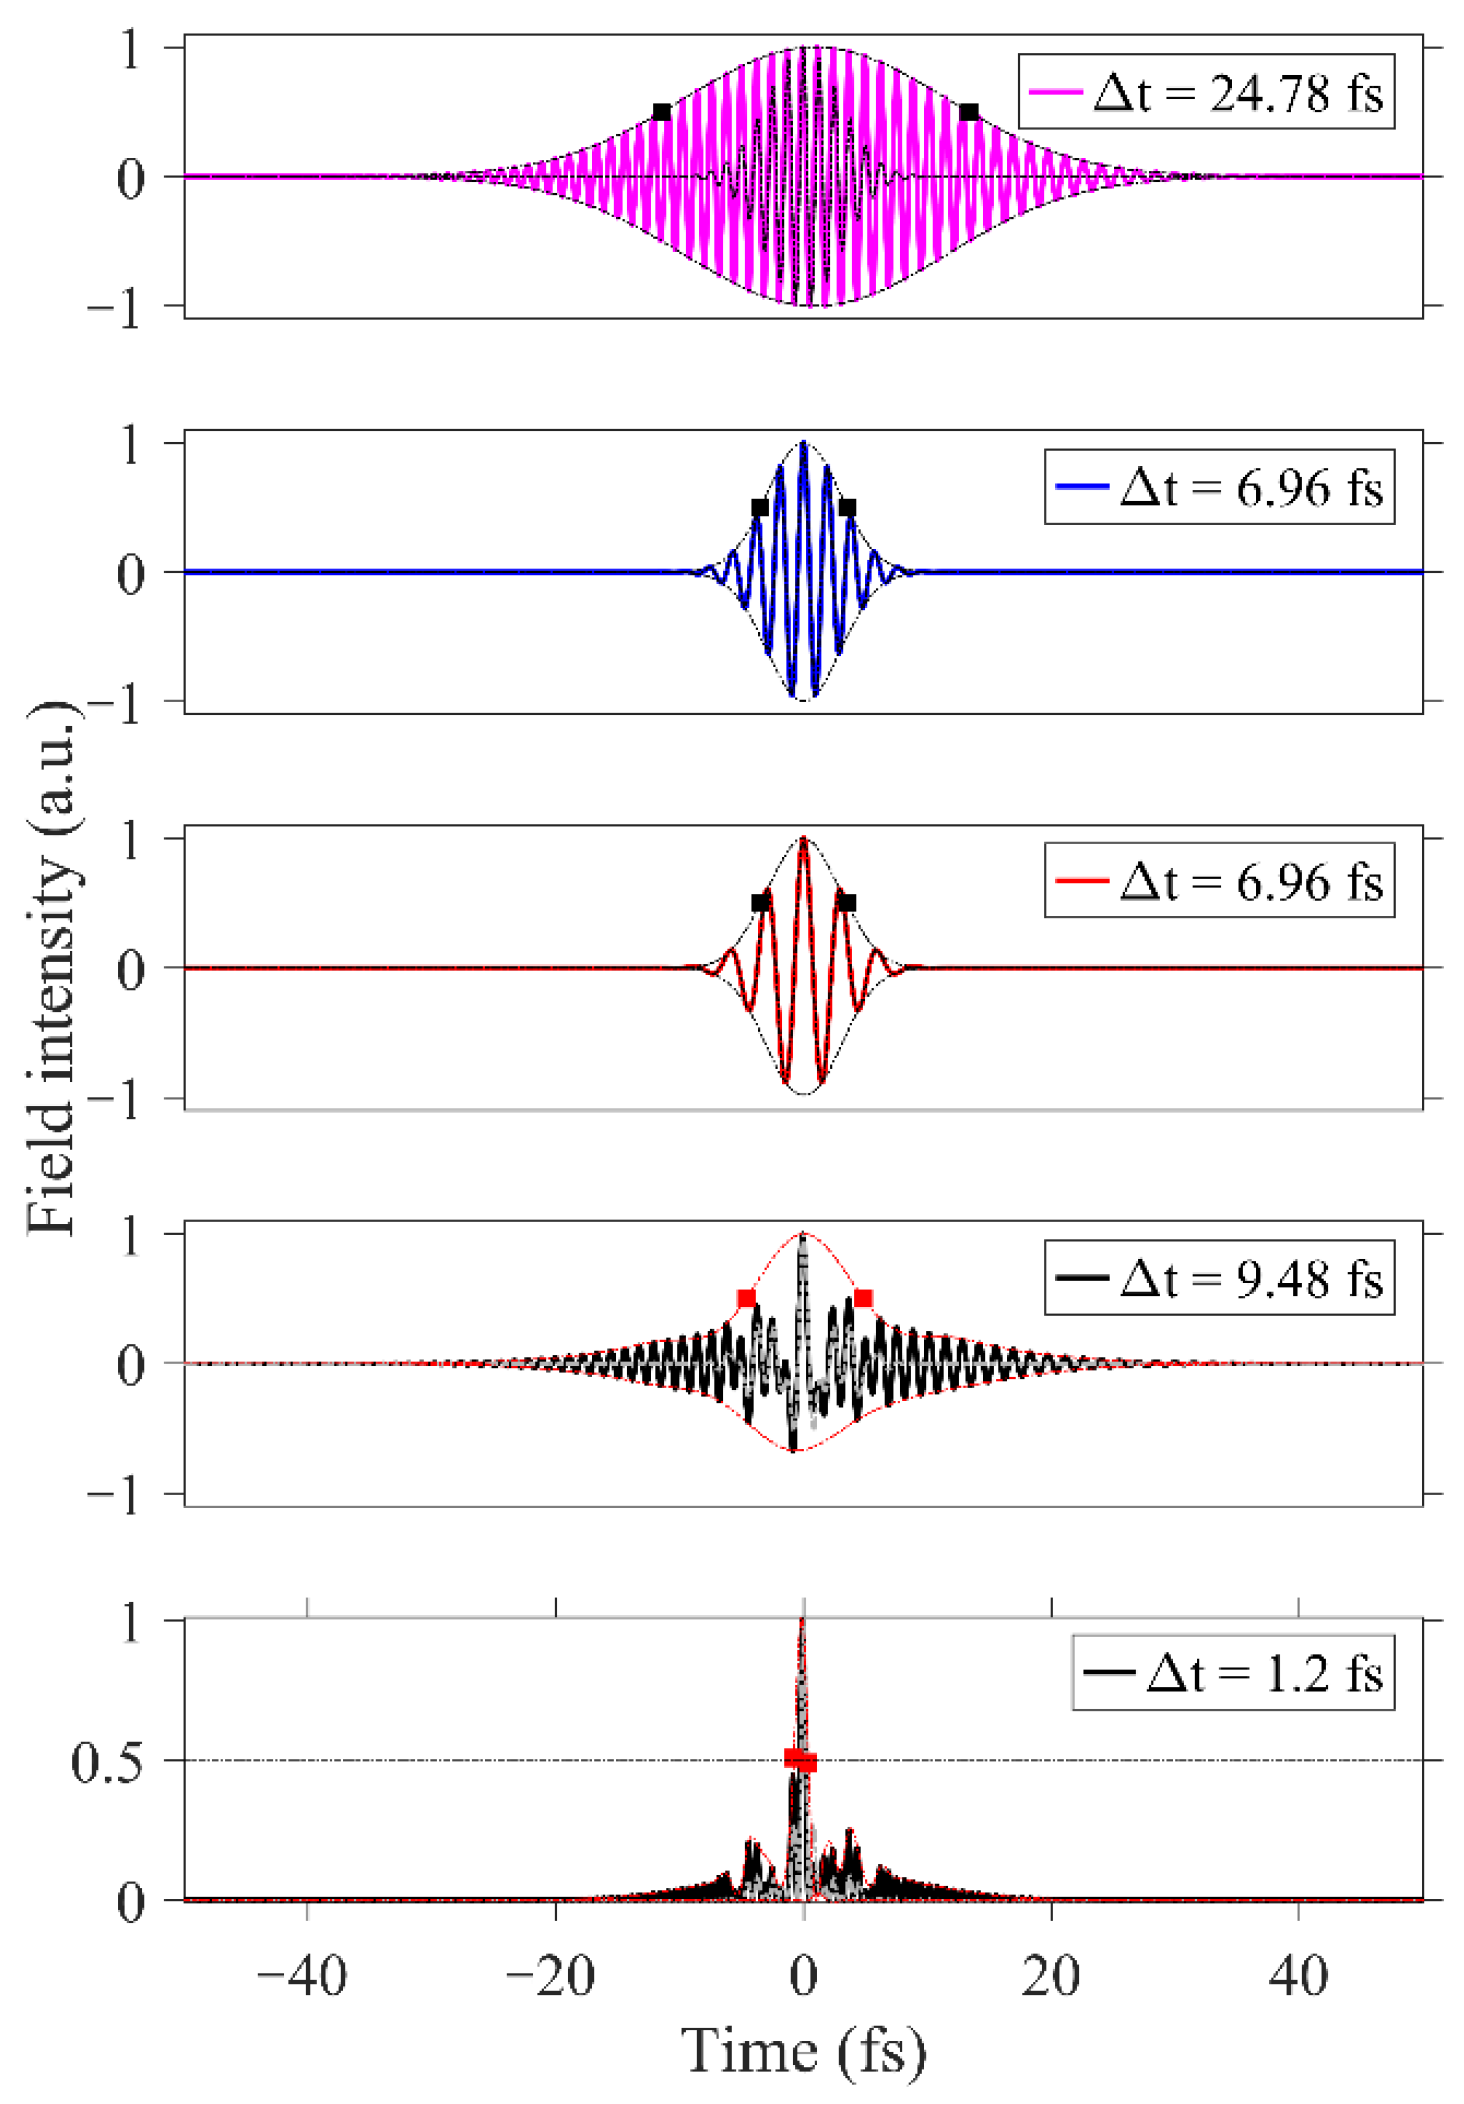
Figure 6 displays the simulated light field of TCLFS: the top three panels show the light fields of ch0, ch1, and ch2, respectively; the dashed black waveforms are the original pulses without dispersion. The colored waveforms are with dispersions. Here we add 30 fs2 GDD to ch0 only to display as an example. Panel 4 and panel 5 present the synthesized waveform and its field intensity, respectively; the black solid lines are the synthesized waveform and intensity with dispersion. The gray dashed lines are synthesized results with no dispersion. The red dashed lines are the envelopes. When there is GDD, the field profile is broadened clearly, resulting in a pulse duration of 7.06 fs. And the side-peak of the field intensity is much higher than that with no dispersion, although the field peak transient remains with an attosecond pulse width.
Figure 6.
Light field simulation of the output pulse of the TCLFS with GDD = 30 fs2 in ch0. The black or red squares in the figure are the FWHM points of the pulse envelopes.
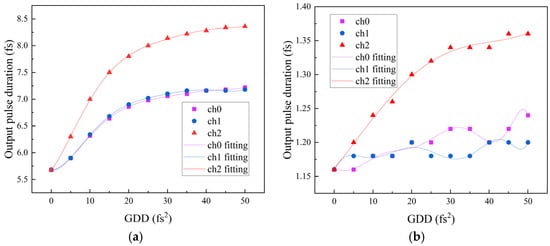
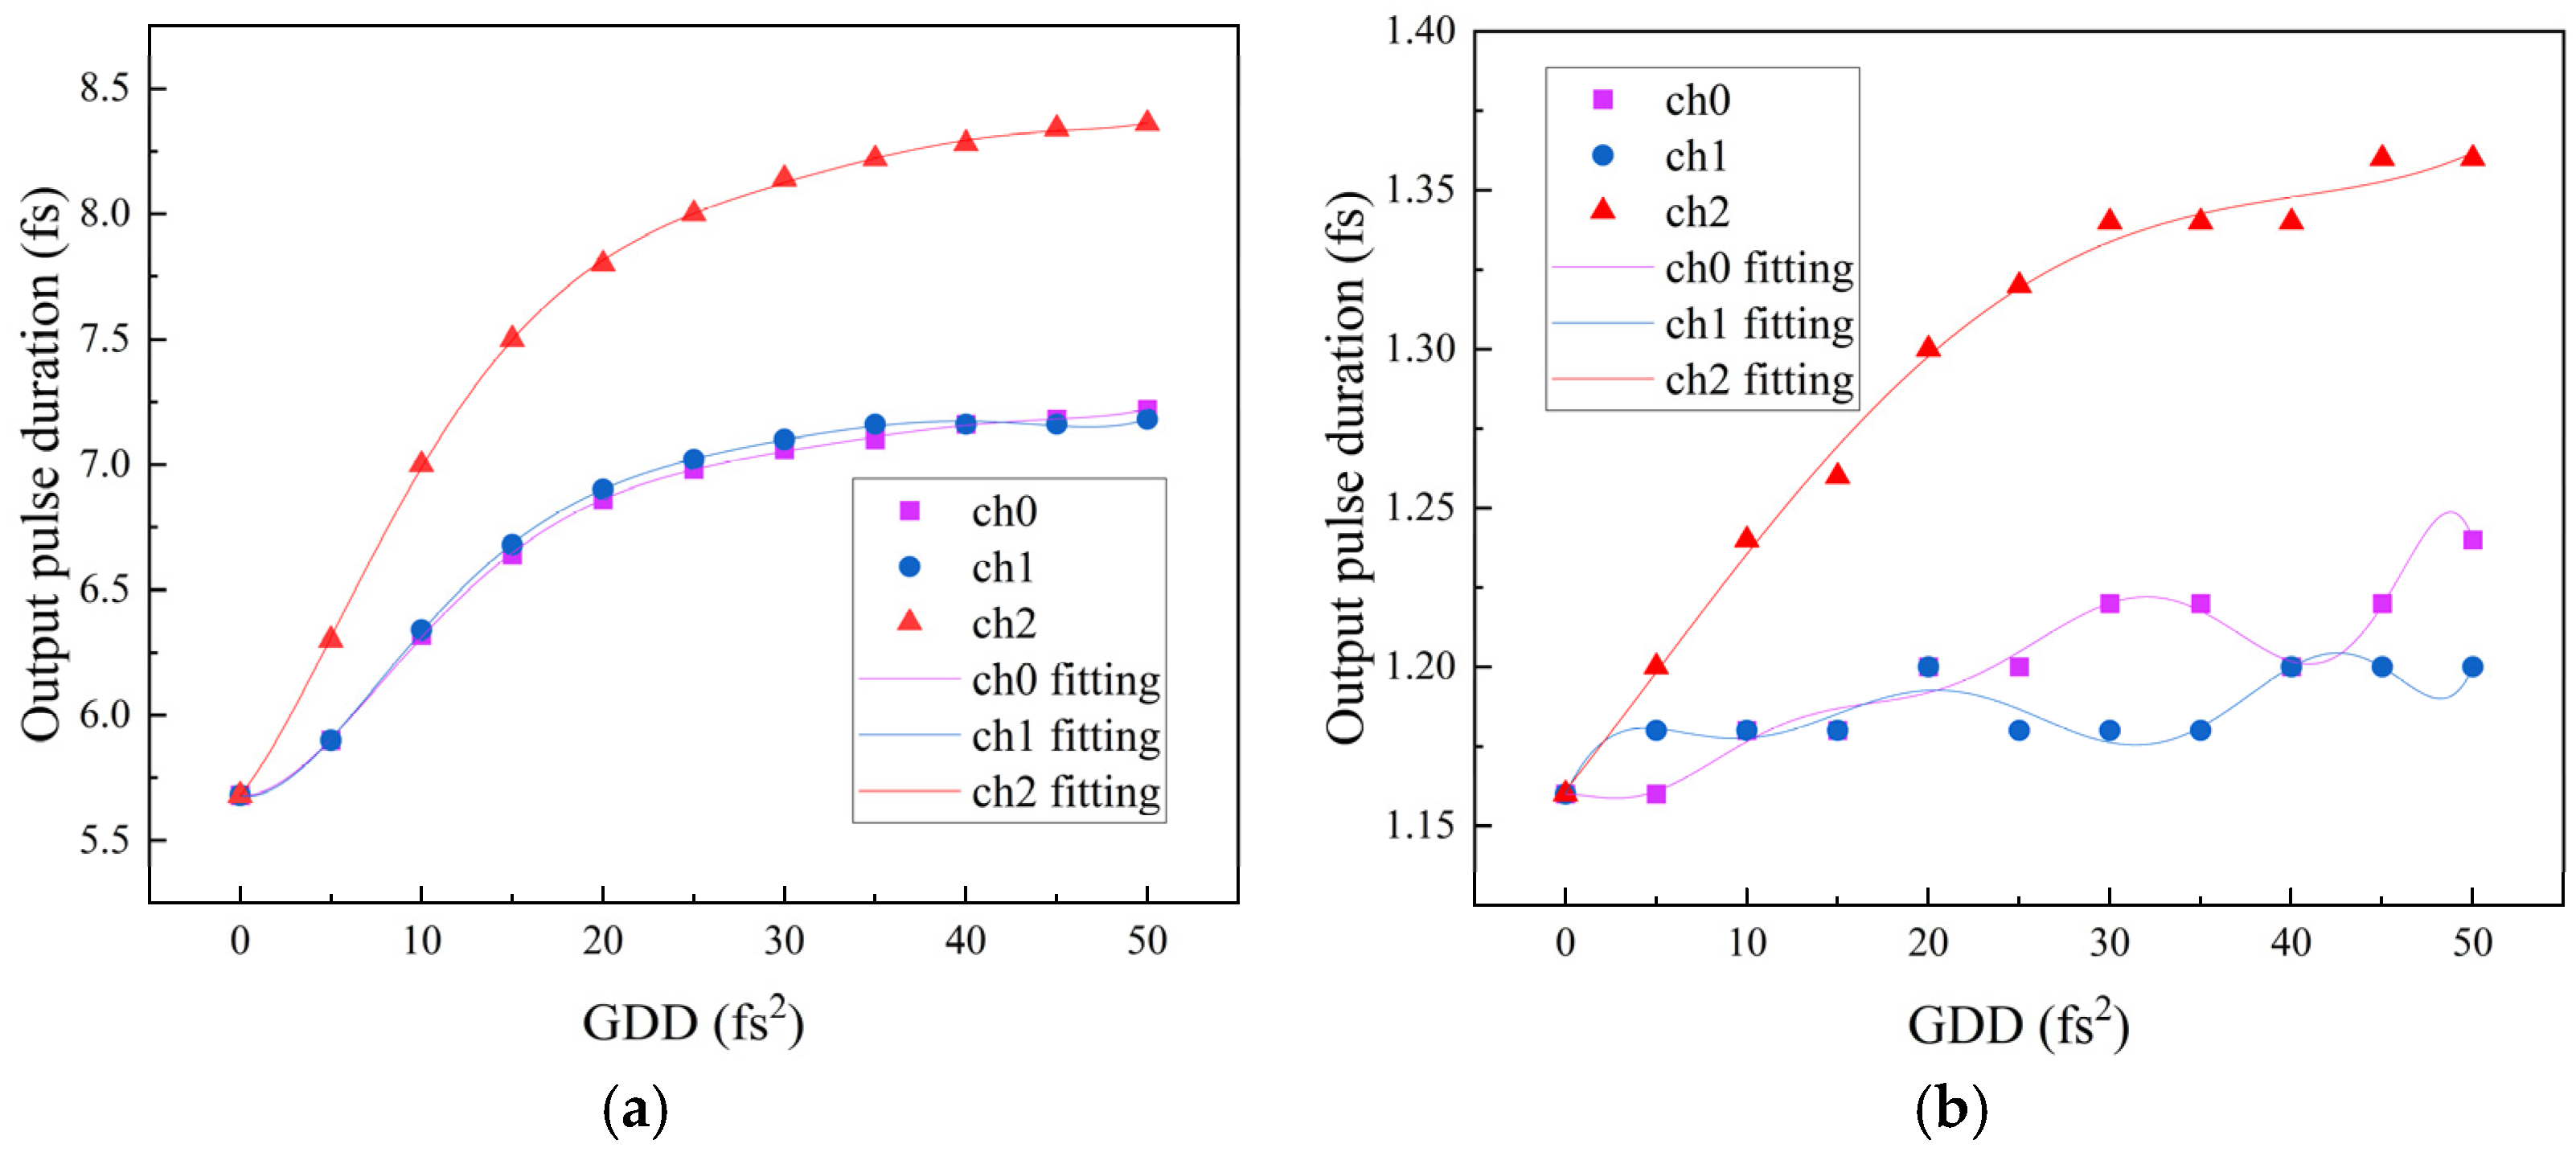
To see how the GDD of each channel affects the output pulse, we synthesized the light at different GDDs of each channel, as shown in Figure 7. For both the pulse duration of the light wave field (Figure 7a) and the field intensity (Figure 7b), GDDs in ch2 have the greatest impact on the results. Ch0 and ch1 show similar impacts. In general, the pulse duration of the profile shows a monotonic increase, which then saturates as the GDD increases to around 25 fs2. This is because, when the GDD is higher, the side-peaks are more serious, but the central part of the pulse does not change too much. This is also why the width of the field intensity profile in Figure 7b has not been affected too much when the GDD increases, since, for the field intensity, the central part plays more of a role. It shows a linear increase with ch2’s GDD; the total change in the profile width is around 0.3 fs in a range of 50 fs2. For ch0 and ch1, the total change is within 10% in the range of 50 fs2. As a result, there is around a 50 fs2 GDD tolerance for ch0 and ch1 generated by HCF spectral broadening for a good, synthesized waveform quality, but the GDD of ch2 should be compensated to less than 10 fs2.
Figure 7.
Synthesized pulse duration of light wave field (a) and the field intensity (b) as a function of GDD for different channels.
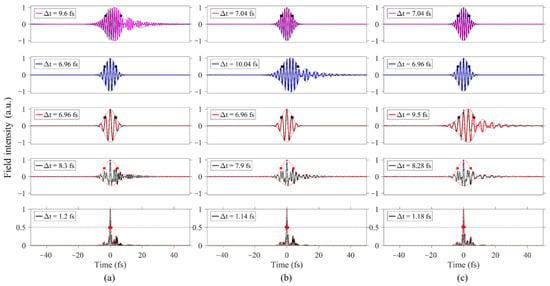
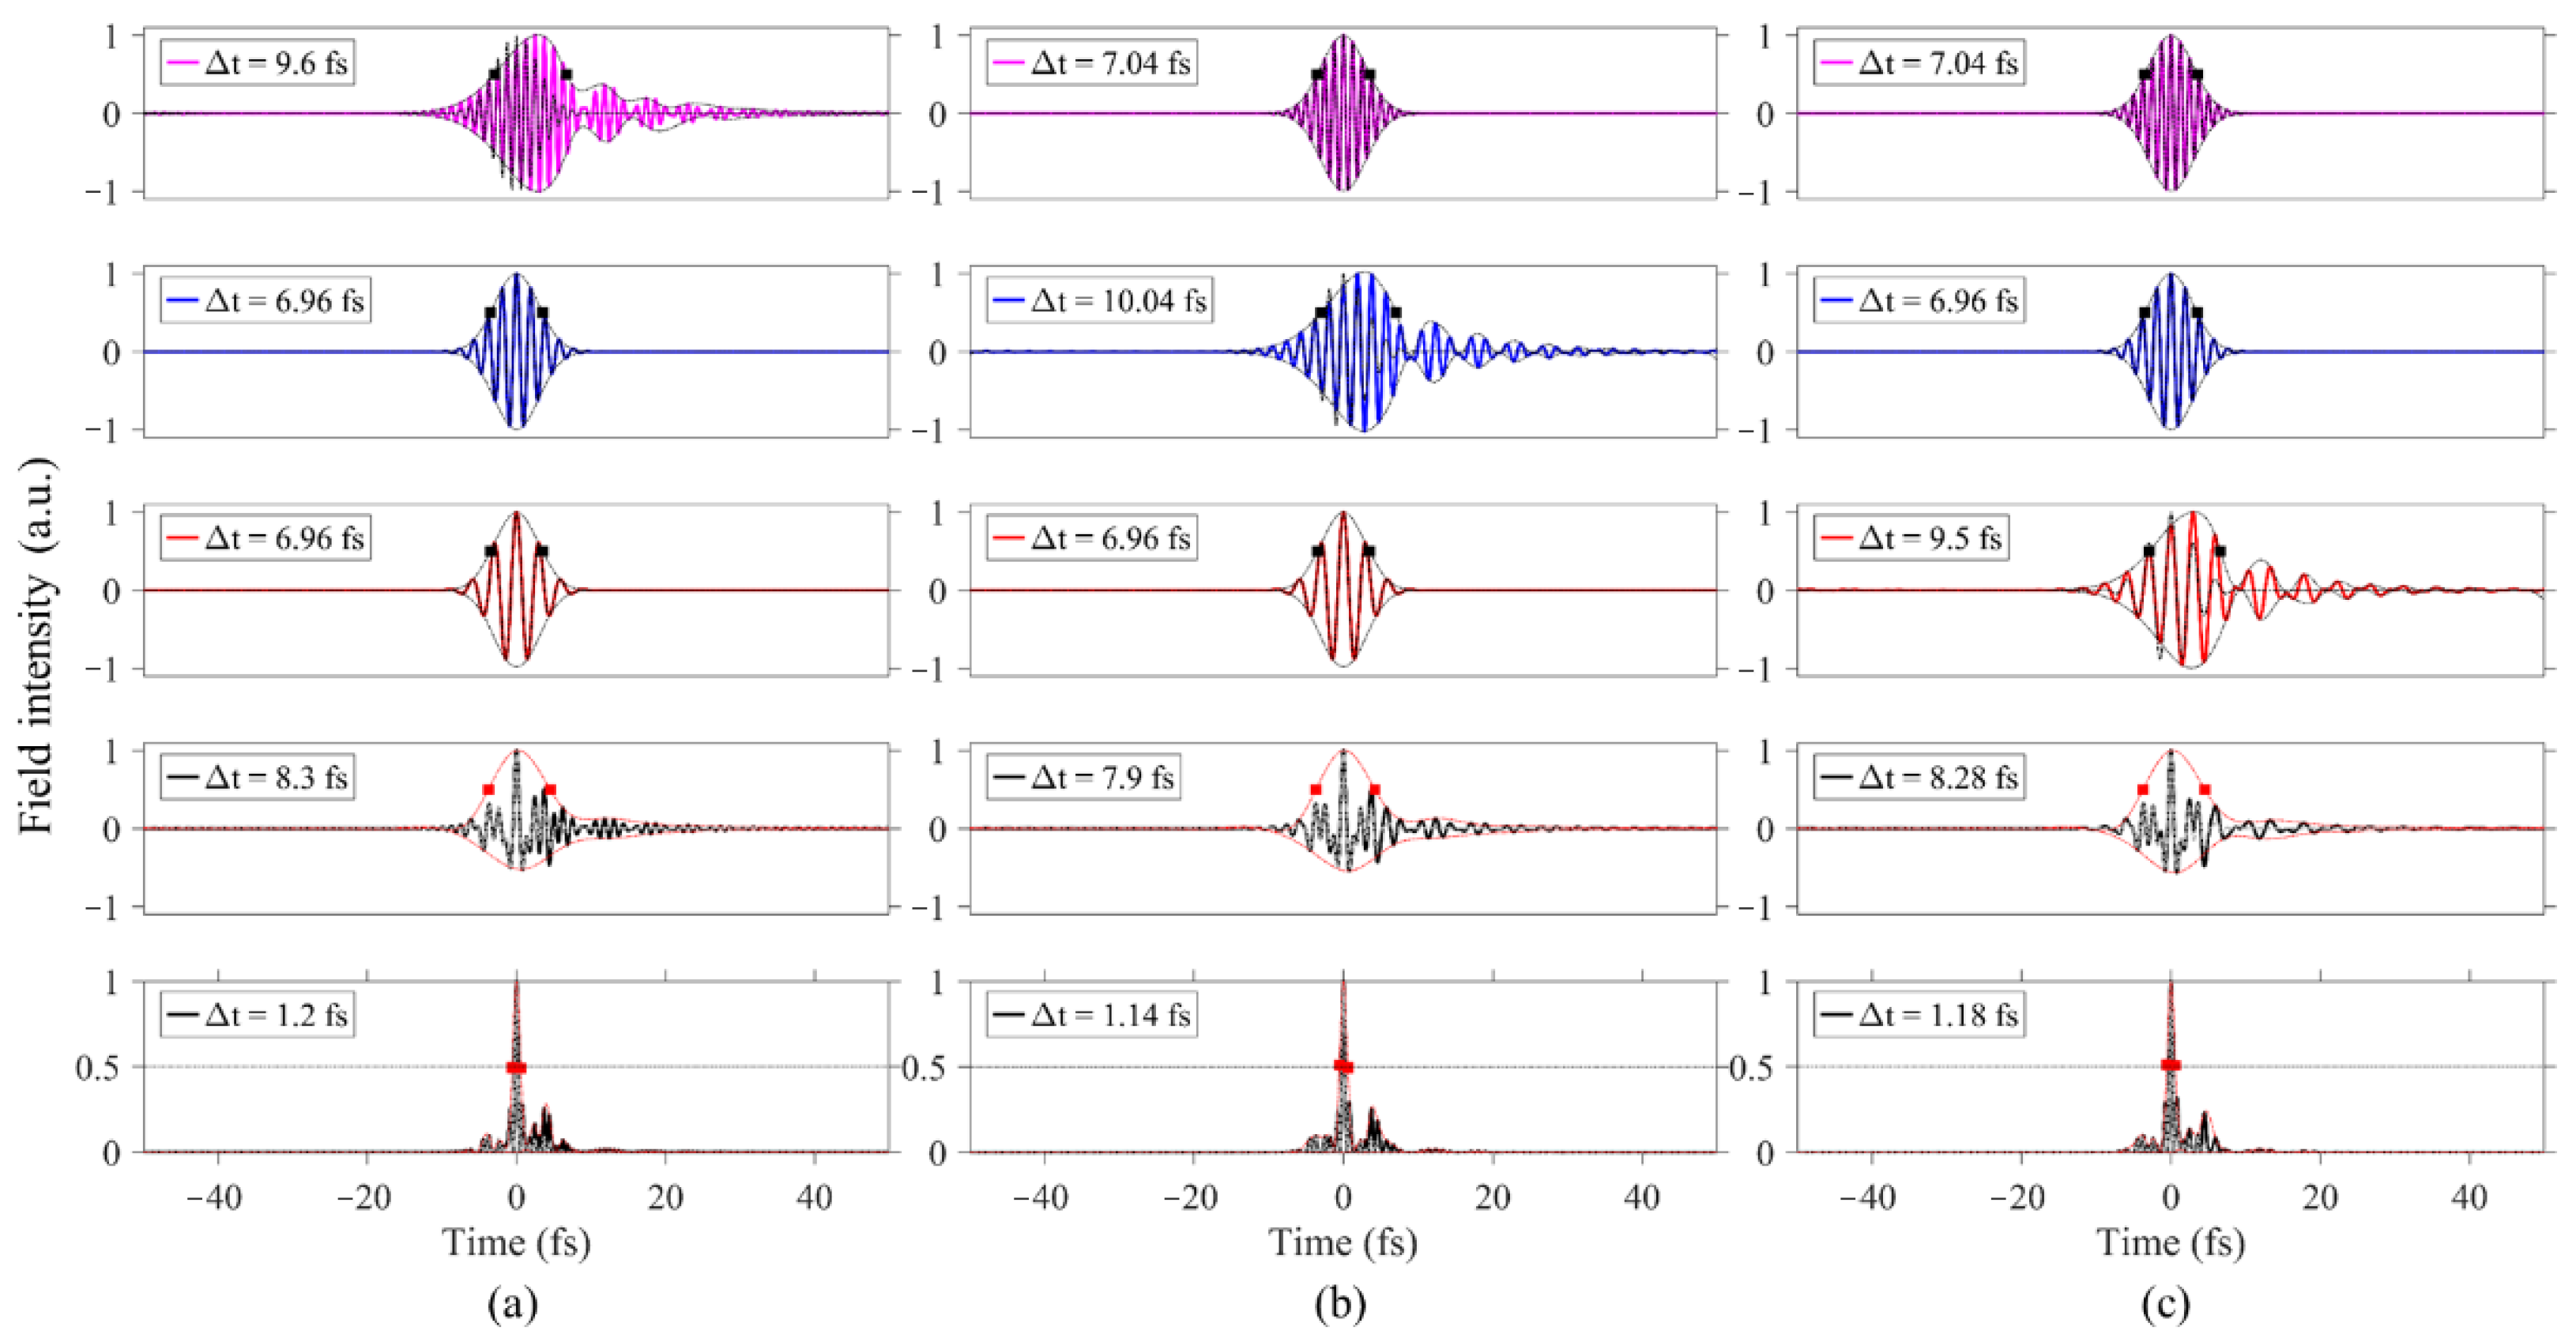
As we all know, TODs do not affect the pulse duration too much but result in a temporal tail and the tilt of the pulse. These pre/post-pulses should also be avoided as much as possible. Here, we simulate the TODs of each channel to provide quantitative and intuitive insights for the synthesized light field. From Figure 3, we know that the HCF broadening can introduce hundreds of TODs, so we set TOD = −100 fs3 (which corresponds to a typical input pulse duration of around 28 fs) as an example for each channel separately, as shown in Figure 8. From left to right, it shows the synthesis results with TOD = −100 fs3 for ch0 (a), ch1 (b), and ch2 (c), respectively. In each case, a temporal tail appears, and the pulse width does not change too much, as expected. Figure 9 shows the same synthesis as Figure 8, but with a larger TOD = −300 fs3. The synthesized field displays longer tails compared to Figure 8. Also, the pulse duration of the electric field waveform envelope is longer in the 4th panel of each column. Thus, to synthesize a clean, neat light wave field, the TODs should also be compensated, especially when the input pulse duration of HCF is short and the nonlinear effect is strong. This study establishes a direct design linkage between nonlinear HCF propagation conditions and downstream waveform synthesis performance.
Figure 8.
Light field simulation of the output pulse of the TCLFS with TOD = −100 fs3 for ch0 (a), ch1 (b), and ch2 (c), respectively. The black or red squares in the figure are the FWHM points of the pulse envelopes.
Figure 9.
Light field simulation of the output pulse of the TCLFS with TOD = −300 fs3 for ch0 (a), ch1 (b), and ch2 (c), respectively. The black or red squares in the figure are the FWHM points of the pulse envelopes.
6. CEP Stability Effects on the Temporal Profile of Synthesized Attosecond Pulse
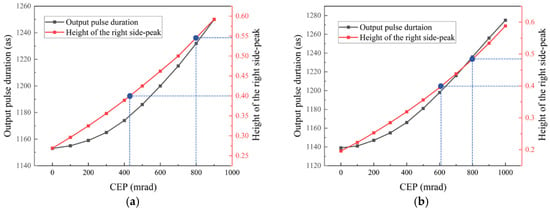
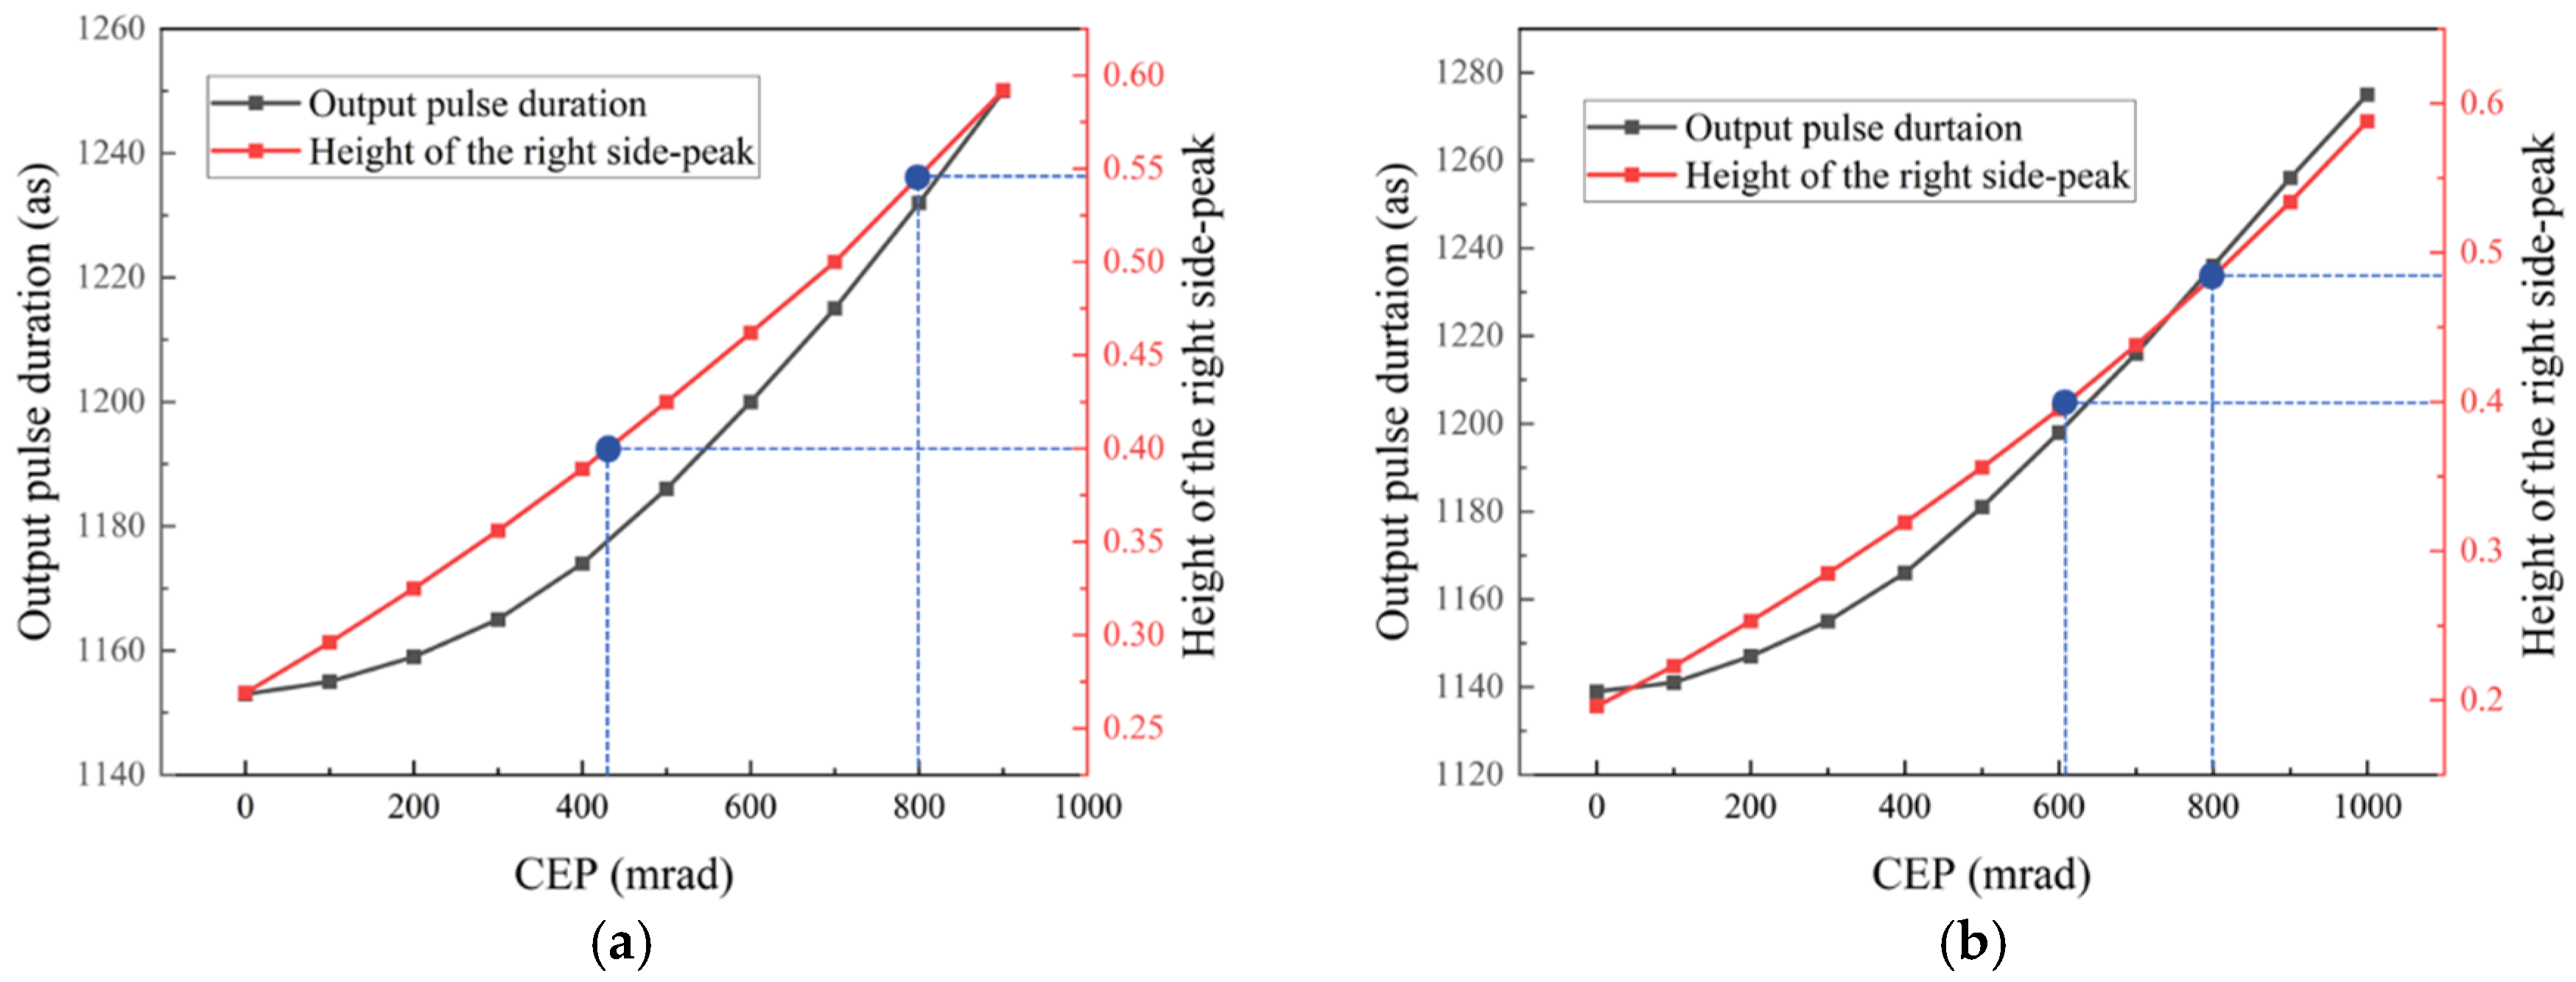
CEP instability is very important for the generation of few-optical-cycle pulses via field synthesis [21]. Here, we studied how the CEP instability affects the attosecond pulse generation. Figure 10 shows the output pulse duration (the FWHM of pulse profile not transient field peak) and height of the first right side-peak as a function of CEP variation for TCLFS with an intensity ratio of 1:1:1 (Figure 10a) and 1:1:3 (Figure 10b), respectively (the red channel has ×3 intensity). The output pulse duration increases exponentially with the CEP variation in both cases due to their increase in the side-peaks. As shown in the red lines, the height of the first right side-peak for the output pulse is significantly influenced by the CEP variation. When CEP changes by 800 mrad, the right side-peak increases to near 55% of the maximum peak for the ratio 1:1:1 (Figure 10a), which seriously disturbs the isolation of the attosecond pulse. For the 1:1:3 case (Figure 10b), it is slightly better, lower than half of the maximum peak, at a CEP change of 800 mrad. But, to ensure a clean isolated attosecond pulse, the side-peak should be lower than 40% of the peak maxima, such that the CEP stability should stay less than around 400 mrad for the 1:1:1 intensity ratio and 600 mrad for the 1:1:3 intensity ratio. This is actually a quite tolerant CEP stability requirement for most of the laser systems. This calculation emphasizes the importance of precise control over the CE phase to maintain the quality of the synthesized pulse.
Figure 10.
(a) Output pulse duration and height of the first right side-peak corresponding to different CEP variations for a TCLFS with intensity ratios of 1:1:1 (a) and 1:1:3 (b).
7. Conclusions
In conclusion, we compared a four-channel and Three-Channel Light Field Synthesizer and found that the three-channel configuration can also generate a clean, isolated attosecond visible pulse. In gas-filled Hollow-Core Fiber (HCF) broadening, longer input pulse durations result in higher GDD and TOD, with the TOD saturating at an input pulse width of approximately 35 fs. To achieve a broader spectrum, the input pulse should be kept as short as possible. Then, we studied how the dispersion of HCF output affects the light waveform synthesis. The GDD causes a monotonic increase in the pulse envelope duration, which gradually approaches saturation, while TOD introduces asymmetric temporal distortions manifested as pre- or post-pulses. In addition, the CEP instability mainly affects the side-peaks of the synthesized waveform. To maintain the first side-peak intensity below 40% of the main peak maxima—necessary for producing an isolated attosecond pulse—a CEP stability better than 600 mrad is required. By optimizing the input pulse parameters and dispersion conditions, pulse compression into the attosecond regime with a near-Fourier transform-limited quality can be achieved. This work establishes a robust framework for engineering ultra-broadband visible pulses with tailored temporal characteristics, opening new opportunities for attosecond science in molecular and solid-state systems.
Author Contributions
Conceptualization, D.H.; methodology, D.H., J.M., and Y.F.; validation, J.M., J.H., M.Y., and D.H.; formal analysis, D.H., J.M., and Y.F.; investigation, J.H., P.X., and G.C. (Gaiyan Chang); resources, D.H., Y.F., G.Z., and G.C. (Guanghua Cheng); data curation, J.M., P.X., and M.Y.; writing—original draft preparation, J.M.; writing—review and editing, D.H., Y.F., G.Z., and G.C. (Guanghua Cheng); supervision, Y.F.; project administration, D.H. and Y.F.; funding acquisition, D.H. and Y.F. All authors have read and agreed to the published version of the manuscript.
Funding
This research was funded by National Natural Science Foundation of China, grant number 12474320, Young Scientist Basic Research Program of CAS, grant number YSBR-091, National Key R&D Program of China, grant number 2025YFF0514900 and 2024YFB4609200, and Shaanxi Provincial Special Project for Technological Innovation Guidance, grant number 2024QY-SZX-14, Shaanxi Provincial Innovation Support Program 2025KJ-JKRC-18.
Data Availability Statement
The data used to produce the figures in this work is available upon request.
Conflicts of Interest
The authors declare no conflicts of interest.
References
- Midorikawa, K. Progress on table-top isolated attosecond light sources. Nat. Photon. 2022, 16, 267–278. [Google Scholar] [CrossRef] [Scilit]
- Tao, C.-Y.; Lei, J.-T.; Yu, X.; Luo, Y.; Ma, X.W.; Zhang, S.F. Development of attosecond pulses and their application to ultrafast dynamics of atoms and molecules. Acta Phys. Sin. 2023, 72, 053202. [Google Scholar] [CrossRef] [Scilit]
- Li, J.; Ren, X.; Yin, Y.; Zhao, K.; Chew, A.; Cheng, Y.; Cunningham, E.; Wang, Y.; Hu, S.; Wu, Y.; et al. 53-attosecond X-ray pulses reach the carbon K-edge. Nat. Commun. 2017, 8, 186. [Google Scholar] [CrossRef] [Scilit] [PubMed]
- Gaarde, M.B. Going visible. Nat. Photon. 2025, 19, 668–669. [Google Scholar] [CrossRef] [Scilit]
- Andrew, M.W. Ultrafast optical pulse shaping: A tutorial review. Opt. Commun. 2011, 284, 3669–3692. [Google Scholar] [CrossRef] [Scilit]
- Froehly, C.; Colombeau, B.; Vampouille, M. II Shaping and Analysis of Picosecond Light Pulses. Prog. Opt. 1983, 20, 63–153. [Google Scholar]
- Anderson, A.; Lücking, F.; Prikoszovits, T.; Hofer, M.; Cheng, Z.; Neacsu, C.C.; Scharrer, M.; Rammler, S.; Russell, P.S.; Tempea, G.; et al. Multi-mJ carrier envelope phase stabilized few-cycle pulses generated by a tabletop laser system. Appl. Phys. B 2011, 103, 531–536. [Google Scholar] [CrossRef] [Scilit]
- Wang, P.; Li, Y.; Li, W.; Su, H.; Shao, B.; Li, S.; Wang, C.; Wang, D.; Zhao, R.; Peng, Y.; et al. 2.6 mJ/100 Hz CEP-stable near-single-cycle 4 μm laser based on OPCPA and hollow-core fiber compression. Opt. Lett. 2018, 43, 2197–2200. [Google Scholar] [CrossRef] [Scilit] [PubMed]
- Saiyyed, R.; Sindhwani, M.; Sachdeva, S.; Pahuja, H.; Shukla, M.K. Comprehensive analysis of nonlinear effects in fiber optic communication systems: Exploring SPM, XPM, SS, and FWM. J. Opt. 2025. [Google Scholar] [CrossRef] [Scilit]
- Heinzerling, A.M.; Tani, F.; Agarwal, M.; Yakovlev, V.S.; Krausz, F.; Karpowicz, N. Field-resolved attosecond solitons. Nat. Photon. 2025, 19, 772–777. [Google Scholar] [CrossRef] [Scilit]
- Galán, M.F.; Serrano, J.; Jarque, E.C.; Borrego-Varillas, R.; Lucchini, M.; Reduzzi, M.; Nisoli, M.; Brahms, C.; Travers, J.C.; Hernández-García, C.; et al. Robust Isolated Attosecond Pulse Generation with Self-Compressed Subcycle Drivers from Hollow Capillary Fibers. ACS Photonics 2024, 11, 1673–1683. [Google Scholar] [CrossRef] [Scilit] [PubMed]
- Dudley, J.M.; Taylor, J.R. Supercontinuum Generation in Optical Fibers; Cambridge University Press: Cambridge, UK, 2010. [Google Scholar]
- Guo, X.; Tokita, S.; Yoshii, K.; Nishioka, H.; Kawanaka, J. Generation of 300 nm bandwidth 0.5 mJ pulses near 1 μm in a single stage gas filled hollow core fiber. Opt. Express 2017, 25, 21171–21179. [Google Scholar] [CrossRef] [Scilit] [PubMed]
- Böhle, F.; Kretschmar, M.; Jullien, A.; Kovacs, M.; Miranda, M.; Romero, R.; Crespo, H.; Morgner, U.; Simon, P.; Lopez-Martens, R.; et al. Compression of CEP-stable multi-mJ laser pulses down to 4 fs in long hollow fibers. Laser Phys. Lett. 2014, 11, 095401. [Google Scholar] [CrossRef] [Scilit]
- Nagar, G.C.; Shim, B. Study of wavelength-dependent pulse self-compression for high intensity pulse propagation in gas-filled capillaries. Opt. Express 2021, 29, 27416–27433. [Google Scholar] [CrossRef] [Scilit] [PubMed]
- Bree, C.; Demircan, A.; Steinmeyer, G. Method for computing the nonlinear refractive index via Keldysh theory. IEEE J. Quantum Electron. 2009, 46, 433–437. [Google Scholar] [CrossRef] [Scilit]
- Heynck, M. A Systematic Study of Multi-Octave Spectral Broadening in a Hollow Core Capillary; Ludwig-Maximilians-Universität: München, Germany, 2021. [Google Scholar]
- Nurhuda, M.; Suda, A.; Kaku, M.; Midorikawa, K. Optimization of hollow fiber pulse compression using pressure gradients. Appl. Phys. B 2007, 89, 209–215. [Google Scholar] [CrossRef] [Scilit]
- Silva, F.; Miranda, M.; Alonso, B.; Rauschenberger, J.; Pervak, V.; Crespo, H. Simultaneous compression, characterization and phase stabilization of GW-level 1.4 cycle VIS-NIR femtosecond pulses using a single dispersion-scan setup. Opt. Express 2014, 22, 10181–10191. [Google Scholar] [CrossRef] [Scilit] [PubMed]
- Alqattan, H.; Hui, D.; Pervak, V.; Hassan, M.T. Attosecond light field synthesis. APL Photonics 2022, 7, 041301. [Google Scholar] [CrossRef] [Scilit]
- Cirmi, G.; Manzoni, C.; Brida, D.; De Silvestri, S.; Cerullo, G. Carrier-envelope phase stable, few-optical-cycle pulses tunable from visible to near IR. J. Opt. Soc. Am. B 2008, 25, B62–B69. [Google Scholar] [CrossRef] [Scilit]
Disclaimer/Publisher’s Note: The statements, opinions and data contained in all publications are solely those of the individual author(s) and contributor(s) and not of MDPI and/or the editor(s). MDPI and/or the editor(s) disclaim responsibility for any injury to people or property resulting from any ideas, methods, instructions or products referred to in the content. |
© 2026 by the authors. Licensee MDPI, Basel, Switzerland. This article is an open access article distributed under the terms and conditions of the Creative Commons Attribution (CC BY) license.