


Abstract
Ultrafast laser microhole machining still lacks reliable taper control and on-machine geometric inspection. We combine a partitioned full-factorial design, composite-path optimization and spectral-domain optical coherence tomography (SD-OCT) on a single 355 nm, 10 ps platform for 80 μm holes in 200 μm silicon wafers. Range analysis and a second-order regression on uncoded physical variables, fitted to 448 parameter combinations with three replicate holes each, identified power, scanning speed and number of scans as significant at p < 0.001 but not repetition rate at p = 0.838, with R2 = 0.802. The resulting helical setting of 498 kHz, 15 W, 203 mm/s and 50 scans gave a mean taper of 0.90°. A composite path combining helical pre-drilling with trepanning was then applied with at 500 kHz, 15 W, 50 mm/s, 50 passes and a spiral diameter of 75 μm, and the mean taper decreased to 0.74° ± 0.05°, a reduction of 0.16° or 17.8% relative to the single helical path, which is reported as a reproducible trend. SD-OCT entrance and exit diameters were compared with an offline 3D optical profilometer, with metallurgical microscopy as an auxiliary reference. The deviations span −1.39° to 0.36° with a mean of −0.63° and an RMSE of 0.87°, a measure of inter-method agreement rather than OCT reading scatter. Since the residual method-to-method scatter exceeds the 0.16° reduction, the OCT data rank the hole geometries but do not resolve absolute taper at the 0.1° level. Although the absolute accuracy is limited by resolution and occlusion, the method has potential for online detection and closed-loop machining, providing a feasible approach for rapid machining and online detection of ultrafast laser microhole taper.
1. Introduction
Three-dimensional (3D) integration is regarded as one of the most promising directions in the chip industry, providing vertical mechanical support and electrical interconnection through silicon vias (TSVs) [1]. Driven by the rapid growth of the artificial intelligence (AI) industry, the importance of 3D integration has become even more pronounced, and the etching routes available for TSV formation have been reviewed in detail [2]. Microhole quality directly determines the success of subsequent filling and metallization steps as well as the final electrical performance of TSVs [3], while defects such as entrance craters, debris and recast layers reduce the reliability of downstream processes. Kim et al. [1] proposed a three-step hybrid approach combining single-pulse and burst modes, which effectively suppresses thermal damage and entrance craters. Achieving microholes with controllable taper angles, high aspect ratios and defect-free sidewalls in single-crystal silicon by ultrafast laser machining has long been a goal in this field [4,5].
Existing microhole fabrication techniques can be grouped into four categories: thermal, chemical, mechanical and hybrid processes [6,7]. Thermal methods are represented by micro-electrical discharge machining (micro-EDM), which is typically accompanied by a heat-affected zone, oxidation rings, a recast layer and residual stress and whose removal efficiency is further limited in silicon because the material is a semiconductor [8]. Recent work has therefore shifted from discharge energy towards electrode kinematics and gap flushing. Coupling rotation with axial vibration, obtained by passively converting the inherent electrode runout into axial vibration, raised the groove depth by 109% relative to rotation alone and produced microholes of about 170 μm diameter at an aspect ratio of 100 [9]. Longitudinal–torsional ultrasonic vibration reduced electrode wear by 51.7% and hole taper by 33.5% in EDM deep-hole drilling [10], and a dedicated longitudinal–torsional transducer increased the material removal rate nearly twofold while lowering electrode wear and taper by about 60% and 80% [11]. Multi-motion spindles combining planetary, self-lifting and swing motions have drilled reverse-taper holes below 80 μm inlet diameter at a K factor of 1.77 [12]. Mechanical micro-drilling has achieved a minimum taper angle of 0.248° and a circularity of 0.981 for Ø500 μm holes [13], as well as aspect ratios above 15 in silicon nitride ceramics [14]. When applied to brittle silicon, however, rapid tool wear and entrance chipping remain difficult to avoid [7]. Among hybrid processes, electrochemical discharge machining (ECDM) avoids residual stress, yet overcuts greater than 160 μm and heat-affected zones approximately 18 μm wide have still been reported for glass wafers [15,16]. Ultrasonic-vibration-assisted electrochemical micromachining has produced deep holes with an aspect ratio of 12.3 in stainless steel [17,18].
For silicon wafers, TSVs are mainly formed by deep reactive ion etching (DRIE, the Bosch process), with alternative routes including KOH anisotropic wet etching, photoelectrochemical etching and metal-assisted chemical etching (MaCE). These routes avoid mechanical damage but are constrained by crystal orientation or catalyst distribution, and their removal rate falls as the aspect ratio increases, while DRIE additionally requires a lithographic mask and leaves scalloped sidewalls [19]. In contrast, ultrafast laser machining, together with plasma-assisted and water-jet-guided laser approaches, is maskless, non-contact and material-selective, avoids tool wear and electrode consumption, and offers the scanning path as an additional degree of freedom for taper control. These advantages, however, concern process flexibility rather than the geometry actually obtained: a freely designable scanning path does not by itself remove the taper. In helical drilling of 0.4 mm thick silicon wafers, shortening the pulse duration from 8 ns to approximately 10 ps suppresses melt redeposition and yields smooth through-holes free of recast layers, whereas ns pulses leave thick redeposited layers and microcracks and fs pulses tend to introduce mechanical defects on the hole wall [20]. A corresponding pulse-duration dependence of the ablation mechanism has been reported for copper, where removal changes from vaporization-dominated to melt-dominated near 10 ps [21]. More directly for the present material, high-energy percussion drilling of 650 μm thick silicon plates with femtosecond pulses produced holes approximately 18 μm in diameter at 40 μm below the top surface and only 8 μm near the exit; the waveguide attenuation model used in that work reproduces the hole depth as a function of shot number, and the authors note that the tapering of the hole would have to be included in a complete fluence analysis [22]. Femtosecond drilling has produced 100 μm holes with aspect ratios above 20 in a nickel-based superalloy, yet the holes obtained remain tapered and irregular [23]. Thus, even where the depth evolution is well described, the lateral profile that defines the taper is not predicted, and taper control remains an open process design problem.
All these results, however, rely on offline measurements performed after machining; without real-time monitoring, in-process adjustment is not possible. Although micro-EDM remains inefficient on silicon, the EDM community has moved furthest towards closing this loop. Non-invasive radio-frequency sensing now classifies discharge states at pulse-train level and drives an adaptive servo control that extends the effective machining time and stabilizes the feed rate [24], physics-informed discharge state identification has been demonstrated for high-energy EDM milling [25], and recent reviews document this transition from post-process inspection to in-process control [26]. Laser microhole drilling has not reached the same level of process awareness, and optical coherence tomography (OCT) has become its principal non-destructive tool for depth-resolved process monitoring [27]. Optimization of laser microhole machining has mainly proceeded through the coordinated design of multiple process parameters and the planning of focused-spot scanning paths. Percussion drilling with single or multiple pulses repeatedly delivers energy to the same location and can yield large aspect ratios but leaves a wide recast layer; trepanning and helical scanning, by contrast, offer high circularity, minimal recast material and low taper, and rotating the beam with a Dove prism can even reverse the taper [28]. In ultrafast laser machining of through trenches in silicon, the entrance width remains almost unchanged while the exit width increases with energy density and the number of scans before saturating after breakthrough; a two-step strategy minimizes the taper [29]. The synergy between process parameters and scanning paths thus enables the control and optimization of aspect ratio and taper, and response surface designs have further revealed interactions among the parameters [30].
Fourier-domain OCT, including spectral-domain and swept-source implementations, uses a fixed reference mirror and reconstructs a complete A-scan from a single interference spectrum; without mechanical scanning, acquisition rates far above those of time-domain systems are attainable, which allows the drilling pulse sequence to be followed. The resulting gain in speed has enabled the transfer of OCT from offline metrology to laser-beam process monitoring [31]. OCT has been applied to keyhole depth measurement in laser welding [32], inter-pulse morphology characterization in percussion drilling [33], closed-loop process guidance [34] and analytical modelling of depth progression [35]. SD-OCT has further been used for in-process hole depth measurement during femtosecond laser drilling [36], depth-controlled ablation of carbon-fiber-reinforced polymer [37], hole depth monitoring in alloys with different reflectivities [38], in situ monitoring of laser grooving [39] and monitoring of hole evolution in ultrafast laser drilling [40]. Nevertheless, the measured quantities remain one-dimensional depths: because the signal light returning from inside a microhole is weak, extracting contour information such as diameter and taper by three-dimensional scanning remains difficult. Despite these advances, two gaps remain, namely the lack of a systematic study on parameter–path interactions for taper control and the absence of in situ SD-OCT taper extraction validated against offline profilometry.
In summary, ultrafast laser machining of silicon microholes requires integrating three elements, namely multi-factor design of process parameters, galvanometer-based scanning path planning, and in situ extraction of through-hole taper. In this work, micro-through-holes with a designed diameter of 80 μm (aspect ratio 2.5) are fabricated in 200 μm thick silicon wafers using a 355 nm ultraviolet picosecond laser, and taper optimization together with SD-OCT-based inspection is investigated. First, a full-factorial design combined with range analysis and second-order polynomial regression is employed to examine the effects of repetition rate, laser power, scanning speed, number of scans and their interactions on hole taper so as to optimize the helical scanning parameters. Second, on the basis of the optimized helical parameters, helical scanning is combined with trepanning into a hybrid path; single-factor experiments are conducted to analyze the influence of trepanning scan count, scanning speed, repetition rate and helical diameter on the taper, thereby further optimizing the hybrid process. Finally, SD-OCT combined with galvanometer scanning is used to reconstruct top-view and cross-sectional images of the microholes and to extract the taper; the SD-OCT results are validated against offline measurements from a commercial three-dimensional profilometer and against metallographic observations. This work provides a reference for taper optimization and online inspection of ultrafast-laser-drilled microholes.
2. Materials and Methods
2.1. Experimental Material
A 4-inch silicon wafer with a thickness of 200 μm was used. The wafer was P-type with a (100) crystal orientation and a resistivity of less than 0.01 Ω·cm.
2.2. Experimental Equipment
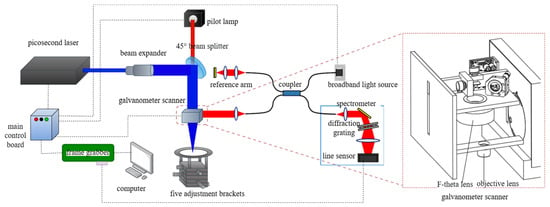
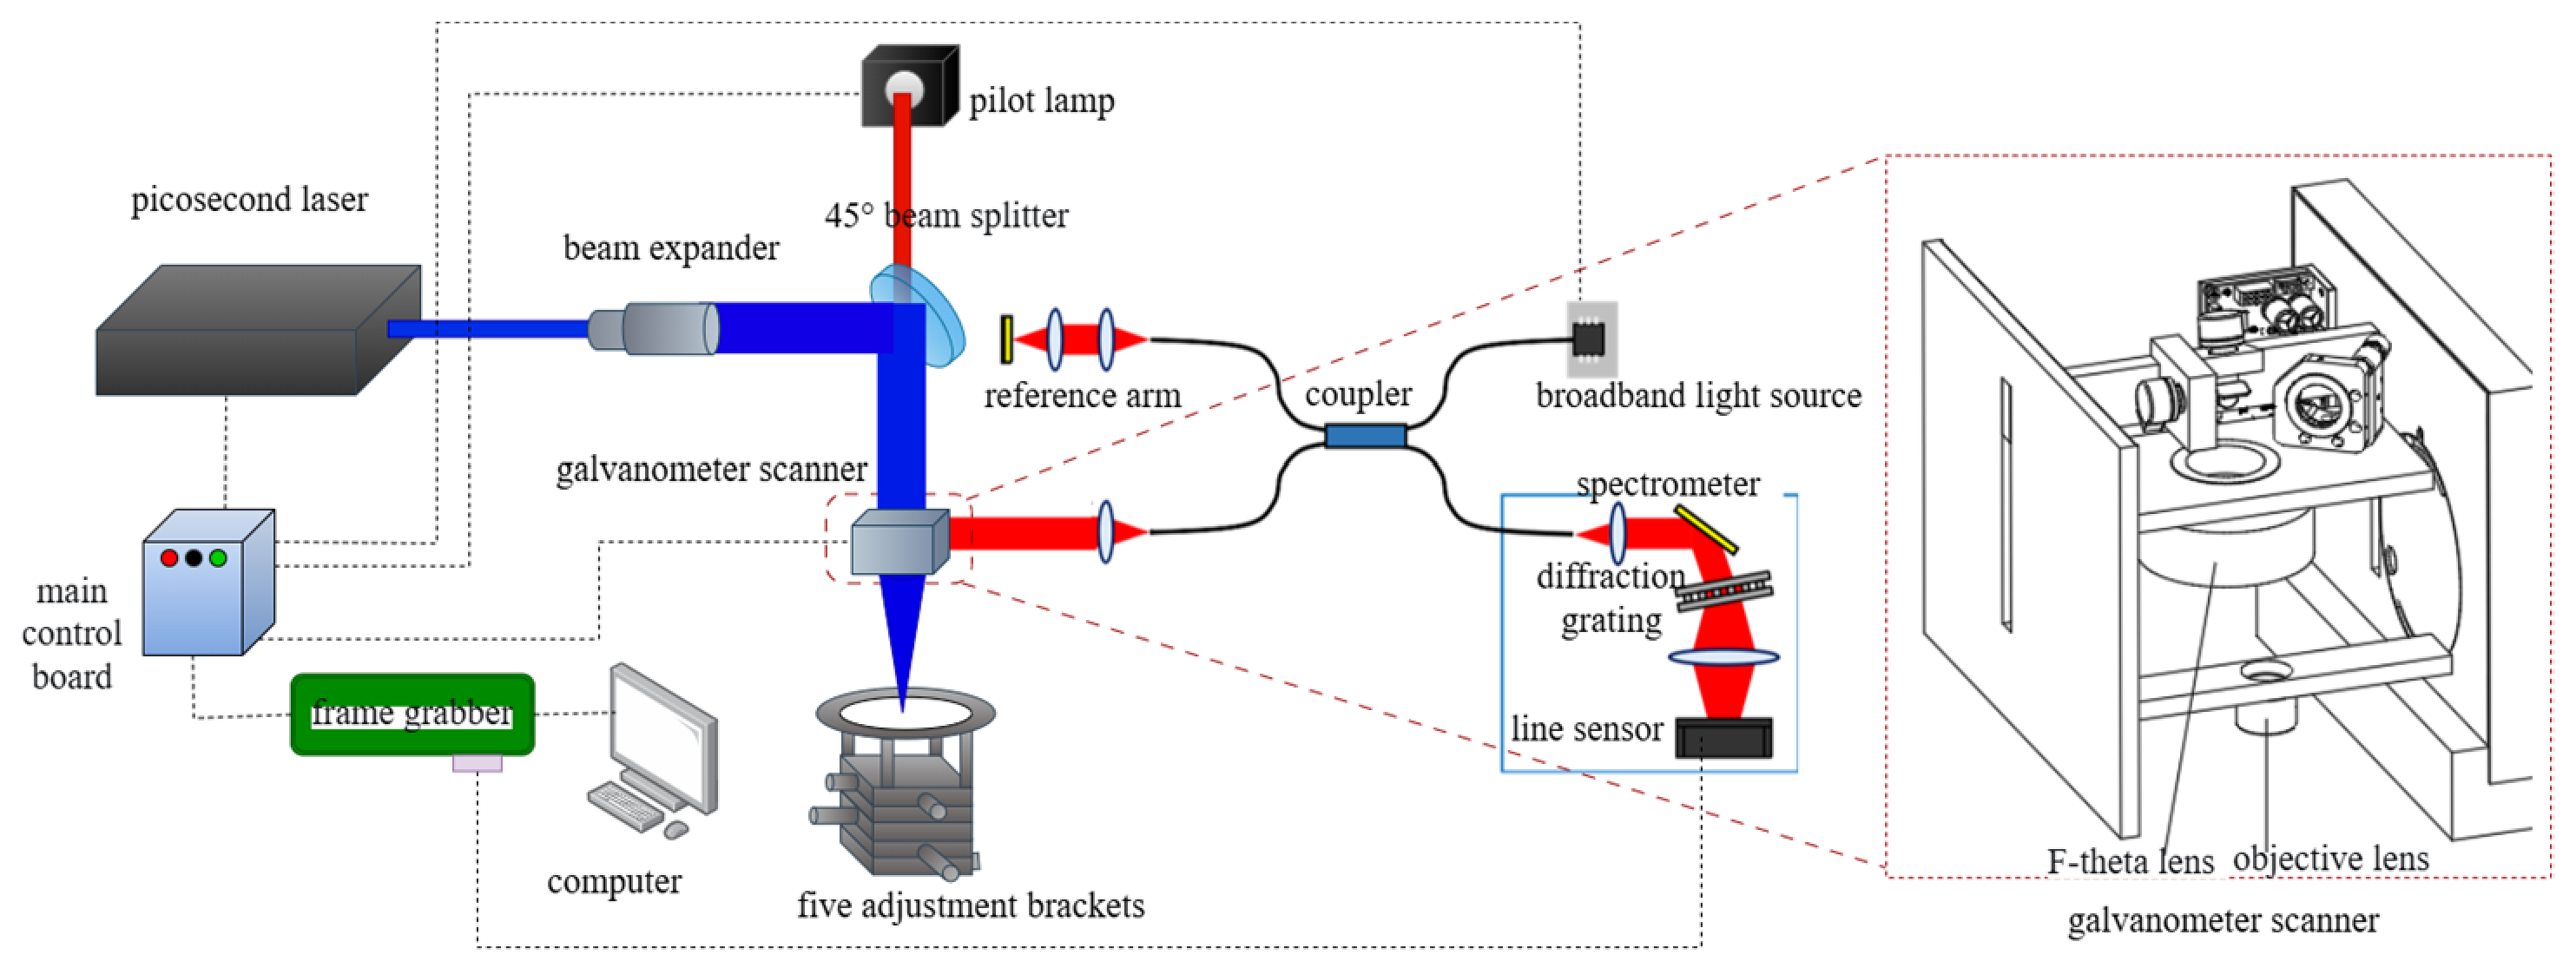
The picosecond laser processing and detection system constructed in this study is shown in Figure 1. It mainly consists of an ultraviolet picosecond laser processing module and an SD-OCT detection module.
Figure 1.
Schematic of the picosecond laser helical drilling and SD-OCT detection system.
An ultraviolet picosecond laser (Topaz 355-30N, BWT Beijing Ltd., Beijing, China) with a wavelength of 355 nm, pulse duration of 10 ps, average power of 0–30 W, and repetition rate of 10–2000 kHz was used. After beam expansion, the spot diameter increased from 2.5 mm to approximately 8 mm. The beam was focused by an f-theta lens (LINOS 4401-509-000-21, Qioptiq Photonics GmbH & Co. KG, Göttingen, Germany) onto a suspended 4-inch wafer processing platform mounted on a five-dimensional adjustment stage. The microhole processing path was controlled by a control board (EZCAD 3.0, Beijing JCZ Technology Co., Ltd., Beijing, China). A metallurgical microscope (MIT500, Chongqing Optec Optical Instrument Co., Ltd., Chongqing, China) and a three-dimensional confocal white-light interferometer (S neox 090, Sensofar-Tech, S.L., Terrassa, Spain) were used to measure the top and bottom surface diameters of the microholes, obtain sidewall angles, and calibrate and verify the taper.
The coherent-detection SD-OCT system (Accipiter series, Tianjin PWTIN Optoelectronics Technology Co., Ltd., Tianjin, China) mainly consists of a superluminescent diode (SLD), 50:50 single-mode fiber coupler, spectrometer, reference arm, and sample arm. The SLD had a central wavelength of 840 nm and a full width at half maximum (FWHM) of 45 nm. The light was split into two beams by the fiber coupler. Interference signals generated by the reference and sample arms were detected by the spectrometer for depth information extraction. The axial and lateral resolutions of the system were 8 μm and 10 μm, respectively. The maximum measurement range was 5 mm × 5 mm, and the depth measurement deviation was ±10 μm. During scanning, a 1 mm × 1 mm scan area corresponded to 1000 × 1000 sampled pixels, with pixel resolutions of 1 μm/pixel in both the x and y directions and 4.9 μm/pixel in the z (depth) direction. Because the processing f-theta lens and the detection focusing objective could not be shared, the processing and detection optical paths could not be fully coaxial. Therefore, a switching scheme between the f-theta lens and the focusing objective was adopted. The processing beam path entered the scanning galvanometer through a 45° mirror, whereas the detection beam path entered the scanning galvanometer directly. The wafer processing and SD-OCT detection system, including the scanning galvanometer module, is shown in Figure 1. Accordingly, each SD-OCT volume was acquired after the corresponding processing step, with the wafer remaining on the platform, and no measurement was performed while the laser was emitting.
2.3. Experimental Scheme
The microhole taper was calculated from the measured top and bottom surface diameters and the material thickness, as given by Equation (1):
where du and dp are the entrance and exit diameters of the microhole, respectively, and is the material thickness.
For the helical drilling path scheme, a full-factorial design was adopted. At a repetition rate of 200 kHz, the power range was divided into two intervals, 3–12 W and 13–28 W, as listed in Table 1.
Table 1.
Factor levels for the helical processing path experiments.
The design is a partitioned full factorial. With four levels of repetition rate, eight levels of power, four levels of scanning speed and four levels of number of scans, the complete design would comprise 4 × 8 × 4 × 4 = 512 combinations. Because the attainable power depends on the repetition rate, the eight power levels were executed as two blocks of four, namely 3, 6, 9 and 12 W (256 combinations) and 13, 18, 23 and 28 W (256 combinations). In the high-power block, the 200 kHz level produced no measurable through-hole under any setting of the other three factors, so this level was removed and 192 combinations were retained; the number of valid data sets is therefore 256 + 192 = 448. For each combination, three replicate holes were drilled and measured, the taper of every hole was calculated from Equation (1), and the arithmetic mean of the three values was used as the response in the range analysis, the ANOVA and the regression, with their standard deviation taken as the within-combination variability. A combination was rejected and is absent from the 448 data sets when no through-hole was formed, so that an exit diameter could not be defined, or when the exit opening was obscured by spatter or by an adherent recast layer that prevented the contour from being read at the 1 μm resolution of the microscope. All drilling and all diameter readings were carried out by the same operator on the same instruments, and each diameter was taken as the mean of the long and short axes of the fitted contour.
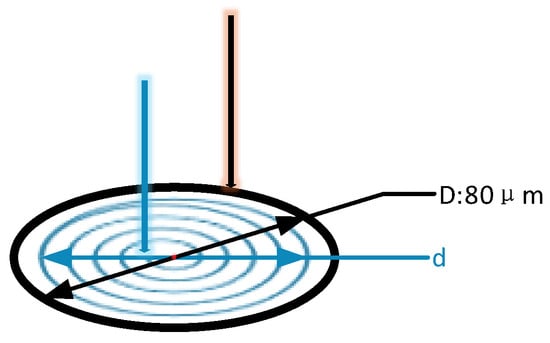
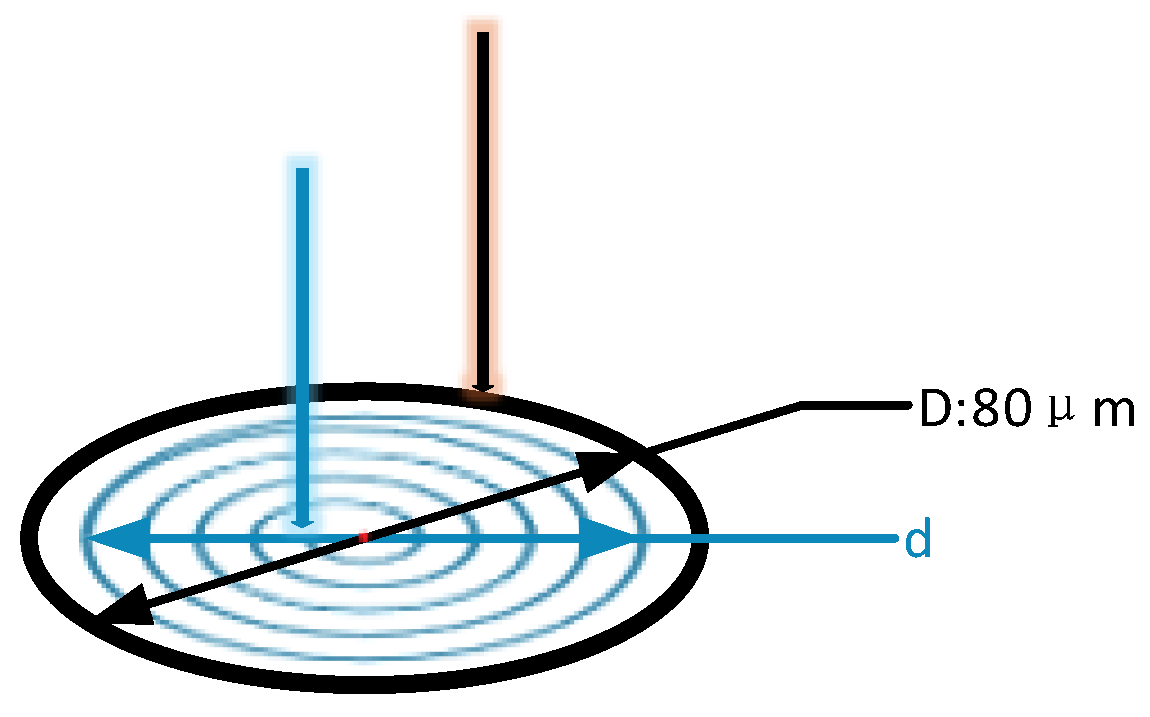
In the hybrid path design, the spiral diameter d was used as a variable parameter, while the trepanning diameter D was fixed at 80 μm, as shown in Figure 2.
Figure 2.
Schematic of hybrid path machining.
Based on the optimized helical process parameters, single-factor experiments were performed in triplicate, as listed in Table 2.
Table 2.
Factor levels for the hybrid path experiments.
3. Results and Discussion
3.1. Analysis of Full-Factorial Experimental Results
3.1.1. Microhole Taper Analysis
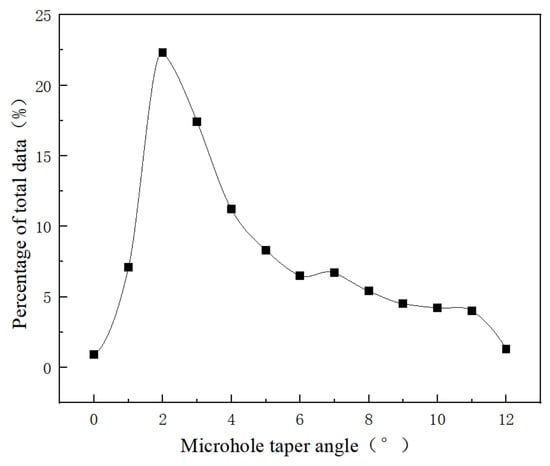
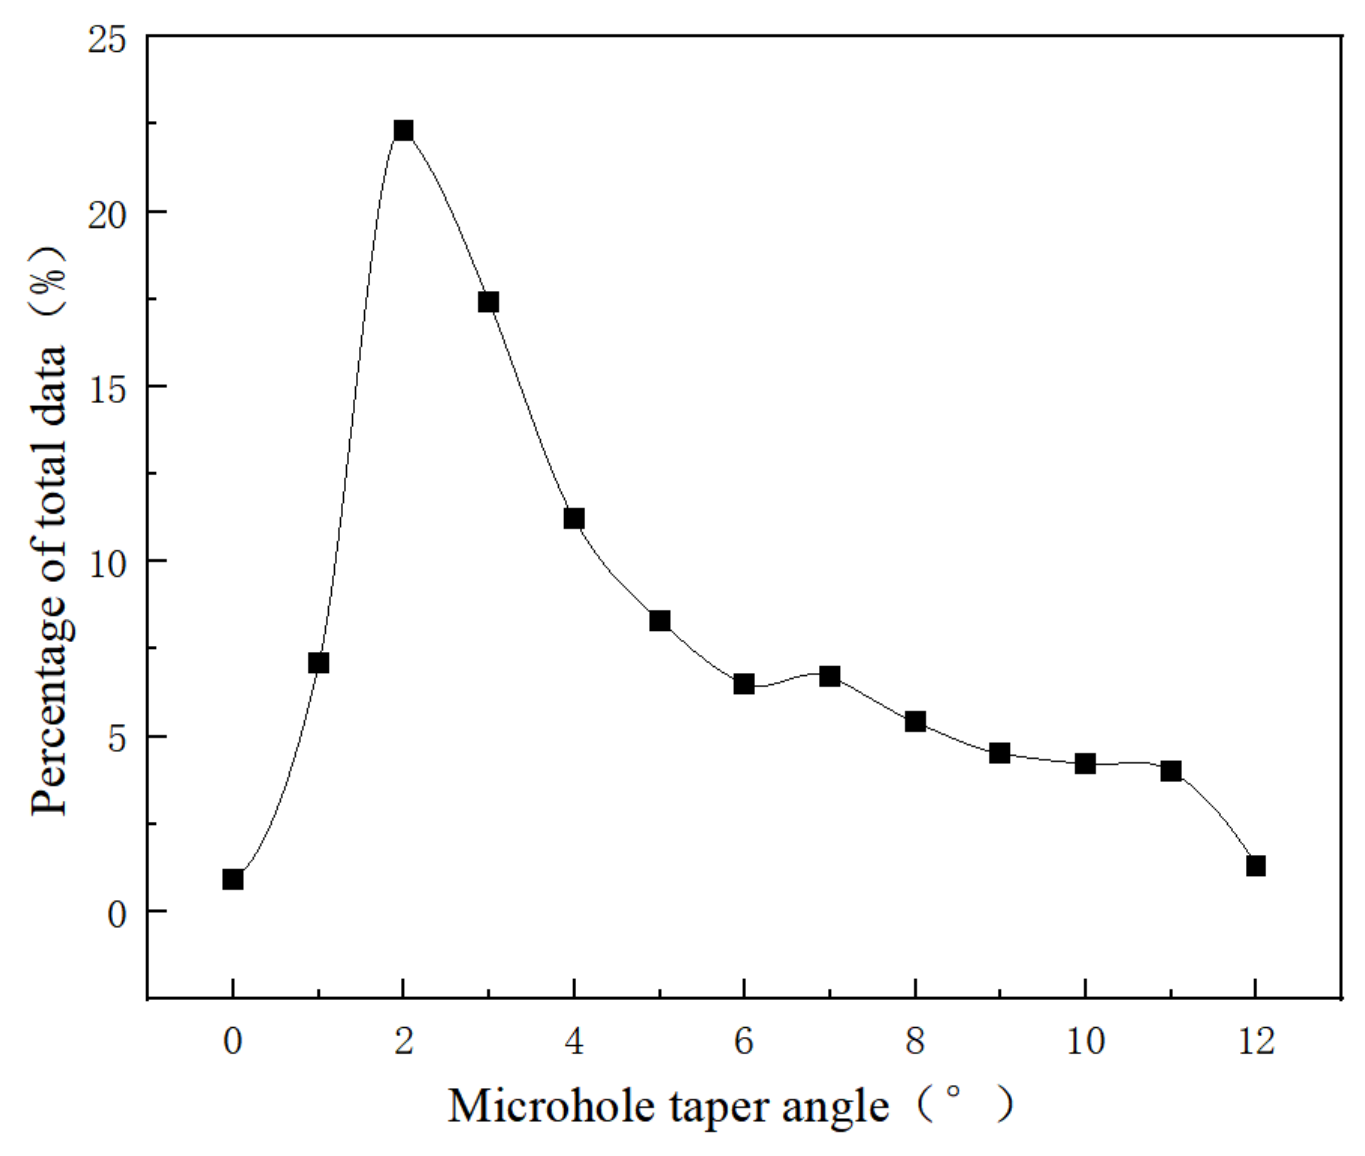
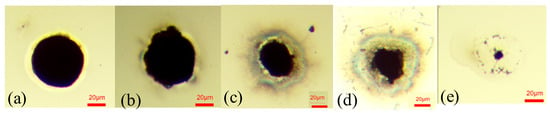
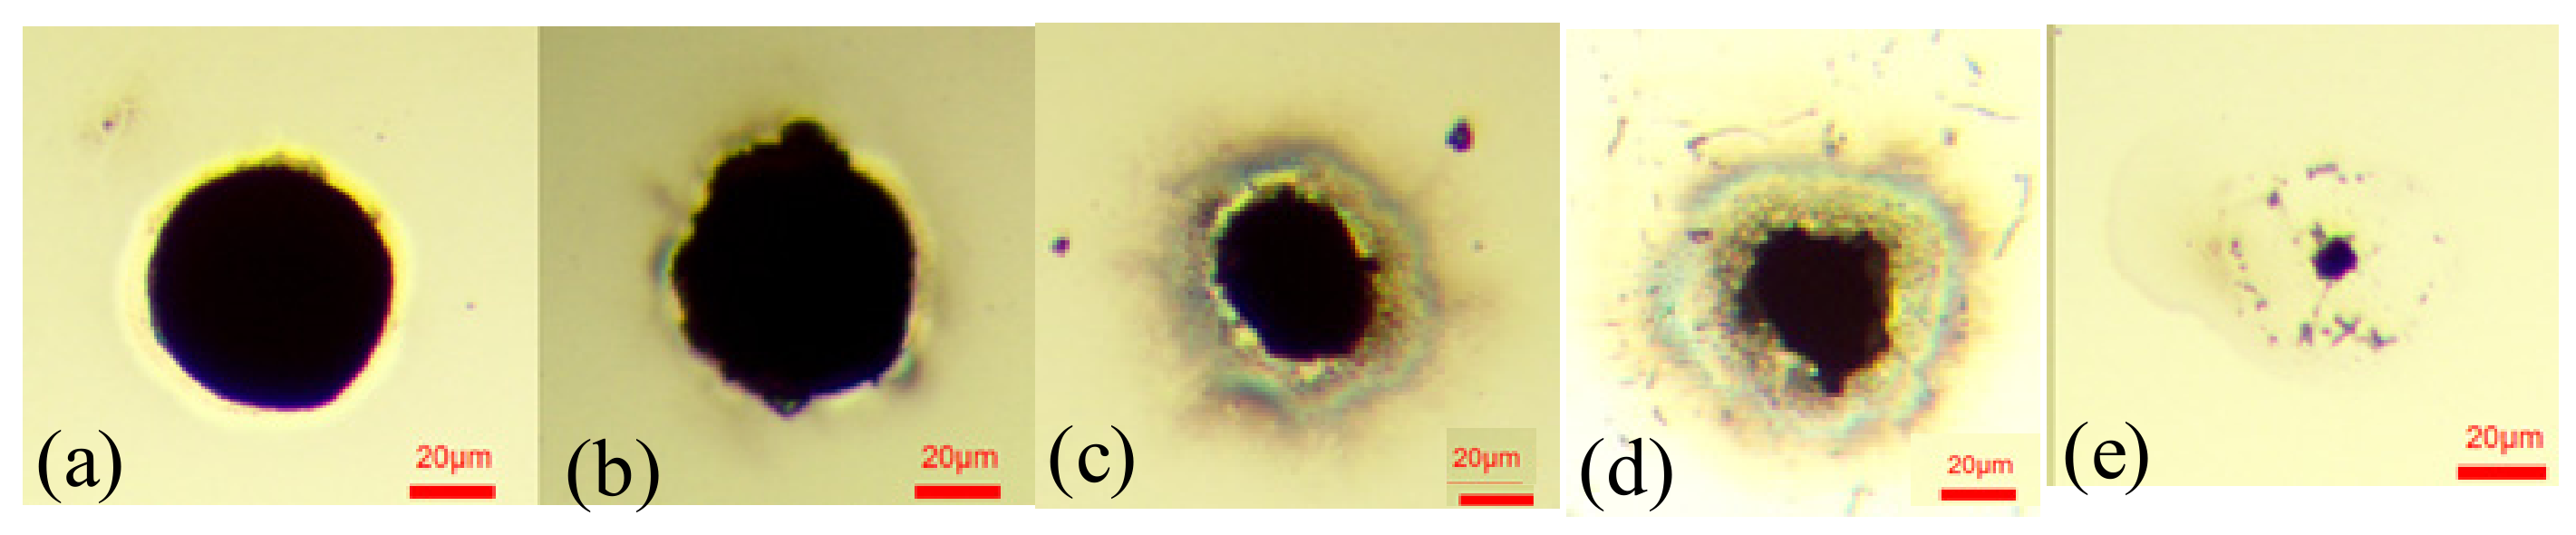
As shown in Figure 3, microholes with taper angles between 2° and 3° account for the highest proportion, indicating that the process parameter combinations tend to produce microholes with moderate taper. To further reveal the direct influence of taper on microhole forming quality, Figure 4 presents representative exit morphologies of microholes in different taper ranges.
Figure 3.
Taper distribution in microhole machining experiments with different processes.
Figure 4.
Microhole exit morphologies in different taper ranges: (a) 0–1°, (b) 2–4°, (c) 5–6°, (d) 7–9°, and (e) above 10°.
A clear morphological evolution can be observed in Figure 4. As shown in Figure 4a, when the taper is less than 1°, the microhole exit is a standard circle with smooth, sharp edges and no visible burrs or chipping. As shown in Figure 4b, when the taper increases to 2–4°, small burrs and molten material residues begin to appear at the edges, reflecting that for process parameter combinations with insufficient effective laser energy at the exit side, the exit opening is not fully expanded; in extreme cases, an effective through-hole cannot be formed. As shown in Figure 4c, at 5–6°, the exit shape begins to distort and circularity decreases. As shown in Figure 4d, at 7–9°, an obvious heat-affected zone and material spalling appear at the exit edge. As shown in Figure 4e, when the taper exceeds 10°, an effective through-hole cannot even be formed, and only irregular ablation traces remain at the exit.
3.1.2. Range Analysis of Microhole Experimental Results
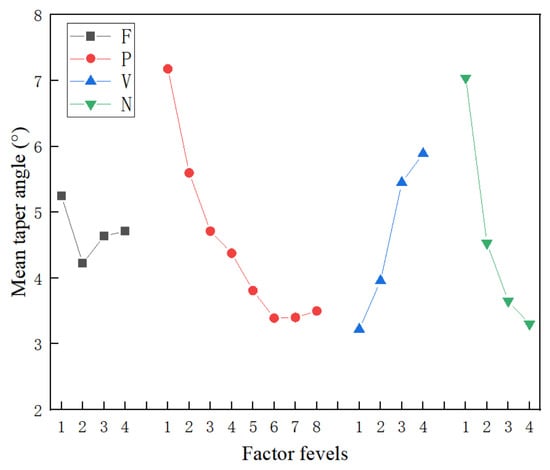
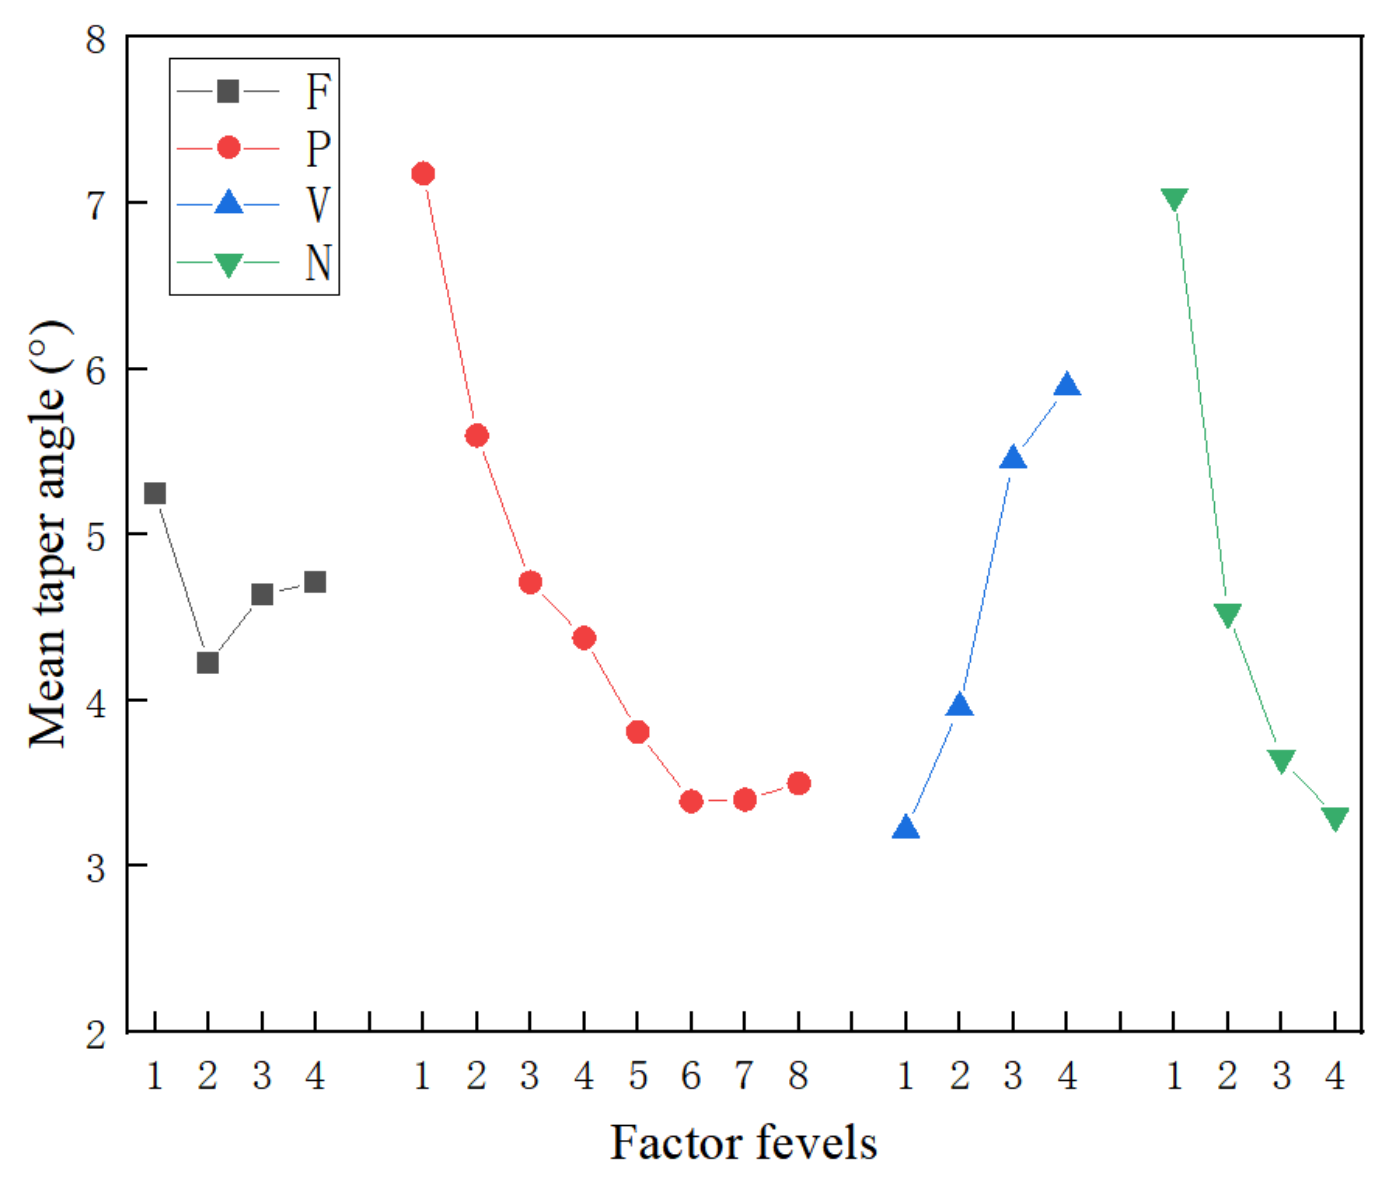
Figure 5 illustrates the main effects of various parameters on the taper angle. The detailed range analysis results are summarized in Table 3. Through range analysis, the calculated range (R) values for power, number of scans, scanning speed, and repetition rate are 3.78, 3.74, 2.67, and 1.03, respectively. Since a larger R value indicates a greater influence, the results show that the significance order of these factors on taper is as follows: power > number of scans > scanning speed > repetition rate.
Figure 5.
Main effects plot of the mean taper angle for different laser parameters. F: repetition rate; P: laser power; V: scanning speed; N: number of scans.
Table 3.
Mean values of each factor level and range analysis.
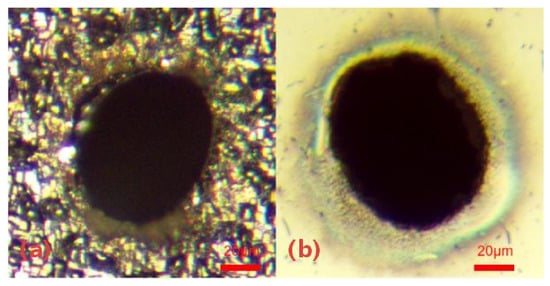
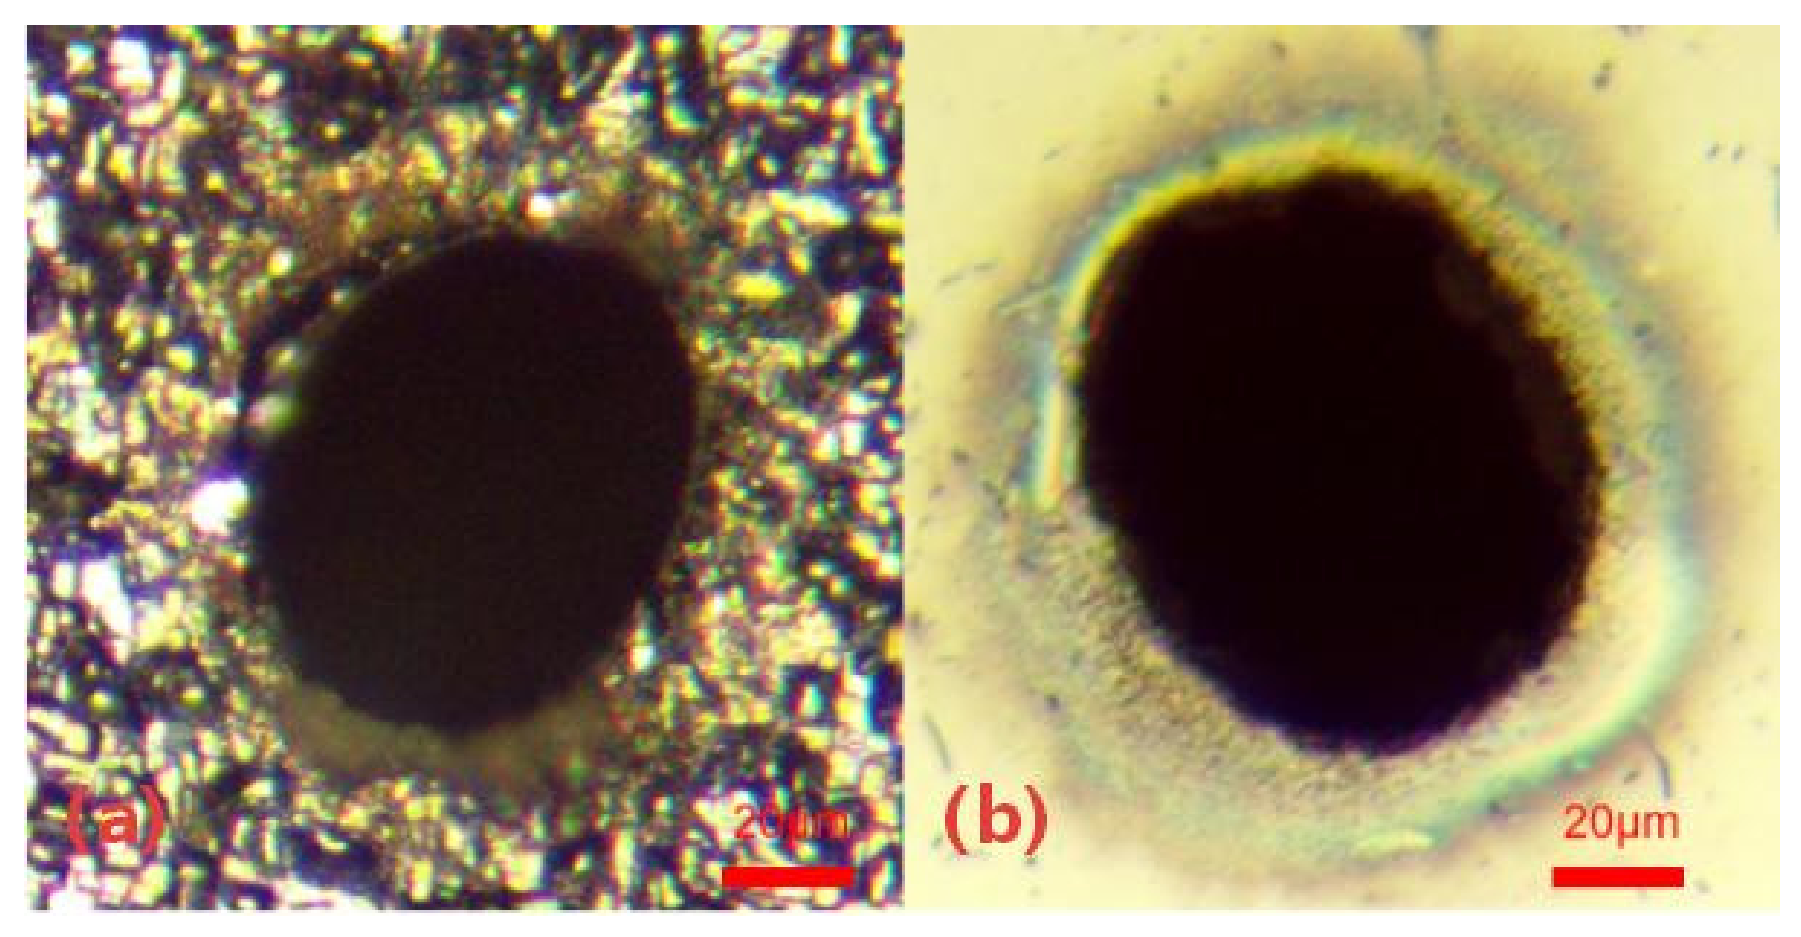
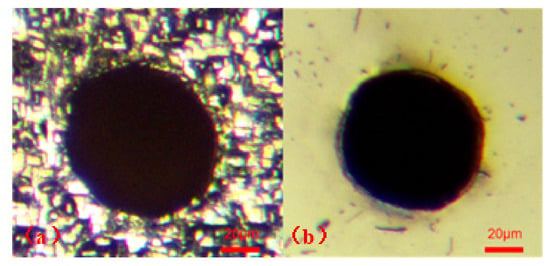
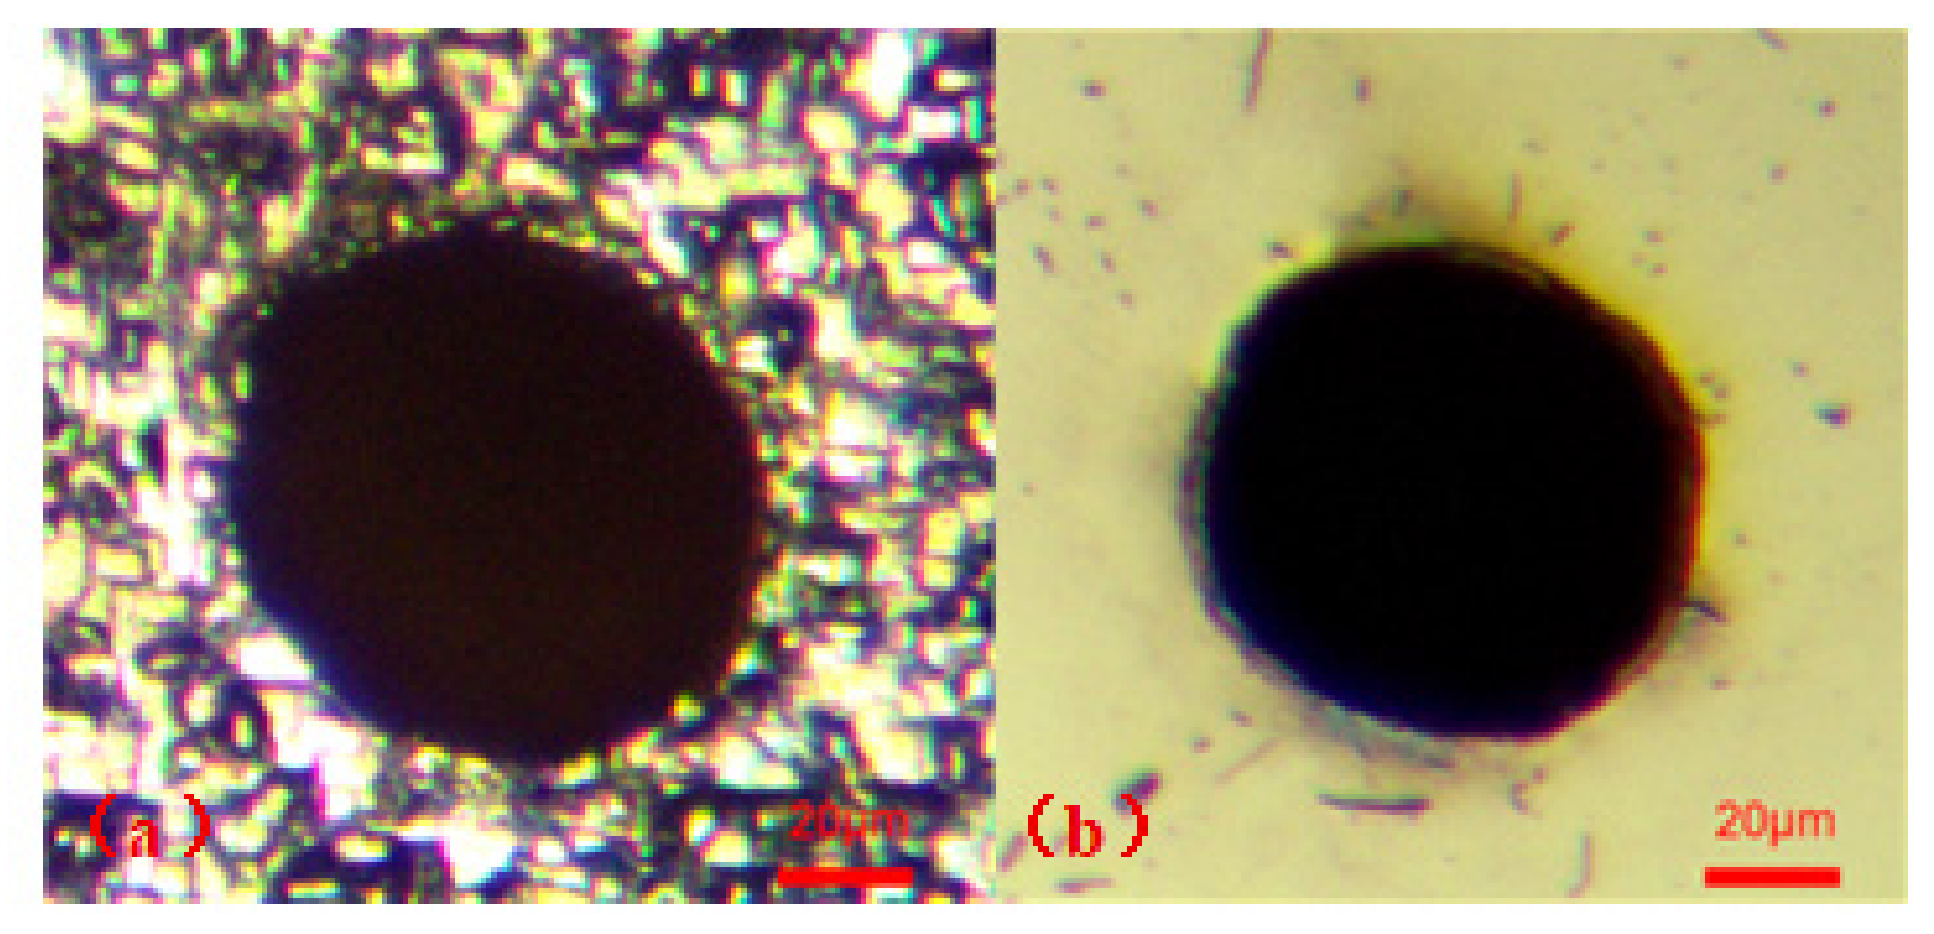
Figure 5 shows that power is the most influential factor affecting taper. The removal mechanisms discussed below were not observed directly because no time-resolved imaging, shadowgraphy or plume emission spectroscopy was performed. They are inferred from the exit morphologies grouped by taper in Figure 4 and from the parameter–taper trends, using previous studies [21,22] to discriminate between competing explanations. Figure 4 shows a clear morphological sequence as the taper increases. Figure 4a shows a smooth, sharp-edged circular exit for taper values below 1°, whereas burrs, molten residues and an incompletely opened aperture appear at taper values of 2–4° in Figure 4b. At taper values of 5–6°, the exit distorts and loses circularity in Figure 4c, and a heat-affected zone with material spalling becomes visible at the rim at taper values of 7–9° in Figure 4d. Above 10°, no effective through-hole forms, leaving only irregular ablation traces in Figure 4e. A large taper therefore corresponds to insufficient effective energy at the exit side and inefficient melt expulsion. Three regimes are accordingly inferred, namely melt-dominated removal with inefficient ejection at low power, vapor and recoil pressure-assisted removal at intermediate power, and shielding-limited energy transfer at high power. Quantitative confirmation would require pump–probe shadowgraphy or plume emission spectroscopy, and this is left to future work. The microhole machined at 400 kHz, 18 W, 10 mm/s, and 100 scans is shown in Figure 6. Its taper is 2°, although pronounced spatter remains at the entrance edge. This indicates that determining the optimal parameters solely by range analysis is still insufficient in terms of morphological quality, and further optimization through regression analysis is needed.
Figure 6.
Inlet and outlet morphologies of the microhole machined with the parameter combination determined by range analysis (F = 400 kHz, P = 18 W, V = 10 mm/s, N = 100). (a) Entrance; (b) exit.
3.1.3. Multivariate Nonlinear Regression Analysis
A second-order polynomial regression model was used to fit the full-factorial experimental data so as to more precisely reveal the effects of interactions among multiple parameters on the experimental results. The second-order regression model is constructed as given by Equation (2):
In Equation (2), x1, x2, x3 and x4 are the repetition rate F in kHz, the power P in W, the scanning speed V in mm/s and the number of scans N, respectively, entered in their original physical units. No coding or normalization was applied to the independent variables before regression. Their investigated ranges are F = 200 to 800, P = 3 to 28, V = 10 to 400 and N = 10 to 100. The coefficients are given in Table 4.
Table 4.
Regression coefficients of Equation (2), with Value being the standardized coefficient.
The regression was performed in IBM SPSS Statistics 25.0 on the 448 valid combinations described in Section 2.3, each taper value being the mean of three replicate holes, and the quadratic and interaction terms were computed from the physical values before import. Because the variables were not coded, every coefficient in Table 4 is tied to the physical units of its term. The model was optimized with the L-BFGS-B algorithm by minimizing the absolute value of the taper predicted by Equation (2), since a taper approaching zero is desired. The only constraints were the box bounds given by the four experimental ranges, namely 200 ≤ x1 ≤ 800, 3 ≤ x2 ≤ 28, 10 ≤ x3 ≤ 400 and 10 ≤ x4 ≤ 100. L-BFGS-B handles bound constraints directly, so no penalty terms were required. The continuous solution was rounded to machinable integer settings, giving F = 498 kHz, P = 15 W, V = 203 mm/s and N = 50, all inside the bounds. Whether this combination still yields a through-hole was checked experimentally after optimization and was not imposed as a constraint.
As shown in Table 4, the standardized interaction coefficient a23 is −0.437, so the effect of power on the taper depends on the scanning speed rather than being additive. The model was fitted to the 448 valid data sets described in Section 2.3 (256 in the 3–12 W block and 192 in the 13–28 W block), each of which is the mean of three replicate holes. SPSS gave a multiple correlation coefficient R = 0.896, a coefficient of determination R2 = 0.802 and an adjusted R2 = 0.796. Power, scanning speed and number of scans had significant effects on the taper (p < 0.001), whereas repetition rate did not (p = 0.838), which is consistent with the range analysis in Section 3.1.2. Validation experiments at F = 498 kHz, P = 15 W, V = 203 mm/s and N = 50 gave an average taper of 0.90°, and the corresponding morphology is shown in Figure 7.
Figure 7.
Entrance and exit morphologies of microholes under the parameter combination determined by multivariate nonlinear regression analysis (F = 498 kHz, P = 15 W, V = 203 mm/s, N = 50). (a) Entrance; (b) exit.
3.2. Experimental Results and Analysis of Hybrid Path Machining
The purpose of the helical and trepanning hybrid path process is to further reduce taper by precision-finishing the sidewalls of microholes through the trepanning path. Single-factor experiments were conducted using the helical drilling process parameters as a reference. Under the hybrid path, the spiral diameter was 60 μm and the trepanning diameter was 80 μm. The results are shown in Figure 8.
Figure 8.
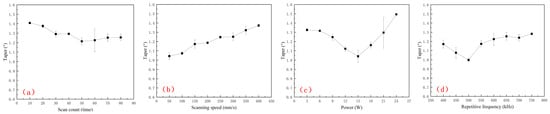
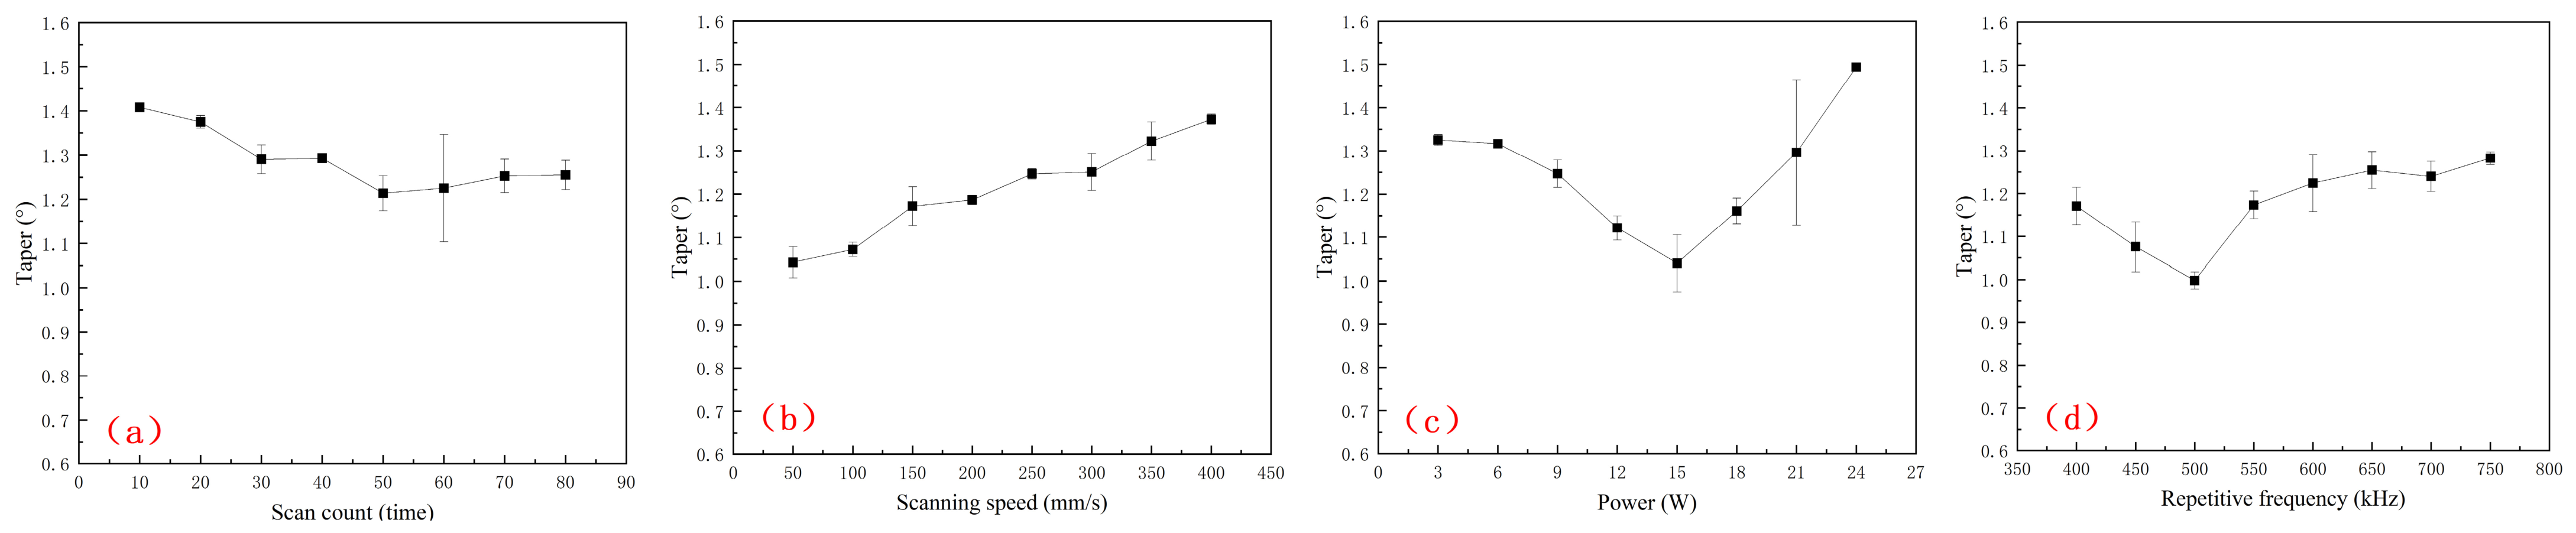
Effect of trepanning parameters on hole taper: (a) repetition rate 498 kHz, power 15 W, scanning speed 203 mm/s; (b) repetition rate 498 kHz, power 15 W, number of scans 50; (c) repetition rate 498 kHz, number of scans 50, scanning speed 50 mm/s; (d) power 15 W, number of scans 50, scanning speed 50 mm/s.
Figure 8 reflects the influence of trepanning parameters on hole taper. (a) The taper decreases with increasing number of trepanning scans, reaching a minimum of 1.2° at 50 scans; in the range of 50–80 scans, the improvement slows and fluctuations increase. (b) The taper is significantly positively correlated with scanning speed, with a minimum of 1.0° at 50 mm/s; when the speed increases to 400 mm/s, the taper increases by 40%. (c) The taper first decreases and then increases with power, reaching a minimum of 1.0° at 15 W; fluctuations are small in the 3–12 W range and increase significantly in the 18–24 W range. (d) The taper also first decreases and then increases with repetition rate, reaching a minimum of 1.0° at 500 kHz and tending to level off after 550 kHz. The optimal parameter combination for the trepanning process in the hybrid path is as follows: number of scans 50, scanning speed 50 mm/s, power 15 W, and repetition rate 500 kHz. The influence of spiral diameter variation on the hybrid path machining effect was studied, as shown in Figure 9.
Figure 9.
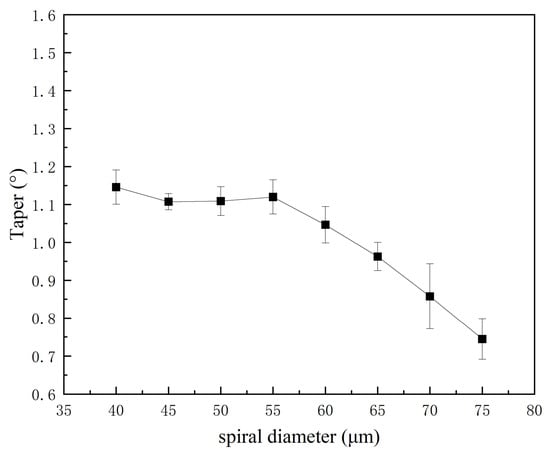
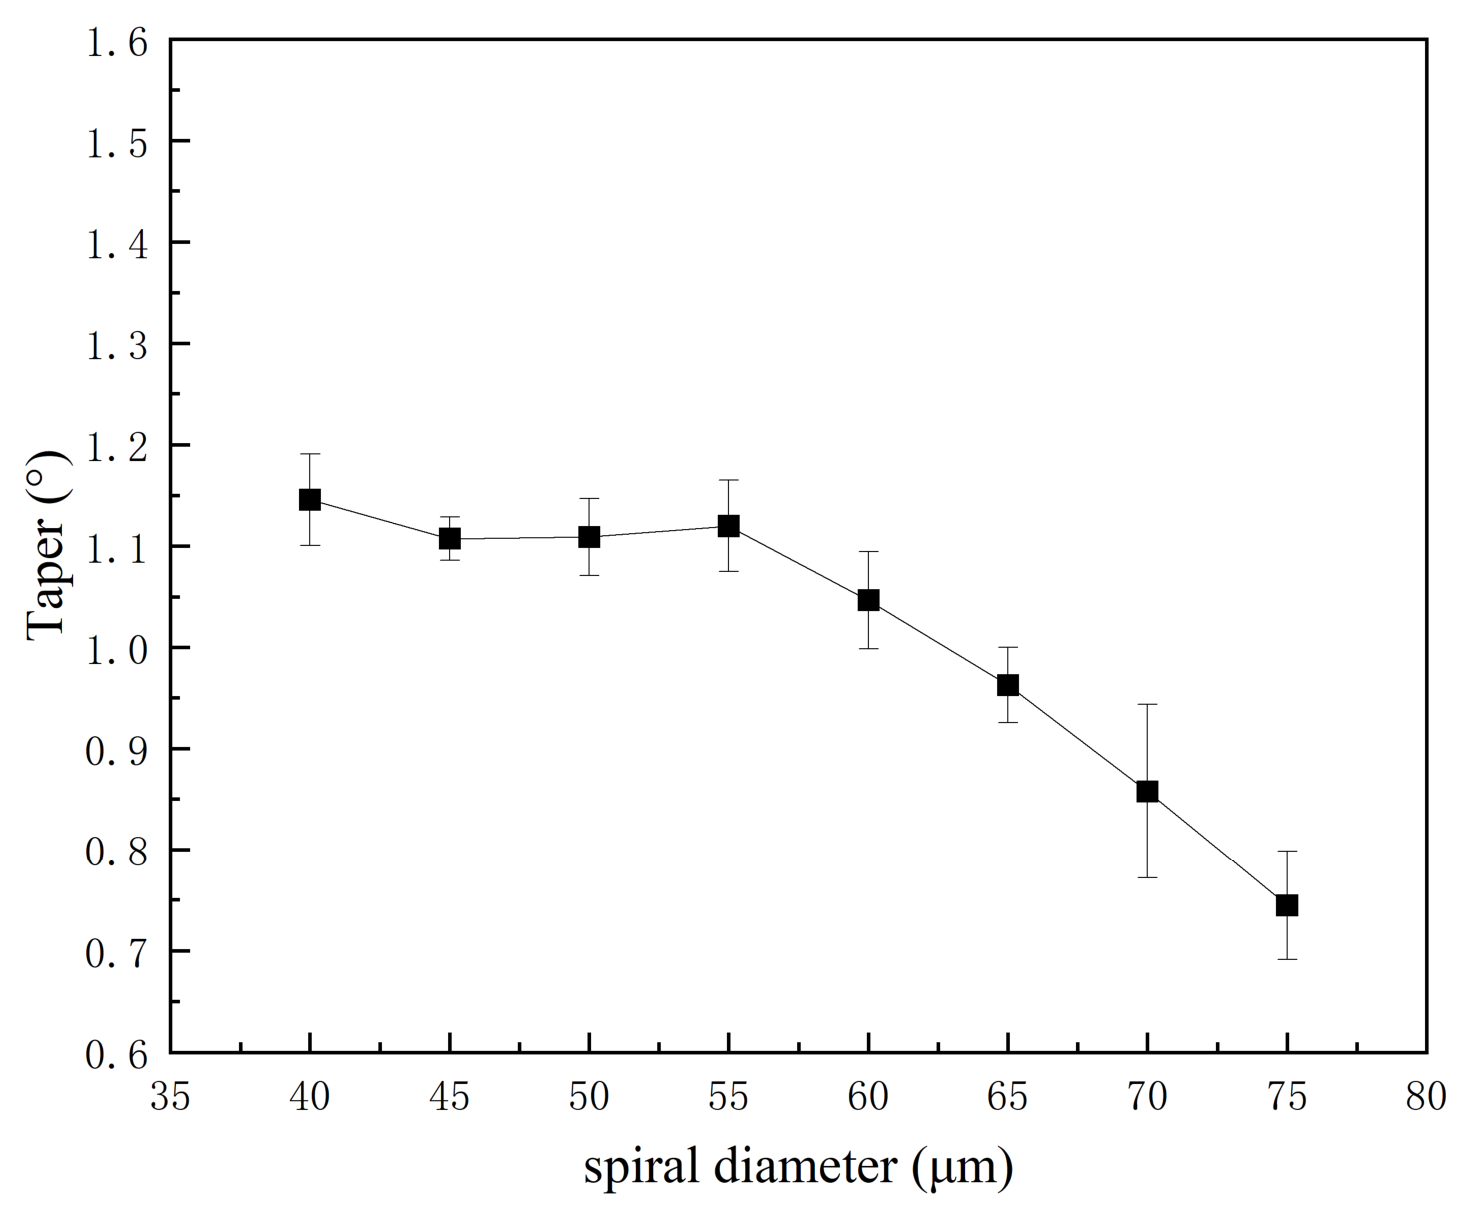
Relationship between spiral diameter and microhole taper.
Figure 9 shows that when the spiral diameter increases from 40 μm to 75 μm, the taper decreases overall, from 1.15° to 0.74° ± 0.05°, with a plateau between 45 and 55 μm where the values remain within one standard deviation of each other; the value obtained at 75 μm is the lowest of the series and the lowest measured in this study. The single-path helical reference with 498 kHz, 15 W, 203 mm/s, 50 scans, measured under the same conditions, with the same instrument and the same diameter definition, gave 0.90°. The composite path therefore reduces the mean taper by 0.16°, i.e., by 17.8%.
3.3. Coherent Detection Analysis of Microhole Taper
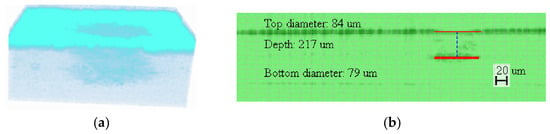
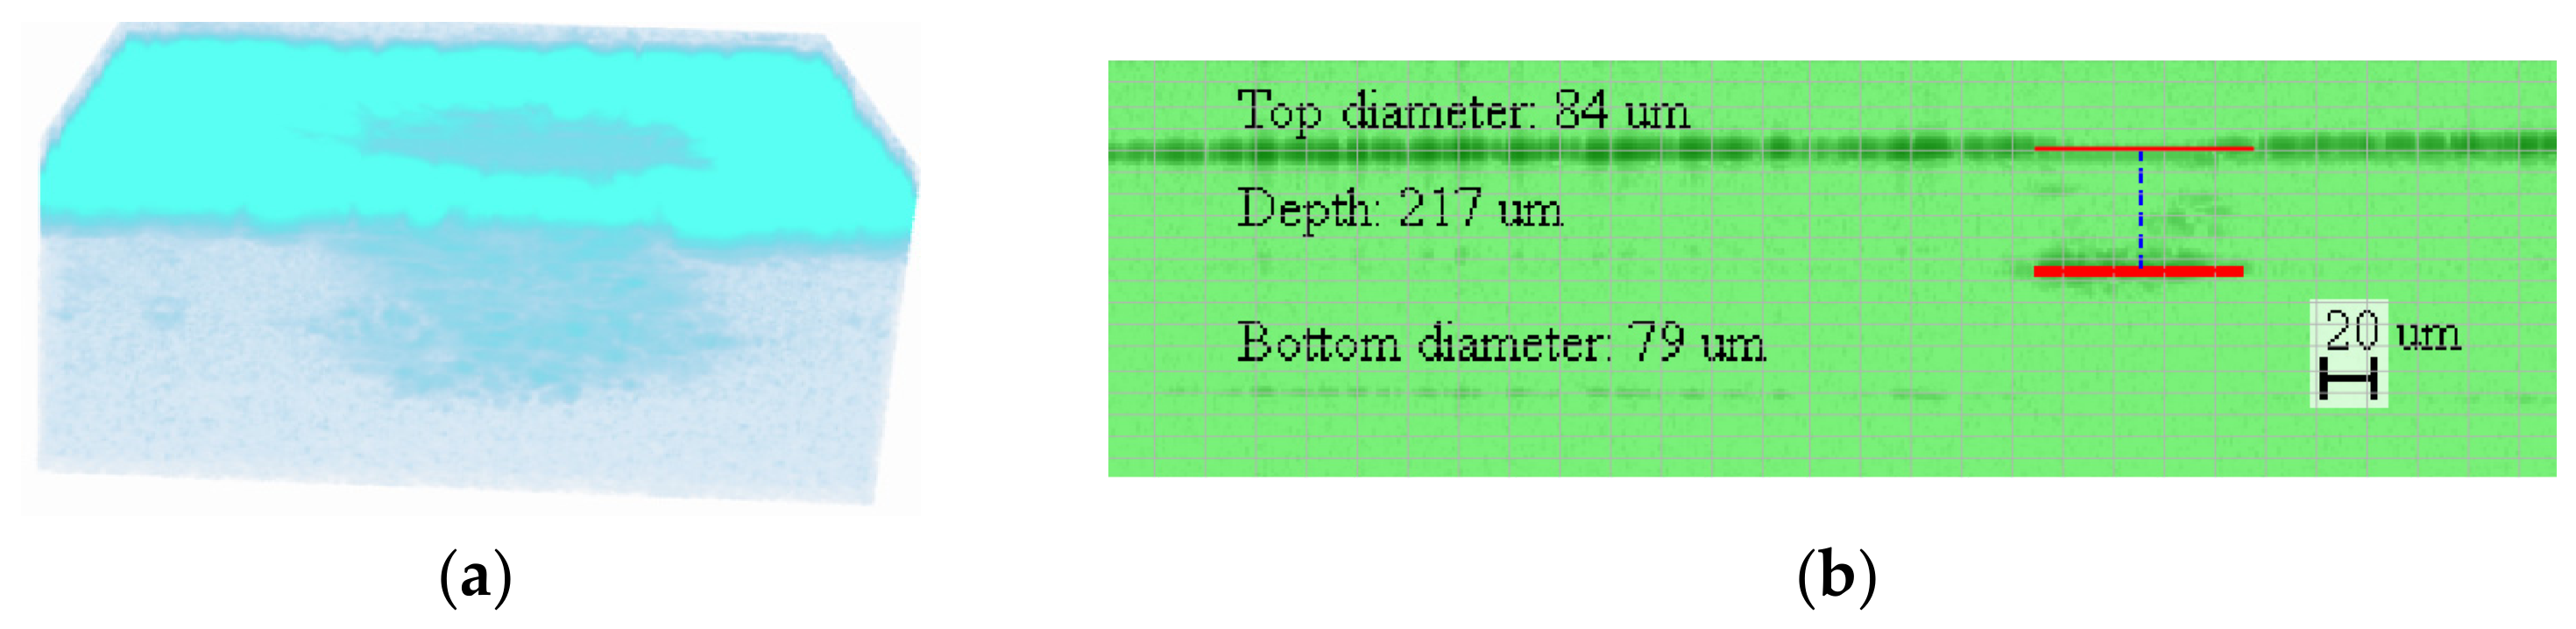
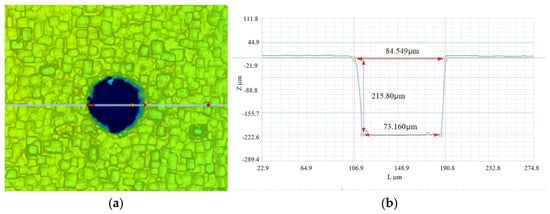
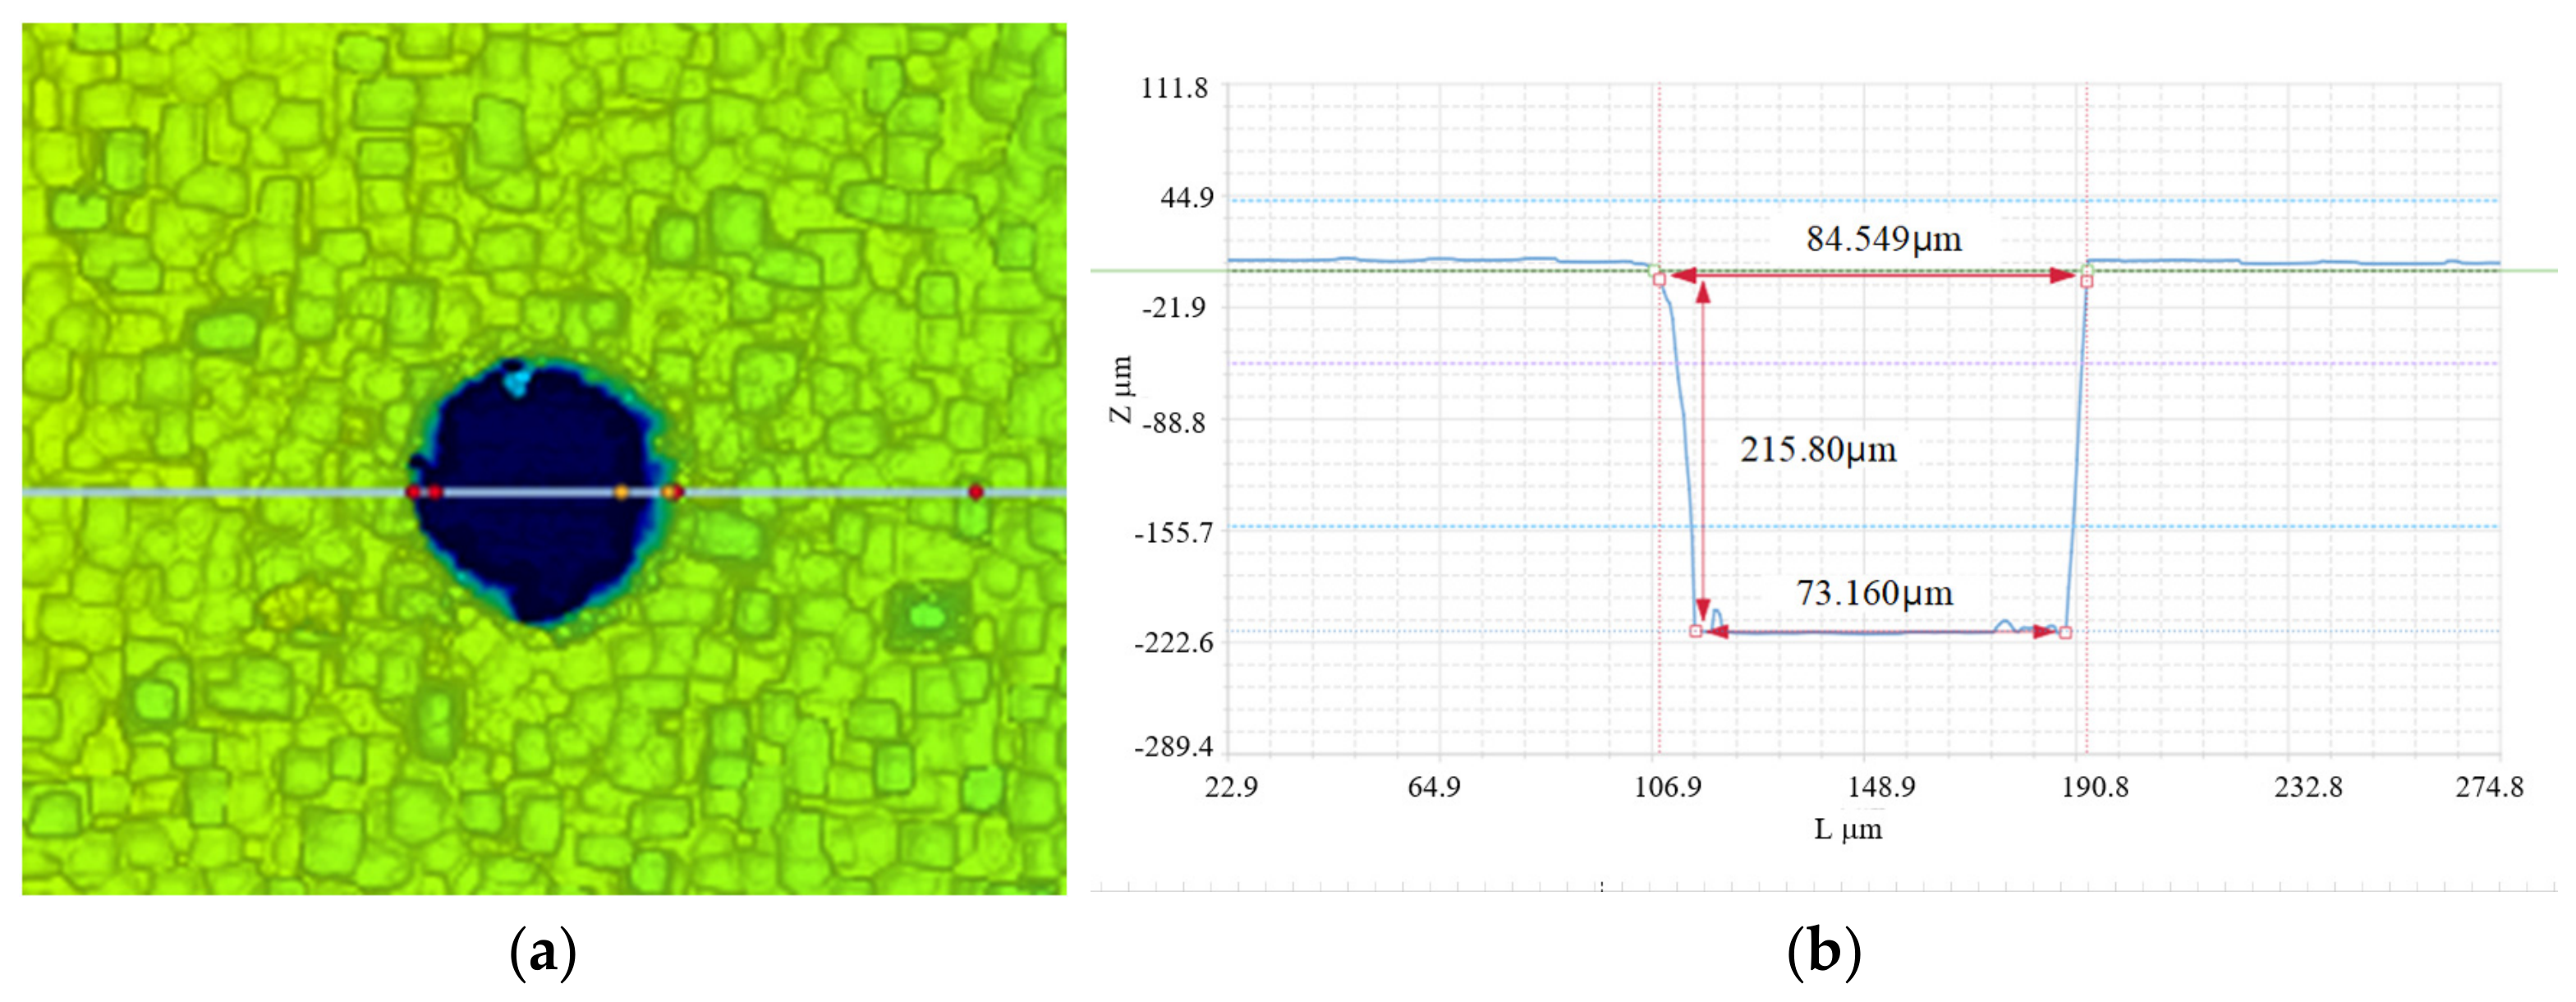
To evaluate the measurement performance of microhole taper in hybrid path machining, SD-OCT, a 3D optical profilometer and a metallurgical microscope were used. The microhole produced with the 75 µm helical and 80 µm trepanning hybrid path was measured by OCT and the 3D profilometer. Figure 10 shows the 3D and side views rendered from the OCT volume, and Figure 11 shows the top and side views measured by the 3D profilometer.
Figure 10.
OCT reconstruction measurement of the microhole structure of the 75 μm helical and 80 μm trepanning hybrid path: (a) 3D view of the microhole sidewall profile. The color map represents the depth/reflection intensity, where cyan indicates the top surface and light blue indicates the inner sidewall and bottom of the microhole and (b) side view.
Figure 11.
3D profilometer measurement of the microhole structure of the 75 μm helical and 80 μm trepanning hybrid path: (a) top view and (b) side view.
Both apertures were read from a single C-scan volume. Each A-scan was k-linearized, windowed and Fourier-transformed to form the intensity volume. The volume was levelled on the first above-threshold interface so that the hole axis coincided with the z direction, and wavelet denoising was applied. An adaptive threshold then located the entrance and exit surface signal lines. Six cross-sectional B-scans passing through the hole center were selected after the center had been located from the same volume. In each section, the bore appeared as a signal void inside the continuous reflection band, and the first crossing pixel of the adaptive threshold on each side of the void defined the two edges. The entrance void was dark because little light returned from the bore, while the exit void was bright because the exit face rested on a diffuse reflector. The lateral width of the void is a two-point chord length. No closed contour was extracted and no circle or ellipse was fitted. The mean of the six sections was taken as the aperture. The wafer thickness is quoted by the supplier as a nominal 200 µm and varies between wafers and across a single wafer. Using a single nominal value would introduce a sample-dependent systematic error. The thickness of each specimen was therefore measured from the same OCT volume as the axial separation between the entrance and exit surface signal lines and used as s in Equation (1).
From the top view in Figure 11, local defects can be observed in the edge contour of the microhole on the upper surface. SD-OCT can scan the point cloud data reflected from the internal sidewalls; however, factors such as sidewall back-reflection and occlusion limit the measurement accuracy of the microhole contour.
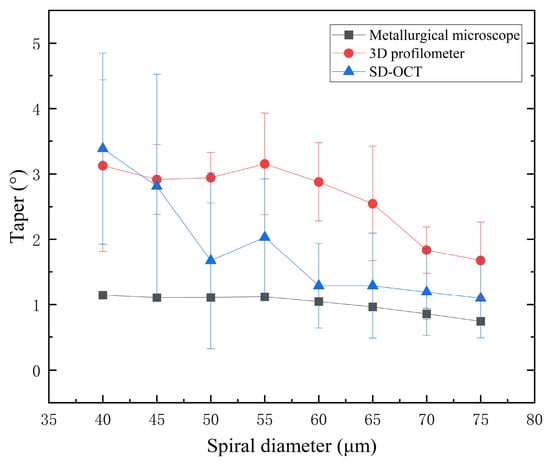
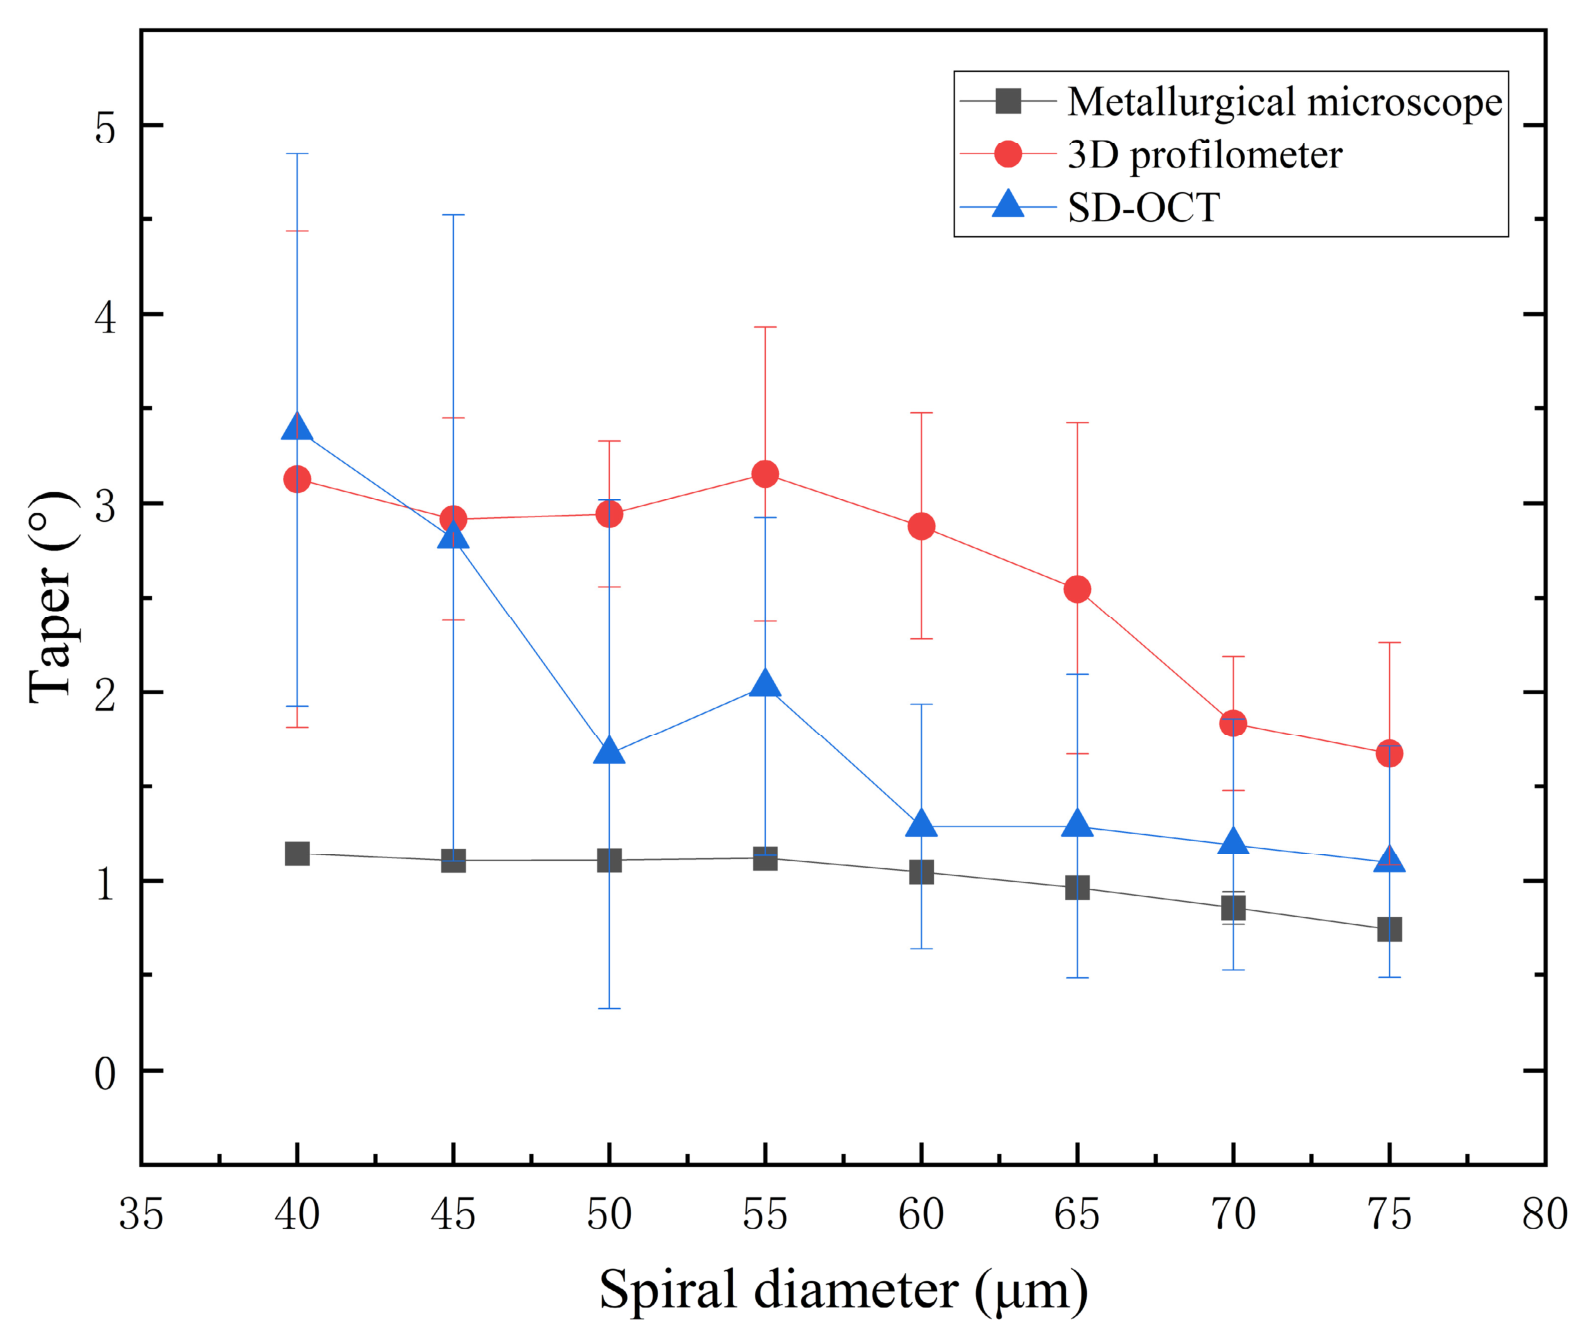
Figure 12 compares the taper from SD-OCT, a 3D optical profilometer and metallurgical microscopy at eight spiral diameters. The SD-OCT and profilometer curves share the same decreasing trend, while the microscope values span 0.68° to 1.19° with a weaker dependence and serve only as an auxiliary reference. Agreement between SD-OCT and the profilometer was quantified as the root mean square of the eight paired differences. Each OCT value is the mean of six cross-sectional B-scans for that hole. This gives deviations from −1.39° to 0.36°, a mean of −0.63°, a mean absolute deviation of 0.77° and an RMSE of 0.87°. The RMSE describes agreement between the two instruments, not the scatter of OCT readings, and it is not itself a test statistic for the difference between the two processing conditions. The population standard deviation of these eight differences, with n = 8, is 0.60°, so the mean offset and the scatter are of comparable magnitude. The offset arises from side-wall shadowing that truncates the exit contour and from the two instruments measuring different quantities, a sectional two-point chord for OCT and a top-view projected or equivalent diameter for the profilometer. This method-related offset does not enter a comparison made within a single method, although its magnitude varies with hole geometry. Within SD-OCT, the pooled standard deviation of the six section readings is 0.96° and the standard error of their mean is 0.39°, and the method-to-method scatter is 0.60°. All three exceed the 0.16° taper reduction, so the improvement is reported as a reproducible trend rather than a statistically significant difference. The OCT data support the ranking of the hole geometries but do not resolve absolute taper at the 0.1° level.
Figure 12.
Microhole taper measured by the three methods as a function of the spiral diameter.
3.4. Current Measurement Capability and Limitations
The measurements reported here were acquired sequentially between processing steps, not during laser emission. Because the processing f-theta lens and the detection objective cannot be shared, the optical path is switched once a processing step is completed, and the SD-OCT volume is recorded with the wafer still mounted on the platform. The reconstructed geometry is used for verification after each step rather than for control within the step, so the present system operates in open loop. Synchronous in-process acquisition and closed-loop adjustment of the laser parameters or the scanning path remain future work that would additionally require a coaxial optical path, trigger-level synchronization and a defined latency budget. The results therefore establish on-machine, inter-step three-dimensional measurement, not real-time process control.
4. Conclusions
In this study, microholes with a diameter of 80 μm were machined in 200 μm thick silicon wafers using a 355 nm ultraviolet picosecond laser with galvanometer scanning. The process optimization of the microhole taper, the composite path control and the SD-OCT detection were investigated. Partitioned full-factorial experiments (448 valid combinations, three replicate holes each) showed that the significance of the factors affecting taper decreased in the order power > number of scans > scanning speed > repetition rate; power, scanning speed and number of scans were significant at p < 0.001, whereas repetition rate was not (p = 0.838). After second-order regression on the uncoded physical variables and L-BFGS-B optimization, the preferred helical parameters were 498 kHz, 15 W, 203 mm/s and 50 scans, which were validated experimentally with a mean taper of 0.90°.
On the basis of helical machining, trepanning was introduced to form a composite path. The optimized trepanning parameters were 500 kHz, 15 W, 50 mm/s and 50 scans. When the spiral diameter increased from 40 μm to 75 μm, the taper decreased from 1.15° to 0.74° ± 0.05° (mean ± SD, n = 3). Compared with the 0.90° obtained with the single helical path, this corresponds to a reduction of 0.16° or 17.8%, which is reported as a reproducible trend rather than a statistically significant difference. Helical pre-drilling improved debris evacuation, while trepanning finished the sidewall and the exit, and their combined effect reduced the taper.
SD-OCT was integrated with the picosecond laser processing platform. By reconstructing the microhole geometry and extracting the entrance and exit diameters, with offline 3D profilometer results as the reference, the two methods were found to give consistent taper trends, with a deviation range of −1.39° to 0.36°, a mean deviation of −0.63° and an RMSE of 0.87°. The RMSE describes agreement between the two instruments, not the scatter of the OCT readings, and the offset is attributed to exit-contour shadowing and to the different measurands of the two instruments. The remaining method-to-method scatter exceeds the 0.16° taper reduction, so the OCT data support the ranking of the hole geometries but do not resolve absolute taper at the 0.1° level. The measurements were acquired between process steps on the machining platform; synchronous in-process acquisition and closed-loop control remain future work. The results establish on-machine, inter-step geometric verification of the microhole taper as a complement to offline profilometry.
Author Contributions
Conceptualization, Y.L. (Yu Lu) and Y.X.; methodology, S.Z. and R.W.; validation, M.R.; investigation, S.Z. and R.M.; resources, S.Z. and R.W.; data curation, S.Z.; writing—review and editing, Y.L. (Yanan Liu) and M.R.; supervision, Y.L. (Yu Lu) and Y.X.; project administration, Y.L. (Yu Lu); funding acquisition, Y.L. (Yu Lu) All authors have read and agreed to the published version of the manuscript.
Funding
This research was supported by Tianjin Science and Technology Program Project (No. 24YDTPJC00510) and Hebei Key Laboratory of Advanced Laser Technology and Equipment (No. HBKL-ALTE2025003).
Data Availability Statement
The original contributions presented in this study are included in the article. Further inquiries can be directed to the corresponding author.
Conflicts of Interest
The authors declare no conflicts of interest.
References
- Kim, T.; Lee, J.; Choi, S.-J.; Park, J. Crater-free through-silicon vias formation by hybrid multi-step femtosecond laser drilling: Surface morphology control and residual stress reduction. J. Mater. Process. Technol. 2026, 347, 119157. [Google Scholar] [CrossRef] [Scilit]
- Guo, H.; Cao, S.; Li, L.; Zhang, X. A review on the mainstream through-silicon via etching methods. Mater. Sci. Semicond. Process. 2022, 137, 106182. [Google Scholar] [CrossRef] [Scilit]
- Jeong, I.H.; Jung, D.H.; Shin, K.S.; Shin, D.S.; Jung, J.P. Electrical characteristics and thermal shock properties of Cu-filled TSV prepared by laser drilling. Electron. Mater. Lett. 2013, 9, 389–392. [Google Scholar] [CrossRef] [Scilit]
- Zhu, H.; Zhang, Z.; Xu, K.; Xu, J.; Zhu, S.; Wang, A.; Qi, H. Performance evaluation and comparison between direct and chemical-assisted picosecond laser micro-trepanning of single crystalline silicon. Materials 2019, 12, 41. [Google Scholar] [CrossRef] [Scilit] [PubMed]
- Chen, P.; Tu, S.; Pan, R.; Qin, F. Femtosecond laser-induced microjet assisted one-step fabrication of through-silicon vias. J. Mater. Process. Technol. 2025, 342, 118918. [Google Scholar] [CrossRef] [Scilit]
- Hof, L.A.; Abou Ziki, J. Micro-hole drilling on glass substrates—A review. Micromachines 2017, 8, 53. [Google Scholar] [CrossRef] [Scilit]
- Ansary, S.R.; Kabir, S.; Cong, W. Ultra-fast rotary ultrasonic micro-hole machining of silicon wafers: A comparative study between twist drill and diamond tools. Ultrasonics 2025, 156, 107776. [Google Scholar] [CrossRef] [Scilit] [PubMed]
- Mao, X.; Almeida, S.; Mo, J.; Ding, S. The state of the art of electrical discharge drilling: A review. Int. J. Adv. Manuf. Technol. 2022, 121, 2947–2969. [Google Scholar] [CrossRef] [Scilit]
- Cao, P.; Li, Y.; Yao, Z.; Reynaerts, D.; Saxena, K.K. Coupled rotation-vibration micro-EDM enabled by passive conversion of electrode runout into axial vibration with improved debris removal. J. Manuf. Process. 2026, 178, 169–182. [Google Scholar] [CrossRef] [Scilit]
- Wang, P.; Hu, J.; Hu, H.; Yu, D.; Yin, Z.; Zou, H.Y.; Lai, T. Debris motion and taper suppression in EDM deep hole machining assisted by longitudinal/torsional ultrasonic vibration. J. Manuf. Process. 2025, 133, 798–810. [Google Scholar] [CrossRef] [Scilit]
- Yin, Z.; Zhang, P.; Zhou, P.; Zhang, K.; Sun, Q.; Zhan, Q.; Li, H. A novel EDM method using longitudinal-torsional ultrasonic vibration (LTV) electrodes to improve machining performance for micro-holes. J. Manuf. Process. 2023, 102, 231–243. [Google Scholar] [CrossRef] [Scilit]
- Li, Z.; Wang, Y.; Jia, J.; Guo, C.; Lv, M.; Yang, S.; Shen, X. Research on drilling sub-100 μm high aspect ratio reverse taper hole by micro-EDM. J. Manuf. Process. 2025, 155, 735–746. [Google Scholar] [CrossRef] [Scilit]
- Prashanth, P.; Hiremath, S.S. Machinability study and characterisation of holes machined using mechanical micromachining technique—Micro drilling. Adv. Mater. Process. Technol. 2019, 5, 226–241. [Google Scholar] [CrossRef] [Scilit]
- Chang, D.-Y.; Lin, C.-H. High-aspect ratio mechanical microdrilling process for a microhole array of nitride ceramics. Int. J. Adv. Manuf. Technol. 2019, 100, 2867–2883. [Google Scholar] [CrossRef] [Scilit]
- Grover, S.; Mangal, S.K.; Singh, S.; Singh, M.; Rajput, V.; Sharma, S.; Kumar, A.; Abbas, M. Experimental investigation of micro-machining of borosilicate glass using an ultrasonic assisted rotary electrochemical discharge machining (UA-RECDM) process. J. Micromech. Microeng. 2024, 34, 055003. [Google Scholar] [CrossRef] [Scilit]
- Zou, Z.; Chan, K.C.; Qiao, S.; Zhang, K.; Yue, T.; Guo, Z.; Liu, J. Electrochemical discharge machining of a high-precision micro-holes array in a glass wafer using a damping and confinement technique. J. Manuf. Process. 2023, 99, 152–167. [Google Scholar] [CrossRef] [Scilit]
- Wang, M.; Zhang, Y.; He, Z.; Peng, W. Deep micro-hole fabrication in EMM on stainless steel using disk micro-tool assisted by ultrasonic vibration. J. Mater. Process. Technol. 2016, 229, 475–483. [Google Scholar] [CrossRef] [Scilit]
- Rahman, Z.; Das, A.K.; Chattopadhyaya, S. Microhole drilling through electrochemical processes: A review. Mater. Manuf. Process. 2018, 33, 1379–1405. [Google Scholar] [CrossRef] [Scilit]
- Chen, H.; Zhu, C.; Lin, G.; Lin, Y. Deep silicon etching technology and applications: A review. J. Micromech. Microeng. 2025, 35, 083001. [Google Scholar] [CrossRef] [Scilit]
- Kaspar, J.; Luft, A.; Nolte, S.; Will, M.; Beyer, E. Laser helical drilling of silicon wafers with ns to fs pulses: Scanning electron microscopy and transmission electron microscopy characterization of drilled through-holes. J. Laser Appl. 2006, 18, 85–92. [Google Scholar] [CrossRef] [Scilit]
- Weck, A.; Crawford, T.H.R.; Wilkinson, D.S.; Haugen, H.; Preston, J. Laser drilling of high aspect ratio holes in copper with femtosecond, picosecond and nanosecond pulses. Appl. Phys. A 2008, 90, 537–543. [Google Scholar] [CrossRef] [Scilit]
- Matsumura, T.; Nakatani, T.; Yagi, T. Deep drilling on a silicon plate with a femtosecond laser: Experiment and model analysis. Appl. Phys. A 2007, 86, 107–114. [Google Scholar] [CrossRef] [Scilit]
- Zhang, N.; Wang, M.; Bai, M.; Guo, L.; Liu, W. Femtosecond laser drilling 100 μm diameter micro holes with aspect ratios > 20 in a nickel-based superalloy. J. Mater. Res. Technol. 2024, 28, 1415–1422. [Google Scholar] [CrossRef] [Scilit]
- Yao, Z.; Wu, M.; Qian, J.; Reynaerts, D. Non-invasive radio frequency (RF)-driven in-process monitoring and control for enhancing micro-electrical discharge machining stability and efficiency. Mech. Syst. Signal Process. 2026, 249, 114072. [Google Scholar] [CrossRef] [Scilit]
- Lu, H.; Liu, Y.; Liu, K.; Yang, Z.; Xie, P.; Li, G.; Zhang, P.; Wang, Z.; Bian, R.; Wu, X.; et al. Physics-informed online intelligent discharge state identification for high-energy electrical discharge milling: Theory and methods. Mech. Syst. Signal Process. 2026, 259, 114812. [Google Scholar] [CrossRef] [Scilit]
- Ye, L.; Guo, C.; Valentincic, J.; Qian, J.; Reynaerts, D.; Yu, N. In-situ process monitoring and control in EDM: A review. J. Manuf. Process. 2025, 152, 899–928. [Google Scholar] [CrossRef] [Scilit]
- Huang, D.; Swanson, E.A.; Lin, C.P.; Schuman, J.S.; Stinson, W.G.; Chang, W.; Hee, M.R.; Flotte, T.; Gregory, K.; Puliafito, C.A.; et al. Optical coherence tomography. Science 1991, 254, 1178–1181. [Google Scholar] [CrossRef] [Scilit] [PubMed]
- Fornaroli, C.; Holtkamp, J.; Gillner, A. Laser-beam helical drilling of high quality micro holes. In Proceedings of the International Congress on Applications of Lasers & Electro-Optics (ICALEO), Anaheim, CA, USA, 23–27 September 2012; pp. 1040–1045. [Google Scholar] [CrossRef] [Scilit]
- Zhu, C.; Huang, R.; Sun, N.X.; Zhao, X. Ultrafast laser micromachining of through-drill trenches in silicon wafers. Manuf. Lett. 2025, 44, 746–751. [Google Scholar] [CrossRef] [Scilit]
- Basha, D.N.; Rakesh, C.; Rao, J.S.; Samuel, G.L.; Bathe, R. Precision ultrafast laser micromachining of silicon microfluidic channels. Eng. Res. Express 2025, 7, 025424. [Google Scholar] [CrossRef] [Scilit]
- Dupriez, N.D.; DeNkL, A. Advances of OCT technology for laser beam processing: Precision and quality during laser welding. Laser Tech. J. 2017, 14, 34–38. [Google Scholar]
- Blecher, J.J.; Galbraith, C.M.; Van Vlack, C.; Palmer, T.A.; Fraser, J.M.; Webster, P.J.L.; DebRoy, T. Real-time monitoring of laser beam welding keyhole depth by laser interferometry. Sci. Technol. Weld. Join. 2014, 19, 560–564. [Google Scholar] [CrossRef] [Scilit]
- Webster, P.J.L.; Yu, J.X.Z.; Leung, B.Y.C.; Anderson, M.D.; Yang, V.X.D.; Fraser, J.M. In situ 24 kHz coherent imaging of morphology change in laser percussion drilling. Opt. Lett. 2010, 35, 646–648. [Google Scholar] [CrossRef] [Scilit] [PubMed]
- Webster, P.J.L.; Wright, L.G.; Mortimer, K.D.; Leung, B.Y.; Yu, J.X.Z.; Fraser, J.M. Automatic real-time guidance of laser machining with inline coherent imaging. J. Laser Appl. 2011, 23, 022001. [Google Scholar] [CrossRef] [Scilit]
- Holder, D.; Weber, R.; Graf, T.; Onuseit, V.; Brinkmeier, D.; Förster, D.J.; Feuer, A. Analytical model for the depth progress of percussion drilling with ultrashort laser pulses. Appl. Phys. A 2021, 127, 302, Correction in Appl. Phys. A 2021, 127, 943. https://doi.org/10.1007/s00339-021-05098-0. [Google Scholar] [CrossRef] [Scilit]
- Kamiya, M.; Aoshima, S. Real-time monitoring of processed hole depth under femtosecond laser processing. Rev. Laser Eng. 2005, 33, 685–689. [Google Scholar] [CrossRef] [Scilit]
- Holder, D.; Buser, M.; Boley, S.; Weber, R.; Graf, T. Image processing based detection of the fibre orientation during depth-controlled laser ablation of CFRP monitored by optical coherence tomography. Mater. Des. 2021, 203, 109567. [Google Scholar] [CrossRef] [Scilit]
- Xu, P.; Yu, Y.; Liu, R.J.; Zha, K.; Zhou, L.; Liu, Y.T.; Xu, Z. Application of spectral-domain optical coherence tomography technique to in-process measure hole depth during femtosecond laser drilling in different alloys. AIP Adv. 2023, 13, 035006. [Google Scholar] [CrossRef] [Scilit]
- Hasegawa, S.; Fujimoto, M.; Atsumi, T.; Hayasaki, Y. In-process monitoring in laser grooving with line-shaped femtosecond pulses using optical coherence tomography. Light Adv. Manuf. 2022, 3, 33. [Google Scholar] [CrossRef] [Scilit]
- Sun, T.; Zhao, W.; Fan, Z.; He, J.; Shen, P.; Cui, J.; Mei, X. In-situ monitoring of hole evolution process in ultrafast laser drilling using optical coherence tomography. J. Manuf. Process. 2025, 133, 1290–1299. [Google Scholar] [CrossRef] [Scilit]

Disclaimer/Publisher’s Note: The statements, opinions and data contained in all publications are solely those of the individual author(s) and contributor(s) and not of MDPI and/or the editor(s). MDPI and/or the editor(s) disclaim responsibility for any injury to people or property resulting from any ideas, methods, instructions or products referred to in the content. |
© 2026 by the authors. Licensee MDPI, Basel, Switzerland. This article is an open access article distributed under the terms and conditions of the Creative Commons Attribution (CC BY) license.