


Abstract
The field application environment of TDLAS gas sensors is inherently complex, and the acquired spectral signals are frequently contaminated by interfering backgrounds. Such interferences compromise the measurement accuracy of gas concentration. To address this issue, this paper proposes an approach for gas characteristic spectral line extraction and quantitative analysis based on the hill-climbing algorithm with progressive window expansion. In this approach, the full measurement range of the TDLAS sensor is divided into segments, and the characteristic spectral line parameters corresponding to a known concentration are pre-stored in each segment. The proposed hill-climbing algorithm with progressive window expansion is then employed to estimate the spectral parameters. In the comparative experiments, using the same TDLAS sensor subject to nonlinear laser drift and a contaminated gas cell, the proposed method and the existing traditional method were respectively employed to process the same raw spectral data acquired by the sensor and to detect the same batch of methane gases at different concentrations. Compared with the traditional method, the proposed method improves the fitting correlation coefficient of spectral background prediction from 0.9985 to 0.9997, and enables more accurate gas concentration prediction simultaneously while extracting the gas characteristic absorption lines. The prediction errors of the proposed method for all concentrations fall within the allowable error limits for methane sensors in Chinese coal mines (i.e., absolute error ≤ 0.05% for the 0–1% range, and relative error ≤ 5% of the actual value for the 1–100% range). In the 6 h detection of the 0.05% methane gas sample, according to the statistics, the average detection value of the proposed method is 0.0491%, which is very close to the true detection value of 0.05%, and the detection variance is only 0.0124%. The comparative experimental results show that the proposed method can successfully extract the gas characteristic lines from raw spectral signals contaminated by interfering backgrounds, while achieving accurate concentration prediction, and its concentration prediction error is significantly lower than that of the conventional method. The proposed method enriches the technical arsenal for spectral signal analysis in TDLAS gas sensors, offers a valuable reference for designing spectral analysis strategies when such sensors are deployed in industrial field applications, and contributes, to a certain extent, to enhancing the sensor’s reliability and stability.
1. Introduction
The demand for monitoring flammable, explosive, and toxic hazardous gases is widespread in industrial field settings. Coal mine operational environments contain multiple gas components, including methane, carbon monoxide, ethylene, and acetylene. Methane is a signature gas that triggers catastrophic events such as gas explosions; carbon monoxide, ethylene, and acetylene are commonly used as early-warning indicators for spontaneous combustion in coal mine goaf areas. Moreover, carbon monoxide, owing to its imperceptibility and high lethality, acts as an invisible “killer” in underground mine working atmospheres [1,2,3]. The petrochemical and oil–gas storage and transportation industries involve an even wider variety of gas species. Typical flammable and explosive gases include alkanes such as methane, ethane, propane, butane, and pentane; common toxic and harmful gases include sulfur dioxide, hydrogen sulfide, and benzene [4,5]. In the biopharmaceutical industry, species such as carbon disulfide, hydrogen sulfide, ammonia, methyl sulfide, and styrene are present. These gases are not only toxic and hazardous but also characteristic odorous pollutants, and any leakage can readily cause severe contamination of the atmospheric environment and even water sources [6,7]. In the new-energy battery industry, the ethylene gas generated during cell formation is an important reference for evaluating the quality of solid electrolyte interphase (SEI) film formation [8]. On one hand, safety and environmental protection constitute the fundamental bottom line that industrial production cannot overstep; on the other hand, precise process control is a basic guarantee for improving quality and efficiency. In summary, whether from the perspective of safety and environmental importance or from the standpoint of enhancing quality and efficiency in production processes, high-precision detection of the signature gas species present in industrial sites is an indispensable prerequisite for ensuring the normal operation of industrial production.
At present, gas sensors based on tunable diode laser absorption spectroscopy (TDLAS), owing to their advantages of high sensitivity, high selectivity, fast response, non-contact measurement, and strong anti-interference capability, are progressively becoming the optimal technological choice for gas sensing in various industrial scenarios such as coal mines, both currently and in the foreseeable future [9,10,11,12]. Taking the Chinese coal mining industry as an example, in 2022, the National Mine Safety Administration of the Ministry of Emergency Management of China mandated the use of TDLAS gas sensors as a national compulsory standard in the “14th Five-Year Plan for Mine Safety Production” [13]. In 2025, the latest revision of the Chinese “Coal Mine Safety Regulations” added requirements for TDLAS gas sensor installations at seven new locations in the coal mine [14]. These regulations directly expand the deployment quantity and coverage of TDLAS gas sensors, thus defining incremental demand for coal-mine TDLAS sensors. Against the background of continuously improving industrial safety requirements and intelligent construction in China, the market demand for TDLAS gas sensors will continue to grow.
In TDLAS technology, the purpose of gas absorption spectral feature recognition and extraction is to extract the characteristic absorption lines arising purely from gas absorption, which is the base for achieving high-precision quantitative TDLAS analysis. On the one hand, for sensors applied in industrial field environments, the operating conditions are complex. For example, some coal mining faces are characterized by high temperature, high dust, and high humidity. Prolonged high temperatures may cause wavelength drift and nonlinear output power drift of the laser diode. High humidity and high dust may contaminate the gas absorption cell of the sensor. When the optical beam propagates through such a cell, a large amount of stray light is generated, thereby causing etalon effects. All of these factors introduce nonlinear background interference into the spectral signals, and the frequency spectra of such interferences may severely overlap with those of the gas characteristic absorption peaks, making it difficult to simply filter out these nonlinear background interferences via frequency-domain filtering. On the other hand, industrial field applications impose stringent requirements on sensor reliability and stability. For instance, false alarms from methane sensors in coal mines can trigger shutdowns of underground systems and production stoppages, leading to severe economic losses; more critically, missed alarms of methane sensors may result in major accidents such as gas explosions. The interfering backgrounds present in the spectral signals will affect the accurate detection of gas concentrations by the sensors, thereby reducing their reliability and stability. Therefore, for TDLAS gas sensors deployed in industrial field environments, a method for effectively extracting gas characteristic absorption lines from complex nonlinear spectral backgrounds is a crucial foundation for ensuring accurate gas concentration detection and maintaining high reliability and stability.
At present, the identification and extraction of gas characteristic absorption lines mainly rely on spectral background fitting and subtraction, signal filtering, and neural-network-based methods. The spectral background fitting and subtraction method is commonly referred to as the conventional method. It uses data points far from the gas absorption peaks in the spectrum to perform polynomial fitting, thereby estimating and subtracting the spectral background, and thus extracting the gas characteristic absorption lines [15,16]. However, this method only employs data away from the characteristic absorption peaks to fit the predicted background. If nonlinear background interference exists near the absorption peaks, the background fitting will suffer from underfitting because the spectral background information near the peaks cannot be effectively utilized. Consequently, the extracted gas characteristic lines still contain residual nonlinear background interference. Furthermore, when applying Gauss–Newton iteration to fit and extract the characteristic lines, the residual nonlinear background interference significantly compromises the fitting accuracy, ultimately degrading the precision of gas concentration detection. Filtering methods include traditional moving average, median filtering, and more powerful techniques such as wavelet transform. Moving average and median filtering are mainly suitable for removing high-frequency spike noise from spectral signals. Wavelet transform, with its multi-resolution analysis capability, can effectively suppress different types of noise in spectral signals. However, the performance of wavelet transform depends heavily on parameter selection and may cause signal distortion, its generalization capability for complex noise is insufficient, and in practical industrial applications it sometimes fails to achieve effective extraction of gas characteristic lines [17,18]. Neural-network-based algorithms, such as back-propagation neural networks and deep learning frameworks including convolutional neural networks, can overcome the limitations of traditional time-domain and frequency-domain filtering algorithms. They are capable of suppressing spectral background interference and significantly improving the accuracy of gas characteristic absorption line recognition and extraction [19,20]. Nevertheless, the construction of neural network models typically requires training on large datasets. To build a robust model, it is necessary first to acquire a substantial amount of in situ spectral data [21,22]. However, considering the stringent requirements for high stability and low power consumption in industrial field applications, together with strict control over data transmission resources and the scarcity of embedded storage space on the sensors, most current industrial application scenarios do not yet possess the conditions to acquire and store large volumes of raw spectral data for neural network training.
In general, given the application environment characteristics of TDLAS sensors in industrial settings, the aforementioned conventional method currently remains dominant in TDLAS industrial field applications, and suitable approaches for effectively extracting gas characteristic absorption lines from spectral background interference are still lacking. The reliability and stability of industrial TDLAS sensors still require further improvement. To this end, this paper proposes a gas characteristic absorption line extraction and quantitative analysis method based on the hill-climbing algorithm with progressive window expansion. Using a TDLAS methane sensor in the coal mining sector as the experimental hardware platform, we further validate the effectiveness and feasibility of the proposed method. The research focuses on the industrial field application of TDLAS gas sensors. The proposed method can concisely and rapidly achieve the extraction of gas characteristic absorption lines while simultaneously performing fast and accurate calculation of gas concentration values. This work provides a reference approach for the effective extraction of gas characteristic lines and concentration detection of TDLAS gas sensors under complex interference backgrounds, and it will, to a certain extent, enhance the reliability and stability of TDLAS gas sensors applied in industrial field environments.
2. Spectroscopic Principle of the Method
The absorption of laser beam intensity by gas molecules obeys the Beer–Lambert law, which can be expressed as
where I0(λ) is the incident light intensity, I(λ) is the transmitted light intensity, P is the total gas pressure, C is the target gas concentration (usually expressed as mole fraction), S(T) is the line strength of the target gas molecule as a function of temperature T, and φ(λ) is the line shape function of the characteristic absorption line. At ambient temperature and pressure, φ(λ) exhibits a Lorentzian line shape. For a specific TDLAS gas sensor, the optical path length is fixed and the selected spectral wavelength for the target gas is determined. Therefore, at ambient temperature and pressure, Equation (1) can be further simplified as
where comparing Equations (1) and (2), α(λ) = PCLS(T)φ(λ). Ideally, the incident light intensity I0(λ) is the output intensity of the semiconductor laser, which exhibits a strictly linear relationship with wavelength λ. Moreover, the acquired spectral signal I(λ) contains no interfering background signals or noise. Thus, under ideal conditions, the spectral signal I(λ) can be written as
where k and b are the linear coefficients relating the laser output intensity to wavelength. The product of the target gas concentration C and α(λ) can be expressed as
where Cα(λ) is the characteristic absorption line to be extracted. Based on Equations (1)–(4), under ideal conditions, the spectral background is obtained by linear fitting of the edge points of I(λ), then removed through ratio and logarithmic operations, and finally the characteristic absorption line is extracted by using the Gauss–Newton iterative method.
I(λ) = I0(λ)exp[−PCLS(T)φ(λ)]
I(λ) = I0(λ)exp[−Cα(λ)]
I(λ) = (kλ + b)exp[−Cα(λ)]
However, owing to various factors in industrial field environments, the output optical power of the semiconductor laser may exhibit nonlinear drift with a certain probability, and the enhancement of stray light in the gas cell introduces significant etalon effects into the spectral background. A cubic polynomial is generally sufficient to achieve a highly correlated nonlinear fit to the output optical power of the semiconductor laser. The causes of the etalon effect are relatively complex, which makes the spectral components of the etalon fringes in the spectral signal complex. Among them, the low-frequency and high-frequency components of the etalon fringes can be simply filtered out by a band-pass filter. However, the spectral components of the etalon fringes that highly overlap with the spectrum of the gas characteristic absorption lines are difficult to directly remove by filtering. The fringe signal formed by these unfilterable frequency components often has a fluctuation period that is approximately similar to the broadening of the gas characteristic lines and is relatively uniform. Admittedly, the aforementioned fringe signal may take various forms such as a square wave or a triangular wave; however, because it has a relatively uniform fluctuation period, a single cosine function can still approximate it well. Therefore, a cosine function is adopted to represent the etalon fringe signal after band-pass filtering. Therefore, the spectral signal I(λ) is further modified as
where the cubic polynomial a1λ3 + a2λ2 + a3λ + a4 represents the nonlinearity of the semiconductor laser output optical power, with a1, a2, a3, a4 being the polynomial coefficients; Acos(2πfλ + φ0) characterizes the etalon effect in the spectral signal, where A, f and φ0 are the amplitude, frequency, and initial phase of the etalon effect, respectively. For TDLAS gas sensors with the same design, the optical path length is identical. Moreover, over a relatively small range of gas concentration variation, the broadening of the characteristic absorption line remains approximately equal, but the spectral intensity of the characteristic line is highly correlated with gas concentration. Using a known concentration C0 as the reference concentration, the characteristic absorption line S(λ) at that concentration serves as the reference spectral template. The spectral signal I(λ) of an unknown gas concentration within the same concentration range can be expressed as
where βS(λ) replaces Cα(λ) in Equation (5) as an alternative representation of the gas characteristic absorption line, and β is the ratio of the unknown gas concentration C to the reference concentration C0. The concentration C can be determined as
I(λ) = [a1λ3 + a2λ2 + a3λ + a4 + Acos(2πfλ + φ0)]exp[−Cα(λ)]
I(λ) = [a1λ3 + a2λ2 + a3λ + a4 + Acos(2πfλ + φ0)]exp[−βS(λ)]
C = βC0
For a TDLAS gas sensor operating in the laboratory under favorable environmental conditions, the acquired spectral signals typically contain no obvious interfering background. A standard gas with a known concentration is passed through the properly functioning laboratory TDLAS sensor, and the reference characteristic absorption line S(λ) is obtained by performing spectral background fitting, subtraction, and Gauss–Newton iterative fitting. In practical applications, it is unnecessary to pre-store the reference characteristic absorption line S(λ) in the sensor’s read-only memory. Only its central wavelength, linewidth, and peak height need to be stored, and S(λ) can then be loaded into random-access memory during sensor operation. To meet the requirements of full-range gas concentration detection, the measurement range can be divided into several segments according to the actual detection needs, and in each segment a standard characteristic absorption line corresponding to a certain concentration is provided. Because the concentration variation within each segment is relatively small, the line broadening of different concentrations remains approximately the same. Therefore, in each concentration segment, the corresponding reference concentration C0 and reference characteristic absorption line S(λ) are given, and the spectral signals I(λ) and concentration values C for different gas concentrations all satisfy the quantitative relationships expressed in Equations (6) and (7).
To accurately extract the gas characteristic absorption line from the interfering background caused by nonlinear drift of the laser output power and etalon effects, it is necessary to finally determine the parameters a1, a2, a3, a4, A, f, φ0 and β in Equation (6). According to Equation (7), once β is determined, the target gas concentration C is also determined. In this work, we propose a method based on the hill-climbing algorithm with progressive window expansion to fit the actual spectral signal y(λ) of the unknown gas to the objective function I(λ) described by Equation (6), thereby estimating all parameters. In the fitting process, the reference characteristic absorption line in a selected concentration segment is first used as the initial S(λ). The residual sum of squares (RSSs) between the actual spectral signal y(λ) and I(λ) is calculated as
Then, gradient descent is employed to compute the parameter variations and update the parameters as follows:
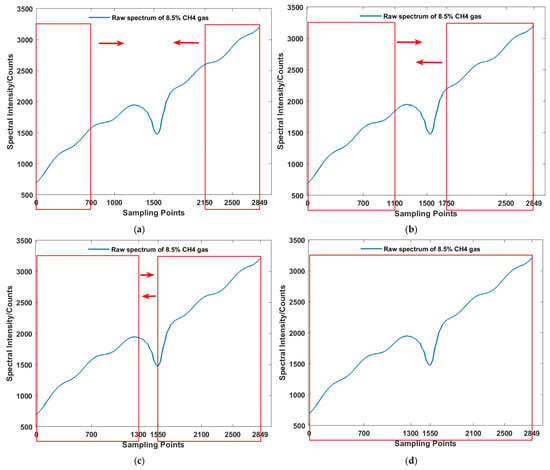
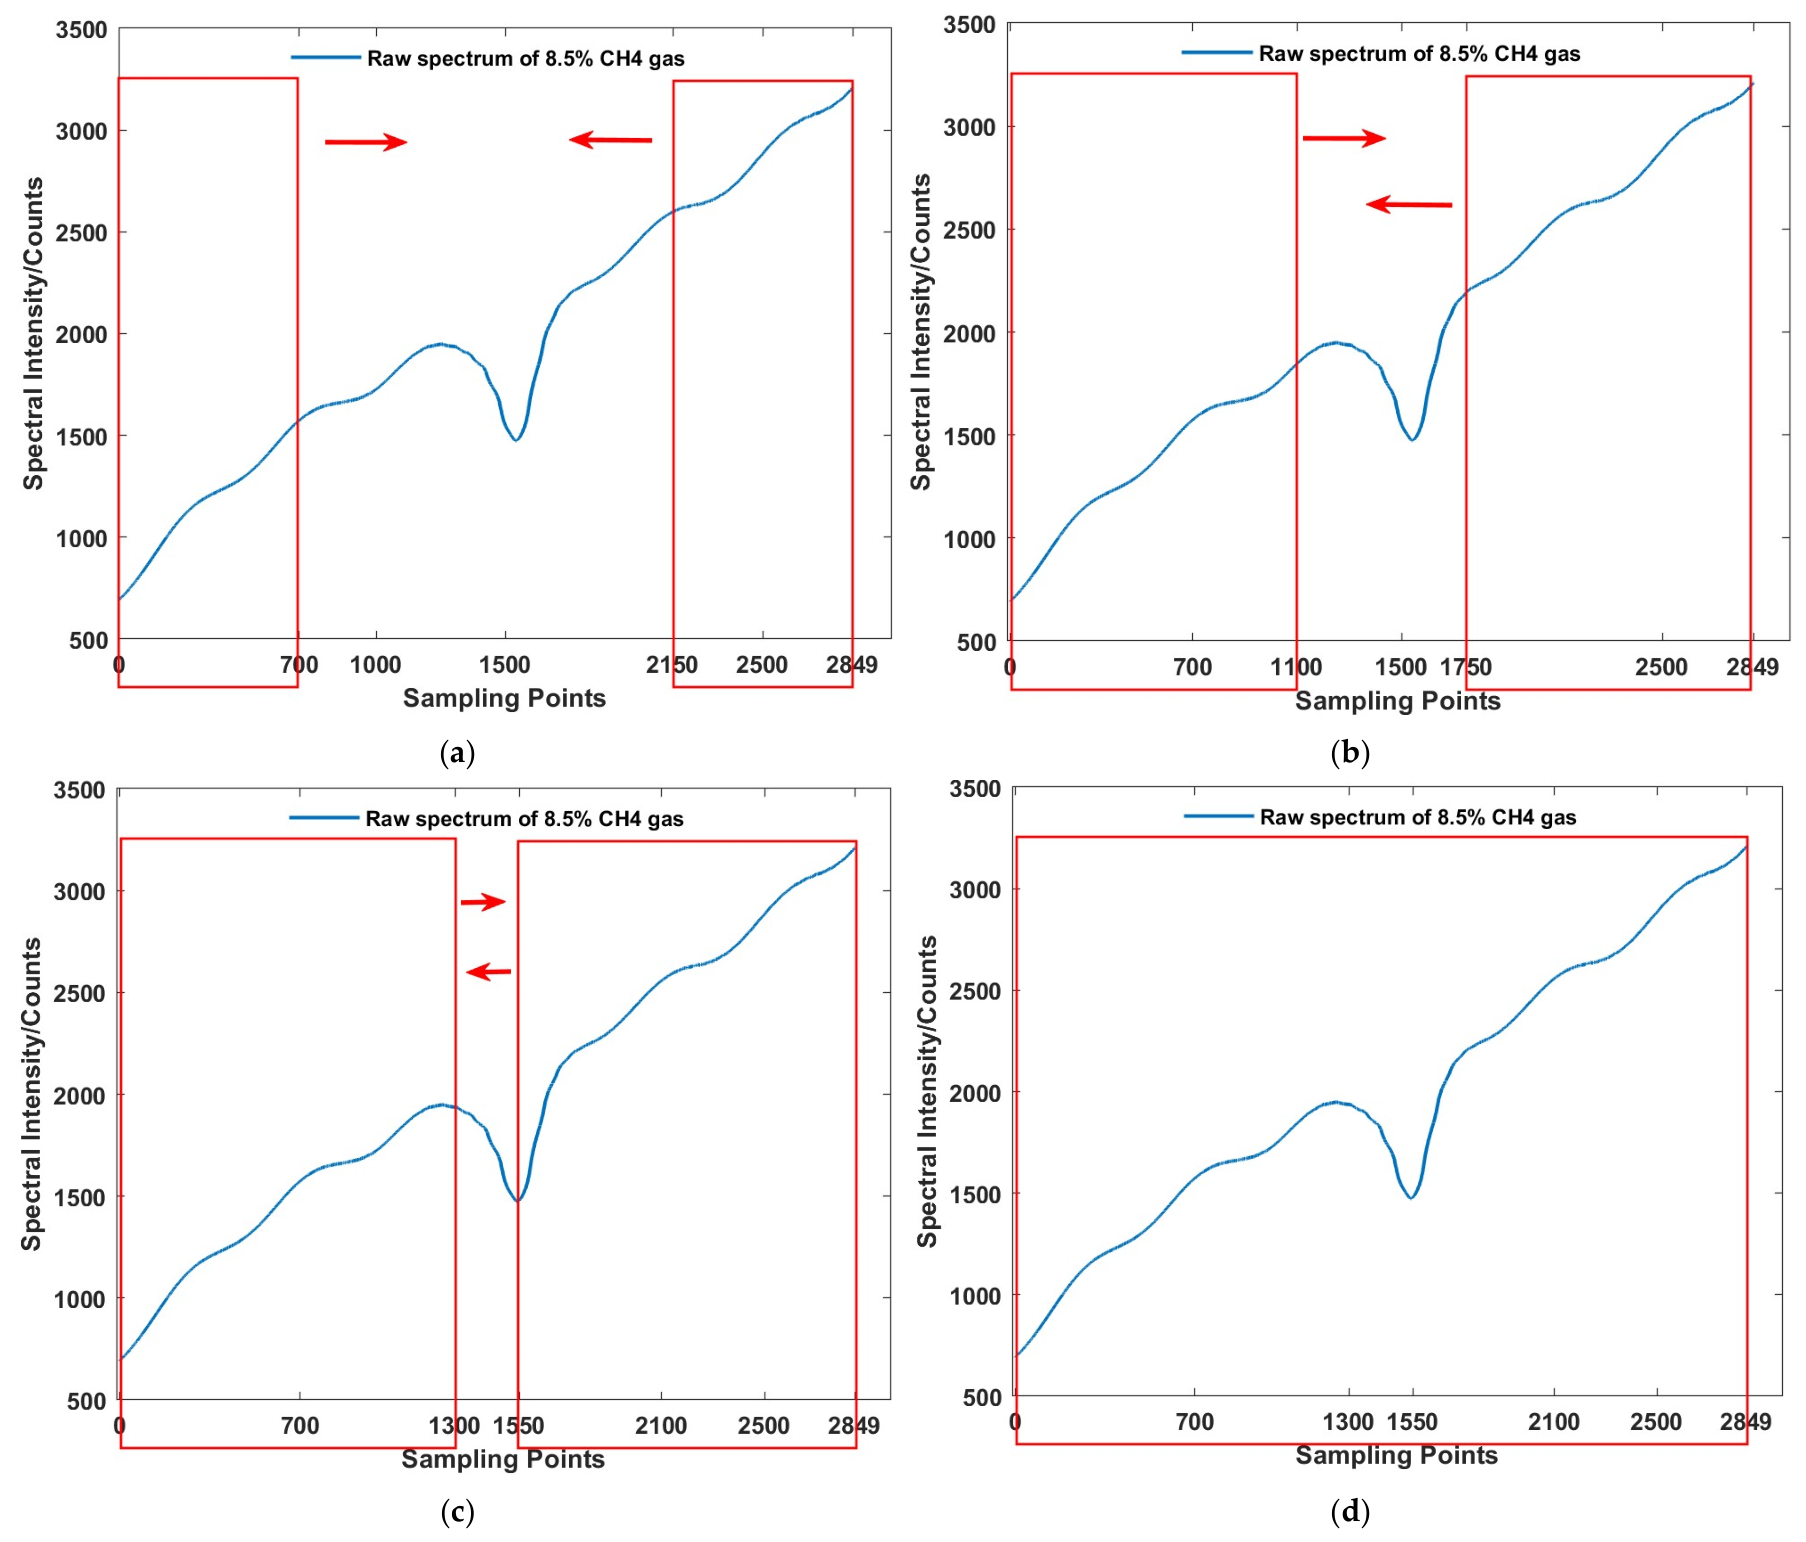
To prevent excessively large parameter update steps, all the gradient variations are multiplied by 0.1. The RSS values before and after the parameter update are compared. If the RSS no longer decreases, the gradient descent iteration is terminated, and the hill-climbing algorithm is subsequently employed to further optimize the parameter estimation. Before starting the hill-climbing iterations, the concentration segment is re-selected according to the current value of βC0, and the corresponding reference concentration C0, reference characteristic line S(λ), and β are updated accordingly. The hill-climbing algorithm takes the parameter values at the end of gradient descent as the initial values, and sequentially and randomly changes the values of a1, a2, a3, a4, A, f, φ0 and β, comparing the RSS before and after each change. If the RSS decreases, the random change is accepted and the parameter value is updated. Compared with the pure gradient descent method, the hill-climbing algorithm can escape local minima of the RSS and attempt to perform a global search for better optimized parameters. Over the full spectral range, the choice of initial parameter values affects the performance of the hill-climbing algorithm. Inappropriate initial values may require more iterations to find the optimal parameters, thereby prolonging the sensor response time. To address this, a combined method of fitting-window expansion and hill climbing is further proposed, in which the window participating in the fitting calculation is specified during the optimization process. The fitting window limits the set of points involved in the fitting. The window points start from both ends of the spectral signal far away from the gas characteristic absorption peak and then simultaneously expand toward the middle of the spectrum until the fitting window covers the entire spectral range. In each window, the above hill-climbing algorithm is used to fit the actual spectral signal y(λ) to the objective function I(λ), iteratively updating all parameters. Taking a spectral signal with a total of 2849 sampling points as an example, the principle of the hill-climbing algorithm with progressive window expansion is illustrated in Figure 1.
Figure 1.
Schematic illustration of window expansion in the hill-climbing algorithm with progressive window expansion. (a) Fitting window [1:700] and [2150:2849]. (b) Fitting window [1:1100] and [1750:2849]. (c) Fitting window [1:1300] and [1550:2849]. (d) Fitting window covers the full spectrum.
The fitting windows, expressed in terms of the sampling points along the abscissa, are as follows: in Figure 1a, the fitting windows are [1:700] and [2150:2849], which are located at the two extreme ends of the spectral signal, away from the gas characteristic absorption peaks; in Figure 1b, the windows are [1:1000] and [1750:2849], extending toward the middle of the spectral range; in Figure 1c, the windows are [1:1300] and [1550:2849], further expanding inward; and in Figure 1d, the fitting window covers the entire spectral signal. Throughout this window expansion process, the parameter estimates obtained from the fitting of each window are used as the initial values for the subsequent window fitting. This strategy enhances the suitability of the initial estimates for the next fitting stage, thereby effectively reducing the number of required iterations. To strike an optimal balance between fitting accuracy and rapid responsiveness, an appropriate iteration number, N, is designated for the hill-climbing algorithm. After N iterations, the optimal estimates of the parameters a1, a2, a3, a4, A, f, φ0 and β are successfully obtained. At this juncture, the method not only identifies and extracts the gas characteristic absorption spectral line, βS(λ), but also enables the calculation of the target gas concentration according to Equation (7).
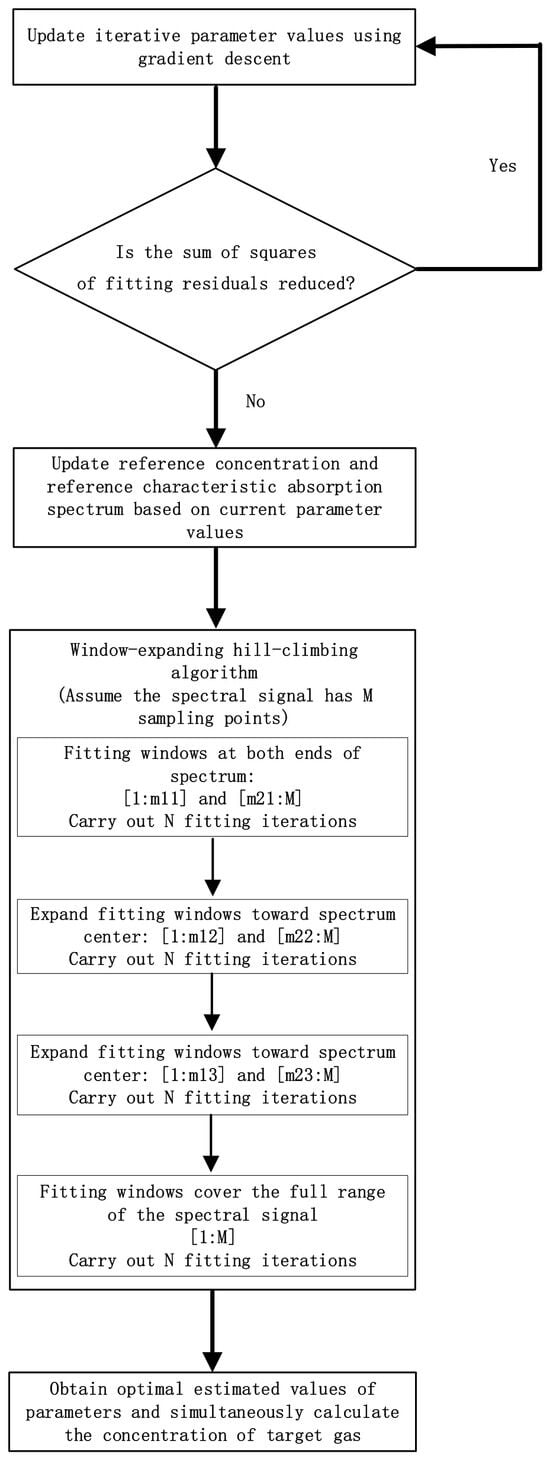
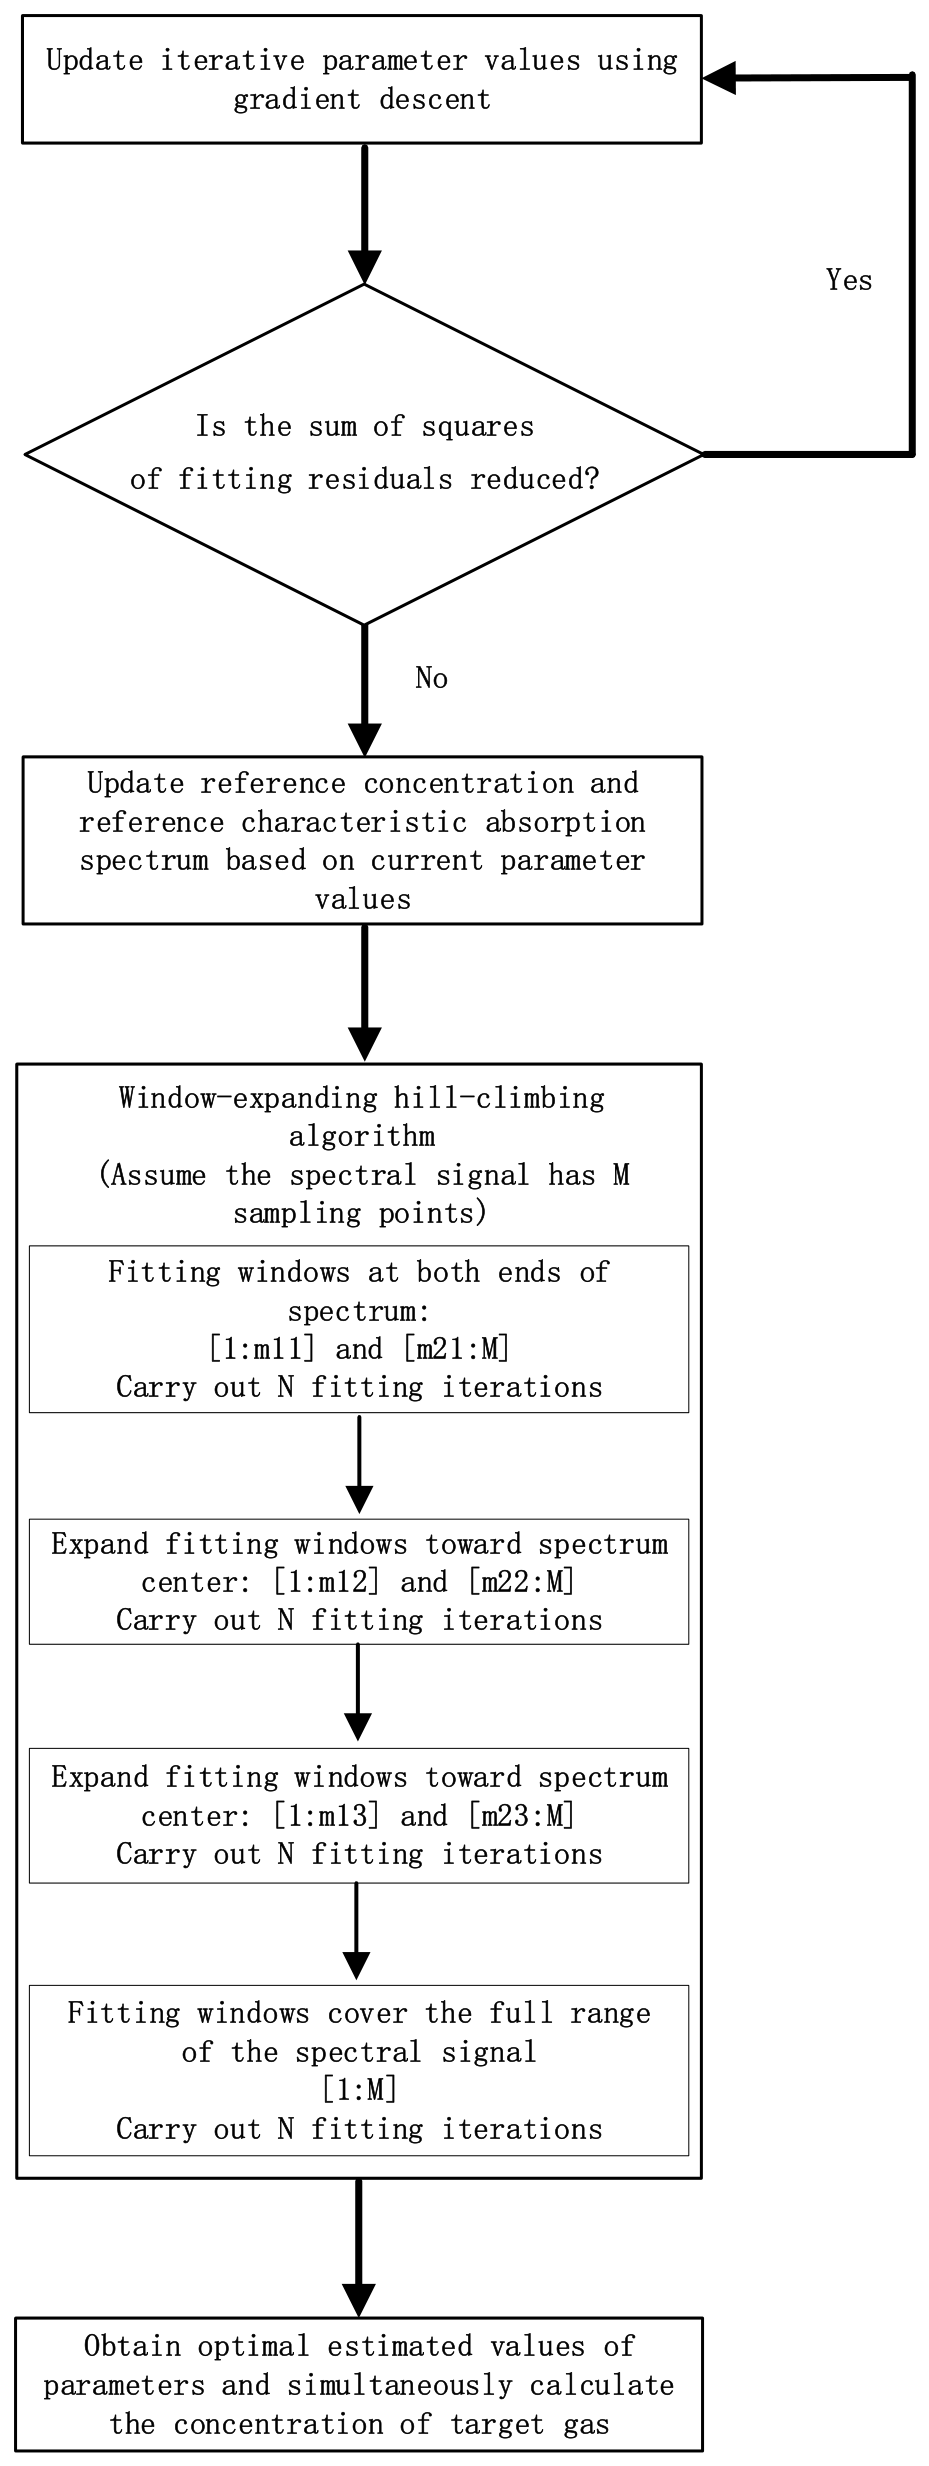
In summary, the gas characteristic absorption line identification and quantitative analysis method proposed in this paper is specifically designed to address the background interference characteristics present in spectral signals within industrial TDLAS field applications. The method adopts I(λ), as formulated in Equation (5), as the spectral fitting objective function, and searches for the optimal estimates of the parameters a1, a2, a3, a4, A, f, φ0 and β. The optimization procedure initially employs the gradient descent method to iteratively update the parameters. Once the fitting residual sum of squares ceases to decrease, the algorithm transitions to the progressive window expansion hill-climbing strategy to escape local optima and continue refining the parameter values. During the execution of the hill-climbing algorithm, the fitting window is progressively expanded from both ends of the spectral signal until the full spectrum is covered. Following a designated number of these “hill-climbing fitting iterations,” the final optimal estimates for all parameters are ultimately achieved. Consequently, this approach accomplishes both the extraction of the gas characteristic absorption lines and the precise determination of the target gas concentration. A schematic flowchart of the proposed method is presented in Figure 2.
Figure 2.
Main workflow of the method for identification and quantitative analysis of gas characteristic absorption spectral lines.
In addition, in the above description of the principle, the segmentation of the sensor measurement range, the initial values of the parameters to be optimized, the step size of window expansion in the hill-climbing algorithm, the number of iterations in the hill-climbing algorithm, etc., are key factors that determine the performance of the proposed method. The segmentation of the sensor measurement range is based on its measurement range and its main operating concentration range. The initial values of parameter a1, a2, a3, a4, and A depend on the laser intensity scanning range inside the sensor. Although the acquired spectral signal is affected by gas absorption, interference noise, and other factors, the laser intensity scanning range determines the order of magnitude of parameter a1, a2, a3, a4, A. The period T corresponding to parameter f should be twice the full width at half maximum (FWHM) of the reference characteristic line within the main operating concentration range of the sensor. The initial value of parameter φ0 is set to 0, and the initial value of parameter β is set to 1. Typically, the reference characteristic absorption line in the minimum concentration segment is selected as the initial characteristic absorption line S(λ). The step size of window expansion in the hill-climbing algorithm depends on the spectral wavelength scanning range. The window generated in the first step contains only the spectral background range, and the window then gradually covers the gas characteristic absorption peak region during expansion. The number of iterations, N, in the hill-climbing algorithm is closely related to the computing device used and the sensor response time requirements, and an excessive number of iterations will significantly increase the time overhead. However, the above key factors ultimately depend on the actual application. Appropriate strategies and parameter initial values need to be determined based on the actual performance of the sensor and the actual application scenario.
3. Experimental Setup
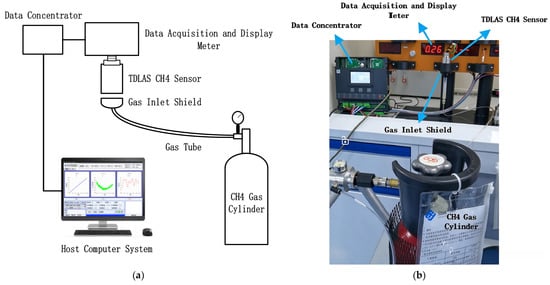
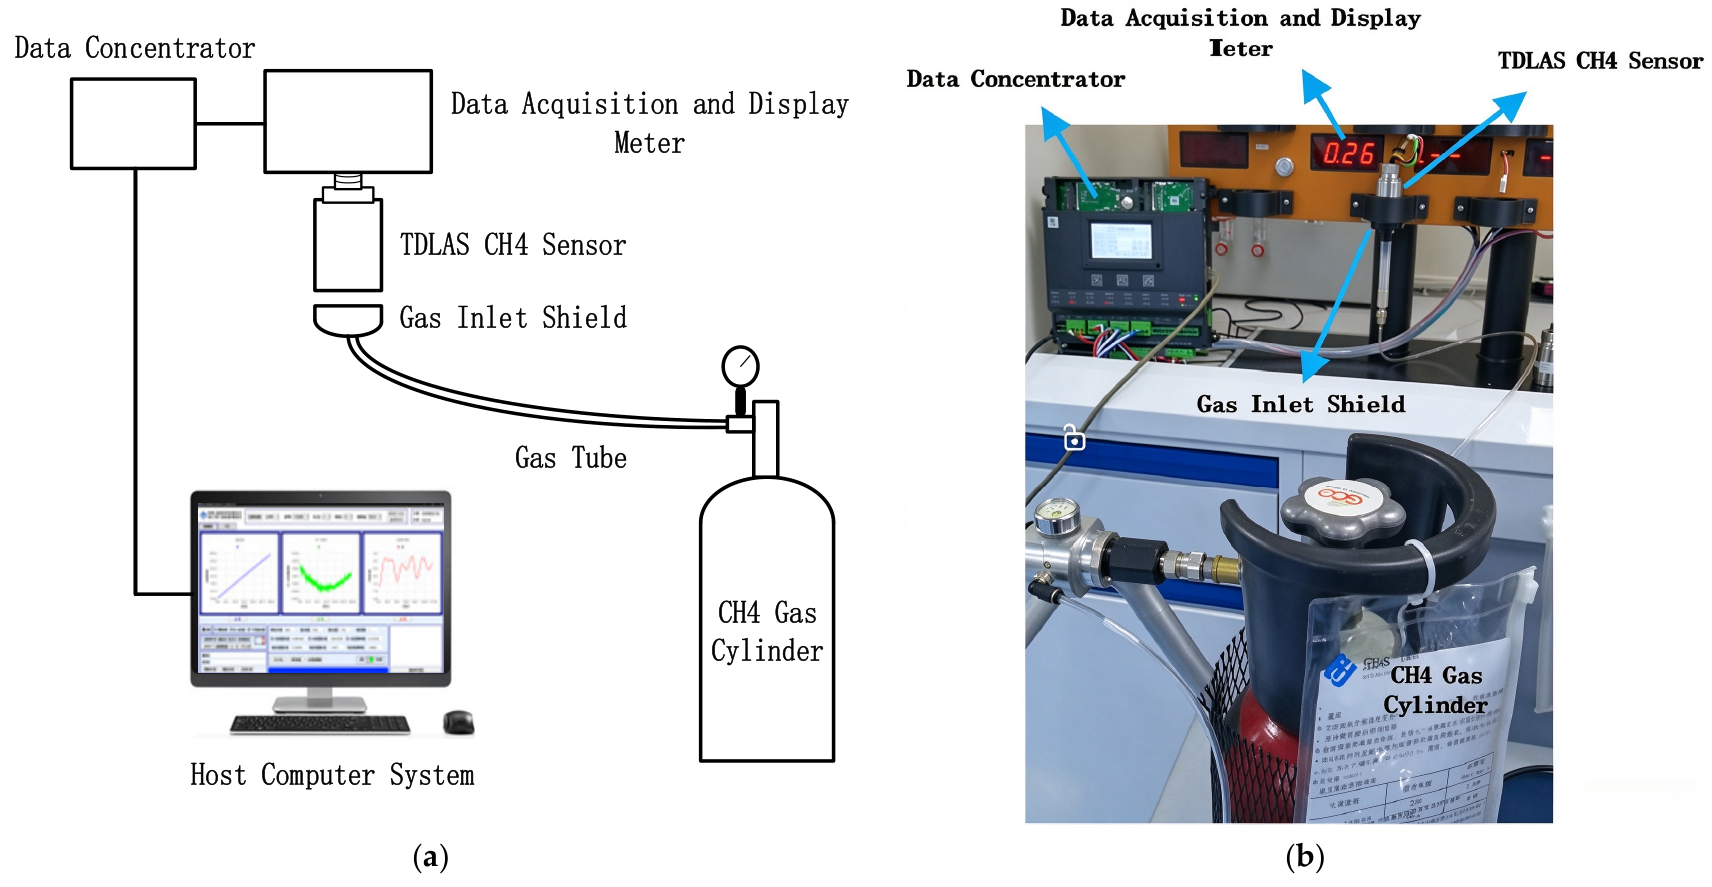
This paper employs the TDLAS methane gas sensor module developed and manufactured by Tiandi (Changzhou) Automation Co., Ltd. (Changzhou, China). as the hardware experimental system. The sensor has a measurement range of 0–100% (volume fraction), with a detection accuracy of ±0.05% in the 0–1% range and ±5% of the true value in the 1–100% range. Its operating temperature range is −10 °C to 50 °C, and its operating pressure range is 80 kPa to 120 kPa. The sensor employs a TO-packaged semiconductor laser as the light source. The laser has a scanning width of approximately 600 pm. The operating temperature of the laser is precisely controlled at 28 °C (with an absolute temperature control error of less than 0.04 °C), thereby stabilizing the central wavelength of its scanning range at 1650.96 nm. This sensor model has been widely applied in online monitoring of methane gas in underground coal mine atmospheres in China. To simulate complex spectral background interference, a semiconductor laser exhibiting nonlinear drift in output optical power was deliberately selected and substituted into the aforementioned TDLAS methane sensor module. Furthermore, the reflective mirrors of the gas absorption cell within the sensor module were contaminated with coal dust; through repeated trials and selective screening, the level of stray light was made sufficiently high to produce an obvious etalon effect. The experimentally modified TDLAS methane gas sensor was then used to construct the system shown in Figure 3.
Figure 3.
Experimental setup. (a) Topology diagram of the experimental system. (b) Partial view of the experimental system.
In the experiments, the measurement range of methane gas from 0 to 100% is divided into four segments: 0–1%, 1–10%, 10–50%, and 50–100%. Given the precise control of the laser operating temperature by the sensor, for the methane gas absorption spectral signals of all concentrations, the 1561st sampling point corresponds to the central wavelength of the laser scanning range, i.e., 1650.96 nm. A sensor from the same batch with good operating conditions was selected as the standard sensor. Under laboratory conditions, methane gas with the same concentration as the reference concentration in each concentration segment was successively introduced into the standard sensor. The standard sensor acquired raw spectral signal data with almost no interfering background and exported the data based on the Modbus protocol. After the raw spectral signal data were obtained, the aforementioned conventional method was used to fit and subtract the spectral background, and the corresponding reference gas characteristic absorption lines were finally obtained through Gauss–Newton fitting iterations. For the 0–1% range, the reference concentration is 0.5%, with a peak intensity of 0.0199 and a linewidth of 142 sampling points. For the 1–10% range, the reference concentration is 3.5%, with a peak intensity of 0.1539 and a linewidth of 164 sampling points. For the 10–50% range, the reference concentration is 20%, with a peak intensity of 0.8873 and a linewidth of 172 sampling points. The reference concentration for the 50–100% range is 85%. Without loss of generality, and for safety considerations, the concentrations of the methane gas samples selected in this experiment are all below 50%. The initial values of parameters a1, a2, a3, a4, A, f, φ0 and β are 1.5 × 10⁻⁷, −6.7 × 10⁻⁴, 1.6, 683, 40, 1.7 × 10⁻³, 0 and 1 respectively. The reference gas characteristic absorption line within the concentration segment of 0–1% is used as the initial reference gas characteristic absorption line. The window expansion strategy is as shown in Figure 1 and the number of iterations, N, is 100.
4. Analysis
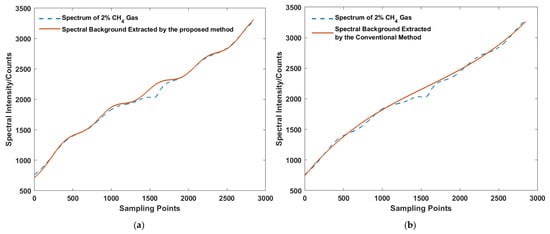
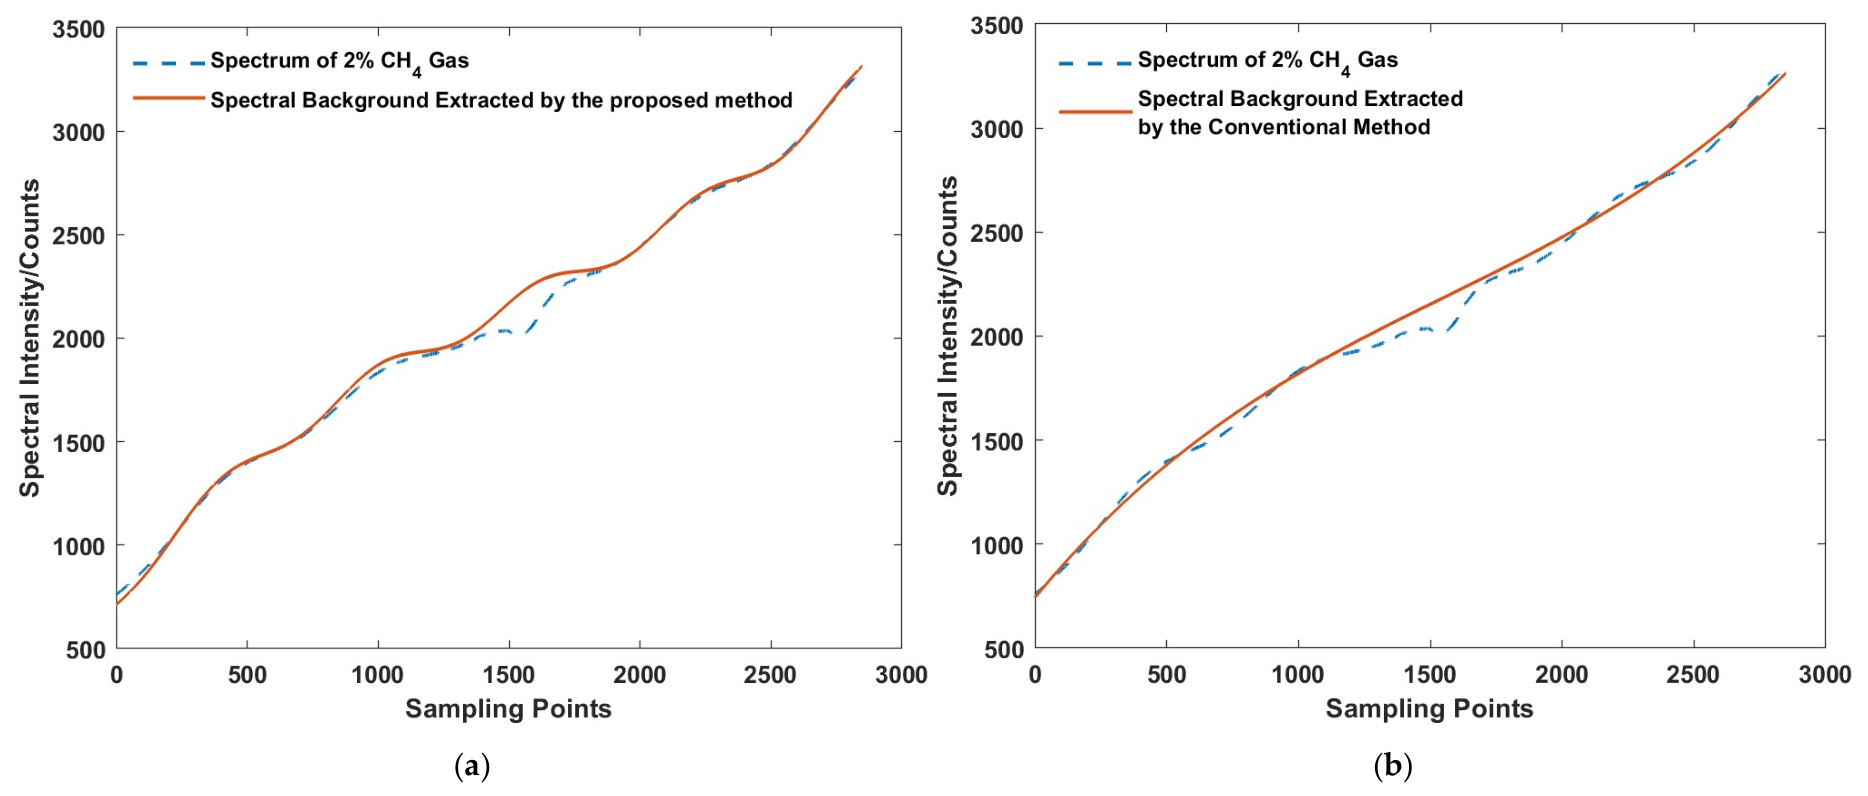
The experimental system acquires the raw spectral signals of methane standard gases at various concentrations, with air used as the balance gas. Following the aforementioned method for the extraction and quantitative analysis of characteristic gas absorption lines, the characteristic absorption spectral lines are extracted from the raw spectral signals, and the gas concentrations are subsequently calculated. As stated in the introduction section, the conventional method based on spectral background fitting and spectral background subtraction still dominate TDLAS industrial field applications. To demonstrate the performance advantages of the proposed method, the comparative analyses were conducted between the proposed method and the conventional method in terms of spectral background fitting, gas characteristic line extraction, and quantitative gas concentration analysis. Taking methane standard gas with a concentration of 2% as an example, its extracted spectral background is presented in Figure 4a.
Figure 4.
Spectral background extraction of 2% methane gas by the proposed method and the conventional method. (a) Spectral background extraction by the proposed method. (b) Spectral background extraction by the conventional method.
The figure demonstrates that the proposed method achieves high-precision fitting of the spectral background containing interference such as the etalon effect. Within the spectral background ranges of the spectral signal (sampling points 1–1000 and 2001–2849), the correlation coefficient between the spectral background predicted by the proposed method and the original spectral signal reaches 0.9997. By contrast, the spectral background predicted by the conventional method fails to capture the detailed fluctuations induced by the etalon in the spectral background, as shown in Figure 4b. Over the same spectral background ranges, the correlation coefficient between the spectral background predicted by the conventional method and the original spectral signal is only 0.9985. An attempt was also made to incorporate a cosine function into the conventional method to fit the detailed fluctuations caused by the etalon effect in the spectral background; however, since the conventional method is based on least-squares fitting, it rapidly falls into a local minimum during computation, which instead increases the prediction error of the spectral background.
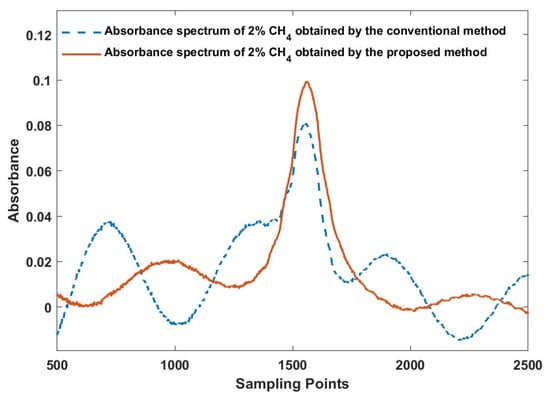
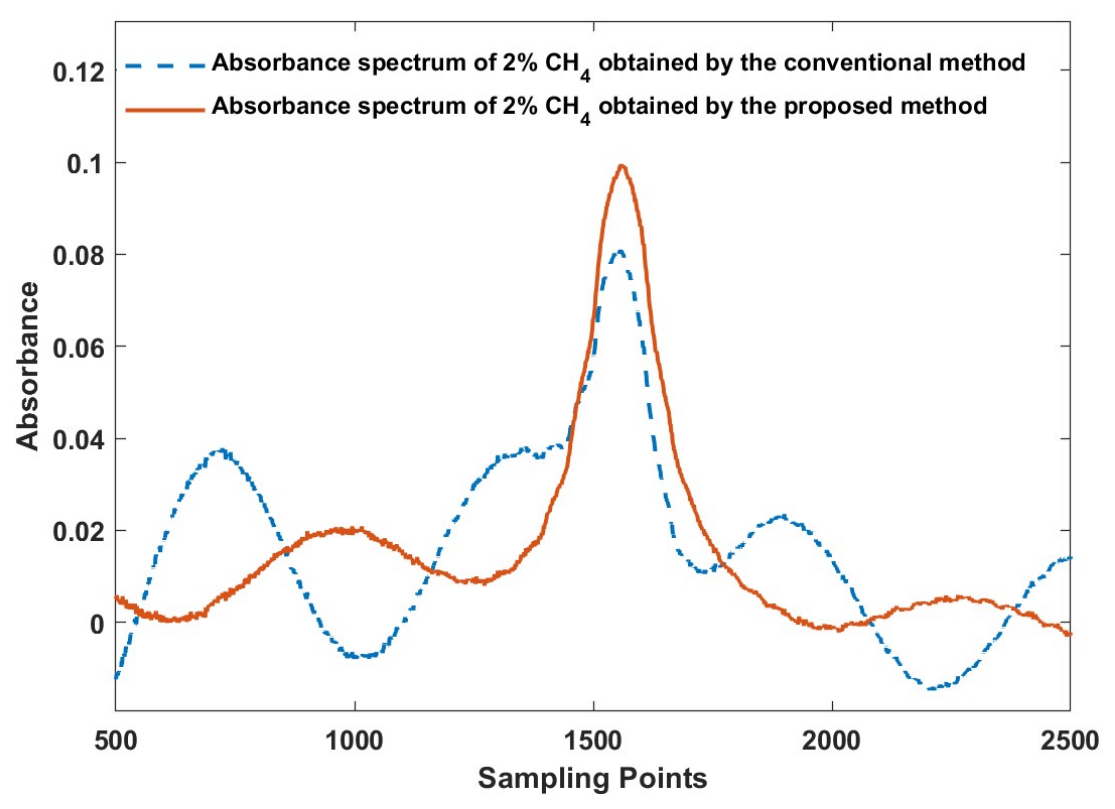
Furthermore, the spectral backgrounds extracted by the two methods were subtracted from the original spectral signal to obtain the corresponding absorbance spectra, and the comparison is shown in Figure 5.
Figure 5.
Absorbance spectra of 2% methane gas obtained by the proposed method and the conventional method.
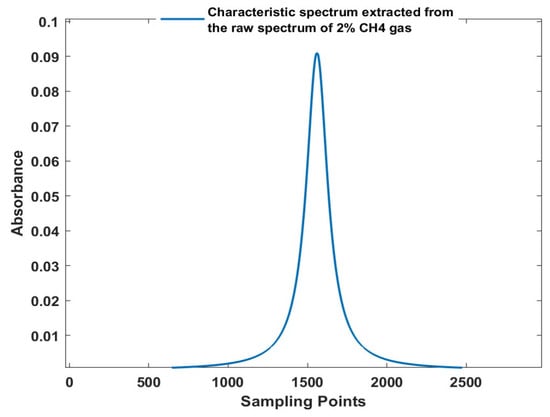
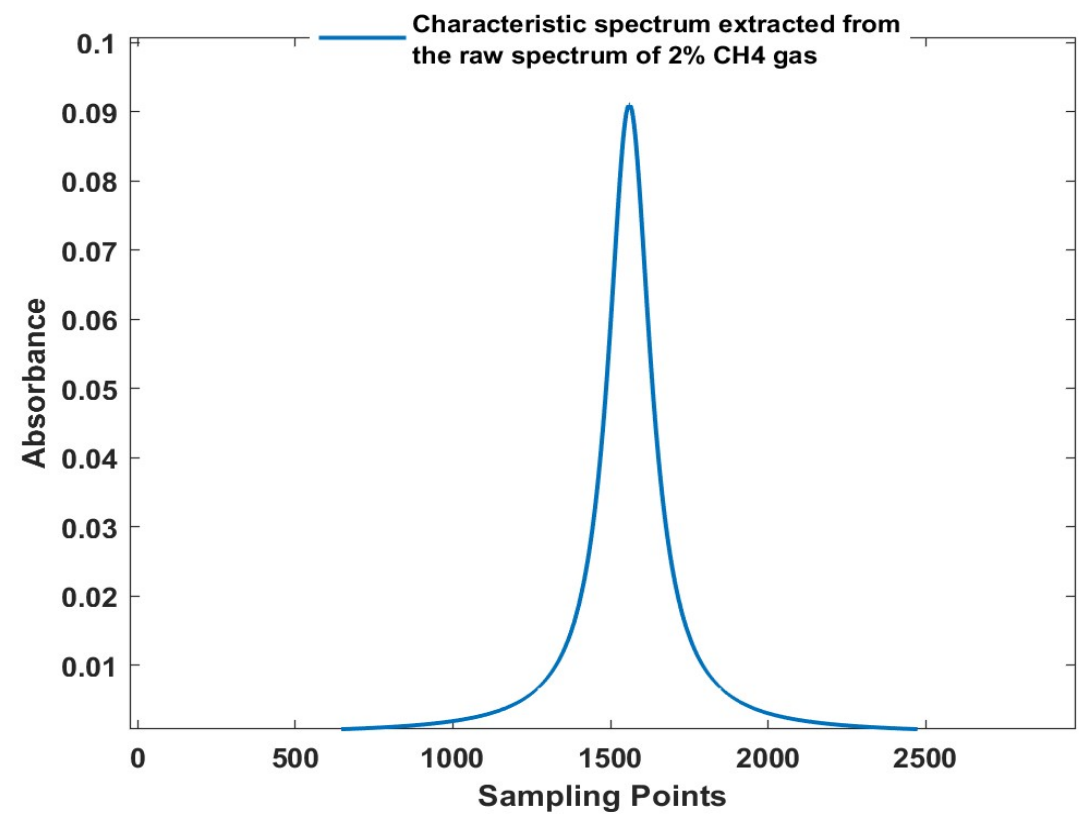
As can be seen from the figure, compared with the conventional method, the signal-to-noise ratio (SNR) of the absorbance spectrum obtained by the proposed method is significantly improved, reaching above 5, whereas that obtained by the conventional method is less than 2. The above comparison demonstrates the performance advantage of the proposed method in spectral background prediction. However, according to the aforementioned principle, the proposed method does not need calculation of the absorbance spectrum. On the basis of accurately predicting the spectral background, and relying on the pre-stored reference characteristic lines and the global search mechanism, the proposed method can directly extract the characteristic absorption lines of the gas to be measured, as shown in Figure 6.
Figure 6.
Extraction of characteristic absorption lines of 2% methane gas by the proposed method.
Meanwhile, an accurate prediction of the gas concentration to be measured is obtained, with a predicted concentration of 2.07% and an absolute error of only 0.07%. In contrast, when the conventional method is used, further fitting of the gas characteristic peak in the absorbance spectrum and calculation of the concentration via the quantitative regression curve are still required. If the acquisition of the absorbance spectrum is affected by the etalon effect, the subsequent fitting of the gas characteristic peak and the calculation of the gas concentration in the conventional method will also be affected, thereby reducing its detection accuracy.
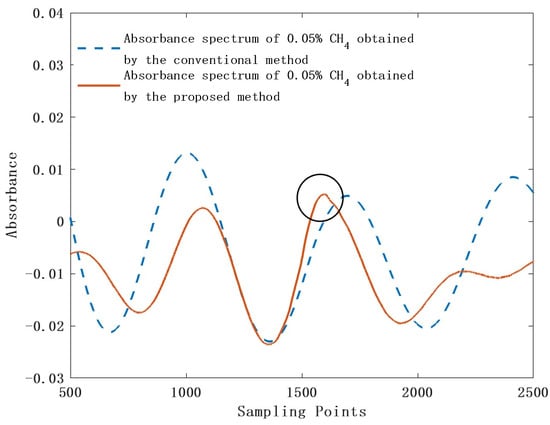
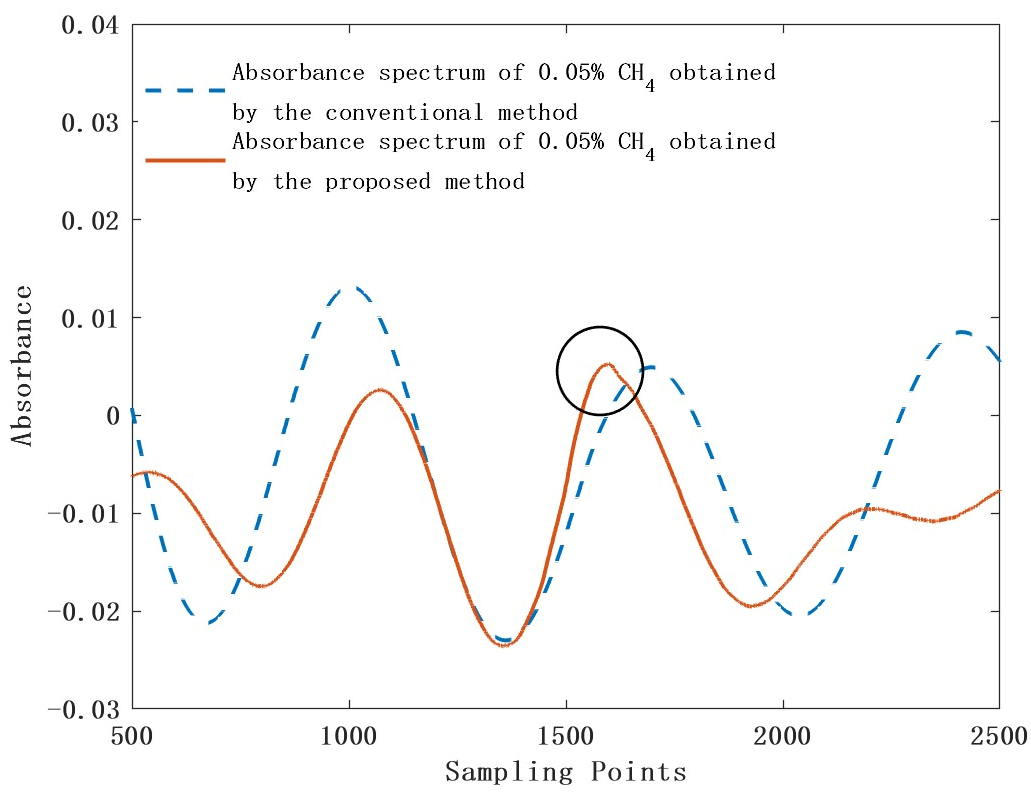
Furthermore, taking 0.05% methane gas as an example, the corresponding absorbance spectra were obtained by the proposed method and the conventional method, respectively, as shown in Figure 7. As can be seen from the figure, when the conventional method is used, the gas characteristic absorption peaks in the obtained absorbance spectrum are completely submerged in noise. Even if the gas characteristic peaks are subsequently fitted and the peak values or areas are introduced into the regression curve to quantitatively calculate the gas concentration, the resulting concentration value is no longer meaningful for reference. When the proposed method is used, the noise in the obtained absorbance spectrum is slightly suppressed, and faint gas characteristic absorption peaks can be vaguely observed superimposed on the noise in the circle of Figure 7.
Figure 7.
Absorbance spectra of 0.05% methane gas obtained by the proposed method and the conventional method.
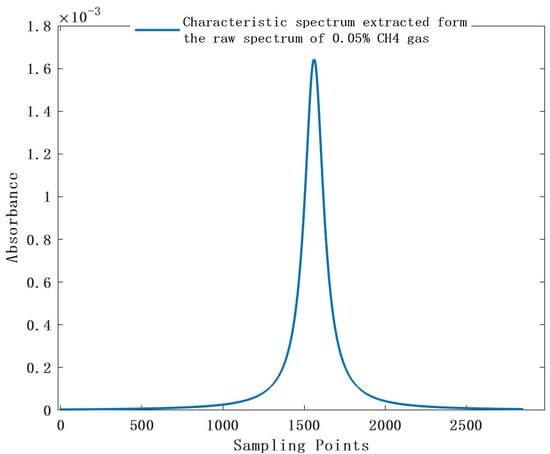
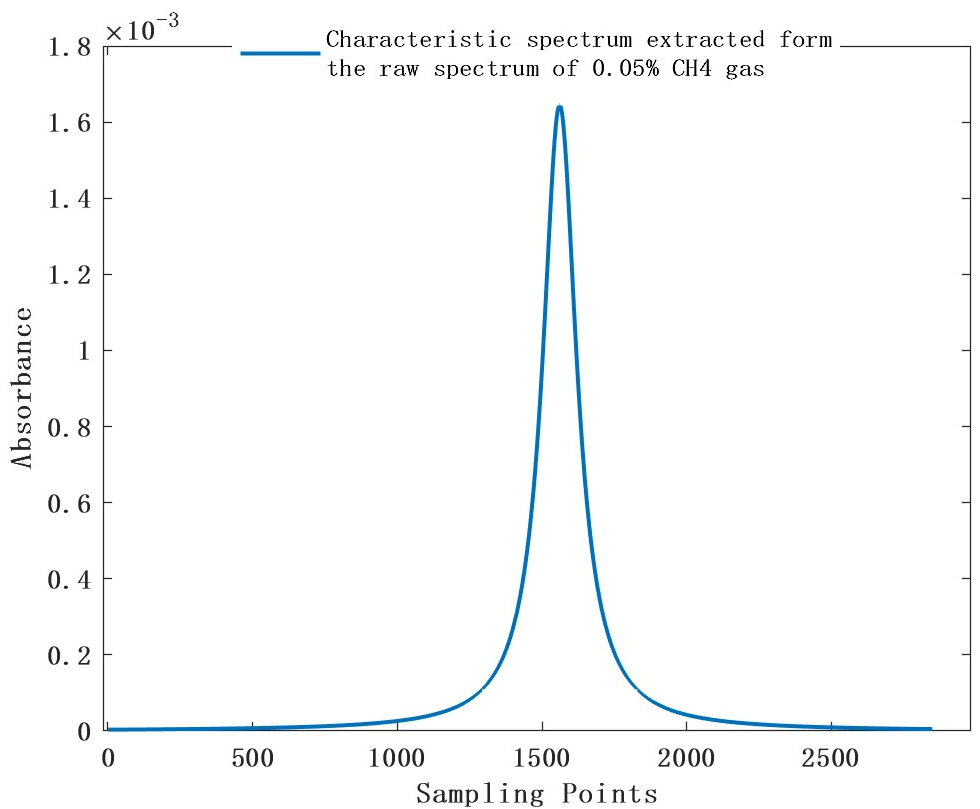
With the conventional method, however, such an absorbance spectrum still cannot be resolved to ultimately obtain an accurate predicted gas concentration. In contrast, with the proposed method, the characteristic absorption line of the gas to be measured can still be directly extracted based on the pre-stored reference characteristic lines and the global search mechanism, as shown in Figure 8, and an accurate predicted gas concentration of 0.04% is simultaneously obtained, with an absolute error of only 0.01%. The comparison of the spectral analysis of 0.05% methane gas shows that the proposed method has a more significant advantage in resolving low-concentration gas spectra: it can still extract weak low-concentration gas characteristic absorption peaks from spectral signals containing interference such as the etalon effect and provide an accurate prediction of the gas concentration.
Figure 8.
Extraction of characteristic absorption lines of 0.05% methane gas by the proposed method.
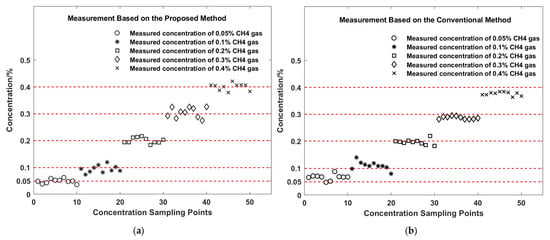
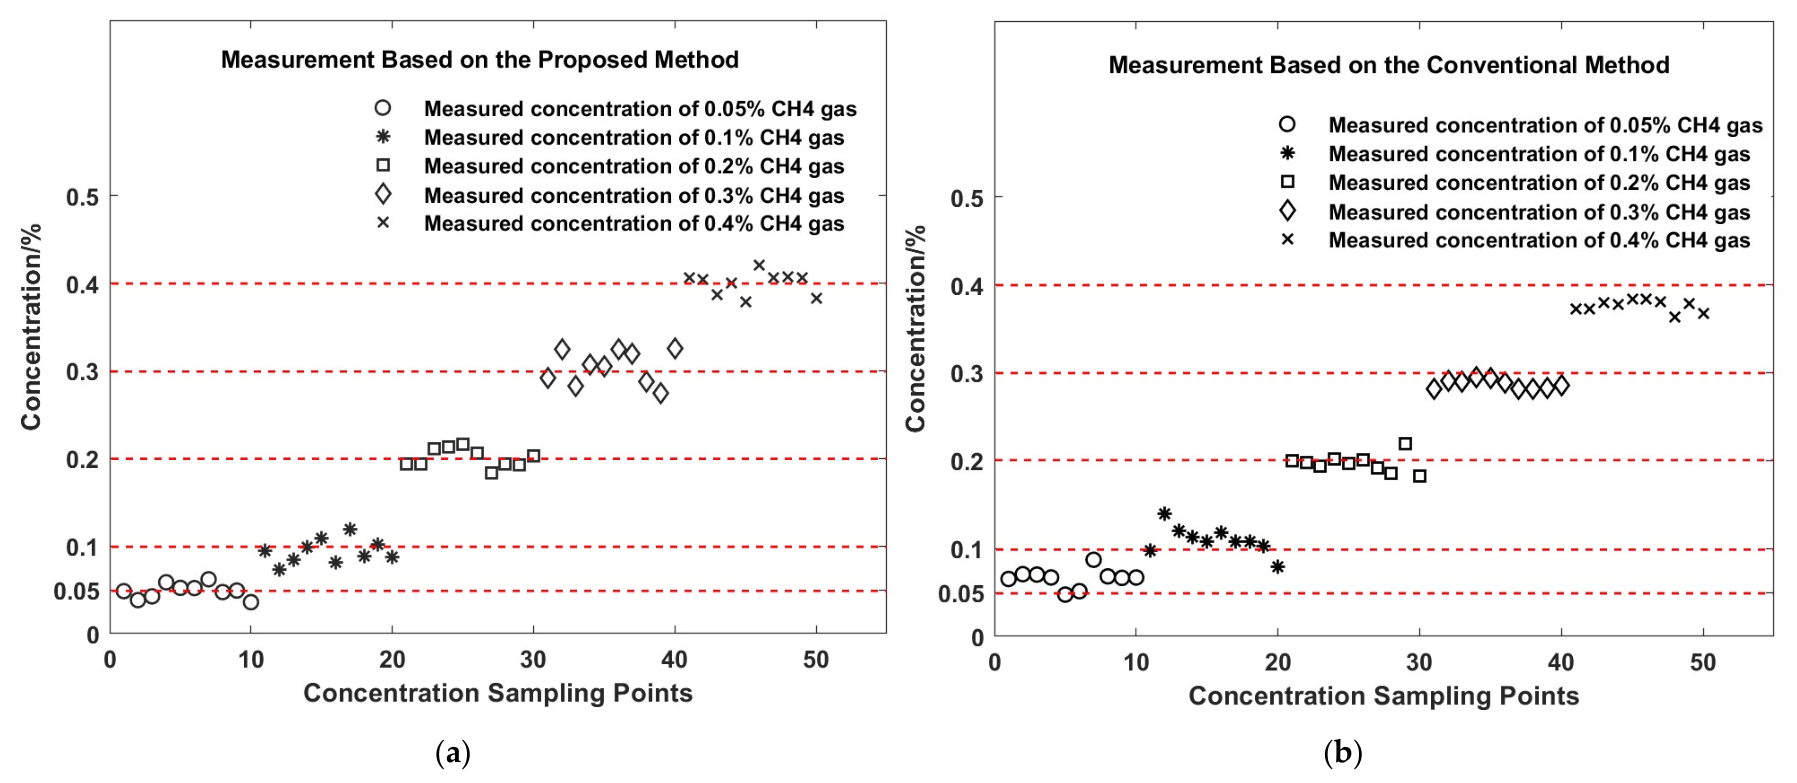
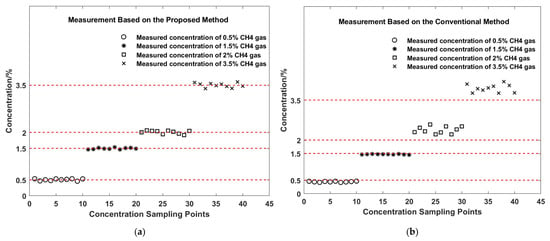
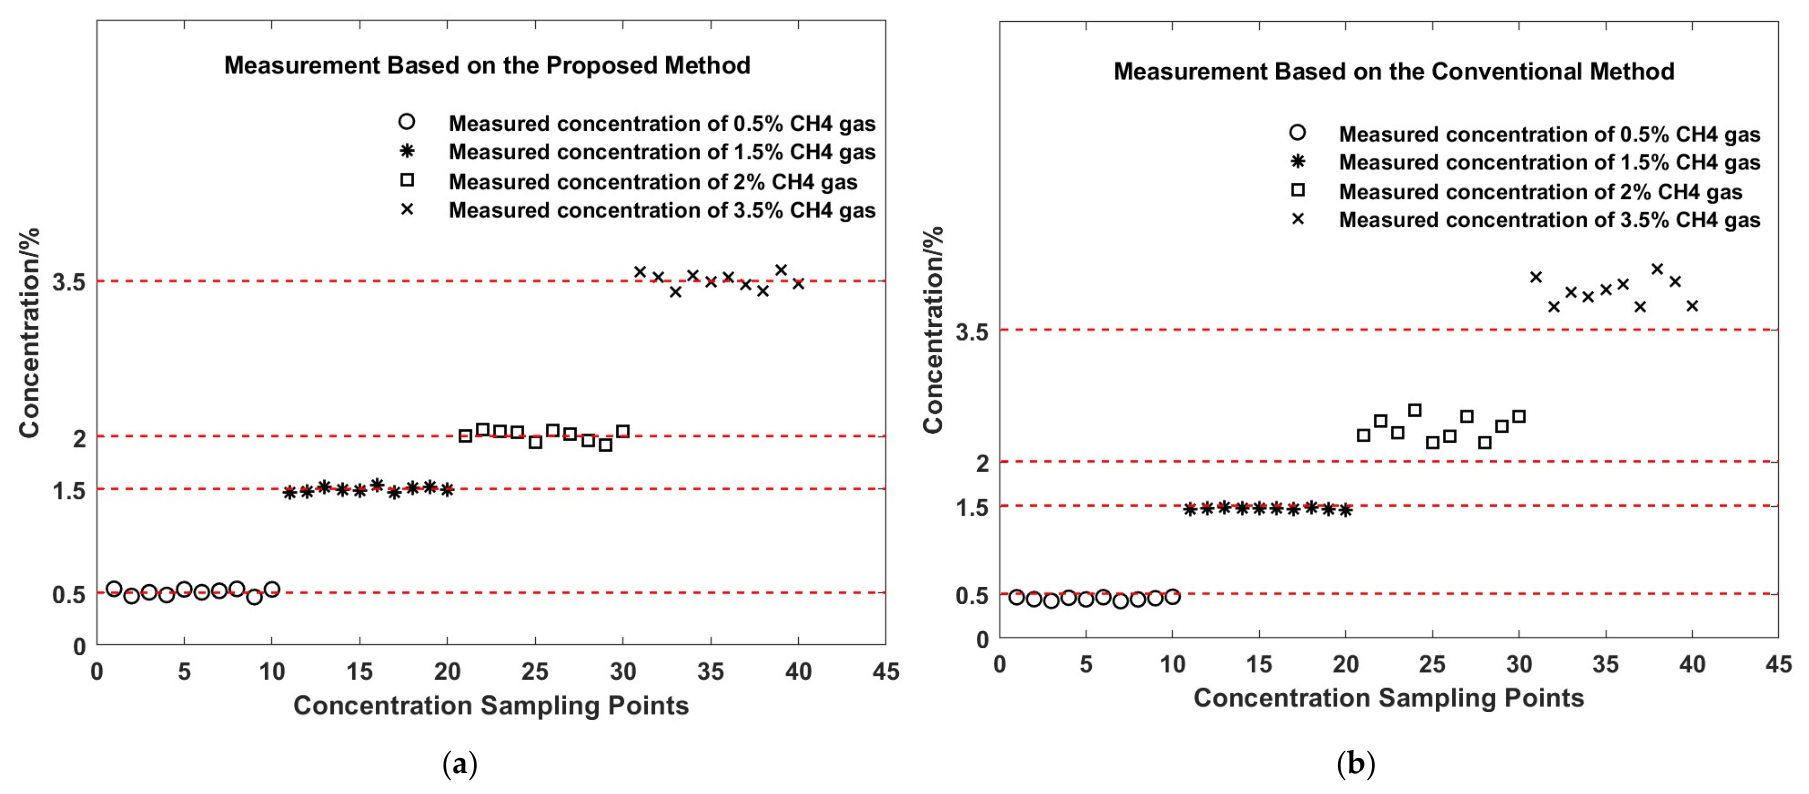
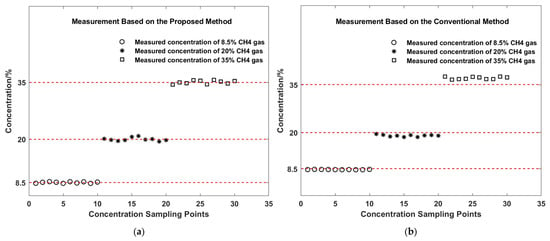
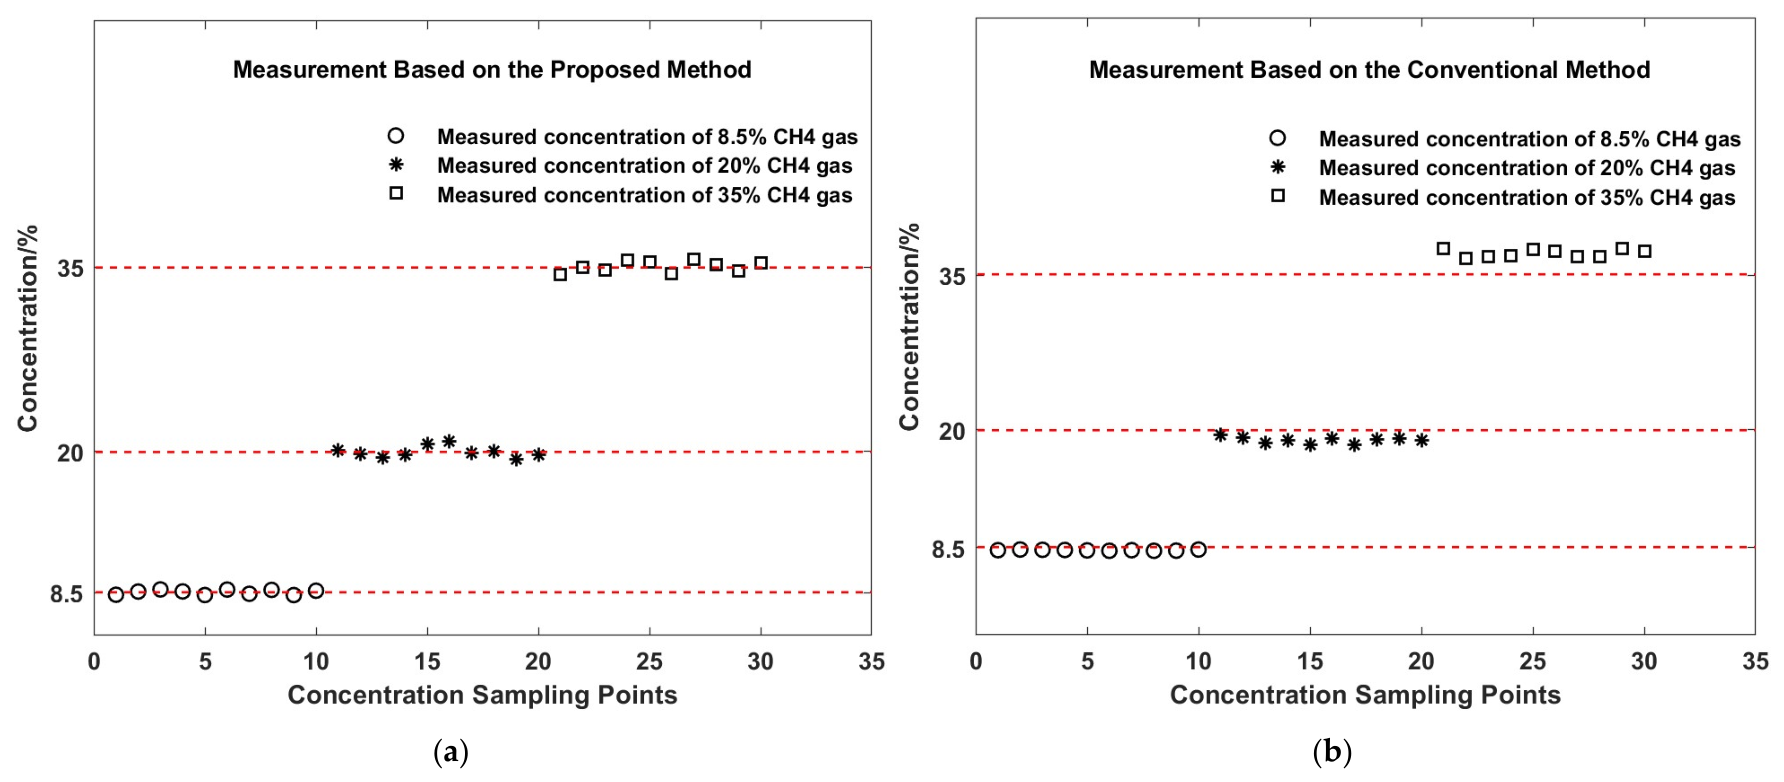
To further validate the effectiveness of the proposed method in extracting gas characteristic absorption lines under complex spectral backgrounds, a comparative analysis was conducted between the proposed method and an existing conventional method in actual detection experiments. The conventional method employs polynomial fitting using spectral data points far away from the gas absorption peak to estimate and subtract the spectral background, followed by fitting and extraction of the gas absorption peak from the background-subtracted spectrum. The algorithm proposed in this work was implemented in embedded code and alternately downloaded, along with the embedded program of the conventional algorithm, into the same TDLAS methane gas sensor in the experimental system. A series of methane standard gases with different concentrations were measured, with concentration levels of 0.05%, 0.1%, 0.2%, 0.3%, 0.4%, 0.5%, 1.5%, 2%, 3.5%, 8.5%, 20%, and 35%. The detection results are presented in Figure 9, Figure 10 and Figure 11.
Figure 9.
The concentration range of methane standard gases is 0.05–0.4%. (a) Detection results of the proposed method. (b) Detection results of the conventional method.
Figure 10.
The concentration range of methane standard gases is 0.5–3.5%. (a) Detection results of the proposed method. (b) Detection results of the conventional method.
Figure 11.
The concentration range of methane standard gases is 8.5–35%. (a) Detection results of the proposed method. (b) Detection results of the conventional method.
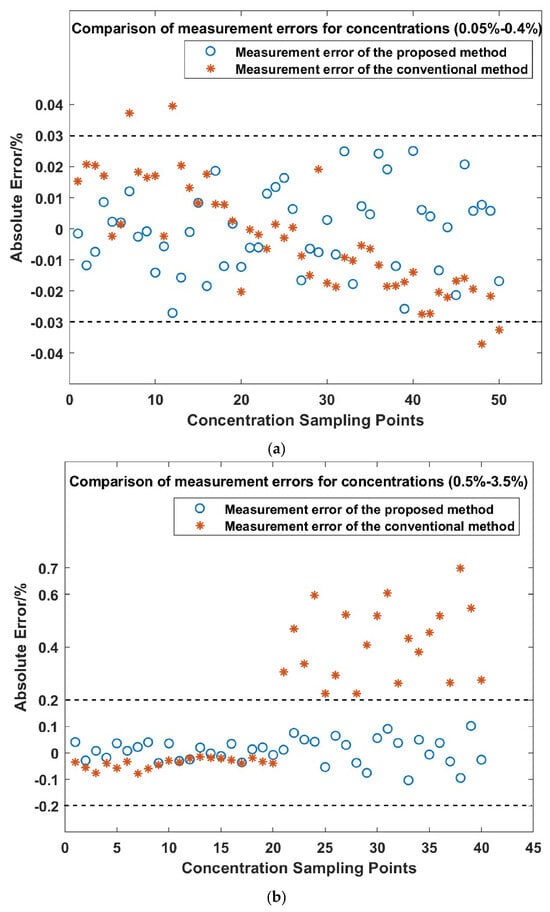
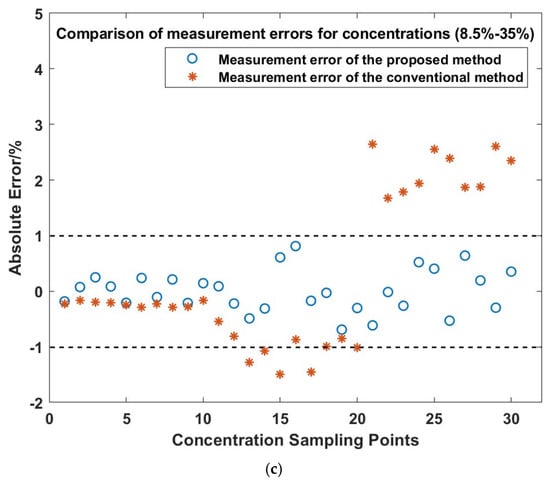
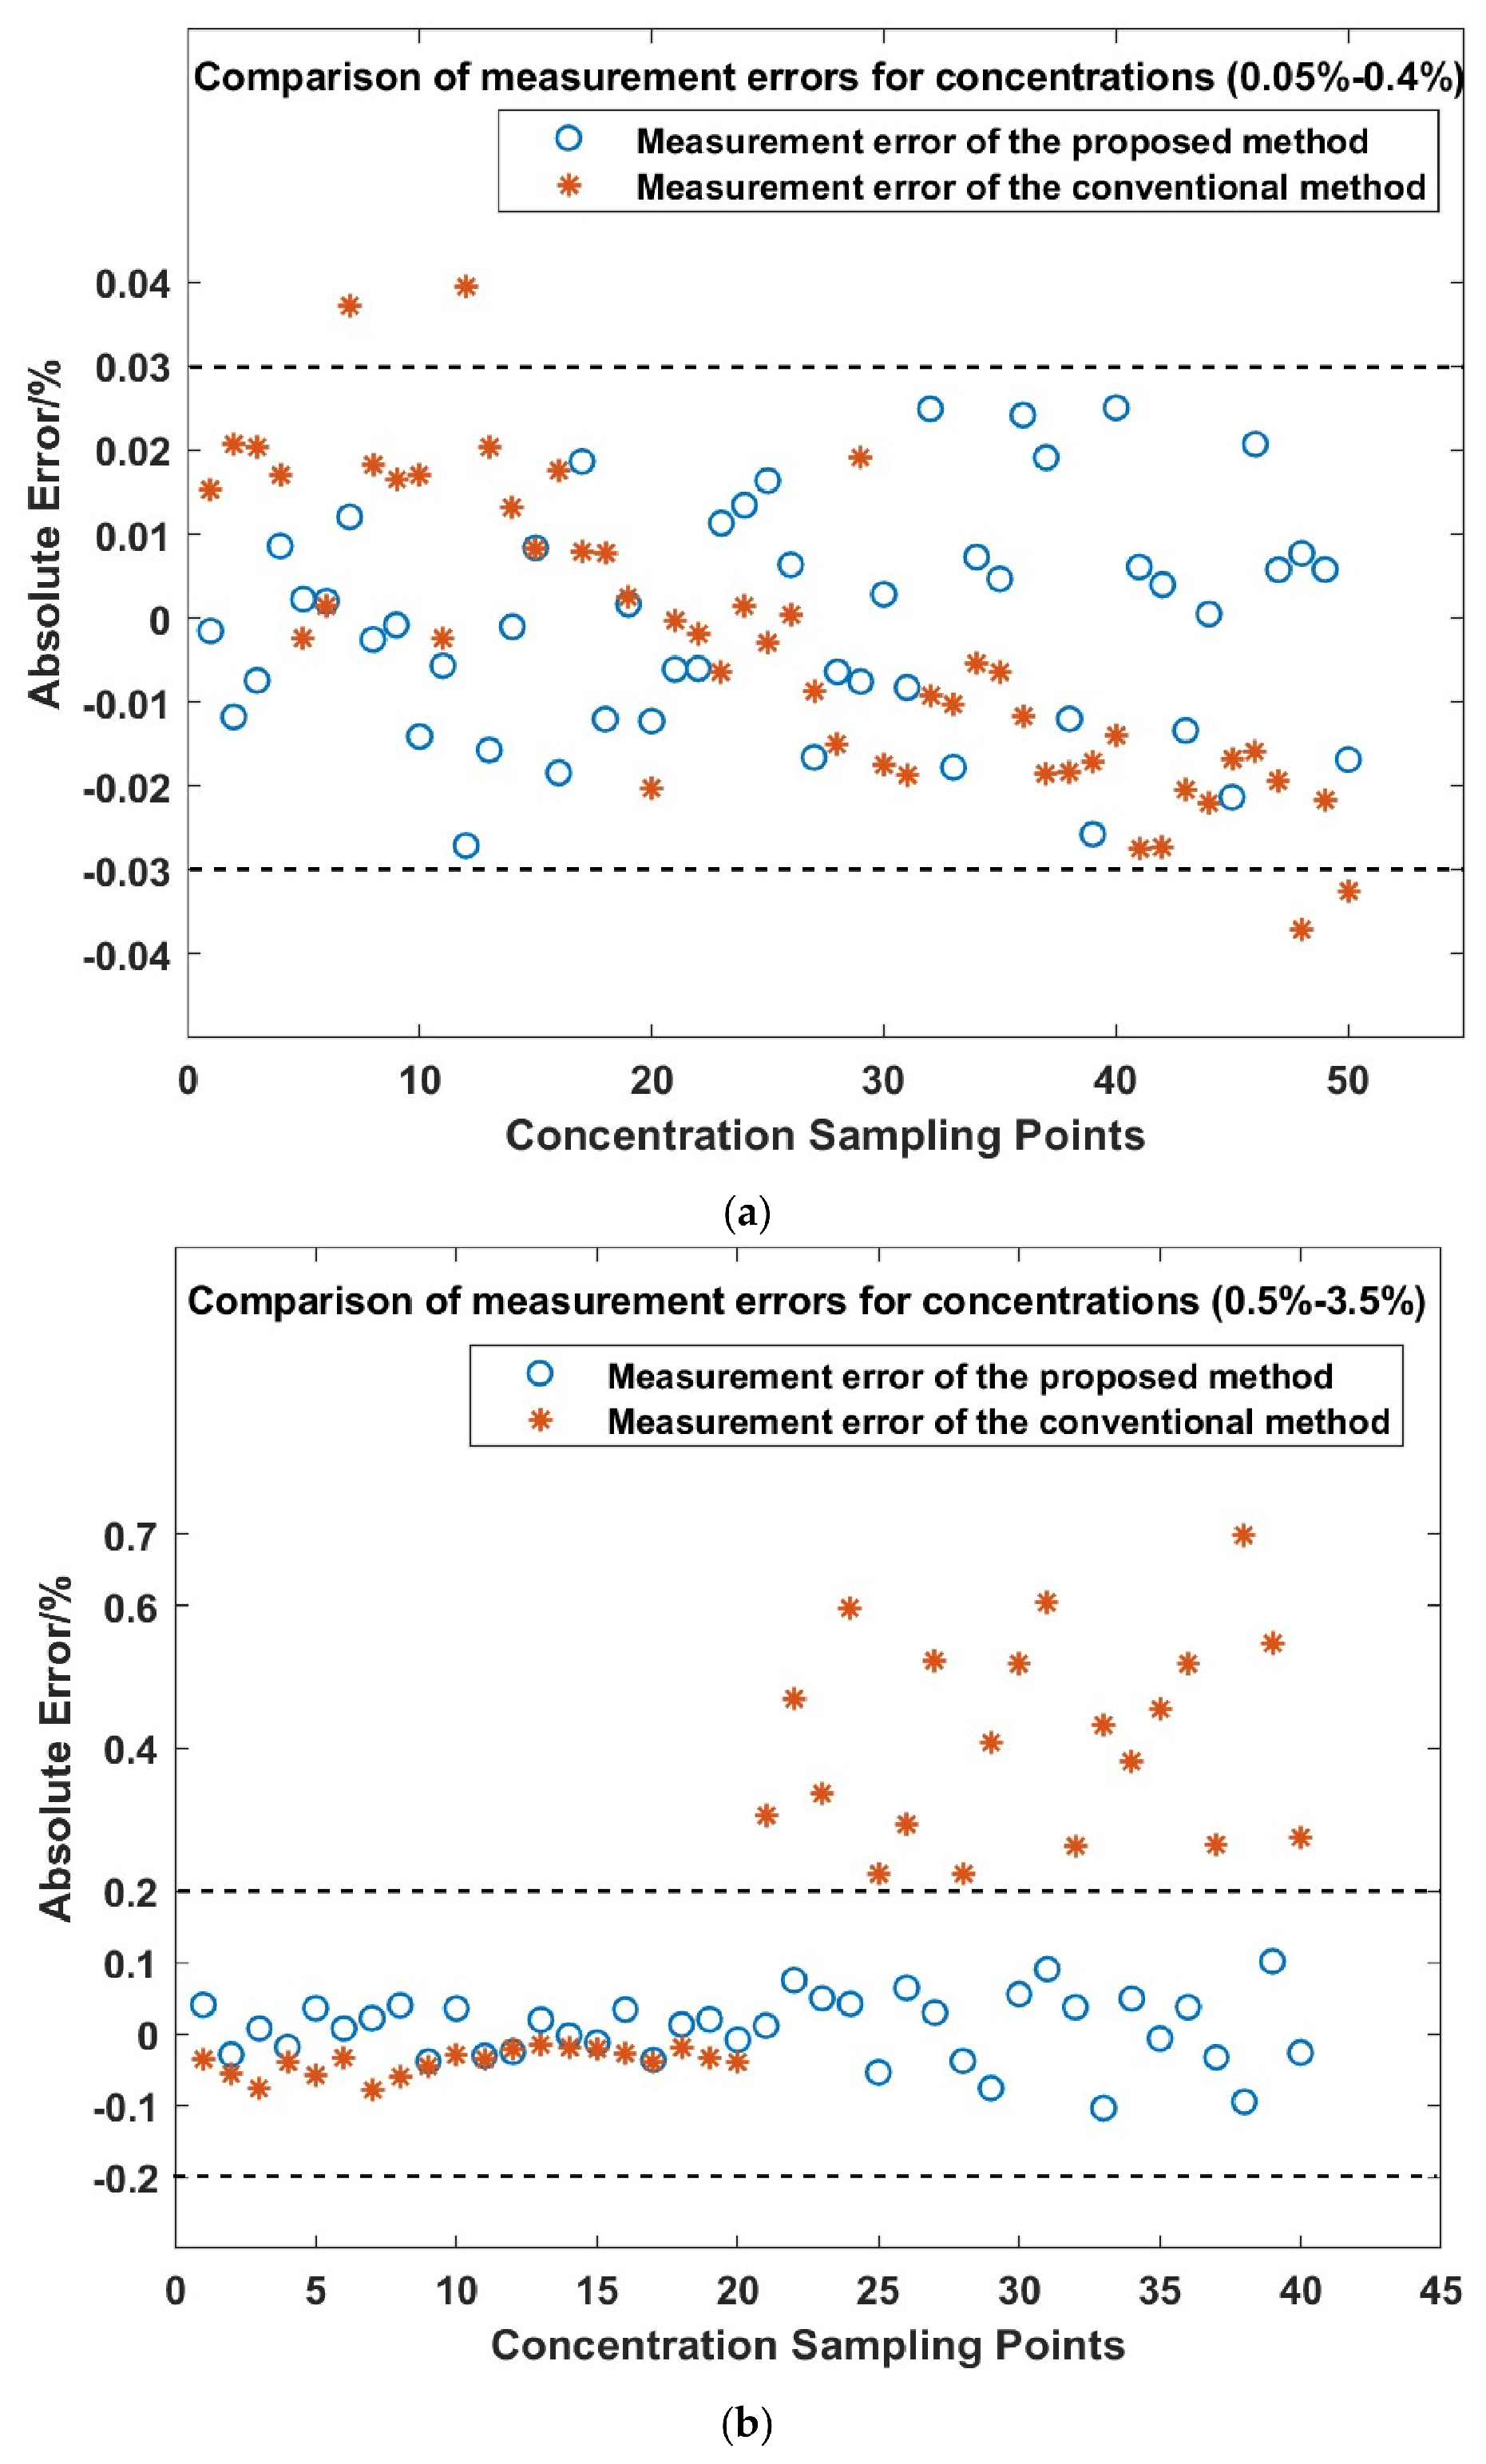
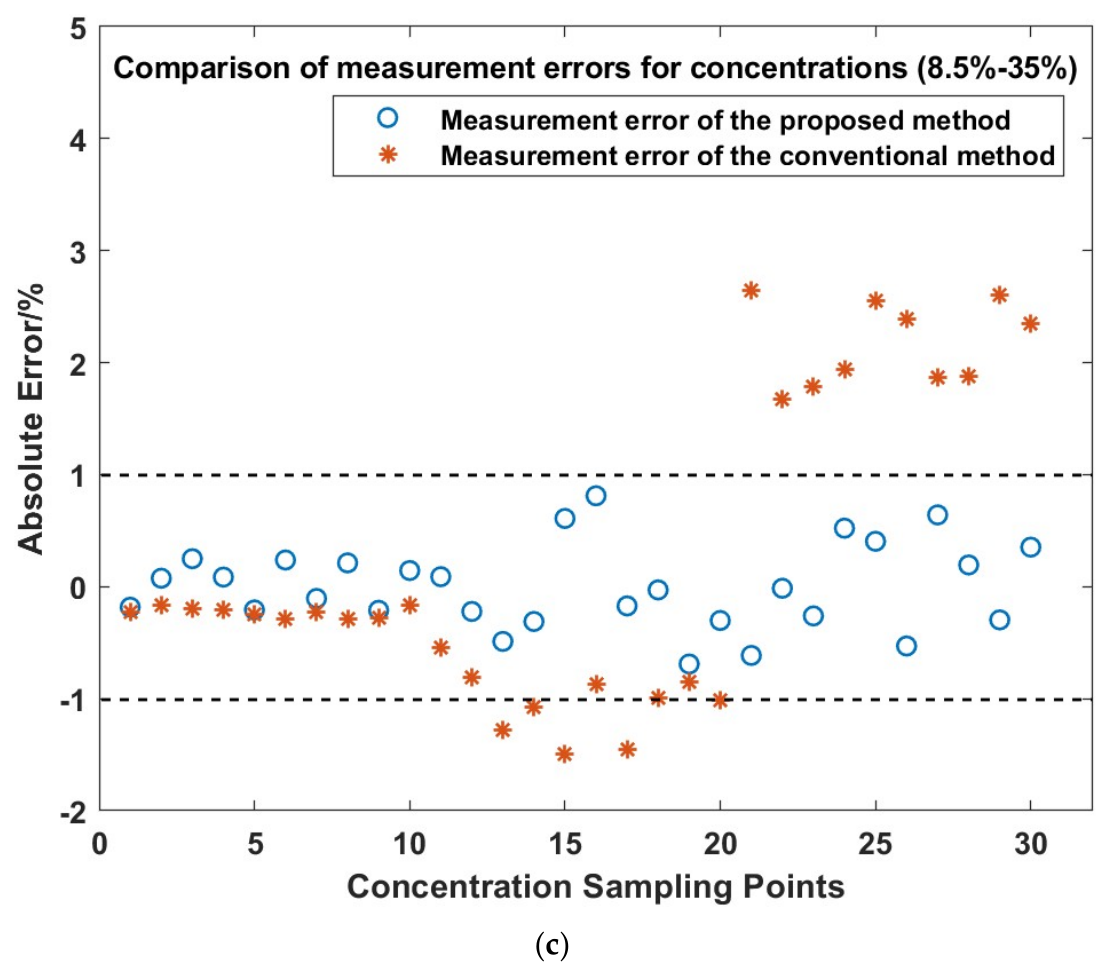
A preliminary observation from Figure 9, Figure 10 and Figure 11 indicates that the detection results obtained by the proposed method are closely distributed around the true values, demonstrating high overall detection accuracy. In contrast, some results from the existing conventional methods exhibit significant overall deviations from the true values, as shown in Figure 10b. An intuitive comparison of the errors between the two detection approaches is provided in Figure 12.
Figure 12.
Comparison of detection errors between the proposed method and the existing conventional method for the same batch of methane standard gases. (a) The concentration range of methane standard gases is 0.05–0.4%. (b) The concentration range of methane standard gases is 0.5–3.5%. (c) The concentration range of methane standard gases is 8.5–35%.
As can be seen from Figure 12, under complex spectral background interference, the conventional method fails to overcome the influence of such interference, resulting in considerable prediction errors for gas concentration values. For instance, in the concentration range of 8.5–35%, some errors approach 3%, which already exceeds the error tolerance limit specified for methane gas sensors in Chinese coal mines. In contrast, the proposed method achieves substantially lower detection errors: in the range of 0.05–0.4%, the absolute detection error is within ±0.03%; in the range of 0.5–3.5%, within ±0.2%; and in the range of 8.5–35%, within ±1%. All concentration prediction errors fall well within the allowable error limits for methane sensors in Chinese coal mines (i.e., absolute error ≤ 0.05% for the 0–1% range, and relative error ≤5% of the actual value for the 1–100% range). The experimental results using multiple standard gas concentrations demonstrate that the proposed method can, to a certain extent, overcome spectral background interference, extract characteristic absorption lines of the target gas, and simultaneously achieve accurate gas concentration prediction within the sensor measurement range.
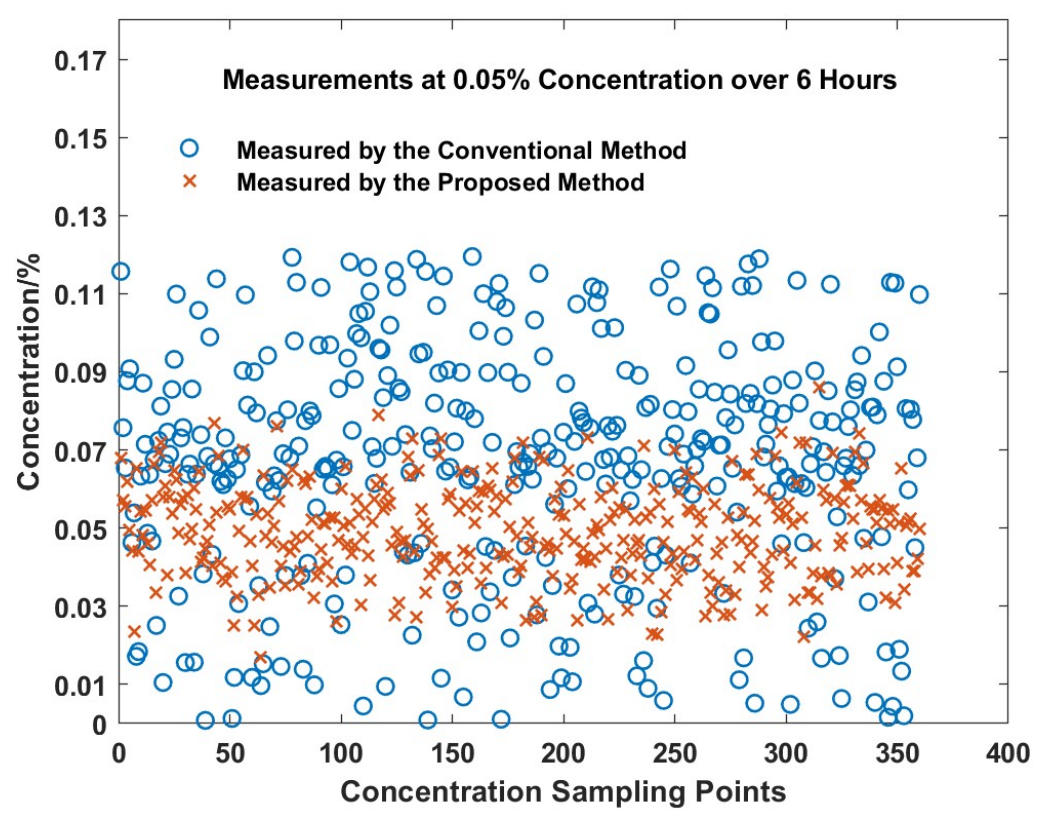
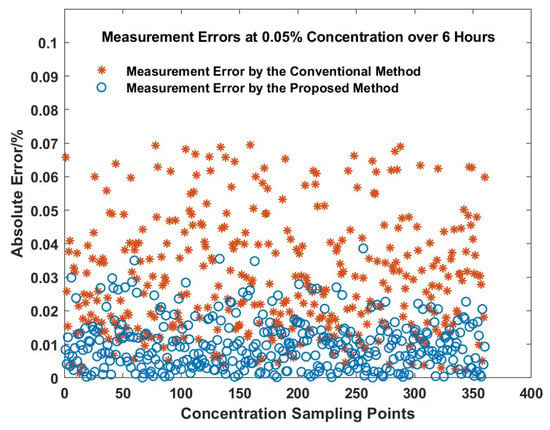
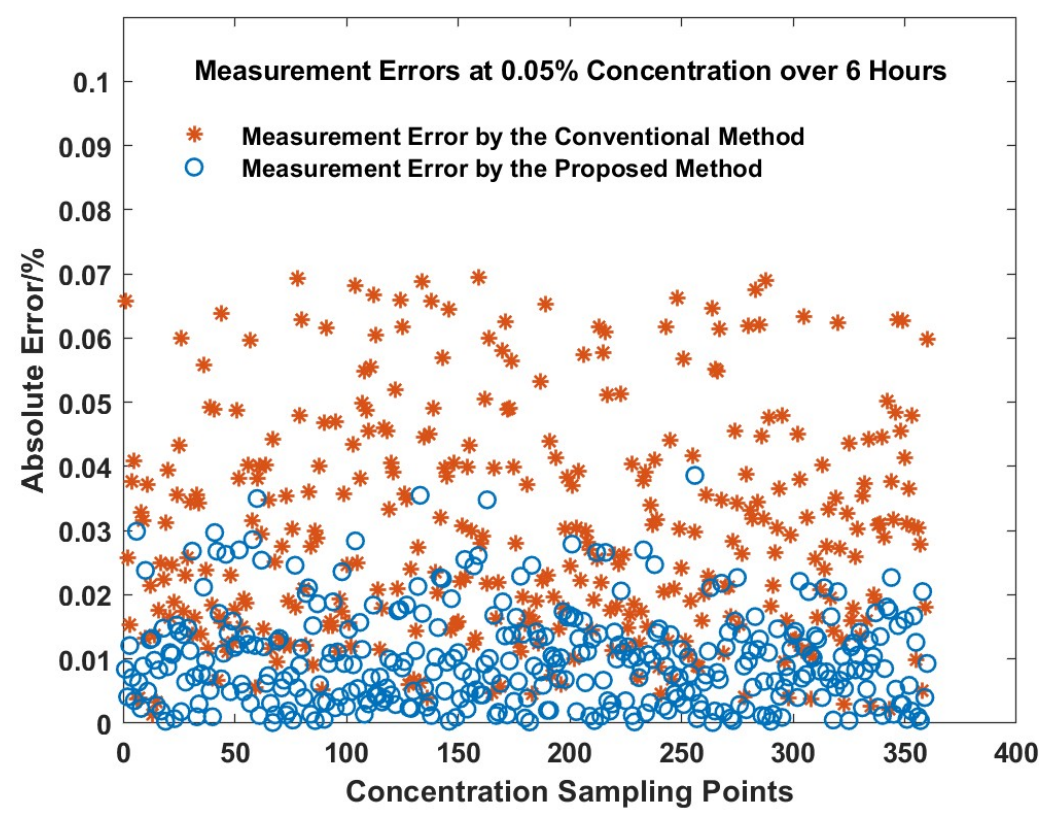
The concentration of 0.05% is the detection limit required by the technical specifications of the sensor used in the experiment. To further verify the reliability and stability of the proposed method, the same sensor was used, and the programs corresponding to the proposed method and the conventional method were respectively downloaded and placed in the same chamber filled with 0.05% methane gas (balanced with air) for detection. The detection frequency was once per minute, and the exposure time was 6 h for both methods. During this process, the gas in the chamber was refreshed through a gas valve every 1 h to ensure that the methane concentration in the chamber was always maintained at 0.05%. The detection results obtained by the proposed method and the conventional method are shown in Figure 13, and the absolute errors of the detection results are shown in Figure 14.
Figure 13.
Six-hour measurements at 0.05% by using the proposed and conventional methods, respectively.
Figure 14.
Measurement errors at 0.05% over 6 h by using the proposed method and the conventional method, respectively.
According to the statistics, the average detection value of the conventional method is 0.0666%, which has significantly deviated from the true detection value of 0.05%, with a standard deviation of 0.0304%, indicating considerable fluctuation in the detection results. In contrast, the average detection value of the proposed method is 0.0491%, which is very close to the true detection value of 0.05%, and the detection variance is only 0.0124%. Both the detection accuracy and precision are significantly improved. The statistical comparison demonstrates that the proposed method effectively improves the reliability and stability of the sensor.
Since the proposed method requires the reference concentrations and reference gas characteristic absorption lines to be pre-stored in the microcontroller’s memory of the sensor, it requires approximately 5 KB of additional read-only memory space compared with the traditional method. However, taking the sensor used in the experiments of this paper as an example, the built-in microcontroller has 64 KB of memory space, and the traditional method currently uses only about 25 KB. Therefore, current mainstream microcontrollers can fully meet the memory resource requirements of the proposed method. With the aforementioned parameters determined, including the reference concentration segmentation rule, initial values of the fitting parameters, window expansion step size, and number of iterations, the proposed method was run multiple times on the microcontroller of the sensor, and its time overhead was estimated through repeated microcontroller debugging. The conventional method was then run on the same sensor, and its time overhead was estimated in the same manner. When the sensor runs the conventional method, the time required to complete one full detection process (laser temperature control, driving, signal acquisition, and spectral analysis) is approximately 600 ms; when the sensor runs the proposed method, the time required to complete the same detection process is approximately 1160 ms. Compared with the conventional method, the proposed method has higher computational complexity, which nearly doubles the time overhead of the entire sensor detection process. However, the response time required for industrial field applications is usually no less than 10 s, and the main factors affecting the sensor response time come from the design and actual state of the sensor’s waterproof and breathable structure. Therefore, the additional time overhead of approximately 560 ms caused by the proposed method has little effect on the sensor response time parameter. In addition, when the optimized algorithm program makes full use of the microcontroller storage space, there will be the potential to further reduce the time overhead. On the other hand, the power consumption of the sensor mainly comes from the temperature control and driving of the laser, and different spectral analysis methods have almost the same effect on the power consumption of the sensor. In this experiment, whether the sensor runs the proposed method or the conventional method, under a 3.3 V power supply, the average current is approximately 40 mA and the peak current is approximately 100 mA, showing no significant difference in power consumption.
As mentioned in the introduction section, filtering methods such as wavelet transform, owing to their insufficient generalization capability for complex spectral noise, sometimes fail to effectively extract gas characteristic lines in practical industrial applications; neural-network-based algorithms require large amounts of data to train a feasible neural network, whereas industrial fields generally do not have the conditions for large-scale data storage and transmission. Therefore, neither filtering methods such as wavelet transform nor neural-network-based algorithms are currently well suited for spectral analysis in industrial field applications. At present, the conventional method still occupies a dominant position in spectral analysis for industrial field applications. However, the comparative experimental analysis above demonstrates that the proposed method has significant advantages in analyzing spectral signals containing interference such as the etalon effect. A summary of the comparison between the proposed method and the conventional method is presented in Table 1. The table shows that, compared with the conventional method, the proposed method, despite its higher time overhead, can accurately extract gas characteristic lines under complex background interference and simultaneously achieve accurate prediction of gas concentration, with no significant increase in power consumption, demonstrating certain potential for industrial field applications.
Table 1.
Summary of the comparison between the proposed method and the conventional method.
5. Discussion and Conclusions
This paper has proposed a method for extracting characteristic spectral lines and performing quantitative analysis in TDLAS gas sensors under industrial field conditions, where the acquired spectra are often degraded by background interference from laser nonlinearity and etalon effects. The method partitions the sensor’s measurement range into several segments, each storing the reference absorption parameters (central wavelength, peak intensity, and linewidth) corresponding to a known gas concentration. Parameter estimation is carried out via the hill-climbing algorithm with progressive window expansion, which initiates optimization with gradient descent iterations to determine the concentration segment and provide reliable initial values; subsequently, a gradually expanding fitting window guides a global hill-climbing search, attempting to escape the local optima and find the better solutions. Experimental results demonstrate that the proposed approach can successfully extract gas spectral features from heavily contaminated backgrounds and yield accurate concentration predictions. In comparative tests using the same sensor with drifting laser and a polluted gas cell, the proposed method consistently produced significantly lower prediction errors than the existing conventional technique, and the errors remained within the high-precision specifications even under complex spectral interference. These comparative experimental results and analyses show that the proposed method is robust and effective for the industrial applications.
Furthermore, by pre-storing reference spectra for known concentrations in each range segment, the proposed method enables concentration determination directly from the extracted spectral parameters, eliminating the need for subsequent steps such as peak-area integration or calibration-curve inversion. This simplification offers a practical basis for the automated production and calibration of TDLAS sensors. The proposed window-expanding hill-climbing algorithm employs gradient descent iteration as the starting point for parameter optimization, which compensates for the uncertainty inherent in a standalone hill-climbing algorithm and improves the optimization efficiency to a certain extent. Guided by the fitting window expanding from both ends of the spectral signal toward the center, this approach avoids the influence of random parameter initialization on the performance of the hill-climbing algorithm, thereby increasing to a certain extent the probability of finding reasonable parameters within a short time, avoiding an excessive increase in the time overhead of the method, and enhancing the practicality of the method. Nevertheless, the on-site operating environment of TDLAS sensors is highly complex and variable, and the proposed method cannot address all practical issues. For instance, large-range shifts and jitter of gas characteristic absorption peaks following failure of the semiconductor laser temperature control system, cross-interference among multi-component gases, and significant attenuation of optical signal intensity due to severe contamination of the gas cell—all of these can substantially increase the difficulty of spectral signal analysis for gas detection. The spectral analysis methodology for TDLAS gas sensors is a collection of diverse techniques, and appropriate methods should be tailored to the specific application scenarios of the sensor. The proposed method enriches the technical toolkit for spectral signal analysis of TDLAS gas sensors, provides a reference for the design of spectral analysis methods when TDLAS sensors are deployed in industrial field settings, and contributes to enhancing the reliability and stability of such sensors to a certain extent.
Author Contributions
Conceptualization, Y.W. (Yin Wang); methodology, Z.J. and Y.W. (Yin Wang); software, Y.W. (Yin Wang); validation, Y.W. (Yubin Wei); formal analysis, Y.W. (Yin Wang) and Y.Y.; investigation, Y.J.; data curation, Z.J., Y.W. (Yin Wang) and Y.W. (Yubin Wei); writing—original draft preparation, Z.J.; writing—review and editing, Y.W. (Yin Wang) and Y.Y.; visualization, Y.W. (Yin Wang) and Y.Y.; supervision, L.W.; project administration, Z.J. and Y.W. (Yin Wang); funding acquisition, Z.J. and Y.W. (Yin Wang). All authors have read and agreed to the published version of the manuscript.
Funding
This research was funded by Sub-topic of the National Key Research and Development Program of China (2023YFC3009102). This research was funded by the 2026 Annual Project of the Special Fund for Science, Technology, Innovation and Entrepreneurship of Tiandi Science & Technology Co., Ltd. (2026-TD-ZD014). This research was funded by the Jiangsu Funding Program for Excellent Postdoctoral Talent. This research was funded by the Changzhou Science and Technology Plan (Basic Research Special Program) (CJ20264037).
Institutional Review Board Statement
Not applicable.
Informed Consent Statement
Not applicable.
Data Availability Statement
Data available online: https://www.researchgate.net/publication/415233929_Data_for_manuscript_entitled_TDLAS_Spectral_Line_Identification_and_Quantification_based_on_Hill-Climbing_Algorithm_with_Progressive_Window_Expansion (accessed on 5 October 2026).
Conflicts of Interest
Authors Ze Jiang, Yin Wang, Yubin Wei, Yangyang Yu, Yaqiang Ji and Lu Wang were employed by Tiandi (Changzhou) Automation Co., Ltd. and China Coal Technology & Engineering Group Changzhou Research Institute Co., Ltd. The remaining authors declare that the research was conducted in the absence of any commercial or financial relationships that could be construed as a potential conflict of interest. The funders had no role in the design of the study; in the collection, analyses, or interpretation of data; in the writing of the manuscript; or in the decision to publish the results.
References
- Carras, J.N.; Day, S.J.; Saghafi, A.; Williams, D.J. Greenhouse gas emissions from low-temperature oxidation and spontaneous combustion at open-cut coal mines in Australia. Int. J. Coal Geol. 2009, 78, 161–168. [Google Scholar] [CrossRef] [Scilit]
- Ozcelik, M. Spontaneous combustion of coal seams in the Bengiler coal mine in Turkey. Euro-Mediterr. J. Environ. Integr. 2023, 8, 665–674. [Google Scholar] [CrossRef] [Scilit]
- Baba, E.; Matsuse, H.; Hashida, R.; Matsukuma, N.; Maki, Y.; Omoto, M.; Takano, Y.; Motooka, M.; Motooka, H. Sixty Years After a Coal Mine Disaster: Serum Metabolomic Profiles in Older Adults with Long-Term Sequelae of Carbon Monoxide Poisoning: A Cross-Sectional Study. Metabolites 2026, 16, 126. [Google Scholar] [PubMed]
- Lackey, G.; Pfander, I.; Gardiner, J.; Sherwood, O.A.; Rajaram, H.; Ryan, J.N.; Dilmore, R.M.; Thomas, B. Composition and Origin of Surface Casing Fluids in a Major US Oil-and Gas-Producing Region. Environ. Sci. Technol. 2022, 56, 17227–17235. [Google Scholar] [CrossRef] [Scilit] [PubMed]
- Sadeghi, B.; Pouyaei, A.; Choi, Y.; Rappenglueck, B. Influence of seasonal variability on source characterisitics of VOCs at Houston industrial area. Atmos. Environ. 2022, 277, 119077. [Google Scholar] [CrossRef] [Scilit]
- Zhao, H.; Cheng, Y.; Liu, Y.; Wang, X.; Wang, Y.; Wang, S.; Jin, T. Characteristics of Volatile Organic Compounds Emissions and Odor Imapact in the Pharmaceutical Industry. Atmosphere 2024, 15, 1338. [Google Scholar] [CrossRef] [Scilit]
- Wang, Y.; Song, H.; Li, L.; Ma, J.; Yu, F. Generation characteristics and spreading risk of VOCs released from a biological fermentation pharmaceutical factory. Environ. Sci. Process. Impacts 2023, 25, 507–518. [Google Scholar] [CrossRef] [Scilit] [PubMed]
- Vivek, J.P.; Garcia-Araez, N. Differences in Interfacial Reactivity of Graphite and Lithium Metal Battery Electrodes Investigated via Operando Gas Analysis. J. Phys. Chem. C 2024, 128, 13395–13401. [Google Scholar] [CrossRef] [Scilit] [PubMed]
- Hanson, R.K.; Spearrin, R.M.; Goldenstein, C.S. Spectroscopy and Optical Diagnostics for Gases; Springer International Publishing AG: Cham, Switzerland, 2016; pp. 1–90. [Google Scholar]
- Li, J.Y.; Li, L.; Zhao, S.; Ren, P.; Tian, S.; Jin, H. Application Research of Tunable Diode Laser Absorption Spectroscopy in Petroleum Industry. Laser Optoelectron. Prog. 2022, 59, 1300006. [Google Scholar]
- Wang, J.; Wang, M.; Qian, F.; Bao, X.; Jia, R.; Wang, C.; Yang, X.; Wang, K.; Guo, X. Advances in enhancing the sensitivity of TDLAS for water vapor concentration detection- A review. Infrared Phys. Technol. 2026, 153, 106309. [Google Scholar] [CrossRef] [Scilit]
- Li, Z.; Li, W.; Lin, J.; Li, C.; Wang, B.; Chen, C.; Piao, H.; Zhang, F. Review on performance enhancement methods of tunable diode laser absorption spectroscopy for in situ gas measurement. Appl. Spectrosc. Rev. 2025, 60, 555–587. [Google Scholar] [CrossRef] [Scilit]
- National Mine Safety Administration; Ministry of Emergency Management of the People’s Republic of China. The “14th Five-Year Plan” for Mine Safety Production. Document No. Ying Ji [2022] No. 64, 2022. Available online: www.chinamine-safety.gov.cn/zfxxgk/fdzdgknr/tzgg/202208/W020220810625338796498.pdf accessed on 19 July 2026.
- Ministry of Emergency Management of the People’s Republic of China. Coal Mine Safety Regulations, Order No. 17, 2025. Available online: www.chinamine-safety.gov.cn/zfxxgk/fdzdgknr/zcfg/bmgz_01/mkanj/202112/P020211230597752285107.docx accessed on 19 July 2026.
- Wang, Z.; Fu, P.; Chao, X. Baseline reduction algorithm for direct absorption spectroscopy with interference features. Meas. Sci. Technol. 2020, 31, 035202. [Google Scholar] [CrossRef] [Scilit]
- Jia, Y.; Liu, T.; Liu, K.; Lei, Z.; Yu, L. An Automatic Baseline Extraction Algorithm for Intensity Absorption Type Gas Sensing. J. Light. Technol. 2013, 31, 3582–3587. [Google Scholar] [CrossRef] [Scilit]
- He, J.; Song, C.; Luo, Q.; Yang, C.; Gui, W. EWT-ASG: Empirical Wavelet Transform with Adaptive Savitzky-Golay Filtering for TDLAS. IEEE Photonics J. 2020, 12, 7800712. [Google Scholar] [CrossRef] [Scilit]
- Yan, W.; Fang, W.; Rui, Z.; Bo, Y.; Yang, S.Y.; Li, X.B. Research on a System Noise Simulation and Filtering Mehtod in Tunable Diode Laser Absorption Spectroscopy Technolog. J. Appl. Spectrosc. 2023, 90, 867–875. [Google Scholar] [CrossRef] [Scilit]
- Pang, D.; Li, L.; Ma, L.; Lin, Z.; Liu, P.; Zhou, X. Interference fringe suppression in tunable diode laser absorption spectroscopy based on BPNN. Opt. Commun. 2023, 544, 129630. [Google Scholar] [CrossRef] [Scilit]
- Li, J.; He, F.; Liu, X.; Liu, F.; Zhang, L.; Guo, Y.; Fu, X.; Li, J. Calibration-free gas concentration measurement using a dual-branch feature fusion CNN. Sens. Actuators B-Chem. 2026, 465, 140227. [Google Scholar]
- Yi, Y.; Kun, D.; Li, R.; Ni, K.; Ren, W. Accurate temperature prediction with small absorption spectral data enabled by transfer machine learning. Opt. Express 2021, 29, 40699–40709. [Google Scholar] [CrossRef] [Scilit]
- Tian, L.; Sun, J.; Chang, J.; Xia, J.; Zhang, Z.; Kolomenskii, A.A.; Schuessler, H.A.; Zhang, S. Retrieval of gas concentrations in optical spectroscopy with deep learning. Measurement 2021, 182, 109739. [Google Scholar] [CrossRef] [Scilit]

Disclaimer/Publisher’s Note: The statements, opinions and data contained in all publications are solely those of the individual author(s) and contributor(s) and not of MDPI and/or the editor(s). MDPI and/or the editor(s) disclaim responsibility for any injury to people or property resulting from any ideas, methods, instructions or products referred to in the content. |
© 2026 by the authors. Licensee MDPI, Basel, Switzerland. This article is an open access article distributed under the terms and conditions of the Creative Commons Attribution (CC BY) license.