


Abstract
For light sources with a prescribed intensity distribution, the design of complex customized illumination systems is challenged by limited control degrees of freedom and nonlinear coupling in the source–target mapping. Existing mainstream methods are mostly based on optimal transport theory, in which source–target mapping and lens modeling generally involve second-order implicit partial differential equations (PDEs), leading to complex formulations and difficult solutions. To address this issue, this paper proposes a first-order iterative illumination design and simulation method based on a freeform surface–microlens array. The method adopts a two-stage “collimation–shaping” stepwise energy mapping strategy, sequentially performing beam direction normalization and irradiance distribution reconstruction. This reduces the mathematical complexity of the system model and requires only a first-order explicit iterative formulation for mathematical modeling. By virtue of the stepwise decoupling mechanism, the lens surface profiles can be directly solved through analytical mapping without relying on numerical iterative optimization. This mechanism avoids the over-constraint of degrees of freedom that readily occurs in existing methods, which must simultaneously handle beam control and irradiance reconstruction, thereby enabling complex target irradiance distributions. Simulation results show that under full-angle illumination, the system achieves an optical energy utilization efficiency of 90% and an irradiance uniformity of 87% on the target plane.
1. Introduction
With the rapid advancement of optoelectronic technology, novel sources have been widely applied in illumination, display, machine vision, and communications [1,2,3]. Laser sources, characterized by high luminance, superior directionality, and small étendue, are ideal candidates for high-precision, complex-pattern customized illumination. Lambertian sources offer advantages of high luminous efficacy, long lifetime, and compact form factor. Optical architectures combining these two source types with customized elements have thus garnered increasing research interest [4,5,6]. In response to the distinct emission characteristics of different sources and their application scenarios, various design methods for optical elements have been proposed to realize prescribed irradiance distributions. From the perspective of design paradigm evolution, existing freeform optical design methods can be broadly categorized into four types: numerical optimization, analytical formulations, microlens arrays, and emerging data-driven approaches.
The numerical optimization approach is among the earliest proposed design methods. Its core principle parameterizes the lens surface rather than directly solving the governing ray equations, simulates ray transport via computer-based ray tracing, and iteratively refines parameters through optimization algorithms until the merit function satisfies the prescribed criteria [7]. The underlying logic comprises modeling, simulation, evaluation, and iteration. For instance, Tang et al. [8] proposed a differentiable design method for double-freeform lenses tailored to extended sources for arbitrary intensity distribution shaping. By employing the sequential unconstrained minimization technique and the Lagrange multiplier method, while incorporating geometric constraints including lens volume, thickness, and source encapsulation, they realized a highly compact configuration.
Analytical formulations constitute a mainstream design methodology [9,10,11], fundamentally grounded in energy conservation. They establish a direct one-to-one mapping between source angular coordinates and target-plane spatial coordinates, subsequently reconstructing the freeform surface by solving partial differential equations. The underlying logic proceeds from energy conservation to mapping construction and surface synthesis. Currently, the Monge–Ampère equation has been widely adopted. For instance, Wu et al. [12,13] proposed a freeform illumination design method based on the elliptic Monge–Ampère equation with nonlinear boundary conditions, addressing complex three-dimensional beam shaping without symmetry assumptions. Alternative formulations have also been employed [14]. Xu and Su et al. [15] presented a freeform mirror design method combining Poisson grid optimization and discrete cosine transform to reshape an incident irradiance distribution into a prescribed target distribution.
The microlens array method typically functions not as a standalone approach but as a complementary enhancement to the two methodologies [16]. Its procedure entails first designing a macroscopic freeform surface to govern the overall spot profile, then superimposing a microlens array onto that surface. The overlapping imaging effect of the microlenses serves to eliminate fringes, improve uniformity, and enhance system robustness. The underlying logic proceeds from macroscopic form control to microscopic homogenization. For instance, Desnijder et al. [17] proposed a method for designing luminance-diffusing freeform lens arrays to address the trade-off between glare and intensity distribution control accuracy in high-brightness LED lighting and validated their approach with a 7 × 7 freeform lens array case study.
Data-driven training models constitute an emerging design methodology enabled by advances in computational technology. The core principle entails training neural networks on extensive known source-to-target irradiance data, allowing the network to learn the nonlinear mapping from prescribed target distributions to freeform surface parameters. Once trained, inputting a target distribution enables rapid synthesis of the corresponding surface profile [18,19]. For instance, Zhu et al. [20] proposed a global optimization method for ultra-compact aspheric lenses based on particle swarm optimization, addressing the challenge of achieving uniform irradiance when high-power LEDs are employed in extreme near-field illumination. Pan et al. [21] presented a physics-driven deep neural network method for solving the Monge–Ampère equation under various boundary conditions. Through multiple case studies, including Gaussian-to-flat-top beam shaping and specific pattern generation, the effectiveness of their approach was validated, demonstrating the substantial potential of a physics–AI hybrid-driven paradigm in optics.
Each of the methods presents distinct advantages and limitations. Numerical optimization and data-driven training models offer flexibility and versatility but are prone to local optima entrapment and suffer from low computational efficiency. Conversely, analytical formulations based on ray mapping provide high accuracy and efficiency yet must satisfy the integrability condition, rendering the mathematical formulation complex. Combining multiple methods to achieve complementary strengths thus constitutes a promising strategy [22,23]. For instance, Wei et al. [24,25] integrated analytical formulations with numerical optimization, proposing a least-squares ray mapping approach that iteratively refines mapping results derived from optimal transport theory, enhancing their consistency with energy conservation and boundary conditions. This enabled the construction of freeform lenses capable of generating complex illumination patterns. Zhang et al. proposed and demonstrated a hybrid metasurface–freeform optical system for multi-focal-plane augmented reality (AR) display [26,27].
Although the above hybrid design approaches simplify the design problem to varying degrees and have achieved favorable results, they essentially still require simultaneous wavefront control and irradiance reconstruction on a single surface [12,13] while satisfying the integrability constraint on the ray mapping. This constraint implies that a second-order implicit partial differential equation (PDE) inevitably arises, or that multiple iterative optimization steps are required to ensure the integrability of the mapping [24,25]. This paper proposes a hybrid optical design method that combines a freeform lens with a microlens array. Through a stepwise strategy, the conversion from a point source to the prescribed target irradiance distribution is decomposed into two independent steps: the freeform lens first collimates and homogenizes the beam, and the microlens array then shapes the beam into the desired distribution. This decoupled design can satisfy the integrability constraint associated with the ray deflection in the second stage, thereby avoiding the mathematical and computational difficulties that commonly arise. The proposed two-stage strategy changes the mathematical nature of the subproblem associated with the prescribed irradiance: after the first stage, the beam has been collimated, and the mapping in the second stage is constructed on rotationally symmetric surfaces by means of a first-order explicit point-to-point recurrence, without solving a complex second-order PDE and without iterative procedures to enforce integrability. In other words, the novelty lies not in the physical combination of freeform elements and a microlens array but in the restructuring of the mapping problem enabled by this combination. Nevertheless, the generated patterns still exhibit pixelation. Simulation results show that the method is effective for various complex targets, including alphanumeric characters, graphics, and QR codes. Although the lens configuration is relatively complex, it remains realizable with existing fabrication technologies [28].
2. Design Method
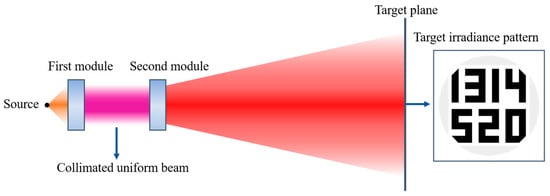
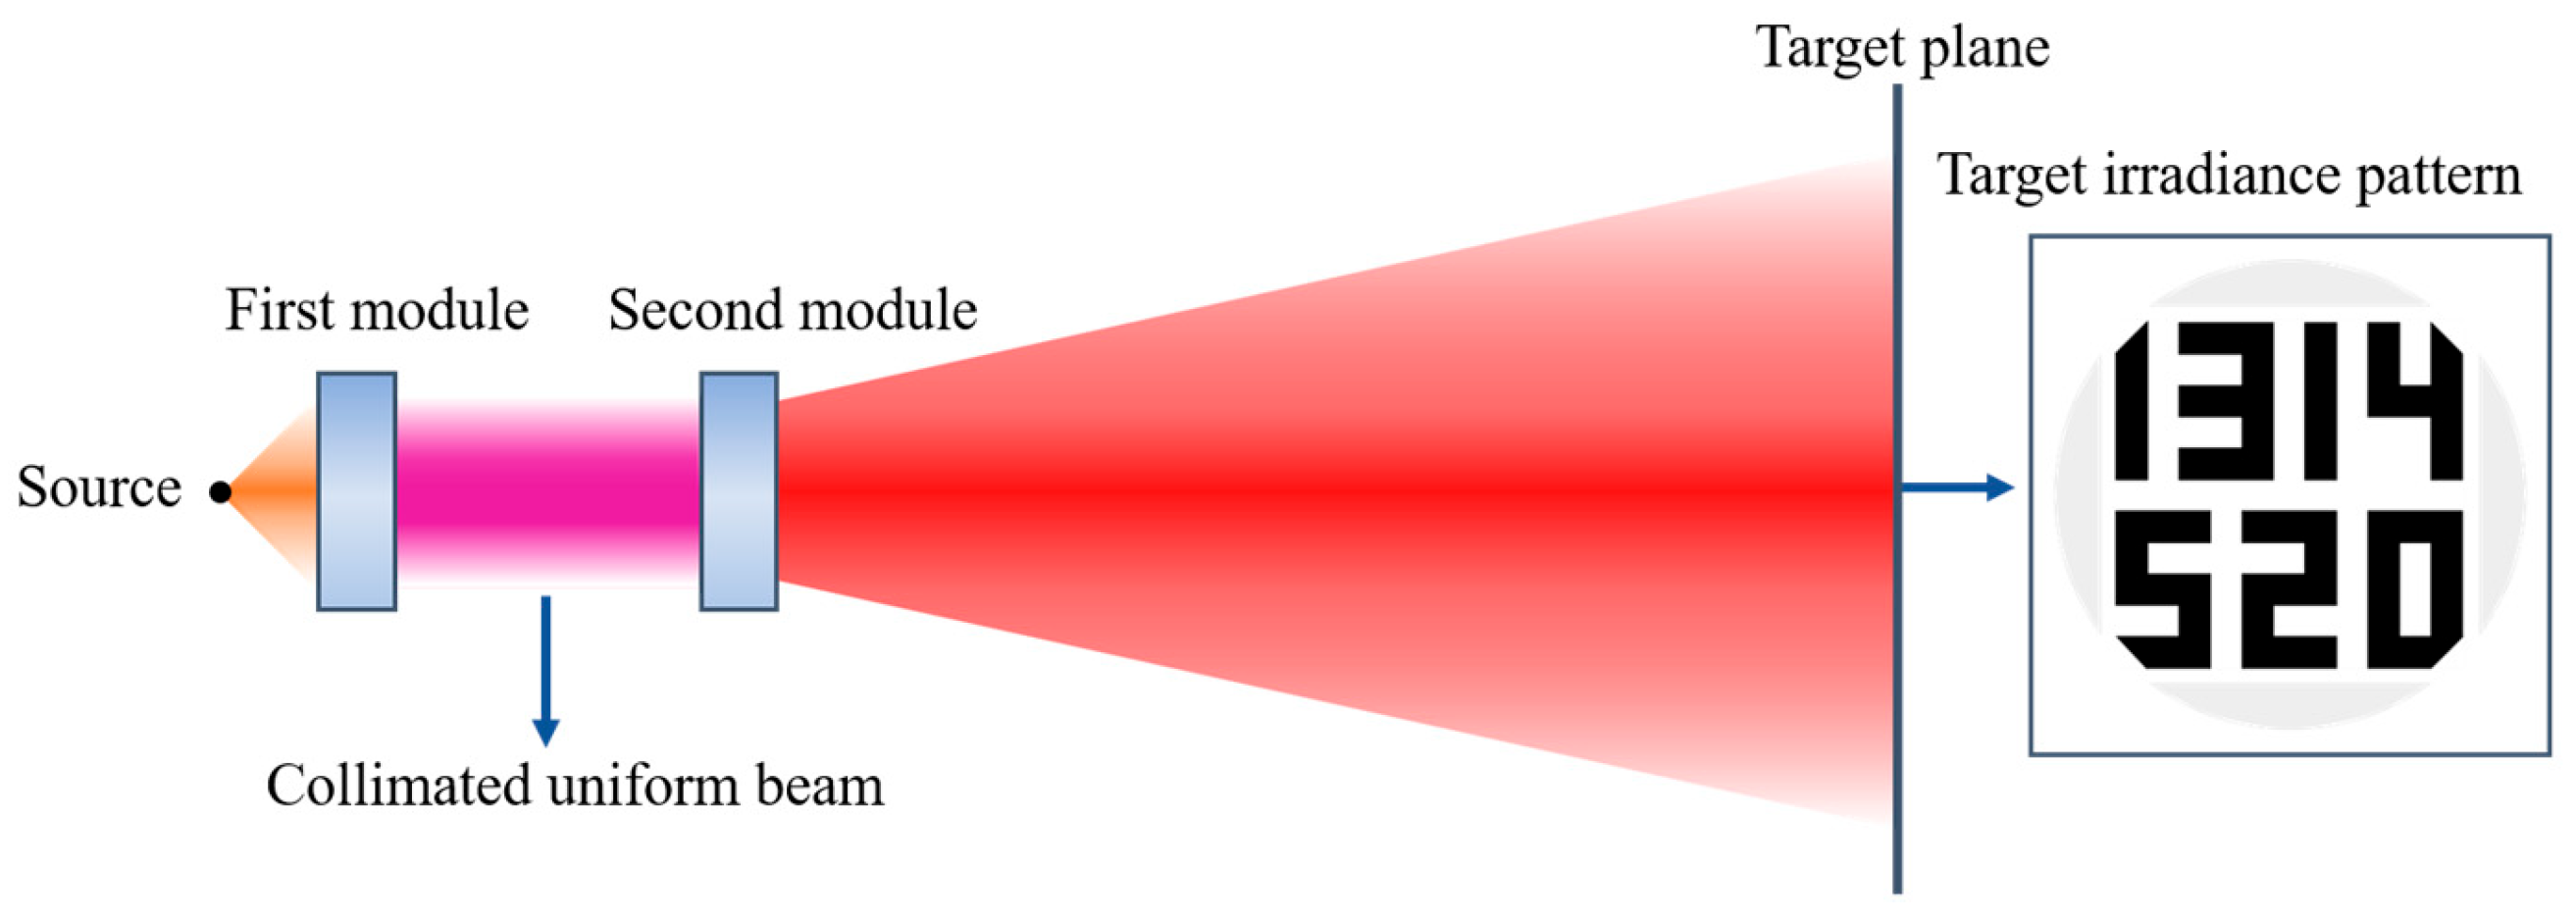
To meet point-source illumination needs, this system has two modules. Module 1 converts rays from various directions into a collimated beam with uniform cross-section, ensuring both parallel propagation and uniform distribution. It also satisfies the integrability constraint under identical transverse or longitudinal transformations over unit areas. Module 2 then uses this beam to produce the desired irradiance distribution on the target (Figure 1).
Figure 1.
Optical layout of the two-module beam shaping system.
2.1. Design Principle and Method
The first module aims to convert a point source into a collimated and uniform beam, subject to two independent constraints on wavefront direction and irradiance distribution. According to PDE theory, a single freeform surface lacks sufficient degrees of freedom to independently control both fields, and thus generally cannot achieve ideal collimation and uniformity simultaneously. Nevertheless, under special conditions (e.g., Gaussian sources in the Fresnel region), a single plano-convex lens has been shown to offer acceptable performance [27]; this does not contradict our general analysis but highlights the gap between theoretical limits and engineering compromises.
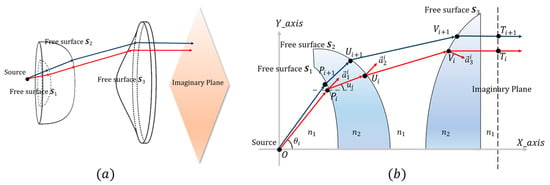
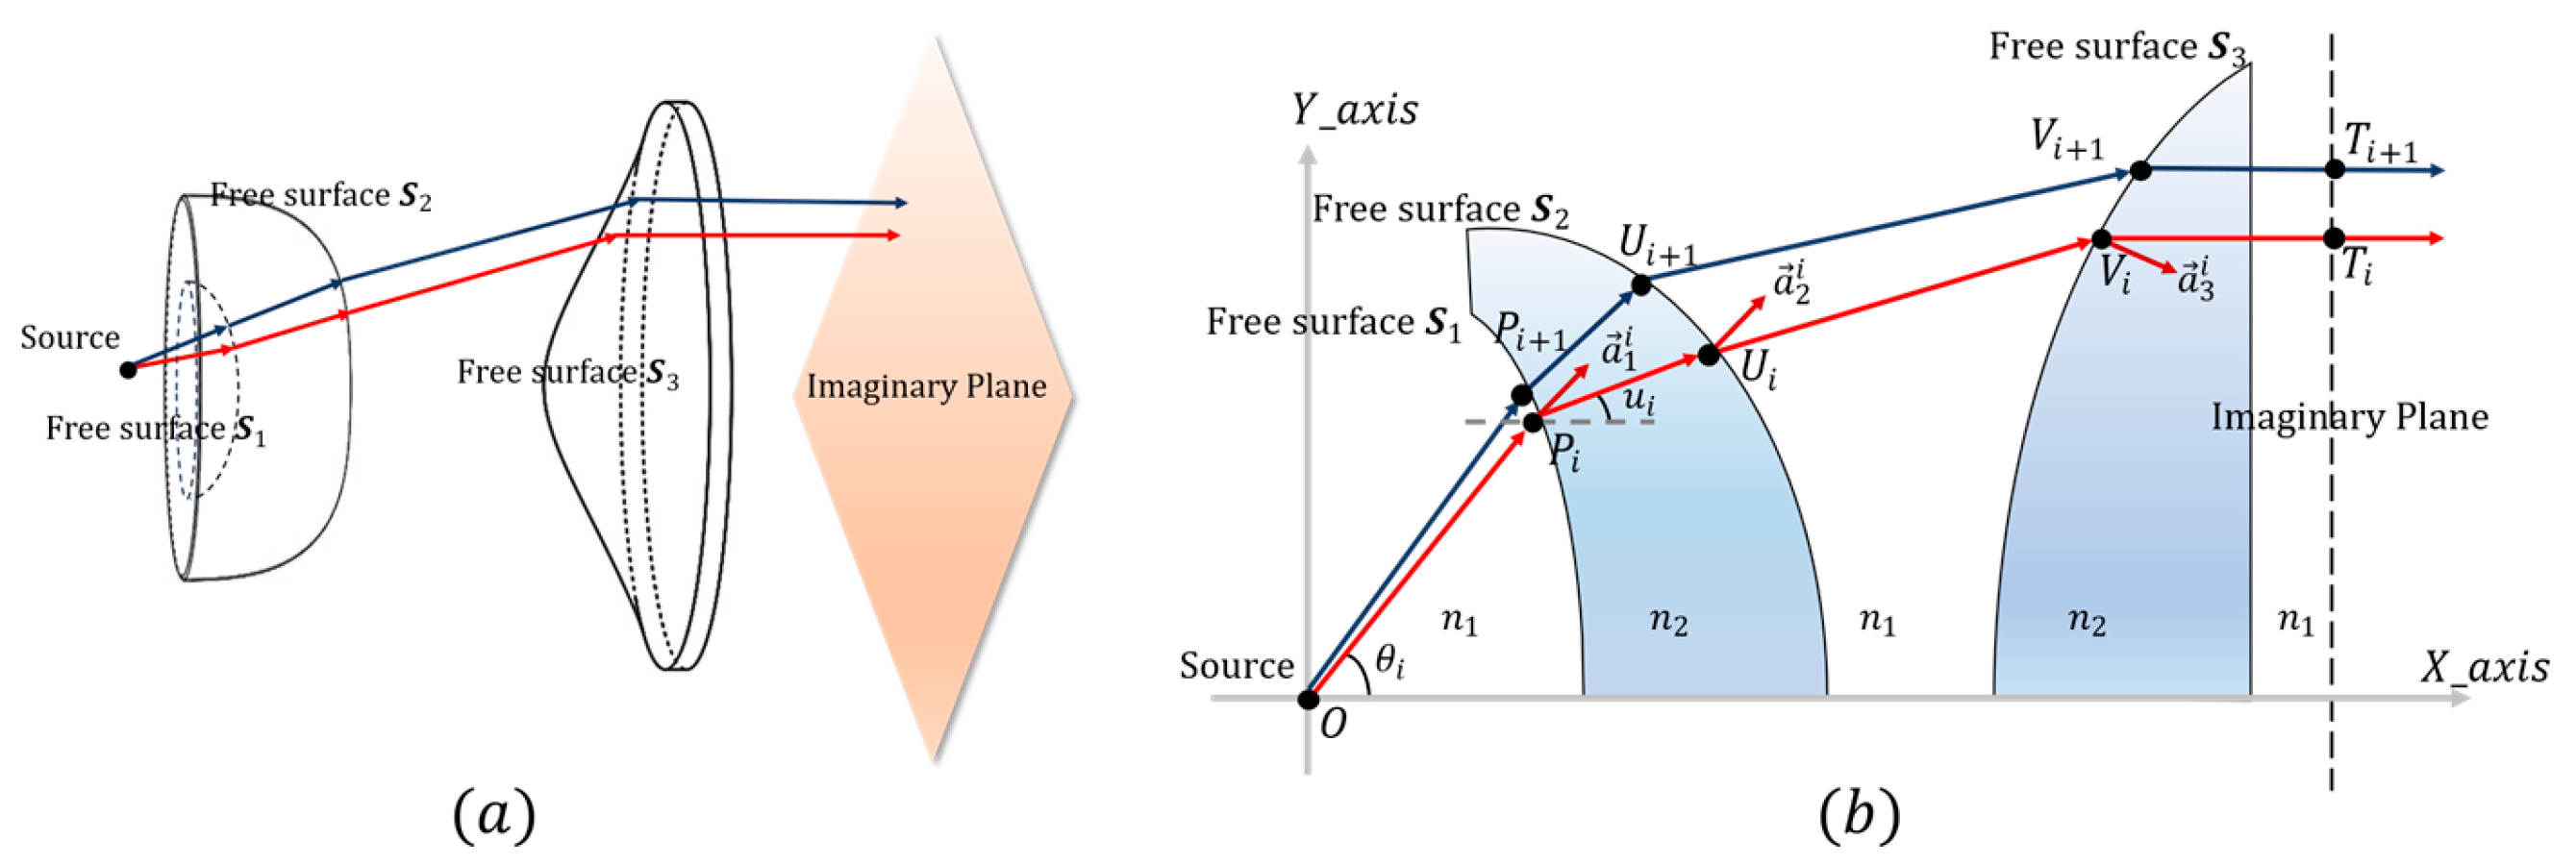
To address this inherent limitation, our Module 1 employs three rotationally symmetric freeform surfaces (S1, S2, and S3) with alternating refractive indices, as illustrated in the cross-sectional view of Figure 2b. A point source is located at the origin , and the optical axis coincides with the -axis. The rays propagate through five refractive regions () and undergo three refractions. Specifically, the first surface, S1, acts as a preliminary concentrator. It pre-compresses the large-angle rays (initial angle ) emitted from the source to reduce their divergence (compressed angle ), thereby alleviating the deflection burden on the subsequent surfaces; thus, S1 functions relatively independently. Surfaces S2 and S3, on the other hand, form a tightly coupled shaping unit. S2 receives the pre-compressed rays and redirects them, while S3 ensures that all emergent rays are parallel to the optical axis. Together, they jointly perform collimation and homogenization to produce a uniform irradiance distribution on the virtual plane. Because the surface profiles of S2 and S3 are strongly interdependent to simultaneously satisfy the requirements of ray direction control and energy mapping, they must be designed and solved together.
Figure 2.
Optical configuration of the first module: (a) 3D schematic; (b) the cross-sectional view.
All three freeform surfaces in the first module are rotationally symmetric. Hence, only the generatrix requires determination during design, enabling modeling in a planar Cartesian coordinate system. The design principle is illustrated in Figure 2: (a) shows a 3D schematic, and (b) shows the cross-sectional view. As shown in Figure 2b, the point source is positioned at the origin O, with the optical axis coincident with the X-axis. The three freeform surfaces, denoted S1, S2, and S3, are sequentially located to the right of the source. A virtual plane perpendicular to the optical axis is placed to the right of S3. Upon transmission through the first module, all emergent rays are parallel to the optical axis, producing a uniform irradiance distribution on this virtual plane. In Figure 2, the space is partitioned into five refractive regions, designated from left to right as and . The three freeform surfaces are constructed via a point-by-point numerical iterative method, wherein the coordinates of the (i + 1)-th point are derived from the i-th point. For the i-th ray emitted from the source, let the refraction points on the three freeform surfaces and the intersection point on the virtual plane be , , , and , respectively. The angle between ray and the optical axis is denoted as .
Referring to Figure 2, the unit direction vectors of rays ,,, and are obtained and denoted ,,, and , respectively. According to Snell’s law, the unit normal vectors of surfaces S1, S2, and S3 at refraction points , , and are determined and denoted , , and , respectively. From Figure 2 and Snell’s law, Equations (1) and (2) are derived as follows:
Since the normal vector is perpendicular to the tangent direction of its respective surface, and the points and , and , and are adjacent to each other, Equation (3) can be obtained:
Based on the above information, the coordinates of , , and can be further solved. From the equation of the straight line , the relationship between the abscissa and ordinate of point can be obtained, as shown in Equation (4).
Combining the first fractions of Equations (2) and (3) with Equation (4) yields the coordinate relation between and , i.e., the iterative relation for adjacent points on the generatrix of freeform surface S1, as given in Equation (5).
The freeform surface S1 acts as a light concentrator. Therefore, a convergence coefficient (0 < < 1) is introduced, meaning that the angle between the refracted ray after passing through S1 and the optical axis becomes times the original angle, i.e., , where is the angle between the straight line and the optical axis.
Then, applying the same iterative scheme as for S1 to freeform surface S2 yields its adjacent-point iterative relation, as given in Equation (6).
Finally, the same scheme applied to S3 yields Equation (7) for its iterative relation.
In Equation (7), the vertical coordinate of is not directly linearly related to its horizontal coordinate ; therefore, is solved separately based on the source intensity distribution and the virtual-plane irradiance distribution, as detailed below. Specifically, the light source is characterized by an on-axis radiant intensity and a Lambertian order .
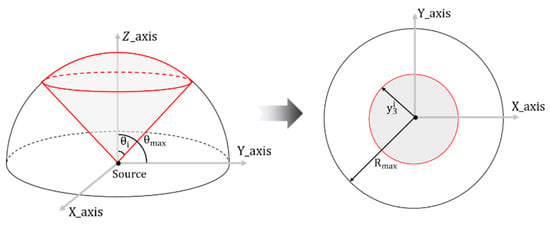
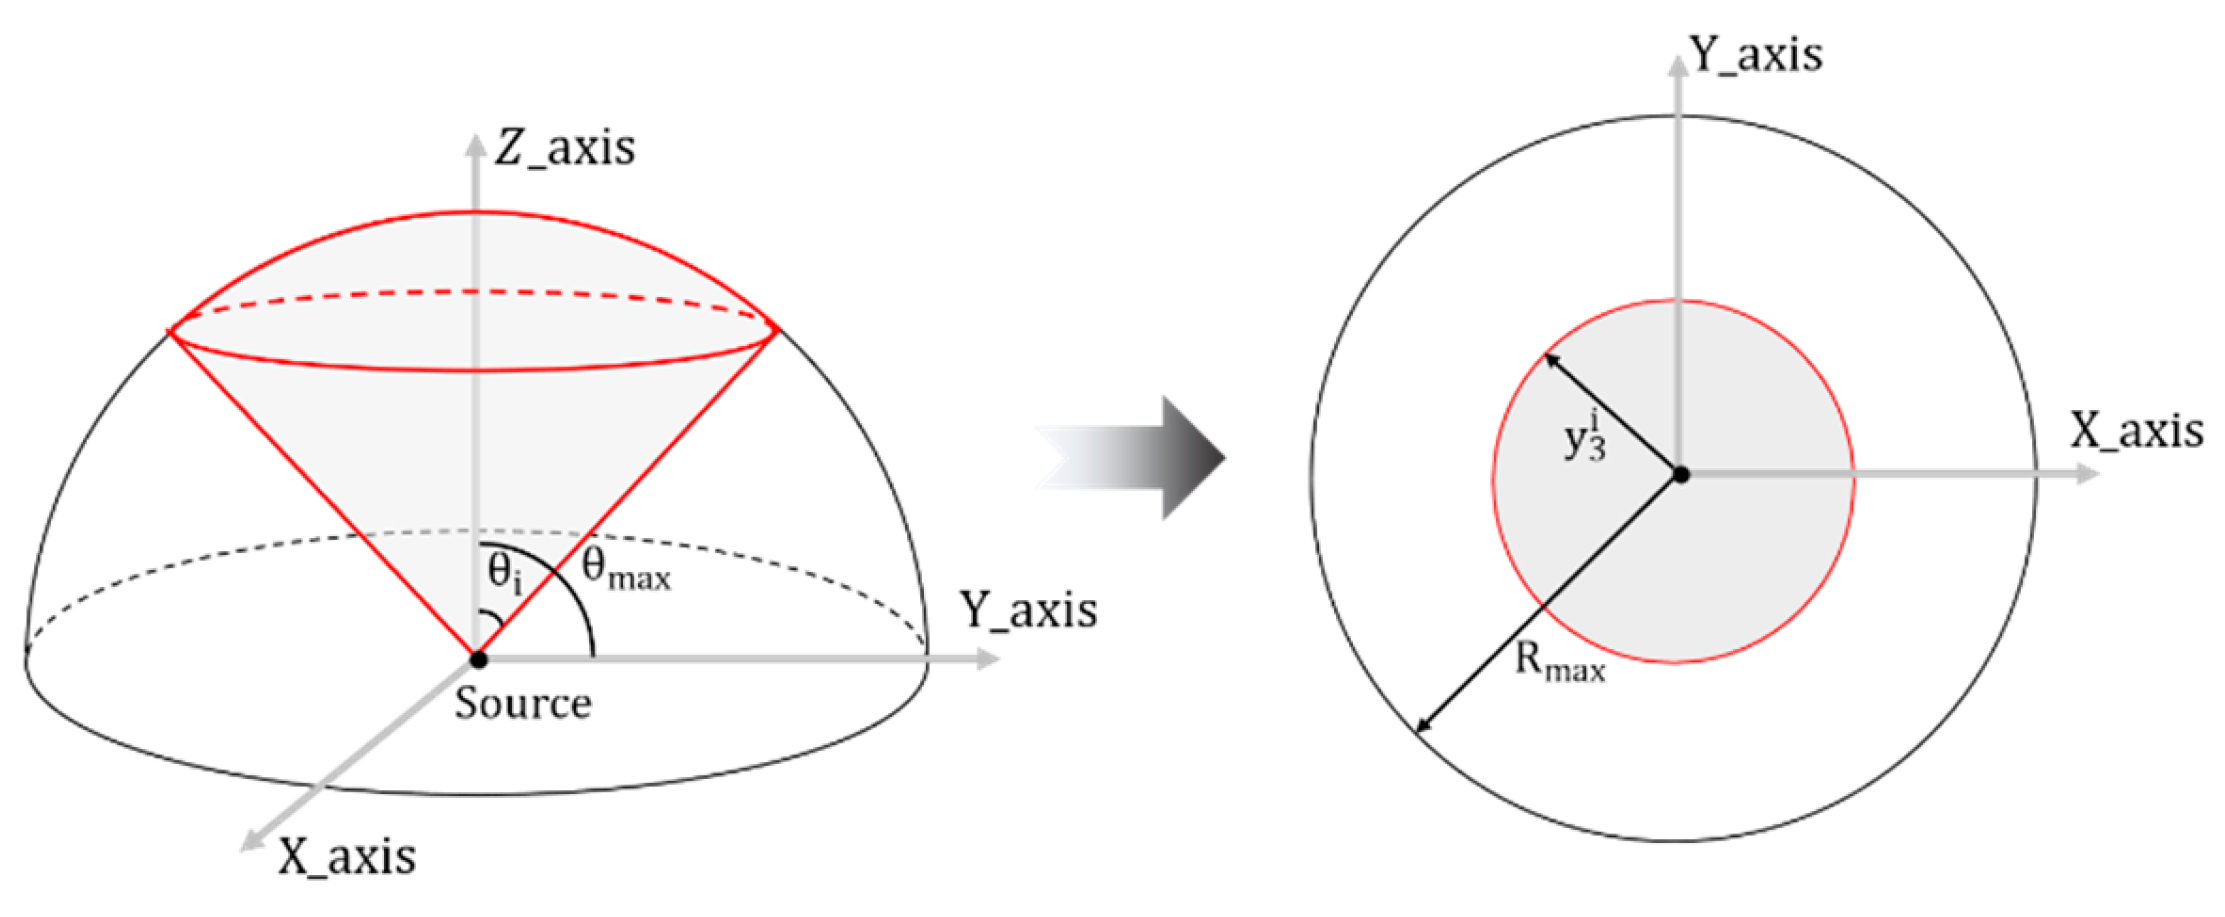
Light-emitting diodes (LEDs) are ubiquitous in daily life and industry. Given their typical Lambertian emission, we model the illuminant as a Lambertian point source, characterized by an on-axis intensity and a Lambertian order . Rays within the cone half-angle are successively refracted by freeform surfaces S1–S3, yielding a uniform circular irradiance pattern with irradiance and radius on the target plane (Figure 3).
Figure 3.
Energy mapping: source angle to illuminated radius (Module 1).
Based on the conservation of étendue, the luminous flux of the source within the cone half-angle is calculated from both the source side and the illuminated area side, yielding the equality relationship shown in Equation (8).
For the case , substituting this value into Equation (8) yields , as given in Equation (9), where denotes the maximum emission half-angle of the source, and is the radius of the largest uniformly illuminated circular area on the target plane.
Equation (9) shows that, for a rotationally symmetric mapping, the target radius depends only on the polar angle of the emergent ray while the azimuthal angle remains unchanged; the mapping therefore reduces to an explicit radial function in the meridional plane. Within each sub-aperture, the corresponding surface profile can be represented as a height function, whose gradient defines the surface normal field. Consequently, the integrability condition within each sub-aperture is satisfied by construction.
2.2. Microlens Array Design (Module 2)
The second module is a microlens array that splits the collimated uniform beam into sub-beams, each directed by a microlens to a prescribed target position, forming a basic illumination unit of fixed size and known irradiance. The superposition of these units—analogous to pixel arrangement—synthesizes any desired irradiance distribution. Thus, the array converts the uniform beam into a tailored beam meeting the specifications.
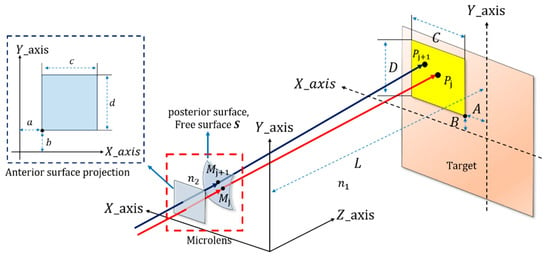
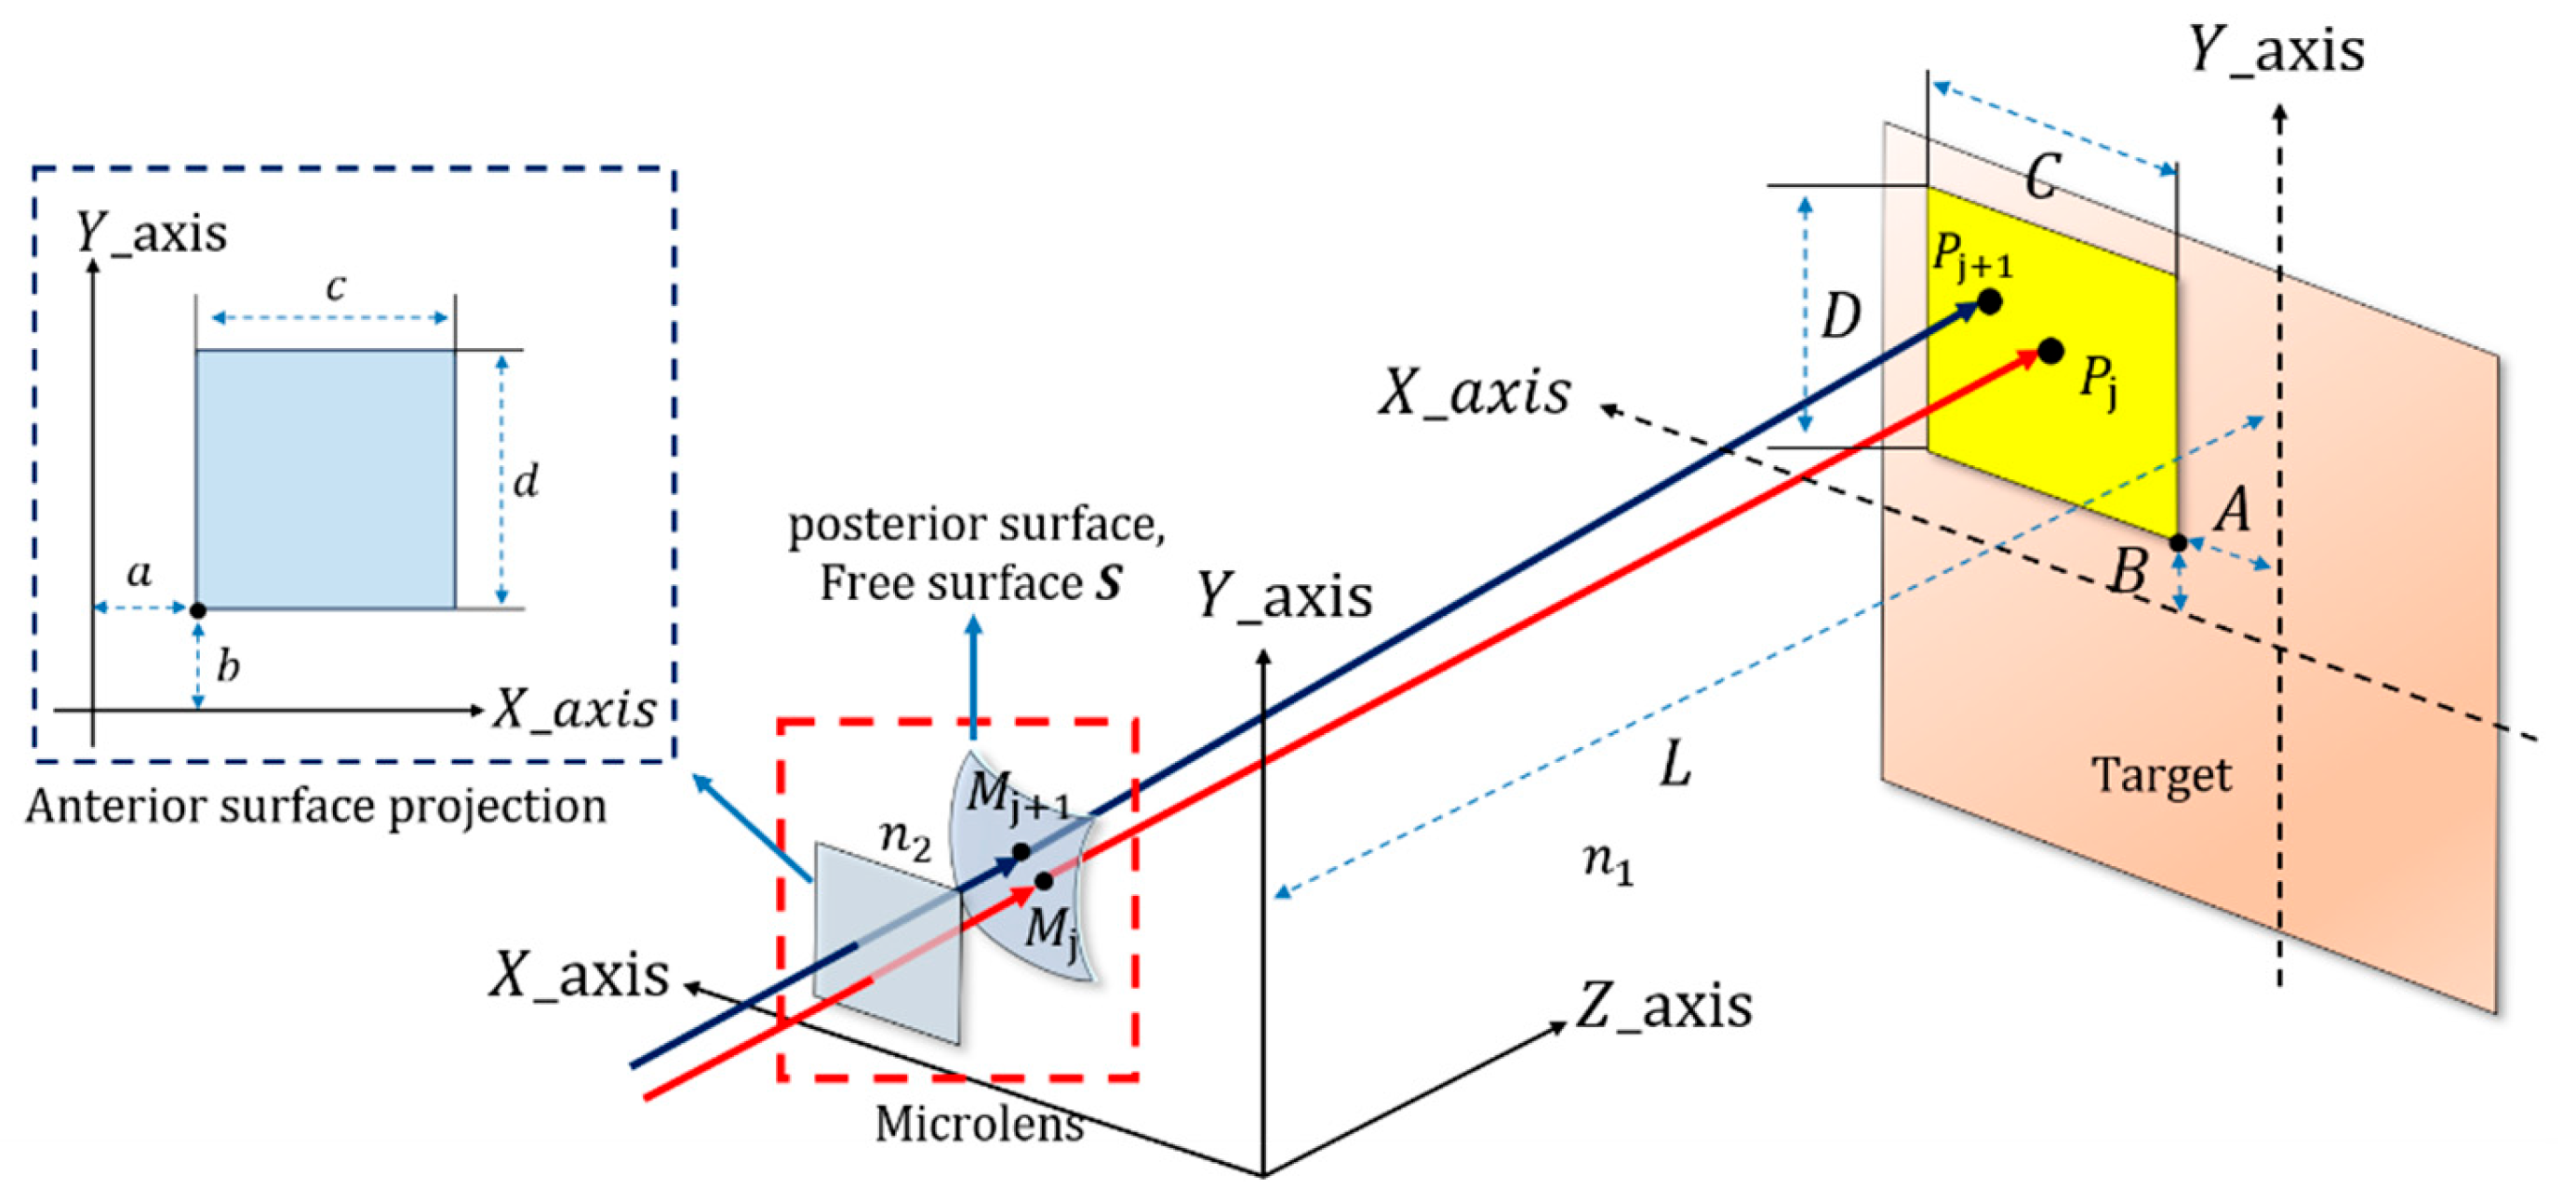
The design procedure is identical for all microlenses; thus, a single microlens is taken as representative to illustrate the design process (parameters defined herein are confined to this discussion and remain independent of other sections). As shown in Figure 4, the dashed red box outlines a schematic of the front and back surfaces of the microlens. The front surface is planar and coincides with the XOY plane; thus, a collimated beam normally incident on this surface undergoes no refraction. The back surface, on the other hand, is a freeform surface S, which determines the deflection direction of the beam. The refractive index of the lens is n2, while that of the surrounding medium is n1. The incident beam is collimated uniform illumination with a rectangular cross-section of dimensions ; the coordinates of its lower-left corner are . Here, c and d denote the microlens sizes in the X and Y directions, respectively. Upon refraction by the freeform surface, the beam forms a rectangular uniform spot on the target plane (defined by ). The spot has dimensions , and its lower-left corner coordinates are . Here, C and D denote the target area sizes in the X and Y directions, respectively.
Figure 4.
Schematic diagram of the principle of a single microlens.
The freeform surface S is constructed via a point-by-point iterative method. Let the intersection of the j-th incident ray with the freeform surface be and the corresponding point on the target plane be . The points corresponding to the adjacent ray are and , respectively. To establish the correspondence between the incident beam and the illuminated region, an appropriate mapping must be determined. Since the incident beam is a collimated uniform rectangular beam and the illuminated region is likewise rectangular and uniform, a linear mapping follows naturally from étendue conservation, as expressed in Equation (10). Essentially, this linear mapping partitions the uniform circular spot from the first stage into sub-apertures according to the microlens aperture size and applies linear scaling along the or direction within each sub-aperture. Because the Jacobian of this axis-aligned linear mapping is constant and its curl vanishes, integrability is preserved within each sub-aperture. The global mapping is therefore piecewise integrable, with continuity satisfied across adjacent sub-aperture boundaries. The method is therefore applicable only to target distributions that admit such a partition—the pixelated output being a direct consequence of this partition—and not to arbitrary mappings on a single global surface. For target distributions that cannot be adequately represented by such a partition, a finer microlens pitch or additional optimization steps would be required.
Based on the above conditions, the unit direction vectors of the incident ray and the outgoing ray, and , can be obtained. Then, based on Snell’s law, the unit normal vector of the freeform surface at point is obtained, as shown in Equation (11),
Since the normal vector is orthogonal to the tangent direction, and point is adjacent to , we have
Combining Equations (11) and (12) yields the coordinate relationship between and , i.e., the iterative relation between adjacent points on freeform surface S, as expressed in Equation (13). With this iterative relation, the surface data of freeform surface S can be constructed point-by-point given an initial point.
Physically and geometrically, Equation (13) embodies a local tangent-plane approximation, assuming piecewise linearity between adjacent discrete points. These local tangent planes are iteratively stitched together to reconstruct the smooth freeform surface. Mathematically, this approach is equivalent to a first-order explicit PDE formulation.
The microlens aperture has no theoretical upper bound; pattern complexity is governed mainly by the number of microlenses. In practice, it is constrained by two factors: the source étendue and collimation quality, which determine the uniformity of the sub-beam incident on each microlens, and the fabrication process, which sets the minimum feature size and aspect ratio. The millimeter-scale aperture adopted here is compatible with diamond turning, injection molding, and UV nanoimprint lithography. The design method itself imposes no lower bound on feature size; the practical minimum is dictated by the selected fabrication process.
3. Simulation Results and Preliminary Analysis
3.1. Lens Modeling
To verify the final irradiance distribution of the designed optical configuration, a three-dimensional model of the constituent lenses was constructed following the design method. MATLAB (2025a) was employed to generate code for solving the lens model data. Subsequently, SolidWorks 2018 was used to build the lens model, and the optical simulation software TracePro was utilized to perform ray tracing and analyze the irradiance distribution.
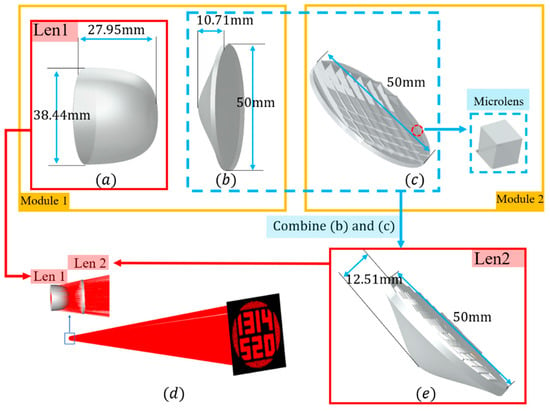
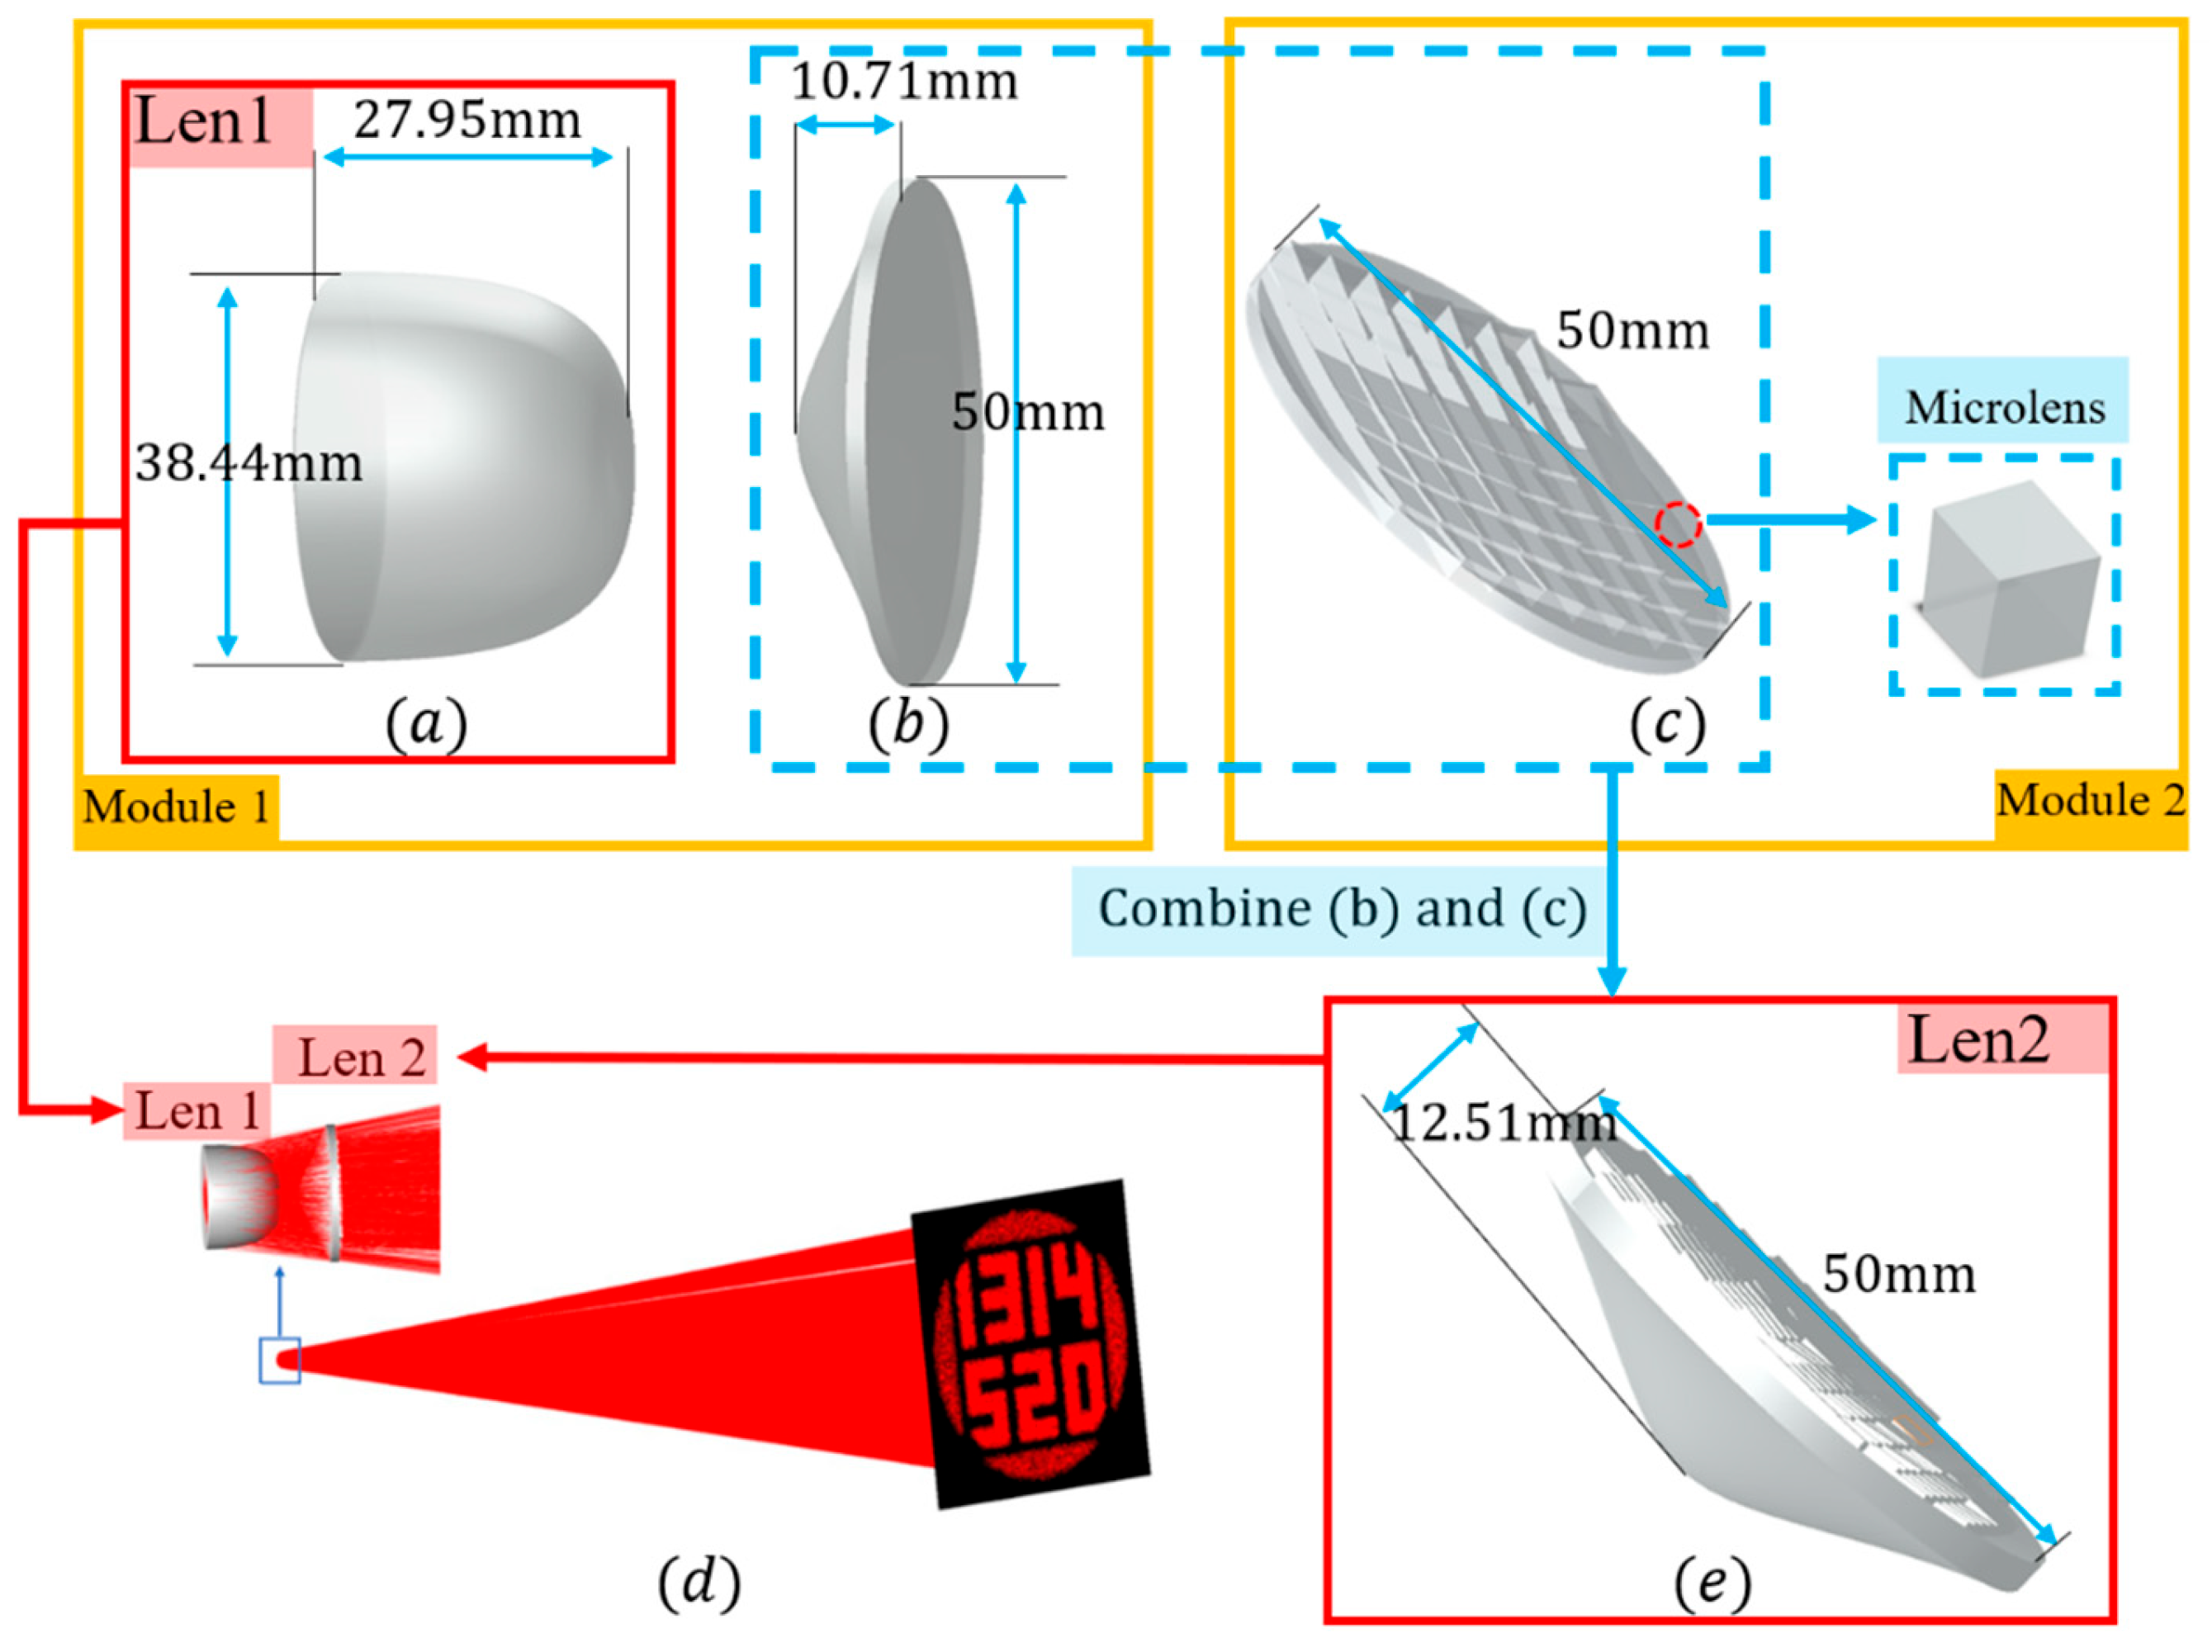
Based on the optical design parameters, a configuration comprising three lenses was constructed, as shown in Figure 5. The refractive index of the selected lens is at the test wavelength. The source is modeled as a Lambertian emitter with a half-angle of π/2, emitting over the full solid angle, and the wavelength is set to 500 nm.
Figure 5.
Lens model and optical path simulation: (a) front lens with freeform surface; (b) rear lens with freeform surface; (c) microlens array; (d) ray tracing simulation optical path diagram; (e) combined lens.
Figure 5 illustrates the design of a dual-lens illumination system. The first module (subfigure (a), Len 1, and subfigure (b)) transforms the Lambertian source into a uniform collimated beam, while the second module (subfigure (c)) is responsible for reshaping the collimated beam into a specific pattern. Due to the matching planar interfaces, lens (b) and module (c) are integrated into a single lens, Len 2 (subfigure (e)), thereby simplifying the system from three elements to two. The optical simulation, as shown in subfigure (d), demonstrates that the light successfully projects a clear ‘1314520’ image onto the receiving plane, preliminarily validating the feasibility of the proposed design.
3.2. Preliminary Analysis
To verify the feasibility of the proposed design method, the above optical model was imported into simulation software to obtain the irradiance distribution maps on the illumination plane and the corresponding cross-sectional irradiance distribution curves for quantitative evaluation. Two cases were employed for simulation verification.
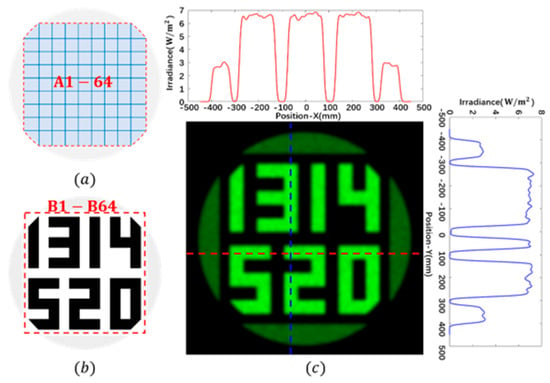
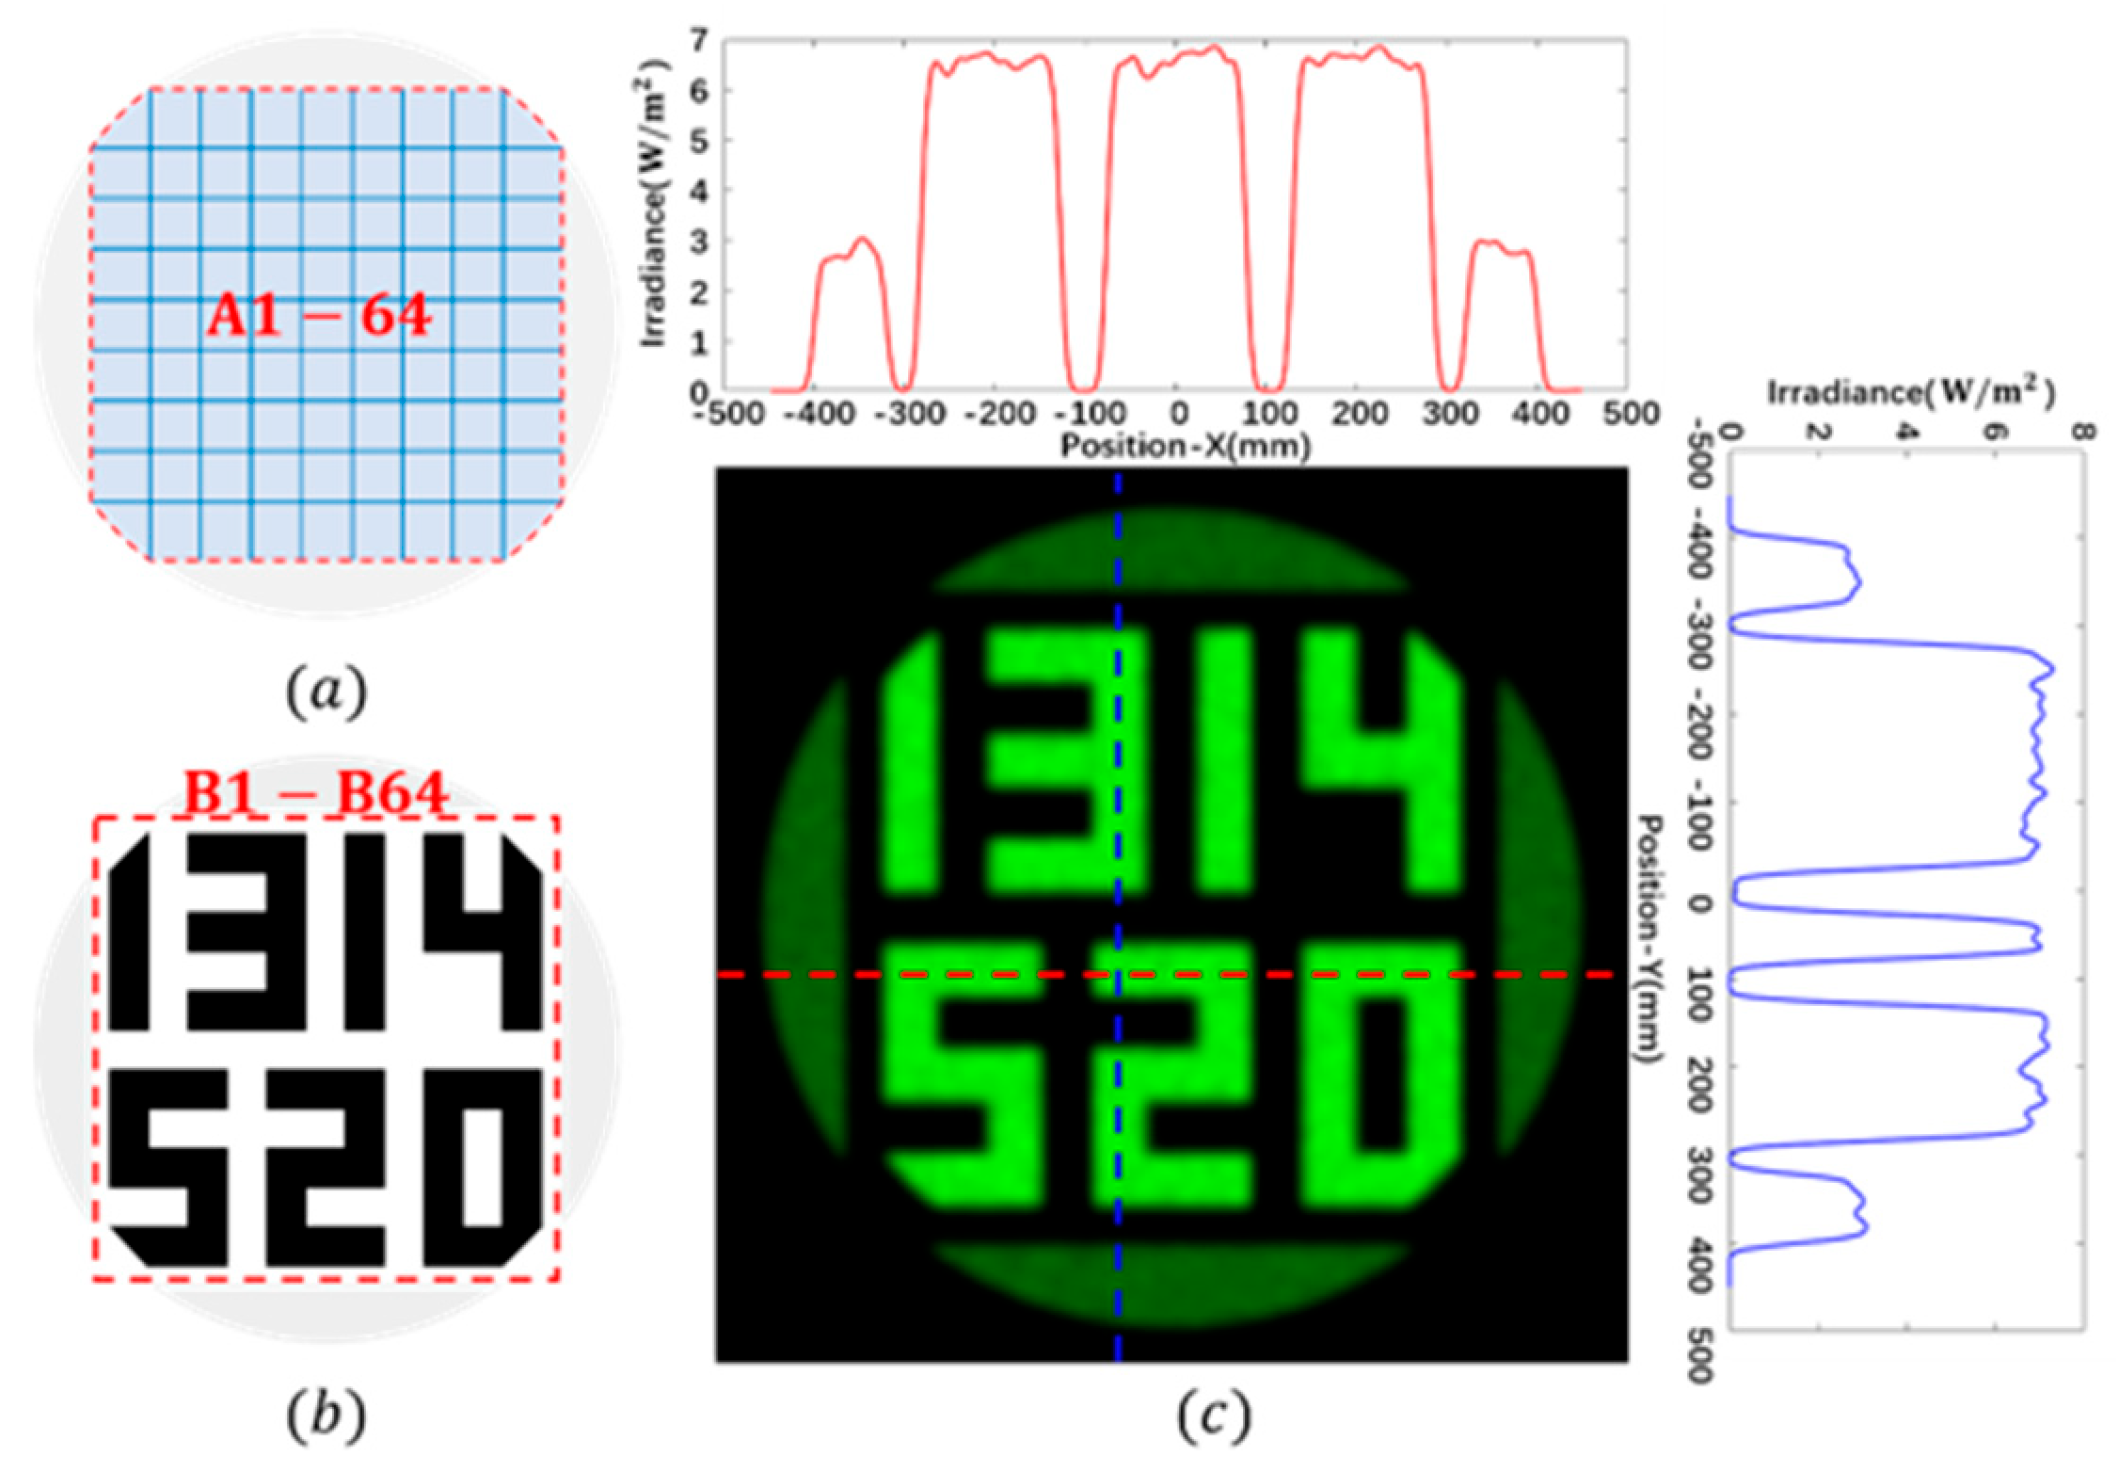
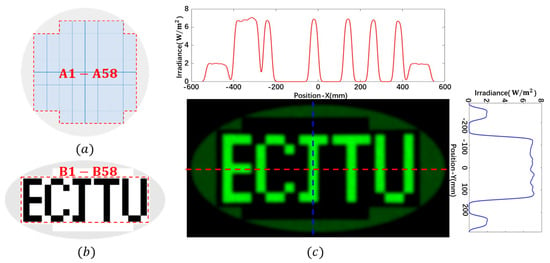
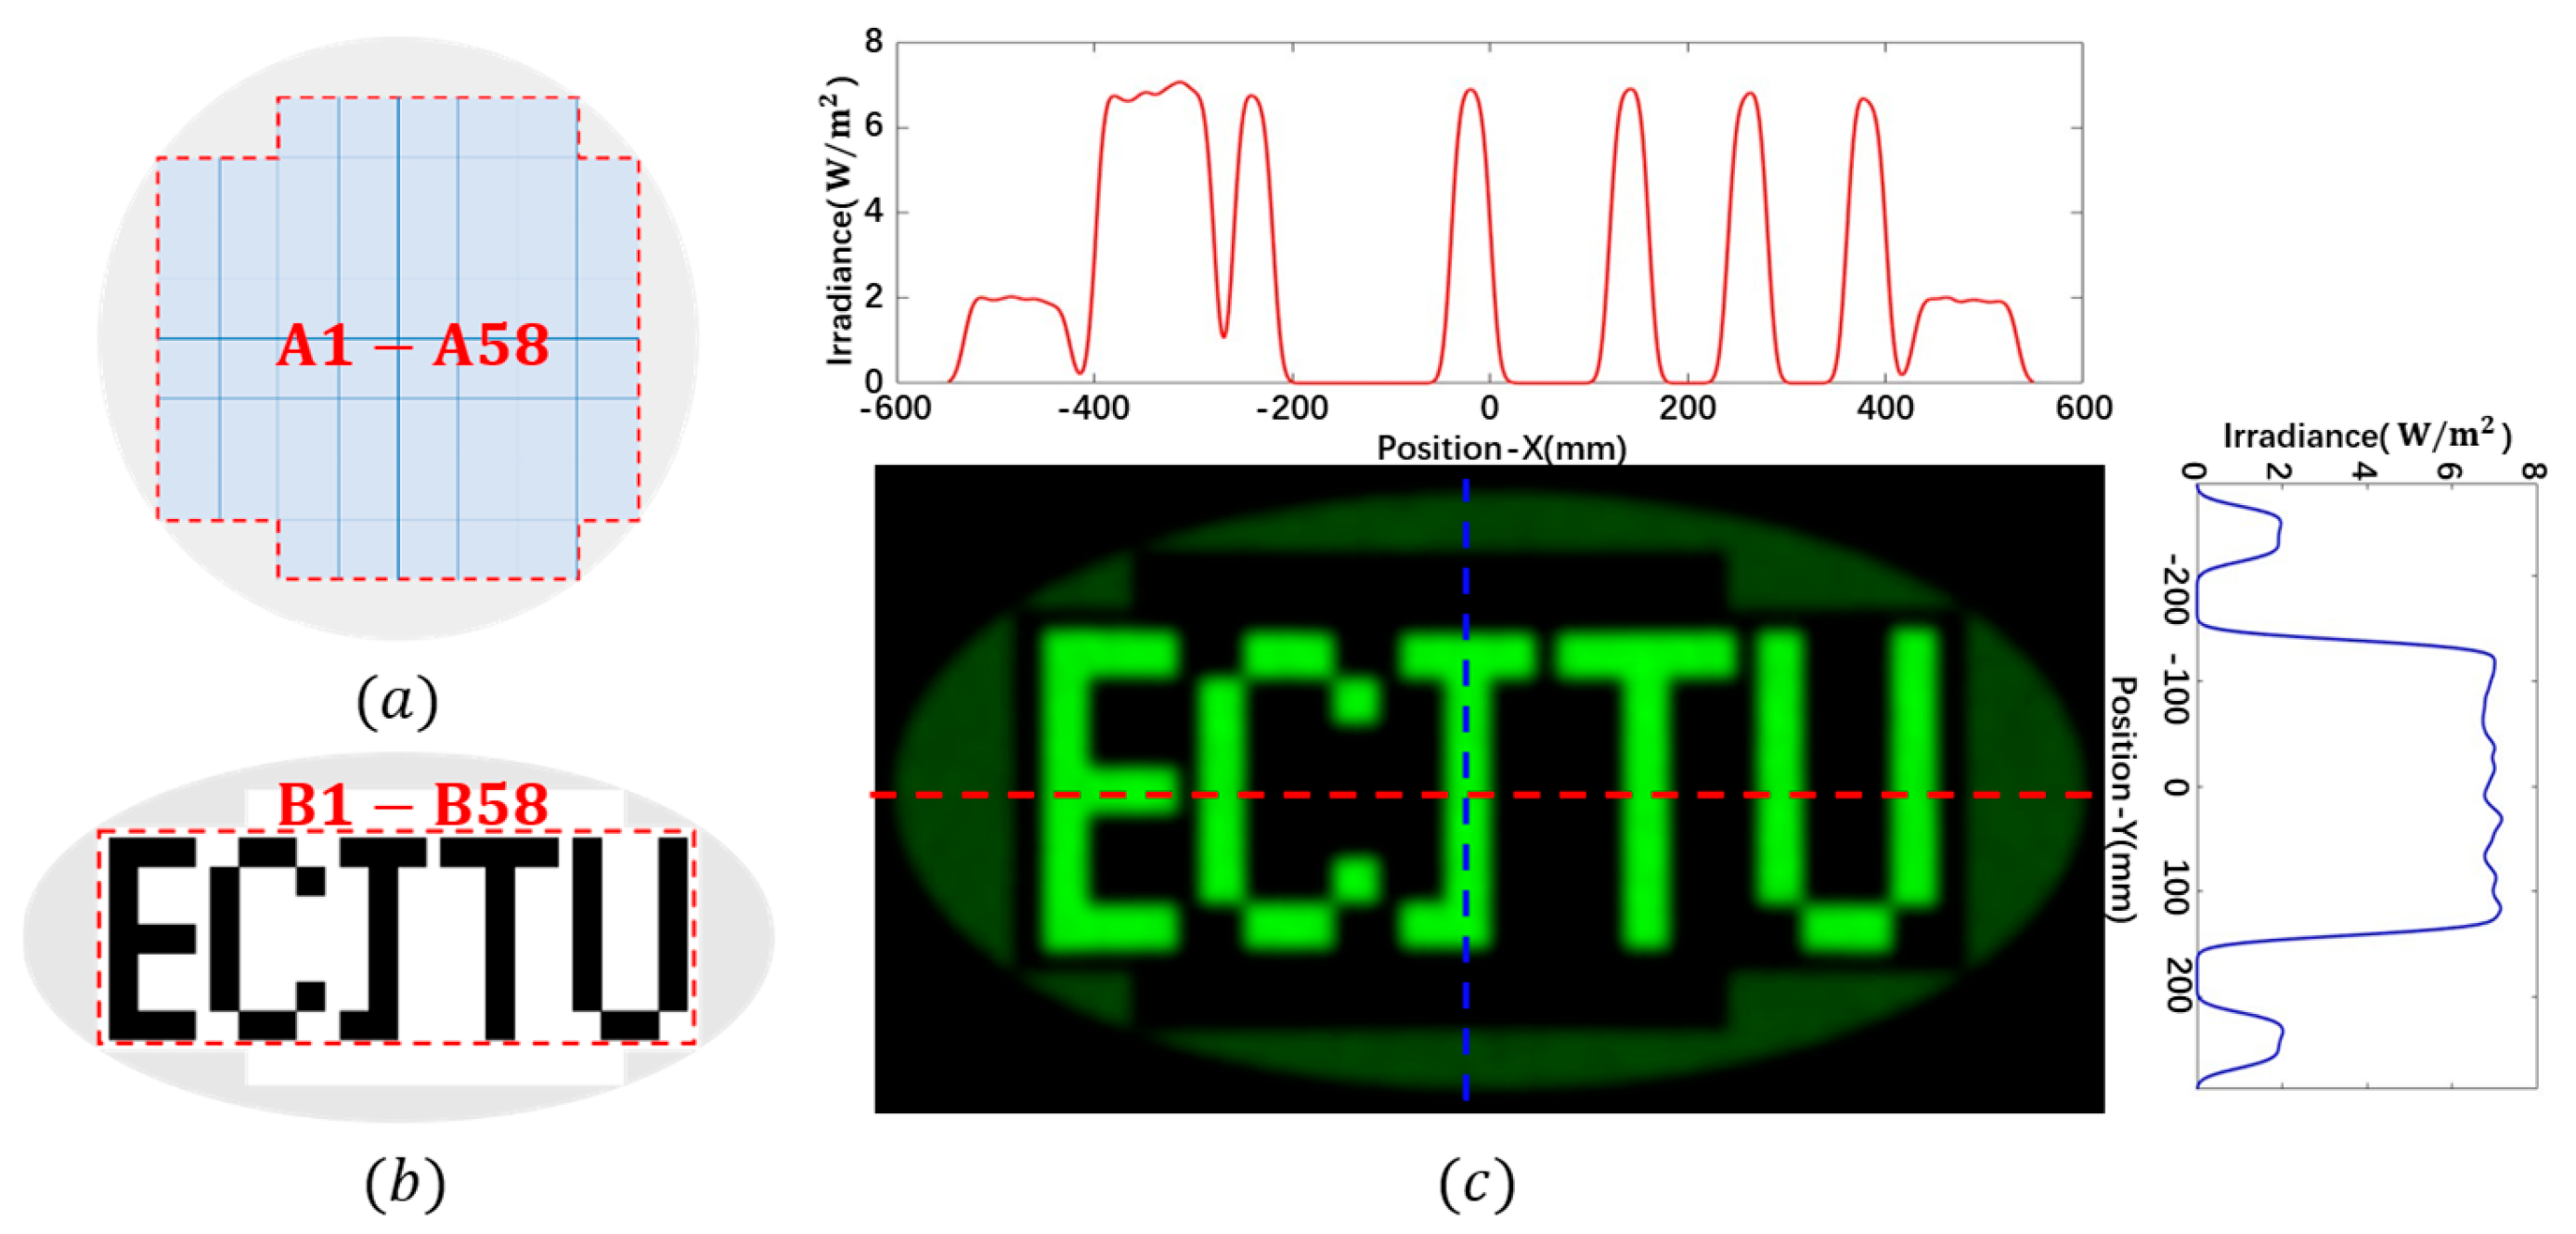
In Case 1, the incident collimated uniform beam was segmented into 64 sub-regions (A1, A2, A3, …, A64 in Figure 6a), which correspond to 64 sub-regions in the target region (B1, B2, B3, …, B64 in Figure 6b), respectively, together with one peripheral boundary region, forming the pattern “1314520” on the illumination plane. The simulated irradiance result and the cross-sectional irradiance distribution curve are shown in Figure 6c. In Case 2, the collimated uniform beam was segmented into 58 sub-regions and one peripheral boundary region, and the target pattern was “ECJTU”. The sub-region division scheme and simulation results for this case are shown in Figure 7, and the layout format is consistent with that in Figure 6.
Figure 6.
Mapping and simulation (Case 1): (a) division of the incident beam; (b) division of the target region; (c) irradiance map.
Figure 7.
Mapping and simulation (Case 2): (a) division of the incident beam; (b) division of the target region; (c) irradiance map.
From the irradiance distributions shown in Figure 6 and Figure 7, it can be observed that the irradiance gradient between the low- and high-irradiance regions changes abruptly, forming sharp light–dark cutoff boundaries and thus endowing the characters with high visual contrast. Overall, the target character patterns are clearly legible, with no evident localized over-bright or over-dark regions, indicating that the constructed lens model can achieve the prescribed complex irradiance distribution. This validates the effectiveness of the proposed design method.
3.3. Engineering Error Analysis
To evaluate the tolerance of the system to practical assembly errors, tolerance simulations were conducted in three dimensions: light source size deviation, position deviation, and angular deviation. Using the control-variable method, each parameter was set at six levels: light source diameters of 0, 0.1, 0.2, 0.3, 0.4, and 0.5 mm; angular deviations of 0°, 1°, 2°, 3°, 4°, and 5°; and position deviations of 0, 40, 80, 120, 160, and 200 μm (the light source diameter was fixed at 0.2 mm in the angular and position deviation tests). The number of traced rays was 2 × 10⁶, and the working distance was 2500 mm.
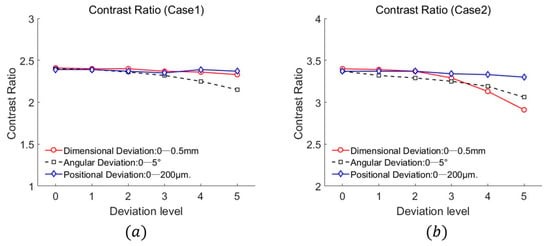
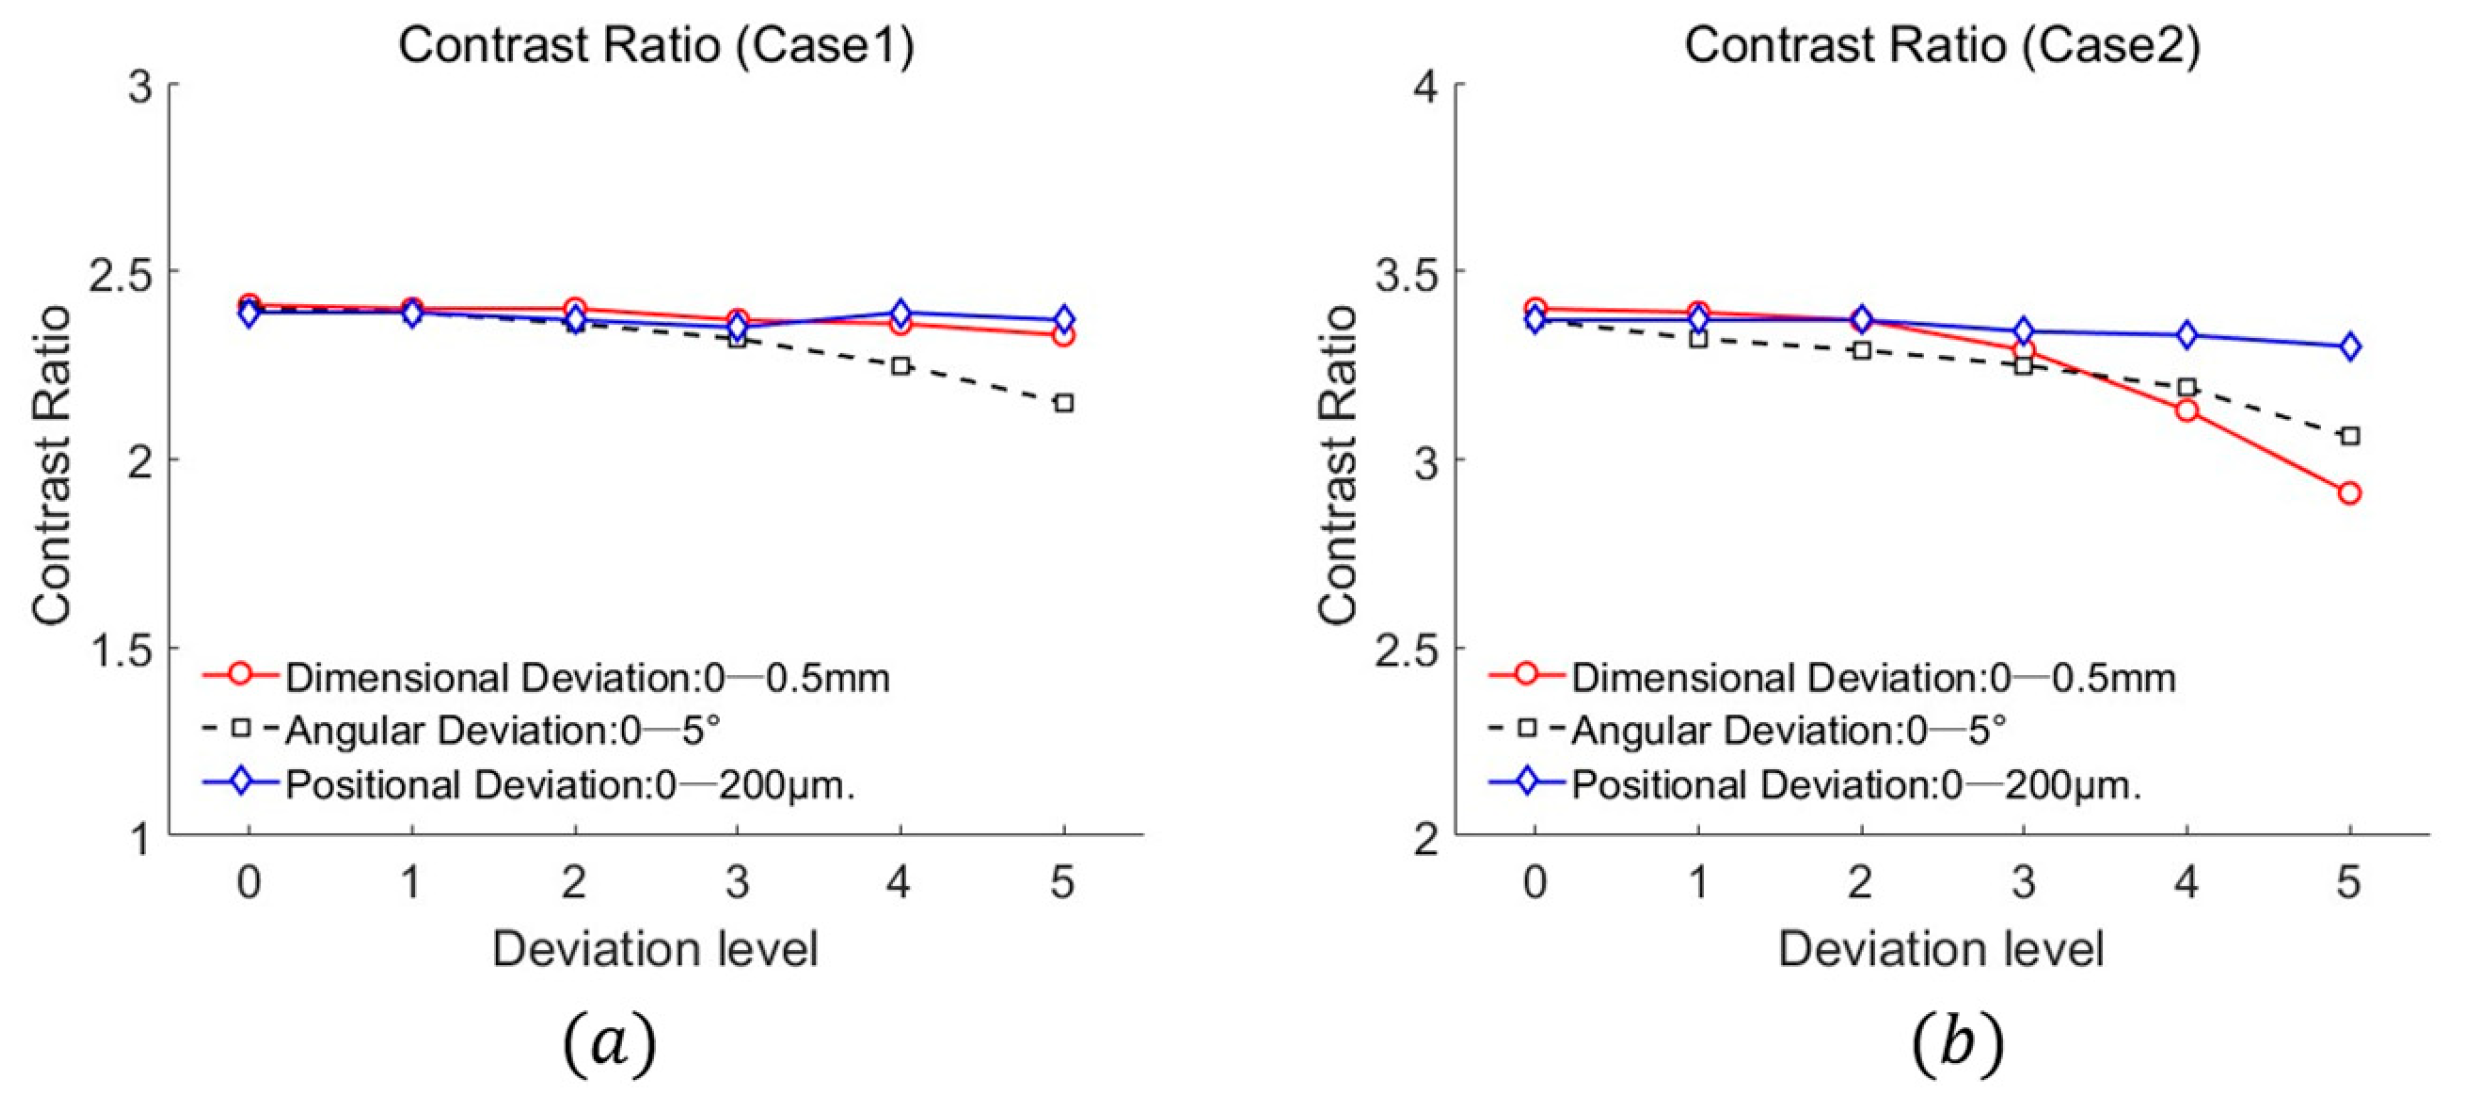
The evaluation metrics are defined as follows: uniformity (further subdivided into pattern-region uniformity and boundary-region uniformity , defined as the ratio of average to maximum irradiance), utilized to evaluate the absolute flatness of the illumination spot; energy utilization efficiency (defined as the ratio of the luminous flux received on the target to the luminous flux emitted by the source); and the contrast ratio (), defined as the ratio of the average irradiance within the main illuminated pattern to that within the peripheral boundary region.
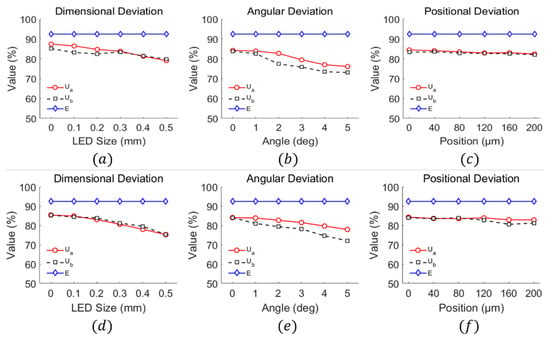
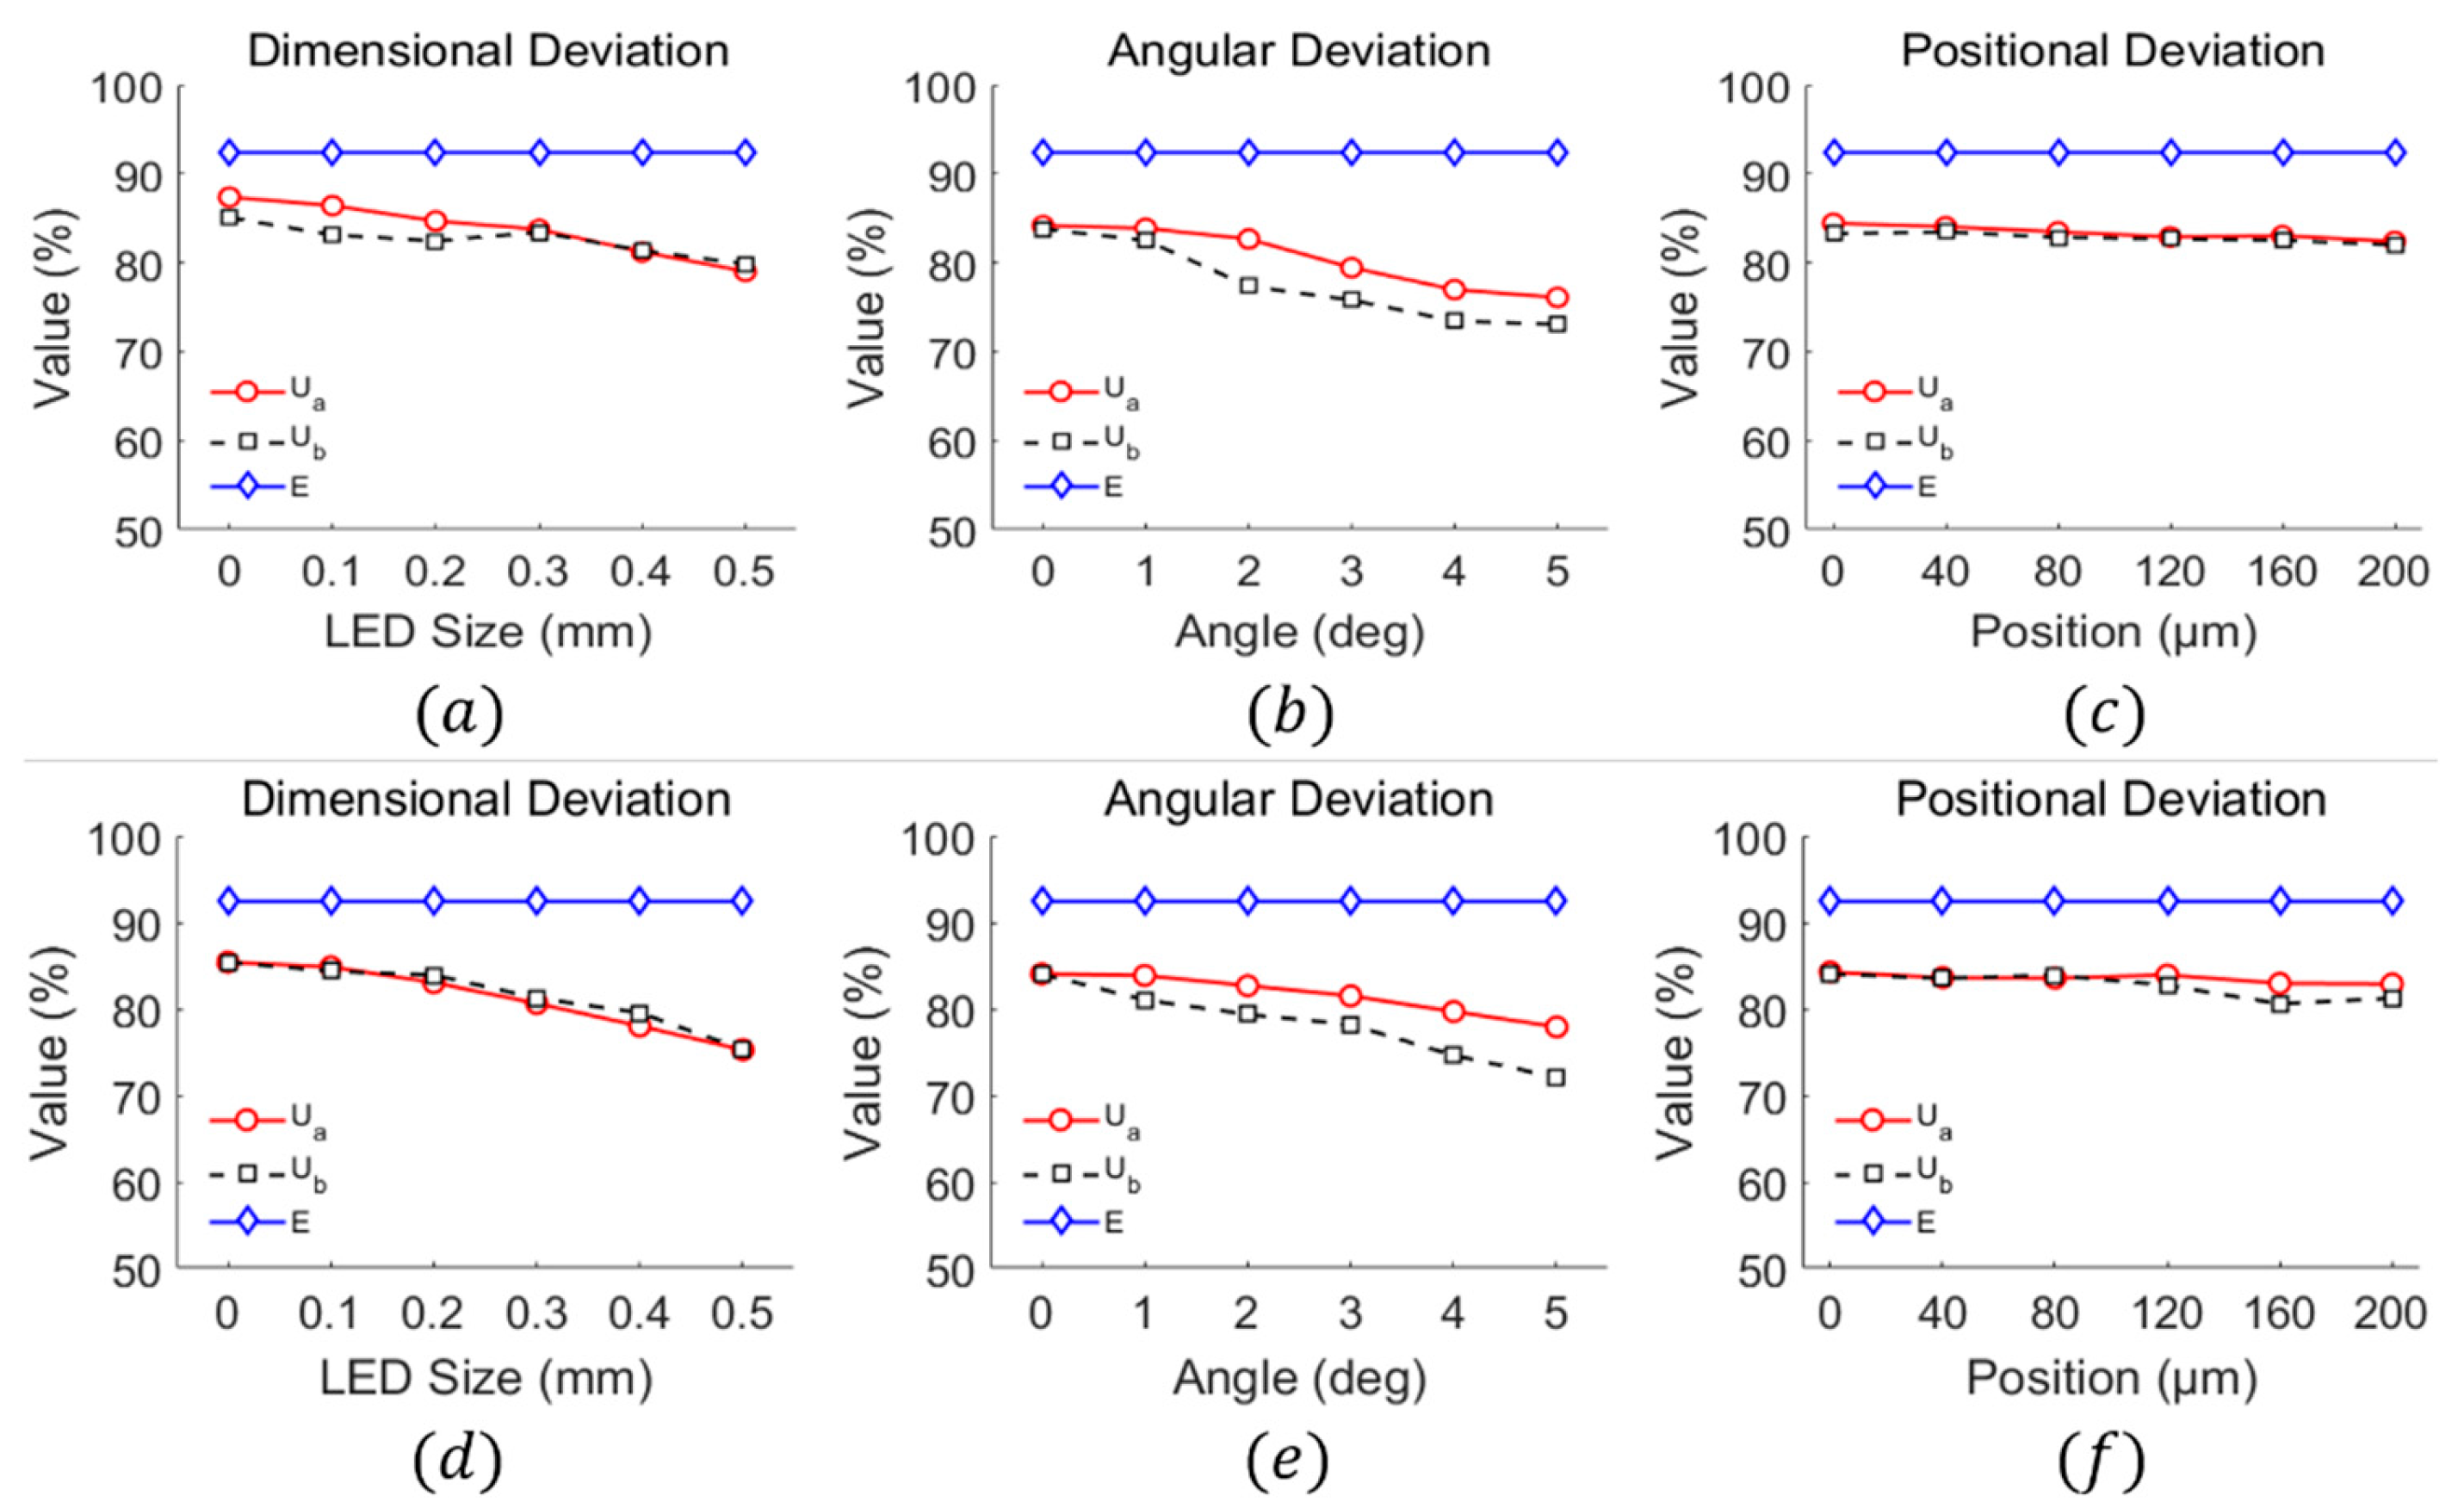
The simulation results for both cases are summarized in Table 1 and Table 2 and are also visualized as line charts in Figure 8 and Figure 9. Figure 8a–c and Figure 8c–f illustrate the variation curves of uniformity and energy efficiency for Case 1 and Case 2, respectively. Figure 9a,b depict the variation curves of the contrast ratio for Case 1 and Case 2.
Table 1.
Comparison of simulation results for performance metrics under different deviations (Case 1).
Table 2.
Comparison of simulation results for performance metrics under different deviations (Case 2).
Figure 8.
Variation curves of system energy efficiency and uniformity with respect to source size deviation, angular deviation, and positional deviation. (a) Effect of light source size (Case 1); (b) Effect of tilt angle (Case 1); (c) Effect of light source position (Case 1); (d) Effect of light source size (Case 2); (e) Effect of tilt angle (Case 2); (f) Effect of light source position (Case 2).
Figure 9.
Contrast ratio versus deviation level: (a) Case 1 and (b) Case 2.
Based on the simulation data and trend-line analysis under the two deviation conditions, it can be concluded that among the three types of deviations, angular deviation imposes the most significant impact on system performance, followed by source size deviation, while positional deviation has the least influence.
First, regarding energy efficiency, the energy utilization efficiency for both design cases remains around 92% under all deviation conditions, with a fluctuation of less than 1%. This stability arises because the misaligned beam remains within the clear apertures and the target plane is much larger than the pattern, so flux spillover is negligible. This indicates that the designed lens structure maintains a stable luminous flux collection capability across the entire illumination angle range, and assembly errors do not cause appreciable energy leakage, thereby demonstrating the high robustness of the design in terms of energy efficiency.
Second, in terms of uniformity, as the source size, tilt angle, and positional deviation increase, the uniformity metrics and exhibit varying attenuation. Specifically, when the source diameter increases from 0 to 0.5 mm, and for Case 1 decrease from 87.40% and 85.09% to 79.04% and 79.87%, respectively; while those for Case 2 decrease from 85.40% and 85.41% to 75.26% and 75.30%, both remaining above 75%. This verifies that the lens possesses a certain tolerance to variations in source size. When the angular deviation reaches 5°, and for both cases remain in the range of 73–77%. Furthermore, even under a positional deviation of 200 μm, the uniformity remains above 80%.
Finally, regarding the contrast ratio (CR), Case 1 is most sensitive to angular deviation. Under the nominal condition, the CR is maintained at 2.40, but it drops to 2.15 when the angular deviation reaches 5°. The impacts of source size and positional deviations on CR are relatively low, with CR remaining above 2.3. For Case 2, the source size deviation imposes the most significant impact: the CR decreases from 3.40 under nominal conditions to 2.91 when the source size increases to 5 mm. The sensitivities to angular and positional deviations are lower, with CR remaining above 3.0. Notably, the positional deviation has virtually no effect on the CR for Case 2.
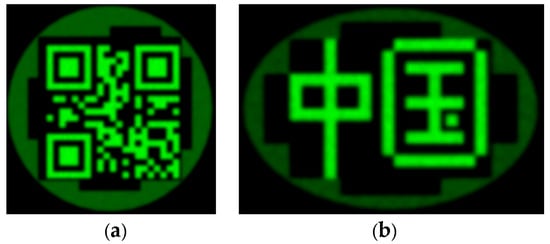
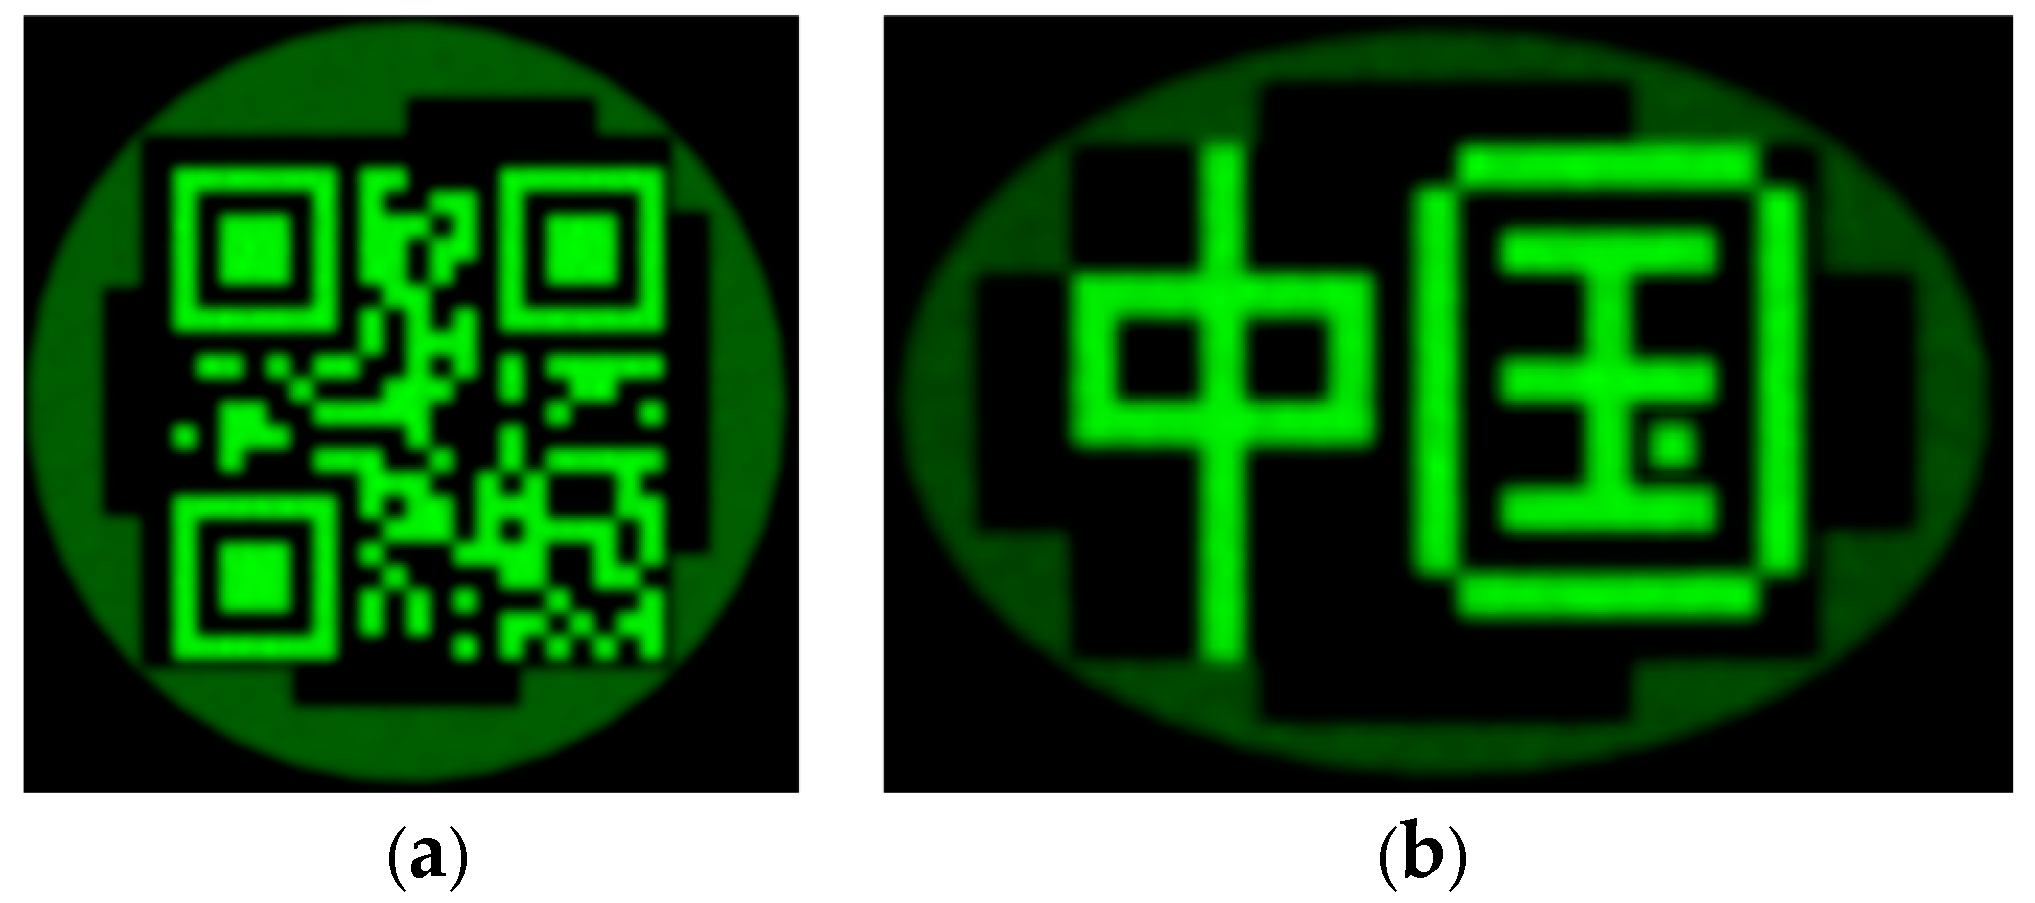
Additionally, to demonstrate generality, a high-frequency QR code and an irregular Chinese character were simulated (Figure 10), exhibiting sharp boundaries and high fidelity.
Figure 10.
Simulated irradiance distributions of complex patterns: (a) a QR code encoding “OPTICS”; (b) Chinese characters “中国”.
In this work, the energy utilization efficiency is defined as the ratio of the luminous flux received on the target plane to the luminous flux emitted by the source. The reported is a geometric ray-tracing efficiency: the lens material is assumed to be non-absorbing, and the air–dielectric interfaces are assumed to be free of reflection losses in the TracePro model. Consequently, the simulated quantifies the geometric flux collection and delivery capability of the designed configuration, rather than the absolute radiometric throughput of a fabricated system. Fresnel reflection and material absorption are discussed separately in Section 4.
4. Discussion
From the above simulation results, a comparison of MA [12], Multi-level SRBFs [8], and SRM [25] is given, with a summary in Table 3.
Table 3.
Qualitative comparison of design paradigms.
Unlike MA, SRM, and multilevel SRBFs, which are typically formulated as second-order implicit PDE problems and solved iteratively, the proposed method uses a first-order explicit recurrence for the decoupled subproblem after collimation. This does not imply lower computational cost for the original coupled problem or numerical superiority under identical settings. The trade-off is a more complex lens configuration with multiple freeform surfaces and a microlens array, increasing alignment and fabrication complexity. Table 3 is therefore a structural and problem-formulation comparison, not a numerical-performance ranking; literature-reported efficiency and uniformity are not directly comparable and are not used for ranking.
Compared with analytical ray-mapping methods that presuppose integrability and often require a second-order solve or iterative mapping correction, the proposed recurrence is not an alternative solver for the same constrained problem; it addresses the second-stage subproblem after collimation has been removed. The first-order form is a consequence of decoupling, not an approximation to the coupled second-order solution. Within each microlens sub-aperture, the linear mapping is integrable by construction, and inter-sub-aperture discontinuities are intentional for pixelated targets.
The additional surfaces and microlens array also introduce Fresnel losses not included in the geometric efficiency reported in Section 3.3. For , a single air–dielectric interface has ; for four interfaces, the uncoated Fresnel throughput is approximately , whereas AR coating can reduce the per-interface loss to below 0.5% and raise the total throughput above . This throughput trade-off is noted as a practical limitation of the proposed multi-surface configuration.
5. Conclusions
To address the inherent trade-off faced by conventional single-stage freeform surface design in simultaneously achieving high optical energy utilization and uniform illumination, this paper proposes a first-order iterative illumination design and simulation method based on a freeform surface–microlens array. The scheme adopts a stepwise design strategy that decomposes the complex beam shaping problem under a point light source into two independent subtasks: collimation and secondary shaping. By decoupling the collimation function from the pattern-generation function, the design fundamentally circumvents the constraint of strict integrability in single-stage mapping, significantly reducing the complexity of mathematical modeling and numerical solution. Simulation results show that the proposed method achieves a geometric optical efficiency of and an irradiance uniformity of under full-angle illumination. As a simulation-only study without experimental fabrication or optical characterization, the reported efficiency is a geometric ray-tracing efficiency excluding Fresnel reflection, material absorption, and spectral dispersion, and thus represents a geometric design upper bound rather than an experimentally achieved performance. Fabrication and optical characterization will be addressed in future work.
Author Contributions
Conceptualization, X.S. and Y.C.; methodology, X.S. and Y.C.; software, X.S. and W.X.; validation, Y.C.; formal analysis, X.S., Y.C. and X.J.; investigation, Y.C., X.J. and M.X.; resources, X.S., J.R. and W.X.; data curation, X.S., Y.C. and J.R.; writing—original draft preparation, Y.C.; writing—review and editing, X.S. and Y.Z.; visualization, Y.C., M.X. and Y.Z.; supervision, X.S.; project administration, X.S.; funding acquisition, X.S. All authors have read and agreed to the published version of the manuscript.
Funding
National Natural Science Foundation of China (52405591); Jiangxi Provincial Natural Science Foundation (20242BAB25104, 20224BAB214053); Research Startup Foundation for Faculty at East China Jiaotong University (558).
Informed Consent Statement
Not applicable.
Data Availability Statement
The original contributions presented in this study are included in the article. Further inquiries can be directed to the corresponding author.
Conflicts of Interest
Author Xiaolong Jin was employed by the company Staff Training Center of China Railway Shanghai Group Co., Ltd. Author Min Xiong was employed by the company Jiangxi Jiangling Group Electric Vehicle Co., Ltd. Author Jianfeng Ru was employed by the company Jiangxi Golden Light Technology Group Co., Ltd. Author Wenjie Xu was employed by the company Ma’anshan Huinong Agricultural Technology Development Co., Ltd. Author Yuqing Zhong was employed by the company Jiangxi Zhongyu Intelligent Manufacturing Equipment Co., Ltd. The remaining authors declare that the research was conducted in the absence of any commercial or financial relationships that could be construed as a potential conflict of interest.
References
- Bösel, C.; Gross, H. Compact freeform illumination system design for pattern generation with extended light sources. Appl. Opt. 2019, 58, 2713–2724. [Google Scholar] [CrossRef] [Scilit]
- Li, D.; Liu, J.; Wu, S. Design and realization of spectral imaging systems based on microlens arrays. Acta Opt. Sin. 2025, 45, 0411001. [Google Scholar]
- Kim, W.; Cassarly, W.; Pomerantz, M.; Rolland, J. Estimating the irradiance of a perturbed surface using physical optics approximation. Opt. Express 2024, 32, 20959–20975. [Google Scholar]
- Zheng, X.; Dai, S.; Zhang, Y.; Zhao, S. UV laser homogenization technology based on microlens array. Acta Opt. Sin. 2023, 43, 1014005. [Google Scholar]
- Doskolovich, L.L.; Bykov, D.A.; Bezus, E.A.; Greisukh, G.I. Design of a stigmatic lens implementing a required ray mapping. Appl. Opt. 2021, 60, 9138–9145. [Google Scholar] [CrossRef] [Scilit]
- Zhao, H.; Li, C.; Chen, Z.; Zhang, Z.; Zhao, W.; Wang, J. Design of collimating lens with uniform illumination for led based on double freeform surface. Acta Opt. Sin. 2017, 37, 0422001. [Google Scholar] [CrossRef] [Scilit]
- Zhou, X.; Xue, C.; Wei, Y. Design of a freeform illumination structure for digital display projection. Appl. Opt. 2025, 64, 4582–4588. [Google Scholar] [CrossRef] [Scilit]
- Tan, H.; Li, H.; Feng, Z.; Luo, Y.; Mao, X. Differentiable design of a double-freeform lens with multi-level radial basis functions for extended source irradiance tailoring. Optica 2024, 11, 653–664. [Google Scholar] [CrossRef] [Scilit]
- Braam, P.; Boonkkamp, J.; Anthonissen, M. An inverse design method for generalized zero-étendue sources and two targets. J. Opt. Soc. Am. A 2025, 43, 464–473. [Google Scholar] [CrossRef] [Scilit]
- Boonkkamp, J.H.M.T.T.; Mitra, K.; Anthonissen, M.J.H.; Kusch, L.; Braam, P.A.; Ijzerman, W.L. Inverse freeform design in non-imaging optics: Hamilton’s theory of geometrical optics, optimal transport, and least-squares solvers. Front. Phys. 2025, 13, 1518660. [Google Scholar] [CrossRef] [Scilit]
- Doskolovich, L.L.; Bykov, D.A.; Mingazov, A.A.; Bezus, E.A. Optimal mass transportation and linear assignment problems in the design of freeform refractive optical elements generating far-field irradiance distributions. Opt. Express 2019, 27, 13083–13097. [Google Scholar] [CrossRef] [Scilit]
- Wu, R.; Xu, L.; Liu, P.; Zhang, Y.; Zheng, Z.; Li, H.; Liu, X. Freeform illumination design: A nonlinear boundary problem for the elliptic Monge–Ampère equation. Opt. Lett. 2013, 38, 229–231. [Google Scholar] [CrossRef] [Scilit]
- Wu, R.; Chang, S.; Zheng, Z.; Zhao, L.; Liu, X. Formulating the design of two freeform lens surfaces for point-like light sources. Opt. Lett. 2018, 43, 1619–1622. [Google Scholar] [CrossRef] [Scilit]
- Chen, J.; Zhou, Y.; He, H.; Li, Y. Adaptive construction of freeform surface to integrable ray mapping using implicit fixed-point iteration. Photonics 2025, 12, 134. [Google Scholar] [CrossRef] [Scilit]
- Xu, S.; Su, Z.; Lei, M. Freeform mirror design for beam shaping by a combined approach using Poisson-based grid optimization and a discrete cosine transform. Appl. Opt. 2024, 63, 9037–9045. [Google Scholar] [CrossRef] [Scilit]
- Ni, Y.; Feng, D.; Ma, D. Design of freeform microlens arrays with prescribed luminance distributions for MicroLED optical packaging. Appl. Opt. 2025, 64, 7875–7884. [Google Scholar] [CrossRef] [Scilit]
- Desnijder, K.; Ryckaert, W.; Hanselaer, P.; Meuret, Y. Luminance spreading freeform lens arrays with accurate intensity control. Opt. Express 2019, 27, 32994–33004. [Google Scholar] [CrossRef] [Scilit]
- Sasaki, A.; Kirino, O.; Watanabe, K.; Beaucamp, A. Optimization of segment topology and surface form for efficient illumination with freeform lens arrays. CIRP Ann.-Manuf. Technol. 2025, 74, 179–183. [Google Scholar] [CrossRef] [Scilit]
- Wu, R.; Sun, H.; Chen, Y.; Zheng, X.; Xu, Y.; She, J.; Zhang, Z. Unlocking freeform optics design for extended light sources. Optica 2025, 12, 1200–1203. [Google Scholar] [CrossRef] [Scilit]
- Zhu, Z.; Wei, S.; Fan, Z.; Yan, Y.; Ma, D. Design ultra-compact aspherical lenses for extended sources using particle swarm optical optimization algorithm. IEEE Photonics J. 2019, 11, 8201614. [Google Scholar] [CrossRef] [Scilit]
- Pan, X.; Feng, Z.; Yang, K. Physics-driven deep neural networks for solving the optimal transport problem associated with the monge-ampère equation. CAAI Trans. Intell. Technol. 2026, 11, 15–25. [Google Scholar] [CrossRef] [Scilit]
- Pan, X.; Tang, H.; Feng, Z. Spectacle lens design with double aspheric surfaces using differentiable ray tracing. Appl. Opt. 2025, 64, 7611–7617. [Google Scholar] [CrossRef] [Scilit]
- Feng, Z.; Cheng, D.; Wang, Y. Iterative freeform lens design for prescribed irradiance on curved target. Opto-Electron. Adv. 2020, 3, 200010. [Google Scholar] [CrossRef] [Scilit]
- Wei, S.; Zhu, Z.; Fan, Z.; Ma, D. Least-squares ray mapping method for freeform illumination optics design. Opt. Express 2020, 28, 3811–3821. [Google Scholar] [CrossRef] [Scilit]
- Wei, S.; Zhu, Z.; Fan, Z.; Yan, Y.; Ma, D. Double freeform surfaces design for beam shaping with non-planar wavefront using an integrable ray mapping method. Opt. Express 2019, 27, 26757–26771. [Google Scholar] [CrossRef] [Scilit]
- Zhang, S.; Gao, L.; Zhao, Y.; Wang, Y.; Wang, B.; Li, J.; Duan, J.; Cheng, D.; Qiu, C.-W.; Wang, Y.; et al. Integrated metasurface-freeform system enabled multi-focal planes augmented reality display. Opto-Electron. Sci. 2026, 5, 250031. [Google Scholar] [CrossRef] [Scilit]
- Zhou, S.; Huang, X.; Lu, L.; Ullah, H.; Du, K.; Trusiak, M.; Kujawinska, M.; Zhang, Y.; Fan, Y.; Chen, Q.; et al. Physics-informed neural fields enable blind aberration correction for partially coherent quantitative phase imaging. Opto-Electron. Sci. 2026, 5, 260019. [Google Scholar] [CrossRef] [Scilit]
- Kumar, S.; Tong, Z.; Jiang, X. Advances in the design and manufacturing of novel freeform optics. Int. J. Extrem. Manuf. 2022, 4, 032004. [Google Scholar] [CrossRef] [Scilit]

Disclaimer/Publisher’s Note: The statements, opinions and data contained in all publications are solely those of the individual author(s) and contributor(s) and not of MDPI and/or the editor(s). MDPI and/or the editor(s) disclaim responsibility for any injury to people or property resulting from any ideas, methods, instructions or products referred to in the content. |
© 2026 by the authors. Licensee MDPI, Basel, Switzerland. This article is an open access article distributed under the terms and conditions of the Creative Commons Attribution (CC BY) license.