


Abstract
Conventional long-wavelength vertical-cavity surface-emitting lasers (VCSELs) require thick distributed Bragg reflectors (DBRs) to provide high-reflectance optical feedback. We present a numerical design of a 1654 nm InP-based VCSEL with a single-layer monolithic high-contrast grating (MHCG) top output-coupling mirror. The optimized mirror achieves a zero-order reflectance of 99.29% for transverse-electric (TE) polarization near 1654 nm. Complete-cavity simulations show a longitudinal standing wave overlapping the quantum wells. At 5 mA, the MHCG architecture reduces whole-device Joule power by 91.53% relative to the DBR reference. A matched active-core heat load gives a 23.94% higher active-to-sink thermal resistance for MHCG, separating resistive heat reduction from heat-extraction performance. The design combines axial optical feedback with reduced top-reflector thickness and lower Joule heating, providing a basis for optical and thermal-path co-design.
1. Introduction
Vertical-cavity surface-emitting lasers (VCSELs) offer low threshold currents, nearly circular beams, large longitudinal mode spacings, and straightforward integration into two-dimensional arrays [1]. They are used in optical communications, light detection and ranging (LiDAR), and gas spectroscopy [2,3]. Compared with edge-emitting semiconductor lasers, VCSELs have shorter cavities and more compact structures. Adjusting the injection current and operating temperature allows continuous wavelength scanning, making VCSELs suitable for miniaturized tunable diode laser absorption spectroscopy (TDLAS) systems [4,5,6].
The near-infrared CH4 absorption line at approximately 6046.95 cm−1 (1653.7 nm) has relatively high line strength and limited H2O and CO2 interference over common tuning ranges [7]. Several TDLAS studies have used lasers near 1654 nm for selective methane measurements [8,9]. Designing a long-wavelength VCSEL at this wavelength remains challenging [10,11]. The limited refractive-index contrast available in InP-based materials generally requires many DBR periods to achieve high reflectance. The resulting epitaxial thickness may affect thermal management and electrical performance [10,11,12].
High-contrast gratings (HCGs) offer an alternative top reflector [13]. They comprise high-index bars in a low-index surrounding medium and form a subwavelength periodic structure. Excitation and interference of a small number of grating eigenmodes can produce broadband high reflectance [14]. Compared with conventional DBRs, HCGs are thinner and allow geometric control of reflection phase and polarization response [15]. These properties are useful in top output-coupling mirrors for long-wavelength VCSELs.
Early HCG-VCSELs primarily used air-suspended gratings. In 2007, Huang et al. first integrated an HCG into a VCSEL, demonstrating the feasibility of replacing the conventional top DBR [15]. In 2010, Hofmann et al. reported a long-wavelength HCG-VCSEL operating at 1320 nm [16]. Chase et al. subsequently demonstrated an electrically injected continuous-wave HCG-VCSEL operating at 1550 nm [17].
To avoid the release and support processes required for suspended HCGs, Gębski et al. introduced the monolithic high-contrast grating (MHCG) in 2015. The grating bars and supporting layer are formed from the same high-index material, and multimode interference produces high reflectance [18]. They subsequently incorporated MHCGs into VCSELs and analyzed their modal properties [19]. Marciniak et al. jointly optimized grating period, duty cycle, and etch depth and validated the design in a 980 nm GaAs-based MHCG-VCSEL [20].
In 2019, Gębski et al. reported an electrically injected VCSEL with a composite top reflector combining an MHCG with a reduced-period DBR. Continuous-wave lasing at 980 nm demonstrated that the MHCG could operate with a partial DBR to provide optical feedback, reflection-phase control, and polarization selectivity [21]. MHCGs have since been extended to other material systems and have shown some potential for sensing applications [22].
HCG-VCSELs have been studied in GaAs-based and long-wavelength InP-based devices. Published MHCG-VCSEL experiments, however, have mainly examined 980 nm GaAs devices and short-wavelength GaN devices. Although MHCGs have been demonstrated as VCSEL mirrors, systematic design and complete-cavity analysis remain limited for 1654 nm InP-based devices with a single-layer MHCG top output-coupling mirror.
Here, we present the numerical design of a 1654 nm InP-based MHCG-VCSEL for potential methane-sensing applications. Rigorous coupled-wave analysis (RCWA) evaluates the mirror response, while complete-cavity simulations assess optical-field overlap. Electrothermal calculations compare resistive heat generation and heat extraction.
2. Materials and Methods
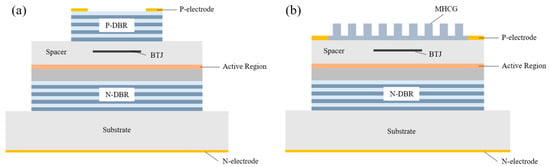
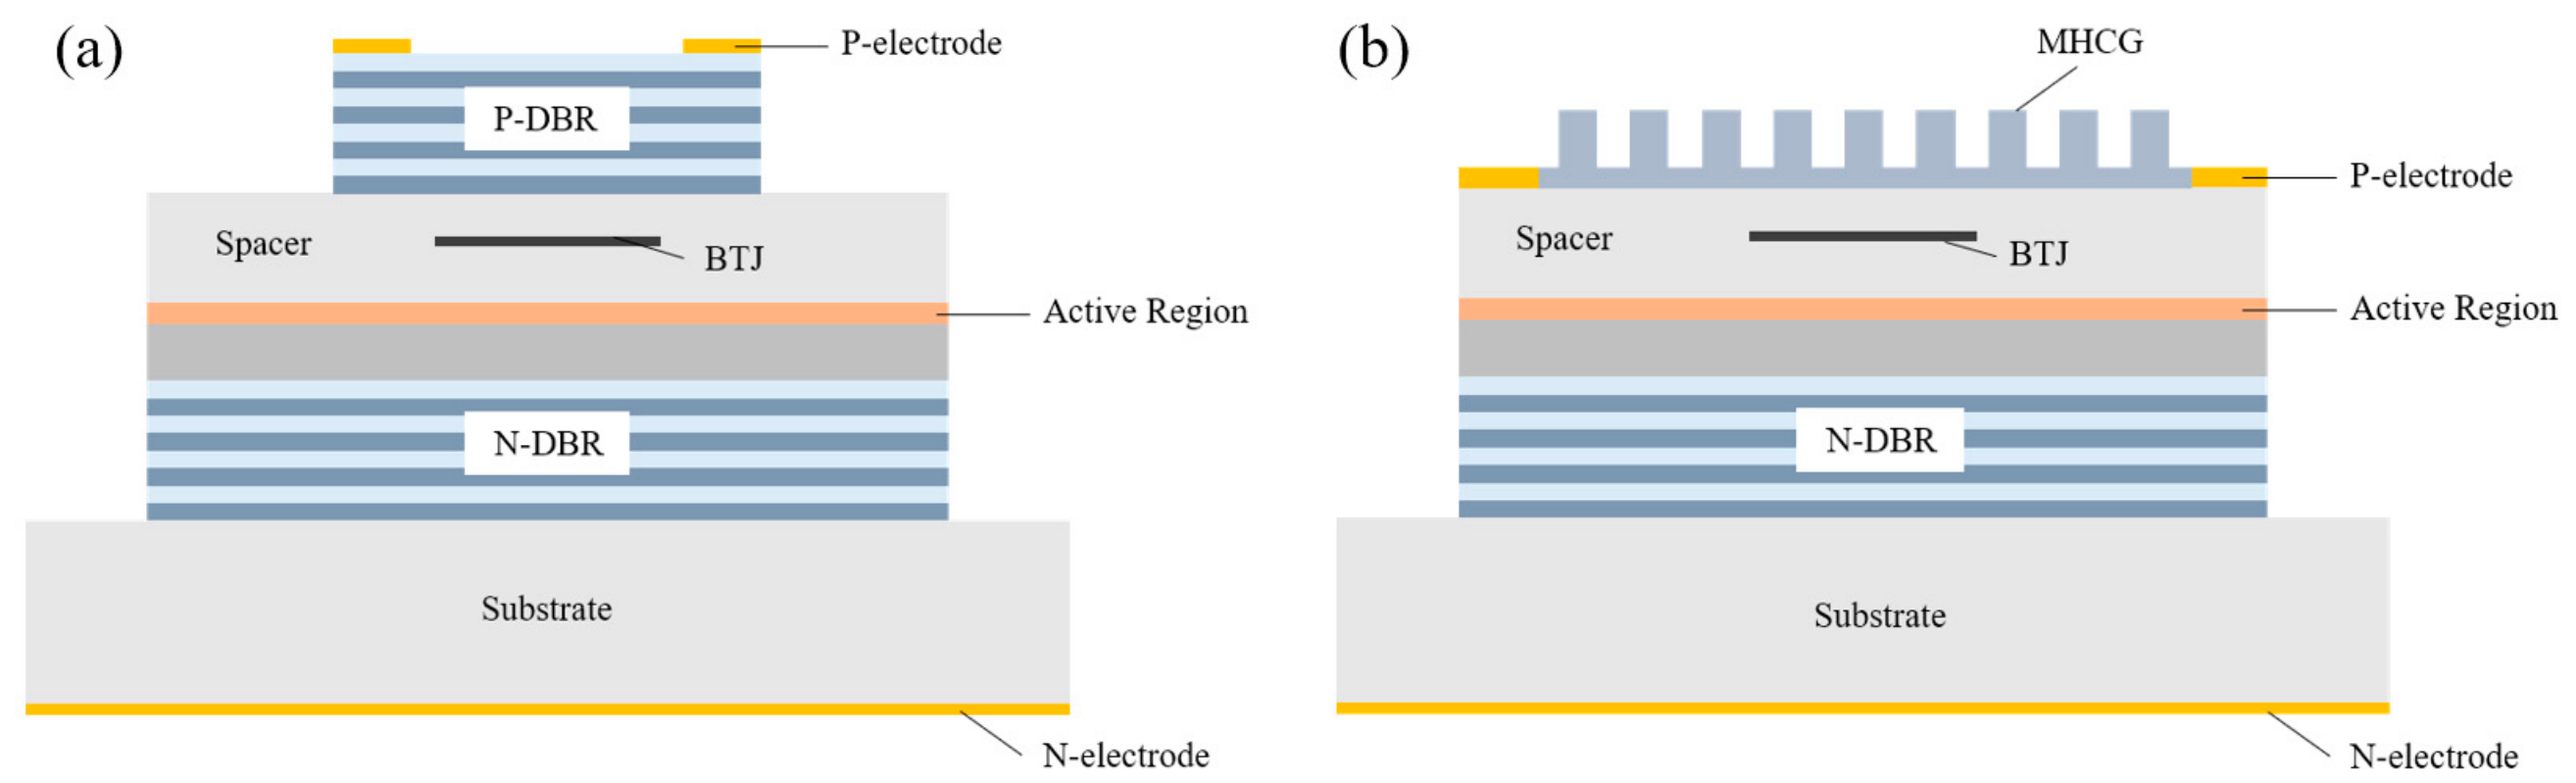
Figure 1 compares the conventional DBR-VCSEL with the proposed MHCG-VCSEL. The latter retains the bottom N-DBR and replaces the top P-DBR with a single-layer MHCG. Its four functional regions are the MHCG top output-coupling mirror; the buried tunnel junction (BTJ) and upper current-injection region; the cavity containing spacers, confinement layers, and the active region; and the bottom N-DBR. The InP substrate supports the epitaxial stack, and the P- and N-electrodes inject current through the device. The BTJ limits the thickness of resistive p-type material, the active region provides optical gain, and the reflectors form the vertical cavity.
Figure 1.
(a) Schematic of a conventional top-emitting VCSEL. (b) Schematic of the proposed MHCG-VCSEL, in which the top P-DBR is replaced by an MHCG while the bottom N-DBR is retained.
A conventional DBR obtains high reflectance through Bragg interference in many alternating high- and low-refractive-index quarter-wave layers. The MHCG instead consists of a patterned high-index semiconductor layer and an underlying continuous layer; interference between grating eigenmodes produces the reflected field. This resonant mechanism allows the reflection amplitude and phase to be adjusted through the period, duty cycle, etch depth, and residual-layer thickness while substantially reducing the thickness of the top reflector.
2.1. Basic Structure Design of the 1654 nm VCSEL
2.1.1. Active Region and Tunnel Junction
The operating wavelength of a VCSEL is determined by the material gain spectrum and the longitudinal cavity mode. To provide gain near 1654 nm, the active region uses In0.73Ga0.24Al0.03As quantum wells and In0.44Ga0.33Al0.23As barriers. The well material has a lower Al content than the barrier material.
Neglecting excitonic corrections, the ground-state transition wavelength is approximately
Here, Eg,w is the well bandgap, Ee1 and Ehh1 are the electron and heavy-hole confinement energies relative to their well band edges, h is Planck’s constant, and c is the speed of light in vacuum.
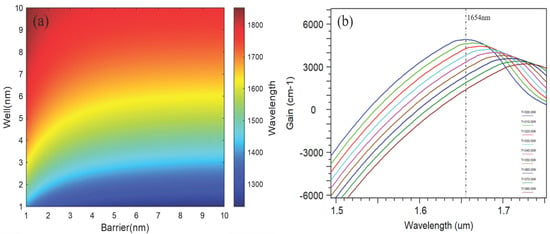
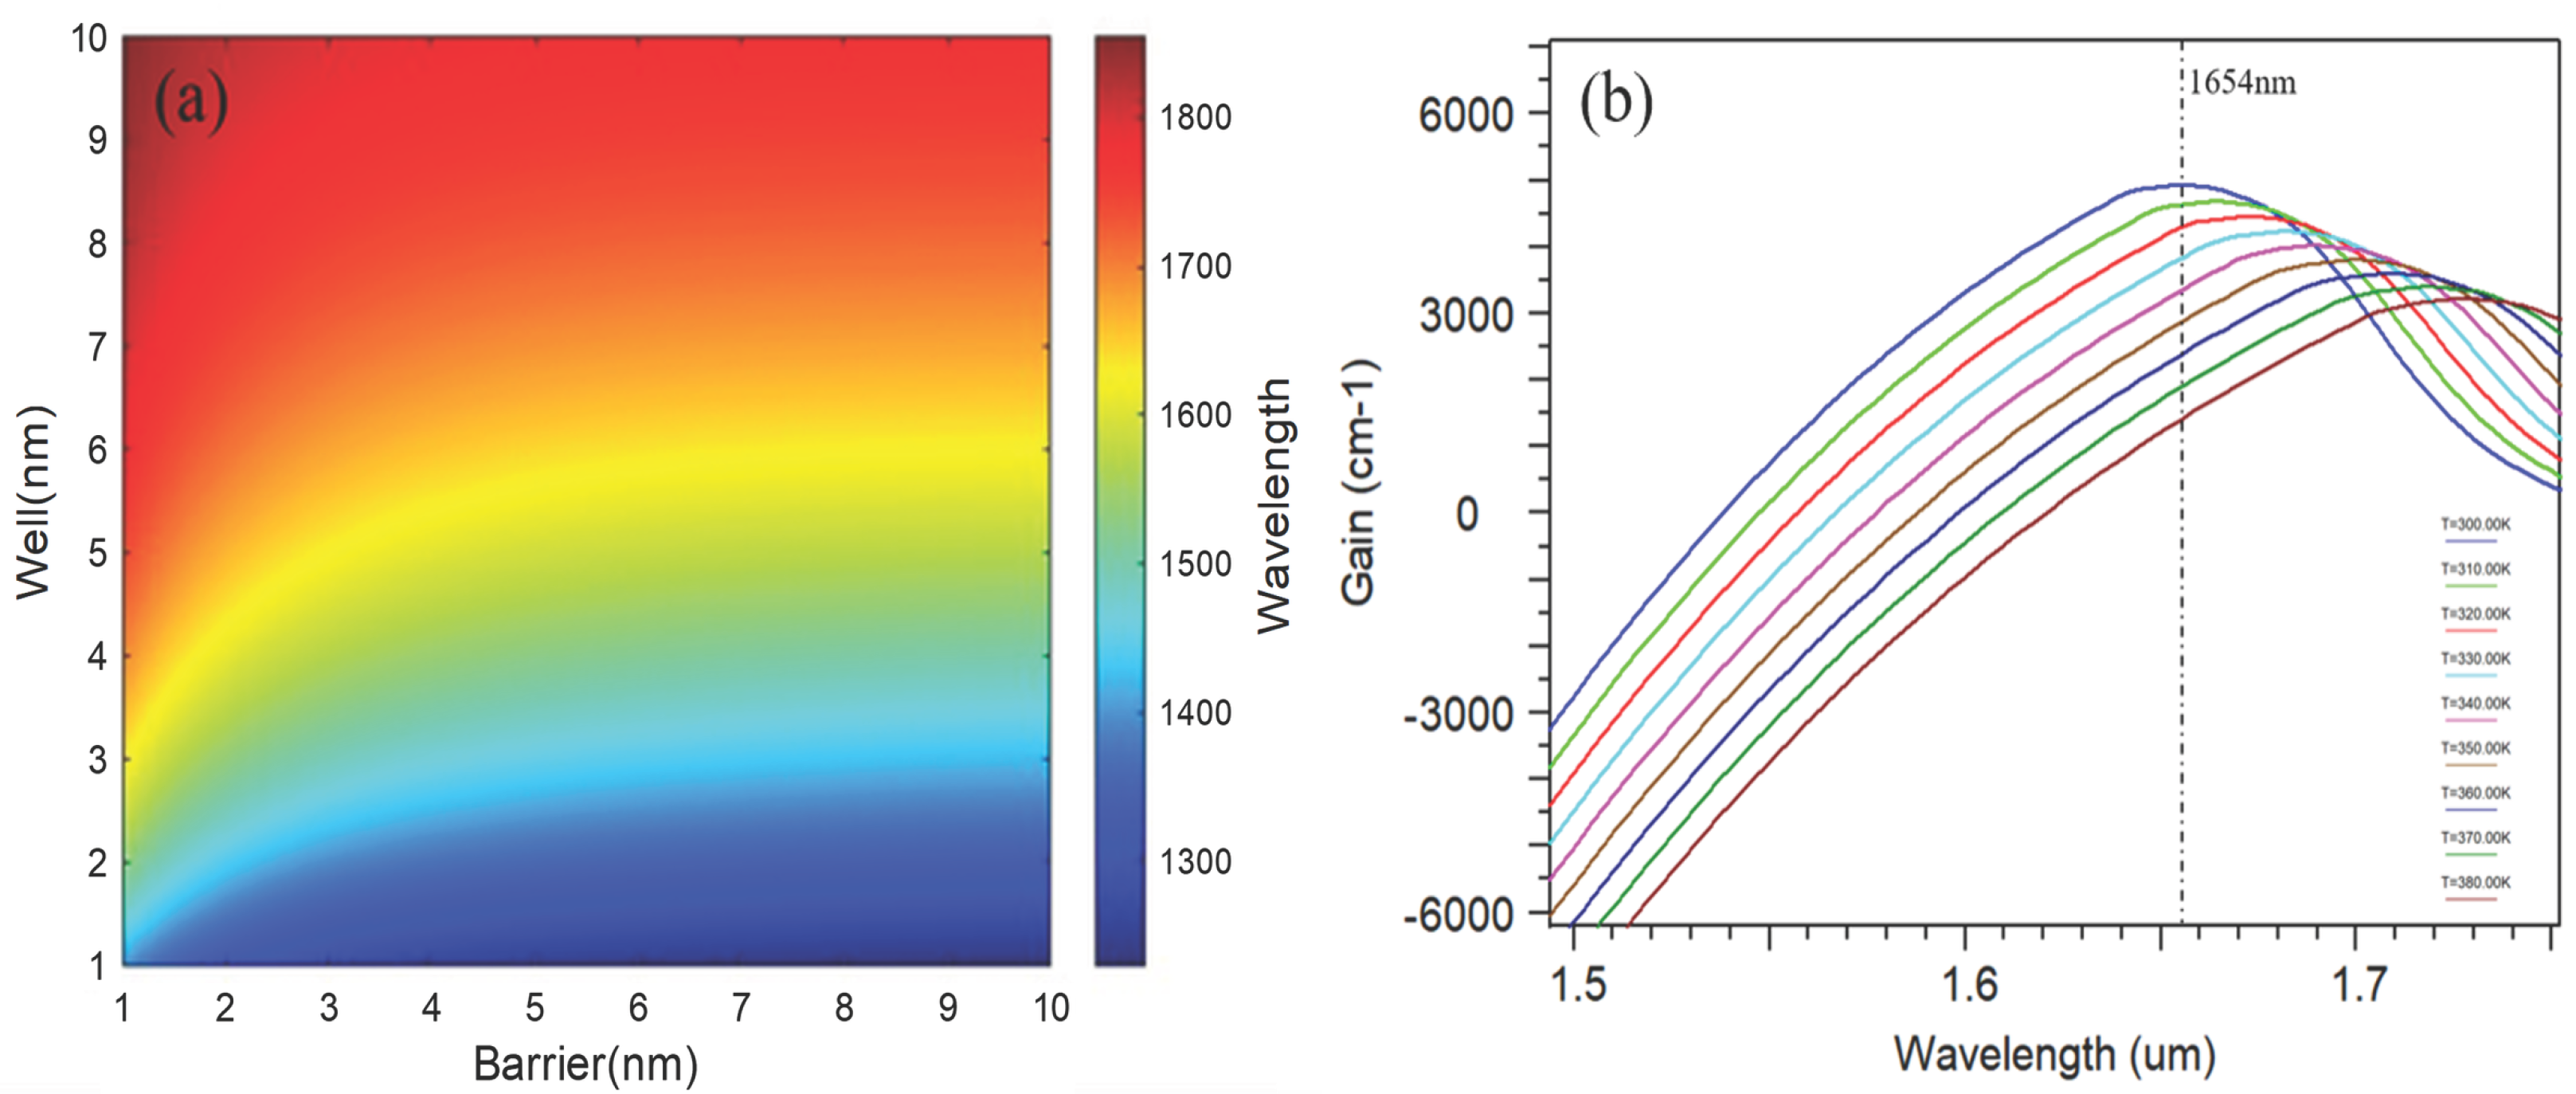
Figure 2a shows the transition wavelength for well and barrier widths of 1–10 nm. Increasing the well width reduces the confinement energies and shifts the transition to longer wavelengths. We selected six periods of 6 nm wells and 10 nm barriers. Figure 2b shows the corresponding gain spectra at temperatures from 300 to 380 K.
Figure 2.
(a) Quantum-well transition wavelength as a function of well and barrier widths; (b) Quantum-well gain spectra at temperatures from 300 to 380 K.
A 71 nm graded confinement layer is placed on each side of the active region to enhance carrier confinement and smooth abrupt band-edge changes. The upper and lower InP spacers primarily adjust the optical cavity length and the positions of the longitudinal standing-wave maxima.
Long-wavelength InP-based VCSELs commonly contain resistive p-type materials with appreciable free-carrier absorption. A heavily doped tunnel junction is therefore placed above the active region to limit the electrical and optical losses associated with thick p-type conducting layers.
The local tunnel-junction stack consists of p-InP, p++-In0.531Al0.05Ga0.419As, n++-In0.531Al0.05Ga0.419As, and n-InP. Each alloy layer is 20 nm thick and has a nominal acceptor or donor concentration of 5 × 1019 cm−3. The adjacent p-type and n-type InP layers have nominal doping concentrations of 2 × 1018 cm−3.
For an ideal abrupt junction, the depletion approximation gives the zero-bias width as
Here, W0 is the approximate zero-bias depletion width, εs is the semiconductor permittivity, Vbi is the built-in potential, and q is the elementary charge. NA and ND denote the acceptor and donor concentrations, respectively. This expression provides a characteristic length scale under the depletion approximation; it does not define a sharp boundary in the numerical profile of a heavily doped junction.
The equilibrium band profile was calculated at 300 K and zero applied bias. The laterally uniform local model included a 100 nm thick InP numerical reservoir on each side, with ohmic contacts at the outer boundaries. The nominal vertical mesh spacing was approximately 0.25 nm in the alloy layers and 0.5 nm in InP. The electrostatic potential satisfies Poisson’s equation,
where x is the position normal to the layers, ϕ is the electrostatic potential, ε(x) = εr(x)ε0 is the local permittivity, εr is the relative permittivity, and ε0 is the vacuum permittivity. The quantities n and p are the electron and hole densities, while and are the ionized donor and acceptor densities.
The relative static permittivities were set to 12.5 for InP and 13.6 for the alloy, with band gaps of 1.344 and 0.828 eV, respectively. The InP/alloy conduction- and valence-band offset magnitudes were set to 0.199 and 0.317 eV. The valence-band offset was estimated from published heterojunction band-offset data using linear composition interpolation; the conduction-band offset follows from the band-gap difference. These effective alloy parameters were not independently calibrated for the exact composition and doping concentration.
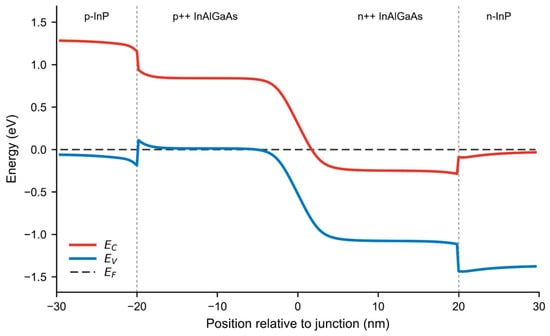
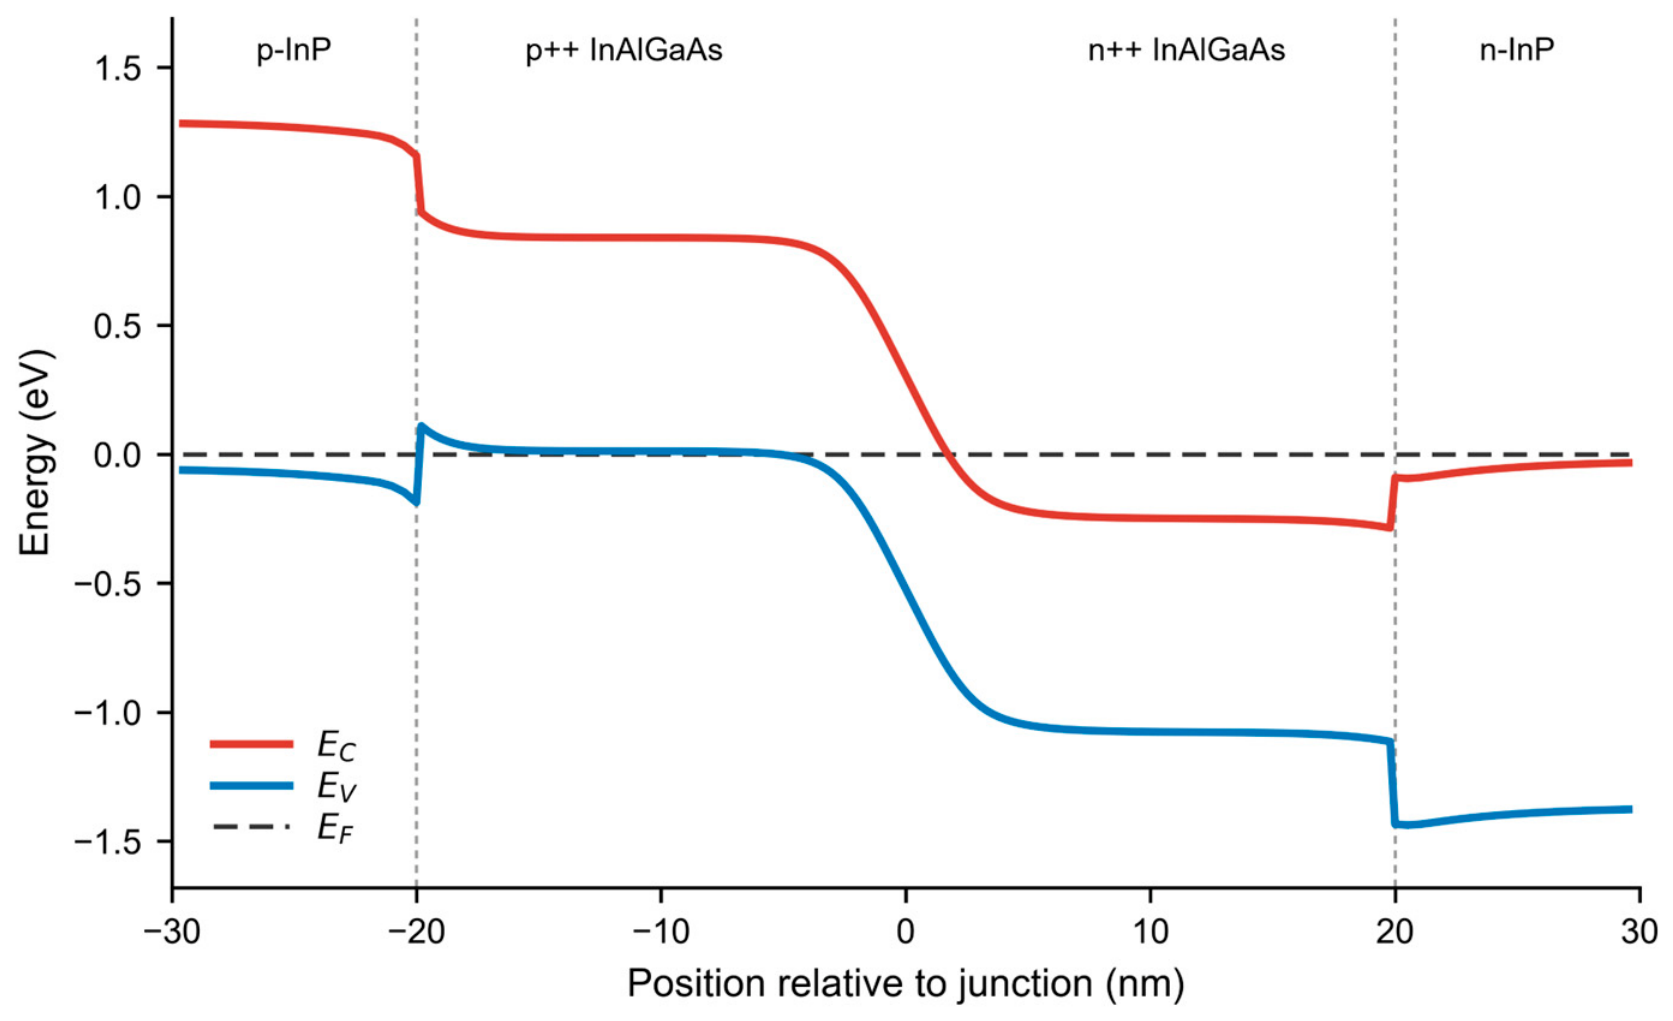
Figure 3 shows the calculated conduction-band edge EC, valence-band edge EV, and equilibrium Fermi level EF. The steps at x = −20 and +20 nm correspond to the InP/InAlGaAs heterointerfaces, and EF remains constant throughout the structure. The profile illustrates the equilibrium band alignment under the stated material assumptions; it is not used to extract a depletion width or quantify tunneling transport.
Figure 3.
Calculated zero-bias equilibrium band diagram of the local p-InP/p++-In0.531Al0.05Ga0.419As/n++-In0.531Al0.05Ga0.419As/n-InP stack at 300 K. The dashed vertical lines at ±20 nm mark the material interfaces. EC, EV, and EF denote the conduction-band edge, valence-band edge, and Fermi level.
2.1.2. Bottom DBR Design
The bottom DBR provides the lower cavity reflector, while the MHCG replaces the conventional top DBR. Quarter-wave optical thicknesses define the initial design, with physical thicknesses adjusted for the target-wavelength reflection spectrum and cavity-mode matching. The transfer matrix method (TMM) was used to calculate the DBR reflectance spectrum and reflection phase [23].
The bottom DBR comprises alternating high-index In0.52Ga0.45Al0.03As and low-index In0.52Al0.48As layers. Its design wavelength λ0 is 1654 nm. Under the quarter-wave condition, the high- and low-index layers satisfy
Here, nH and nL are the layer refractive indices, dH and dL are their physical thicknesses, and λ0 = 1654 nm is the design wavelength. With nH = 3.4281 and nL = 3.2196, the initial thicknesses are dH = 120.6 nm and dL = 128.4 nm.
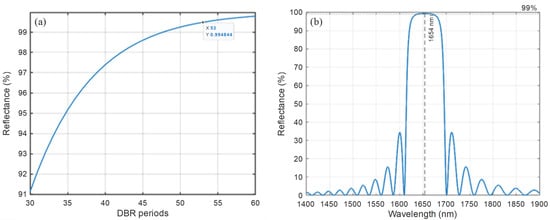
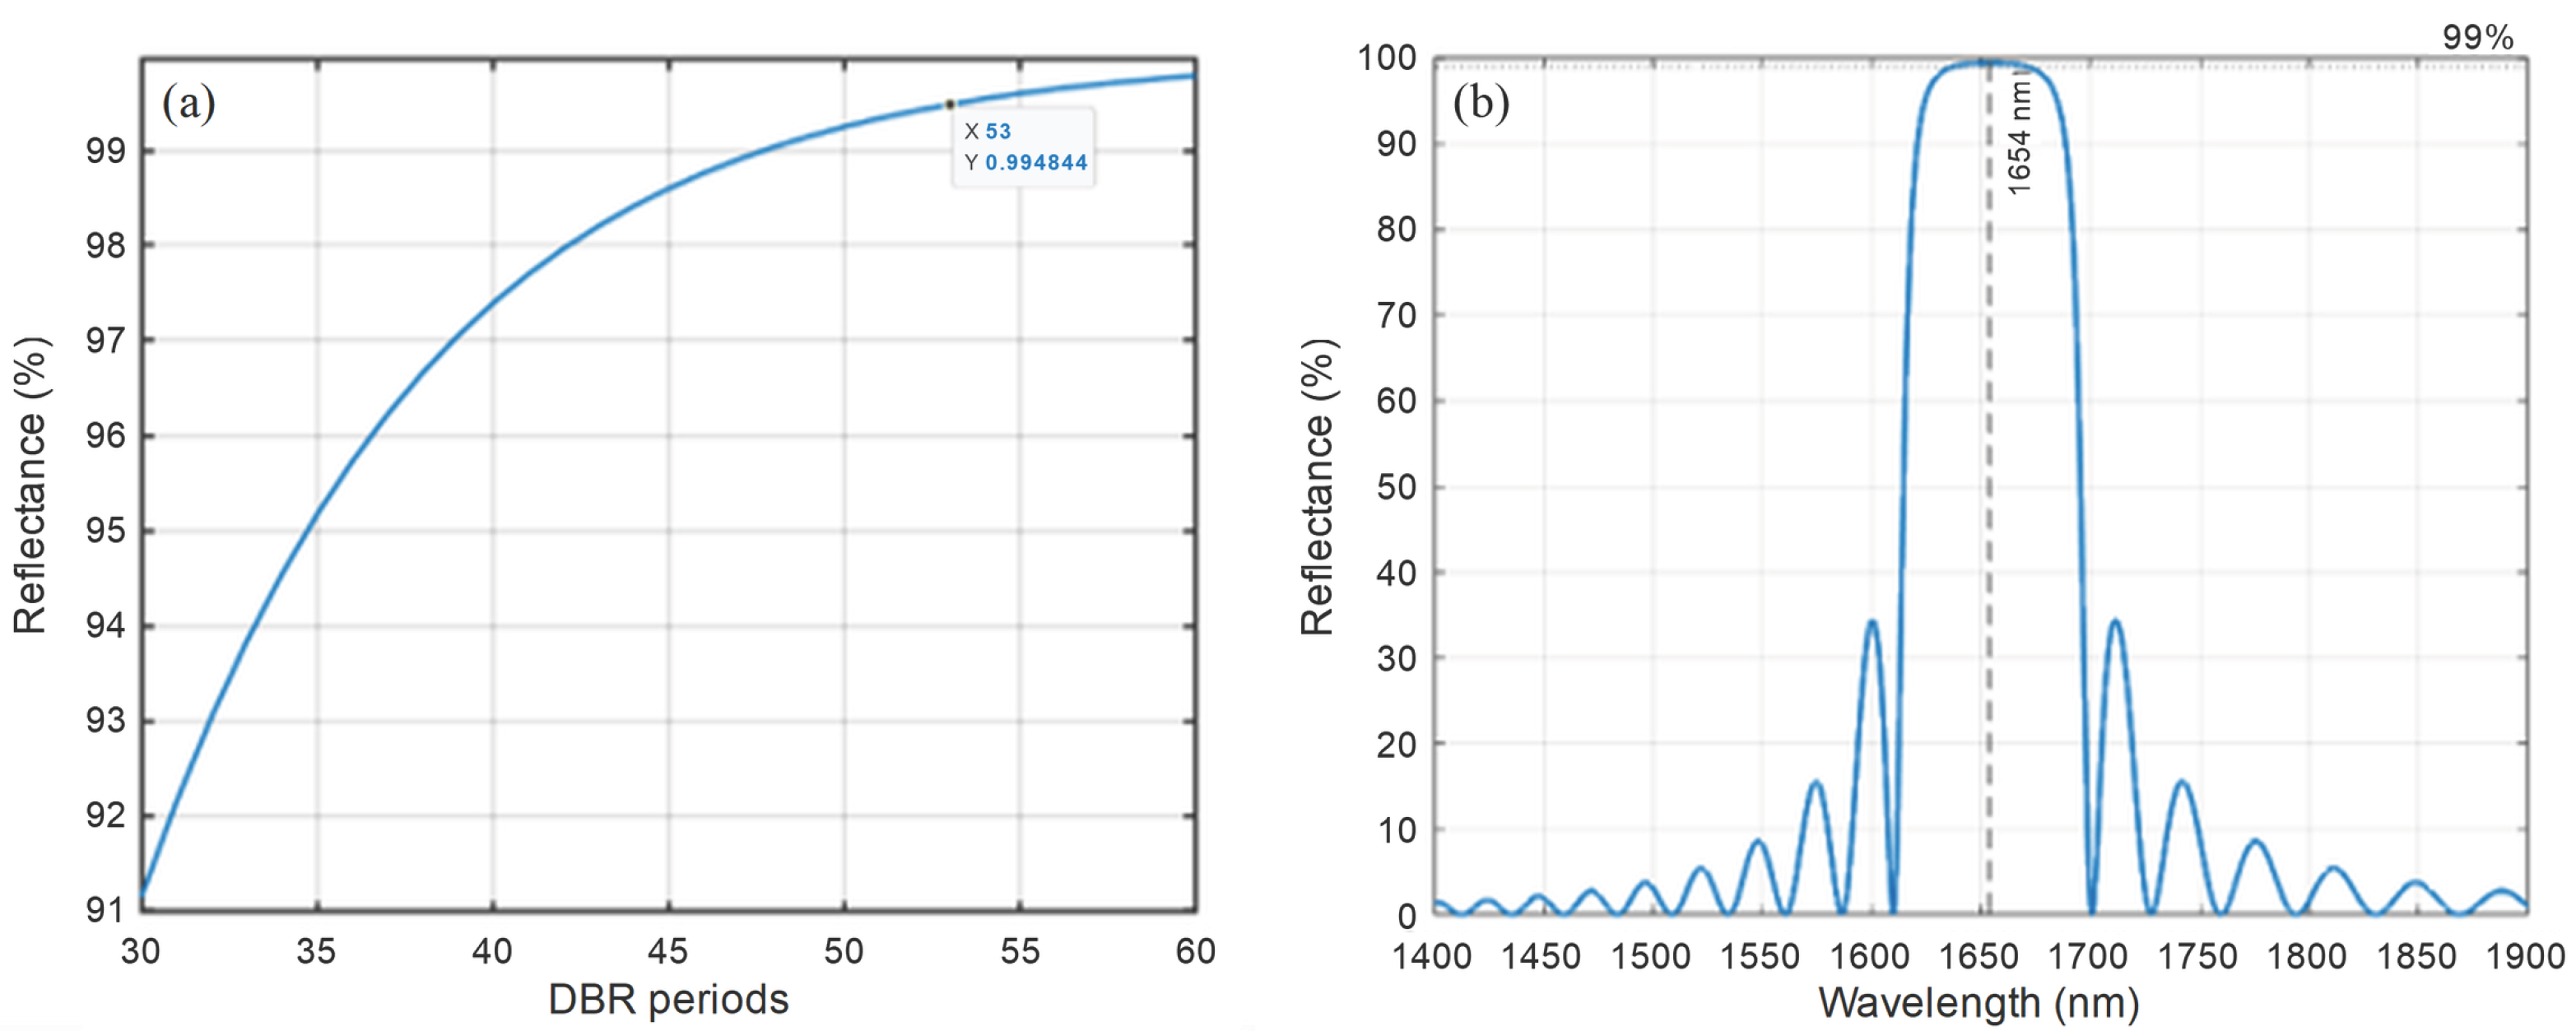
Figure 4a shows the bottom-DBR reflectance at 1654 nm as a function of the number of layer pairs. The reflectance increases with pair number and approaches saturation. A 53-pair DBR reaches approximately 99.48% reflectance at the design wavelength, which lies within the high-reflectance stopband shown in Figure 4b.
Figure 4.
(a) Bottom DBR reflectance at 1654 nm as a function of the number of periods; (b) Reflectance spectrum of the 53-pair bottom DBR.
2.2. MHCG Structure Design and Optimization
2.2.1. Structural Model and Design Parameters
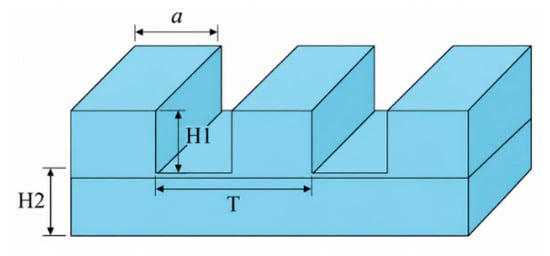
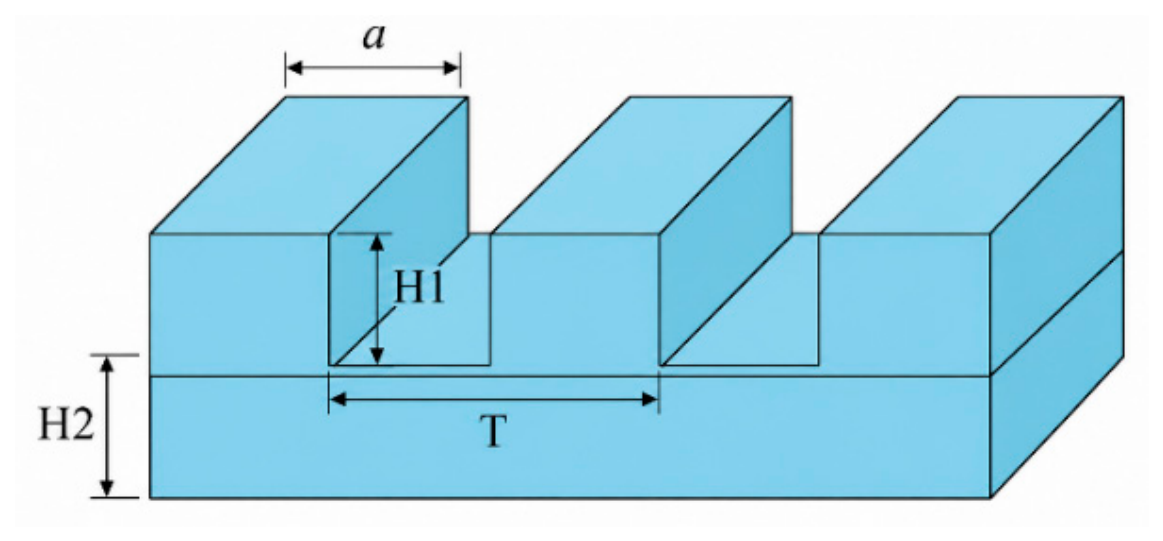
As shown in Figure 5, the one-dimensional MHCG has period T, bar width a, duty cycle , etch depth H1, and continuous-layer thickness H2. The period and duty cycle control grating-mode coupling, while H1 and H2 control phase accumulation. These parameters were varied jointly in the optimization.
Figure 5.
Schematic of the MHCG structure.
RCWA was used to calculate the reflected diffraction orders under normal incidence from the InP side. TE polarization has its electric field parallel to the grating bars; TM polarization was evaluated for comparison. The initial model used real refractive indices, neglected absorption, and retained 31 spatial harmonics; the refined polarization spectra used 111 harmonics. The RCWA formulation follows [24].
Here, Pr,m is the power reflected in diffraction order m, Pinc is the incident power, and the set P contains the propagating reflected orders. The zero-order reflectance R0 quantifies axial reflection and defines the optimization objective. The initial thicknesses were H1 = 410 nm and H2 = 120 nm.
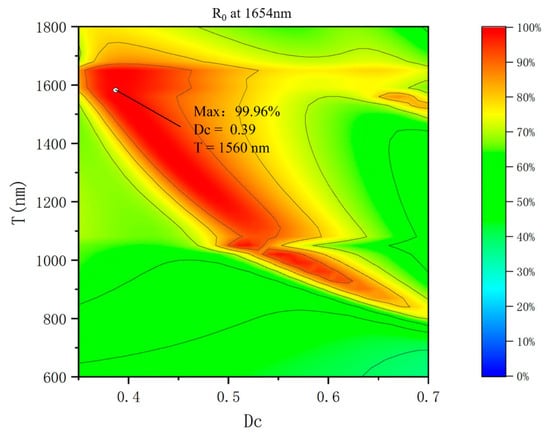
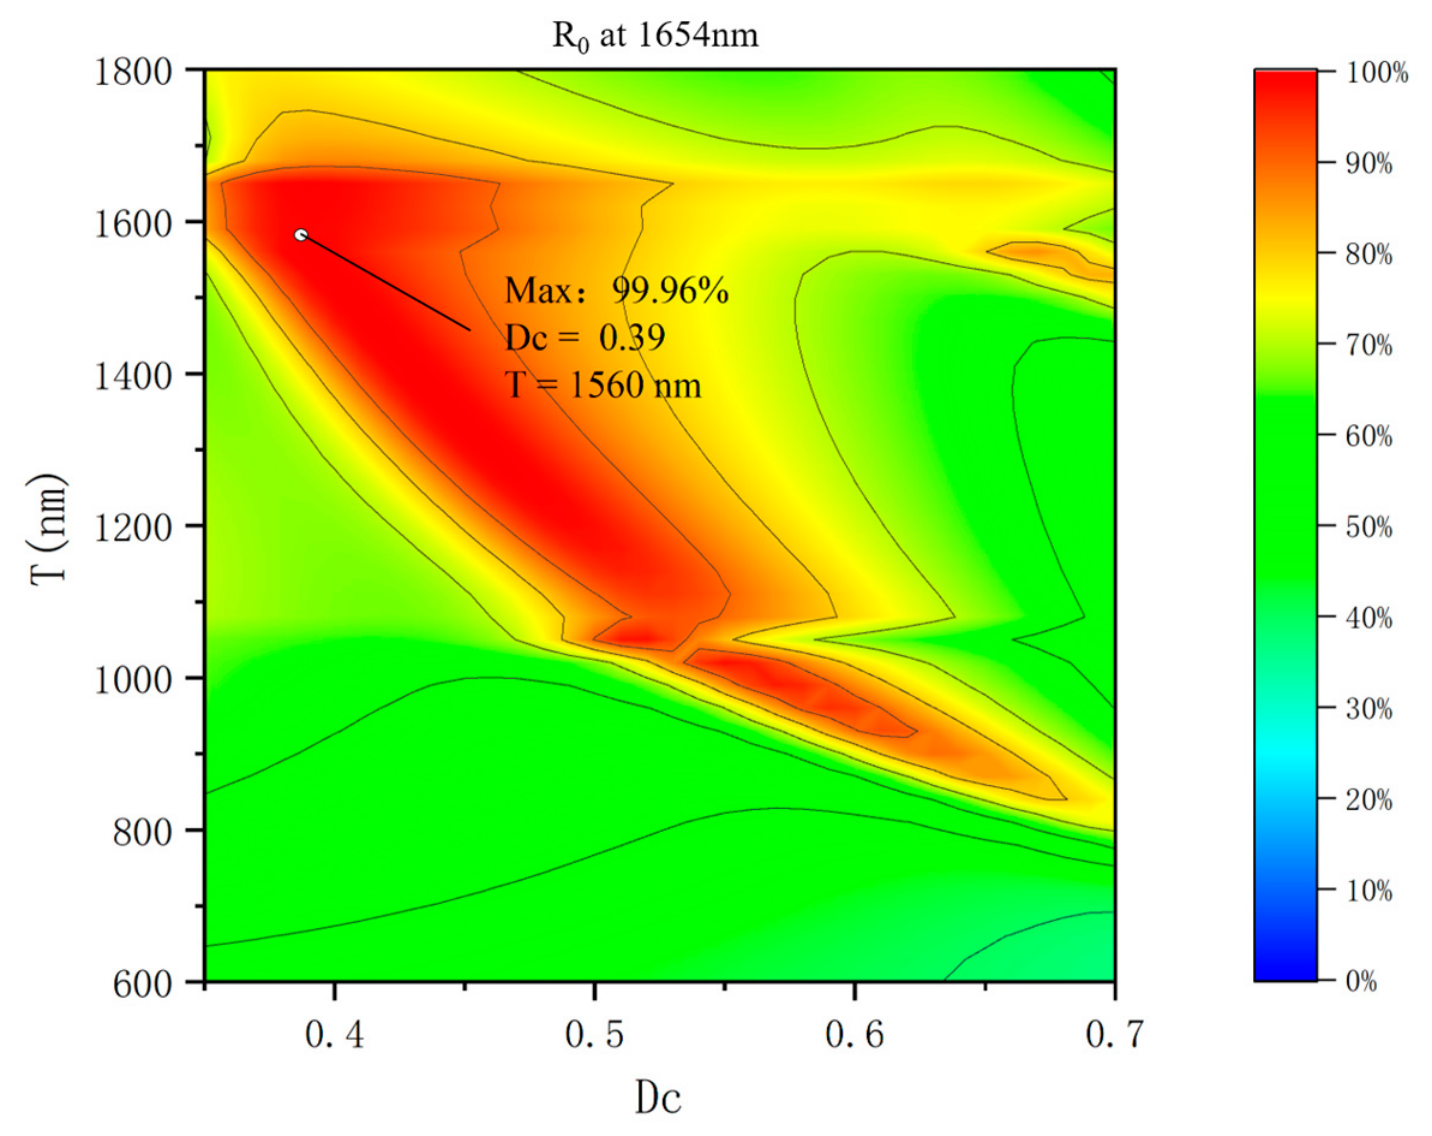
At fixed H1 and H2, Figure 6 maps the total reflectance as a function of duty cycle Dc and grating period T. The curved high-reflectance band indicates coupled effects of period and duty cycle on modal excitation and phase accumulation. The maximum total reflectance is 99.96% at Dc = 0.39 and T = 1560 nm.
Figure 6.
Initial two-dimensional map of total reflectance as a function of duty cycle and grating period.
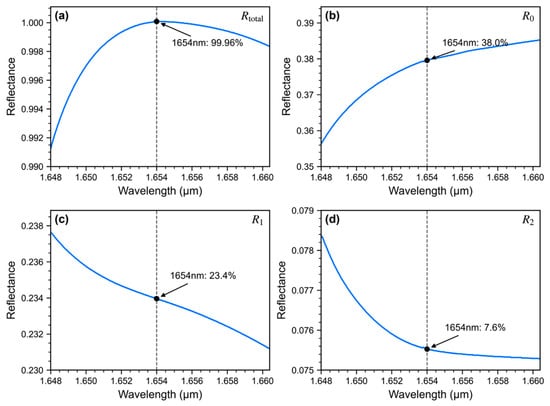
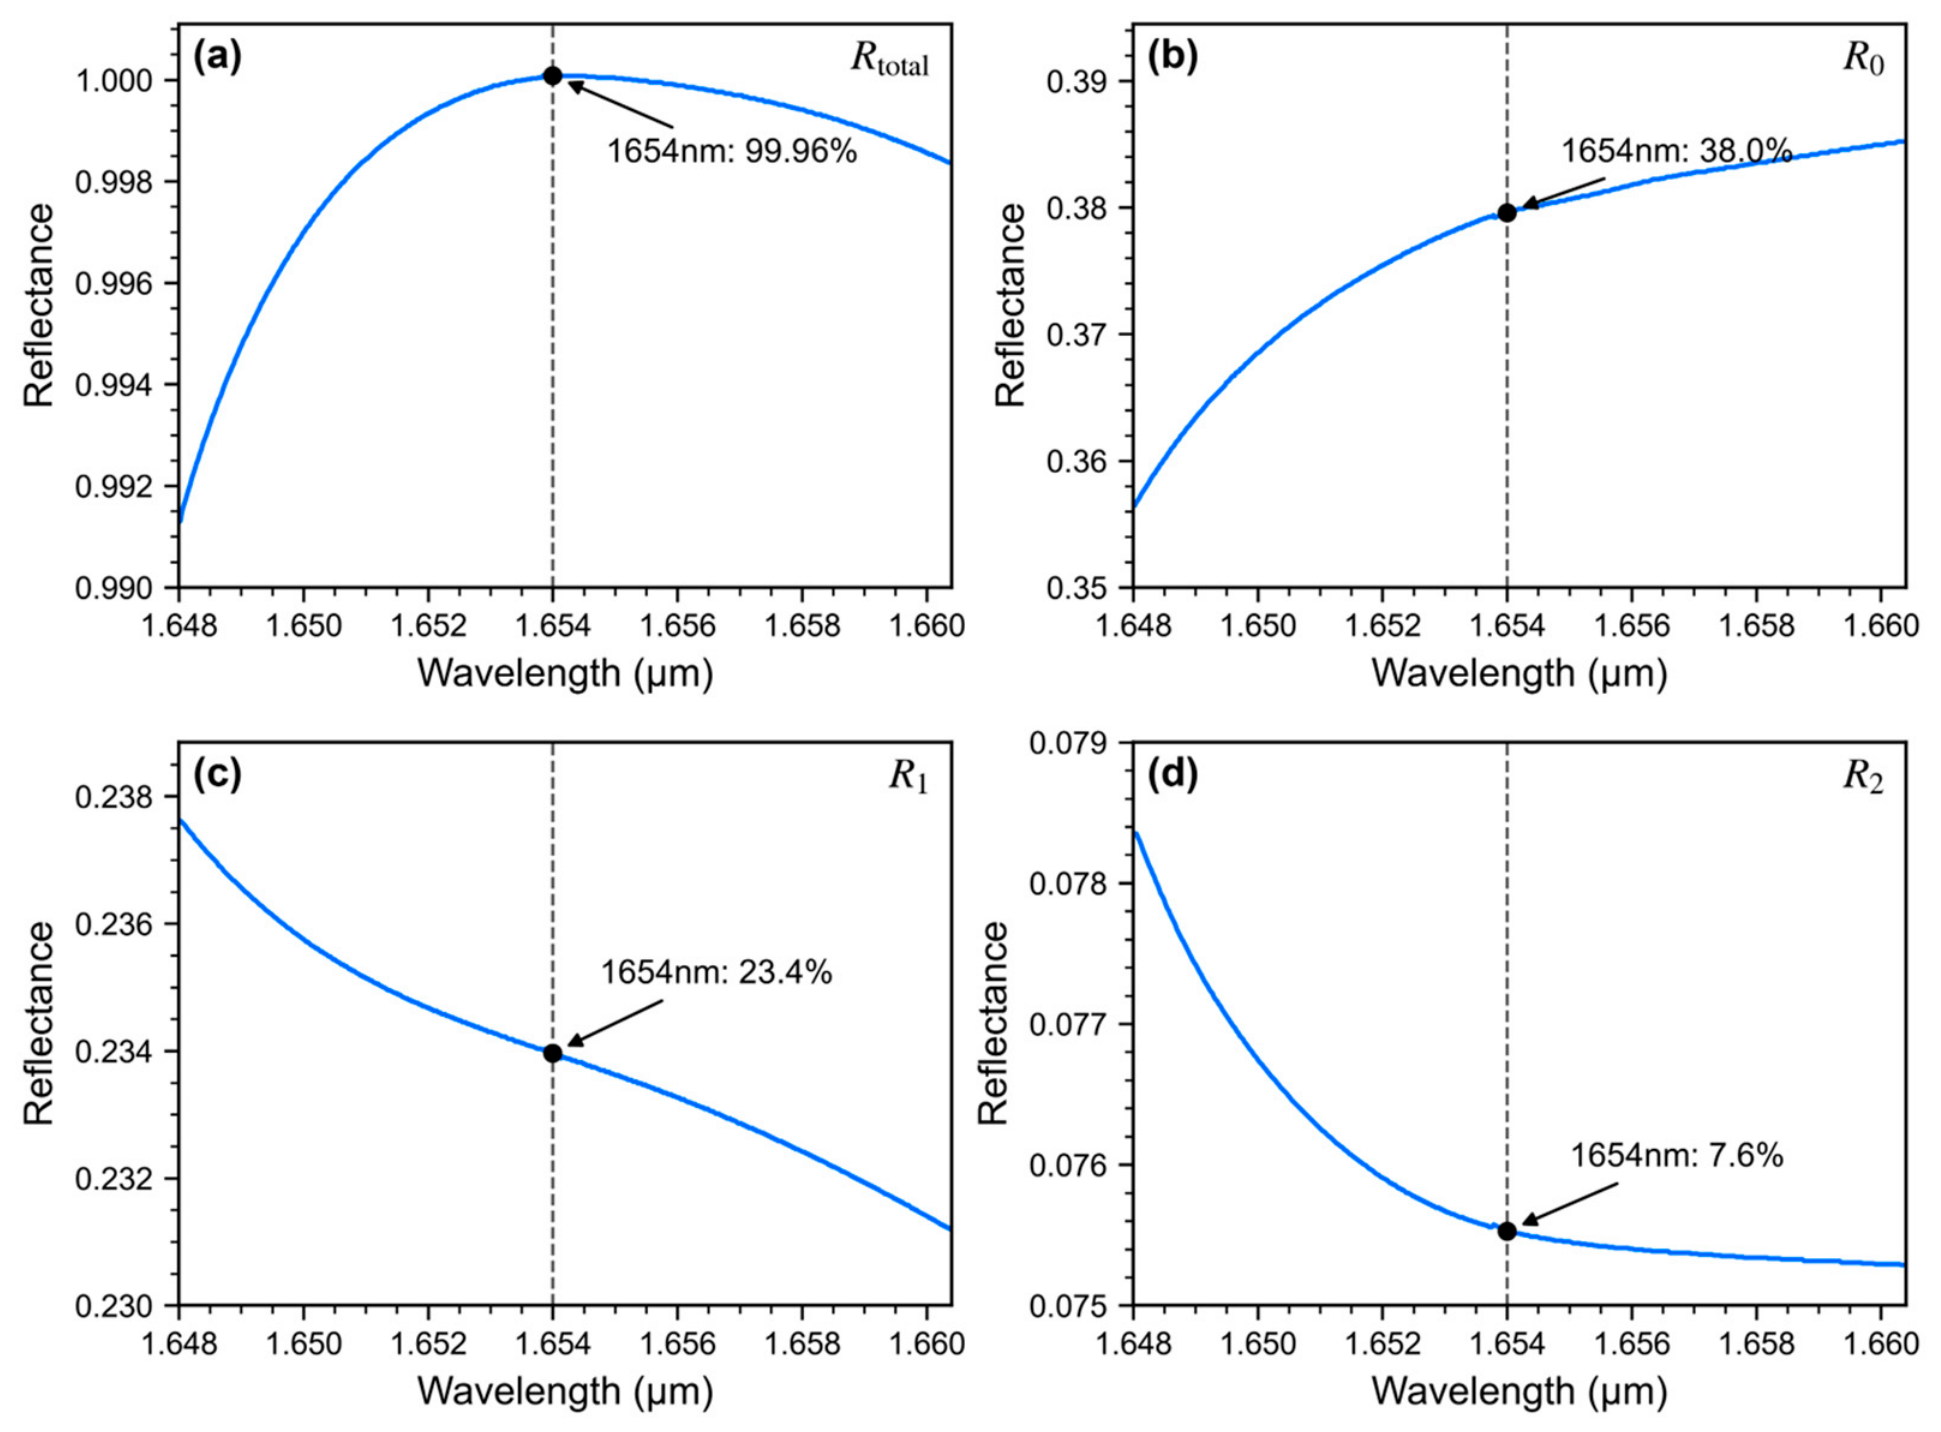
For T = 1560 nm, an InP refractive index of 3.15, and a wavelength of 1654 nm, the reflected orders m = 0, ±1, and ±2 can propagate. These orders distribute reflected power between axial and oblique channels. Figure 7 shows the total and zero-order reflectance spectra together with the positive and negative first- and second-order spectra.
Figure 7.
Reflectance spectra of the MHCG: (a) total reflectance, (b) zero-order reflectance, (c) first-order reflectance, and (d) second-order reflectance. In (c,d), the positive and negative diffraction orders have equal reflectance, and their curves overlap. The plotted values represent the reflectance of each individual order.
At 1654 nm, the zero-order reflectance is approximately 38% (Figure 7b). Each positive or negative first order contributes approximately 23.4%, and each second order contributes approximately 7.6%. The higher orders thus carry approximately 62% of the incident power into oblique reflected channels.
Zero-order reflectance R0 therefore defines the optimization metric for axial cavity feedback under normal incidence. Total reflectance Rtotal is used with total transmittance to check energy balance in the lossless model.
2.2.2. Optimization of Key Structural Parameters
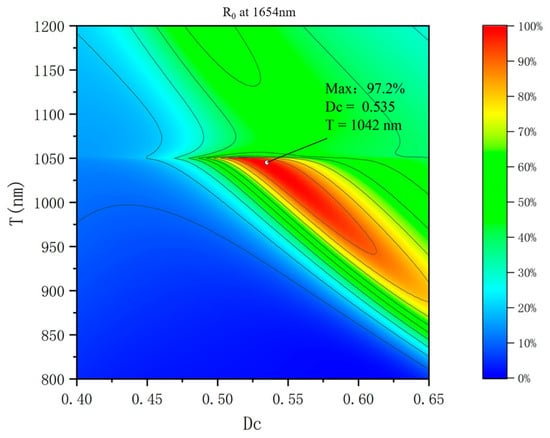
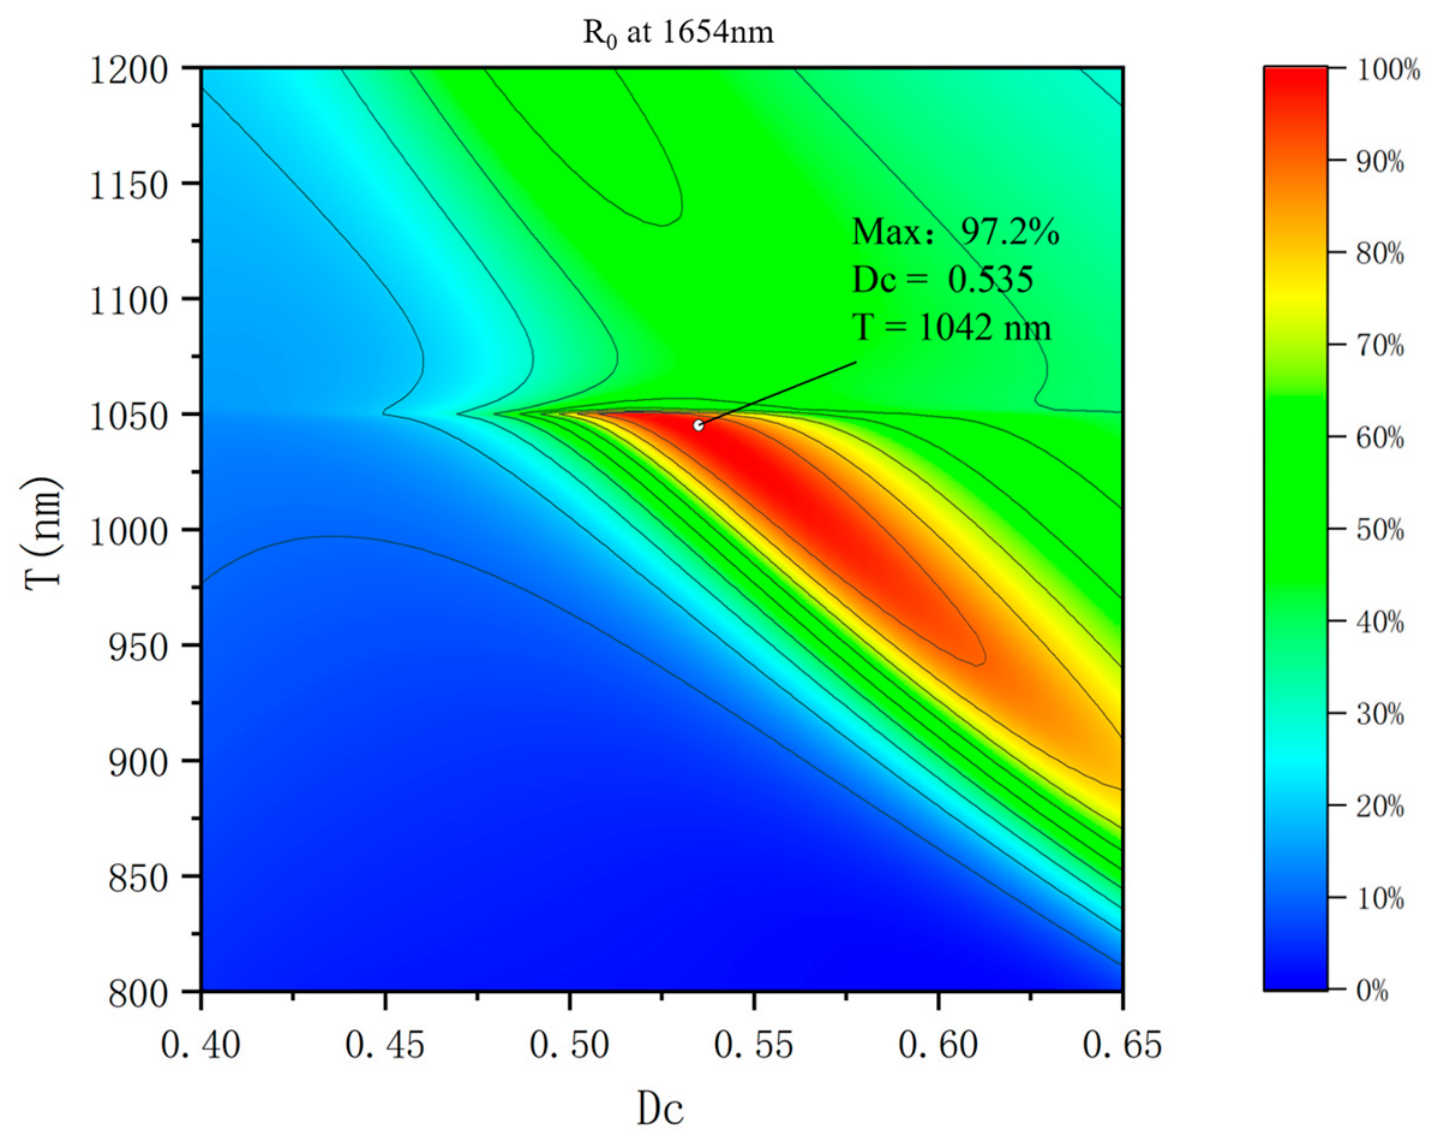
At H1 = 410 nm and H2 = 120 nm, Figure 8 maps R0 as a function of T and Dc at 1654 nm. The high-reflectance band reflects the coupled influence of period and duty cycle on mode excitation and phase. The initial sweep yielded a maximum R0 of 97.2% at T = 1042 nm and Dc = 0.535. These lateral dimensions were retained for the subsequent thickness optimization.
Figure 8.
Two-dimensional map of the zero-order reflectance R0(Dc, T) at 1654 nm.
For T = 1042 nm and Dc = 0.535, Figure 9 maps the dependence of R0 on H1 and H2. The thickness optimization yielded H1 = 700 nm and H2 = 245 nm, giving R0 = 99.29% at 1654 nm. These dimensions control grating-mode phase accumulation and interface coupling.
Figure 9.
Two-dimensional map of the zero-order reflectance R0(H1, H2) at 1654 nm.
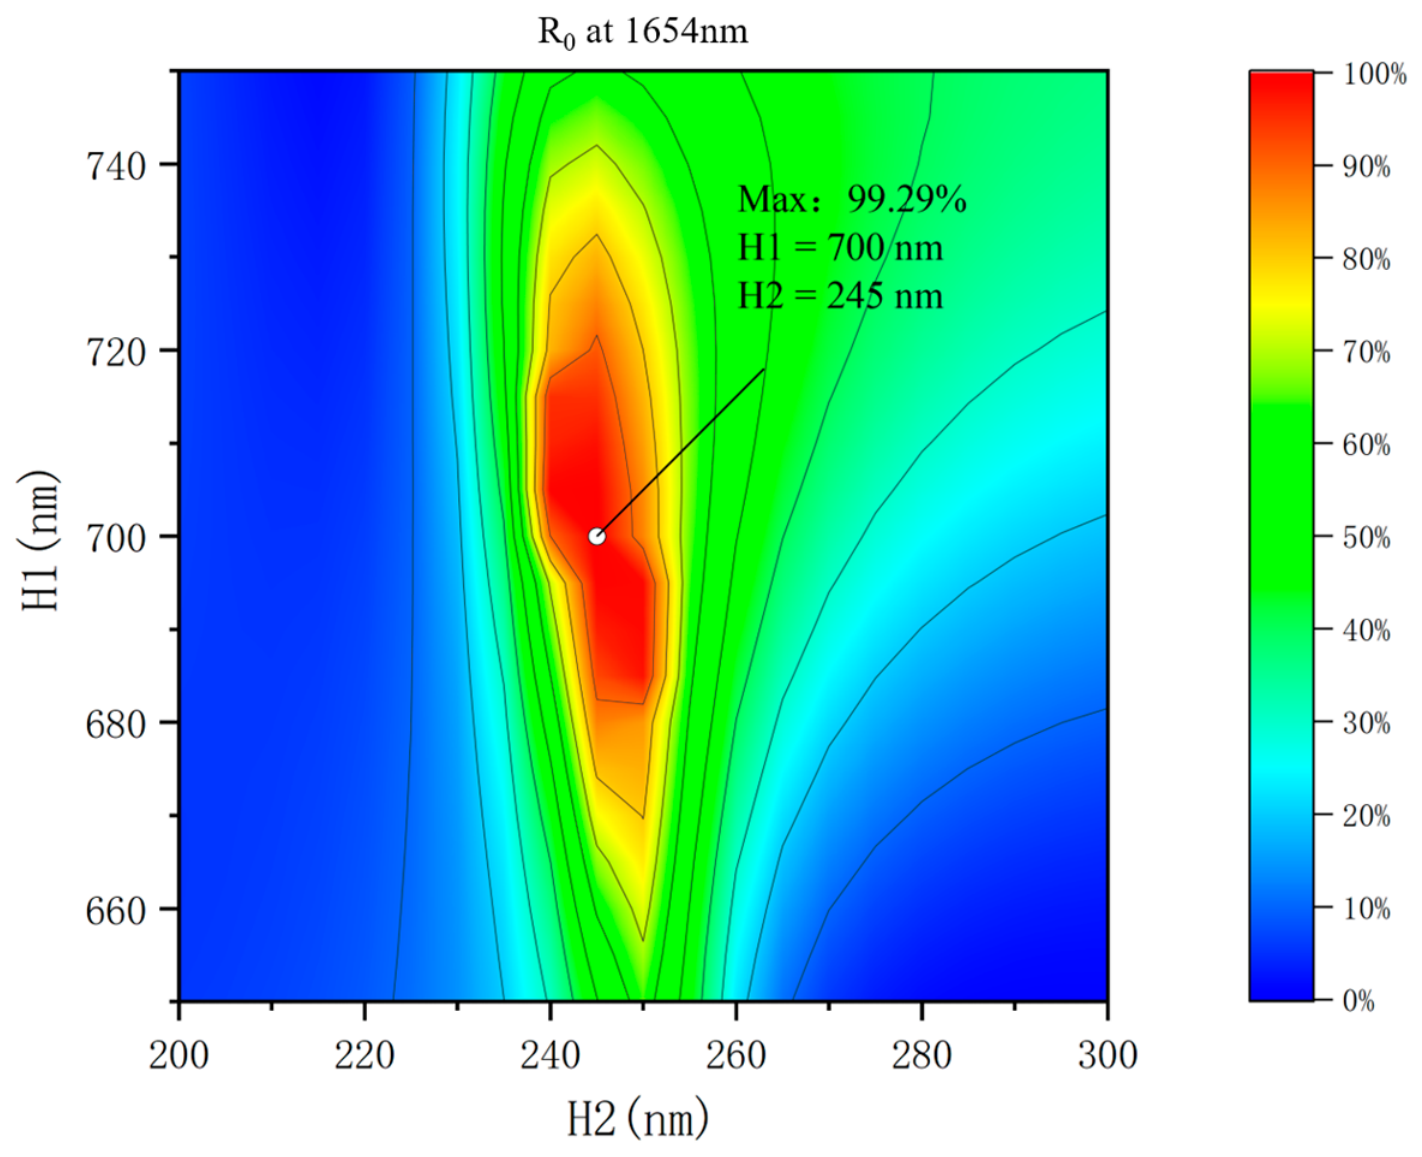
The total MHCG thickness HMHCG = H1 + H2 is defined by metal–organic chemical vapor deposition (MOCVD) epitaxial growth. For a fixed total thickness, the fabrication window is evaluated in terms of bar width a and etch depth H1, which are controlled by lithography and etching.Figure 10 identifies the joint bar-width/etch-depth window for zero-order reflectance above 99%. The reported parameter ranges are a = 550–560 nm and H1 = 687–703 nm, with acceptable combinations defined by the high-reflectance region.
Figure 10.
Two-dimensional map of the zero-order reflectance R0(a,H1) at 1654 nm.
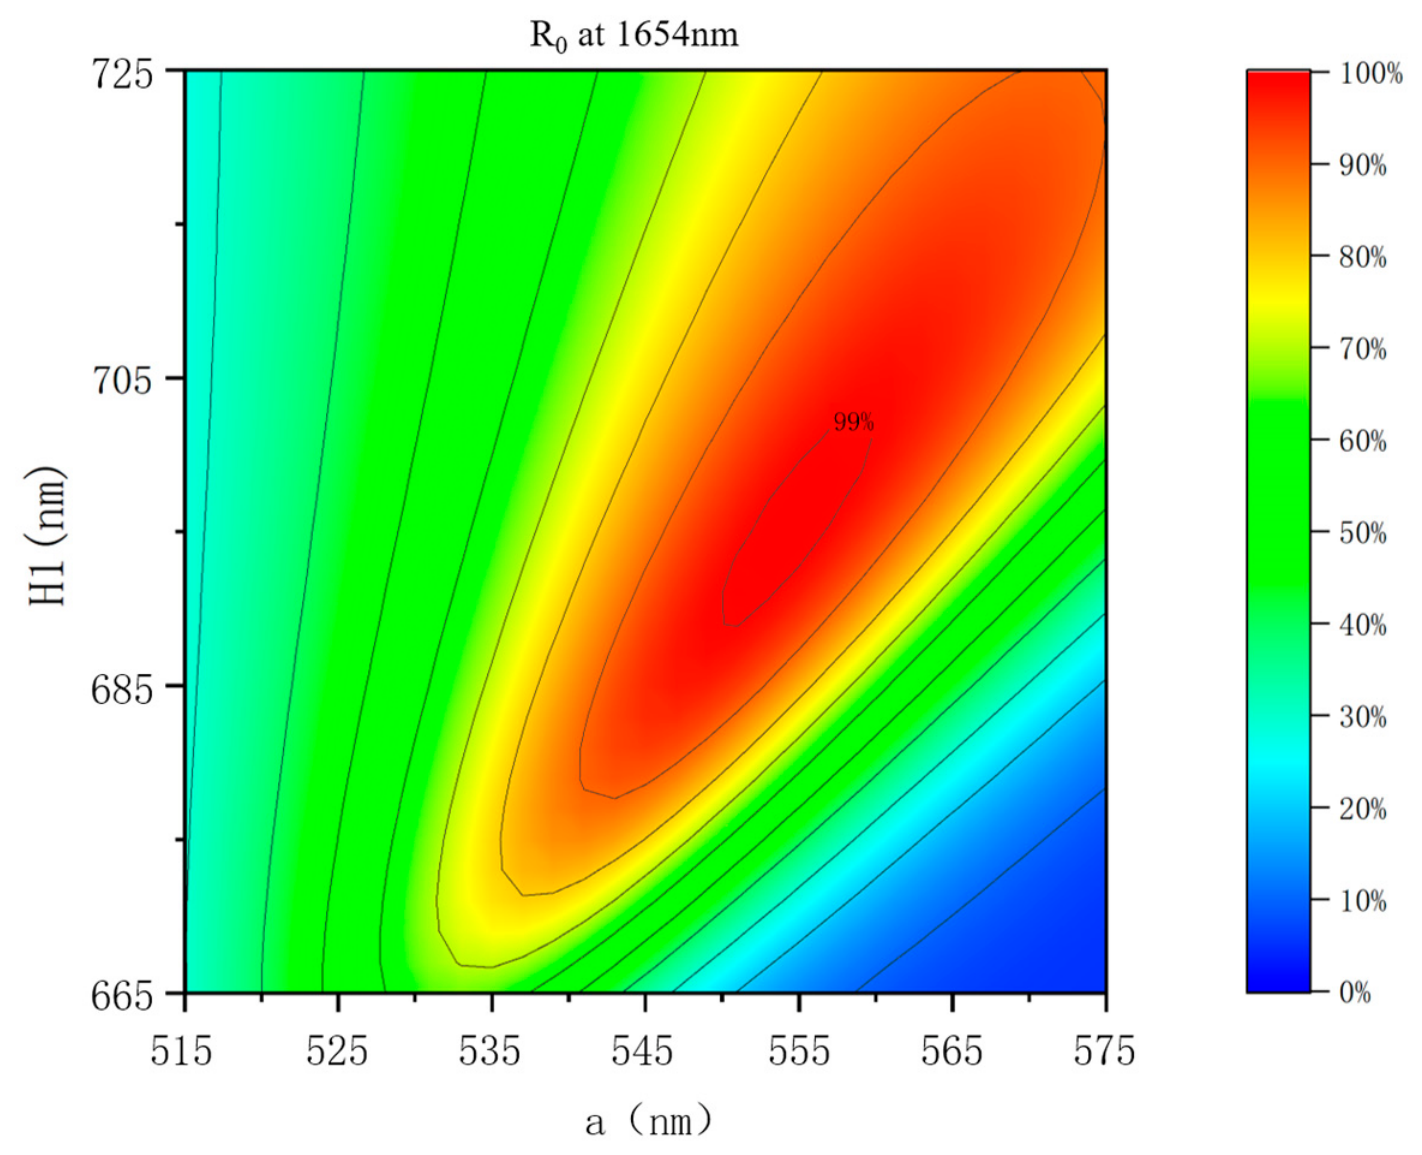
Figure 11 shows the optimized mirror spectra for H1 = 700 nm, H2 = 245 nm, T = 1042 nm, and Dc = 0.535. The zero-order reflectance reaches 99.29% at 1654 nm, while total reflectance approaches unity and total transmittance remains low. These spectra characterize the isolated reflector; they do not represent the laser emission spectrum.
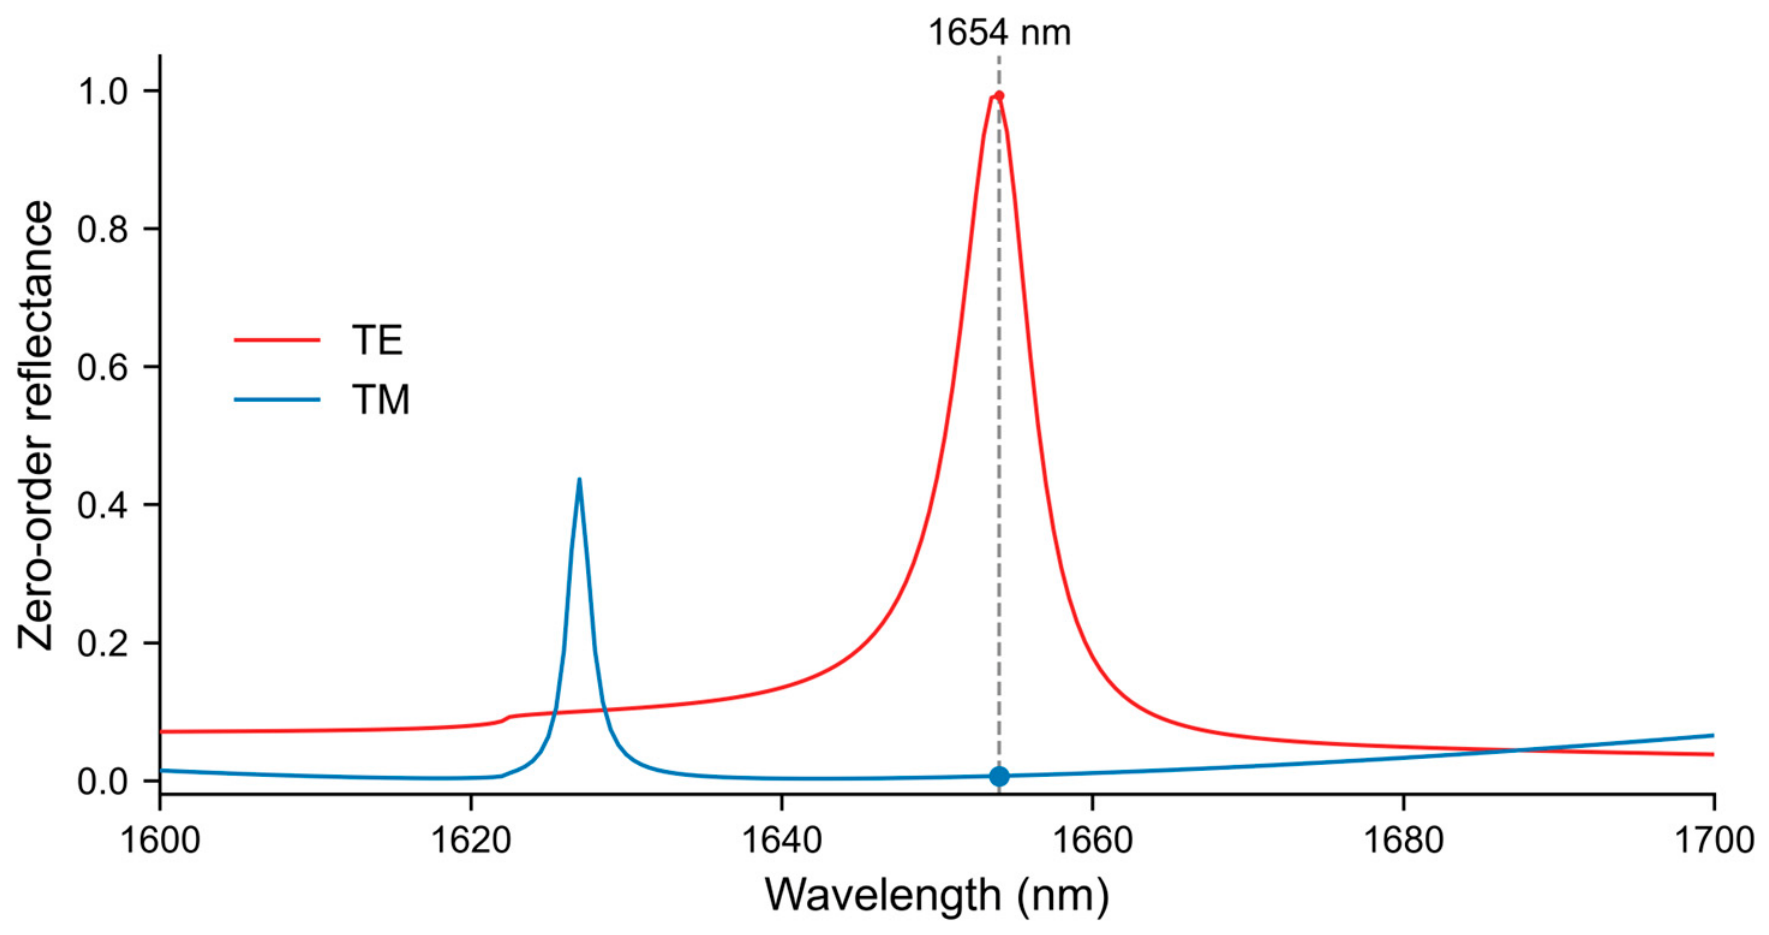
Figure 12 compares the TE and TM zero-order reflectance spectra of the optimized mirror under identical geometry and material definitions. Both spectra were calculated under normal incidence from the InP side. The refined double-precision calculation gives a zero-order reflectance of 99.29% for TE and 0.66% for TM at 1654 nm. This mirror-level polarization selectivity supports the use of TE polarization in the subsequent complete-cavity field calculation.
Figure 11.
Zero-order reflectance, total reflectance, and total transmittance spectra of the optimized MHCG under normal TE-polarized incidence from the InP side.
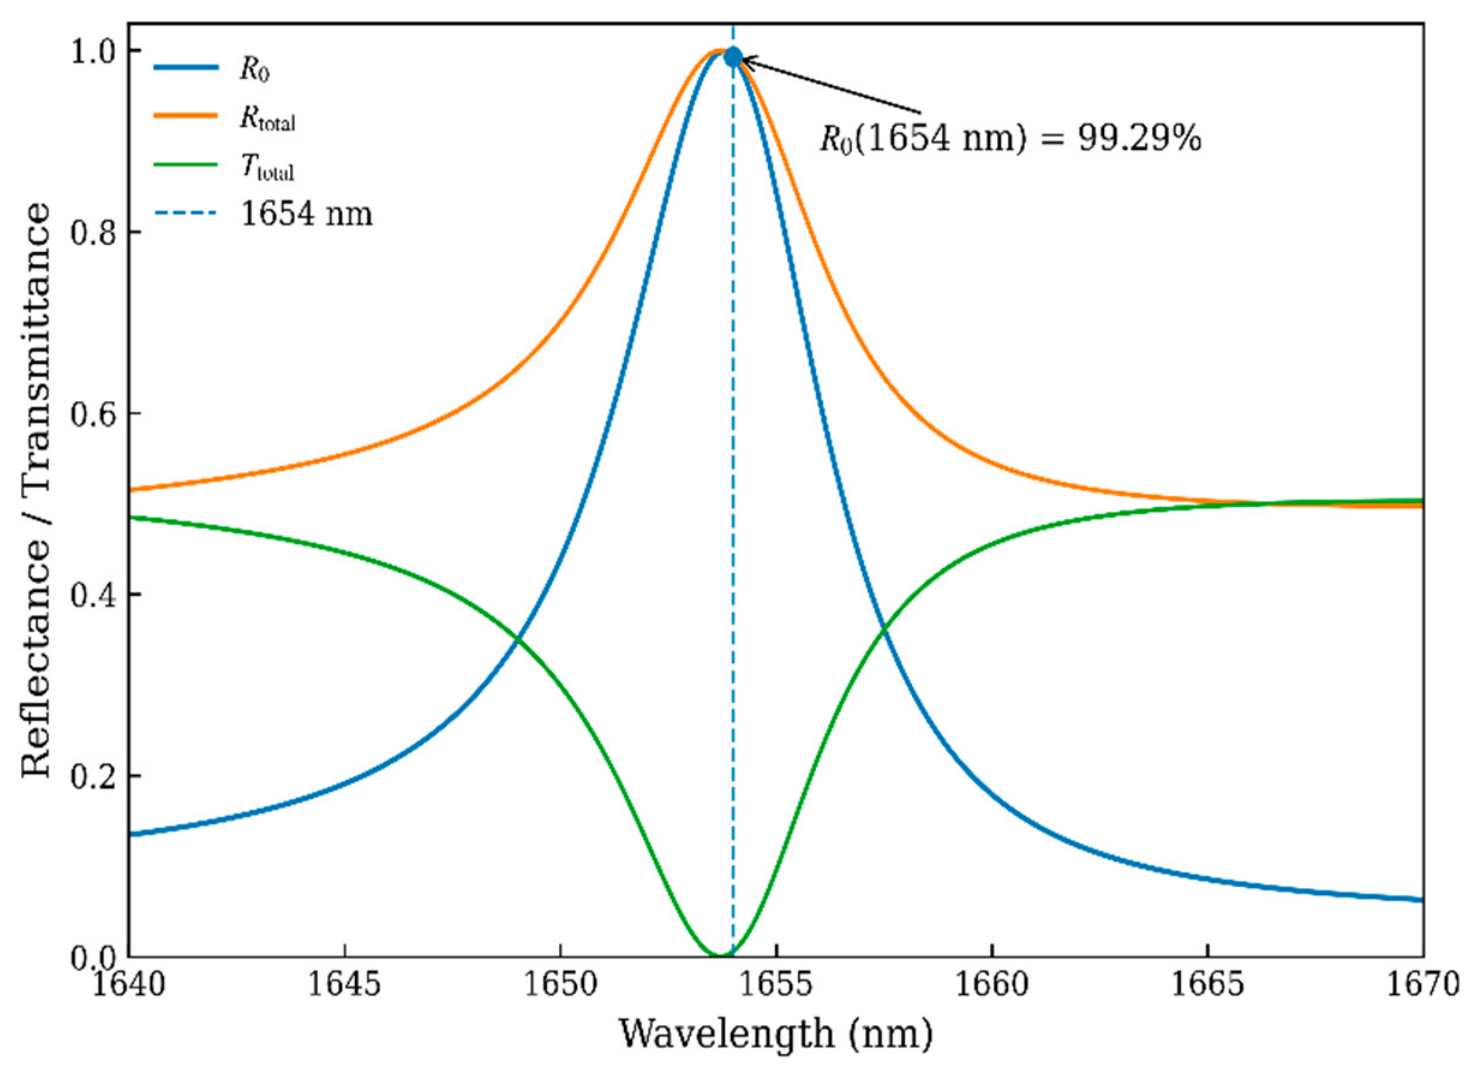
Figure 12.
TE and TM zero-order reflectance spectra from the refined double-precision calculation.
The optimized TE reflector was integrated with the bottom DBR in the complete-cavity model.
2.3. Optical and Electrothermal Models
The complete two-dimensional cavity was evaluated at 1654 nm using the frequency-domain electromagnetic equation
Here, E is the optical electric-field vector, μr and εr are relative permeability and permittivity, and k0 is the vacuum wavenumber at wavelength λ. The TE field intensity was normalized as
Three-dimensional steady-state electrothermal models were used to compare the 1654 nm MHCG-VCSEL and conventional DBR-VCSEL architectures. Both models included an InP substrate, a 53-pair bottom DBR, the active region and confinement layers, InP spacers, a BTJ, a ring-shaped top electrode, and a copper heat sink. The top reflector consisted of either a single-layer MHCG or a 51-pair In0.52Ga0.45Al0.03As/In0.52Al0.48As DBR.
Steady-state electrical solutions were obtained at injection currents of 1, 3, 5, 7, and 10 mA. The resulting Joule heat sources were applied in the thermal calculations. The electrical governing equations and Joule heating expressions are
∇ · J = 0, Eel = −∇V, J = ΣEel.
Here, V is the electric potential, J is the current density, Eel is the electric field, and Σ is the electrical conductivity tensor. QJ is the volumetric Joule heat-generation rate, and PJ is the Joule power integrated over the selected domain Ω. The volume element is denoted by dV. The steady-state temperature distribution satisfies
−∇⋅(K∇T) = Qtotal.
Here, T is the temperature (K), K is the thermal conductivity tensor, and Qtotal is the total volumetric heat source. The bottom boundary of the copper heat sink was fixed at Tsink = 298.15 K; all other external boundaries were thermally insulated. Electrical and thermal conductivities were held constant, and solid interfaces were treated as ideal thermal contacts. Heat transfer through the empty grating slots was neglected.
A separate thermal calculation applied a uniform active-core heat source with a total power of PC = 10 mW, with all other sources disabled. The cylindrical source region had a radius of 3 μm and a thickness of 96 nm. The source density and active-to-sink thermal resistance were defined as
Here, QC is the uniform volumetric heat source, while ΩC and VC denote the source region and its volume. The quantity ⟨T⟩C is the volume-averaged source-region temperature, and Ract is the active-to-sink thermal resistance.
For this uniform active-core heat source and the stated boundary conditions, regional contributions to Ract were defined by
The non-overlapping solid regions Ωj partition the device. Their contributions Rj sum to Ract and partition thermal dissipation within the common three-dimensional temperature field.
3. Results
3.1. Optical Field
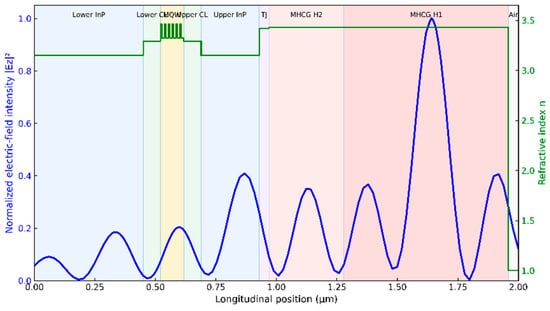
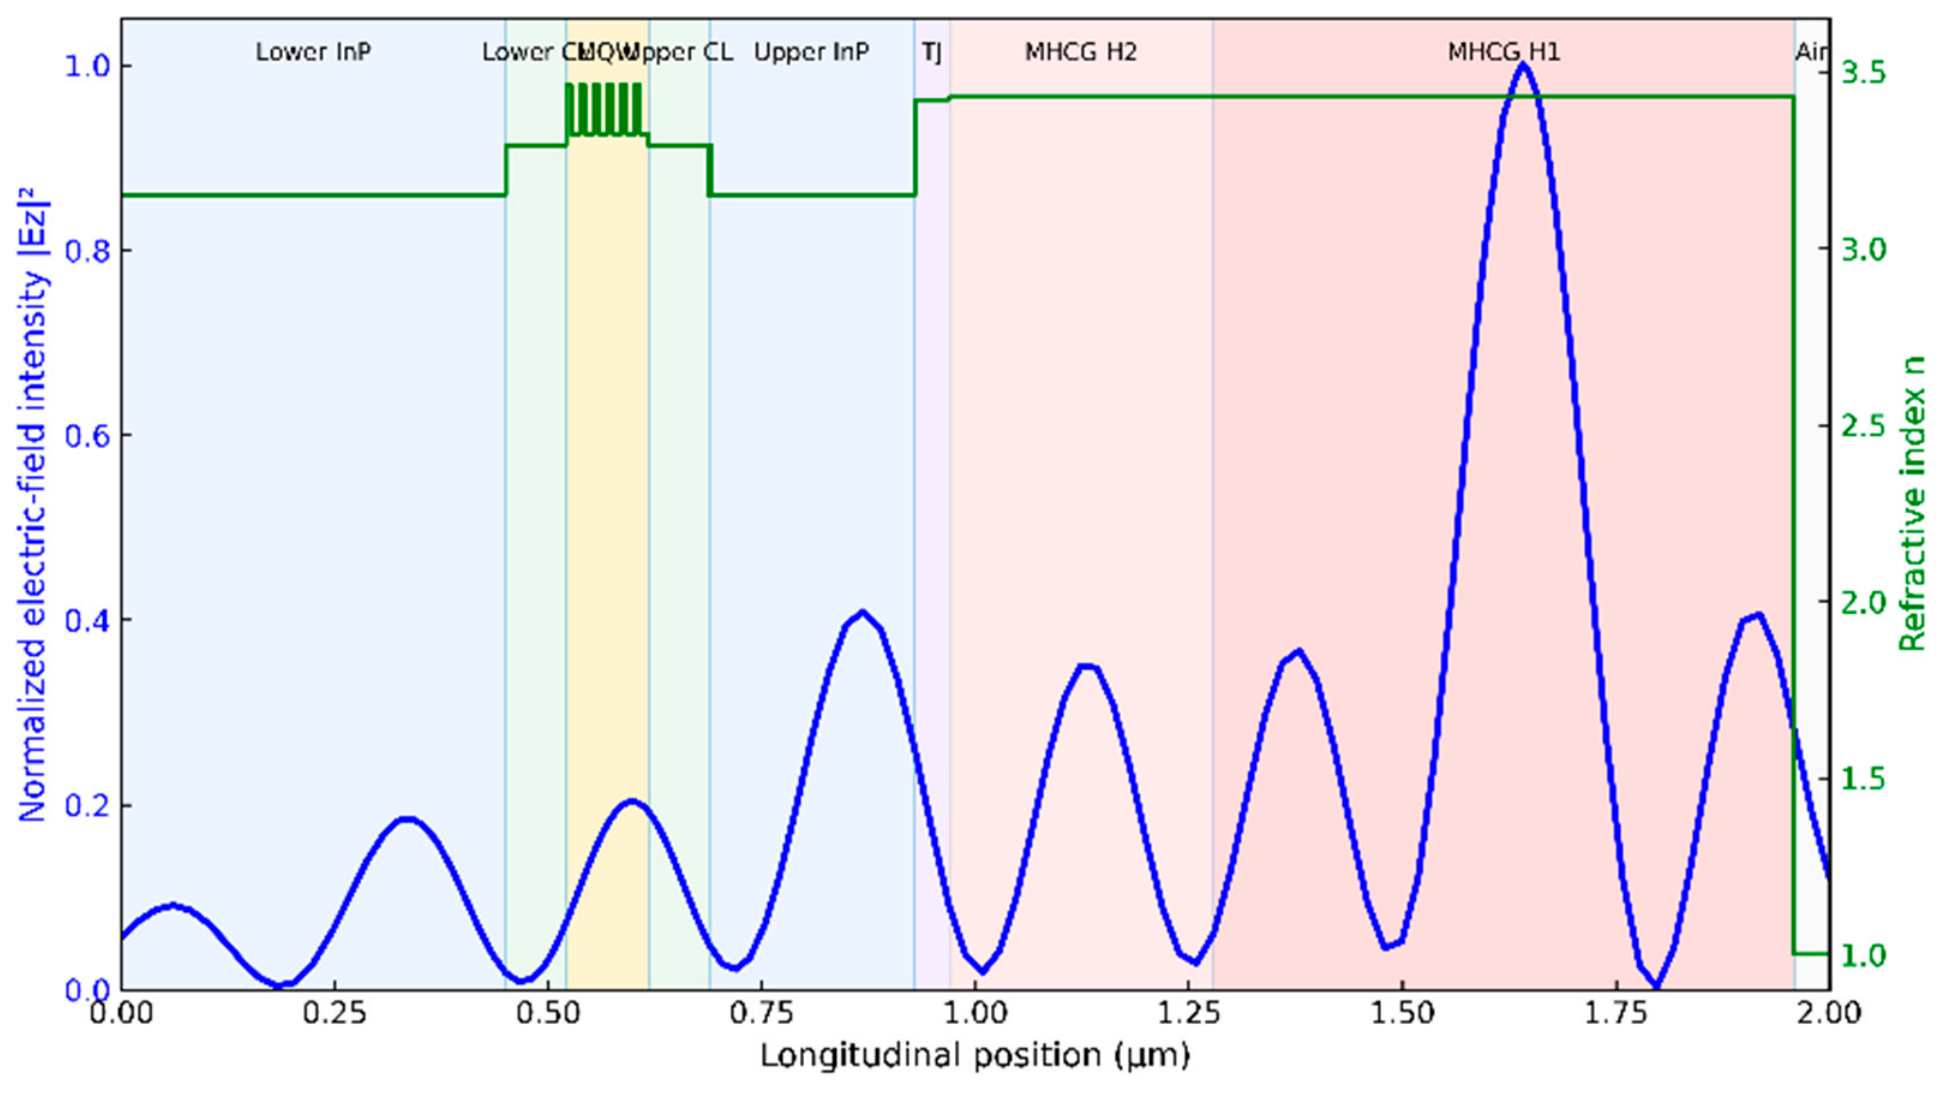
Figure 13 shows the normalized longitudinal optical-field intensity in the complete MHCG-VCSEL at 1654 nm. Adjacent peaks are separated by approximately half the wavelength inside the high-index semiconductor, consistent with a longitudinal standing wave. The quantum wells overlap local field maxima along the epitaxial direction.
Figure 13.
Longitudinal optical-field distribution in the optimized MHCG-VCSEL. The blue curve shows the normalized electric-field intensity |Ez|2, and the green curve shows the refractive index. Shading identifies the principal epitaxial regions and the MHCG region.
The strongest localized field enhancement occurs in the MHCG region, consistent with resonant coupling in the grating. The calculated field distribution connects the optimized reflector with the standing wave in the active cavity.
3.2. Thermal Characteristics
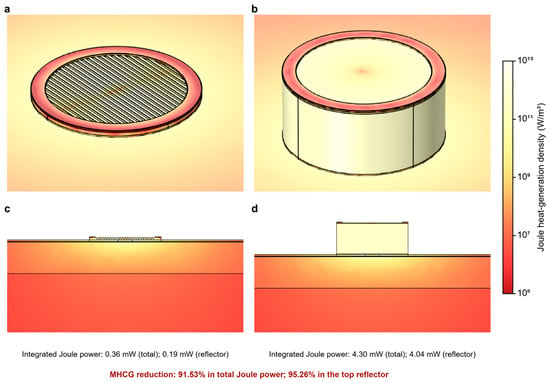
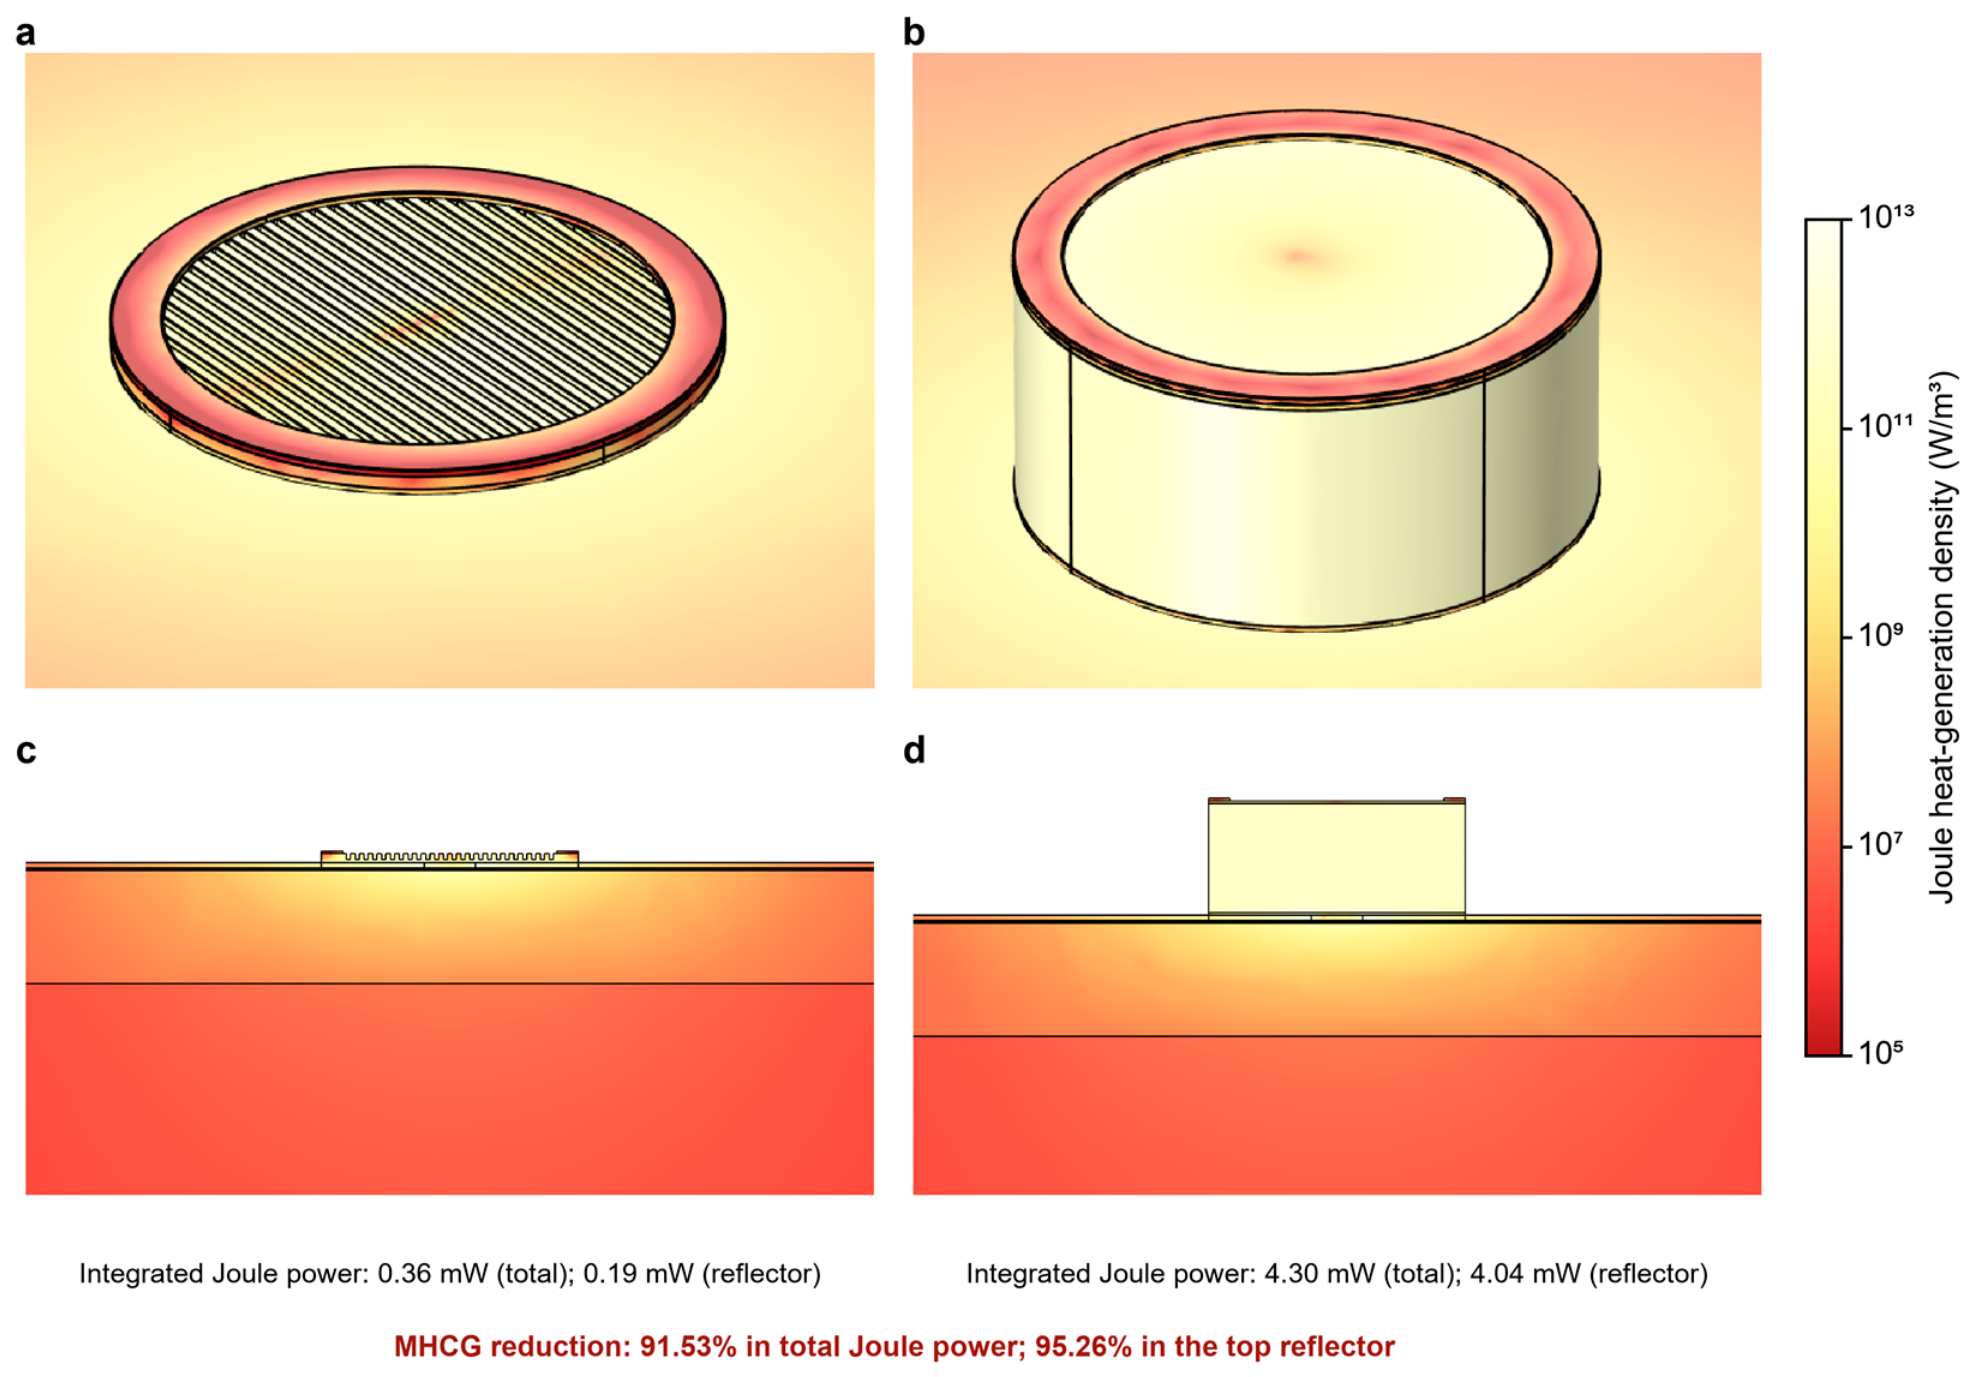
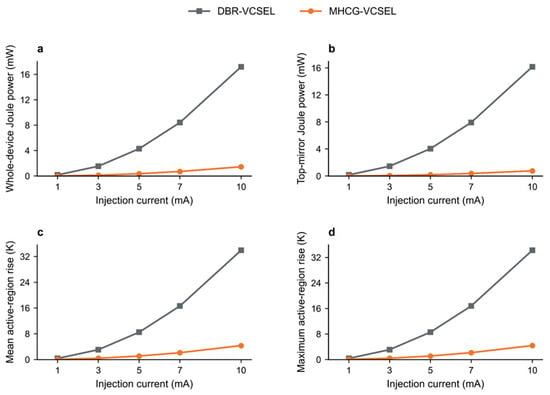
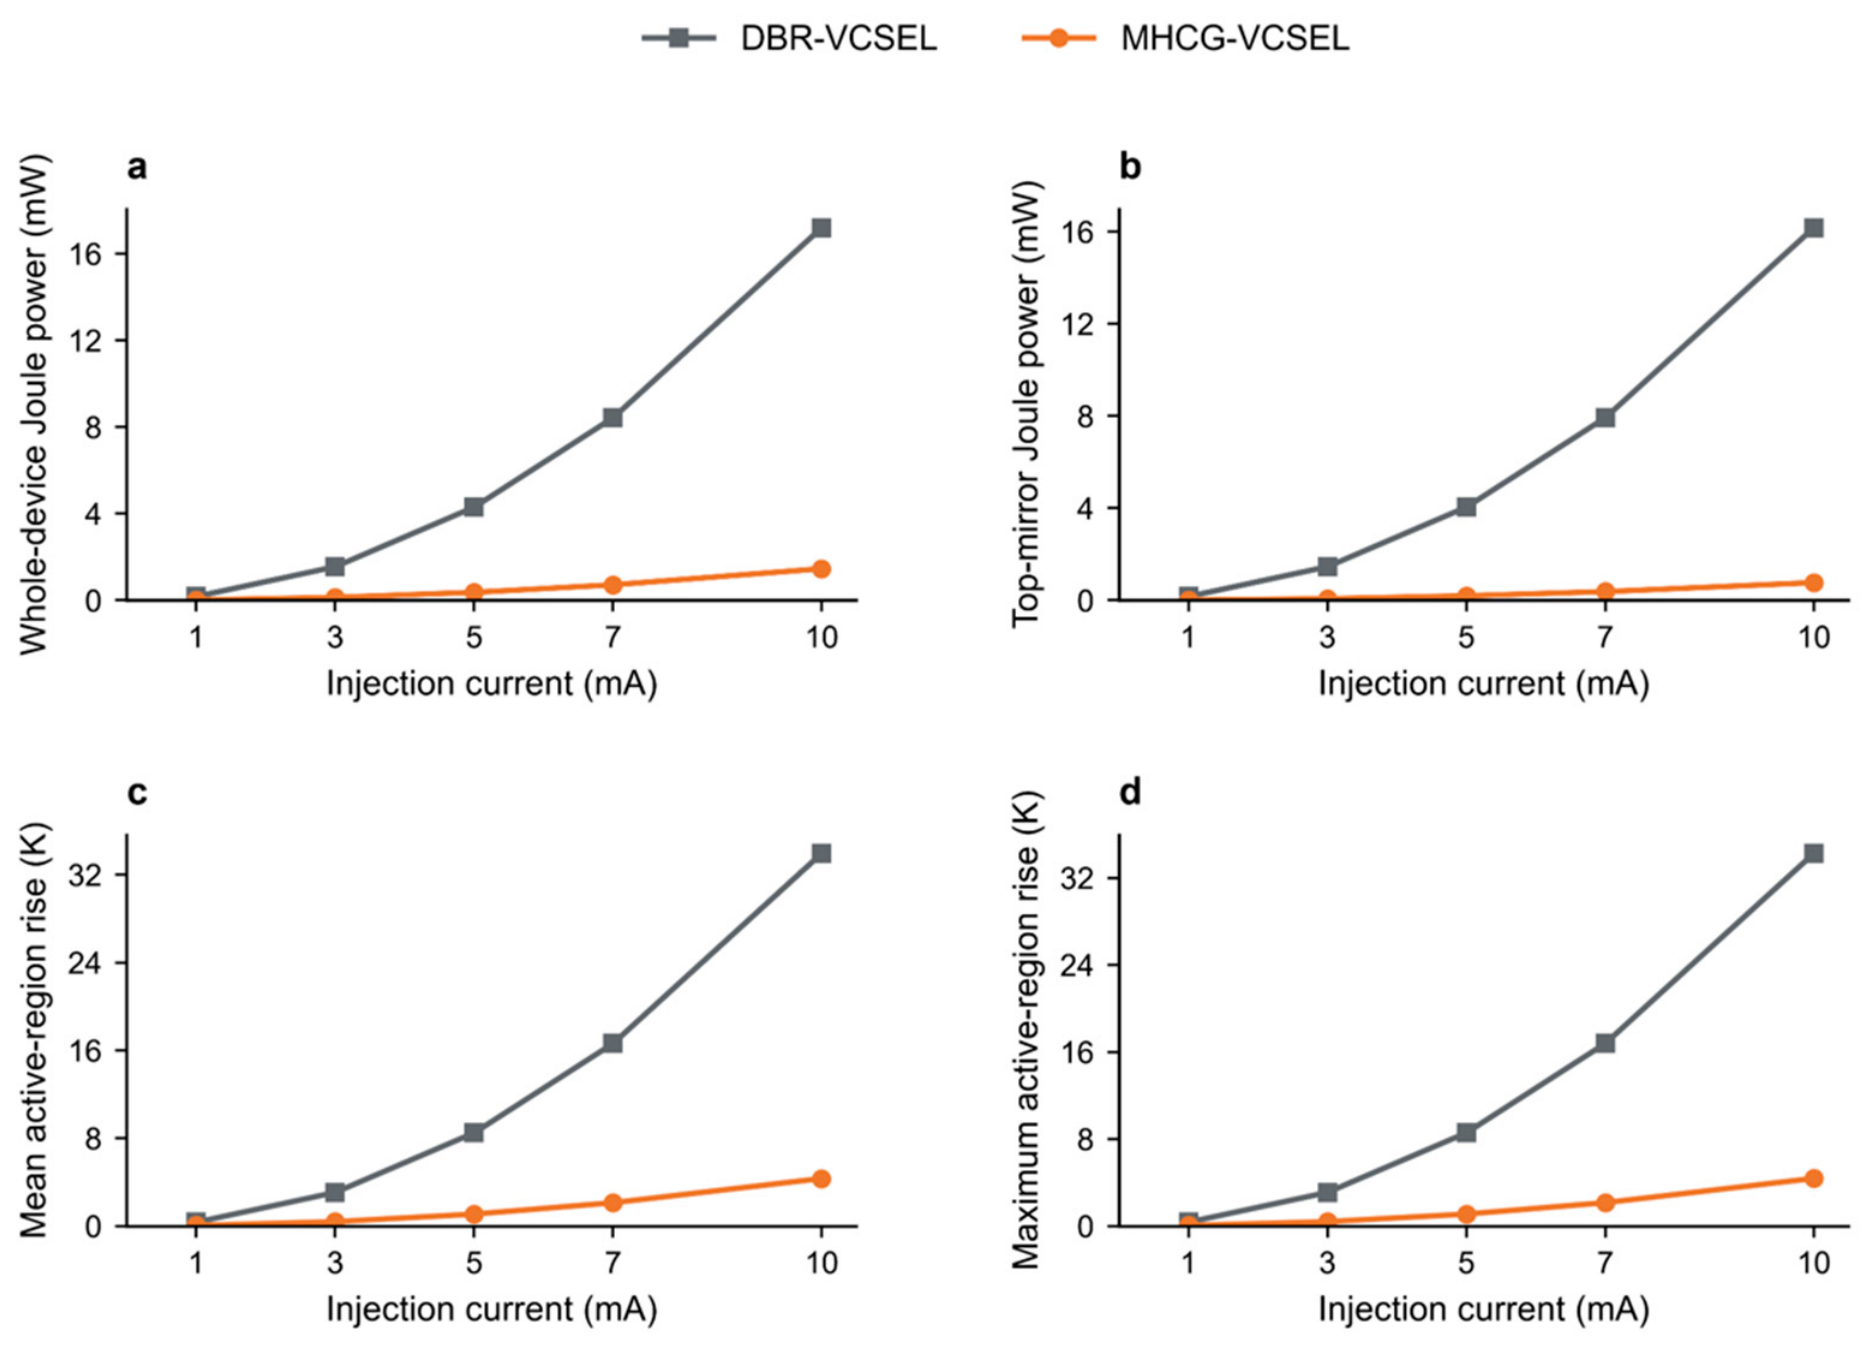
Figure 14 and Figure 15 compare the Joule-only responses of the DBR-VCSEL and MHCG-VCSEL under the common electrical and thermal model definitions. At 5 mA, replacing the top DBR with the MHCG reduced whole-device Joule power by 91.53% and reflector-only Joule power by 95.26%. At 10 mA, the corresponding mean active-core temperature rises were 33.93 K and 4.32 K for the DBR and MHCG devices.
Figure 14.
Joule heat-generation density at 5 mA for (a,c) the MHCG-VCSEL and (b,d) the conventional DBR-VCSEL. (a,b) show three-dimensional views, and (c,d) show longitudinal sections. Both devices share a logarithmic color scale in W/m3; values below 105 W/m3 are clipped for display only. Annotations give whole-device and reflector-only integrated Joule powers in mW. Reflector-only integrals exclude neighboring contact and cap layers.
Figure 15.
Current-dependent Joule-only response of the DBR-VCSEL and MHCG-VCSEL. (a) whole-device Joule power, (b) reflector-only Joule power, (c) mean active-core temperature rise, and (d) maximum active-core temperature rise. Electrical and thermal conductivities are constant; non-Joule heat sources are excluded.
A separate uniform 10 mW active-core heat source was used to compare heat extraction independently of Joule heating. Under this matched load, the MHCG device had a 23.94% higher active-to-sink thermal resistance than the DBR reference. Table 1 reports the total resistance and its regional thermal-dissipation contributions.
Table 1.
Active-to-sink thermal resistance and regional contributions under a sole uniform 10 mW active-core heat source. Values are in K/mW.
The MHCG device had larger contributions from the InP cavity and bottom DBR, together with a smaller top-reflector contribution. A thermal-only control with semiconductor-filled slots gave Ract = 5.69 K/mW. Relative to this control, slot etching increased Ract by 1.69%.
With an additional prescribed 10 mW distributed heat load, the mean active-core temperatures at 5 mA were 347.82 K for MHCG and 344.03 K for DBR. This temperature ordering differed from the Joule-only comparison.
4. Discussion
The single-layer MHCG combines high axial reflectance with a thin top-reflector structure in the 1654 nm InP-based cavity. Its TE response and the standing-wave overlap with the quantum wells support the optical design. Replacing the thick top DBR also reduces resistive heat generation. These results establish axial feedback and reduced Joule heating as the principal benefits of the proposed reflector architecture.
The distinction between total and zero-order reflectance defines the optical design criterion. Total reflectance includes power returned through oblique diffraction orders, whereas R0 quantifies the axial reflected component under normal incidence. The TE–TM contrast identifies TE as the appropriate design polarization for the cavity-field calculation. The comparison establishes mirror-level selectivity; predicting single-polarization lasing requires a polarization-resolved analysis of the active cavity.
The thermal comparisons separate heat generation from heat extraction. The Joule-only calculations show the benefit of reduced resistive heating across the tested injection currents. The matched active-core load reveals the thermal resistance of each architecture independently of its Joule power. The regional decomposition locates the increased thermal-dissipation contributions mainly in the InP cavity and bottom DBR, rather than in the top reflector. The thermal-only slot-filling control further separates the contribution of etching from the broader redistribution of heat spreading. These findings identify thermal-path design as a complementary task to reflector optimization.
For a fixed total MHCG thickness, bar-width definition and etch-depth control determine the relevant fabrication window. The R0 > 99% contour identifies acceptable combinations of these parameters. Electron-beam lithography is planned for bar-width definition, while etch-depth control must satisfy the joint optical design window. This formulation links fabrication requirements directly to the axial-reflectance target.
The thermal comparison uses effective temperature-independent conductivities, ideal solid–solid contacts, and a fixed-temperature copper heat-sink boundary. The reported absolute temperatures apply to these material, interface, and boundary conditions. In fabricated devices, temperature-dependent conductivities and finite thermal boundary resistances determine the corresponding device-level temperature rise. Incorporating measured layer and interface properties would extend the comparison to a specific epitaxial process and package. The present results distinguish the reflector’s resistive-heating benefit from the heat-extraction requirements of the modeled architecture.
5. Conclusions
We designed a 1654 nm InP-based VCSEL with a single-layer MHCG top output-coupling mirror. The design replaces the thick conventional top DBR while retaining optical-field overlap with the active region.
Total reflectance alone did not distinguish axial feedback from power reflected into higher diffraction orders. In the initial design, Rtotal approached 100%, but R0 was only approximately 38% at 1654 nm. Most reflected power entered the ±1 and ±2 orders. We therefore optimized R0 through joint sweeps of the period, duty cycle, and vertical dimensions. The optimized geometry was T = 1042 nm, Dc = 0.535, H1 = 700 nm, and H2 = 245 nm. It achieved approximately 99.29% zero-order reflectance at 1654 nm, supporting vertical-cavity feedback.
At 5 mA, replacing the top DBR reduces whole-device Joule power by 91.53%. The matched-load and regional thermal analyses distinguish this reduction in heat generation from the active-to-sink heat-extraction resistance. Together, the optical and electrothermal results support a thin, high-reflectance top mirror with reduced resistive heating and provide a basis for reflector and thermal-path co-design.
Author Contributions
Conceptualization, Y.S., S.F. and W.L.; methodology, Y.S.; software, Y.S.; validation, Y.S., S.F., H.Z. and Z.W.; formal analysis, W.L.; investigation, Y.S.; resources, W.L.; data curation, S.F.; writing—original draft preparation, Y.S.; writing—review and editing, W.L. and S.L.; visualization, Y.S.; supervision, M.T.; project administration, C.X.; funding acquisition, S.L. All authors have read and agreed to the published version of the manuscript.
Funding
This research was funded by the National Natural Science Foundation of China (NNSFC), grant number 62174154.
Data Availability Statement
The data supporting the findings of this study are available from the corresponding author upon reasonable request.
Conflicts of Interest
The authors declare no conflicts of interest.
Abbreviations
The following abbreviations are used in this manuscript:
| BTJ | Buried tunnel junction |
| DBR | Distributed Bragg reflector |
| EBL | Electron-beam lithography |
| HCG | High-contrast grating |
| MHCG | Monolithic high-contrast grating |
| MOCVD | Metal–organic chemical vapor deposition |
| MQW | Multiple quantum wells |
| PICS3D | Photonic Integrated Circuit Simulator in 3D |
| RCWA | Rigorous coupled-wave analysis |
| TDLAS | Tunable diode laser absorption spectroscopy |
| TE | Transverse electric |
| TM | Transverse magnetic |
| TMM | Transfer matrix method |
| VCSEL | Vertical-cavity surface-emitting laser |
Appendix A
The material parameters of multinary compounds can be obtained by interpolation from those of the constituent binary compounds. The parameters of the binary semiconductors formed from In, Ga, Al, and As are listed in Table A1.
Table A1.
Material parameters of binary semiconductor composed of In, Ga, Al and As.
For the alloy parameters treated by linear interpolation, the ternary and quaternary relations are
P(AxB1−xC) = xP(AC) + (1 − x)P(BC)
P(A1−x−yBxCyD) = (1 − x − y)P(AD) + xP(BD) + yP(CD)
Here, P denotes the interpolated material parameter, and x and y are composition fractions. AC and BC denote the ternary end members; AD, BD, and CD denote the quaternary end members. For the quaternary alloy, 0 ≤ x, y and x + y ≤ 1. The unstrained bandgap energies were evaluated using the following expressions:
Eg(In1−x−yAlxGayAs)
= 0.36 + 2.093x + 0.629y + 0.577x2 + 0.436y2 + 1.013xy − 2.0xy(1 − x − y)
Eg(In1−xGaxAs) = 0.36 + 0.505x + 0.555x2
Here, Eg is the Γ-point bandgap energy in electronvolts. In the quaternary expression, x and y are the Al and Ga fractions, respectively; in the ternary expression, x is the Ga fraction. In Table A1, m0 denotes the free-electron mass; the subscripts lh and hh denote light and heavy holes, respectively.
References
- Choquette, K.D.; Hou, H.Q. Vertical-cavity surface emitting lasers: Moving from research to manufacturing. Proc. IEEE 1997, 85, 1730–1739. [Google Scholar] [CrossRef]
- Larsson, A. Advances in VCSELs for communication and sensing. IEEE J. Sel. Top. Quantum Electron. 2011, 17, 1552–1567. [Google Scholar] [CrossRef] [Scilit]
- Pan, G.; Xun, M.; Zhou, X.; Sun, Y.; Dong, Y.; Wu, D. Harnessing the capabilities of VCSELs: Unlocking the potential for advanced integrated photonic devices and systems. Light Sci. Appl. 2024, 13, 229. [Google Scholar] [CrossRef] [Scilit] [PubMed]
- Hovde, D.C.; Parsons, C.A. Wavelength modulation detection of water vapor with a vertical cavity surface-emitting laser. Appl. Opt. 1997, 36, 1135–1138. [Google Scholar] [CrossRef] [Scilit] [PubMed]
- Totschnig, G.; Lackner, M.; Shau, R.; Ortsiefer, M.; Rosskopf, J.; Amann, M.-C.; Winter, F. 1.8 μm vertical-cavity surface-emitting laser absorption measurements of HCl, H2O and CH4. Meas. Sci. Technol. 2003, 14, 472–478. [Google Scholar] [CrossRef] [Scilit]
- Wang, B.; Lu, H.; Li, A.; Chen, Y.; Dai, T.; Huang, S.; Lian, H. Research of TDLAS methane detection system using VCSEL laser as the light source. Infrared Laser Eng. 2020, 49, 0405002. [Google Scholar] [CrossRef] [Scilit]
- Liu, K.; Wang, L.; Tan, T.; Wang, G.; Zhang, W.; Chen, W.; Gao, X. Highly sensitive detection of methane by near-infrared laser absorption spectroscopy using a compact dense-pattern multipass cell. Sens. Actuators B Chem. 2015, 220, 1000–1005. [Google Scholar] [CrossRef] [Scilit]
- Li, Y.; Chang, L.; Zhao, Y.; Meng, X.; Wei, Y.; Wang, X.; Yue, J.; Liu, T. A fiber optic methane sensor based on wavelength adaptive vertical cavity surface emitting laser without thermoelectric cooler. Measurement 2016, 79, 211–215. [Google Scholar] [CrossRef] [Scilit]
- Li, B.; Zheng, C.; Liu, H.; He, Q.; Ye, W.; Zhang, Y.; Pan, J.; Wang, Y. Development and measurement of a near-infrared CH4 detection system using 1.654 μm wavelength-modulated diode laser and open reflective gas sensing probe. Sens. Actuators B Chem. 2016, 225, 188–198. [Google Scholar] [CrossRef] [Scilit]
- Babichev, A.; Blokhin, S.; Kolodeznyi, E.; Karachinsky, L.; Novikov, I.; Egorov, A.; Tian, S.-C.; Bimberg, D. Long-wavelength VCSELs: Status and prospects. Photonics 2023, 10, 268. [Google Scholar] [CrossRef] [Scilit]
- Amann, M.-C.; Ortsiefer, M. Long-wavelength (λ ≥ 1.3 μm) InGaAlAs-InP vertical-cavity surface-emitting lasers for applications in optical communication and sensing. Phys. Status Solidi A 2006, 203, 3538–3544. [Google Scholar] [CrossRef] [Scilit]
- Ortsiefer, M.; Shau, R.; Böhm, G.; Köhler, F.; Rosskopf, J.; Amann, M.-C. Thermal conductivity analysis and device performance of 1.55 μm InGaAlAs/InP buried tunnel junction VCSELs. Phys. Status Solidi A 2001, 188, 913–919. [Google Scholar] [CrossRef] [Scilit]
- Chang-Hasnain, C.J.; Yang, W. High-contrast gratings for integrated optoelectronics. Adv. Opt. Photonics 2012, 4, 379–440. [Google Scholar] [CrossRef] [Scilit]
- Karagodsky, V.; Chang-Hasnain, C.J. Physics of near-wavelength high contrast gratings. Opt. Express 2012, 20, 10888–10895. [Google Scholar] [CrossRef] [Scilit] [PubMed]
- Huang, M.C.Y.; Zhou, Y.; Chang-Hasnain, C.J. A surface-emitting laser incorporating a high-index-contrast subwavelength grating. Nat. Photonics 2007, 1, 119–122. [Google Scholar] [CrossRef] [Scilit]
- Hofmann, W.; Chase, C.; Müller, M.; Rao, Y.; Grasse, C.; Böhm, G.; Amann, M.-C.; Chang-Hasnain, C.J. Long-wavelength high-contrast grating vertical-cavity surface-emitting laser. IEEE Photonics J. 2010, 2, 415–422. [Google Scholar] [CrossRef] [Scilit]
- Chase, C.; Rao, Y.; Hofmann, W.; Chang-Hasnain, C.J. 1550 nm high contrast grating VCSEL. Opt. Express 2010, 18, 15461–15466. [Google Scholar] [CrossRef] [Scilit] [PubMed]
- Gębski, M.; Dems, M.; Szerling, A.; Motyka, M.; Marona, L.; Kruszka, R.; Urbańczyk, D.; Walczakowski, M.; Pałka, N.; Wójcik-Jedlińska, A.; et al. Monolithic high-index contrast grating: A material independent high-reflectance VCSEL mirror. Opt. Express 2015, 23, 11674–11686. [Google Scholar] [CrossRef] [Scilit] [PubMed]
- Gębski, M.; Dems, M.; Wasiak, M.; Lott, J.A.; Czyszanowski, T. Monolithic subwavelength high-index-contrast grating VCSEL. IEEE Photonics Technol. Lett. 2015, 27, 1953–1956. [Google Scholar] [CrossRef] [Scilit]
- Marciniak, M.; Gębski, M.; Dems, M.; Haglund, E.; Larsson, A.; Riaziat, M.; Lott, J.A.; Czyszanowski, T. Optimal parameters of monolithic high-contrast grating mirrors. Opt. Lett. 2016, 41, 3495–3498. [Google Scholar] [CrossRef] [Scilit] [PubMed]
- Gębski, M.; Lott, J.A.; Czyszanowski, T. Electrically injected VCSEL with a composite DBR and MHCG reflector. Opt. Express 2019, 27, 7139–7146. [Google Scholar] [CrossRef] [Scilit] [PubMed]
- Hong, K.-B.; Chang, T.-C.; Hjort, F.; Lindvall, N.; Hsieh, W.-H.; Huang, W.-H.; Tsai, P.-H.; Czyszanowski, T.; Haglund, Å.; Lu, T.-C. Monolithic high-index contrast grating mirror for a GaN-based vertical-cavity surface-emitting laser. Photonics Res. 2021, 9, 2214–2221. [Google Scholar] [CrossRef] [Scilit]
- Katsidis, C.C.; Siapkas, D.I. General transfer-matrix method for optical multilayer systems with coherent, partially coherent, and incoherent interference. Appl. Opt. 2002, 41, 3978–3987. [Google Scholar] [CrossRef] [Scilit] [PubMed]
- Moharam, M.G.; Gaylord, T.K. Rigorous coupled-wave analysis of planar-grating diffraction. J. Opt. Soc. Am. 1981, 71, 811–818. [Google Scholar] [CrossRef] [Scilit]

Disclaimer/Publisher’s Note: The statements, opinions and data contained in all publications are solely those of the individual author(s) and contributor(s) and not of MDPI and/or the editor(s). MDPI and/or the editor(s) disclaim responsibility for any injury to people or property resulting from any ideas, methods, instructions or products referred to in the content. |
© 2026 by the authors. Licensee MDPI, Basel, Switzerland. This article is an open access article distributed under the terms and conditions of the Creative Commons Attribution (CC BY) license.