


Abstract
At the air–sea interface, a laser is transmitted across media from an optically denser medium to an optically thinner one, and the random fluctuation of the sea surface causes expansion, scintillation and drift of the spot on the receiving plane, which changes the communication performance. Underwater cross-medium optical communication is affected not only by the absorption and scattering of the water body but also by the sea-surface wind speed and water flow velocity. In this paper, field measurements were carried out in Chan River, Ba River and Qianyou River in Shaanxi Province and at Yantai First Bathing Beach in Shandong Province; spot images were acquired in the different water bodies and the spatial intensity distribution of the spot was studied and analyzed. By measuring the dynamic variation in the spot over a long period, the centroid displacement of the cross-medium transmitted spot was studied and analyzed. The results show that, under the experimental conditions, the spatial intensity distribution of the spot follows a Gaussian distribution model during air–sea cross-medium optical transmission, and that the spatial intensity distribution of the spot differs among water bodies. The spot centroid displacement also follows a Gaussian distribution model, and the centroid displacement of the spot differs among water bodies. This model is of certain significance for establishing a transmission model for cross-medium optical communication.
1. Introduction
In recent years, with the vigorous development of laser communication technology, the application scenarios of laser communication have become increasingly broad, and it now plays an ever more critical role in radar, guidance and satellites. In the marine underwater environment, blue–green laser communication systems offer the advantages of high efficiency, low loss and large capacity, and they do not compromise the mobility and concealment of underwater platforms; therefore, compared with radio communication systems, the blue–green laser is a more ideal means of underwater communication [1,2,3].
For cross-medium laser uplink transmission, the laser is affected not only by seawater but also by sea wind; the sea wind causes random fluctuations of the sea surface, which affects the refraction and reflection of the laser penetrating the sea surface and further leads to spot drift, distortion, scintillation and non-uniform power distribution at the receiver. For cross-medium uplink laser transmission, the communication process is very difficult to express analytically. Practice has shown that the Monte Carlo method can simulate the propagation of light in turbid media very well. Huang Aiping et al. [4] studied and analyzed the channel characteristics of an underwater optical communication link by using the Monte Carlo simulation method. Zhou Tianhua et al. [5] combined three-dimensional ocean wave simulation with Monte Carlo simulation to study and analyze the concentrated distribution region of the exit angle of the emitted beam. Wu Fangping et al. [6] simulated marine uplink laser communication by the Monte Carlo method and studied and analyzed the influence of submarine depth and sea-surface wind speed on the number of received photons and the radial distribution of their relative energy. SAHU S K et al. [7] improved the scattering phase function and, combined with Monte Carlo simulation, studied and analyzed the received power and the impulse response of the laser signal in a seawater channel. JASMA F et al. [8] studied and analyzed, on the basis of the Monte Carlo method, the influence of the scattering region and the communication distance on the link bandwidth when the laser passes through three different types of water bodies.
With regard to research on the cross-medium channel as a whole, Si Lihong et al. [9] studied uplink communication, in which the laser passes through seawater and the atmosphere, and particularly discussed the uplink transmission characteristics of light at a randomly rough sea surface. Zhai P W et al. [10] developed simulation software for downlink laser communication from the atmosphere to seawater, in which different media correspond to their respective radiative transfer models. He Guqiang [11] studied downlink laser channel communication and established and verified the communication channel models of 10 communication scenarios using the Monte Carlo method. Liu Li [12] established a cross-medium laser uplink communication system model and, according to the attenuation characteristics of the seawater, air–sea interface and atmospheric channels, estimated a calculation expression for the system path loss.
In summary, most existing studies on the transmission characteristics of optical communication channels focus on theoretical analysis and simulation, which affect the fidelity of cross-medium channel modeling and can hardly meet the requirements of theoretical analysis and design of communication systems. To address this problem, the present paper carries out a more accurate and more realistic modeling of cross-medium optical communication on the basis of actually measured data.
2. Cross-Medium Transmission Model
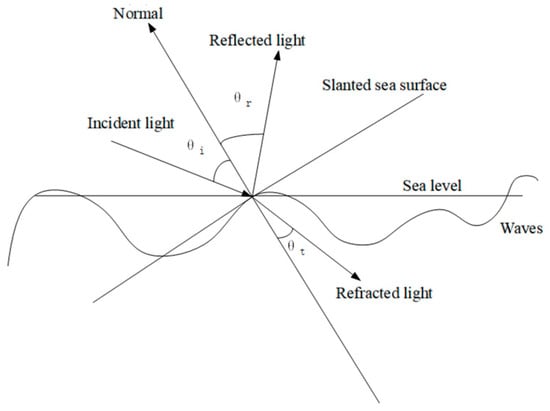
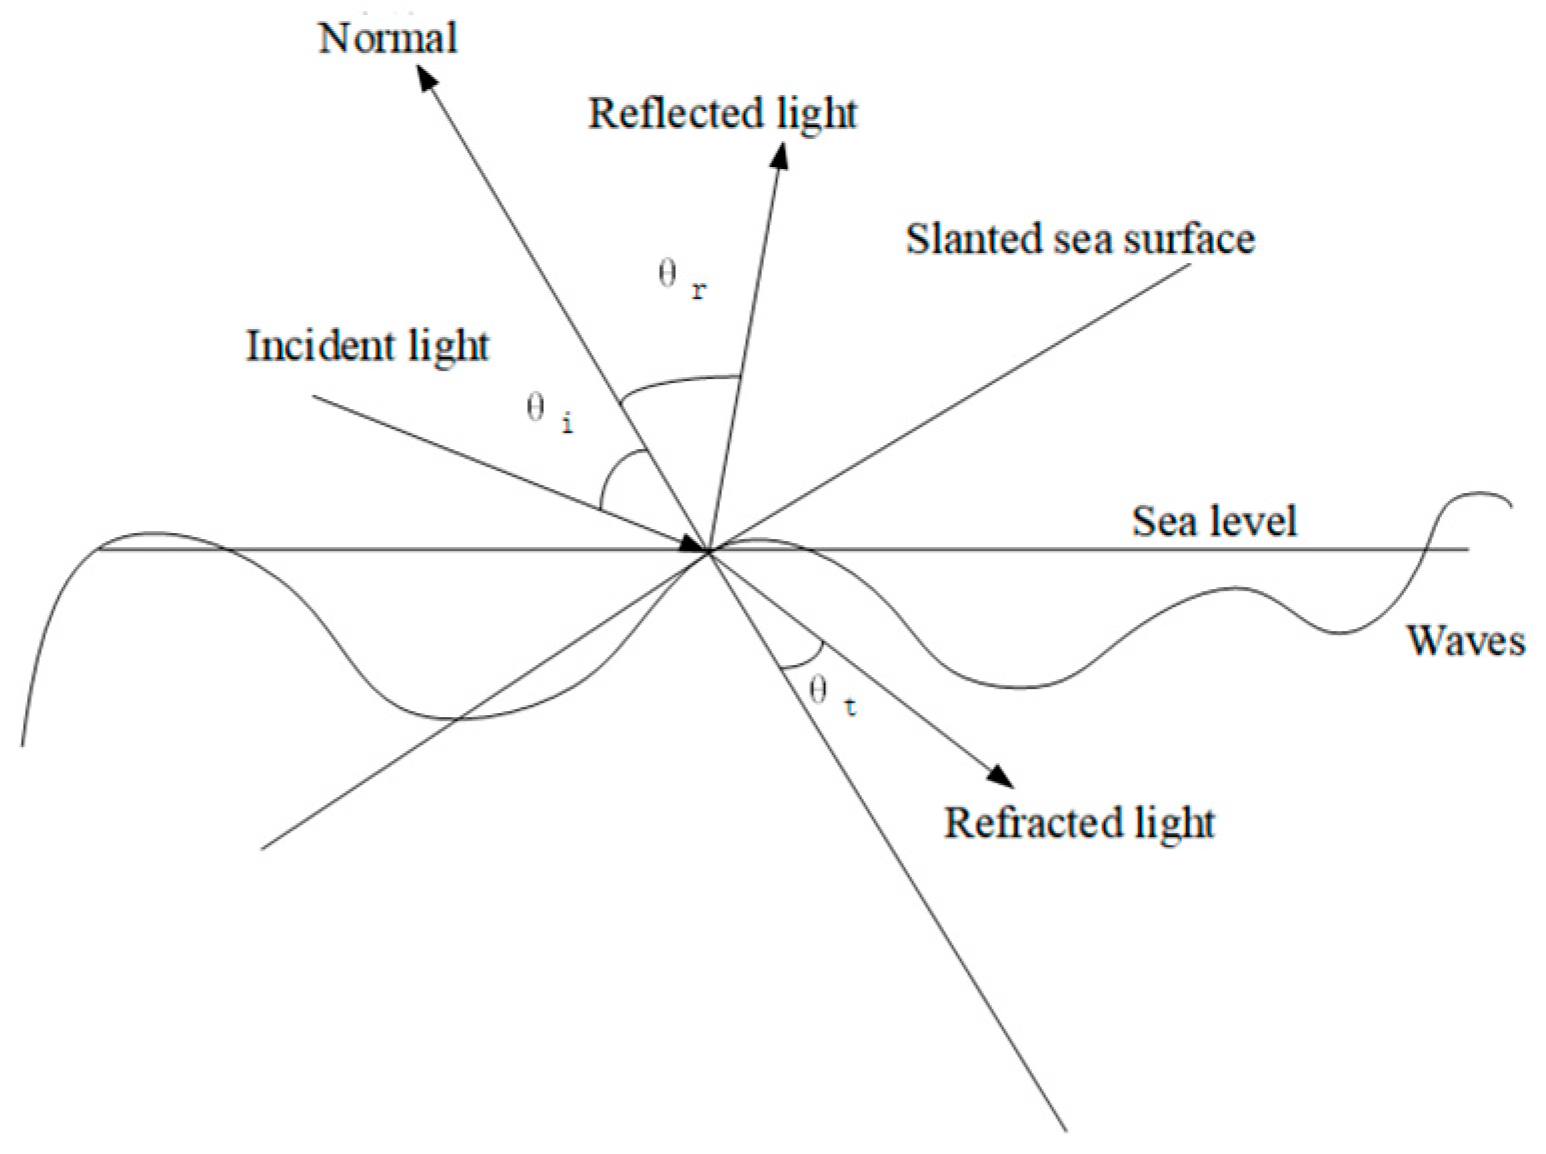
Owing to the influence of the sea-surface wind speed, the sea surface fluctuates randomly over time. When a laser irradiates the sea surface, the difference in refractive index between the atmosphere and seawater causes refraction and reflection of the transmitted laser. Figure 1 shows the refraction and reflection of light at the air–sea interface; the refractive index of the medium in which the incident light propagates is assumed to be n1, and that of the medium in which the refracted light propagates is n2.
Figure 1.
Simplified model of light passing through the air–sea interface.
In the coordinate system established in Figure 1, the relationship among the incident angle θi, the reflection angle θr and the refraction angle θt satisfies the law of reflection and Snell’s law:
θi = θr
The ratio of the power of the incident light reflected by the air–sea interface to the incident optical power is called the reflectance R; the reflectance of vertically polarized light is Rs and that of parallel-polarized light is Rp. Thus,
The ratio of the refracted optical power to the incident optical power is called the transmittance T. Thus,
T = 1 − R
The refractive index of seawater is 1.33 and that of air is 1. Whether the beam is transmitted upward from seawater to the atmosphere or downward from the atmosphere to seawater, there exists an incidence angle (36.9° and 53.1°) at which the reflectance of parallel-polarized light is 0; at this angle the parallel-polarized light is completely transmitted, and the angle is called the Brewster angle. When the beam is transmitted upward from seawater to the atmosphere, there exists a critical incidence angle (48.8°); when the incidence angle exceeds this value, total internal reflection occurs for both the vertically polarized light and the parallel-polarized light, the reflectance of the air–sea interface for the incident light becomes 1 and the transmittance becomes 0. This critical angle is the critical angle of total internal reflection.
Combining measured sea-surface data, Cox and Munk obtained the normalized probability density formula of the sea-surface tilt angle under a given sea-surface wind speed [13],
where σs is the root-mean-square surface slope, σs = (0.003 + 0.00512v)1/2; v is the sea-surface wind speed, in units of m/s.
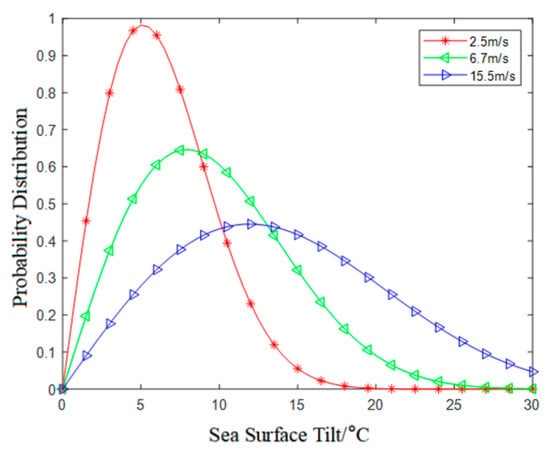
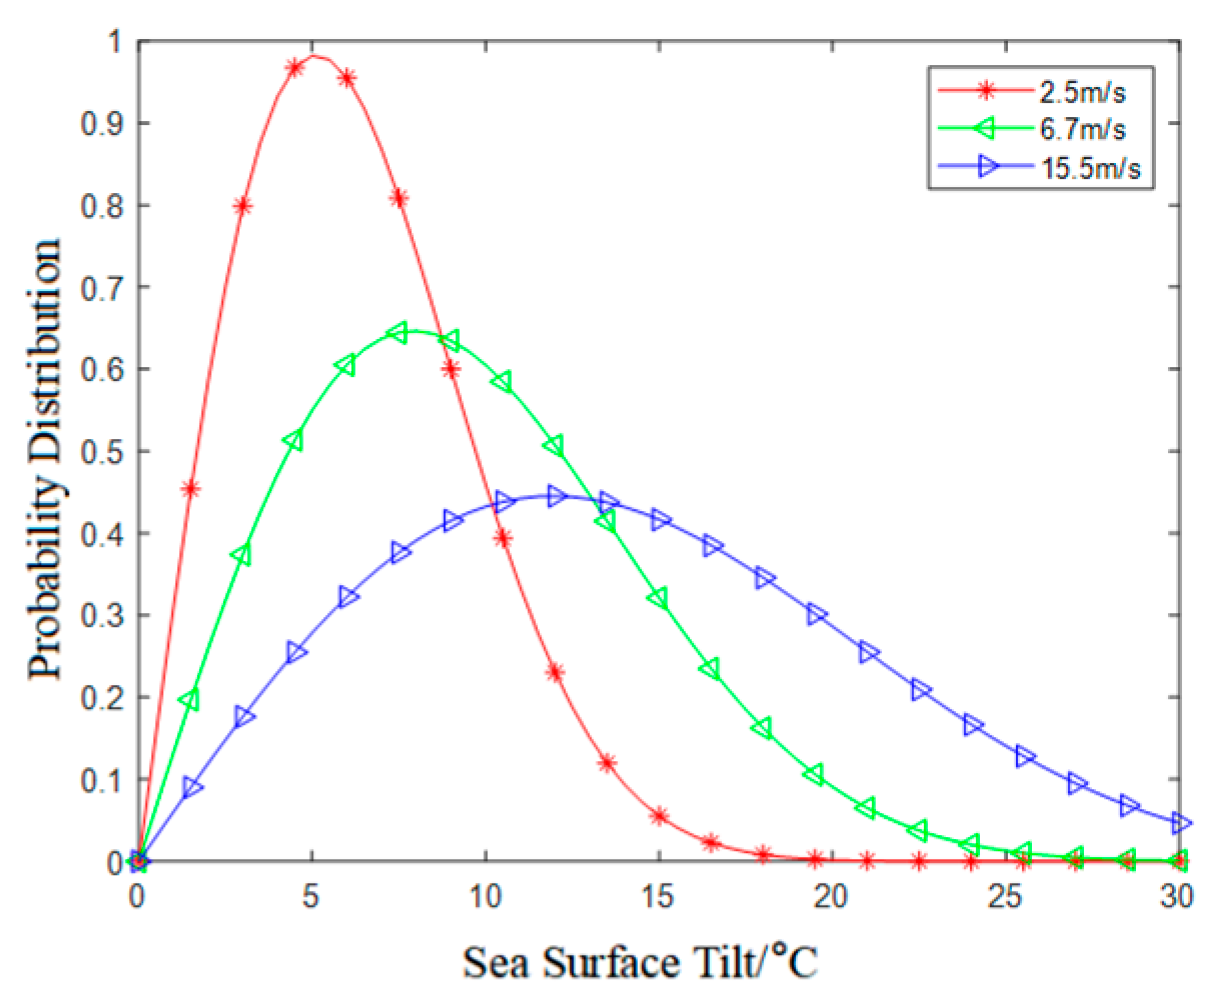
Figure 2 shows the probability density of the sea-surface tilt angle under different wind speeds. For a given wind speed, the sea-surface tilt angle appears only within a certain range; as the sea-surface wind speed increases, the probability of a large sea-surface tilt angle increases, and the uplink laser is prone to total internal reflection.
Figure 2.
Probability density of the sea-surface tilt angle at different wind speeds.
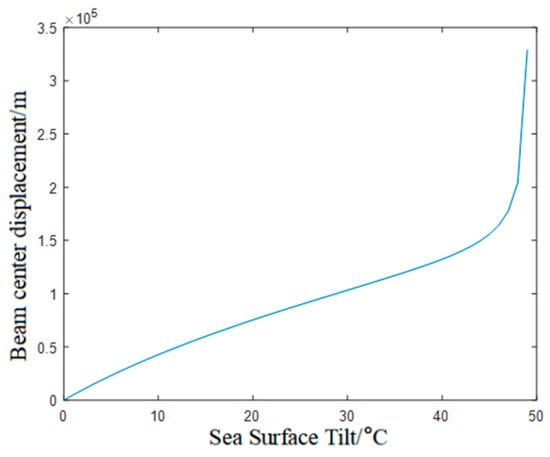
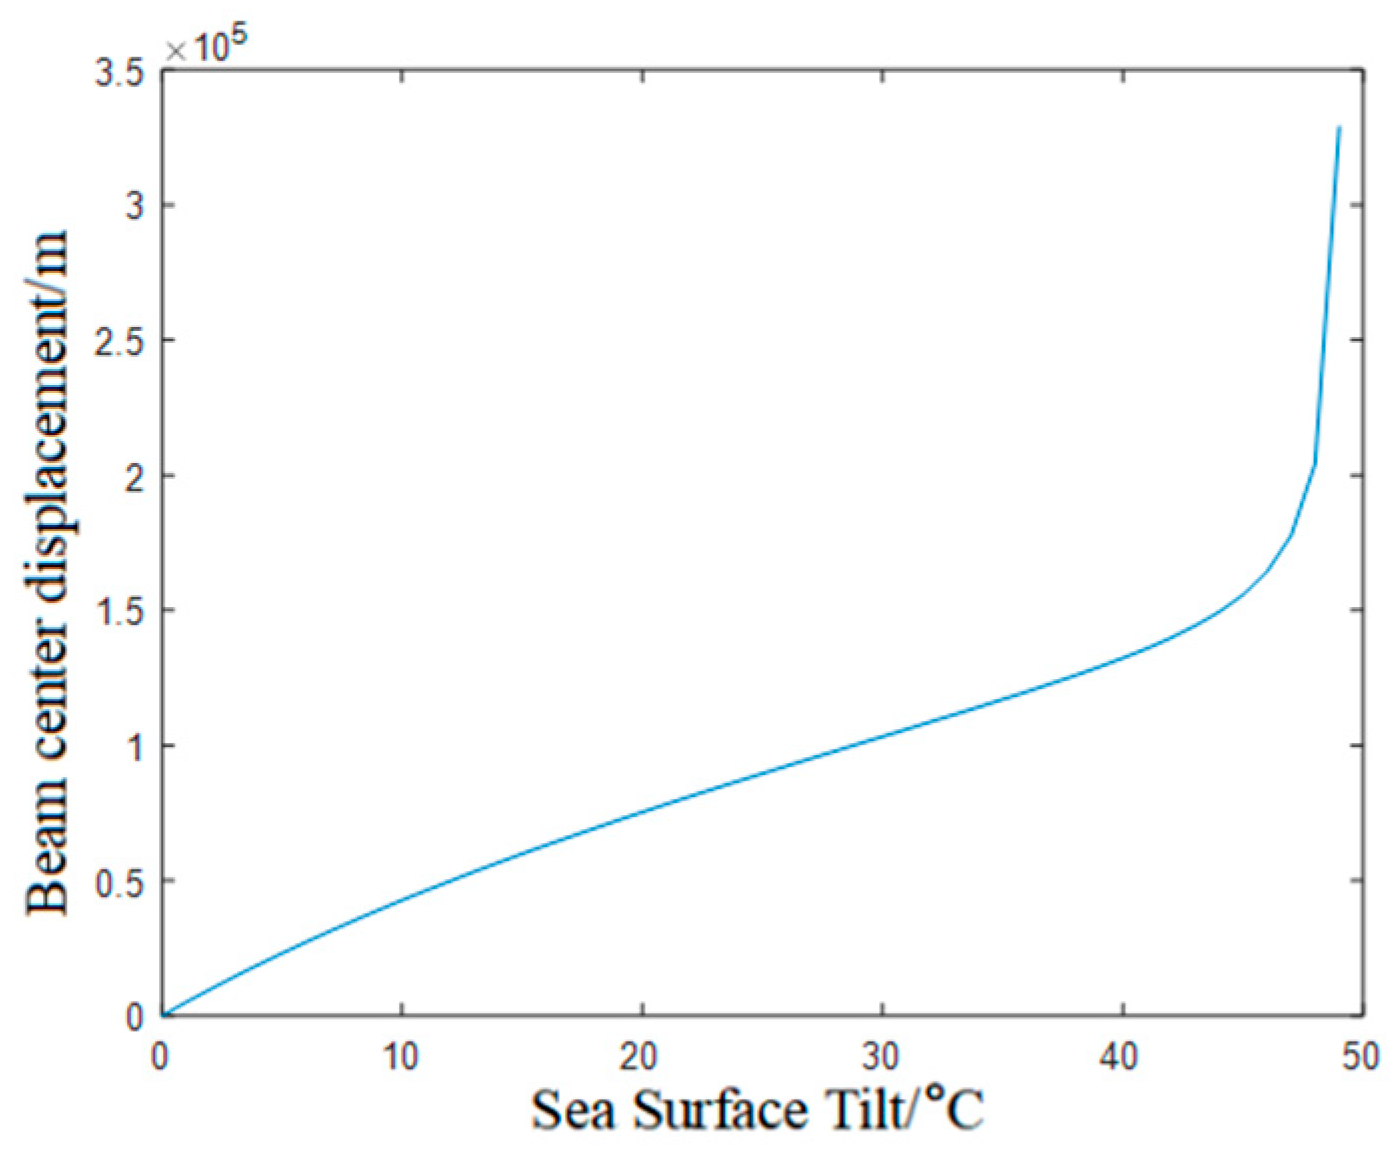
The refraction of a beam at an ideally tilted air–sea interface is calculated by using geometrical optics. When the sea surface is tilted and the beam passes through the air–sea interface, the beam center is displaced by d0; the displacement of the laser beam center is
d0 = h1tan[sin−1(n1sinγ) − γ]
When the laser is transmitted through a tilted sea surface, the variation in beam-center displacement d0 with the sea-surface tilt angle γ is shown in the figure below.
It can be seen from the Figure 3 that when the sea-surface tilt angle is below 25°, the beam-center displacement varies linearly; as the sea-surface tilt angle increases, the spot displacement becomes more and more severe, and when the sea-surface tilt angle approaches the critical angle, the displacement approaches its maximum value.
Figure 3.
Beam-center displacement for different sea-surface tilt angles.
During the underwater transmission of the beam, the attenuation effect of the water body on light must also be taken into account, which causes a certain loss of optical power; at the same time, the emitting device of the light source produces a certain loss during emission, i.e., the emission efficiency ηt, and the receiving antenna and optical design at the receiving end produce a receiving loss, i.e., the receiving efficiency ηr. Taking all the above factors into account, the received power equation of laser transmission in water can be expressed as
where ηt is the emission efficiency, ηr is the receiving efficiency, c(λ) is the attenuation coefficient and d is the transmission distance.
Pr = Pt × ηt × ηr × e−c(λ)×d
In the context of cross-medium optical transmission, this paper proposes a model, fitted by a Gaussian function, for the spot-center displacement caused by underwater cross-medium turbulence; its probability density function is defined as follows:
where A is a normalized correction coefficient ranging from 0 to 1, such that , μ is the mean spot-center displacement under the current turbulence condition, and σ is the jitter variance of the spot-center displacement under the current turbulence condition.
The cumulative distribution function of the spot-center displacement caused by cross-medium turbulence is fitted with a Gaussian function, and the expression is
3. Experimental Analysis
3.1. Experimental System
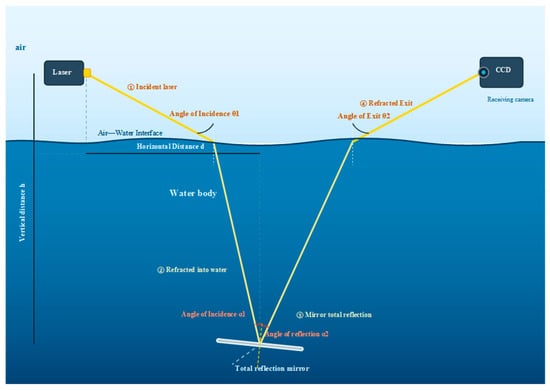
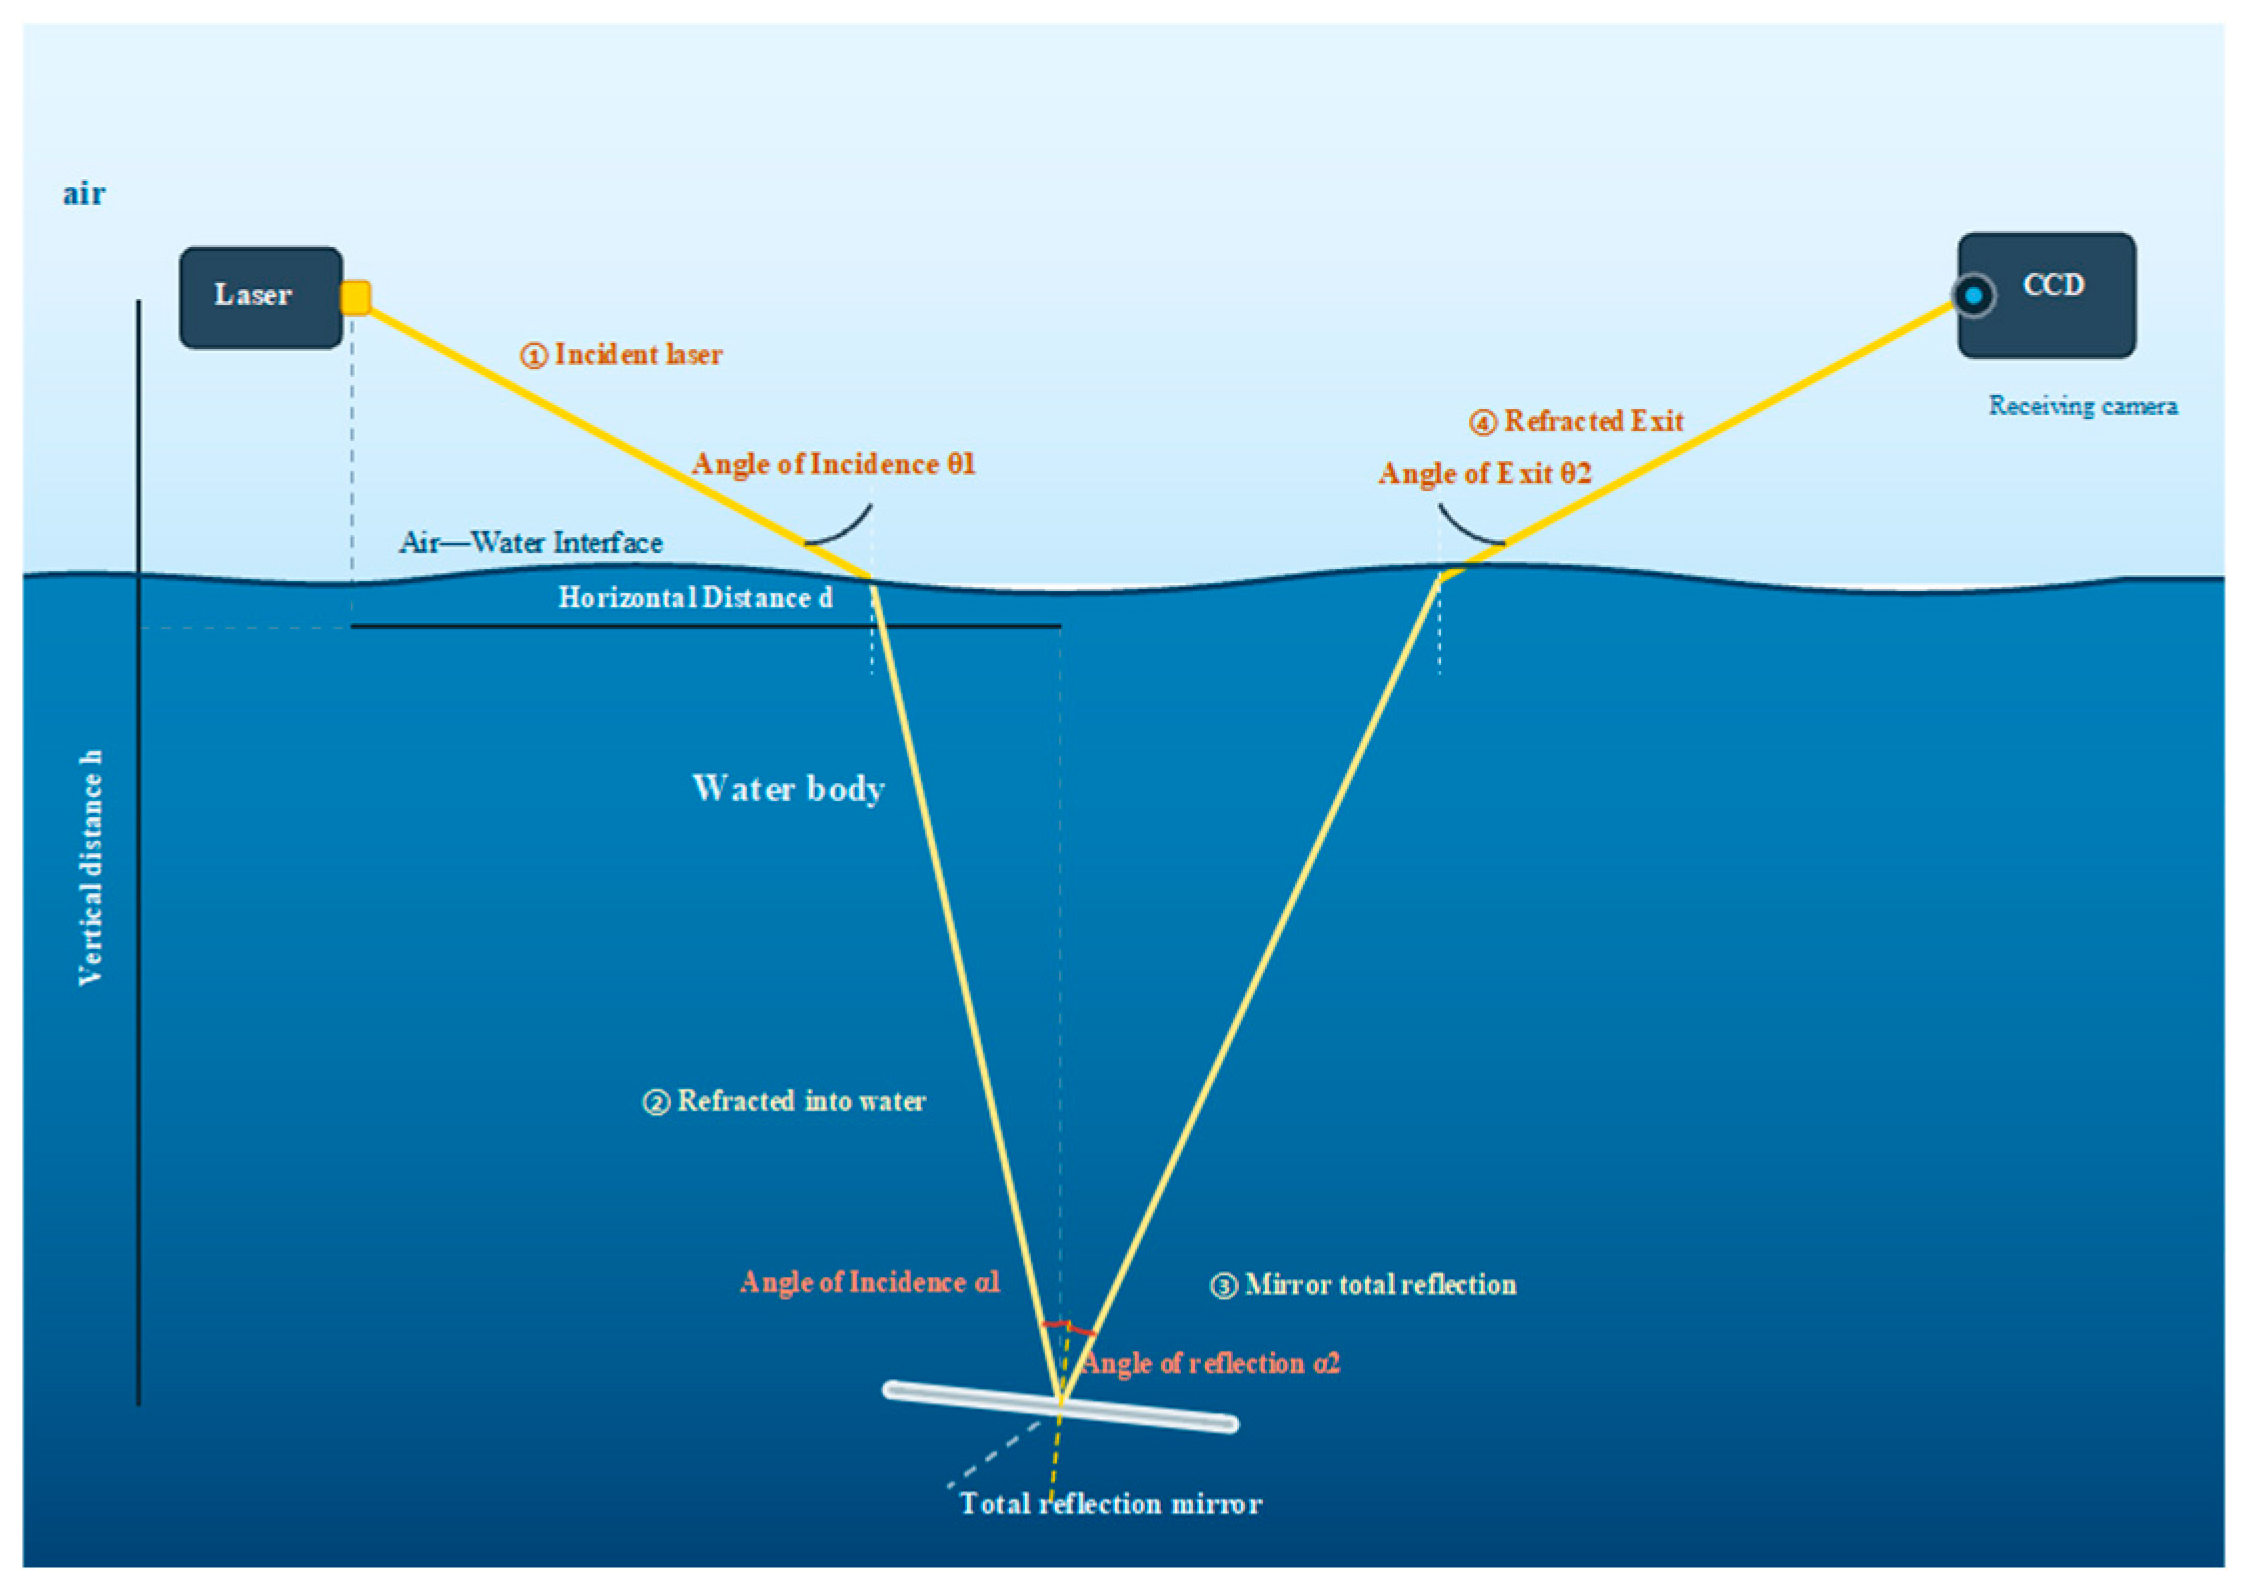
In order to obtain the rules governing the spatial intensity distribution of light and the spot centroid displacement under different water-body conditions, cross-medium laser transmission was carried out repeatedly in Chan River and Ba River in Xi’an, Shaanxi Province, in the upper reaches of Qianyou River in Zhashui County, Shangluo, Shaanxi Province, and at Yantai First Bathing Beach in Shandong Province. A schematic diagram of the experimental system is shown in the figure below.
The experimental system consists of a transmitting end, a cross-medium channel and a receiving end (the setup is shown in the Figure 4 below). The transmitting end adopts a PL-EPRO green laser with a wavelength of 532 nm, an output power of 1 W, a beam exit diameter of 2 mm and a half divergence angle of 0.75 mrad; the beam is incident from the air side onto the air–water interface at an incidence angle of θ1 = 30° (relative to the interface normal). After being refracted into the water body, the beam is folded back by a total-reflection mirror placed on the water bottom according to the law of reflection and is refracted out of the interface to the air side again. The horizontal distance between the transmitting end and the mirror is d = 0.45 m and the vertical distance is h = 0.5 m; these were kept fixed throughout the experiments and were not adjusted when the water body was changed. At the receiving end, a CCD camera together with a 25 mm focal-length C-mount fixed-focus imaging lens was used to acquire the exit spot; the receiving aperture is 25 mm and the field of view is about 20° (horizontal) × 15° (vertical). The effective resolution of the camera is 640 × 480 pixels with a pixel size of 14 µm, and the calibrated pixel resolution is about 0.147 mm/pixel. The acquisition parameters were set to a single-frame exposure time of 1 ms, a frame rate of 30 fps and a single sampling duration of 60 s so that about 1800 frames were acquired each time, and the exposure and gain were kept constant under all water-body conditions. In the experiments, the water temperature was measured with an electronic thermometer, the water flow velocity was measured several times by the float method and then averaged, and the turbidity of each water body was measured in situ with a turbidity meter; each water body was measured five times and the arithmetic mean was taken as the turbidity value of that water body, recorded in NTU and rounded to one decimal place in accordance with GB/T 8170 [14]. During the experiments, the optical path was calibrated according to d, h and θ1 so that the incident beam was centered on the mirror center and the CCD field of view covered the exit spot; the above parameters were then kept unchanged, and spot sequences were acquired continuously in Chan River, Ba River, Qianyou River and Yantai First Bathing Beach in turn.
Figure 4.
Experimental system.
3.2. Spatial Intensity Distribution of the Spot
The spot images were acquired continuously by a CCD camera and output as gray-scale images. In order to suppress the camera readout noise, dark current and laser intensity fluctuation, N raw gray-scale frames were acquired continuously under each water-body condition; the dark field was first subtracted frame by frame, and then the N frames of the same condition were averaged in time to obtain the mean spot image of that condition.
Single-frame dark-field subtraction (pixel-by-pixel subtraction):
I′k,n(x,y) = Ik,n(x,y) − D(x,y)
Time averaging of the N frames of the same condition:
where k is the water-body/condition index, n = 1,…,N is the frame index, (x,y) are the pixel coordinates, Ik,n(x,y) and D(x,y) are both gray-scale values, and D(x,y) is the dark-field image acquired under light-shielded conditions, which is used to remove the camera dark current, readout offset and fixed-pattern noise.
In order to compare the relative gray-scale intensity and spatial morphology of the spot in different water bodies on the same scale, a unified reference basis was adopted to normalize the images of all conditions:
where Iref is the peak value of the incident reference spot, and the images of all water bodies are divided by the same Iref.
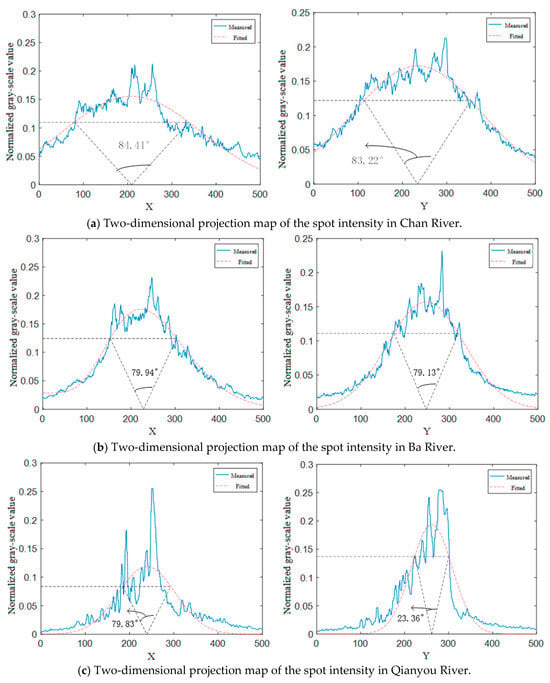
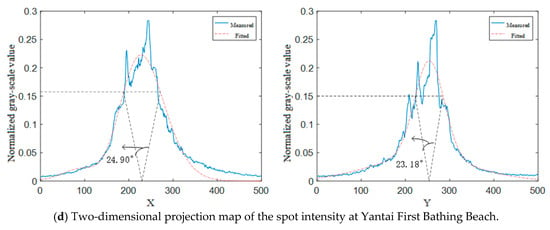
The normalized gray-scale image was projected along the x and y axes to obtain the two-dimensional distribution of light intensity, and the projection curves were fitted by nonlinear least squares with a one-dimensional Gaussian function; the 3 dB beam width angle was taken as the angle at which the normalized intensity fell to half of the peak value of the curve. The acquired data of each water body were randomly selected, and one group of 1800 independently and continuously acquired frames was selected for each water body. The experimental environmental conditions of the sample data are listed in Table 1, and the final results are shown in Figure 5.
Table 1.
Environmental conditions of the experiments.
Figure 5.
Two-dimensional projection maps of spot intensity in different water bodies.
Figure 5 shows the normalized intensity spatial distribution of the received spot in the four water bodies, namely Chan River, Ba River, Qianyou River and Yantai First Bathing Beach, and the corresponding 3 dB beam width angle is marked with an arrow in each sub-figure. The 3 dB beam width angles along the x and y directions are, respectively, 84.41°/83.22° for Chan River, 79.94°/79.13° for Ba River, 79.83°/23.36° for Qianyou River and 24.90°/23.18° for Yantai First Bathing Beach. The projected intensity distributions of the spot along the x and y axes of each water body were fitted by nonlinear least squares according to the Gaussian model, and the coefficient of determination R2 was used to evaluate the goodness of fit; the R2 values of the four water bodies in both directions are all greater than 0.95 (0.952/0.953 for Chan River, 0.960/0.961 for Ba River, 0.956/0.954 for Qianyou River and 0.955/0.952 for Yantai First Bathing Beach). The maximum normalized gray-scale values of the received spot in the water bodies are, respectively, 0.2833 for Yantai First Bathing Beach, 0.2550 for Qianyou River, 0.2318 for Ba River and 0.2125 for Chan River, so the peaks decrease in the following order: Yantai First Bathing Beach, Qianyou River, Ba River, Chan River.
It can be seen from Figure 5 that the intensity of the received spot fluctuates randomly in space, and that the morphology and the degree of energy attenuation of the spot differ obviously among water bodies: the spot distribution is the steepest and most concentrated at Yantai First Bathing Beach, followed by Qianyou River and Ba River, and it is the flattest and most diffuse in Chan River. The mechanism lies in the following: as the attenuation coefficient of the water body c(λ) and the turbidity increase, the absorption and scattering of photons by suspended particles are enhanced, the number of absorption and scattering events experienced by a photon in the water body increases [15], its direction of motion gradually deviates from the optical axis, and finally the spot area reaching the receiving plane increases and the diffusion is intensified, so the maximum normalized gray-scale value decreases accordingly. The R2 values of the four water bodies in both directions are all greater than 0.95, indicating that the light intensity distribution of the received spot follows a Gaussian distribution.
3.3. Spot Centroid Displacement
For the gray-scale image of the k frame, the gray-scale centroid method was used to extract the spot centroid coordinates frame by frame:
where Ik,i,j is the gray-scale value at pixel (i,j) in the k frame, and xi,yj is the spatial coordinate of that pixel.
Taking the reference centroid (x0,y0) (the mean centroid of all samples) as the origin, single-frame centroid displacement is defined as the square root of the sum of the squares of the displacements in the two directions x and y, i.e., the radial displacement:
In order to compare the degree of displacement of different water bodies on the same dimensionless scale, the displacement of each frame was divided by the reference displacement rref so as to obtain the normalized displacement:
where rref is the receiving radius of the spot on the receiving plane, and the images of all of the water bodies are divided by the same rref.
The empirical probability density of the normalized displacement of each water body was fitted by nonlinear least squares with the Gaussian model proposed in Equation (10), and the μ and σ obtained by fitting each curve (each figure) are listed in Table 2.
Table 2.
The fitting and statistical characterization results of the normalized displacement of each water body.
In order to characterize the deviation of the normalized displacement from a Gaussian distribution, the sample skewness and excess kurtosis were calculated:
where s is the sample standard deviation. For an ideal Gaussian distribution, g1 = 0, g2 = 0; the smaller |g1| and |g2| are, the closer the distribution is to Gaussian.
On the basis of the fitted model parameters and the sample size, the statistical uncertainty is given by the standard error of the parameter estimates:
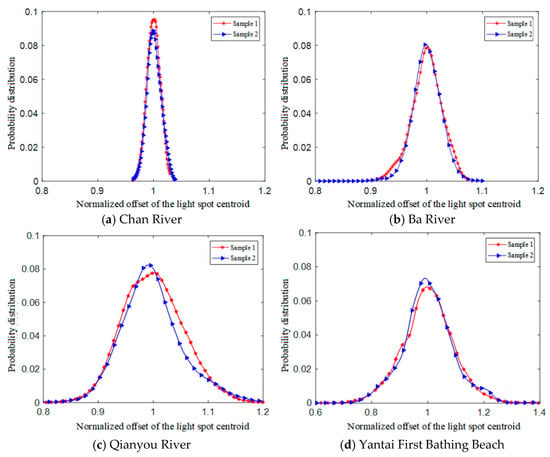
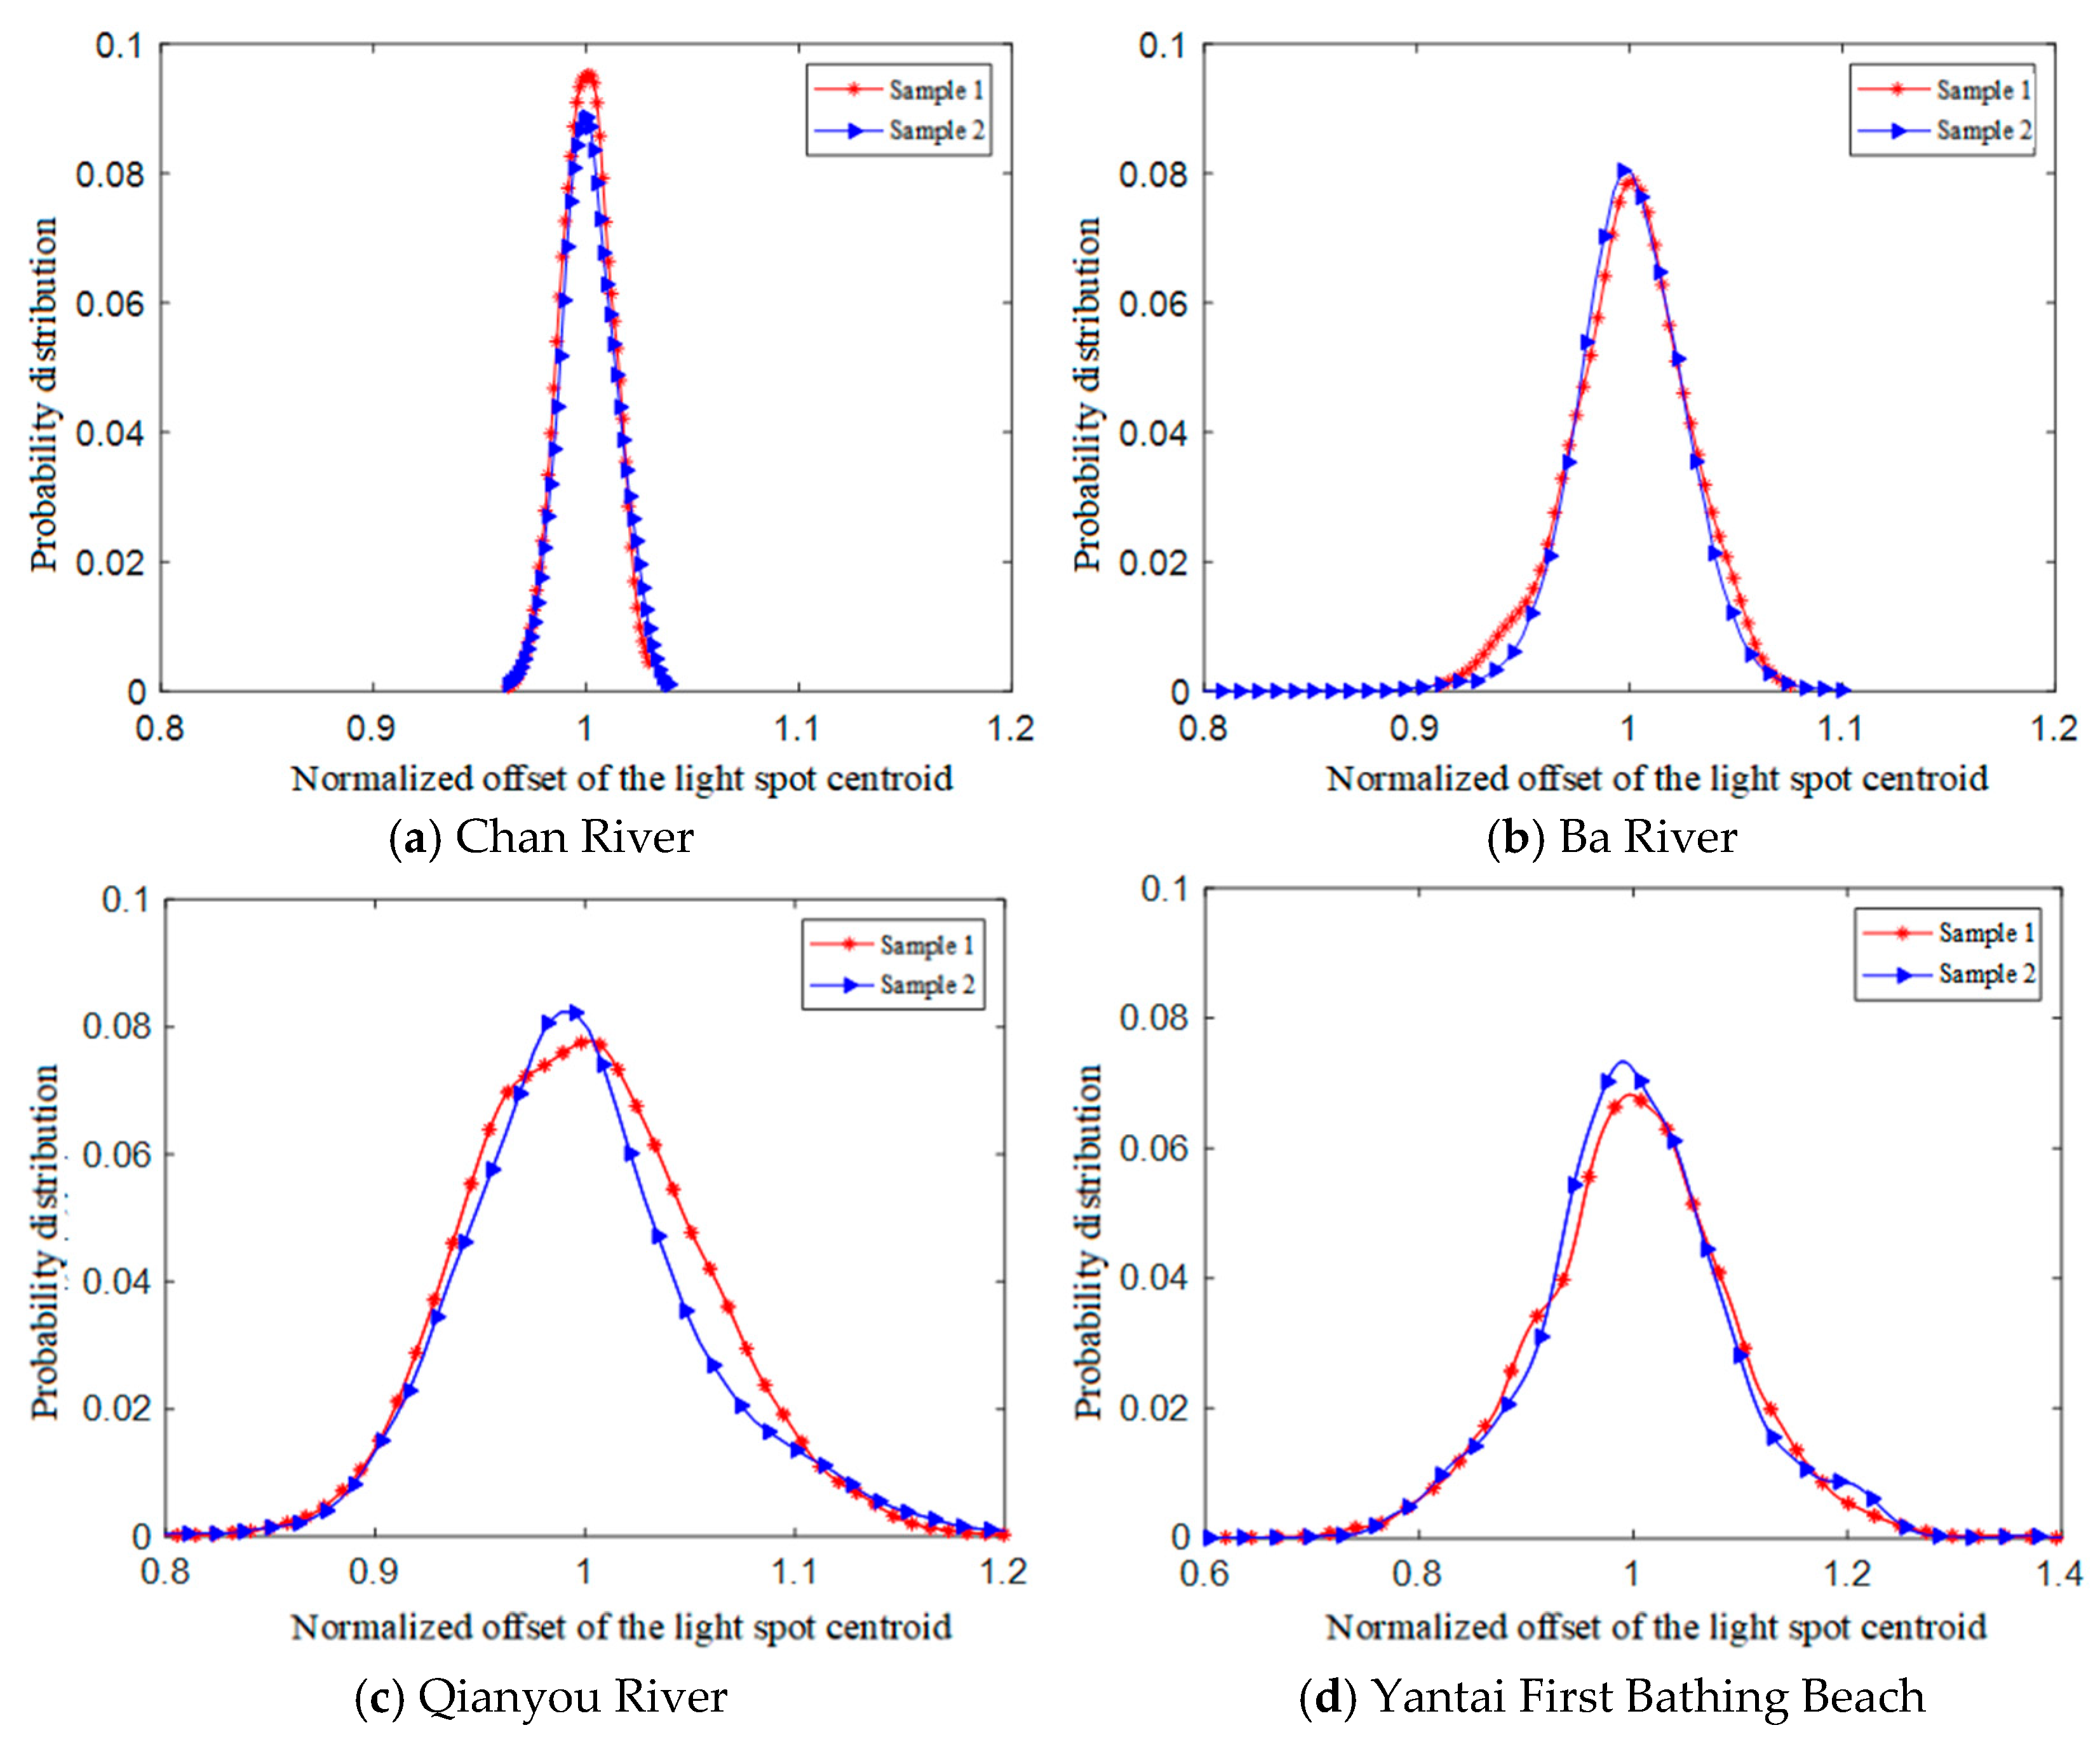
Each probability density curve in Figure 6 is obtained from one group of independently and continuously acquired 1800 frames, and two curves (i.e., two mutually independent groups of 1800 frames) are given for the same water body in order to test the repeatability and robustness of the results.
Figure 6.
Probability density distributions of the spot centroid displacement in different water bodies.
Figure 6 shows the probability density distributions of the measured spot centroid displacement in Chan River, Ba River, the upper reaches of Qianyou River and Yantai First Bathing Beach, respectively. It can be seen from Figure 6 that the normalized centroid displacements of the spot measured in Chan River, Ba River, Qianyou River and Yantai First Bathing Beach are mainly concentrated in the ranges of 0.96~1.04, 0.92~1.08, 0.85~1.15 and 0.74~1.16, respectively. The standard deviations σ of the normalized displacement of the four water bodies are 0.012 (Chan River), 0.024 (Ba River), 0.046 (Qianyou River) and 0.064 (Yantai First Bathing Beach), respectively; the absolute values of the skewness g1 and the excess kurtosis g2 are not significantly different from 0, and the goodness-of-fit R2 values are all greater than 0.96; the statistical uncertainties of the mean and the standard deviation are given in terms of the standard error.
As the wind waves on the water surface intensify and the water flow velocity increases, the surface fluctuates more violently, and the probability of the occurrence of a large sea-surface tilt angle increases; when photons are projected out of the sea surface, their directions deviate further from the centroid position of the receiving plane, and the light field distribution becomes more and more divergent. In addition, because of the limitation of the receiving field of view, some photons even fall outside it, so that the number of photons on the receiving plane decreases and they are not included in the statistical results, which causes the weight of the centroid position of the receiving plane to decrease gradually. Combined with the above numerical information, the fluctuation of the spot-center displacement is the largest at Yantai First Bathing Beach, followed by Qianyou River and Ba River, and spot centroid displacement is the smallest in Chan River. For the four water bodies, the skewness and kurtosis are not significantly different from 0 and the goodness-of-fit R2 values are all greater than 0.96, indicating that the displacement follows a Gaussian distribution.
4. Conclusions
In this paper, an experimental study of cross-medium optical transmission was carried out. Four types of real natural water bodies, namely rivers and coastal seawater, were selected to complete field spot acquisition and statistical analysis of the data, and data fitting and modeling were completed in combination with the theories of optical refraction and scattering. The following conclusions are drawn:
- (1)
- Under the experimental conditions of this paper, the spot intensity image on the receiving plane of cross-medium optical transmission follows a Gaussian distribution; the more turbid the water quality is, the greater the degree of absorption and scattering caused by suspended particles in the water body, the smoother the Gaussian image and the smaller the maximum light intensity. The spatial distribution of the spot intensity differs among water bodies: compared with seawater, river water has a higher content of impurities and suspended matter and a poorer water quality, and photons undergo multiple random scattering events during transmission, so the distortion and diffusion of the spot are more severe in river water than in seawater;
- (2)
- Under the experimental conditions of this paper, the spot centroid displacement of cross-medium optical communication conforms to a Gaussian function model. The degree of surface undulation is affected by the coupling of the water flow velocity and the sea-surface wind speed; an increase in the water flow velocity or the sea-surface wind speed gives rise to a larger surface tilt angle, and the refraction displacement of light passing through the air–sea interface increases correspondingly, thus leading to a larger spot centroid displacement. The probability density distribution of the spot centroid displacement differs among water bodies; under the experimental conditions, the fluctuation/dispersion of the spot centroid displacement is largest at the bathing beach.
The existing measured data cover only small and medium-sized inland rivers and nearshore shallow-sea conditions, and do not yet cover extreme environments such as the open sea, deep-water sea areas and stormy waves, so the applicable range of the model is somewhat limited. This study only completed the offline analysis of static spot data and did not build a real-time online prediction system, so it is difficult to apply the model directly to the dynamic compensation of underwater optical communication links.
In the future, the practicality and universality of the model can be further studied, the mathematical and physical mechanism of the model can be further explored, the measured database can be expanded to multiple types of complex water environments, and the real-time calculation of the spot displacement can be realized by combining it with embedded hardware so as to provide complete engineering support for the channel loss compensation and communication outage prediction of underwater blue–green laser communication.
Author Contributions
Conceptualization, J.B. and S.Y.; methodology, J.B.; software, J.B.; validation, J.B. and S.Y.; formal analysis, J.B.; investigation, J.B. and S.Y.; resources, S.Y.; data curation, J.B.; writing—original draft preparation, J.B.; writing—review and editing, J.B. and S.Y.; visualization, J.B.; supervision, S.Y.; project administration, S.Y.; funding acquisition, S.Y. All authors have read and agreed to the published version of the manuscript.
Funding
This research was funded by the Youth Science Fund Project of Henan Provincial Natural Science Foundation (252300423311).
Data Availability Statement
The data presented in this study are available on request from the corresponding author. The data are not publicly available due to privacy/ethical restrictions.
Acknowledgments
During the preparation and revision of this manuscript, the authors used artificial intelligence tools (large language models) to assist with English language polishing, wording optimization, and literature search. The research design, experimental measurements, data processing, result analysis, and all conclusions presented herein were completed independently by the authors. AI was employed solely as a language and text-assistance tool and did not participate in the generation of any scientific data, modeling, or derivation of conclusions. The authors bear full responsibility for the accuracy and integrity of the content of this paper.
Conflicts of Interest
The authors declare no conflict of interest.
References
- Yao, J.; Yue, P.; Yan, Q.; Ju, M. Bit error rate analysis of slant-path atmospheric laser communication under weak turbulence. J. Xidian Univ. 2016, 43, 66–70. [Google Scholar] [CrossRef]
- Guan, Y.; He, F.; Yang, Y.; Duan, Z.; Zhu, Y.; Gao, Z. Analysis of channel characteristics of marine underwater laser communication based on Monte Carlo. Opt. Commun. Technol. 2016, 40, 52–54. [Google Scholar] [CrossRef]
- Alipour, A.; Mir, A. On the performance of blue-green waves propagation through underwater optical wireless communication system. Photonic Netw. Commun. 2018, 36, 309–315. [Google Scholar] [CrossRef] [Scilit]
- Huang, A.; Zhang, Y.; Tao, L. Channel characteristics of underwater laser communication based on Monte Carlo simulation. Infrared Laser Eng. 2017, 46, 226–231. [Google Scholar] [CrossRef] [Scilit]
- Zhou, T.; Chen, W.; He, Y.; Zhu, X. Beam Spatial Distribution of Upward Laser Through Sea-Air Interface. Chin. J. Lasers 2010, 37, 1978–1982. [Google Scholar] [CrossRef] [Scilit]
- Wu, F.; Zhang, X.; Yang, J.; Miao, R.; Ma, S.; Liu, C. Monte Carlo simulation of marine uplink laser communication. Laser Infrared 2015, 45, 22–26. [Google Scholar]
- Sahu, S.K.; Shanmugam, P. A theoretical study on the impact of particle scattering on the channel characteristics of underwater optical communication system. Opt. Commun. 2018, 408, 3–14. [Google Scholar] [CrossRef] [Scilit]
- Jasma, F.; Zaiton, A.M.; Ahmad, Z.; Rihawi, Z. Scattering regimes for underwater optical wireless communications using Monte Carlo simulation. Int. J. Electr. Comput. Eng. 2018, 8, 2571–2577. [Google Scholar] [CrossRef] [Scilit]
- Si, L. Research on the Channel Characteristics of Blue-Green Laser Uplink Communication. Master’s Thesis, Guilin University of Electronic Technology, Guilin, China, 2007. [Google Scholar] [CrossRef]
- Zhai, P.W.; Kattawar, G.W.; Yang, P. Impulse response solution to the three-dimensional vector radiative transfer equation in atmosphere-ocean systems. II. The hybrid matrix operator-Monte Carlo method. Appl. Opt. 2008, 47, 1063–1071. [Google Scholar] [CrossRef] [Scilit] [PubMed]
- He, G. Monte Carlo Simulation and Modeling of the Downlink Channel of Blue-Green Laser Communication. Master’s Thesis, Huazhong University of Science and Technology, Wuhan, China, 2009. Available online: https://www.zhangqiaokeyan.com/academic-degree-domestic_mphd_thesis/020312320054.html (accessed on 3 August 2023).
- Liu, L. Research on the Cross-Medium Blue-Green Laser Uplink Communication System. Master’s Thesis, Xidian University, Xi’an, China, 2019. Available online: https://www.zhangqiaokeyan.com/academic-degree-domestic_mphd_thesis/020315255939.html (accessed on 4 August 2023).
- Cox, C.S.; Munk, W.H. Statistics of the sea surface derived from sun glitter. J. Mar. Res. 1954, 13, 198–227. [Google Scholar]
- GB/T 8170—2008; Numerical Rounding Rules and Expression and Judgement of Limiting Values. Standards Press of China: Beijing, China, 2008.
- Zayed, M.M.; Shokair, M. Performance analysis of 450/520 nm LD-PS based UOWC systems for IoUT applications across various water conditions using opti-system. Opt. Rev. 2025, 32, 684–704. [Google Scholar] [CrossRef] [Scilit]

Disclaimer/Publisher’s Note: The statements, opinions and data contained in all publications are solely those of the individual author(s) and contributor(s) and not of MDPI and/or the editor(s). MDPI and/or the editor(s) disclaim responsibility for any injury to people or property resulting from any ideas, methods, instructions or products referred to in the content. |
© 2026 by the authors. Licensee MDPI, Basel, Switzerland. This article is an open access article distributed under the terms and conditions of the Creative Commons Attribution (CC BY) license.