


Abstract
Selecting an appropriate chemotherapy dose is challenging because tumor growth is nonlinear, treatment can affect physiological condition, and tumor–drug responses vary across subjects. This study extends the third-order tumor–drug model of Siket et al. with a normalized, phenomenological physiological-health state and formulates a health-constrained nonlinear model predictive control (NMPC) framework that combines tumor suppression, health preservation, and control smoothness under the simulation-defined constraint . Simulations were conducted on eight virtual Siket parameter profiles. At , PLD3, PLD4, and PLD6 achieved tumor-volume reductions of approximately , , and , respectively, whereas the other five profiles showed tumor progression. The structural indicator was strongly negatively associated with tumor reduction (Pearson correlation of approximately for all profiles and excluding PLD1); this is a descriptive observation based on only eight profiles. A dose-matched comparison with a simple threshold-based strategy favored NMPC for some profiles, although the health constraint was not imposed on the comparator. The health bound was satisfied in all 15 one-at-a-time mismatch cases, but joint parameter perturbations produced threshold violations and optimization difficulties for PLD1 and PLD9, and health-model sensitivity analyses revealed further difficulties for PLD1. The health model and its threshold are not calibrated against clinical data. This work is a simulation-based proof of concept and does not establish clinical safety, clinical efficacy, or general robustness.
1. Introduction
Mathematical models have long been used to describe tumor growth and cancer progression, ranging from ordinary differential equation (ODE) models to more detailed reaction–diffusion and spatial formulations that account for nutrient transport, tissue interactions, and cellular heterogeneity [1,2,3,4,5,6]. Other models have considered tumor invasion, therapeutic inhibition, and interactions between tumor cells and their surrounding environment [7,8,9,10,11,12,13,14,15]. These modeling approaches provide a basis for investigating tumor dynamics and their responses to treatment.
Chemotherapy models extend this framework by incorporating drug-dependent effects and treatment schedules. Tumor–drug models have been used to study chemotherapy dynamics and treatment design [16,17]. In parallel, chemotherapy dosing has been formulated as an optimal-control problem in which tumor suppression is balanced against treatment burden and physiological constraints [18]. Multi-objective optimization and parameter-identification techniques have also been applied to cancer treatment models [19,20], while related optimal-control formulations have been developed for more detailed tumor-growth systems [21,22,23].
A relevant starting point for the present work is the third-order tumor–drug model proposed by Siket et al. [24]. The model describes proliferating tumor cells, non-proliferating tumor cells, and drug concentration, and was studied together with state and parameter estimation methods, including Moving Horizon Estimation (MHE) and the Extended Kalman Filter (EKF). The estimation framework was evaluated using experimental data from mice treated with pegylated liposomal doxorubicin (PLD) [24,25]. Its state-space structure provides a basis for investigating model-based chemotherapy control because tumor and drug dynamics are represented within the same nonlinear model.
Czakó et al. [26] subsequently investigated chemotherapy optimization using an MHE-based Nonlinear Model Predictive Control (NMPC) framework. Their approach combined online state and parameter estimation with predictive optimization of drug administration and was evaluated in silico using a virtual population. The present study considers a complementary setting: the controller uses a fixed nominal prediction model without an online MHE step, while the simulated plant can follow different subject-specific parameter profiles. This setting allows us to examine how a phenomenological physiological-health constraint affects the simulated control outcomes when the controller does not update its prediction model to account for plant–model parameter mismatch. The study does not seek to reproduce or supersede the estimation-based framework of Czakó et al.; instead, it investigates the behavior and limitations of a different control configuration.
Tumor suppression alone is insufficient to characterize a treatment strategy when physiological tolerability is also considered. A dosing policy may reduce tumor volume while producing an undesirable change in the physiological condition represented by a model. In addition, predictive control depends on the model used to forecast future states. Differences between the nominal prediction model and the simulated plant can therefore affect control actions, tumor response, and satisfaction of a prescribed mathematical constraint. These considerations motivate the investigation of a predictive-control formulation that incorporates tumor response and a modeled physiological-health state within the same optimization problem.
In this work, the third-order model of Siket et al. [24] is extended by introducing a fourth state, , representing a normalized phenomenological physiological-health level. The resulting four-state model describes proliferating tumor cells , non-proliferating tumor cells , drug concentration , and physiological-health state . The additional state is introduced as a simplified representation of a treatment-related physiological response in the simulations and enables a lower-bound constraint to be incorporated explicitly into the NMPC optimization. The health dynamics and their parameters are not calibrated against clinical or preclinical toxicity data. Accordingly, is not a clinically validated toxicity biomarker, and the constraint is a simulation-defined modeling assumption rather than an established clinical toxicity threshold.
The principal methodological contribution is the integration of this fourth, phenomenological health state and its lower-bound constraint into an NMPC formulation based on the Siket tumor–drug model, followed by a simulation-based assessment across multiple parameter profiles and selected model-mismatch scenarios. The prediction model retains fixed nominal parameters, whereas the simulated plant follows one of eight subject-specific parameter profiles from the Siket parameter set. These profiles represent between-profile parameter variability in the simulations; they do not describe spatial, cellular, or intra-tumor heterogeneity. The analysis also includes a comparison with a dose-matched threshold-based strategy and examines the sensitivity of the simulated outcomes to selected health-model parameters and parameter perturbations. Unlike the MHE-based framework of Czakó et al. [26], the proposed controller does not perform online state or parameter estimation. The contribution should therefore be understood as a simulation-based investigation of this specific control formulation, rather than as evidence of superiority over estimation-based or other advanced chemotherapy-control methods.
Based on the four-state model, a multi-objective NMPC formulation is used to combine tumor suppression, preservation of the modeled physiological-health state, and control smoothness. The simulated health state is constrained by , and the drug administration rate is bounded. Treatment performance is evaluated using final tumor-volume reduction, minimum simulated health state, and cumulative drug exposure. Cumulative exposure is calculated a posteriori and is not directly included in the NMPC objective. Because the objective combines tumor and health terms with potentially different numerical scales across parameter profiles, the weighting parameter should not be interpreted as representing an identical efficacy–health trade-off for every profile.
The controller receives the complete simulated state vector at each sampling instant. No state estimator, measurement noise, or partial-observation mechanism is included. This idealized state-feedback assumption facilitates the investigation of the proposed optimization formulation but does not represent the state information that would necessarily be available in a clinical setting. Furthermore, the formulation does not impose a terminal cost or terminal constraint designed to establish closed-loop stability. Consequently, the numerical experiments do not provide a formal guarantee of closed-loop stability or recursive feasibility.
The numerical analysis considers eight subject-specific parameter profiles from the Siket parameter set, namely PLD1–PLD6, PLD8, and PLD9. It examines the effect of the efficacy–health weighting parameter , refines the weighting analysis using a finer grid, and investigates the empirical association between treatment response and the structural indicator . To reduce the influence of extreme tumor-growth values on the response analysis, the association is evaluated using both the conventional tumor-volume reduction metric and a bounded tumor-response metric. Correlations are reported for all eight profiles and for the subset excluding PLD1. These analyses are exploratory and do not establish a general predictive relationship between and treatment response.
NMPC is also compared with a threshold-based dosing strategy whose cumulative exposure is adjusted to approximately match that of NMPC at a reference weighting value. This strategy is used as a simple reference for comparison, rather than as a comprehensive benchmark against optimal-control, feedback-dosing, or other advanced methods from the chemotherapy-control literature. The health constraint is enforced during NMPC optimization but is not imposed during the optimization of the threshold-based comparator; its health trajectory is assessed retrospectively. The comparison therefore does not impose the same health-constraint conditions on both strategies, and its results must be interpreted in light of this asymmetry.
Model mismatch is examined through one-at-a-time perturbations of a, b, and n, together with a separate exploratory analysis of simultaneous perturbations involving tumor, pharmacological, and health-model parameters across the subject-specific profiles. The corresponding initial and final tumor volumes are considered alongside percentage reductions where needed to clarify the magnitude of the simulated response. The sensitivity of the phenomenological health-state extension is also investigated over selected combinations of and , together with alternative health thresholds. These experiments characterize the simulated behavior under the specified parameter variations; they do not constitute an exhaustive uncertainty analysis or establish general robustness to arbitrary parameter mismatch. In particular, constraint satisfaction in one set of perturbation experiments should not be interpreted as a guarantee of constraint satisfaction under other parameter configurations.
This study is presented as a simulation-based proof of concept. The physiological-health model and its lower bound are not clinically calibrated or validated, and the simulations do not establish clinical efficacy or clinical safety. The findings are limited to the selected virtual parameter profiles, modeling assumptions, and perturbation scenarios. They do not establish a general predictive relationship between and treatment response, nor do they guarantee satisfaction of the prescribed health constraint under arbitrary model mismatch. Further work is needed to calibrate the health model against clinical or preclinical toxicity measurements, investigate state estimation under incomplete and noisy observations, compare the controller with more advanced dosing strategies, and examine robustness, terminal ingredients, stability, and recursive feasibility before any clinical interpretation can be considered.
2. Mathematical Model and System Dynamics
The tumor–drug dynamics considered in this study are based on the third-order nonlinear carcinoma model proposed by Siket et al. [24]. The model describes the interaction between proliferating tumor cells, non-proliferating tumor cells, and the concentration of the chemotherapeutic drug. Its state-space formulation provides a basis for model-based treatment control by representing tumor and drug dynamics within a common nonlinear framework.
In this study, the original tumor–drug model is extended with a fourth state representing a normalized physiological-health state. This extension allows a prescribed health-state constraint to be included directly in the predictive-control optimization problem rather than evaluating the health trajectory only after treatment. The formulation combines tumor suppression, physiological-health preservation, and control-input regularization. Physiological and toxicity-related constraints have also been considered in previous chemotherapy optimal-control studies [18]. However, the health state introduced here is phenomenological and should not be interpreted as a clinically validated toxicity measure.
Let the state vector be defined as
where denotes the proliferating tumor-cell volume, the non-proliferating tumor-cell volume, the chemotherapeutic drug concentration in the host, and the normalized physiological-health state.
2.1. Baseline Carcinoma Model
Following Siket et al. [24], the tumor–drug dynamics are described by
Here, a is the intrinsic proliferation rate of the proliferating tumor-cell compartment, n is the transition rate from the proliferating to the non-proliferating compartment, b describes the drug-dependent effect on proliferating tumor cells, and w is the removal rate of the non-proliferating compartment. The parameter c governs nonlinear drug elimination, with determining the corresponding saturation constant. The parameter represents tumor-associated drug consumption, while denotes the drug concentration associated with a half-maximal drug effect. The input represents the drug administration rate. The saturating drug-dependent terms are retained from the original Siket formulation [24].
The total tumor volume is defined as
and is used as the primary output for evaluating the simulated treatment response.
The three-state tumor–drug subsystem is unchanged from the model of Siket et al. [24]. The physiological-health state introduced below augments this subsystem without modifying its original tumor–drug equations.
2.2. Physiological Health-State Extension
The original Siket model does not include an explicit physiological health state [24]. A fourth state, , is therefore introduced to represent a simplified treatment-related physiological response within the predictive-control framework. Its dynamics are defined as
where determines the recovery tendency toward the reference level of 100, and controls the concentration-dependent decrease in the health state. The first term represents recovery toward the reference level, whereas the second represents a drug-associated decrease in the modeled health state.
The state is defined on a normalized scale,
where represents the nominal reference state. This scale is a modeling convention; is not a directly measured clinical variable or a validated toxicity biomarker.
Equation (6) is an extension introduced in this study and is not part of the original Siket et al. model. The parameters and were selected for numerical exploration and were not estimated from clinical or experimental toxicity data. They must therefore be interpreted as phenomenological modeling choices, not clinically calibrated physiological parameters. Likewise, the lower bound is a prescribed constraint on the normalized model state; it is not a clinically validated toxicity threshold and does not establish clinical safety.
The sensitivity of the results to these modeling choices was examined using a full-factorial analysis with
A separate threshold analysis considered
while retaining the nominal values of and . The resulting tumor-control performance, minimum simulated health state, cumulative drug exposure, health-threshold violations, and optimization failures were recorded. These analyses assess sensitivity within the specified mathematical model; they do not calibrate the health equation against clinical toxicity outcomes.
2.3. Complete State-Space Representation
Combining the original tumor–drug subsystem with the physiological extension gives the four-state nonlinear model
The output used to evaluate tumor response is
The four-state model distinguishes the tumor-volume output V from the modeled physiological-health state . Both quantities enter the treatment-control design: tumor volume contributes to the therapeutic objective, while the health state contributes to the objective and is subject to a prescribed lower-bound constraint.
2.4. Health-Constrained NMPC Formulation
The controller is formulated as a finite-horizon nonlinear model predictive control (NMPC) problem. At each sampling instant k, the current state is used to predict the system evolution over a horizon of sampling intervals. The prediction model uses a fixed nominal parameter vector, whereas the simulated plant may evolve according to a different, subject-specific parameter set. This design makes it possible to examine the effect of parameter mismatch between the controller model and the simulated plant.
The decision variable is the sequence of future drug-administration inputs
For a given input sequence, the nominal model generates the predicted states for . The corresponding predicted tumor volume is
The finite-horizon objective combines a tumor-related term, a physiological-health term, and a control-regularization term. The tumor-related term is
where is the initial tumor volume for the subject profile under consideration. This normalization expresses predicted tumor volume relative to its initial value.
The physiological-health term is
This term penalizes deviations below the reference health state of 100 on the normalized scale.
To discourage abrupt changes in drug administration, a control-regularization term is included:
where denotes the input applied at the previous sampling instant.
The complete scalarized NMPC objective is
where determines the relative weighting of tumor suppression and physiological-health preservation, and weights the control-regularization term. Unless otherwise specified, .
Although and are dimensionless, their numerical magnitudes and variations need not be comparable across subject profiles. In particular, normalization by does not remove differences in tumor-growth dynamics or in the range of predicted relative tumor volumes. Consequently, a fixed value of does not necessarily represent an identical effective trade-off between tumor suppression and health-state preservation for every profile. The results are therefore interpreted for the stated objective and weighting choices rather than as evidence of a universally calibrated trade-off.
The optimization is subject to the nonlinear state dynamics and the following input and health-state constraints:
and
For and , the finite-horizon problem is
where denotes the state-transition model defined by Equation (10), and is the fixed nominal parameter vector. The dynamics constraints apply for , while the health-state constraint is imposed at each predicted state, including the terminal prediction state.
The nominal parameter vector used by the controller corresponds to the nominal parameter set reported by Siket et al. [24]. In the parameter ordering , it is
This parameter vector remains fixed in the NMPC prediction model throughout the simulations. The simulated plant, however, evolves according to the corresponding subject-specific parameter profile reported by Siket et al. [24]. The controller therefore does not update its prediction parameters to match each simulated profile. This distinction is central to the parametric model-mismatch experiments.
Only the first element of the optimized input sequence is applied at each sampling instant. The state is then updated, and the optimization is solved again using the state available at the next sampling instant. This receding-horizon procedure is repeated throughout the 50-day simulation.
Cumulative drug exposure is evaluated separately from the NMPC objective as an a posteriori performance metric:
where D denotes the total amount of drug administered over the simulation horizon. Cumulative exposure is not directly minimized in the objective in Equation (20); instead, it is used in the subsequent comparison of treatment strategies at approximately matched cumulative drug exposure.
The implementation assumes that the complete simulated state vector,
is available to the controller at each sampling instant. This is an ideal full-state-feedback assumption. No state estimator or measurement-noise model is included in the present implementation. In particular, is available to the controller as a simulated state, although it is not assumed to be directly measurable in clinical practice. The results therefore do not quantify the effects of partial observability, measurement noise, or state-estimation errors on the health constraint.
Finally, the finite-horizon formulation does not by itself establish closed-loop stability or recursive feasibility. No terminal cost or terminal constraint is included, and no formal stability guarantee is claimed. In addition, satisfaction of the health constraint along the nominal predicted trajectory does not guarantee satisfaction of the same bound by the simulated plant when the prediction model and plant parameters differ. Feasibility and health-threshold satisfaction must therefore be assessed empirically for the specified simulations, and the reported results should be interpreted as a simulation-based evaluation of the proposed formulation rather than as a guarantee of clinical safety or reliable patient-specific dosing.
3. Numerical Simulation Setup and Experimental Protocol
Numerical simulations were conducted using a virtual cohort comprising subject-specific tumor–drug parameter profiles. The experiments examined the influence of the objective-weighting parameter, variability in treatment response across profiles, comparison with a conventional dosing strategy at approximately matched cumulative drug exposure, and sensitivity to parametric model mismatch. Additional analyses examined the sensitivity of the phenomenological health-state model and the effects of joint parameter perturbations.
3.1. Virtual Population and Subject-Specific Profiles
Eight parameter profiles reported by Siket et al. [24], namely PLD1–PLD6, PLD8, and PLD9, were included in the simulations. PLD7 was not included in the selected profile set. The tumor–drug parameters and initial proliferating tumor volumes were taken from the corresponding profiles. The additional physiological parameters and were fixed across profiles unless explicitly varied in the sensitivity analyses.
These profiles represent between-profile parameter variability in a virtual population. They do not represent spatial heterogeneity within a tumor or variability among individual tumor cells.
The structural indicator
was calculated for each profile to provide a compact parameter-based descriptor for exploratory comparison with treatment response. Because the drug-mediated effect also depends on the drug concentration, should not be interpreted as the actual net tumor-growth rate or as a direct clinical measure of tumor aggressiveness. Its association with simulated treatment response is assessed descriptively across the eight profiles.
Table 1 summarizes the parameter values used in the simulations. For each profile, the initial proliferating tumor volume was taken from the corresponding profile, while , , and were used for all profiles.
Table 1.
Subject-specific PLD parameter profiles used in the numerical simulations. The parameters a, b, n, and w, as well as , are expressed in day−1; c in drug-concentration units per day; and in drug-concentration units; and in units consistent with the tumor-associated drug-consumption term. The numerical values correspond to the subject-specific profiles reported by Siket et al. [24].
All time-related quantities are expressed in days. The tumor states and are expressed in tumor-volume units, and in drug-concentration units. Accordingly, the drug-administration rate u is expressed in drug-concentration units per day, and cumulative drug exposure D in drug-concentration units. The physiological health state is dimensionless and defined on a normalized 0–100 scale. The parameters a, b, n, and w, as well as , have units of day−1. The parameter c has units of drug-concentration units per day, while and have units of drug concentration. The units of are determined by the tumor-associated drug-consumption term in Equation (4). The parameter has units of day−1, whereas has units of (drug-concentration unit)−1day−1.
3.2. NMPC Controller Parameters and Simulation Environment
All simulations covered a total horizon of days. The control input was updated at intervals of
resulting in 50 control actions over the simulation horizon. Between consecutive control instants, the nonlinear state equations were integrated using a fourth-order Runge–Kutta (RK4) method with a time step of day.
The prediction horizon was set to
corresponding to five days ahead. The drug-administration rate was constrained by
The NMPC prediction model imposed the normalized health-state constraint
This is a prescribed mathematical constraint on the simulated health state and is not a clinically validated toxicity threshold.
The NMPC prediction model used the fixed nominal parameter vector defined in Equation (21). In the subject-specific experiments, the simulated plant instead evolved according to the corresponding subject-specific parameter profile. Thus, the controller and simulated plant were not necessarily described by the same parameter vector.
For the subject-specific simulations, the initial state was
where was taken from the corresponding profile and , , and for all profiles.
The nominal physiological parameters were
These parameters were treated as phenomenological choices and were not estimated from clinical toxicity data. They were held fixed across the subject-specific profiles so that differences in simulated responses would primarily reflect differences in the tumor–drug parameters reported by Siket et al. [24]. The threshold was likewise used as a prescribed modeling criterion on the normalized 0–100 scale; it does not represent a clinically calibrated toxicity cutoff.
3.3. Experimental Simulation Protocol
The computational study comprised four main protocols, supplemented by sensitivity analyses of the health-state model and joint parameter-mismatch experiments. In the subject-specific simulations, the NMPC prediction model retained the fixed nominal parameter vector, whereas the simulated plant followed the corresponding subject-specific or perturbed parameter vector.
3.3.1. Protocol 1: Coarse Weighting Analysis
The first experiment examined the eight profiles for
For each combination of and profile, the final tumor volume, relative tumor-volume reduction, minimum simulated health state, and cumulative drug exposure were recorded. The conventional percentage tumor-volume reduction is defined as
where . Cumulative drug exposure was evaluated a posteriori using Equation (22).
This experiment examined how the weighting parameter affects the simulated closed-loop response across profiles.
To reduce the influence of extreme simulated tumor progression on plots and descriptive correlation analyses, a bounded tumor-response score was also calculated:
where and are the initial and final tumor volumes. The score is bounded between and 100. Positive values indicate tumor-volume reduction, while negative values indicate tumor progression. Unlike , this score limits the magnitude of extreme negative responses. It is a post-processing metric and does not change the model or the simulated trajectories. The conventional percentage reduction is retained when reporting the magnitude of tumor-volume changes.
3.3.2. Protocol 2: Fine-Grid Efficacy–Health-State Analysis
The second experiment examined the weighting parameter on a finer grid:
For each profile, tumor-volume reduction, minimum simulated health state, and cumulative drug exposure were recorded across the grid. The largest tested value of for which the minimum simulated health state remained at or above the prescribed threshold is denoted by . Since this value is selected from a finite grid, it is the largest tested value satisfying the constraint, not an exact critical threshold. Here, admissibility refers only to satisfaction of the prescribed mathematical constraint in the simulated trajectory and does not imply clinical safety.
The relationship between and treatment response was examined descriptively across the eight profiles. This analysis is a finite-grid efficacy–health-state assessment, not a computation of a continuous Pareto front.
At , the conventional tumor-volume reduction for PLD1 is approximately , whereas its bounded score is approximately . The discrepancy arises because the final simulated tumor volume is much larger than the initial volume, while the conventional percentage reduction is normalized by the initial volume alone. The bounded score limits the numerical magnitude used for visualization and correlation analysis without altering the simulated progression.
PLD1 is therefore treated as an influential profile with an extreme simulated response, rather than being classified as an invalid parameter set. The simulations do not establish whether its parameters are biologically implausible. The model does not include a clinically calibrated carrying-capacity term, so the extreme progression should not be interpreted as a clinically realistic prediction of tumor growth. The small number of profiles and the influence of PLD1 also limit the generalizability of the observed association between and treatment response.
3.3.3. Protocol 3: Dose-Matched Benchmark Comparison
The third experiment compared the NMPC strategy with a simple threshold-based reference dosing rule. The comparator applies a constant administration rate whenever the total tumor volume is at least its initial value, and otherwise sets the input to zero:
This rule defines a continuous, piecewise-constant administration rate; it does not represent bolus dosing.
For each profile, was selected from the candidate grid
by minimizing the absolute difference between cumulative exposure under the comparator and under NMPC at . The selection was performed separately for each profile.
The strategies were compared in terms of final tumor-volume reduction, minimum simulated health state, and cumulative drug exposure. The comparison therefore concerns treatment response at approximately matched cumulative exposure, not identical dosing schedules.
The health lower-bound constraint is enforced within the NMPC optimization problem but is not imposed during operation of the threshold-based comparator. The comparator’s health trajectory is evaluated retrospectively. Consequently, the two strategies are not compared under identical health-constraint conditions. The simple threshold rule provides a reference for comparison; it is not intended to represent a comprehensive benchmark against optimal-control methods or more advanced feedback-dosing strategies.
3.3.4. Protocol 4: Parametric Model-Mismatch Analysis
The fourth experiment examined the effect of differences between the parameters of the simulated plant and those used by the NMPC prediction model.
In the one-at-a-time analysis, the prediction model retained the nominal parameter vector while one plant parameter at a time was perturbed. The parameters a, b, and n were varied by , , , , and relative to their nominal values. The initial state for this experiment was
which was fixed across perturbation cases.
For each case, the final tumor-volume reduction, minimum simulated health state, and cumulative drug exposure were recorded. The analysis therefore examined both changes in treatment response and whether the simulated health state remained above the prescribed lower bound. Satisfaction of the bound in these one-at-a-time cases is not a general guarantee under arbitrary parameter uncertainty.
A complementary exploratory joint-perturbation analysis was also performed across the eight profiles. In these experiments, the plant parameters a, b, n, c, , , and were perturbed simultaneously and independently: each was multiplied by a factor sampled uniformly from relative to its profile-specific value, and was sampled uniformly from , while the NMPC prediction model retained its nominal parameters. The sampling used a fixed random seed (20261012) for reproducibility. For each profile, the analysis comprised one reference run, using the profile-specific parameters and the nominal value , and three perturbed runs, for 32 evaluations in total. The resulting health-threshold violations and optimization difficulties were recorded. This limited exploratory study is not a Monte Carlo analysis and does not establish robust constraint satisfaction over a defined uncertainty distribution.
In addition to the parameter-mismatch experiments, a separate sensitivity analysis examined the health-model parameters and and the prescribed health threshold. A full-factorial combination of and was evaluated across the eight profiles. The threshold analysis considered while retaining the nominal health-model parameters. The resulting tumor-control performance, minimum simulated health state, cumulative exposure, threshold violations, and optimization failures were recorded. These analyses assess the sensitivity of the simulation results to the specified modeling choices; they do not provide clinical calibration or validation of the health-state model.
The results of the simulation protocols and complementary sensitivity analyses are presented in Section 4.
4. Results
4.1. Structural Indicator and Treatment Response
The subject-specific parameter combinations were examined using the structural indicator , defined in Equation (23). To complement the conventional relative tumor-volume reduction, we also considered a bounded tumor-response metric:
where and denote the initial and final total tumor volumes, respectively. For positive tumor volumes, this metric is bounded between and , thereby reducing the influence of extreme tumor progression on the response scale.
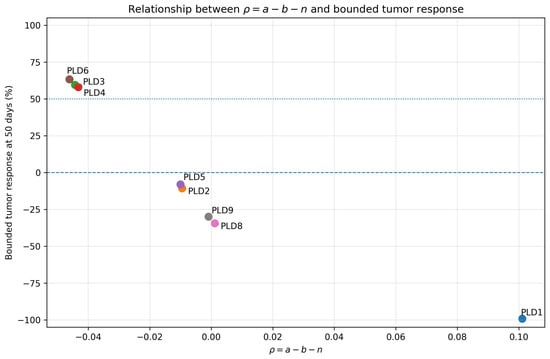
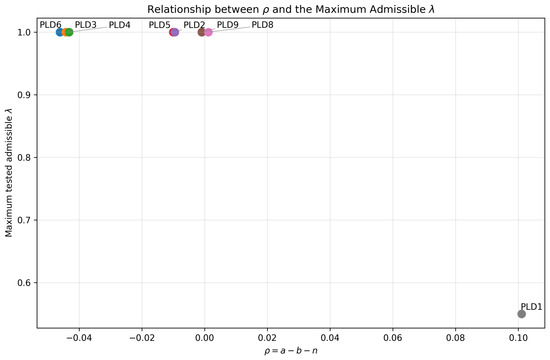
Figure 1 illustrates an inverse association between and the bounded tumor-response metric at . Using the conventional percentage-reduction metric, the Pearson correlation between and tumor-volume reduction is approximately across all eight profiles and when PLD1 is excluded. Using the bounded metric , the corresponding coefficients are approximately and , respectively. These coefficients describe the association observed in this particular set of simulated profiles; they do not establish a general predictive relationship.
Figure 1.
Relationship between the structural dynamic indicator and the bounded tumor-response metric at .
For PLD1, the final tumor volume substantially exceeds the initial volume, producing an extremely negative value of the conventional relative tumor-volume reduction. The bounded metric limits the magnitude of this response and facilitates comparisons across profiles. However, the change in the correlation after excluding PLD1 demonstrates the influence that a single profile can have in a dataset containing only eight observations.
Within the considered virtual population, provides a compact structural descriptor associated with differences in simulated treatment response and control difficulty. The eight profiles represent between-profile parameter variability rather than spatial or intratumoral heterogeneity. Given the small number of profiles and the influence of PLD1, the observed association should be regarded as descriptive and hypothesis-generating, not as a validated predictor of treatment response or a clinical response indicator.
4.2. Fine-Grid Efficacy–Health Analysis
The second experiment refined the weighting analysis using the grid
allowing a more detailed examination of the effect of and of the largest tested admissible value, , for each profile. Here, admissibility means that the prescribed health lower bound was satisfied in the corresponding nominal simulation. It does not imply clinical safety or guarantee constraint satisfaction under parameter mismatch.
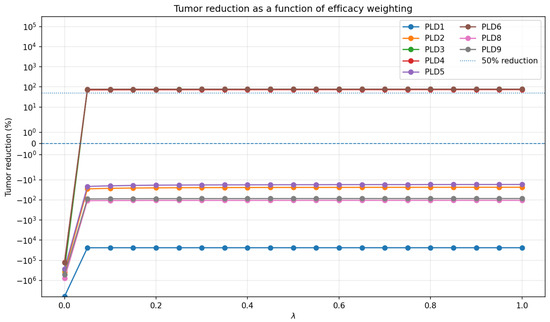
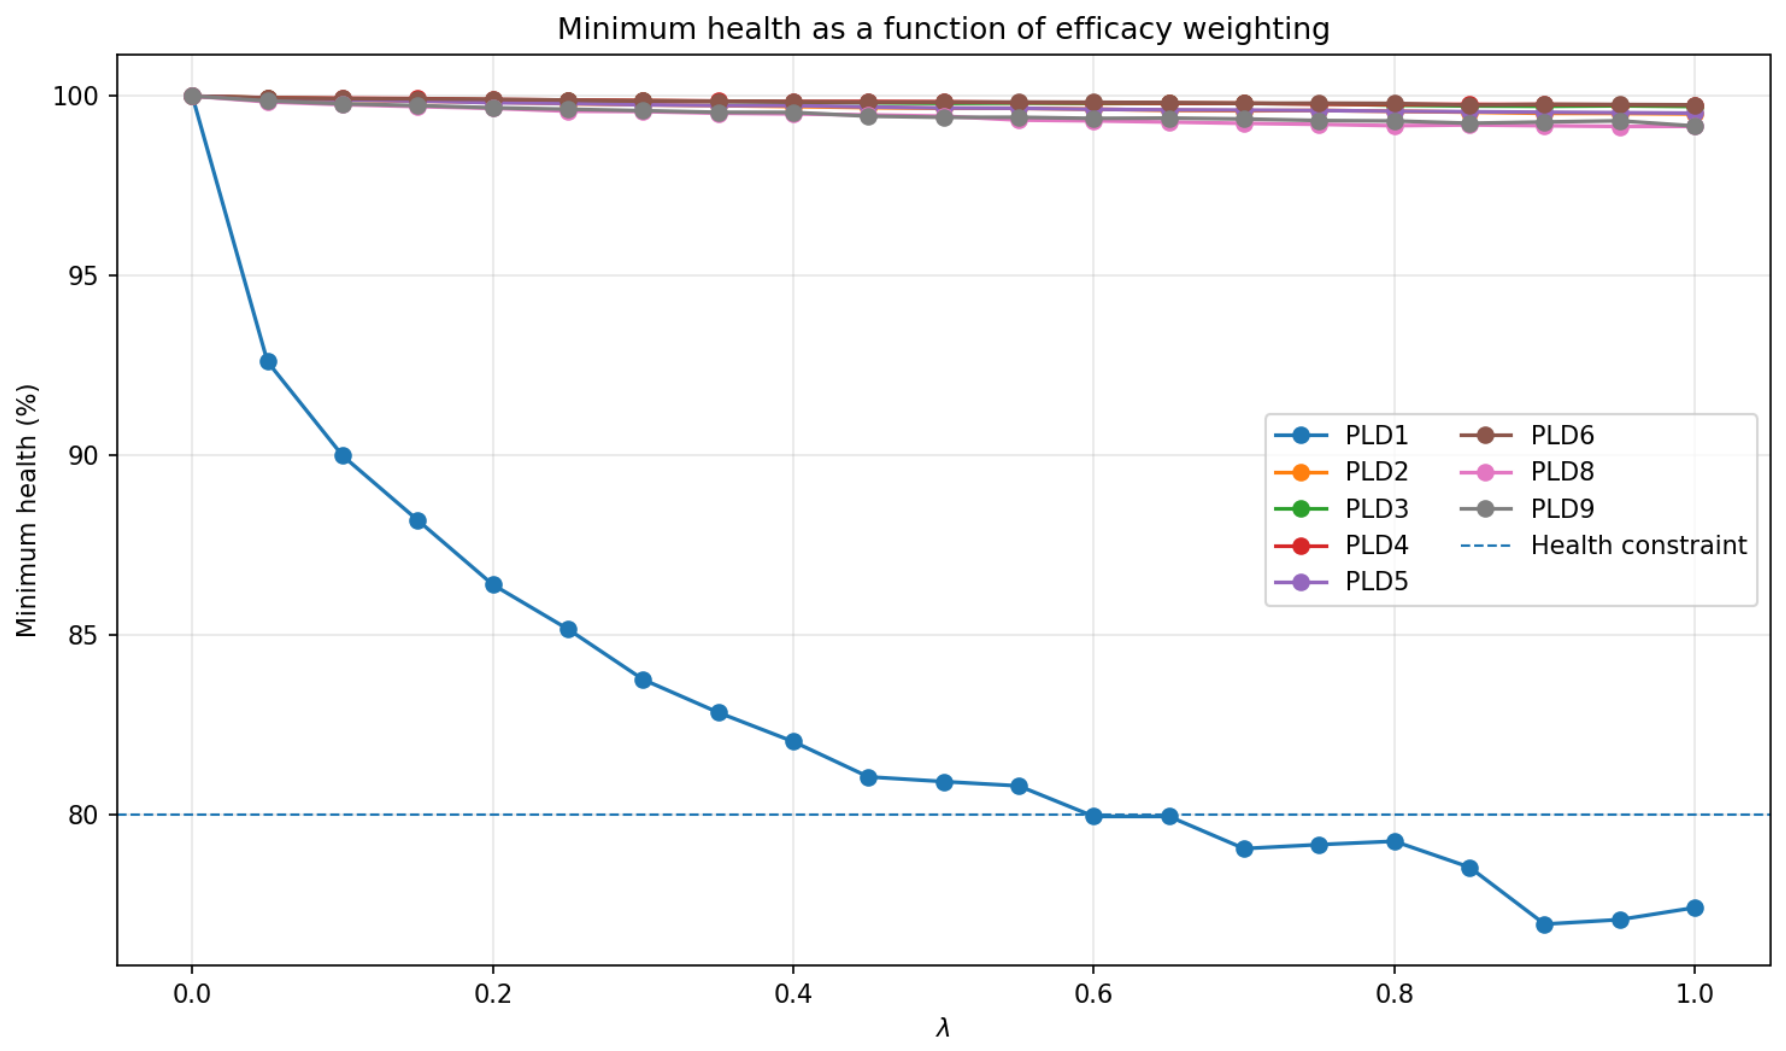
Figure 2 and Figure 3 show that the simulated efficacy–health response depends on the profile and the selected weighting parameter. For PLD3, PLD4, and PLD6, substantial tumor suppression is achieved over a broad range of , with limited additional improvement as approaches its largest tested values. In contrast, PLD1 exhibits a different response pattern: increasing the emphasis on tumor suppression is associated with more aggressive control actions and a decline in the minimum simulated health state.
Figure 2.
Tumor-volume reduction as a function of the efficacy weighting parameter on the fine grid . The vertical axis uses a symmetric logarithmic scale to accommodate the wide range of simulated tumor responses.
Figure 3.
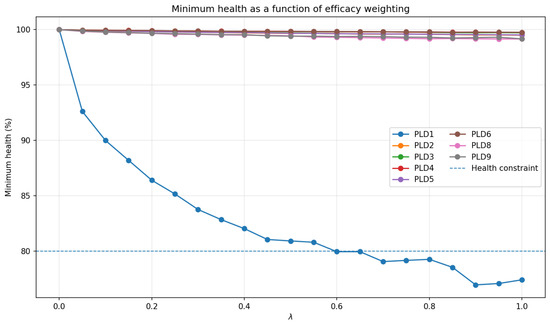
Minimum simulated physiological-health state as a function of on the fine weighting grid. The prescribed health lower bound used in the NMPC optimization is .
On the fine grid, PLD1 has , whereas the other seven profiles remain admissible up to . Because these values are selected from a finite grid, they represent the largest tested admissible values, not exact critical thresholds. This result applies only to the tested nominal simulation conditions and does not establish admissibility under parameter mismatch or other untested conditions.
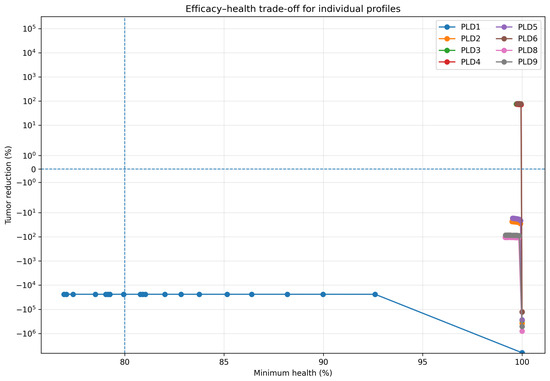
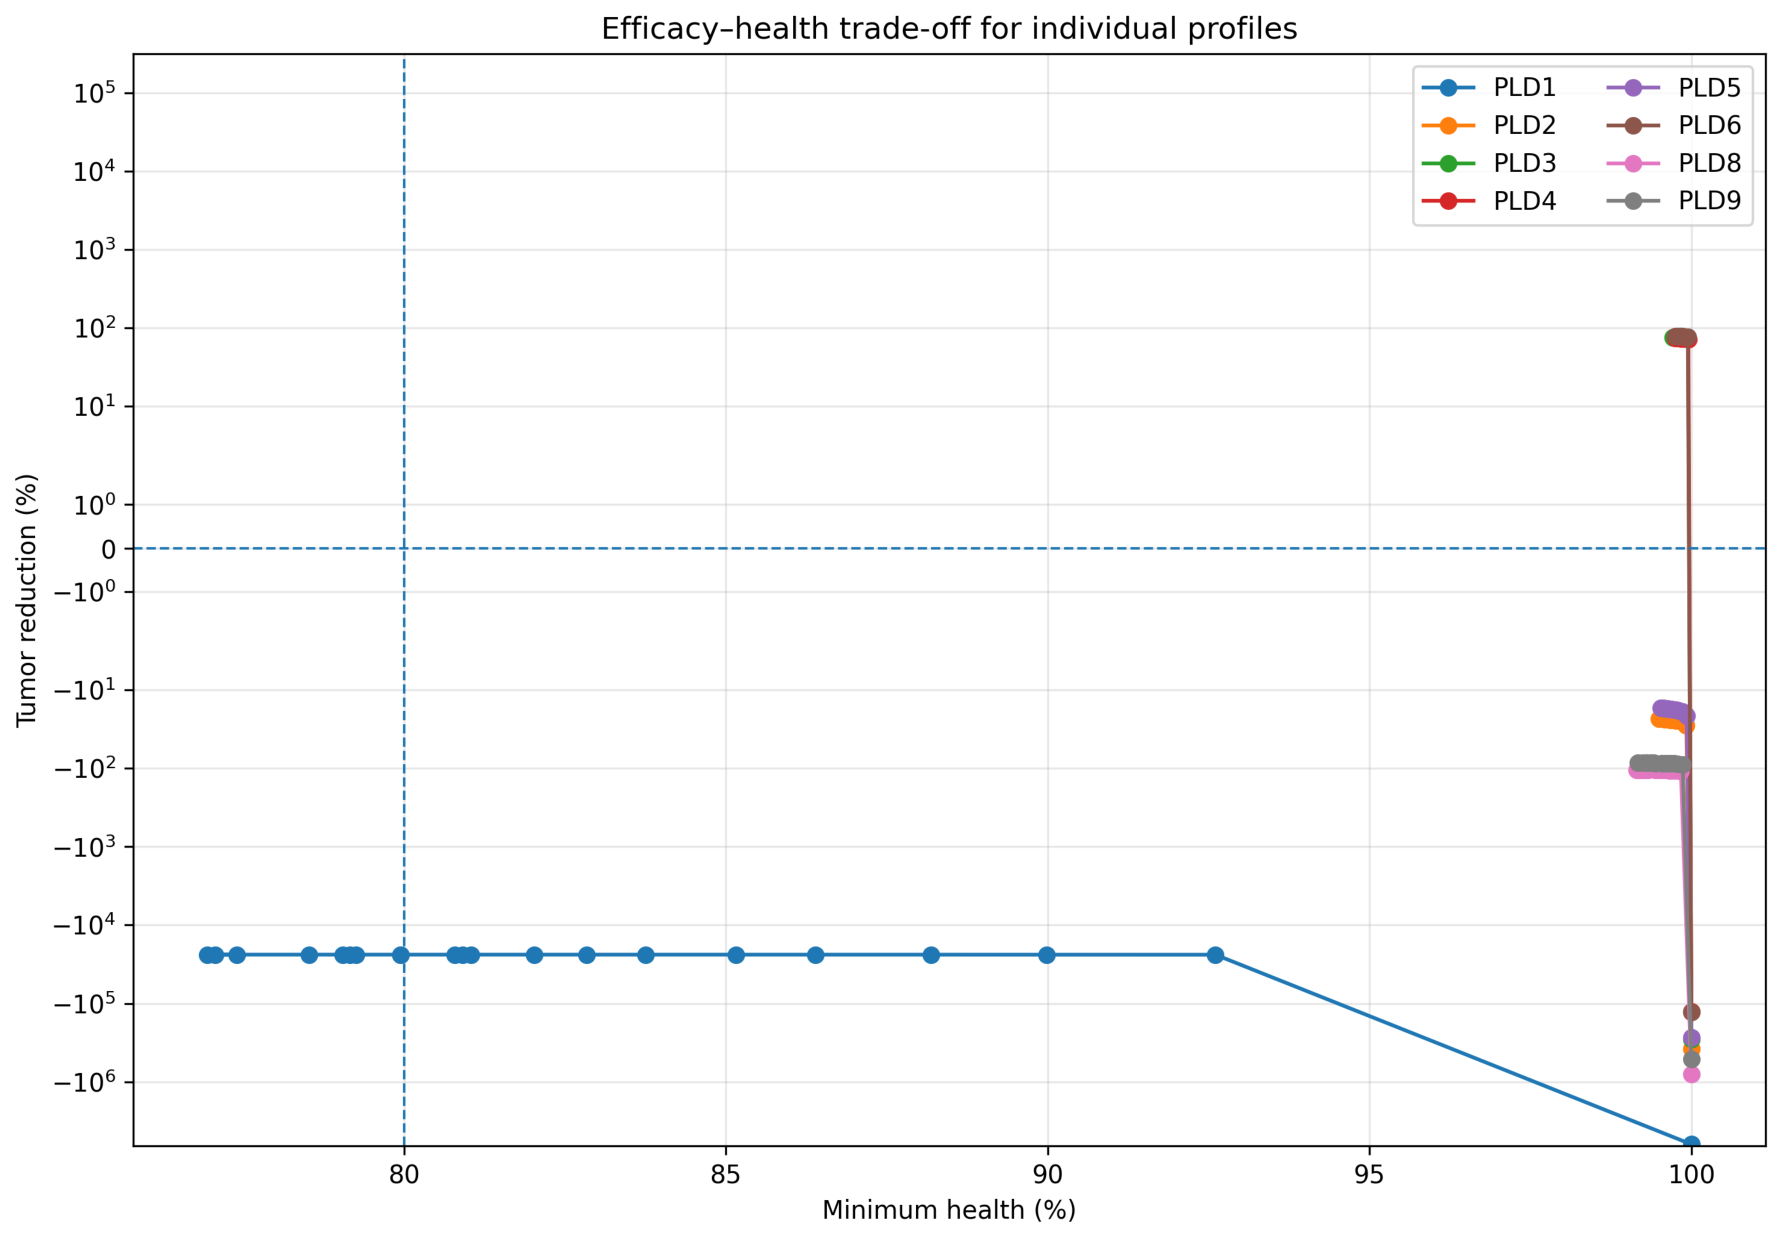
Figure 4 further illustrates the profile-dependent treatment response. Some profiles achieve substantial tumor reduction while maintaining relatively high minimum simulated health values, whereas other profiles show limited tumor control despite treatment exposure. The figure illustrates the simulated efficacy–health trade-off; it does not establish a common response curve or a clinically validated relationship.
Figure 4.
Trade-off between final tumor-volume reduction and minimum simulated physiological-health state across the tested profiles and weighting values. The tumor-reduction axis uses a symmetric logarithmic scale.
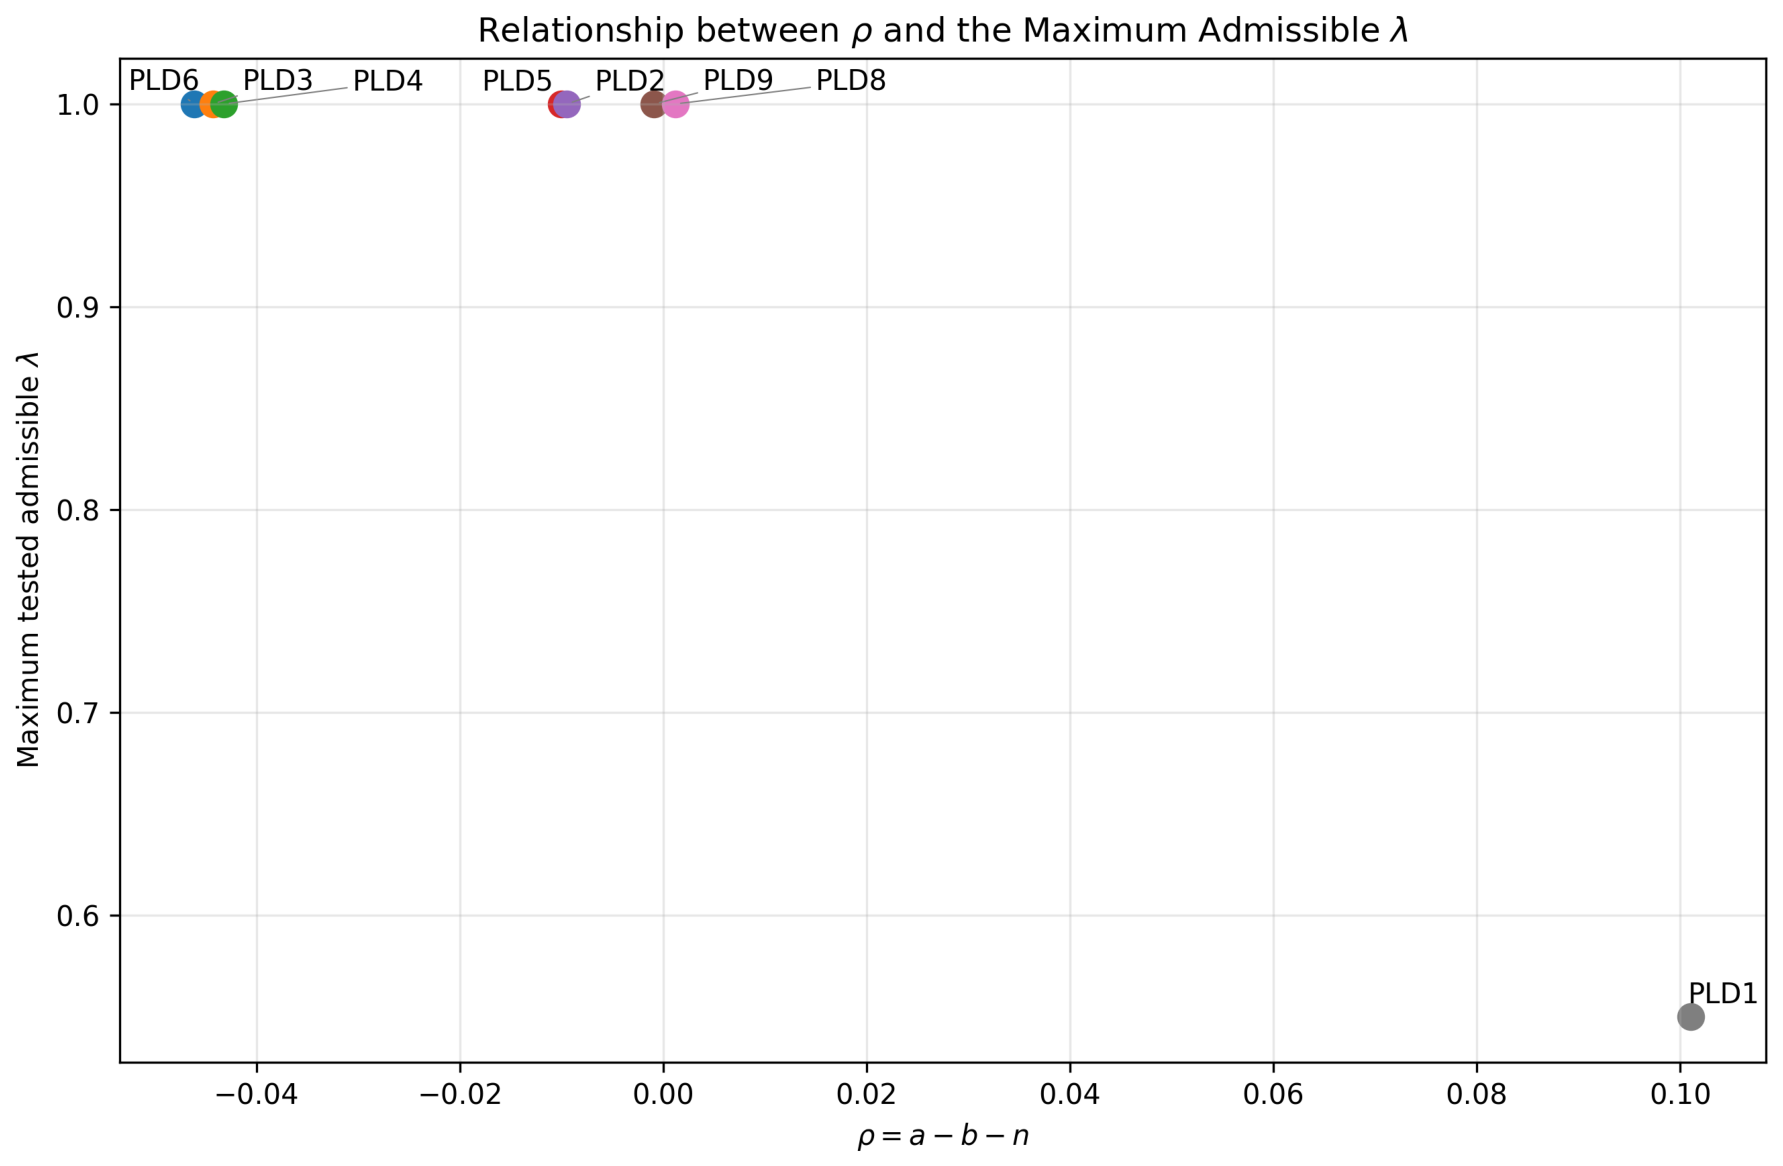
Figure 5 shows that PLD1 combines the largest positive value in the set with the smallest tested admissible value, . The other profiles remain admissible over the tested range up to . This identifies PLD1 as a limiting profile under the nominal simulation conditions, but it does not establish a general deterministic relationship between and .
Figure 5.
Structural dynamic indicator versus the largest tested admissible weighting value .
4.3. Dose-Matched Benchmark Comparison
The third experiment compares the proposed NMPC strategy with a conventional threshold-based dosing rule under approximately matched cumulative drug exposure. For each profile, the amplitude of the conventional protocol was selected using a discrete grid search to make its cumulative exposure as close as possible to that of the NMPC controller at .
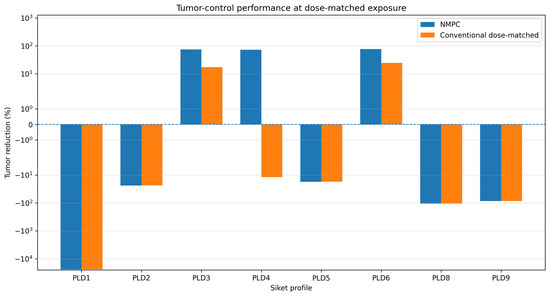
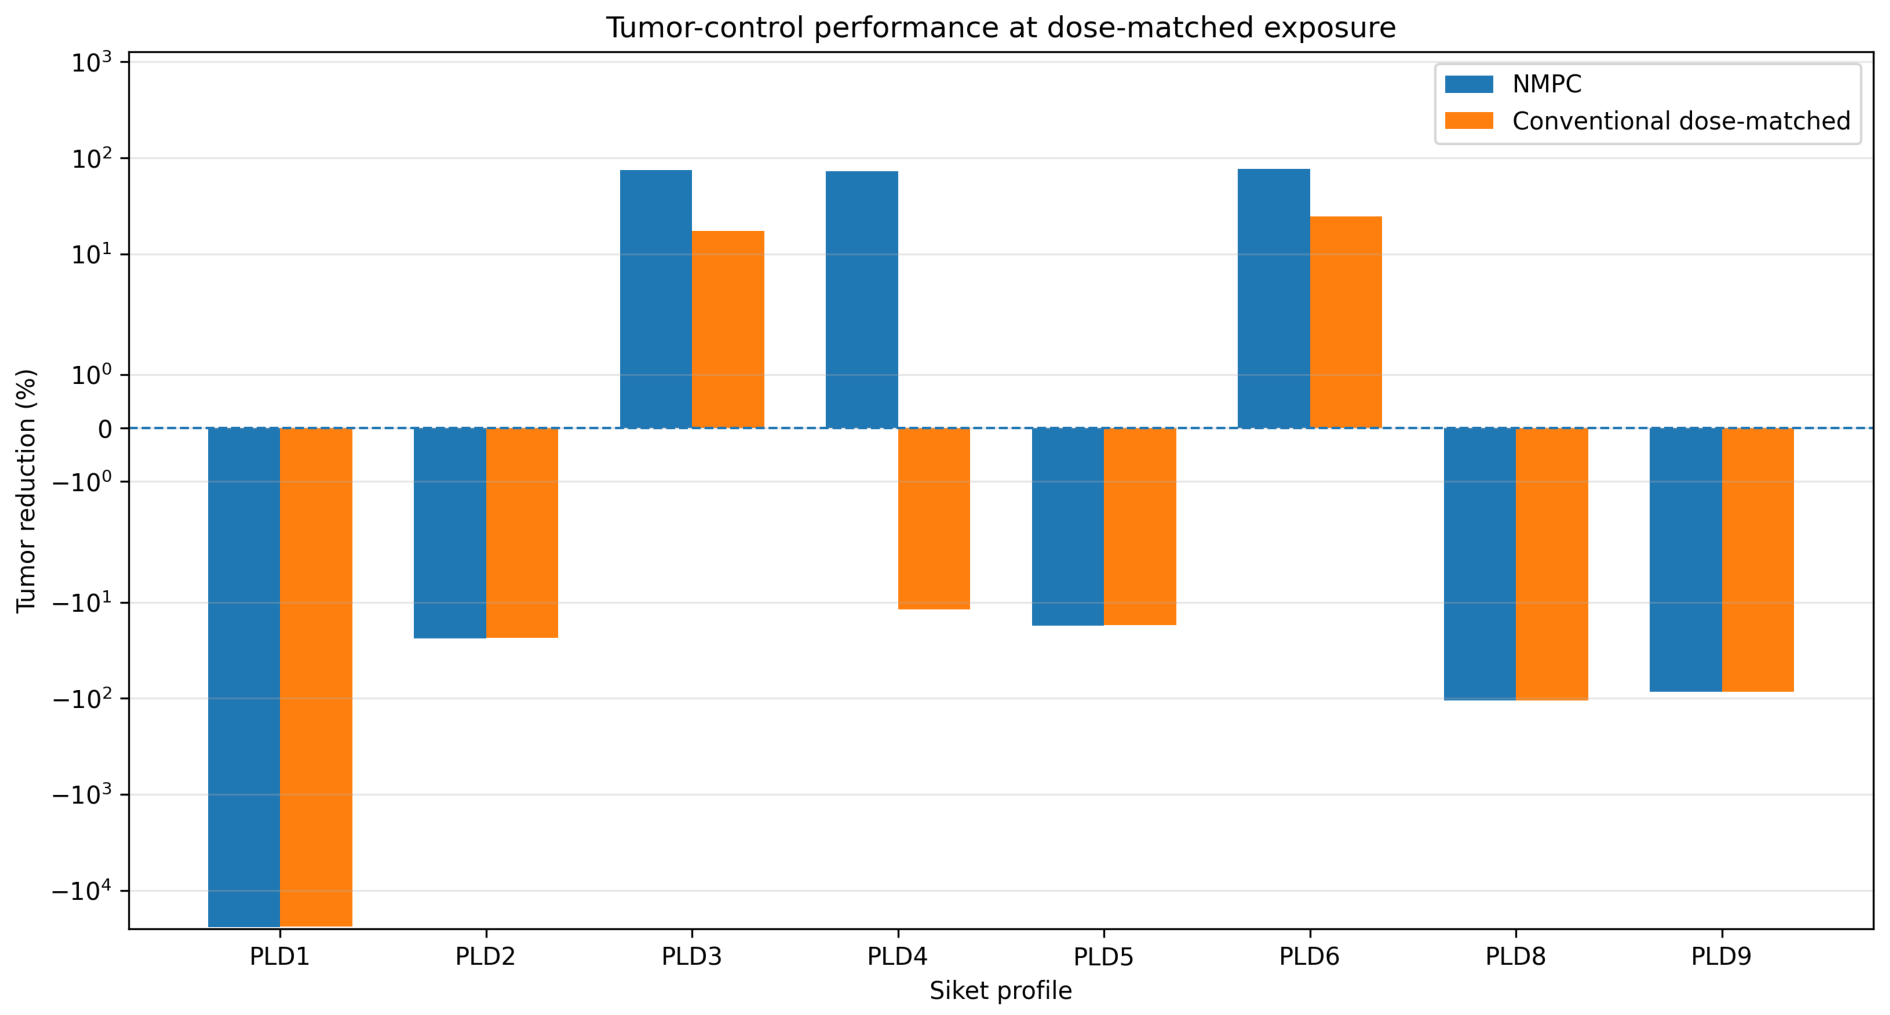
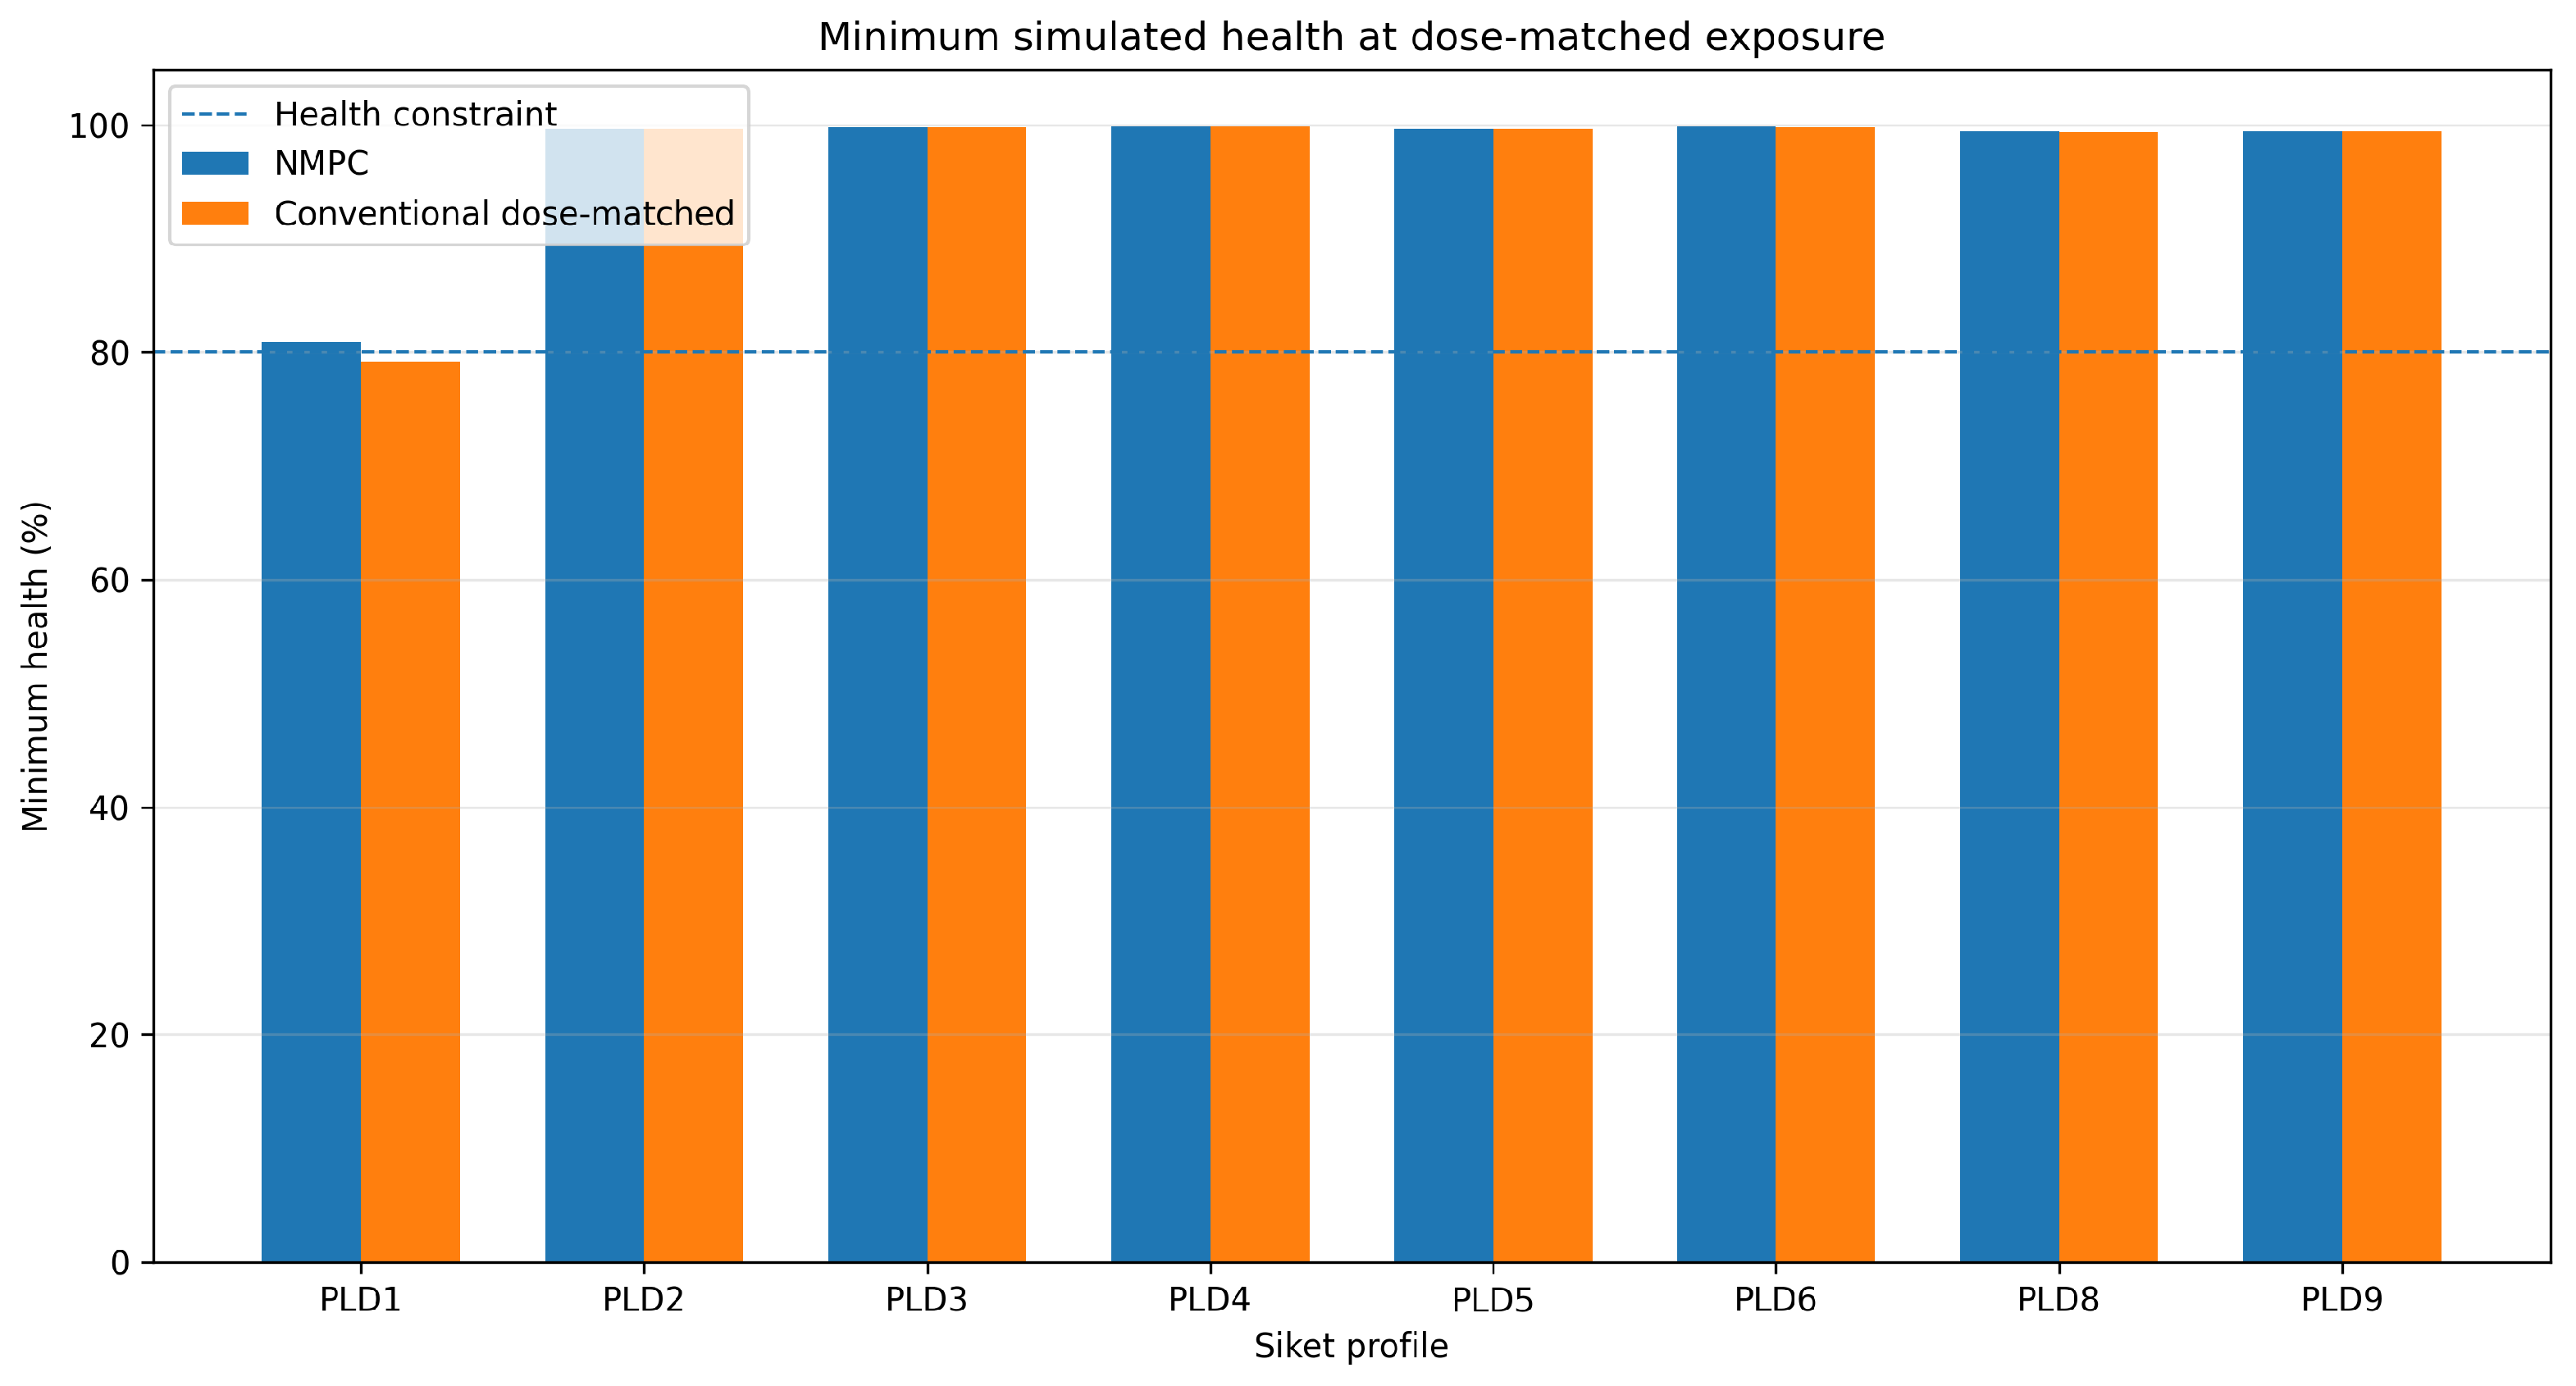
Figure 6 and Figure 7 show that the relative performance of the two strategies depends strongly on the simulated subject-specific tumor–drug dynamics.
Figure 6.
Comparison of final tumor-volume reduction between NMPC and the conventional threshold-based strategy under approximately matched cumulative drug exposure. The vertical axis uses a symmetric logarithmic scale to accommodate the extreme PLD1 response.
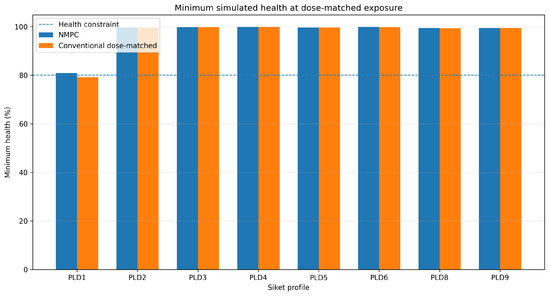
Figure 7.
Comparison of minimum simulated physiological-health state between NMPC and the conventional threshold-based strategy under approximately matched cumulative drug exposure.
For PLD3, PLD4, and PLD6, NMPC achieved tumor-volume reductions of , , and , respectively, compared with , , and for the threshold-based strategy. The corresponding differences were approximately , , and percentage points.
For PLD2, PLD5, PLD8, and PLD9, both strategies produced poor tumor control despite approximately matched cumulative exposure. Thus, predictive control did not consistently compensate for unfavorable tumor–drug dynamics in these simulated cases.
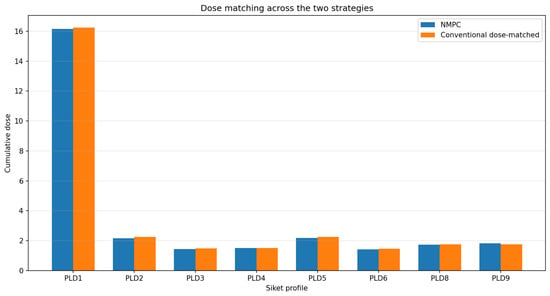
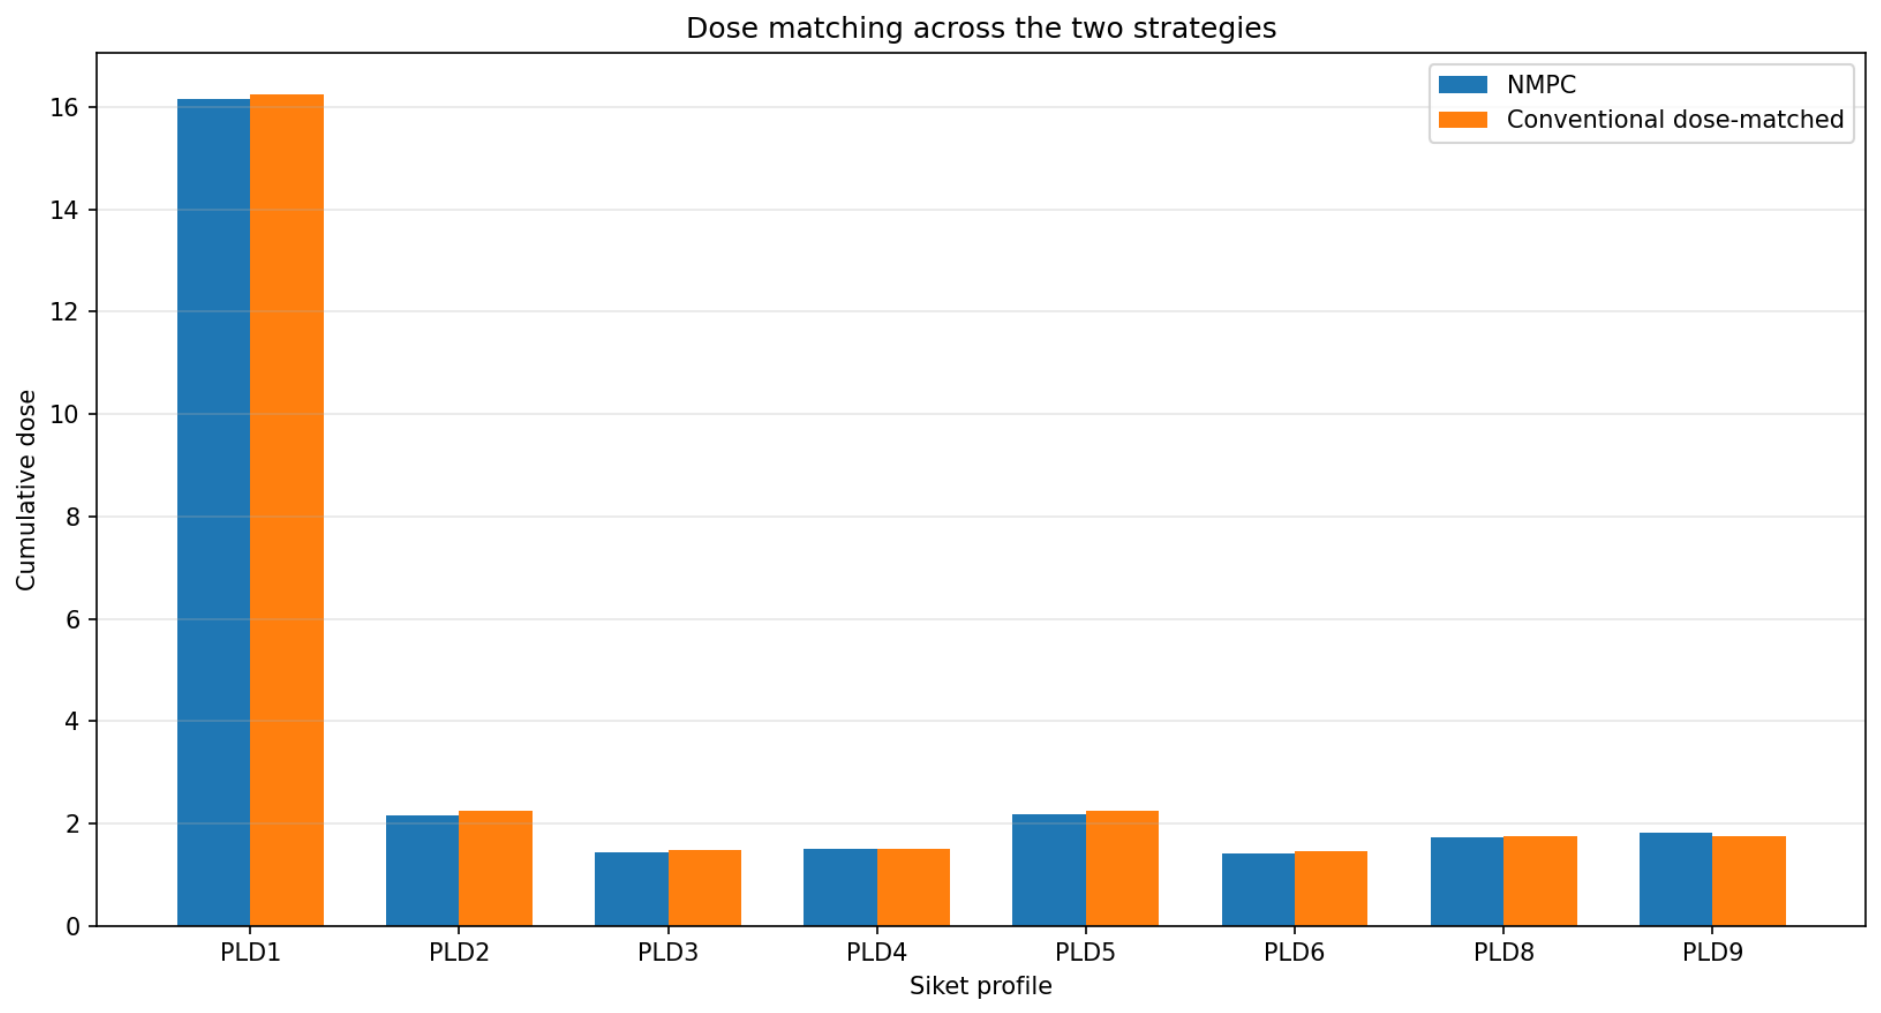
Figure 8 shows that the two strategies were compared at closely matched cumulative exposure. Residual differences arise from the discrete grid used to select . For PLD1, NMPC maintained the minimum simulated health state above the prescribed lower bound, with a minimum value of , whereas the dose-matched conventional strategy reached approximately .
Figure 8.
Cumulative drug exposure obtained with NMPC and the conventional threshold-based strategy after profile-specific dose matching.
This comparison requires an important qualification. The health lower-bound constraint is enforced within the NMPC optimization problem but is not imposed when selecting or applying the threshold-based comparator. The comparator’s health trajectory is evaluated retrospectively after simulation. Consequently, the strategies are compared at approximately matched cumulative exposure, but not under identical health-constraint conditions.
The threshold-based comparator was selected as a simple reference strategy to provide a transparent baseline for comparison. It is not an optimized conventional controller, nor does it represent a comparison with other advanced dosing strategies. The results therefore do not establish general superiority of NMPC over alternative control approaches.
Overall, the dose-matched benchmark suggests that the proposed NMPC strategy can exploit favorable tumor–drug dynamics more effectively than the tested threshold-based rule for some profiles. This advantage is not consistent across all profiles and is limited to the assumptions and scenarios considered.
4.4. Parametric Model-Mismatch Analysis
The fourth experiment evaluates controller sensitivity to parametric mismatch between the prediction model and the simulated tumor–drug dynamics. The prediction model retains its nominal parameters, while one of the parameters a, b, or n in the simulated plant is perturbed independently by , , , , or . This yields 15 one-at-a-time (OAT) cases. The initial state and all other model and controller settings remain unchanged.
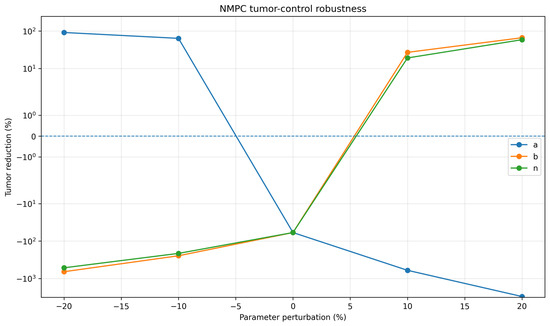
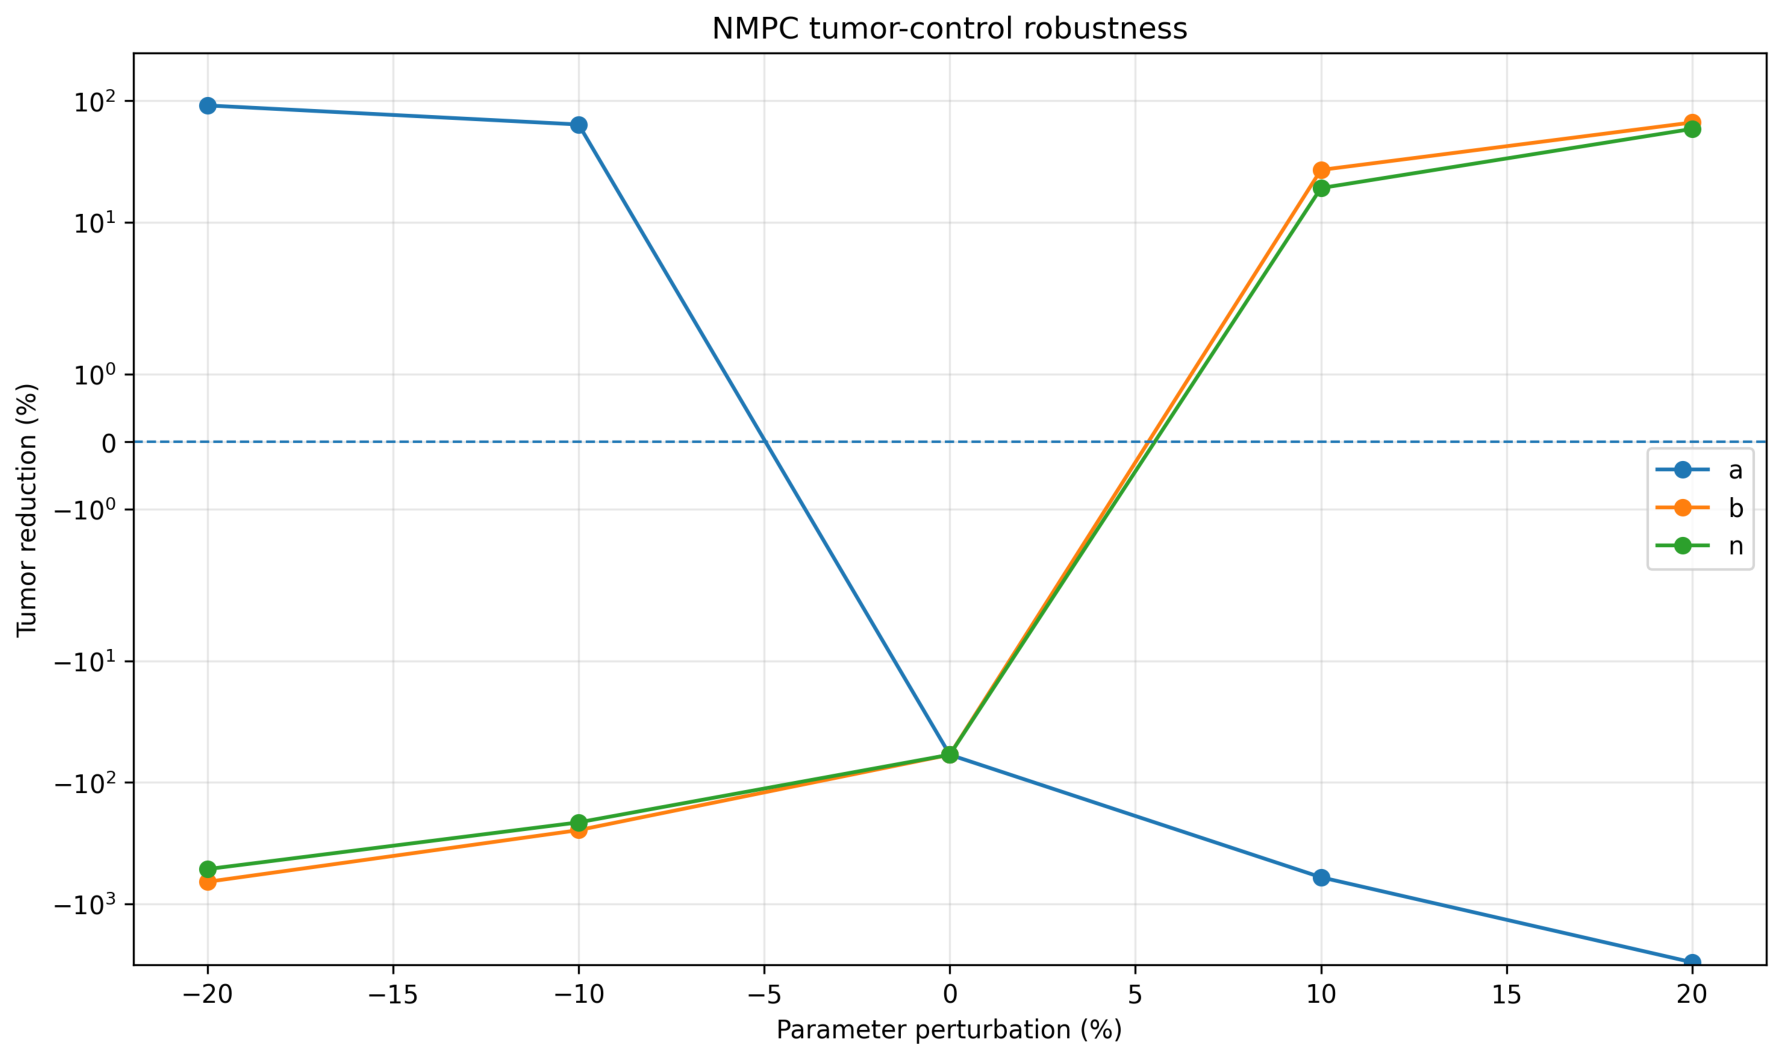
Figure 9 shows that tumor-control performance is highly sensitive to the tested parameter mismatch. For parameter a, tumor-volume reduction ranges from at to at , with a value of at the nominal parameter value. With an initial total tumor volume , these correspond to final volumes of approximately at , at the nominal value, and at . For parameter b, the reduction ranges from at to at . For parameter n, it ranges from at to at . These results indicate that moderate changes in the selected tumor–drug parameters can lead to markedly different simulated treatment outcomes.
Figure 9.
Tumor-volume reduction after 50 days under independent perturbations of a, b, and n from to . The NMPC prediction model retains its nominal parameters. The vertical axis uses a symmetric logarithmic scale to accommodate the wide range of simulated responses.
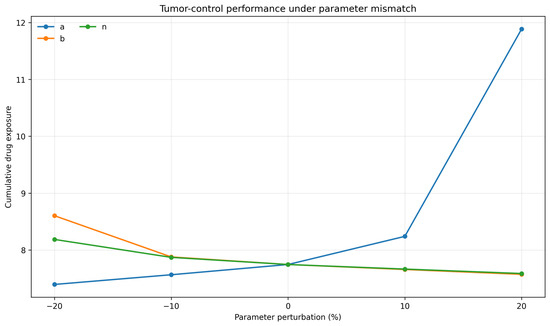
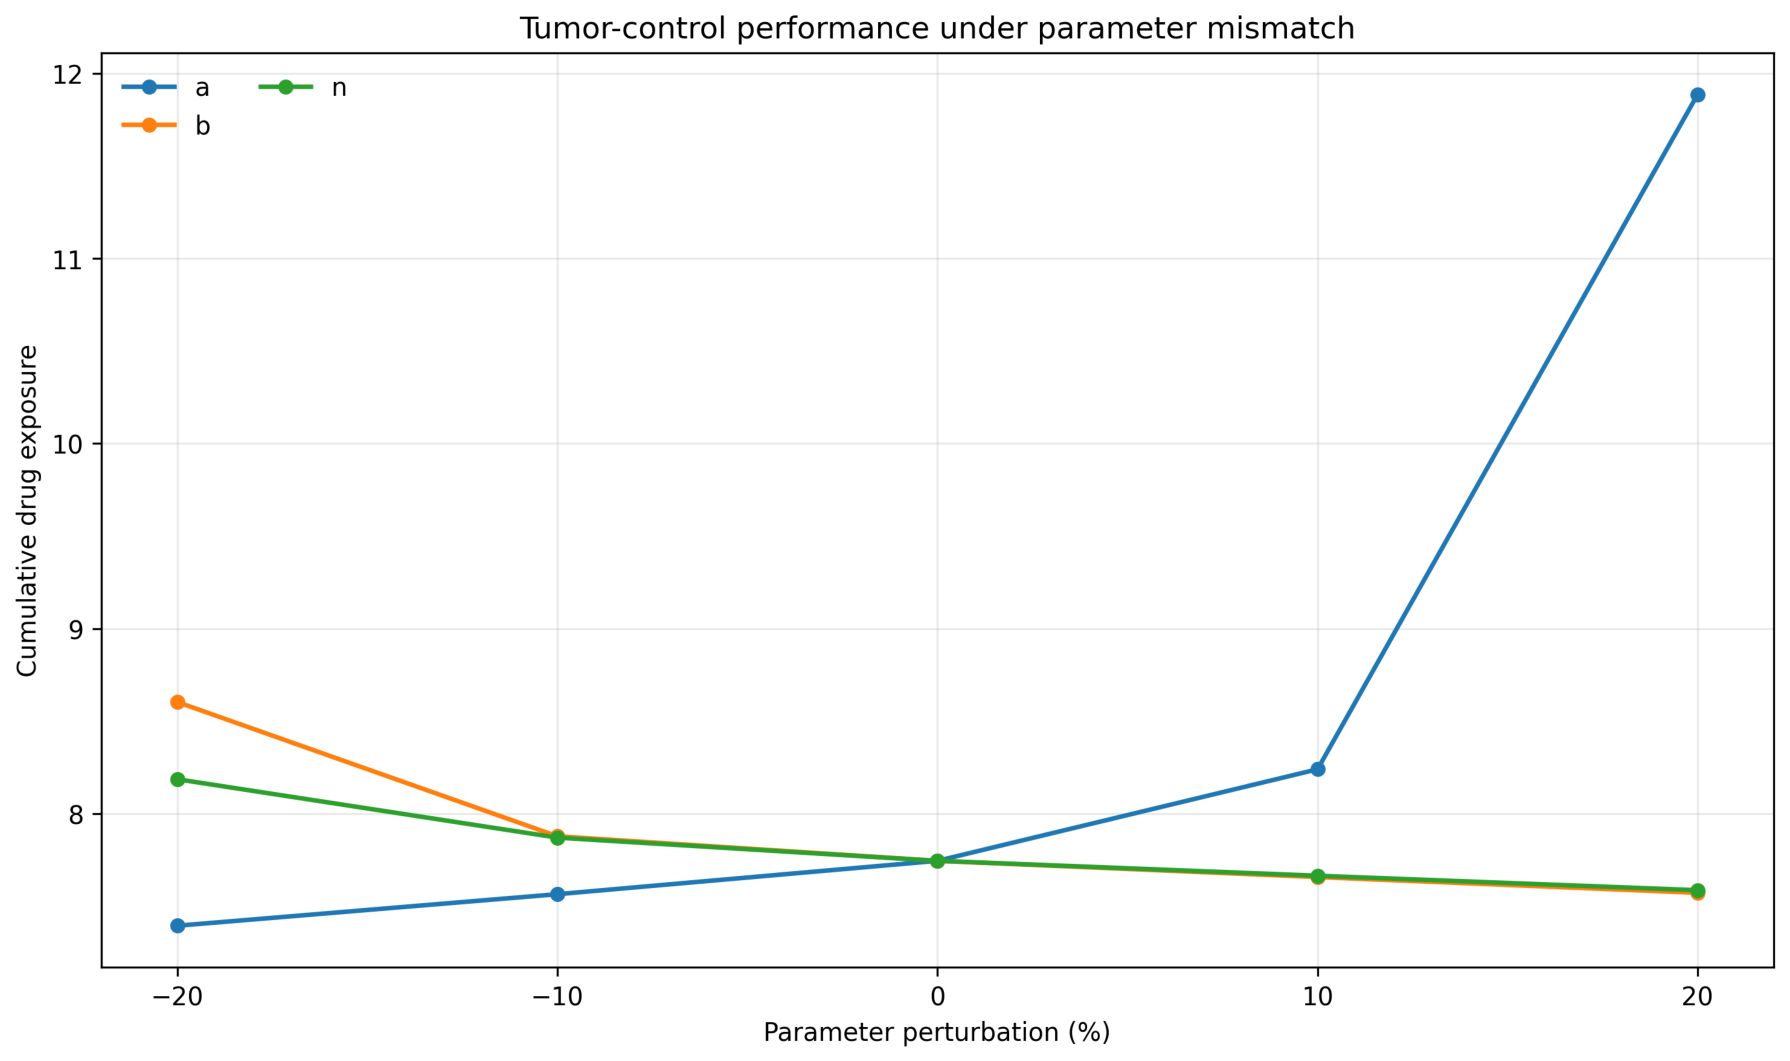
Figure 10 complements the tumor-response analysis by showing how parametric mismatch affects the cumulative drug exposure selected by the closed-loop controller. Treatment effort should be interpreted together with the resulting tumor response and simulated physiological state, because a change in cumulative exposure does not necessarily imply improved tumor control.
Figure 10.
Cumulative drug exposure over the 50-day simulation horizon under independent perturbations of a, b, and n.
Figure 11 shows that the prescribed health lower bound was satisfied in all 15 OAT perturbation cases. The minimum simulated health value was , obtained for a perturbation of a. No solver-status failures or time steps without a feasible candidate were recorded in these cases.
Figure 11.
Minimum simulated physiological-health state over the 50-day treatment horizon under independent perturbations of a, b, and n. The dashed line indicates the prescribed lower bound of 80.
Within the OAT perturbations considered here, the simulated health state was less sensitive to parameter mismatch than tumor-control performance. However, these results do not establish general robustness, closed-loop stability, recursive feasibility, or clinical safety. The findings are restricted to the selected parameters, perturbation levels, initial condition, and simulation setup.
4.5. Exploratory Joint-Parameter Perturbation Analysis
An additional exploratory experiment investigated simultaneous parameter mismatch. Four runs were evaluated for each profile: one reference run and three perturbed cases. The perturbations involved multiple tumor–drug model parameters, including a, b, n, c, , , and , together with variations in the health-model parameter , sampled uniformly from . Each of the tumor–drug parameters was sampled uniformly within a range around its profile-specific value. The prediction model retained its nominal parameters. This limited set of simulations is exploratory and does not constitute a Monte Carlo uncertainty study.
Table 2 summarizes the minimum, median, and maximum tumor-reduction values across the four runs for each profile, together with the minimum simulated health state and the number of runs in which a health-threshold violation occurred. Negative tumor reductions indicate an increase in final tumor volume relative to the initial volume.
Table 2.
Summary of the exploratory joint-parameter perturbation analysis. Each profile includes one reference run and three perturbed cases.
Figure 12 shows that the minimum simulated health state fell below the prescribed lower bound for PLD1 and PLD9. No violations were recorded for PLD2–PLD6 or PLD8 in the tested runs, although PLD8 approached the lower bound, with a minimum value of approximately . The minimum health values were approximately for PLD1 and for PLD9.
Figure 12.
Minimum simulated physiological-health state across the eight virtual profiles in the exploratory joint-parameter perturbation analysis. Each profile includes one reference run and three perturbed cases. The dashed line indicates the prescribed lower bound .
The prescribed health lower bound was violated in three of the four PLD1 runs and in one of the four PLD9 runs. The optimization diagnostics also differed across profiles. PLD1 had 40 cumulative health-violation days and 46 time steps without a feasible candidate across its four runs. PLD9 had 11 cumulative health-violation days and 10 time steps without a feasible candidate. No time steps without a feasible candidate were recorded for PLD2–PLD6 or PLD8. These are counts within the tested simulations and should not be interpreted as estimates of failure probabilities.
Tumor response was highly variable under joint mismatch. The minimum tumor-reduction values were extremely negative for PLD1 and PLD9, and several other profiles also exhibited negative reductions in some runs. Such values indicate substantial tumor progression under the model and parameter combinations considered. Because only three perturbed cases were tested per profile, these extrema depend strongly on the selected perturbations and do not characterize the probability distribution of outcomes under uncertainty.
Overall, the joint-parameter experiment reveals limitations that were not observed in the OAT analysis. In particular, the PLD1 and PLD9 results show that satisfying the prescribed health lower bound under individual parameter perturbations does not guarantee satisfaction under simultaneous mismatch. This experiment remains exploratory: four runs per profile are insufficient to establish general robustness or estimate the frequency of constraint violations.
4.6. Sensitivity to Physiological-Health Model Parameters
The physiological-health equation is a phenomenological extension of the tumor–drug model. Its parameters and , as well as the prescribed health lower bound, were not estimated from clinical or experimental toxicity data. The following sensitivity analysis therefore examines how the simulated outcomes depend on these selected values; it does not validate the health state as a clinical toxicity biomarker.
Nine combinations were tested using
across the eight simulated profiles. Additional tests considered health thresholds of 70, 80, and 90 while retaining the nominal values of and .
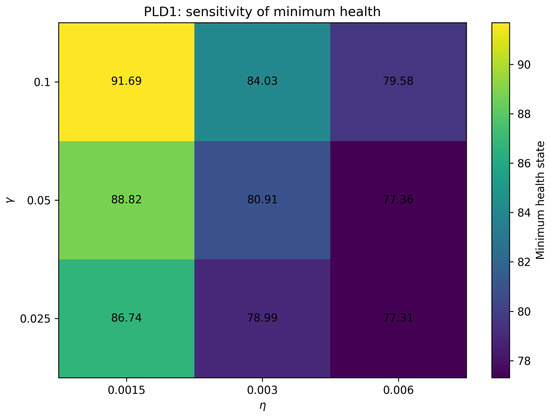
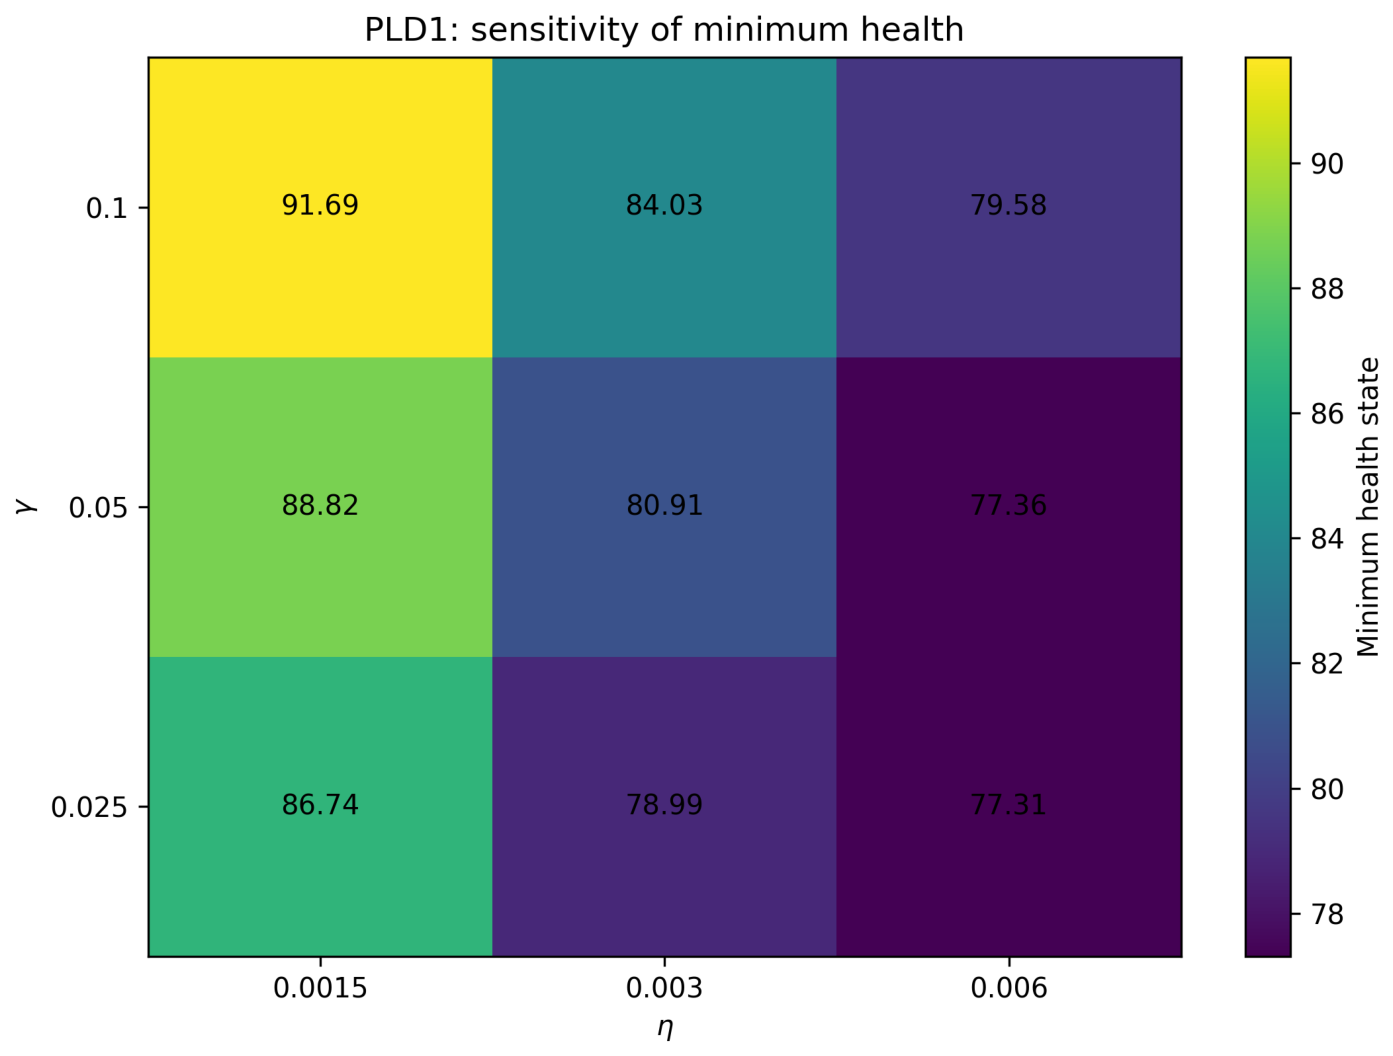
Figure 13 illustrates the dependence of the minimum simulated health state for PLD1 on the selected values of and . Across the tested combinations, the minimum health state for PLD1 ranged from approximately to . Some configurations therefore produced health-threshold violations and numerical optimization failures. This profile-specific sensitivity indicates that the outcome of the health constraint depends on the selected phenomenological parameters.
Figure 13.
Minimum simulated physiological-health state for PLD1 across the tested combinations of the phenomenological health-model parameters and . The prescribed health lower bound is .
For seven of the eight profiles (PLD2–PLD6, PLD8, and PLD9), the tumor-reduction metric varied by less than 0.7 percentage points across the tested combinations, while the minimum simulated health state remained above 98.1. In contrast, PLD1 showed substantially greater sensitivity, with some tested configurations falling below the prescribed health lower bound.
The health-threshold sweep also revealed profile-dependent effects. With a threshold of 70 and the nominal health-model parameters, the lowest simulated health value across the profiles was approximately , and no optimizer failures were recorded. With the nominal threshold of 80, the lowest simulated health value was approximately , and three optimizer failures were recorded. When the threshold was increased to 90, the lowest simulated health value was approximately , and 10 optimizer failures were recorded across the tested profiles. These results indicate increased optimization difficulties for the more restrictive health requirement in the tested simulations.
A solver failure should be distinguished from a health-threshold violation. The former concerns the numerical optimization procedure, whereas the latter concerns the simulated health trajectory. A failed optimization step does not, by itself, establish that the health constraint was violated, and a constraint violation should be assessed from the corresponding simulated trajectory.
Taken together, the sensitivity experiments show that the effects of the selected health-model parameters depend on the simulated profile and parameter configuration. The results are limited to the tested values and numerical scenarios; they do not establish clinical validity, global robustness, or feasibility under all configurations. Calibration against appropriate preclinical or clinical data would be required before the health state or its lower bound could be interpreted in clinical terms.
5. Discussion
The numerical results characterize the behavior of the proposed health-constrained nonlinear model predictive control (NMPC) framework under the simulation conditions considered. By extending the third-order tumor–drug model of Siket et al. [24] with a fourth, phenomenological physiological-health state, the formulation incorporates an explicit lower-bound constraint on the modeled health state into the predictive-control optimization. The simulations reveal substantial variability in tumor-control performance across the eight virtual parameter profiles, as well as sensitivity to model mismatch and to the selected health-model parameters. These findings must be interpreted in light of the modeling assumptions and the limitations of this simulation-based study.
5.1. Inter-Subject Variability and Structural Dynamic Indicator
A major finding is the substantial variability in simulated treatment response across the eight virtual subject-specific parameter profiles. At , PLD3, PLD4, and PLD6 achieved tumor-volume reductions of approximately 73–, whereas PLD2, PLD5, PLD8, and PLD9 showed tumor progression over the 50-day simulation horizon. PLD1 was particularly challenging, combining pronounced tumor progression with substantial cumulative drug exposure.
These profiles represent between-profile parameter variability in the Siket-based model; they do not represent spatial or intratumoral heterogeneity. Furthermore, the profiles have not been independently calibrated or clinically validated as models of individual patients. The observed differences therefore characterize variability within the selected virtual population rather than established differences in clinical treatment response.
The structural indicator provides a compact descriptor derived from selected tumor-model parameters. At , the Pearson correlation between and conventional tumor-volume reduction was approximately across all eight profiles and when PLD1 was excluded. Using the bounded tumor-response metric, the corresponding correlations were approximately and , respectively.
These associations suggest that may help describe differences in simulated control difficulty within the profiles considered. However, the small sample size and the influence of PLD1 limit the interpretation of these correlations. In addition, the treatment response depends on drug concentration and other model parameters, so alone cannot characterize the complete tumor–drug dynamics. It should therefore be regarded as a descriptive, hypothesis-generating indicator rather than the actual net tumor-growth rate, a generally validated predictor, or a clinical response marker. Extremely negative values of the conventional tumor-reduction metric indicate that the final simulated tumor volume greatly exceeds the initial volume; they should not be interpreted as clinically validated quantitative predictions.
5.2. Efficacy–Health Trade-Off of the Constrained NMPC
The principal methodological contribution is the extension of the third-order tumor–drug model of Siket et al. [24] with a fourth, phenomenological physiological-health state whose lower bound is imposed directly within the NMPC optimization. The fine-grid results show that the effect of increasing the tumor-suppression weight depends on the simulated profile. For PLD3, PLD4, and PLD6, substantial tumor suppression was achieved at moderate values of . In contrast, PLD1 showed a decline in its minimum simulated health state as greater emphasis was placed on tumor suppression.
On the tested fine grid, PLD1 had , whereas the other seven profiles remained admissible up to under the nominal simulation conditions. These values are the largest tested admissible weighting values on a finite grid; they are not exact critical thresholds and do not guarantee constraint satisfaction under model uncertainty.
An important feature of the formulation is that the prescribed health lower bound is included directly in the NMPC optimization problem. This allows the controller to account for the modeled health state when selecting the treatment input. However, the health equation is phenomenological: and were selected as modeling choices and were not estimated from clinical or experimental toxicity data. Similarly, the lower bound is a simulation constraint rather than a clinically validated threshold. The simulated health state is therefore not a validated toxicity biomarker, and satisfaction of its lower bound does not establish clinical safety.
The health-model sensitivity analysis further qualifies the nominal results. Although seven profiles showed comparatively small changes in tumor reduction over the tested combinations, PLD1 exhibited minimum simulated health values ranging from approximately to . Some configurations produced health-threshold violations and optimization difficulties. The exploratory joint-parameter perturbation analysis also identified health-threshold violations for PLD1 and PLD9. Thus, constraint satisfaction under nominal conditions or individual parameter perturbations does not imply satisfaction under every tested parameter configuration.
5.3. Comparison with the Dose-Matched Threshold-Based Comparator
The dose-matched benchmark compared NMPC with a threshold-based dosing rule whose amplitude was selected separately for each profile to obtain cumulative drug exposure as close as possible to that of NMPC at . For PLD3, PLD4, and PLD6, the improvements in tumor-volume reduction over this comparator were approximately , , and percentage points, respectively.
Because cumulative drug exposure was approximately matched, these differences cannot be attributed solely to a larger total administered dose in the NMPC simulations. For the responsive profiles, the results are consistent with a benefit from the temporal organization of treatment under receding-horizon feedback. Nevertheless, this interpretation is limited to the model and comparator considered and does not establish that NMPC is generally superior to alternative control strategies.
The improvement was not uniform across profiles. PLD2, PLD5, PLD8, and PLD9 showed poor tumor control under both strategies despite approximately matched cumulative exposure. These results suggest that predictive control can exploit favorable tumor–drug dynamics but cannot necessarily compensate for unfavorable dynamics.
The comparison also involves an important asymmetry in constraint handling. The health lower-bound constraint is enforced during the NMPC optimization but is not imposed during the selection or application of the threshold-based comparator. The comparator’s health trajectory is assessed retrospectively. For PLD1, the minimum simulated health state was approximately under NMPC and under the comparator. This difference illustrates the importance of constraint handling in the simulated comparison, but it does not establish clinical safety or general superiority.
The comparator is a simple reference strategy rather than a predefined clinical dosing protocol or a comprehensive benchmark of established chemotherapy-control methods. Its profile-specific tuning facilitates comparison at approximately matched cumulative exposure but limits the conclusions that can be drawn. Further comparisons with alternative feedback strategies, predefined dosing schedules, and optimization-based controllers would be needed to assess the relative performance of the proposed method more comprehensively.
5.4. Sensitivity to Parametric Model Mismatch
The one-at-a-time (OAT) mismatch experiment showed that tumor-control performance was sensitive to differences between the prediction model and the simulated plant. When a, b, or n was independently perturbed by , , , , or , while the prediction model retained its nominal parameters, the prescribed health lower bound was satisfied in all 15 tested cases. The minimum simulated health value was approximately .
Tumor response varied considerably more strongly. For parameter a, the simulated tumor-volume reduction ranged from approximately at to at . Perturbations in b and n also produced substantial changes in the simulated response. These results show that satisfying the modeled health constraint does not necessarily imply satisfactory tumor control.
The OAT results do not establish general robustness. Only three tumor-model parameters were perturbed individually, and the controller retained its nominal prediction model. In the additional exploratory joint-parameter analysis, simultaneous perturbations produced health violations for PLD1 and PLD9, as well as substantial tumor progression in several cases. These findings show that the health-constraint results observed in the OAT experiment do not guarantee constraint satisfaction under simultaneous mismatch. The experiments are scenario-based analyses, not a formal robust-control certification or a statistical estimate of failure probability.
5.5. Sensitivity to the Physiological-Health Model
The sensitivity analysis examined the effects of changing the phenomenological parameters and and the prescribed health threshold. For seven profiles, tumor reduction varied by less than percentage points across the tested combinations of and , while the minimum simulated health state remained above . PLD1 showed substantially greater sensitivity, with minimum simulated health values ranging from approximately to across the tested parameter combinations.
The threshold sweep also revealed increased optimization difficulties for more restrictive health requirements. With a threshold of 70, no optimizer failures were recorded in the tested cases. With the nominal threshold of 80, three optimizer failures were recorded, whereas a threshold of 90 resulted in ten optimizer failures. These outcomes indicate that numerical optimization behavior depends on the chosen health-model parameters and constraint level. Solver failure and health-threshold violation are distinct: a solver failure concerns the numerical optimization procedure, whereas a threshold violation concerns the simulated health trajectory.
Since neither the health-model parameters nor the threshold was calibrated using clinical or experimental toxicity data, this analysis quantifies numerical sensitivity rather than clinical validity. Calibration and validation against appropriate preclinical or clinical data would be required before the additional state could be interpreted as a clinically meaningful measure of toxicity.
5.6. Implications and Limitations for Model-Based Chemotherapy Control
The main methodological contribution is the integration of a phenomenological physiological-health state and an explicit lower-bound constraint into the NMPC formulation based on the Siket tumor–drug model [24]. The simulations illustrate how this formulation can be used to investigate tumor response and satisfaction of a modeled health constraint across different virtual parameter profiles. They do not establish a clinically validated dosing strategy.
Several limitations are important. First, the study is entirely simulation-based and uses eight virtual profiles. The additional health state has not been calibrated against clinical or experimental toxicity data, and the selected health threshold has no established clinical interpretation. Preclinical or clinical calibration and validation would be necessary before the state could be used as a meaningful representation of toxicity. Such a calibration could, for example, relate to longitudinal preclinical toxicity markers such as white blood cell counts or body-weight loss in rodent models, and derive the lower bound from the observed range of tolerable values.
Second, the controller assumes that the complete simulated state vector
is available at each sampling instant. In practice, the tumor compartments may not be directly measurable, drug-concentration observations may be incomplete or uncertain, and the phenomenological health state is not a directly measured clinical variable. No state estimator or measurement-noise model was included. Because the controller operates on the exact simulated state, the present results may overestimate the performance attainable with estimated states, in contrast to estimation-based frameworks such as that of Czakó et al. [26]. Measurement noise or estimation errors could cause the controller’s state information to differ from the true health state and could therefore lead to violations of that are not observed in the present simulations. Future work should therefore introduce an explicit observation model and evaluate state estimation, for example using an extended Kalman filter or moving-horizon estimation, under partial and noisy observations.
Third, the finite-horizon simulations do not establish formal closed-loop stability or recursive feasibility. The absence of a feasible optimization candidate in some joint-perturbation runs also shows that successful constraint enforcement cannot be assumed for every tested configuration. Future work should investigate stability and feasibility conditions that account for the nonlinear dynamics, input constraints, health lower bound, and model mismatch.
Finally, the dose-matched comparator is limited to a simple threshold-based rule, and the uncertainty analysis covers only the selected parameter variations and scenarios. Further work should consider more systematic benchmarking, broader uncertainty studies, and online state and parameter estimation. The estimation-based approaches discussed by Siket et al. [24] and the moving-horizon estimation and NMPC framework of Czakó et al. [26] provide relevant directions for future investigation. Their integration with the present health-constrained formulation would require separate implementation and evaluation.
In summary, the current study should be interpreted as a simulation-based proof of concept. Potential clinical application would require a clinically meaningful health model, appropriate model calibration and validation, realistic state-estimation assumptions, and further assessment of feasibility and stability. The present results provide a basis for these investigations but do not establish clinical efficacy, clinical safety, or reliable patient-specific dosing recommendations.
6. Conclusions
This study developed a health-constrained nonlinear model predictive control (NMPC) framework for a nonlinear tumor–drug system. The formulation retains the third-order tumor–drug model of Siket et al. [24] and extends it with a phenomenological physiological-health state whose lower bound is imposed within the predictive-control optimization.
The simulations showed substantial variability in tumor response across the eight virtual parameter profiles. At , PLD3, PLD4, and PLD6 achieved tumor-volume reductions of approximately 73–, whereas several other profiles exhibited tumor progression. The structural indicator was negatively associated with tumor reduction within the investigated profile set. However, this association is descriptive and requires further evaluation before any predictive interpretation could be justified.
The dose-matched benchmark showed greater tumor reduction with NMPC than with the tested threshold-based comparator for some responsive profiles at approximately comparable cumulative drug exposure. This advantage was not uniform across profiles, and the comparator was a simple reference strategy rather than a comprehensive benchmark of established control methods. The results therefore do not establish general superiority over alternative chemotherapy dosing strategies.
The OAT mismatch experiments maintained the prescribed health lower bound in all 15 tested cases, although tumor response was highly sensitive to some parameter perturbations. The additional joint-parameter experiments revealed health-threshold violations for PLD1 and PLD9. The health-model sensitivity analysis likewise identified profile-dependent behavior and optimization difficulties, particularly for PLD1. Consequently, satisfaction of the health constraint under nominal conditions or individual parameter perturbations cannot be assumed under all parameter configurations.
The physiological-health state and its parameters have not been calibrated against clinical or experimental toxicity data. The prescribed lower bound is a numerical modeling constraint, not a clinically validated safety threshold. In addition, the controller assumes full-state availability, and the study does not include a state estimator or measurement-noise model. The finite-horizon simulations also do not establish formal closed-loop stability or recursive feasibility.
The findings should therefore be interpreted as a simulation-based proof of concept rather than evidence of clinical efficacy, clinical safety, or reliable patient-specific dosing. Further work should focus on calibrating and validating the health model, developing state and parameter estimation under partial and noisy observations, investigating stability and feasibility, and comparing the controller with more advanced dosing strategies under consistent assumptions. These steps are necessary before the proposed framework can be evaluated for potential clinical application.
Author Contributions
Conceptualization, A.I. and A.M.; methodology, A.I. and A.M.; software, A.I.; verification, A.I. and A.M.; formal analysis, A.I.; investigation, A.I.; resources, A.M.; writing—original draft preparation, A.I.; writing—review and editing, A.I. and A.M.; supervision, A.M. All authors have read and agreed to the published version of the manuscript.
Funding
This research received no external funding.
Institutional Review Board Statement
Not applicable.
Informed Consent Statement
Not applicable.
Data Availability Statement
The Python 3.10 scripts and simulation data supporting the findings of this study are available from the corresponding author upon reasonable request.
Acknowledgments
The authors acknowledge the computational resources used for this study.
Conflicts of Interest
The authors declare no conflicts of interest.
Abbreviations
The following abbreviations are used in this manuscript:
| NMPC | Nonlinear Model Predictive Control |
| PLD | Pegylated Liposomal Doxorubicin |
| Drug concentration associated with 50% of the maximum effect | |
| RK4 | Fourth-order Runge–Kutta integration |
| EKF | Extended Kalman Filter |
| MHE | Moving Horizon Estimation |
| OAT | One-at-a-time |
References
- Adam, J.A. A simplified mathematical model of tumor growth. Math. Biosci. 1986, 81, 229–244. [Google Scholar] [CrossRef] [Scilit]
- Adam, J.A. A mathematical model of tumor growth. II. Effects of geometry and spatial nonuniformity on stability. Math. Biosci. 1987, 86, 183–211. [Google Scholar] [CrossRef] [Scilit]
- Byrne, H.M.; Chaplain, M.A.J. Growth of necrotic tumors in the presence and absence of inhibitors. Math. Biosci. 1996, 135, 187–216. [Google Scholar] [CrossRef] [Scilit] [PubMed]
- Byrne, H.M.; Chaplain, M.A.J. Necrosis and apoptosis: Distinct cell loss mechanisms in a mathematical model of avascular tumour growth. Comput. Math. Methods Med. 1998, 1, 223–235. [Google Scholar] [CrossRef] [Scilit]
- Greenspan, H.P. Models for the growth of a solid tumor by diffusion. Stud. Appl. Math. 1972, 51, 317–340. [Google Scholar] [CrossRef] [Scilit]
- Kerr, J.F.; Winterford, C.M.; Harmon, B.V. Apoptosis. Its significance in cancer and cancer therapy. Cancer 1994, 73, 2013–2026. [Google Scholar] [CrossRef] [Scilit] [PubMed]
- Gatenby, R.A.; Gawlinski, E.T. A reaction-diffusion model of cancer invasion. Cancer Res. 1996, 56, 5745–5753. [Google Scholar] [PubMed]
- Byrne, H.M.; Chaplain, M.A.J. Growth of nonnecrotic tumors in the presence and absence of inhibitors. Math. Biosci. 1995, 130, 151–181. [Google Scholar] [CrossRef] [Scilit] [PubMed]
- Cui, S.; Friedman, A. Analysis of a mathematical model of the effect of inhibitors on the growth of tumors. Math. Biosci. 2000, 164, 103–137. [Google Scholar] [CrossRef] [Scilit] [PubMed]
- de Araujo, A.L.; Fassoni, A.C.; Salvino, L.F. An analysis of a mathematical model describing acid-mediated tumor invasion. Math. Methods Appl. Sci. 2019, 42, 6686–6705. [Google Scholar] [CrossRef] [Scilit]
- Friedman, A.; Reitich, F. Analysis of a mathematical model for the growth of tumors. J. Math. Biol. 1999, 38, 262–284. [Google Scholar] [CrossRef] [Scilit] [PubMed]
- Holder, A.B.; Rodrigo, M.R.; Herrero, M.A. A model for acid-mediated tumour growth with nonlinear acid production term. Appl. Math. Comput. 2014, 227, 176–198. [Google Scholar] [CrossRef] [Scilit]
- Lingeshwaran, S.; Nallasamy, D.M.; Shanmugasundaram, K. Renormalized and entropy solutions of tumor growth model with nonlinear acid production. Math. Model. Anal. 2017, 22, 695–716. [Google Scholar] [CrossRef] [Scilit]
- Manimaran, J.; Shangerganesh, L. Solvability and numerical simulations for tumor invasion model with nonlinear diffusion. Comput. Math. Methods 2020, 2, e1068. [Google Scholar] [CrossRef] [Scilit]
- McGillen, J.B.; Gaffney, E.A.; Martin, N.K.; Maini, P.K. A general reaction diffusion model of acidity in cancer invasion. J. Math. Biol. 2014, 68, 1199–1224. [Google Scholar] [CrossRef] [Scilit] [PubMed]
- Holder, A.B.; Rodrigo, M.R. Model for acid-mediated tumour invasion with chemotherapy intervention II: Spatially heterogeneous populations. Math. Biosci. 2015, 270, 10–29. [Google Scholar] [CrossRef] [Scilit] [PubMed]
- Solis, F.J.; Delgadillo, S.E. Evolution of a mathematical model of an aggressive-invasive cancer under chemotherapy. Comput. Math. Appl. 2015, 69, 545–558. [Google Scholar] [CrossRef] [Scilit]
- Tan, P.L.; Maurer, H.; Kanesan, J.; Chuah, J.H. Optimal control of cancer chemotherapy with delays and state constraints. J. Optim. Theory Appl. 2022, 194, 749–770. [Google Scholar] [CrossRef] [Scilit]
- Garshasbi, M.; Abdolmanafi, M. Identification of some unknown parameters in an aggressive–invasive cancer model using adjoint approach. Mediterr. J. Math. 2019, 16, 18. [Google Scholar] [CrossRef] [Scilit]
- Lobato, F.S.; Machado, V.S.; Steffen, V. Determination of an optimal control strategy for drug administration in tumor treatment using multi-objective optimization differential evolution. Comput. Methods Programs Biomed. 2016, 131, 51–61. [Google Scholar] [CrossRef] [Scilit] [PubMed]
- Cavaterra, C.; Rocca, E.; Wu, H. Long-time dynamics and optimal control of a diffuse interface model for tumor growth. Appl. Math. Optim. 2019, 83, 739–787. [Google Scholar] [CrossRef] [Scilit]
- Dai, F.; Liu, B. Global solvability and optimal control to a haptotaxis cancer invasion model with two cancer cell species. Appl. Math. Optim. 2021, 84, 2379–2443. [Google Scholar] [CrossRef] [Scilit]
- Garcke, H.; Lam, K.F.; Rocca, E. Optimal control of treatment time in a diffuse interface model of tumor growth. Appl. Math. Optim. 2018, 78, 495–544. [Google Scholar] [CrossRef] [Scilit]
- Siket, M.; Eigner, G.; Drexler, D.A.; Rudas, I.; Kovács, L. State and parameter estimation of a mathematical carcinoma model under chemotherapeutic treatment. Appl. Sci. 2020, 10, 9046. [Google Scholar] [CrossRef] [Scilit]
- Füredi, A.; Szebényi, K.; Tóth, S.; Cserepes, M.; Hámori, L.; Nagy, V.; Karai, E.; Vajdovich, P.; Imre, T.; Szabó, P.; et al. Pegylated liposomal formulation of doxorubicin overcomes drug resistance in a genetically engineered mouse model of breast cancer. J. Control. Release 2017, 261, 287–296. [Google Scholar] [CrossRef] [Scilit] [PubMed]
- Czakó, B.; Siket, M.; Drexler, D.A.; Kovács, L. Chemotherapy Optimization using Moving Horizon Estimation based Nonlinear Model Predictive Control. IFAC-PapersOnLine 2021, 54, 215–220. [Google Scholar] [CrossRef] [Scilit]

Disclaimer/Publisher’s Note: The statements, opinions and data contained in all publications are solely those of the individual author(s) and contributor(s) and not of MDPI and/or the editor(s). MDPI and/or the editor(s) disclaim responsibility for any injury to people or property resulting from any ideas, methods, instructions or products referred to in the content. |
© 2026 by the authors. Licensee MDPI, Basel, Switzerland. This article is an open access article distributed under the terms and conditions of the Creative Commons Attribution (CC BY) license.