


Abstract
Multilayer networks are widely adopted as flexible models for characterizing complex systems with diverse interconnection types. Nevertheless, mainstream existing visualization tools are predominantly designed for single-layer network scenarios, and limited functional support is provided for inter-layer comparative analysis. In this work, MultiVis is proposed as a dedicated visual-analysis framework for multilayer networks, which couples topological structure visualization with high-order information pattern representation. Within the topological view, network compression, community detection, and multiple layout algorithms are integrated to uncover multi-scale (macro, meso, and micro) structural features of networks at intra-layer and inter-layer levels. In the high-order pattern view, area-proportional Venn diagrams are utilized to quantify the overlapping sets of nodes and edges across layers, while directed arrow diagrams are adopted to visualize intricate inter-community interaction patterns. A multi-view interaction pipeline derived from the Card reference model is constructed to support user-driven data abstraction, visual encoding, and cross-view transformation. All the aforementioned visual modules and multidirectional interactive operations are implemented in a browser-based prototype named MultiVisSys. User-study results from thirteen participants demonstrate that the developed system delivers satisfactory usability for inter-layer similarity comparison, while its objective analytical performance remains to be further verified through large-scale empirical evaluations.
1. Introduction
Research on complex networks typically abstracts real systems into single-layer networks, where edges represent simple, static connections, and characteristics such as self-loops are generally not considered. However, entities in real systems often serve multiple functions, and the connections and interactions between entities are typically mixed rather than uniform. These multi-functional and multi-type characteristics constitute the heterogeneity of nodes and edges in the network. Multilayer networks introduce the concept of a layer and use intra-layer edges and inter-layer edges to represent multi-type connection relationships within and between layers, respectively, thereby describing the interactions of entities across different states and dimensions of a system [1]. The multilayer-network model is highly flexible and can abstract realistic complex systems with multiple types of connection relationships. To date, multilayer-network modeling and analysis techniques have been widely applied in complex-system modeling across domains such as national defense, economics and finance, and power systems.
- Civilian applications. Multilayer networks have become a core modeling method for public systems such as transportation and energy. Taking the air-transport network as an example, Cardillo et al. [2] treat each airline as a layer, with layers coupled through shared airport nodes; they find that the superposition of layers significantly improves the clustering coefficient, shortens paths, and increases the number of reachable destinations. By modeling a transport network as a two-layer multilayer network, Zhang et al. [3] propose a node-importance calculation method and design a load-capacity cascade-failure model that considers node capacity, node status, and node importance; then, they simulate and analyze the factors affecting network vulnerability. Multilayer networks have also been applied in neuroscience [4,5,6,7], where modeling disease, structure–function relationships, network evolution, and multi-scale data linkage can uncover previously hidden features of brain networks.
- Commercial applications. In supply-chain finance and industrial collaboration, multilayer networks describe the coupling relationships among logistics, information, and capital subnets. Shen et al. [8] construct a multilayer-network model comprising a logistics-management layer, an information-flow layer, and a financial layer and analyze risk-transmission paths through inter-layer coupling coefficients to achieve early warning and prevention of supply-chain financial risks. Peng and Zhang [9] propose a multilayer supply-chain equilibrium model based on variational inequalities that integrates forward and reverse logistics, recycling, and remanufacturing, revealing the dual impact of inter-layer competition and cooperation on overall costs and environmental benefits. These results provide methodological support for enterprises to achieve collaborative decision-making and improve resilience in complex industrial ecosystems.
- Military applications. A military command-and-control system is essentially a multilayer network composed of a physical communication layer, a logical command layer, and a combat-task layer. Liu et al. [10] abstract a hybrid warfare system-of-systems into a multilayer network coupling political, economic, cultural, and national-defense layers, enabling systematic description and quantitative analysis of influence diffusion in warfare strategies. In addition, the Joint All-Domain Command and Control (JADC2) architecture integrates sensing, communication, command, and effects into a four-layer pyramid structure, emphasizing real-time sharing and inter-layer data flow; an AI-driven decision-making closed loop has become a reference blueprint for future combat networks. Lu et al. [11] model a combat system under information support as a multilayer network comprising cognitive, information, and physical domains, describing command-and-control, operational-coordination, and information-flow relationships across combat domains. These studies demonstrate the value of multilayer networks for improving command coordination, sustainment resilience, and cross-domain combat capabilities. By modeling complex systems as multilayer networks, researchers can describe diverse correlation patterns among system components from different angles and levels, thereby more fully characterizing the internal composition of complex systems.
Research on multilayer-network theory requires effective analytical methods and tools. Network-visualization technology displays network nodes, edges, attributes, and other data graphically, effectively assisting analysts in understanding network-analysis results and promoting the research and application of network theory. However, most existing network-visualization methods target single-layer networks and are difficult to extend directly to multilayer networks. This limitation hampers designers’ and analysts’ understanding of the topology of complex systems and is not conducive to the planning, design, and management of such systems. Moreover, most current visualization methods for complex systems focus on simulating the platform and its operating status, suffering from problems such as view occlusion and a lack of graphical display for abstract information, which hinders large-scale data analysis and application. Network-visualization methods can provide users with a graphical channel for understanding and perceiving complex-system networks. By displaying multilayer-network topology from multiple perspectives—including macro scale, meso scale, and high-order information patterns—analysts can compare structural characteristics across layers and discover hidden patterns and laws. This approach can effectively support network analysis of complex systems with multilayer characteristics and promote the application of research results in architecture planning and design, multi-task networking, and security protection.
In view of the multi-level characteristics of complex systems, this paper presents network overviews, correlations, and detailed information from a multilayer perspective to address technical problems in information display. Because the visualization method is designed around the multilayer characteristics of complex systems, the proposed model and method are broadly applicable and provide a reference for visual-analysis and network-analysis research on other networks with multilayer characteristics, such as multi-platform social networks, power-control networks, infrastructure networks, and hybrid warfare systems-of-systems.
The main contributions of this paper are summarized as follows:
- (1)
- A novel visual representation for inter-layer similarity. An area-proportional Venn-diagram visual encoding is tailored for multilayer networks, which maps the count of overlapping nodes/edges to diagram area to realize quantitative visual comparison of set-wise layer-to-layer similarity. Note that the Venn-diagram primitive itself is not new; the adaptation and mapping strategy for multilayer-network overlap measurement constitutes our visual novelty.
- (2)
- An adapted multi-view interaction pipeline. Extended from the classic Card information-visualization reference model, a bidirectional interactive workflow connecting topology views and high-order pattern views is constructed to support multi-granularity comparative exploration across network layers.
- (3)
- An integrated visualization framework. The MultiVis framework combines existing community-detection, network-compression, and layout algorithms within a unified workflow; the underlying algorithms are reused from prior work and are not claimed as novel.
- (4)
- A software prototype implementation. MultiVisSys is a complete browser-side prototype that realizes all above-mentioned views and interaction mechanisms for multilayer-network visual analysis.
2. Related Work
In 2015, Rossi and Magnani [12] studied node-layout strategies for multilayer-network visualization. They observed that although multilayer-network analysis had attracted attention from scholars and engineers in complex-systems research, no targeted approach for multilayer-network visualization had yet been proposed. Piskorec et al. [13] extended single-layer node-layout methods to multilayer networks, applying automatic node layout in a 2.5D view. To reduce visual clutter in node-link diagrams, Bourqui et al. [14] studied edge bundling and proposed a multi-relationship network bundling method that improved the visual display of multiple relationship types. De Domenico et al. [15,16] compared and displayed multiple node-attribute measurements using ring charts, designing two circular-layout views—global views and focus-layer views—that can visualize the distribution of overlapping edges between two layers.
By extending single-layer visualization methods to multilayer networks, the above studies have achieved multilayer-network structure analysis and key-node identification to some extent, but several problems remain as follows: (1) current solutions focus on the topology of a single network layer, making it difficult to support effective comparative analysis of structural characteristics across layers, and node-layout methods specifically designed for multilayer-network visualization remain scarce; (2) high-order pattern information is not displayed, so quantitative comparison of inter-layer structures is not supported; and (3) existing methods focus on the static presentation of attribute information, preventing users from participating in the analysis process or selecting a layer (or subgraph, region, etc.) of interest, which limits in-depth exploration of multilayer structures.
In summary, although several multilayer-network-visualization toolkits have been published in recent years, most existing approaches still focus on individual-layer rendering or node-attribute comparison. Few systems support quantitative visual comparison of set-level overlap between layers together with multi-view interactive exploration, which motivates the present study.
To clarify the positioning of the proposed work, Table 1 compares representative multilayer-network-visualization tools along the following four dimensions: inter-layer topology comparison, set-similarity visualization, multi-granularity network compression, and coordinated multi-view interaction. Gephi is a mature single-layer network-analysis tool; MultiNets provides web-based multilayer visualization with limited inter-layer comparison; MuxViz focuses on multilayer analysis with circular-layout attribute comparison; and edge-bundling approaches reduce visual clutter but do not support quantitative similarity analysis. In contrast, MultiVis distinguishes itself by integrating area-proportional Venn diagrams for quantitative inter-layer set overlap with a coordinated multi-view interaction pipeline.
Table 1.
Qualitative feature comparison of representative multilayer-network-visualization tools.
3. Materials and Methods
3.1. Information Visualization Reference Model
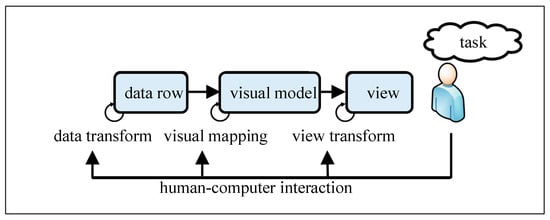
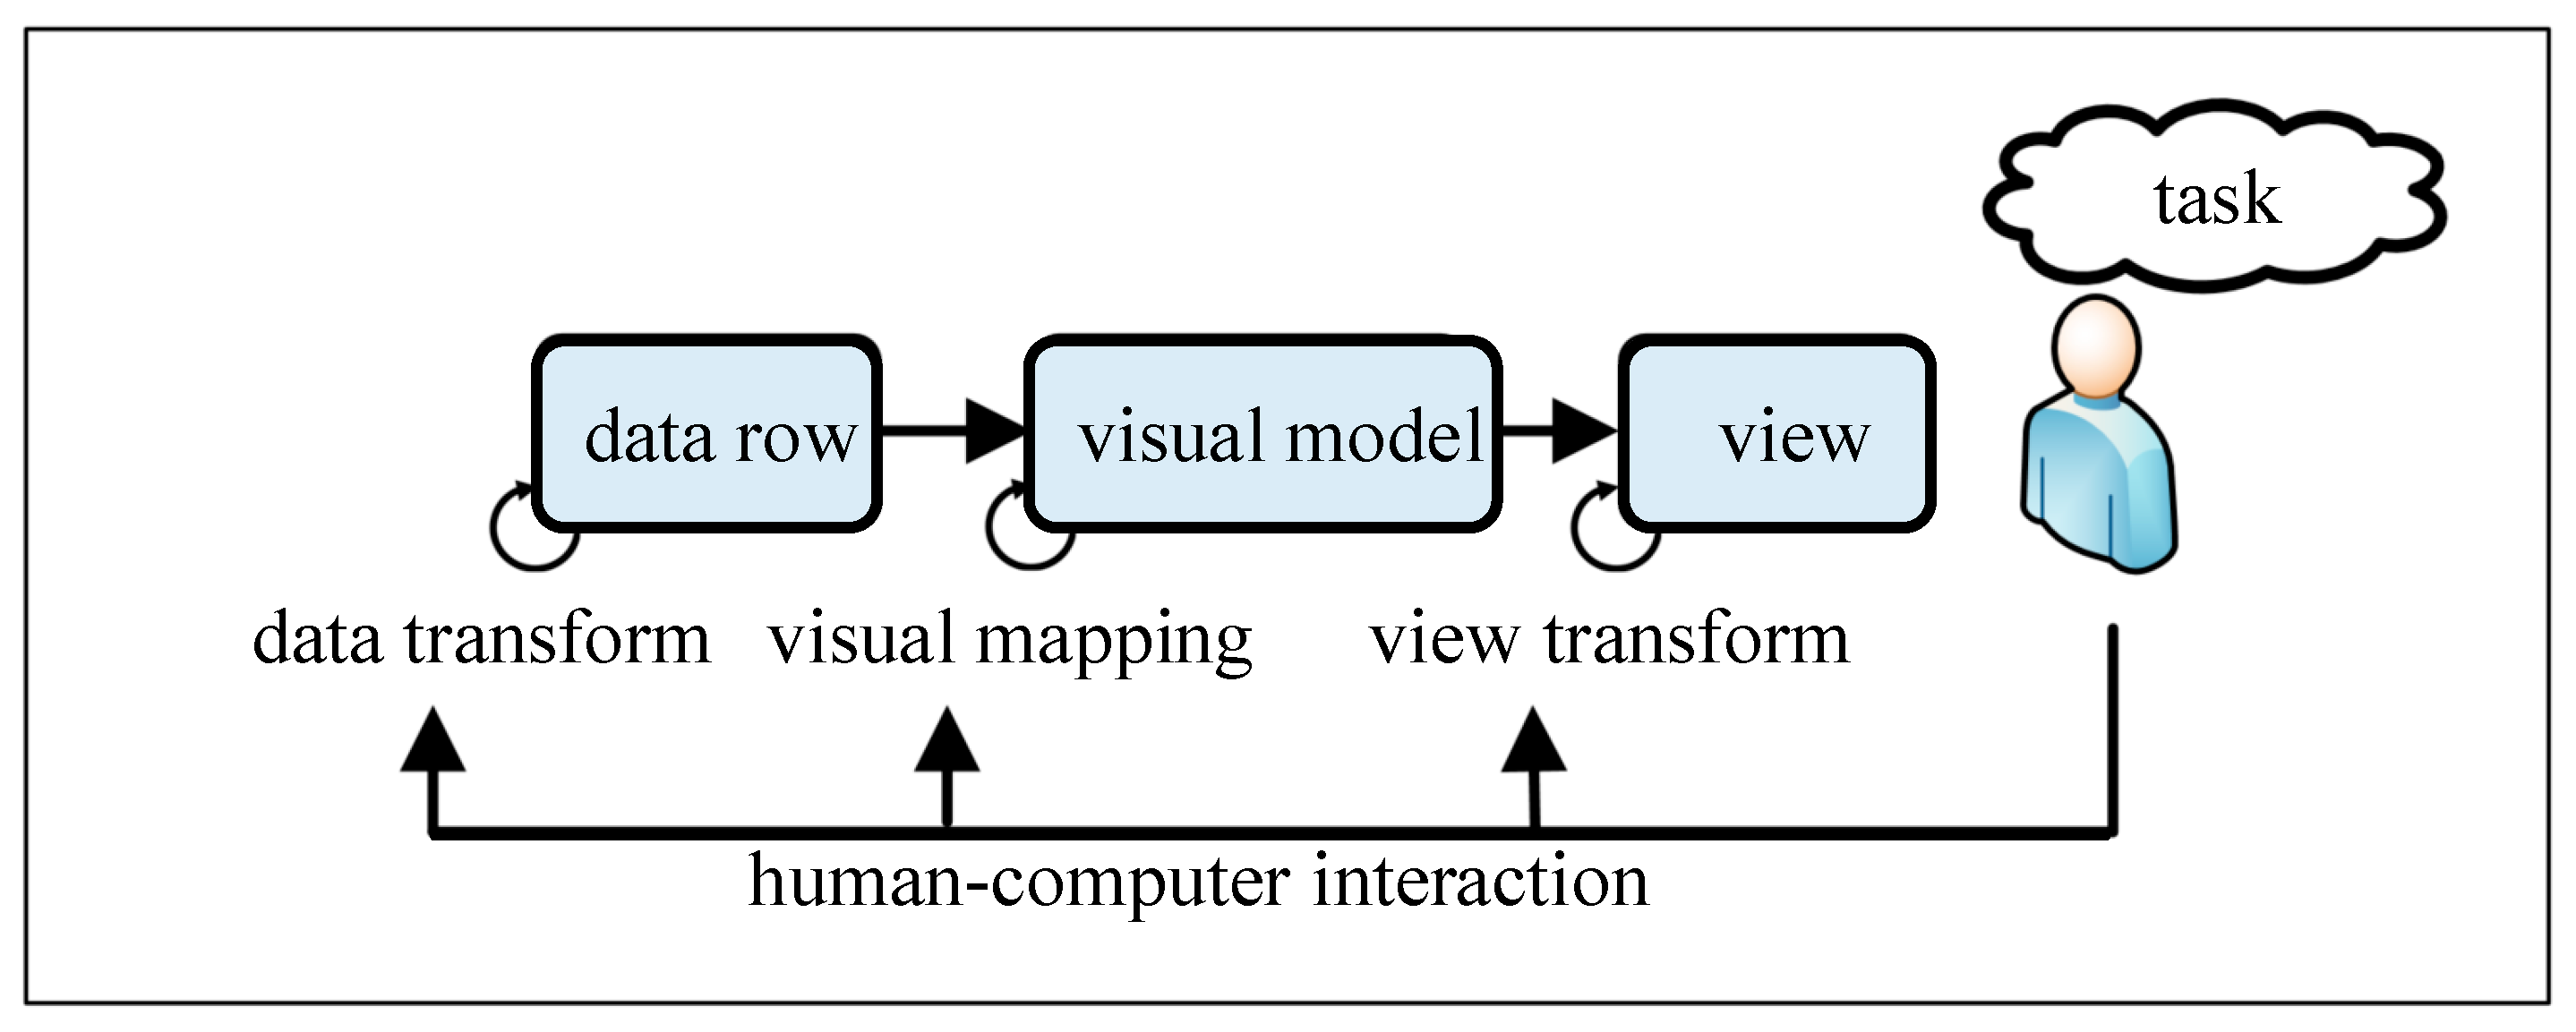
Figure 1 shows the general reference model of information visualization, also known as the Card model, proposed by Card et al. [17]. Its basic idea is to express analytical data using metaphors familiar to users. The model abstracts the information-visualization process as a series of transformations—data conversion, visual mapping, and view transformation—from original data to visual views. Users can participate in and control the entire visualization process through human–computer interaction.
Figure 1.
The general reference model of information visualization.
The data-conversion process primarily organizes the original data into data tables that are easy to understand and suitable for visual-model mapping. Visual mapping, the core of the Card model, expresses abstract information that is difficult for users to understand as familiar graphical elements. Therefore, the key issue in information-visualization research is designing suitable visual metaphors (representation models) and mapping methods to describe abstract data, enabling users to perceive information from these metaphors more accurately and easily. In the view-transformation process, graphical elements are assembled into a visible view, where the color, size, position, distribution, and other attributes of graphical elements convey the information contained in the abstract data. The view-transformation process also supports interactive operations such as translation, zooming, navigation, cutting, and deformation to control changes in view structure, thereby highlighting important information and hiding non-essential information.
The Card model was developed based on visualization research across a variety of data types and is therefore a generalized information-reference model with a high degree of abstraction. All data tables, visual models, views, and interaction behaviors in the Card model are designed to support domain-task analysis, reflecting the characteristic that user tasks drive the visualization process. In practical applications, therefore, the model should be refined with respect to data tables, visual models, views, and interaction operations according to the data characteristics and task needs of the specific domain, in order to effectively guide research on visualization methods for multilayer networks.
3.2. Multilayer-Network-Visualization Framework (MultiVis)
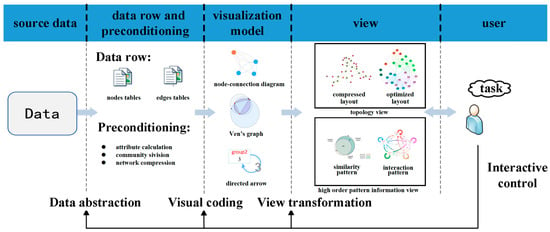
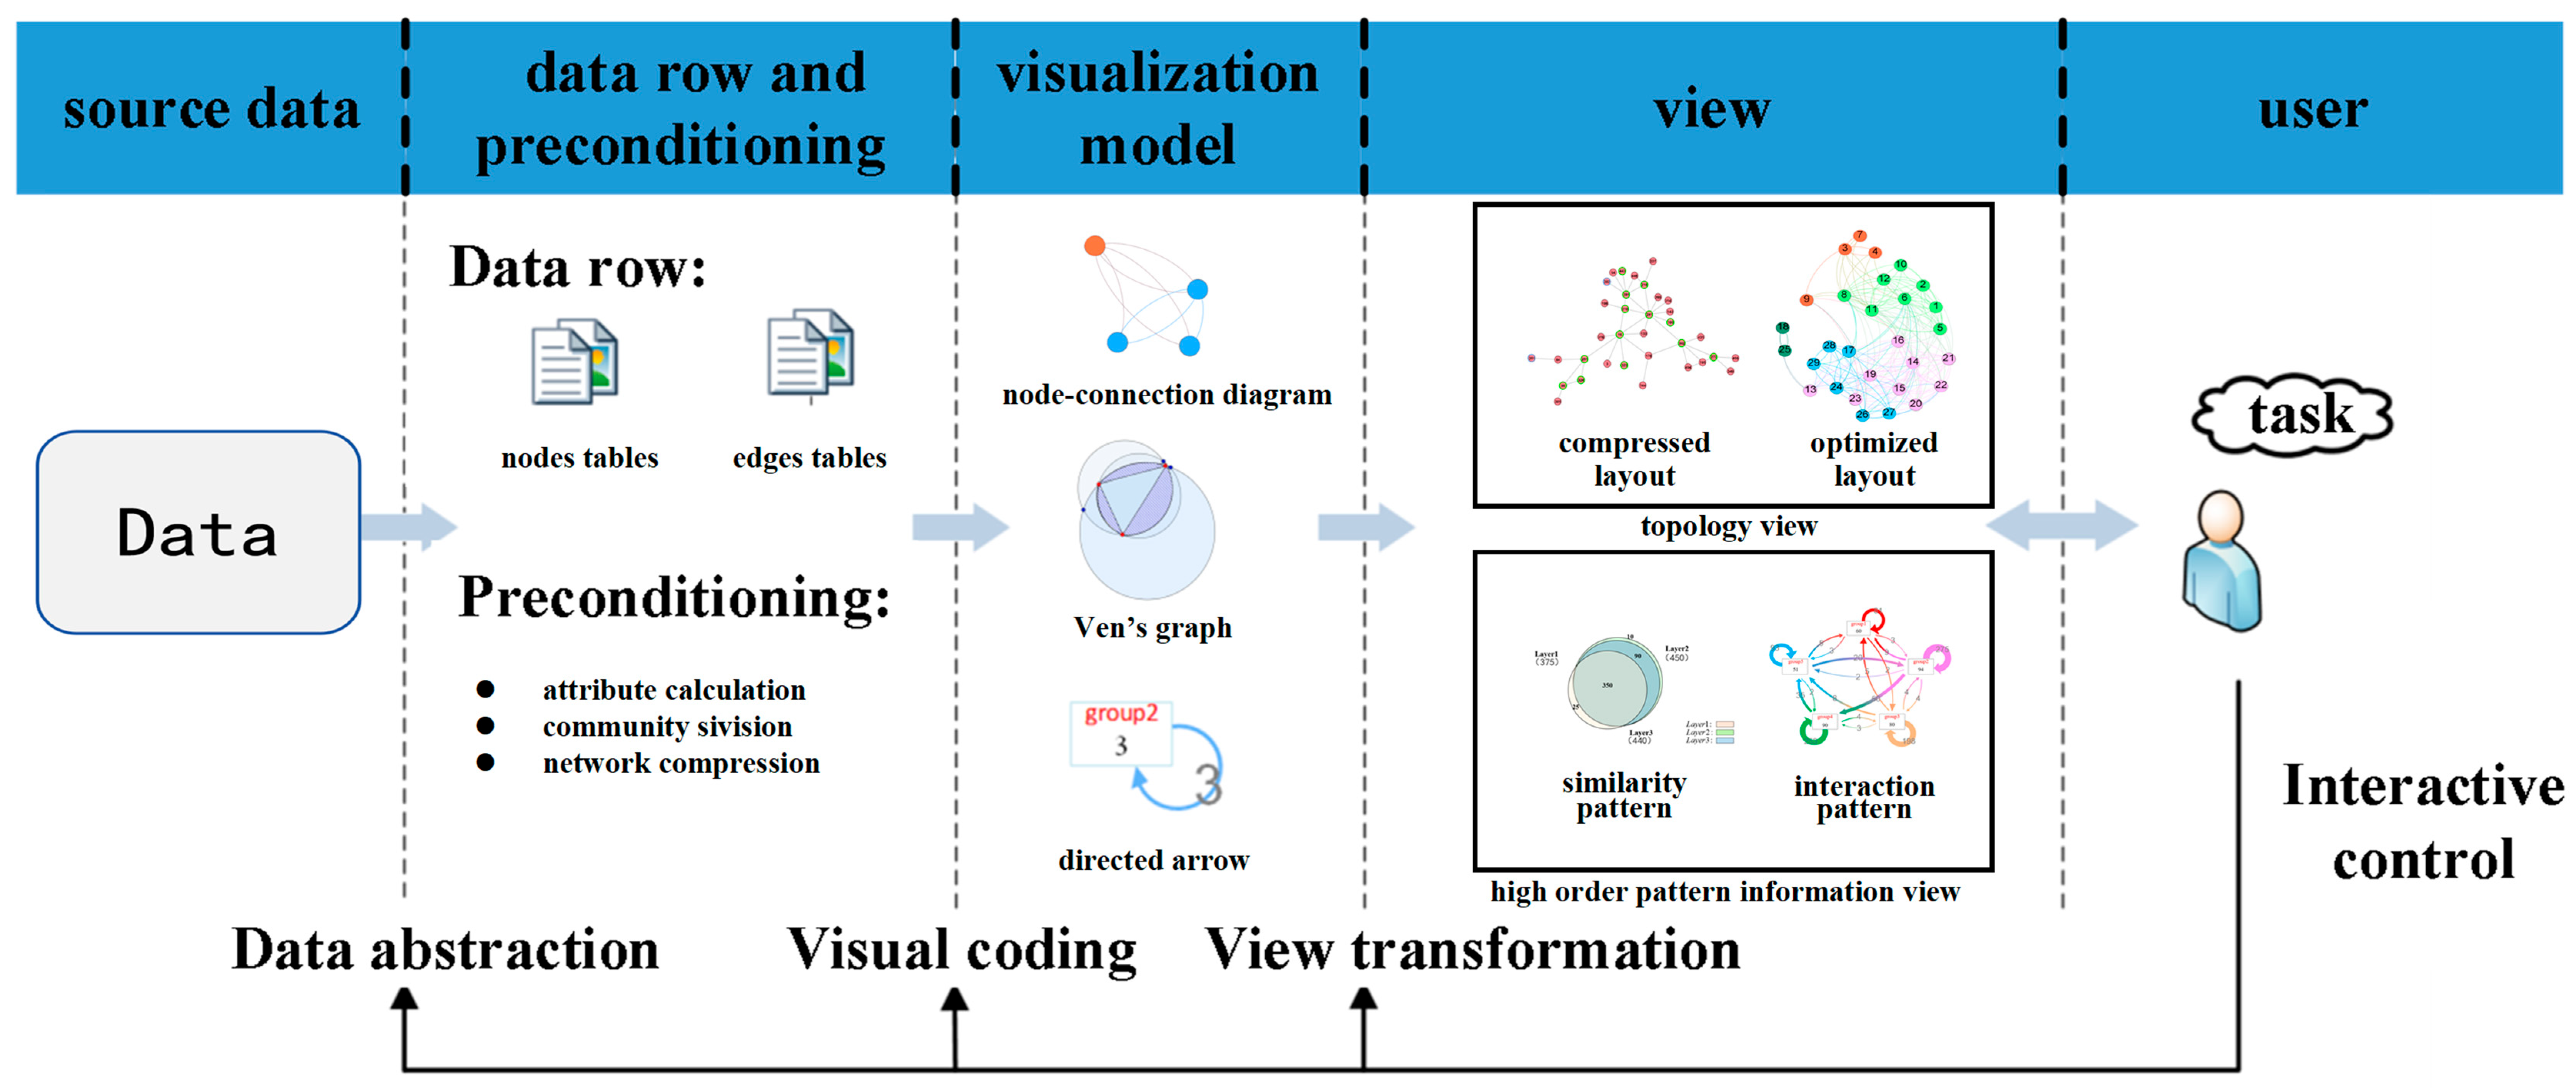
According to the data characteristics and multilayer feature analysis needs of multilayer networks, a more detailed, targeted multilayer-network-visualization framework, MultiVis, is proposed based on the Card model, as shown in Figure 2. Here, MultiVis refers to the conceptual framework comprising data abstraction, visual coding, view transformation, and interactive-control stages; MultiVisSys refers to the browser-based software prototype that implements this framework (see Section 4). The arrows from left to right in the figure indicate the process of processing and transformation of multilayer-network data. Following the pipeline of source data -> data row and preconditioning -> visual model -> view -> user, one can build a systematic, complete network-visualization framework. Conversely, the arrows from right to left are used to control data processing and view creation through interactive modules, so that the visualization process can output visual views that meet task needs through data abstraction, visual coding, and view transformation.
Figure 2.
Multilayer-network-visualization framework.
The MultiVis framework is designed to clarify the data-processing pipeline, standardize data formats, and design reasonable visualization models and target views by establishing a standardized end-to-end process from source data to visual views, thereby guiding research on visualization methods for multilayer networks.
3.2.1. Data Abstraction
Multilayer-network data are stored as node tables and edge tables. Node tables store node-object information, primarily basic node attributes such as ID, type, function, and index, where ID is the unique identifier of the node, type identifies the node category, function identifies the node’s functional role, and other attributes provide further descriptions of the entity. Edge tables store connection-object information; each record represents an edge between nodes in the multilayer network.
3.2.2. Visual Coding
Data-preconditioning operation is used to generate input data for visual models to participate in visual coding. The data-preconditioning stage integrates several existing algorithms, including community detection, attribute calculation, and network compression.
Community detection is performed using the Louvain method [18], which optimizes modularity through a greedy agglomerative approach. Network compression is achieved by aggregating nodes within each detected community into a single meta-node, preserving inter-community edges while reducing the total node count; the compression ratio is user-controllable. Node importance is computed using PageRank [19], with the damping factor set to 0.85 by default. For layout, the topology view supports both a force-directed layout (ForceAtlas2) for the original network and a community-aggregated layout for the compressed view. The force-directed layout minimizes an energy function that combines attractive spring forces between connected nodes and repulsive Coulomb forces between all node pairs. In the area-proportional Venn diagrams, each circle area is proportional to the cardinality of the corresponding layer’s node (or edge) set, and pairwise and triple intersection areas are computed from the set-cardinality data using the method of Chow and Rodgers [20]. Nodes or edges that appear in multiple layers are treated as shared elements and counted in each relevant intersection; layer-unique elements are counted only in their respective layer set. The time complexity of the preprocessing pipeline is dominated by community detection at O(nlogn) for n nodes, followed by layout computation at O(n2) per iteration for the force-directed algorithm.
The visual-coding process describes abstract information through graphical elements familiar to users and enhances visual expressiveness. It includes node-link diagrams, Venn diagrams, and directed arrows: node-link diagrams describe nodes and edges in combination with different visualization-layout methods; Venn diagrams and directed arrows display inter-layer similarity patterns and intra-layer interaction patterns, respectively, which constitute high-order pattern information.
3.2.3. View Transformation
View transformation constructs visual views from the results of visual coding, including the topology view and the high-order pattern-information view, which are the outputs of the visualization process. Through the color, size, position, distribution, and other attributes of visible elements in the view, users can perceive the information contained in the abstract data and, further, the network status, thereby achieving the goals of multilayer-network-visualization analysis, such as rapid identification of inter-layer nodes and copies and comparison of similar structures across layers.
3.2.4. Interactive Control
Interactive control is an indispensable part of visual analysis. Because task demands are diverse and multi-level, a single visual view or static display is often insufficient to meet analytical needs over time. Users need to participate in controlling the visualization process based on task-analysis requirements and current view information through the interactive interface, including filtering data of interest, setting color, size, and other coding methods for graphical elements, and selecting appropriate layout methods and parameters.
4. Visualization System Designing and Achieving
The multilayer-network-visualization system aims to provide a visualization platform that allows users to freely explore multilayer data through the visual display of topology views and high-order pattern-information views, making multilayer characteristics easier to understand and perceive.
4.1. System Architecture
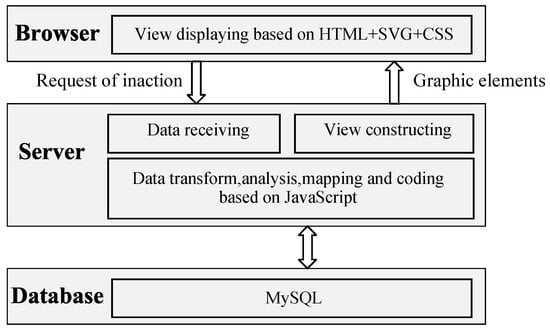
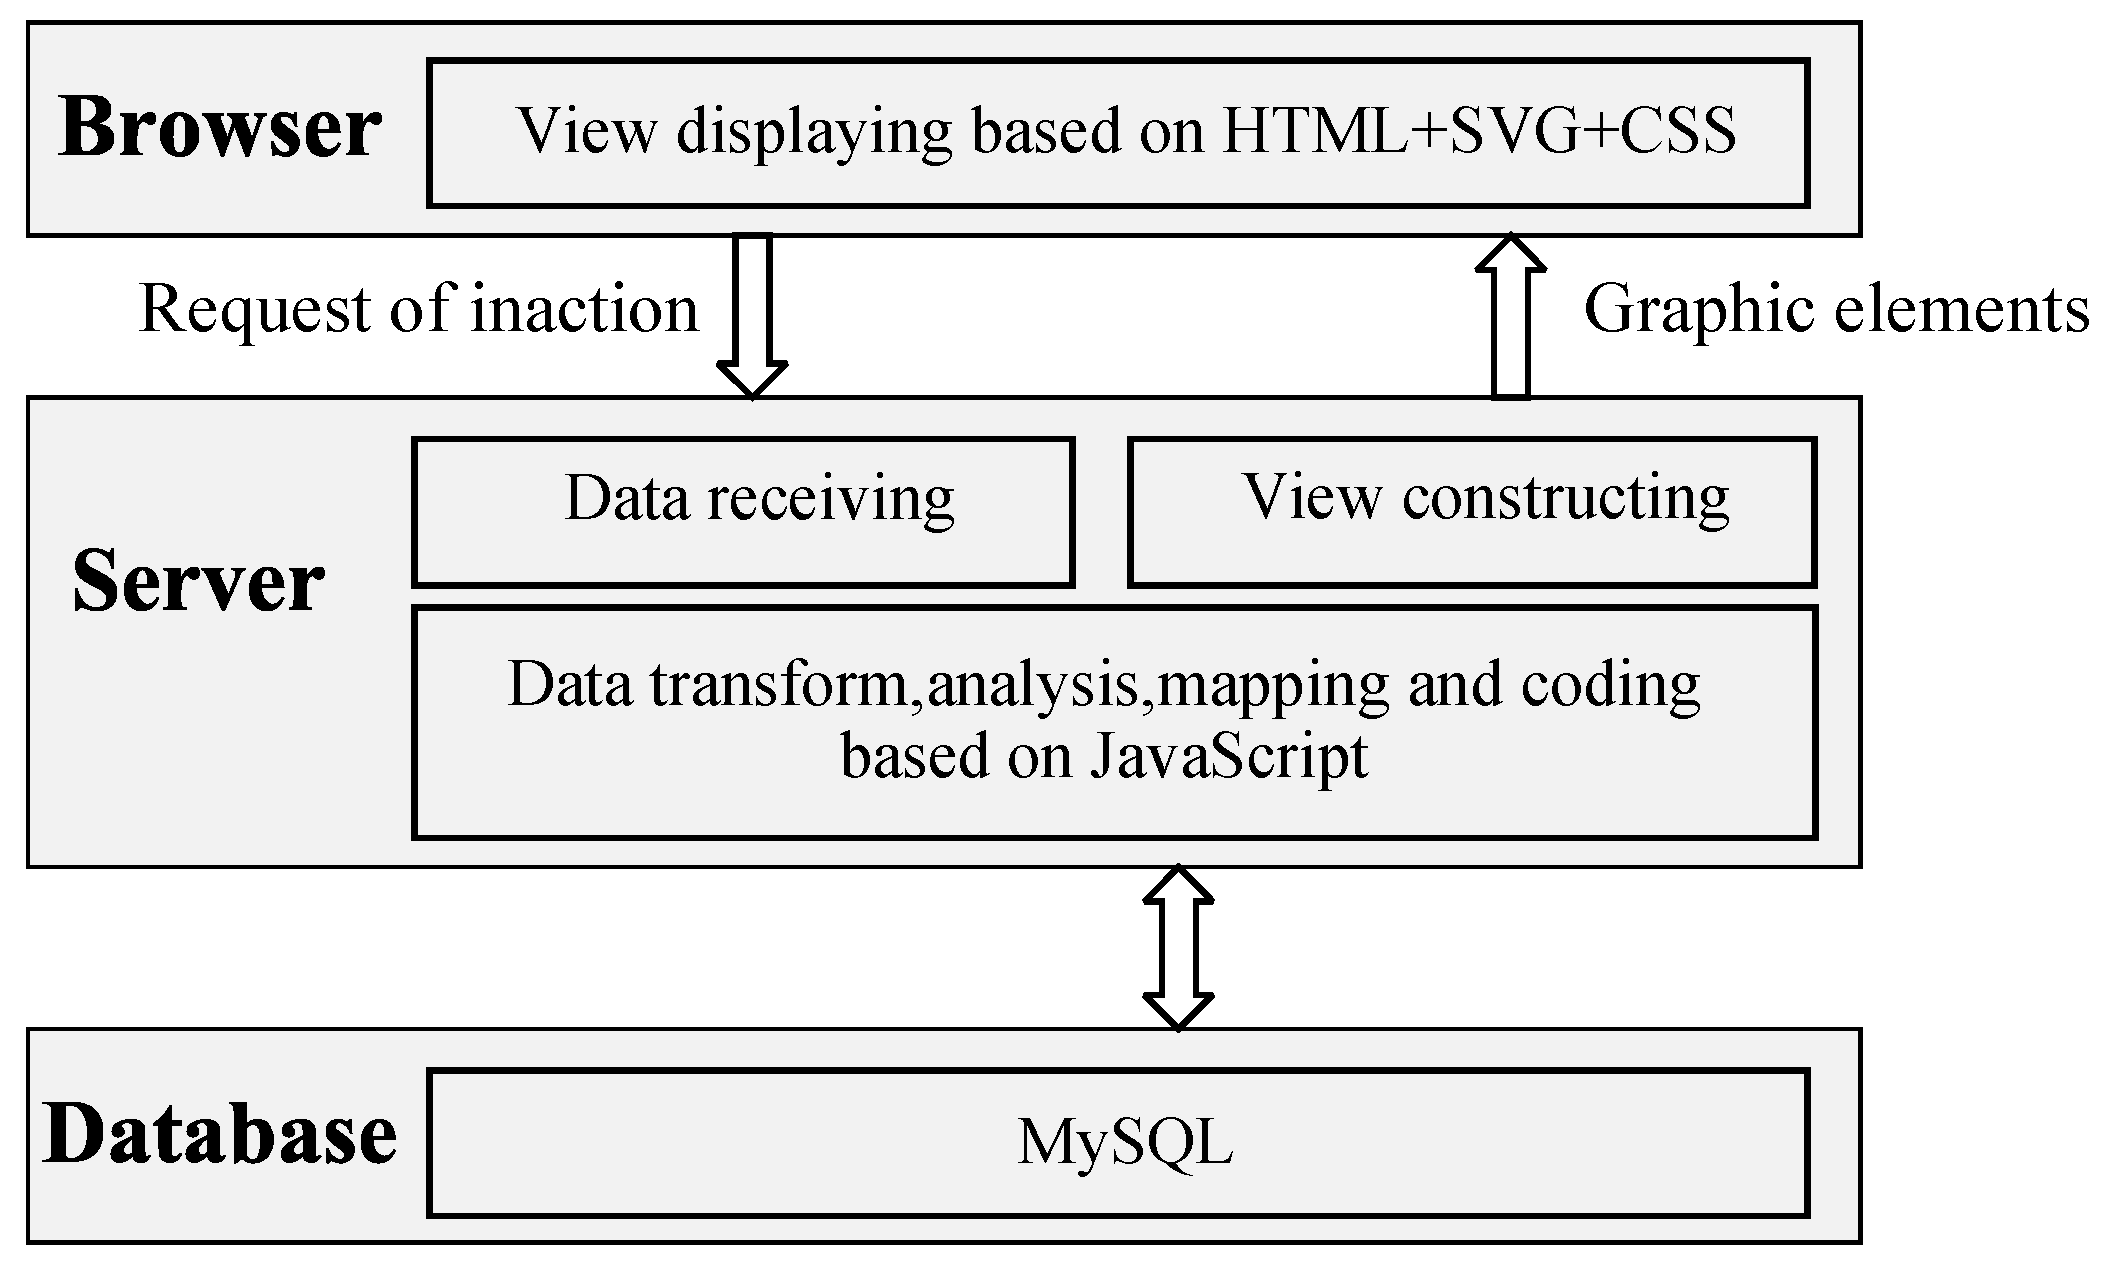
To facilitate maintenance, management, and rapid deployment, MultiVisSys adopts a browser-server (BS) architecture, as shown in Figure 3, implemented primarily through the browser, server, and database. The top layer is the browser end, which serves as the viewing layer for displaying graphical element data produced by mapping and coding. Users enter interaction requests through the interactive interface, and these requests are transmitted to the server. Current mainstream browsers generally provide sufficiently powerful graphics-rendering capabilities to support the view-drawing needs of this system in terms of both performance and compatibility.
Figure 3.
System architecture.
The database serves as the data-access layer with relatively limited functionality, primarily responsible for managing source-data lists. The prototype system uses a MySQL database to store experimental network data, and the database can be switched to other platforms according to actual needs.
4.2. Development Environment
4.2.1. Hardware Environment
Browser-side client: CPU clock frequency greater than 2.0 GHz; RAM greater than 2.0 GB; and dedicated NVIDIA graphics processing unit with video memory greater than 1.0 GB.
Server-side: CPU clock frequency greater than 2.0 GHz; RAM greater than 2.0 GB; and hard-disk capacity greater than 500 GB.
4.2.2. Software Environment
Browser-side client: Windows 7 or above; Google Chrome v112.0.
Server-side: Windows 7 or above; Apache httpd v2.2.5; MySQL v5.7; and dependent front-end libraries including jQuery v3.6.0, D3.js v7.8.5, Three.js v0.152.2, JSNetworkX.js v1.2.0, Bootstrap.js v5.1.3, and CrossFilter.js v1.5.4.
Note: The above-mentioned hardware and software represent the minimum test-run requirements for the research prototype only. Windows 7, Apache httpd v2.2.5 have reached official end-of-life status without ongoing security maintenance. Google Chrome v112.0 corresponds to the final Chrome major release compatible with Windows 7. This configuration is used solely for offline prototype demonstration in this study and is not recommended for internet-facing production deployment.
4.3. Functional Modules
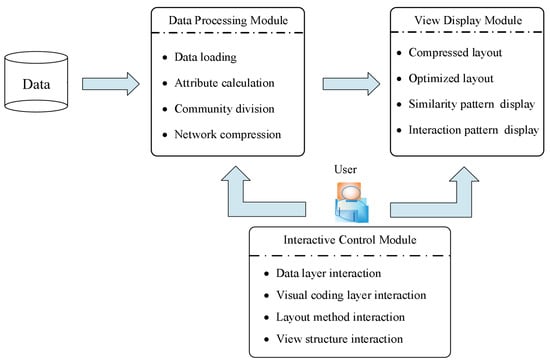
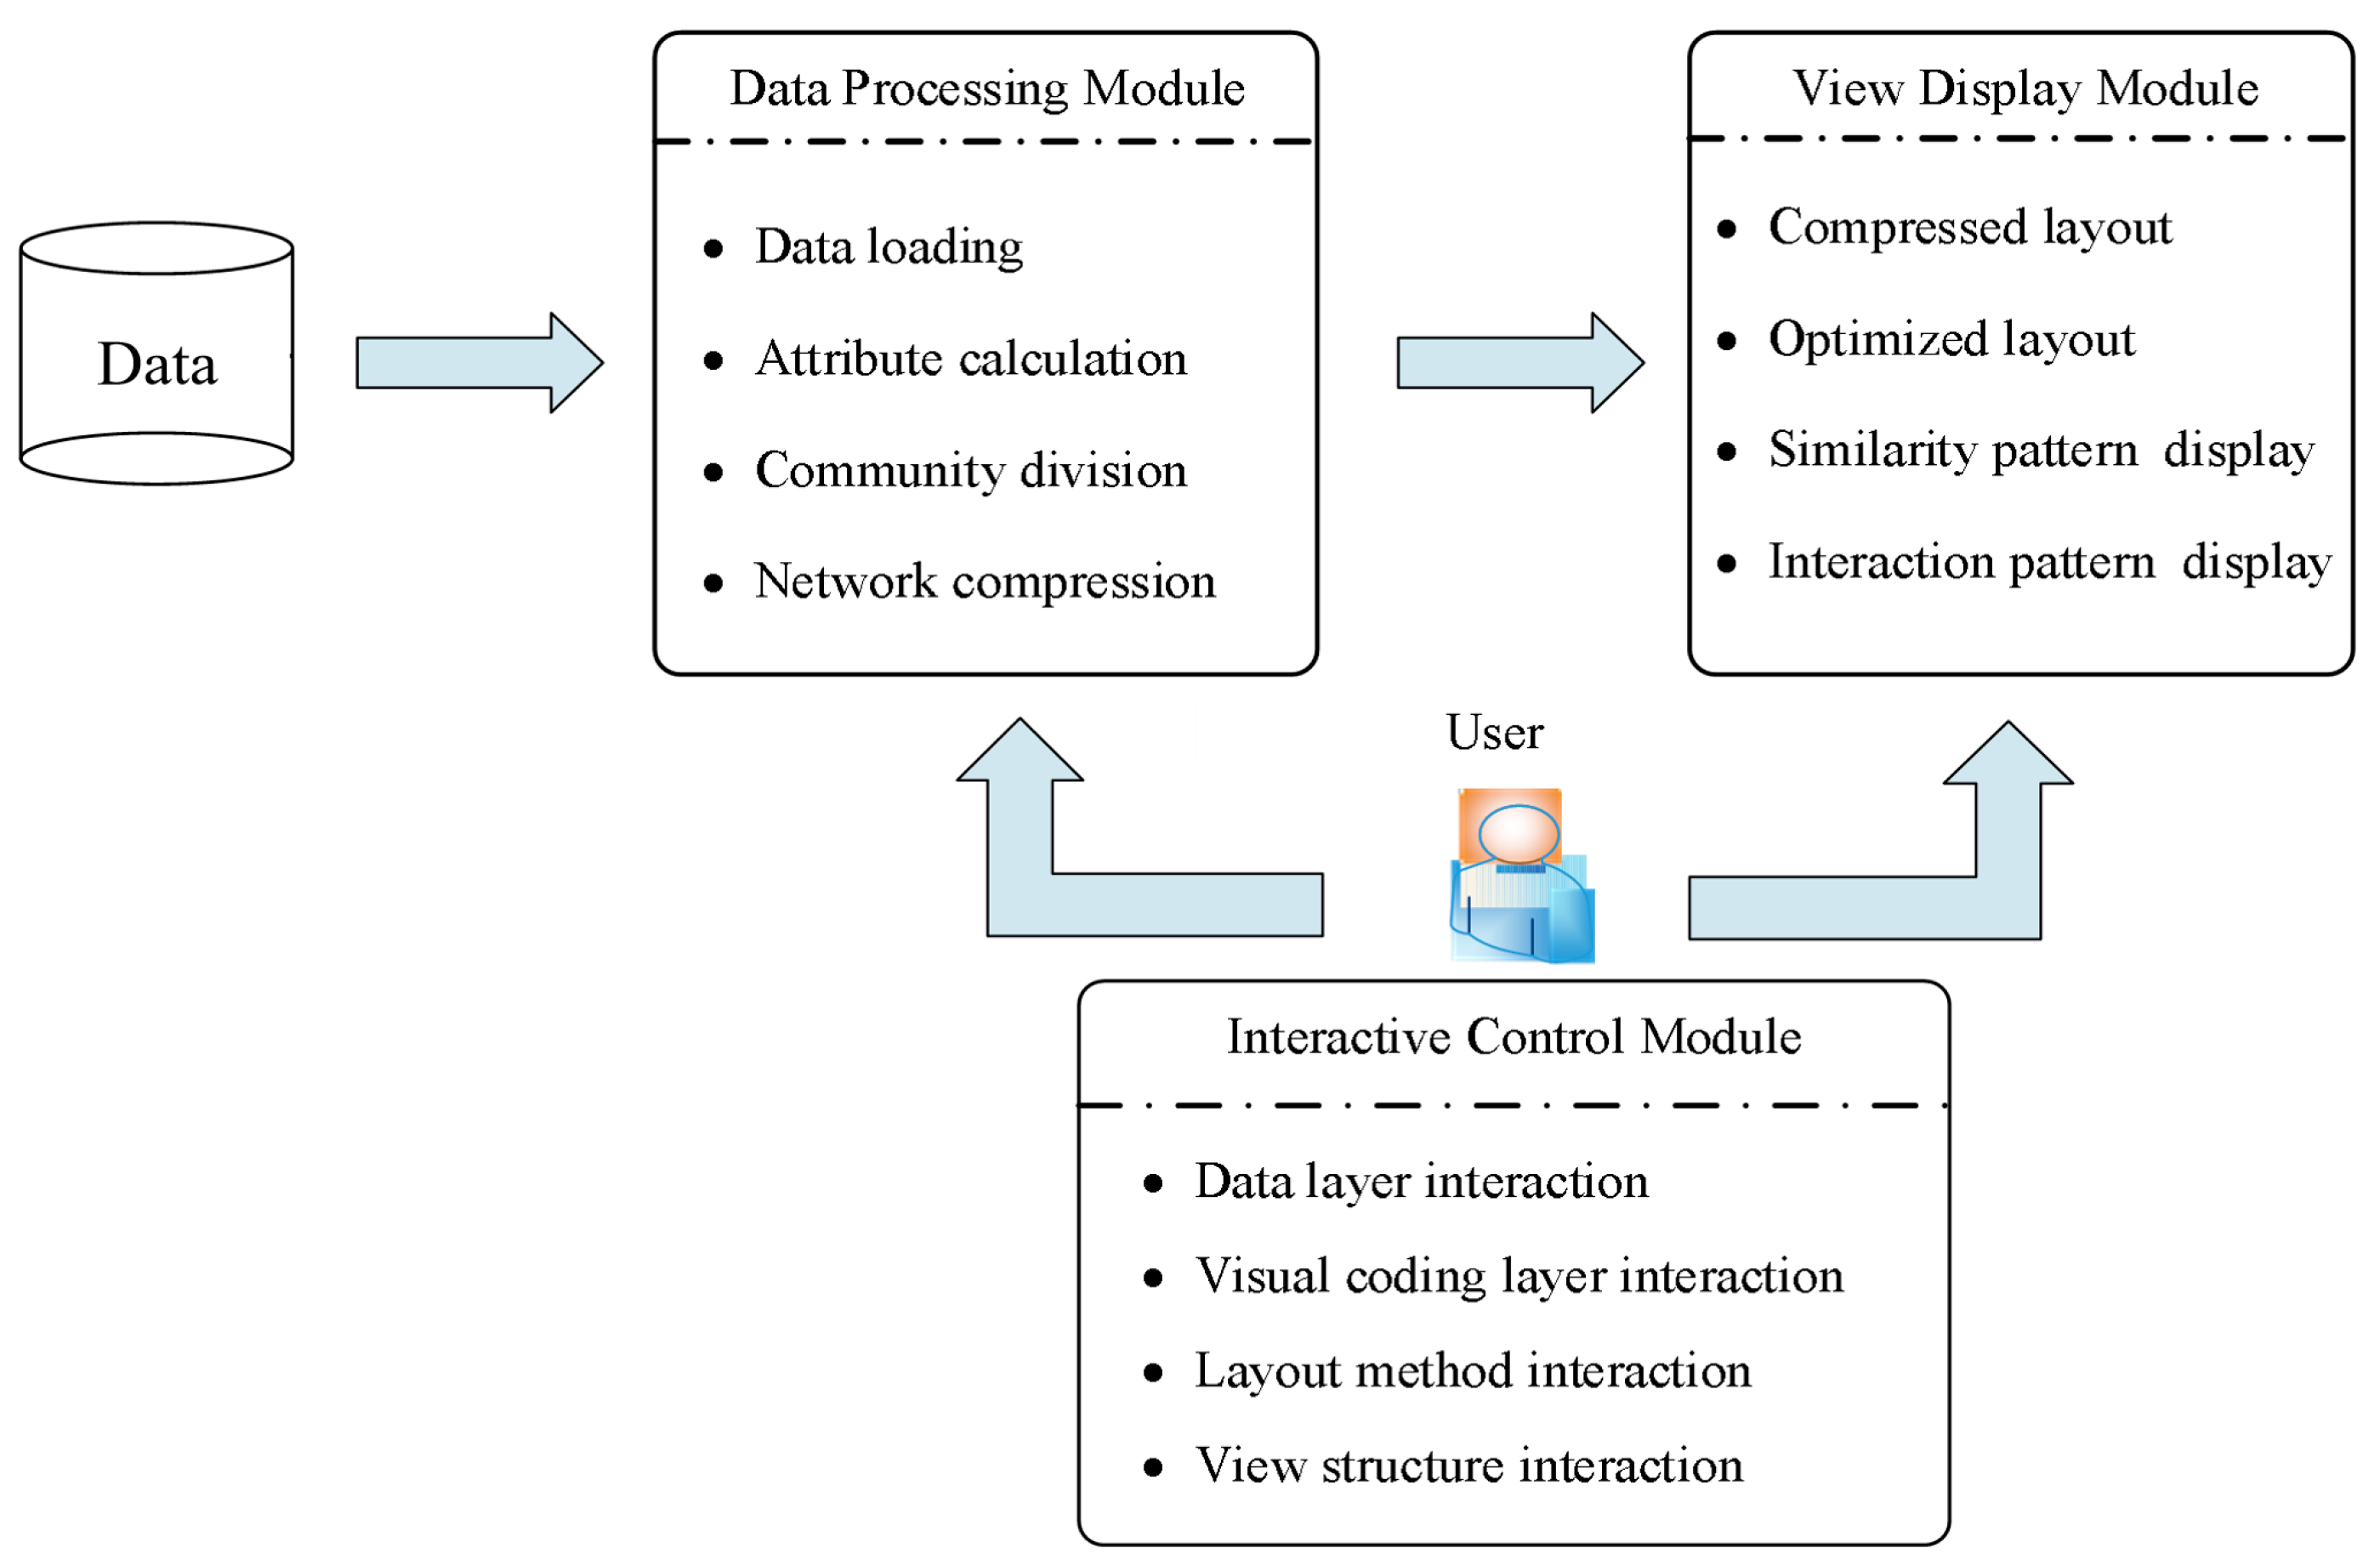
The main functional modules of MultiVisSys are shown in Figure 4. They comprise a data-processing module, a view-display module, and an interactive-control module. Users interact with network data or topology-view elements through multiple interaction methods, and the multilayer structure of the target network is displayed through the topology view and the high-order information view. The following describes the role of each functional module.
Figure 4.
The functional structure diagram of the prototype system.
The main function of the data-processing module is to prepare data for the view module according to user needs, including:
- Data loading: importing network data lists for analysis, cleaning the data, removing duplicate nodes and edges, generating data lists for aggregated and overlapping network layers, and creating graph objects.
- Attribute calculation: computing node and edge attributes such as degree and centrality, providing data preparation for view display and user interaction at the data layer.
- Community detection: partitioning nodes into communities using integrated community-detection algorithms, which supports network compression and view coding.
- Network compression: compressing each network layer to obtain its abstract structure using network-compression algorithms, which supports node layout and view coding.
The view-display module presents network structural characteristics from both qualitative and quantitative perspectives through the topology view and the high-order information view. It mainly includes:
- Compressed layout: the topology view is displayed as a node-link diagram under a compressed layout algorithm, showing the compressed network structure and highlighting macro-scale characteristics such as the layer’s community structure and skeleton structure.
- Optimized layout: the topology view presents the original network-layer structure as a node-link diagram. The layout process uses an optimization layout method to compute node coordinates and displays the structural characteristics of each network layer from a micro perspective.
- Similarity-pattern display: the similarity-pattern view uses Venn diagrams to display the similarity of regions of interest across selected layers, that is, the distribution of overlapping nodes or edges, which measures structural similarity among layers.
- Interaction-pattern display: the interaction-pattern view uses directed arrows to display the interaction state among communities within a single network layer, assisting structural comparison across layers.
- The interactive-control module assists multilayer characteristic analysis by acting on data, layout parameters, network-layer elements, or views through multiple interaction methods. It mainly includes:
- Data-layer interaction: changes visual data through source-data selection, layer selection, or attribute-based filtering.
- Visual-coding-layer interaction: interacts with color, size, label, and other visual elements to enhance the user’s visual perception.
- Layout-method interaction: interacts with the node-layout method and its algorithm parameters, adjusting the positions of visual elements to enhance visual perception.
- View-structure interaction: selects visual elements through point selection, frame selection, and other operations and changes the observation angle through viewing operations such as scaling and translation, assisting users in querying view details.
4.3.1. Data Processing Module
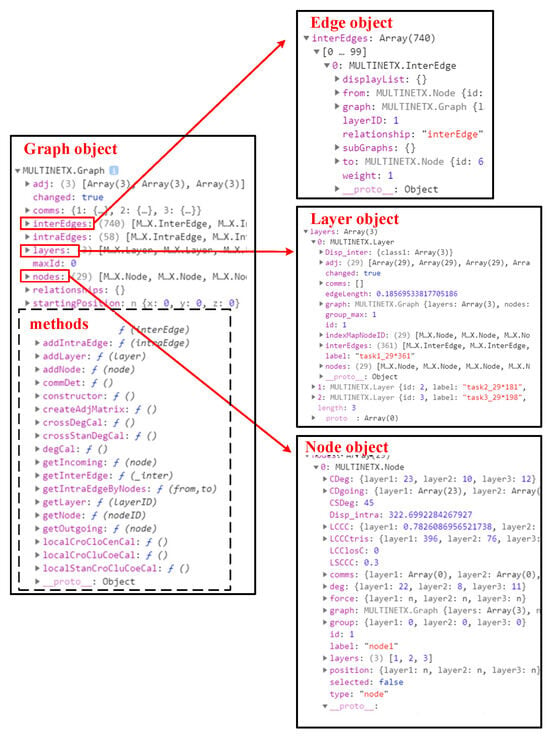
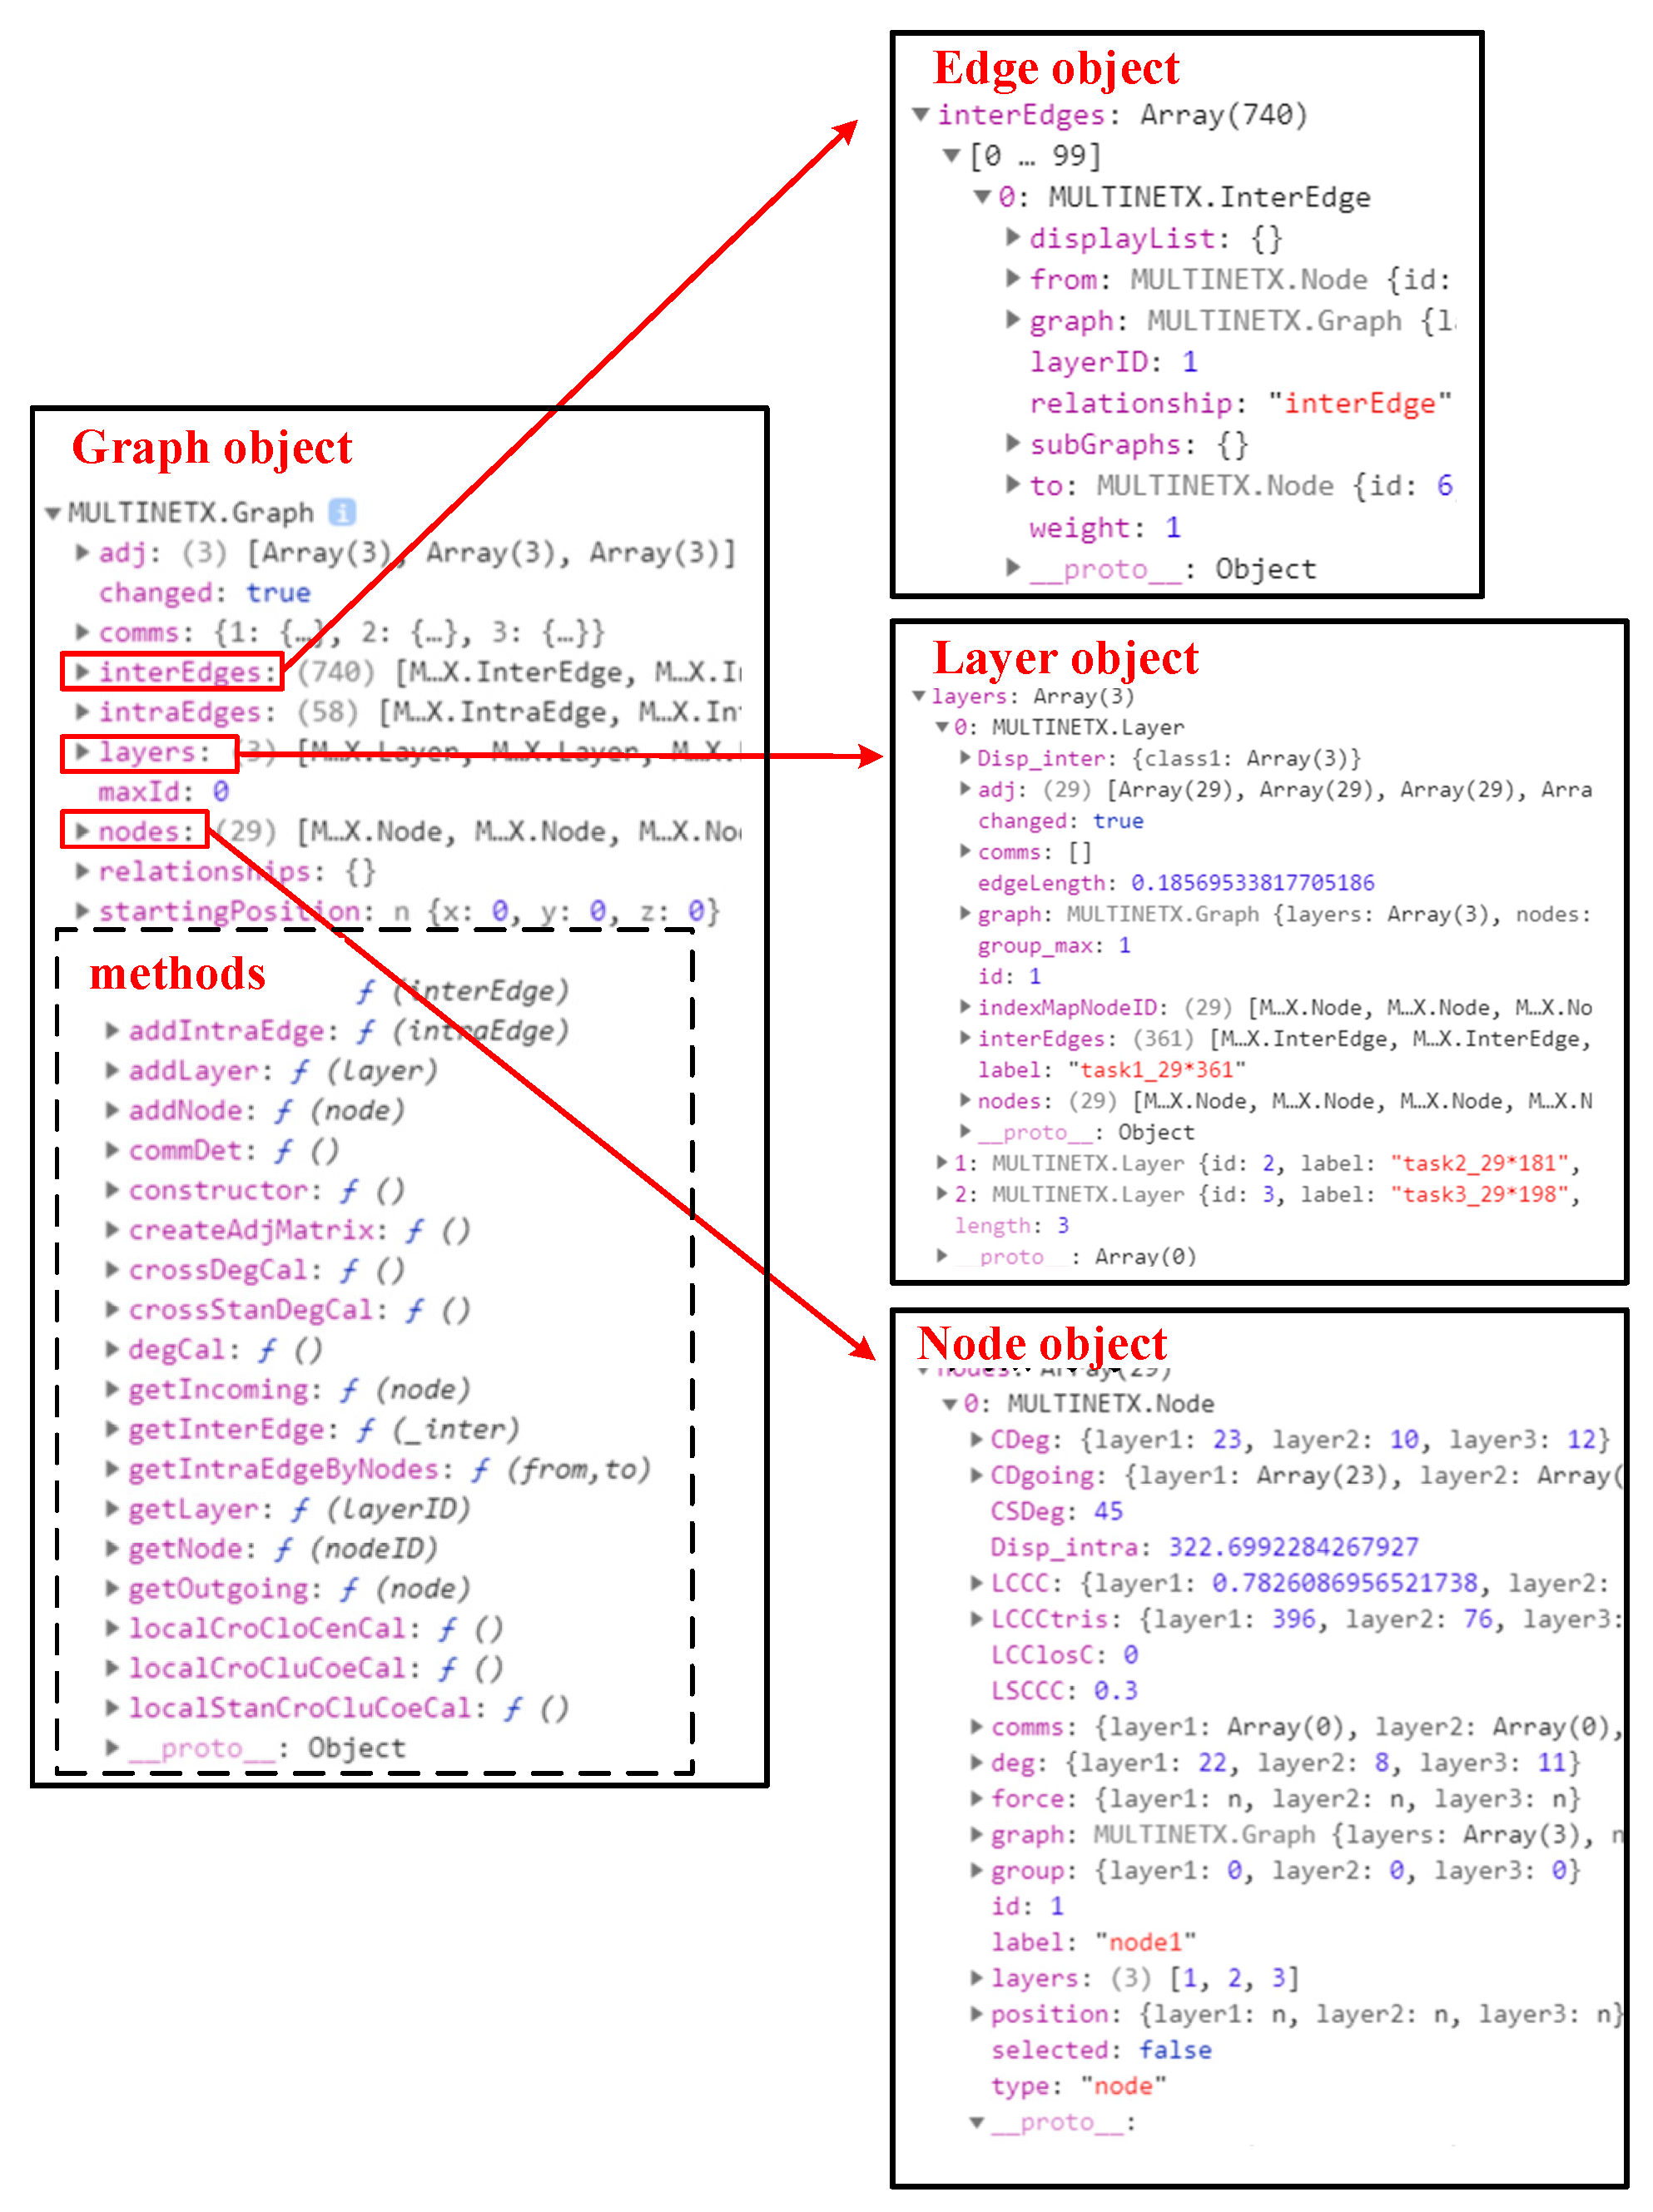
The data-processing module preprocesses imported network data and generates the data objects shown in Figure 5. The graph object (left) includes related layer, node, and edge data, as well as methods for adding and deleting nodes and edges, community detection, attribute calculation, and node and edge searching. The edge, layer, and node objects (right, from top to bottom) store related attributes.
Figure 5.
Multilayer-network data object.
4.3.2. View-Display Module
The view-display module includes the topology view and the high-order pattern-information view. The topology view shows the topology of the compressed network according to compressed layout algorithms and the original network according to optimization layout algorithms.
- (1) Compressed layout display
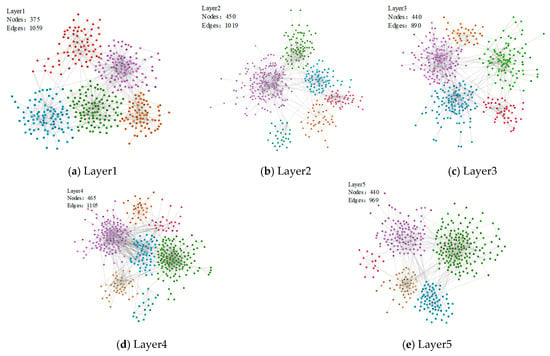
Compressed layout algorithms compress the multilayer network and arrange the nodes of each network layer to obtain the framework of each layer, which can be used for comparative analysis across layers. As shown in Figure 6, five subfigures show the framework of each layer in the case multilayer network. The upper-left corner of each subfigure indicates the network-layer label and the numbers of nodes and edges.
Figure 6.
Compression layout of topical structure view for case network layers.
- (2) Optimized layout display
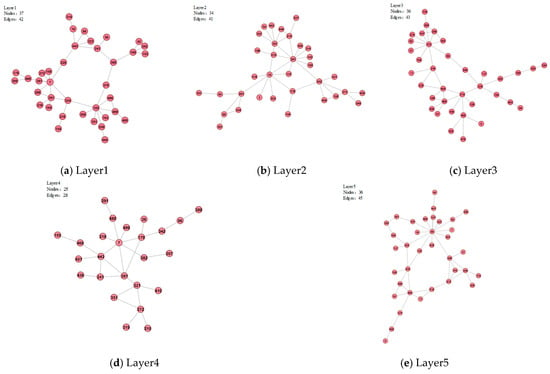
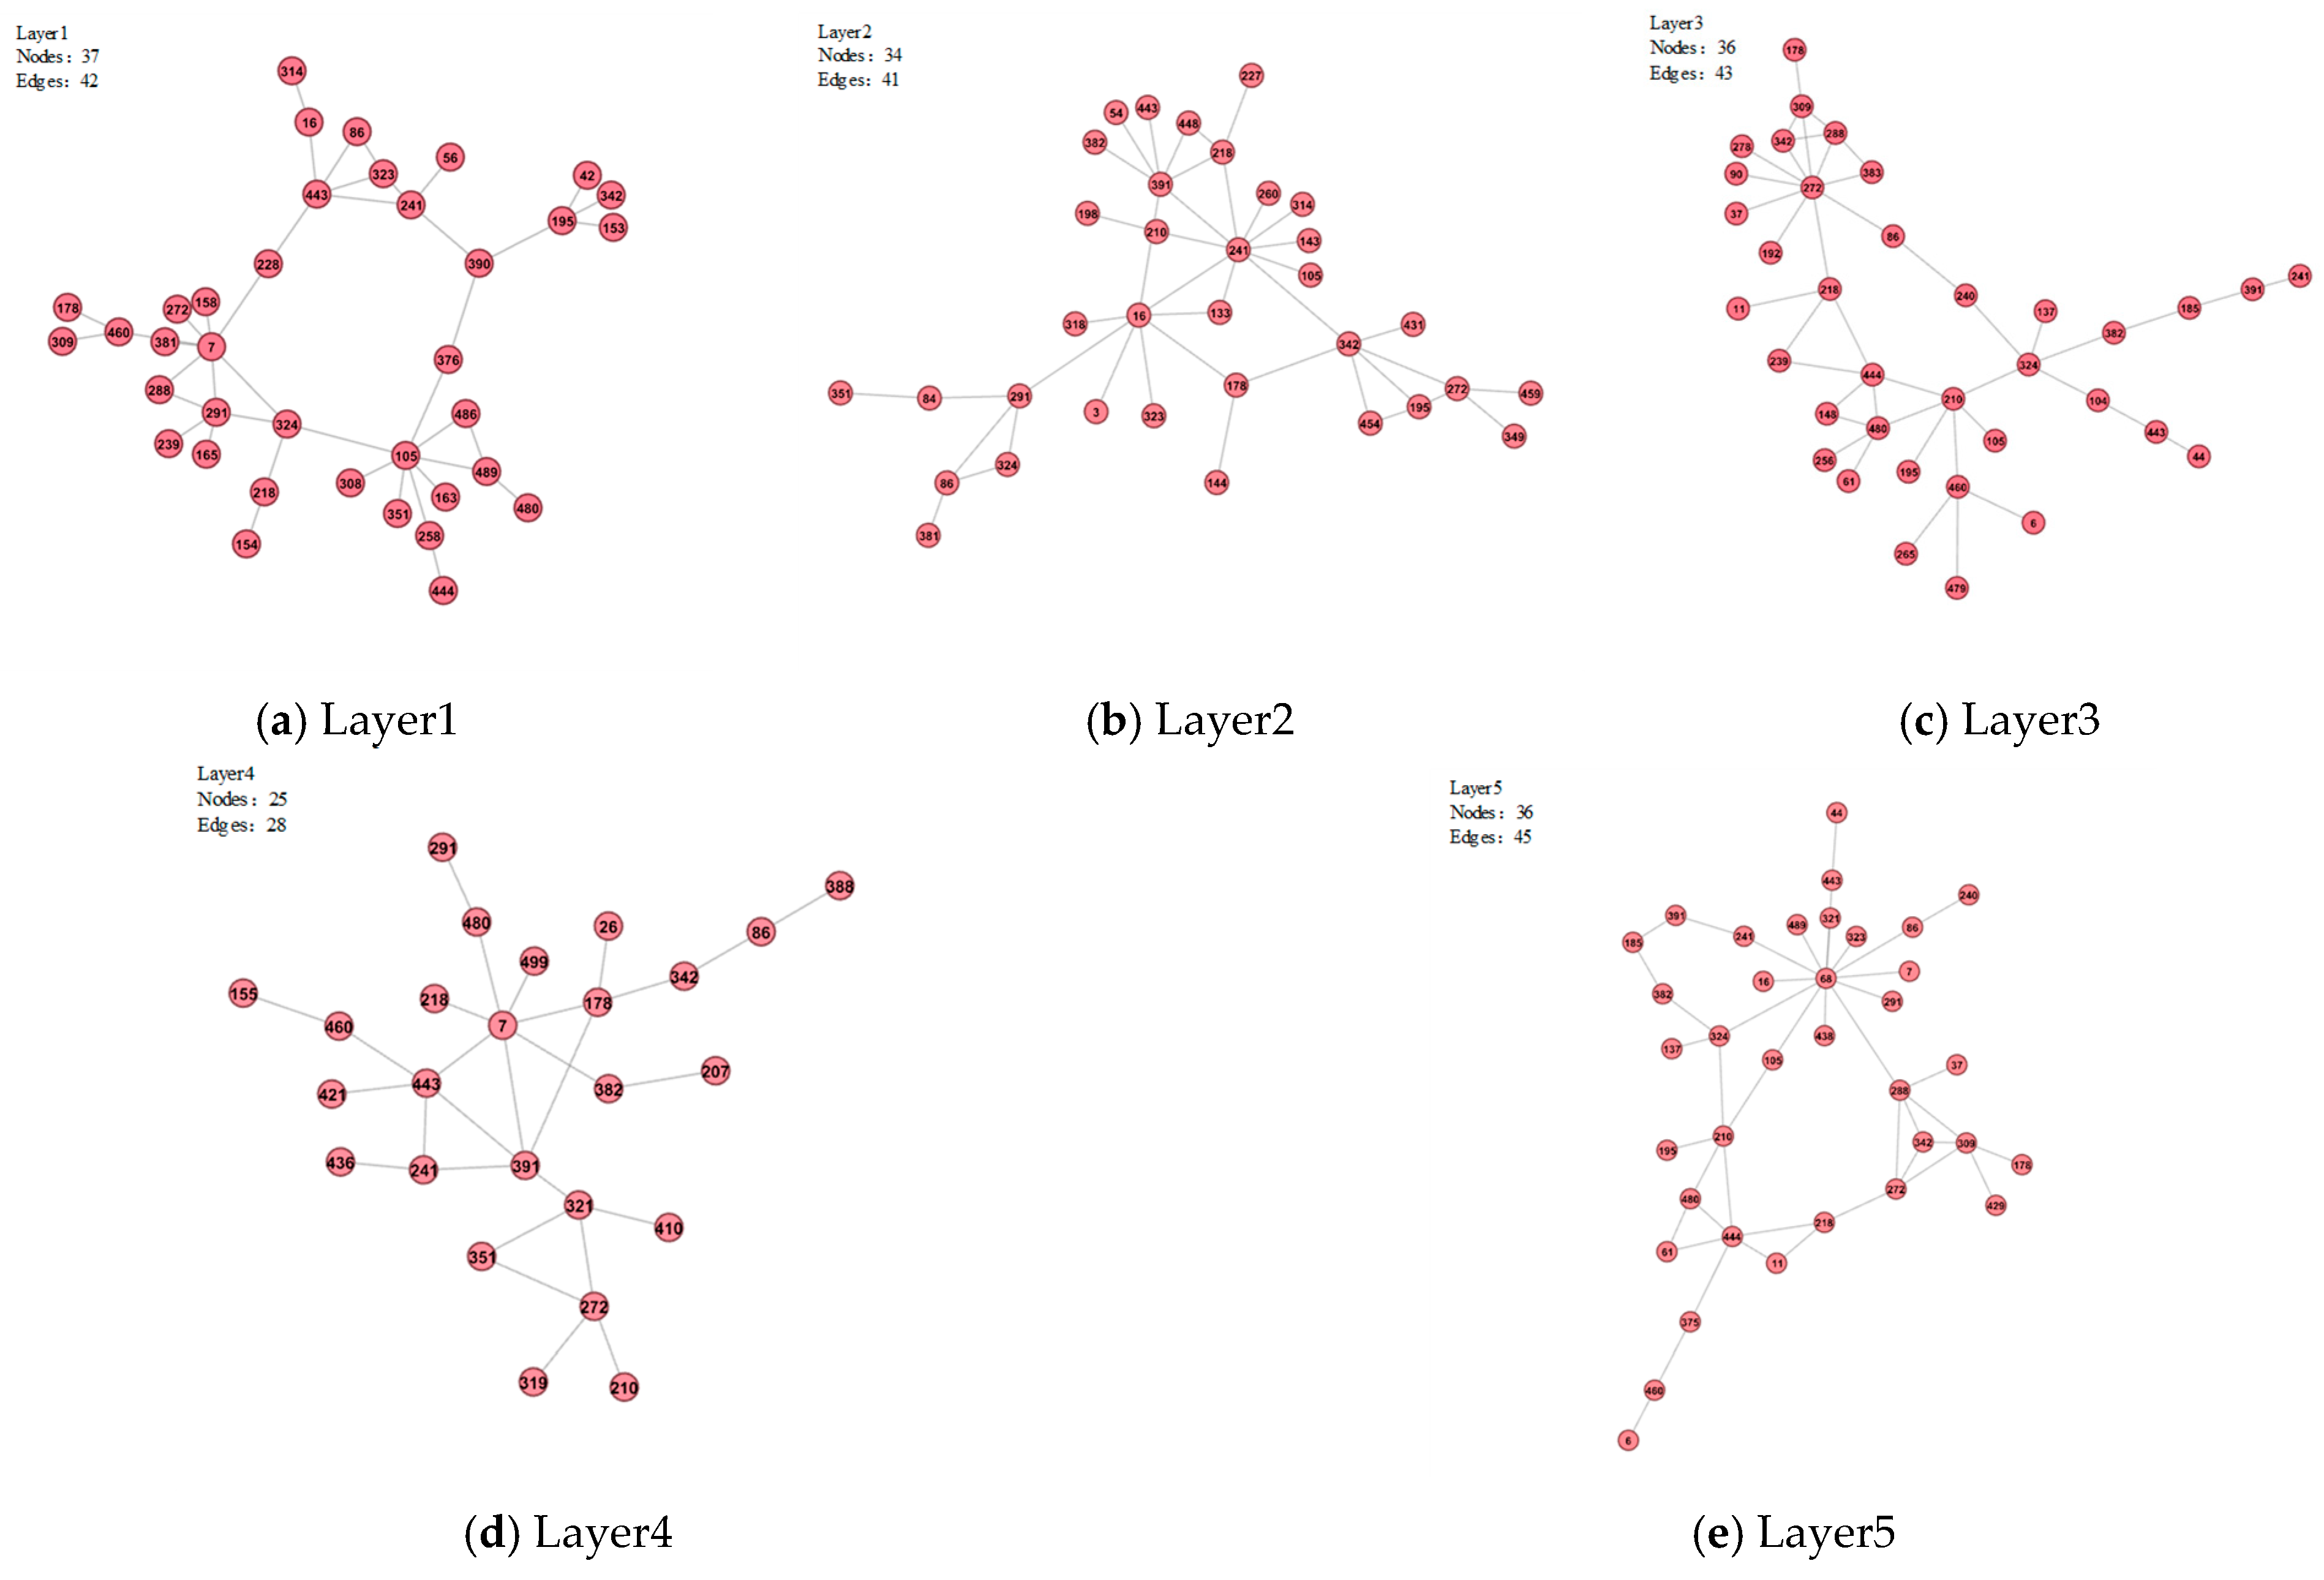
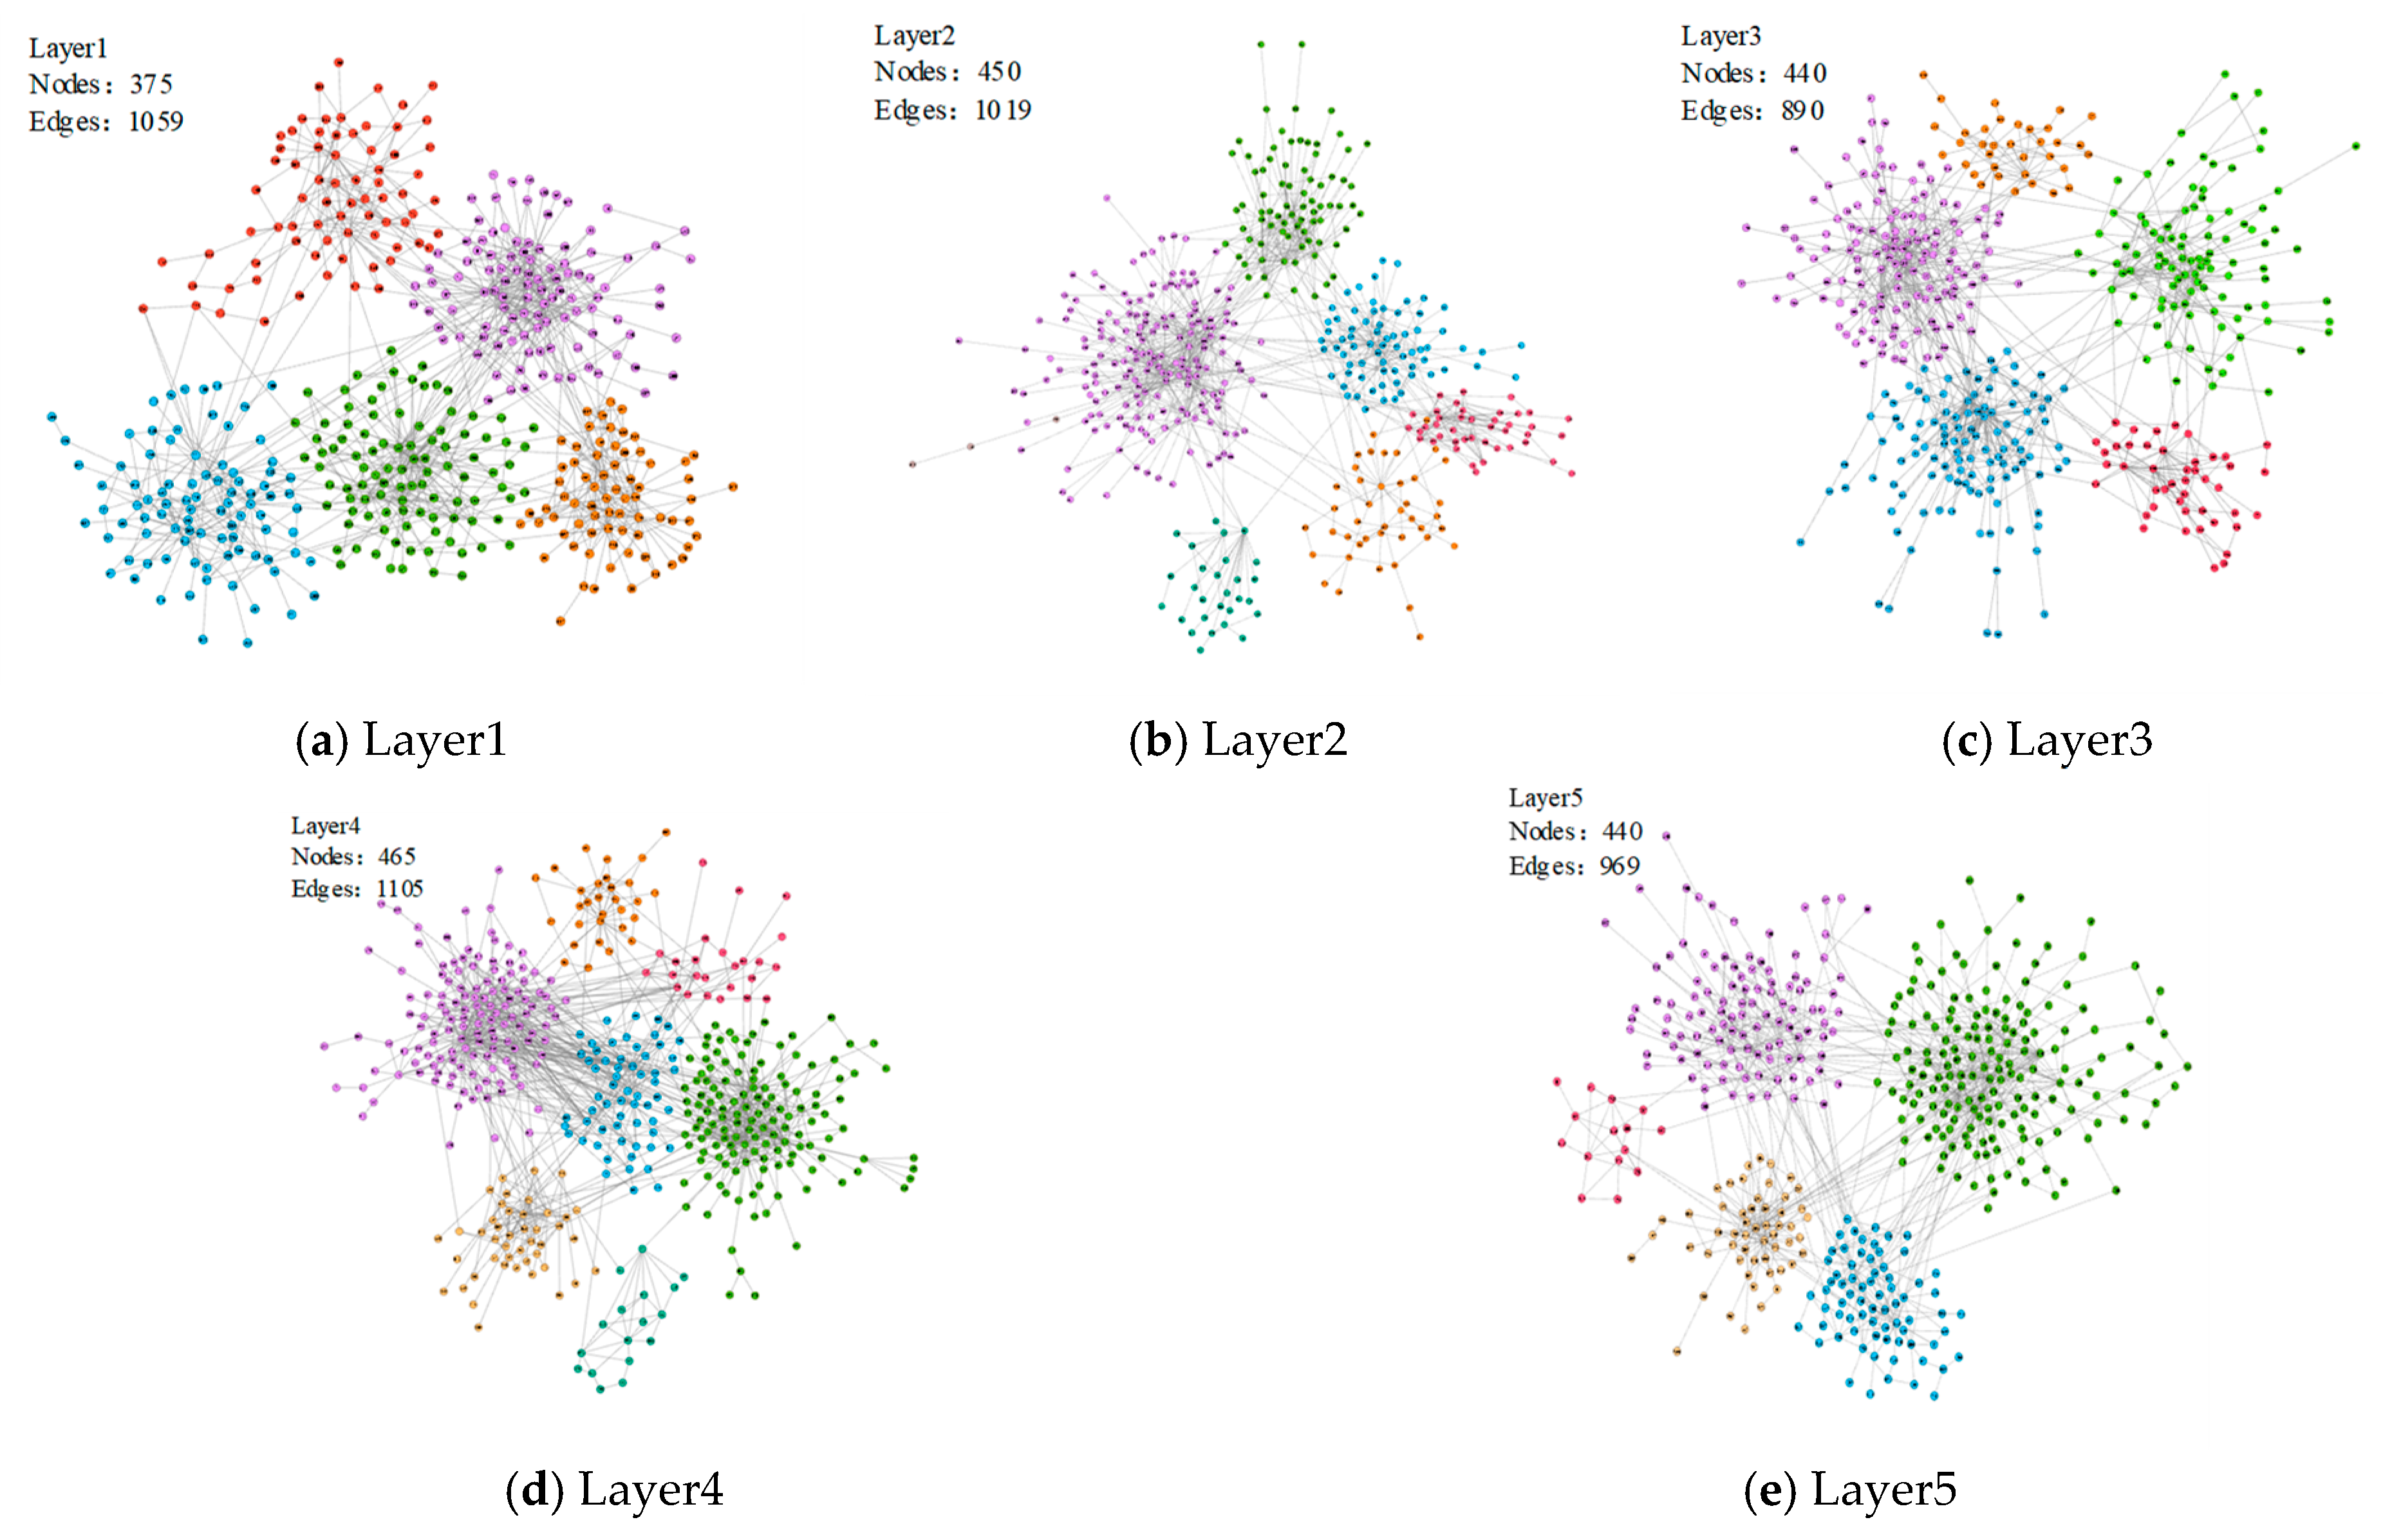
Optimized layout algorithms arrange the network layers of the multilayer network to obtain the original network-layer topology views, as shown in Figure 7. The upper-left corner of each subfigure indicates the network-layer label and the numbers of nodes and edges.
Figure 7.
Optimization layout of topical structure view for case network layers.
- (3) Similarity pattern display
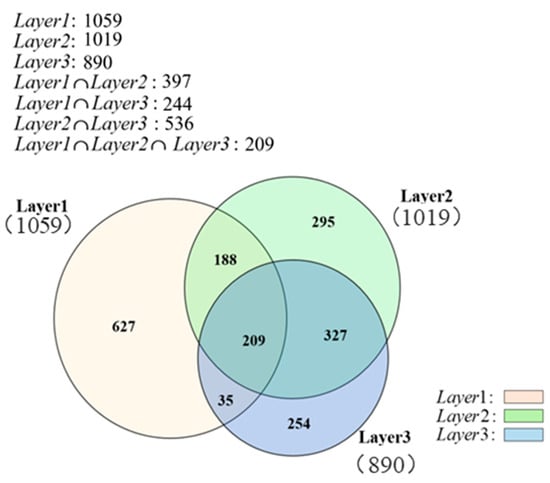
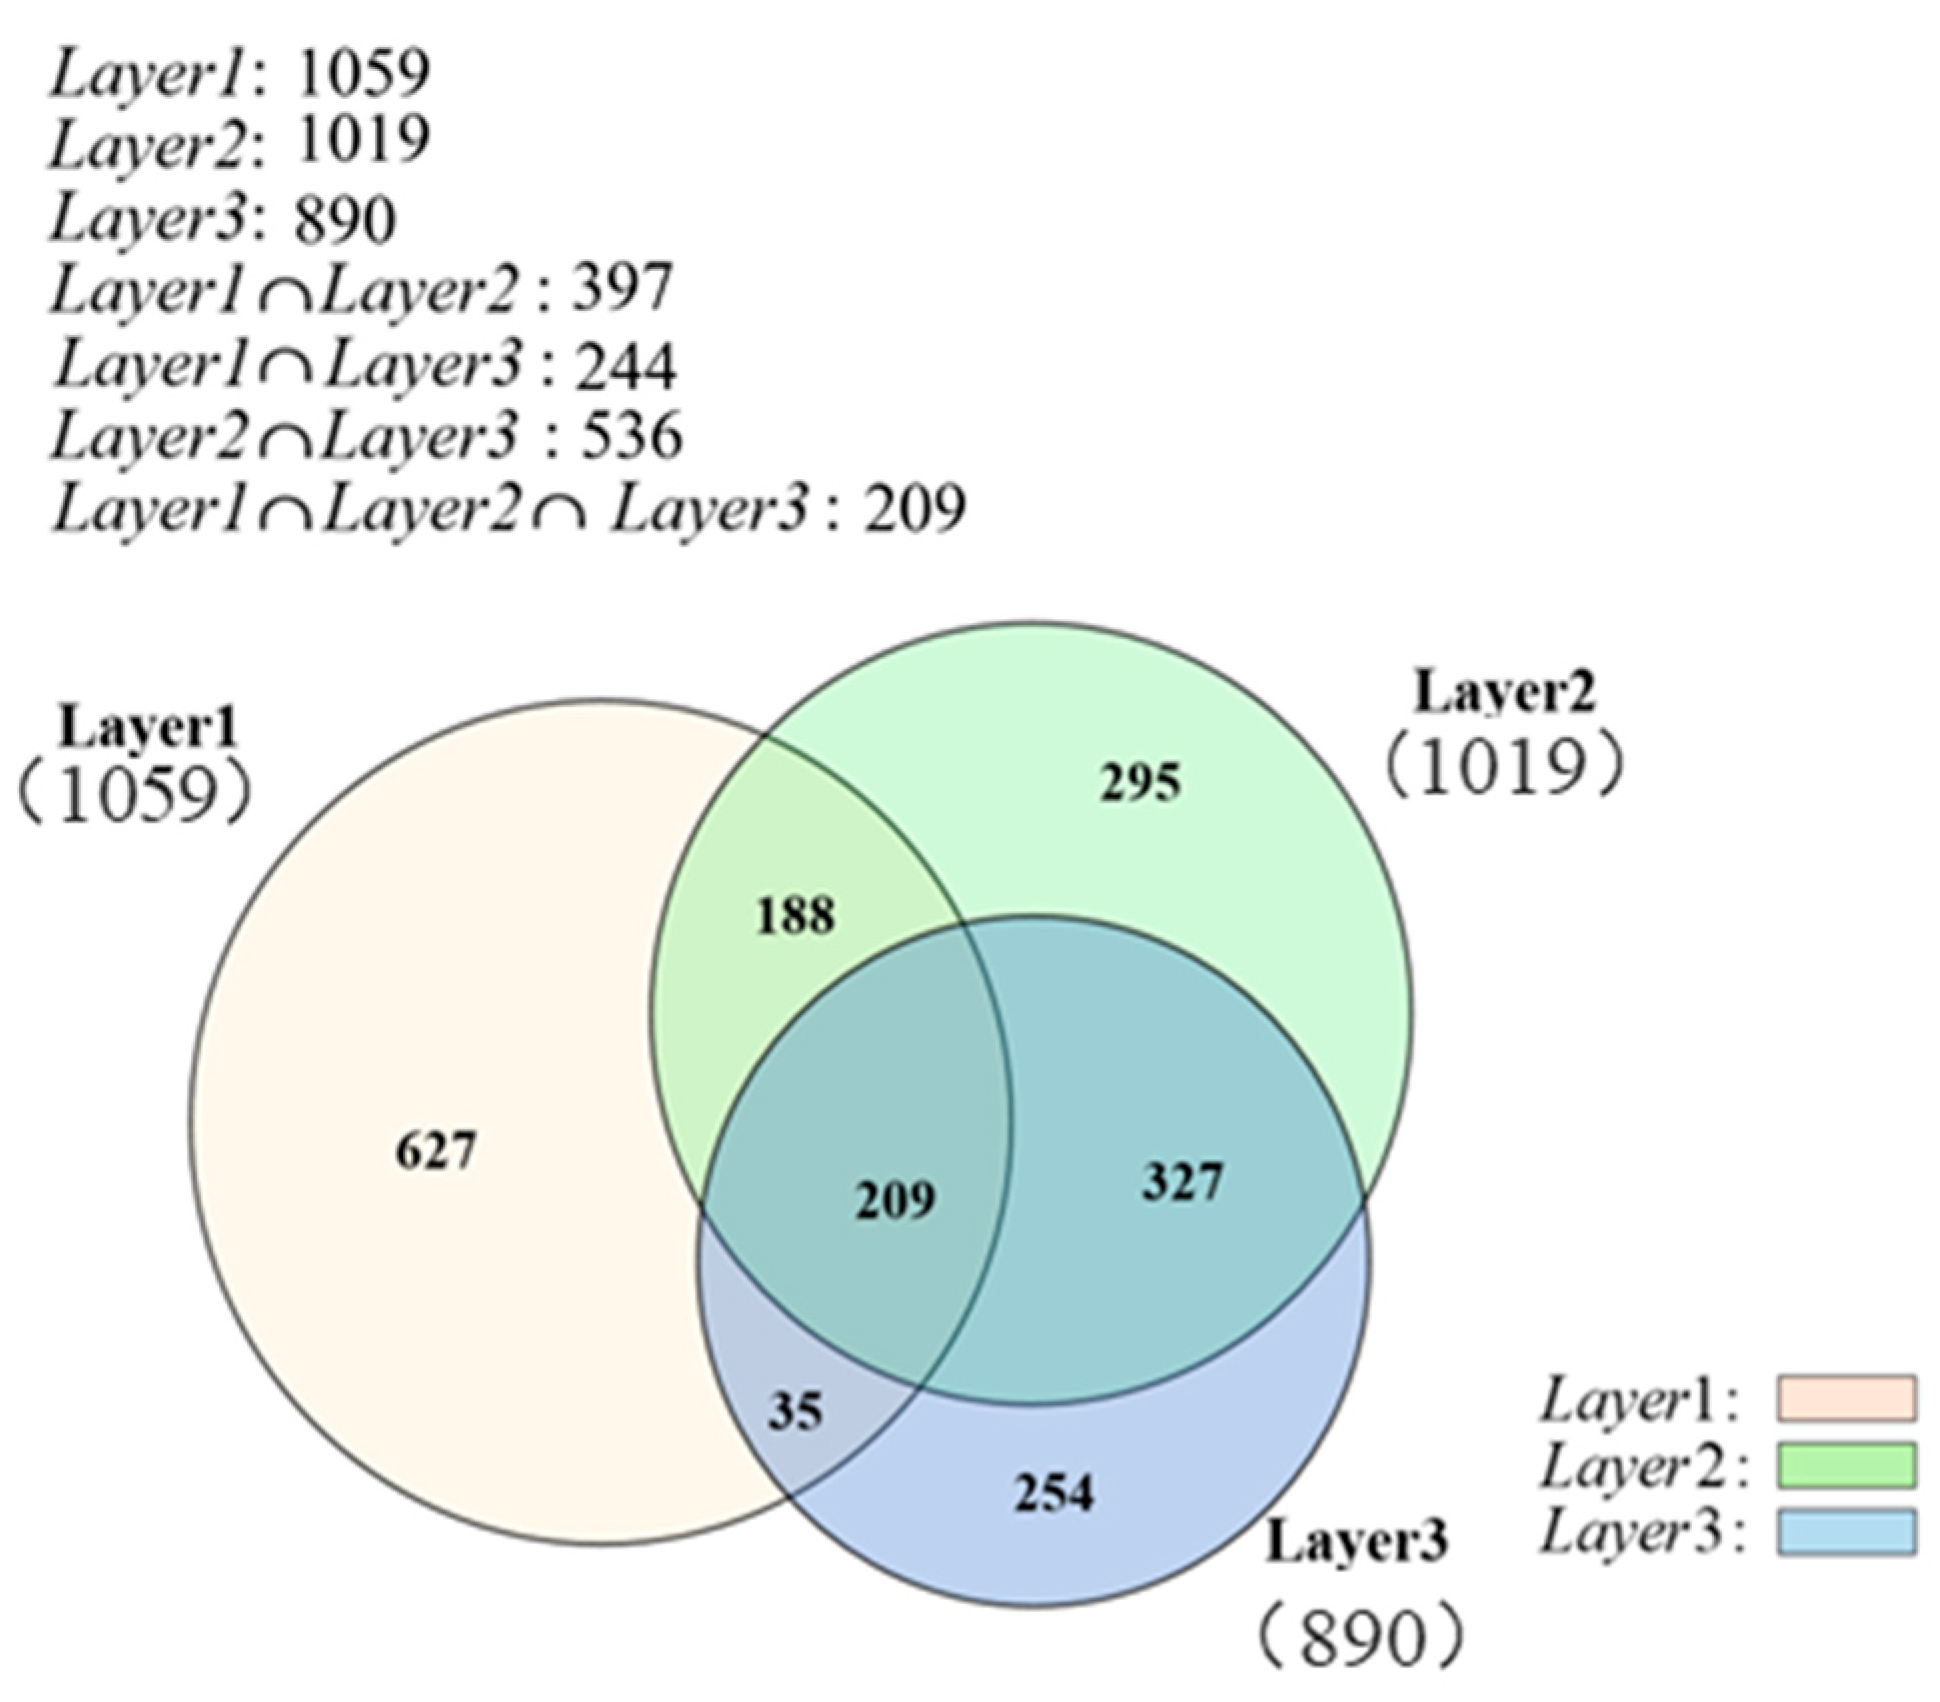
The duplication of nodes and edges across different layers, i.e., the overlap structure, primarily sustains the functions of a multilayer network. High-order pattern-extraction algorithms and visualization methods can be combined to display similarity patterns: each layer is treated as a set, the nodes (or edges) in each layer are the elements of the set, and overlapping nodes (or edges) correspond to set intersections. The similarity pattern displays the overlap structure of selected layers as area-proportional Venn diagrams, while the size of each individual set and overlapping intersection layer is quantitatively scaled according to the number of nodes or edges belonging to the certain layer. The visualization supports pairwise and triple intersections among three layer sets, and the node or edge count within each intersection layer is directly annotated on the diagram. Therefore, these Venn diagrams serve as quantitative visual representations rather than purely illustrative sketches, where the size of each overlapping area represents the number of overlapping nodes or edges, supporting analysis of multilayer-network topology. A key feature of area-proportional Venn diagrams is that each area is proportional to the cardinality of the corresponding set intersection; the computation of areas and coordinates is crucial for drawing the diagrams.
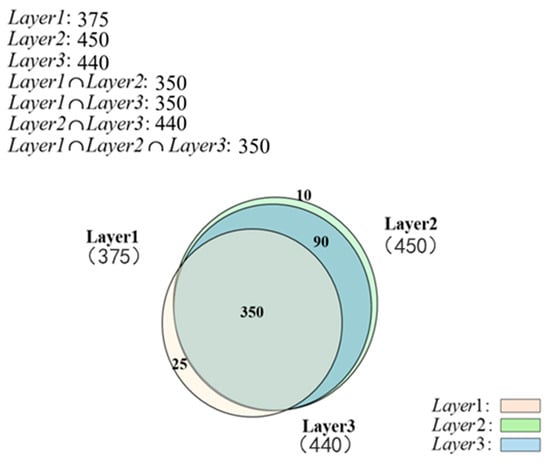
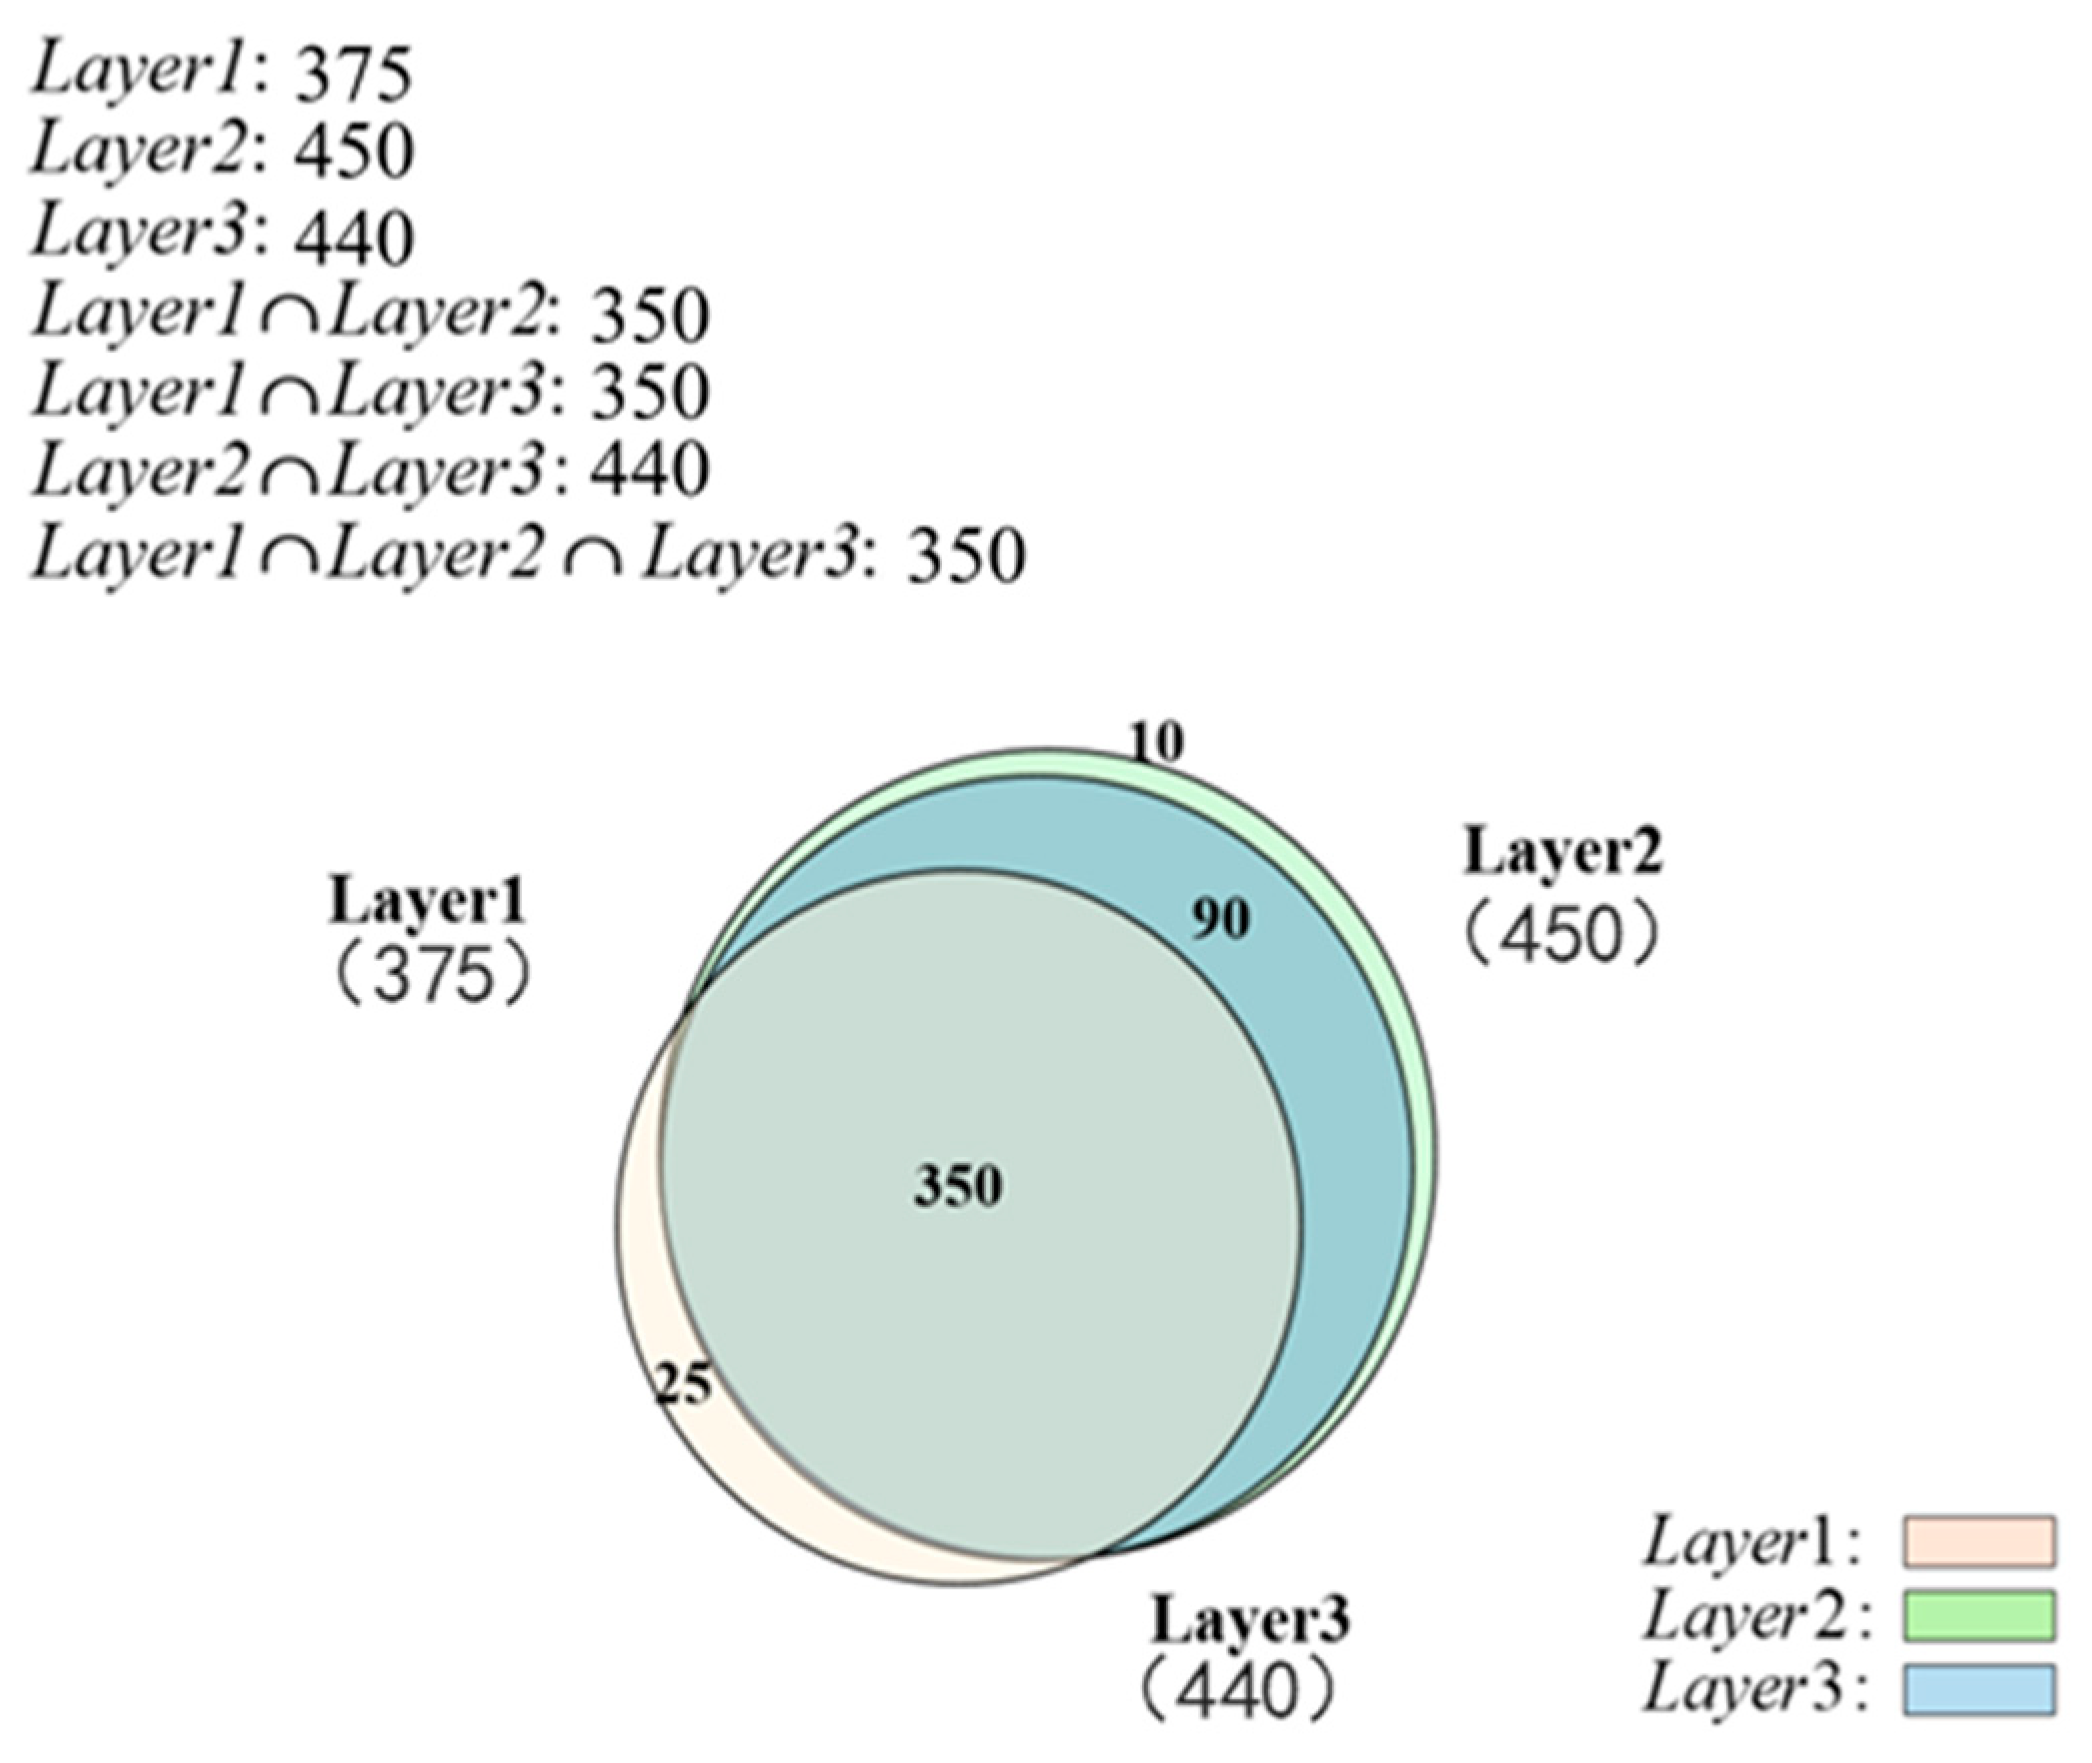
Figure 8 and Figure 9 are the Venn-diagram-based quantification of node-set and edge-set overlap across three network layers. Each layer uses the base color specified in the legend. Owing to transparency settings, overlapping regions show blended colors to support discrimination of multi-set overlaps. Values in parentheses represent edge counts.
Figure 8.
Nodes overlapped in Layer1, Layer2 and Layer3 of case network.
Figure 9.
Edges overlapped in Layer1, Layer2 and Layer3 of case network.
As shown in Figure 8, there are 375, 450, and 440 nodes respectively in Layer1, Layer2 and Layer3. There are 350 overlapping nodes between Layer1 and Layer2, 350 overlapping nodes between Layer1 and Layer3, 440 overlapping nodes between Layer2 and Layer3, and 350 overlapping nodes shared by Layer1, Layer2 and Layer3.
As shown in Figure 9, there are 1059, 1019, and 890 edges in Layer1, Layer2, and Layer3, respectively. Among these, 397 edges are shared between Layer1 and Layer2, 244 edges between Layer1 and Layer3, 536 edges between Layer2 and Layer3, and 209 edges appear in all three layers.
- (4) Interaction pattern display
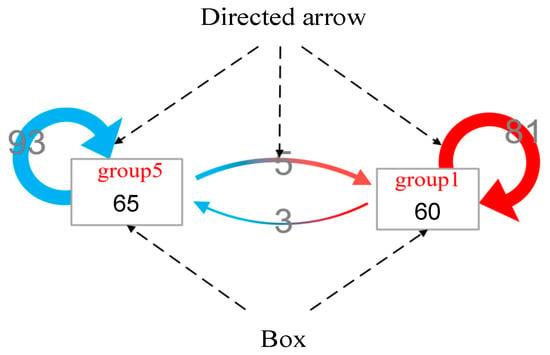
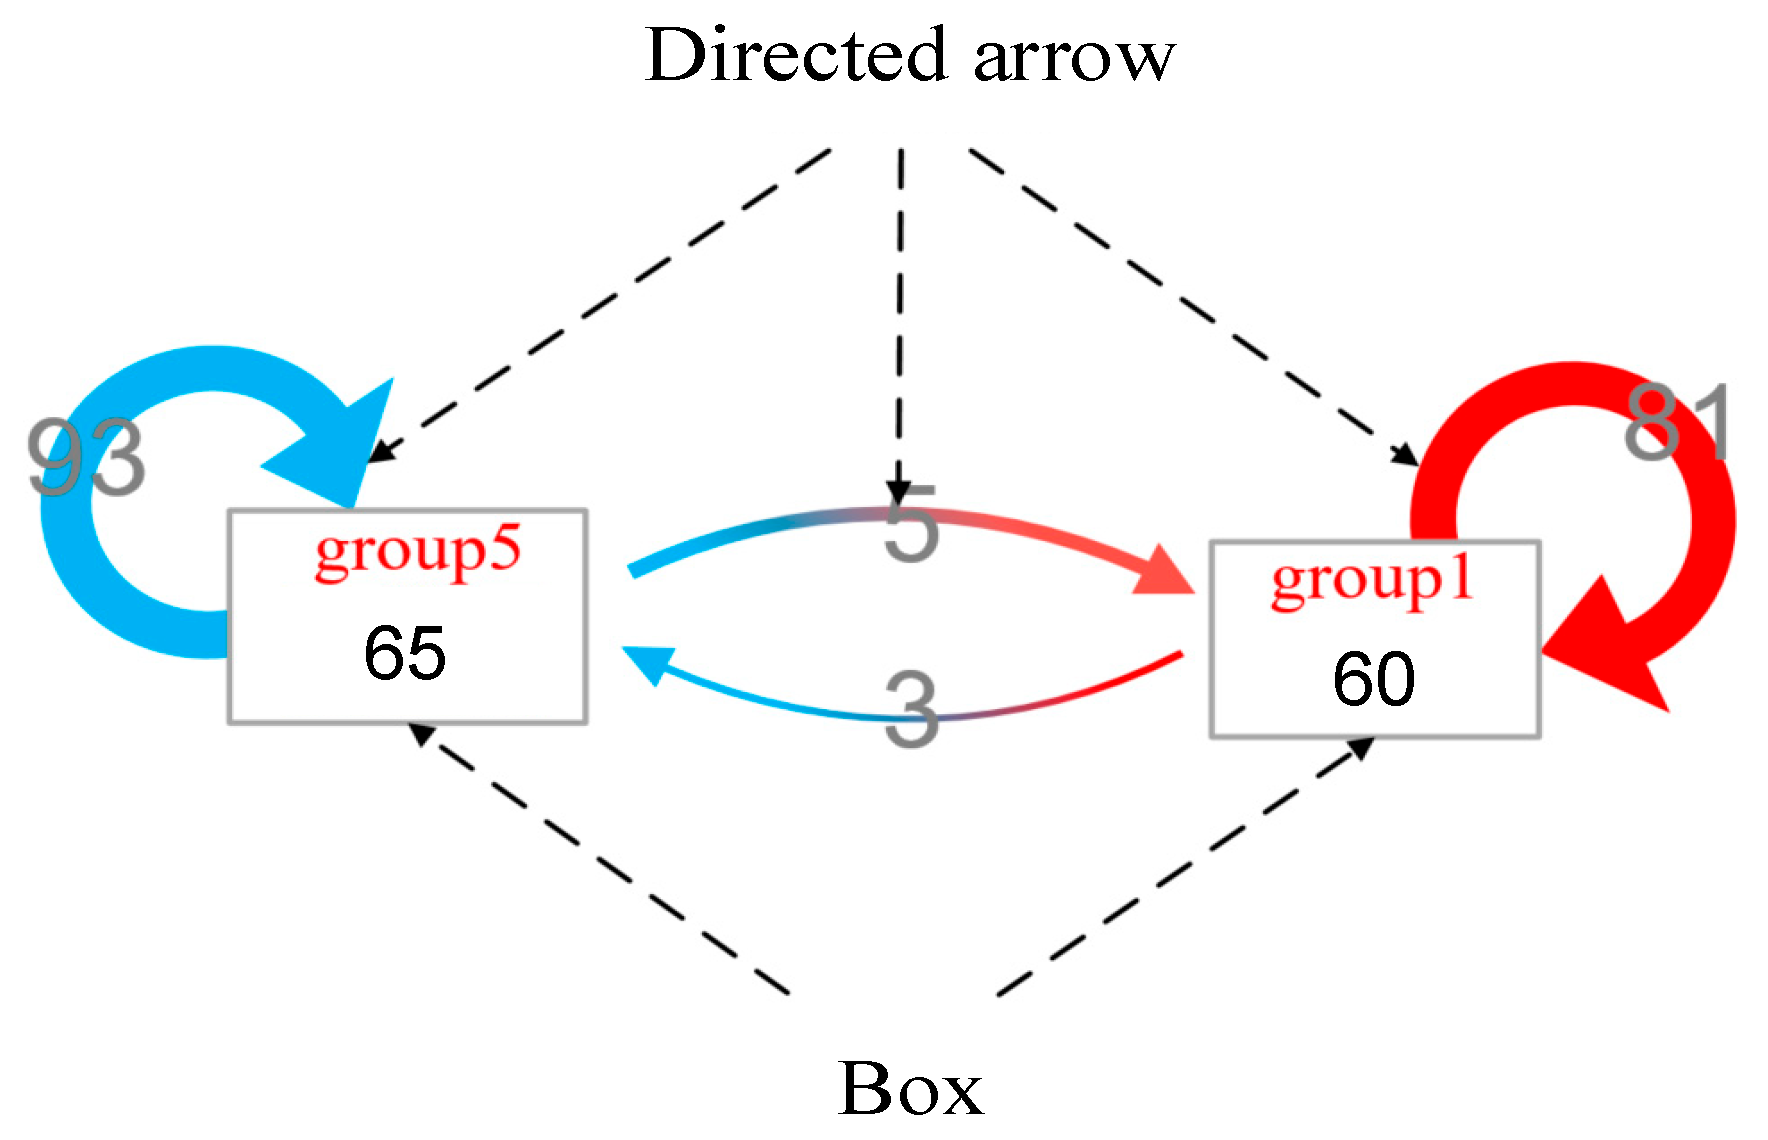
Detailed interaction information among selected areas within a layer is aggregated as an interaction pattern, such as statistics on the inner edges or nodes of an area, or the edges between selected areas. The interaction pattern can be displayed with directed arrows and boxes, as shown in Figure 10. When an area is selected through frame selection, the data selector, the layer selector, or node filtering, the corresponding interaction-pattern view is updated. The interaction pattern uses standardized editing subcomponents, through which colors and labels can be manually coded. The coordinates of directed arrows and boxes are computed using force-directed layout methods. Figure 10 illustrates the interaction patterns between two selected areas (group1 and group2). Group1 has 60 nodes and 81 intra-group edges, while group5 has 65 nodes and 93 intra-group edges. The number of directed edges from group1 to group5 is 3, and 5 edges run in the opposite direction.
Figure 10.
The interaction pattern visualization model.
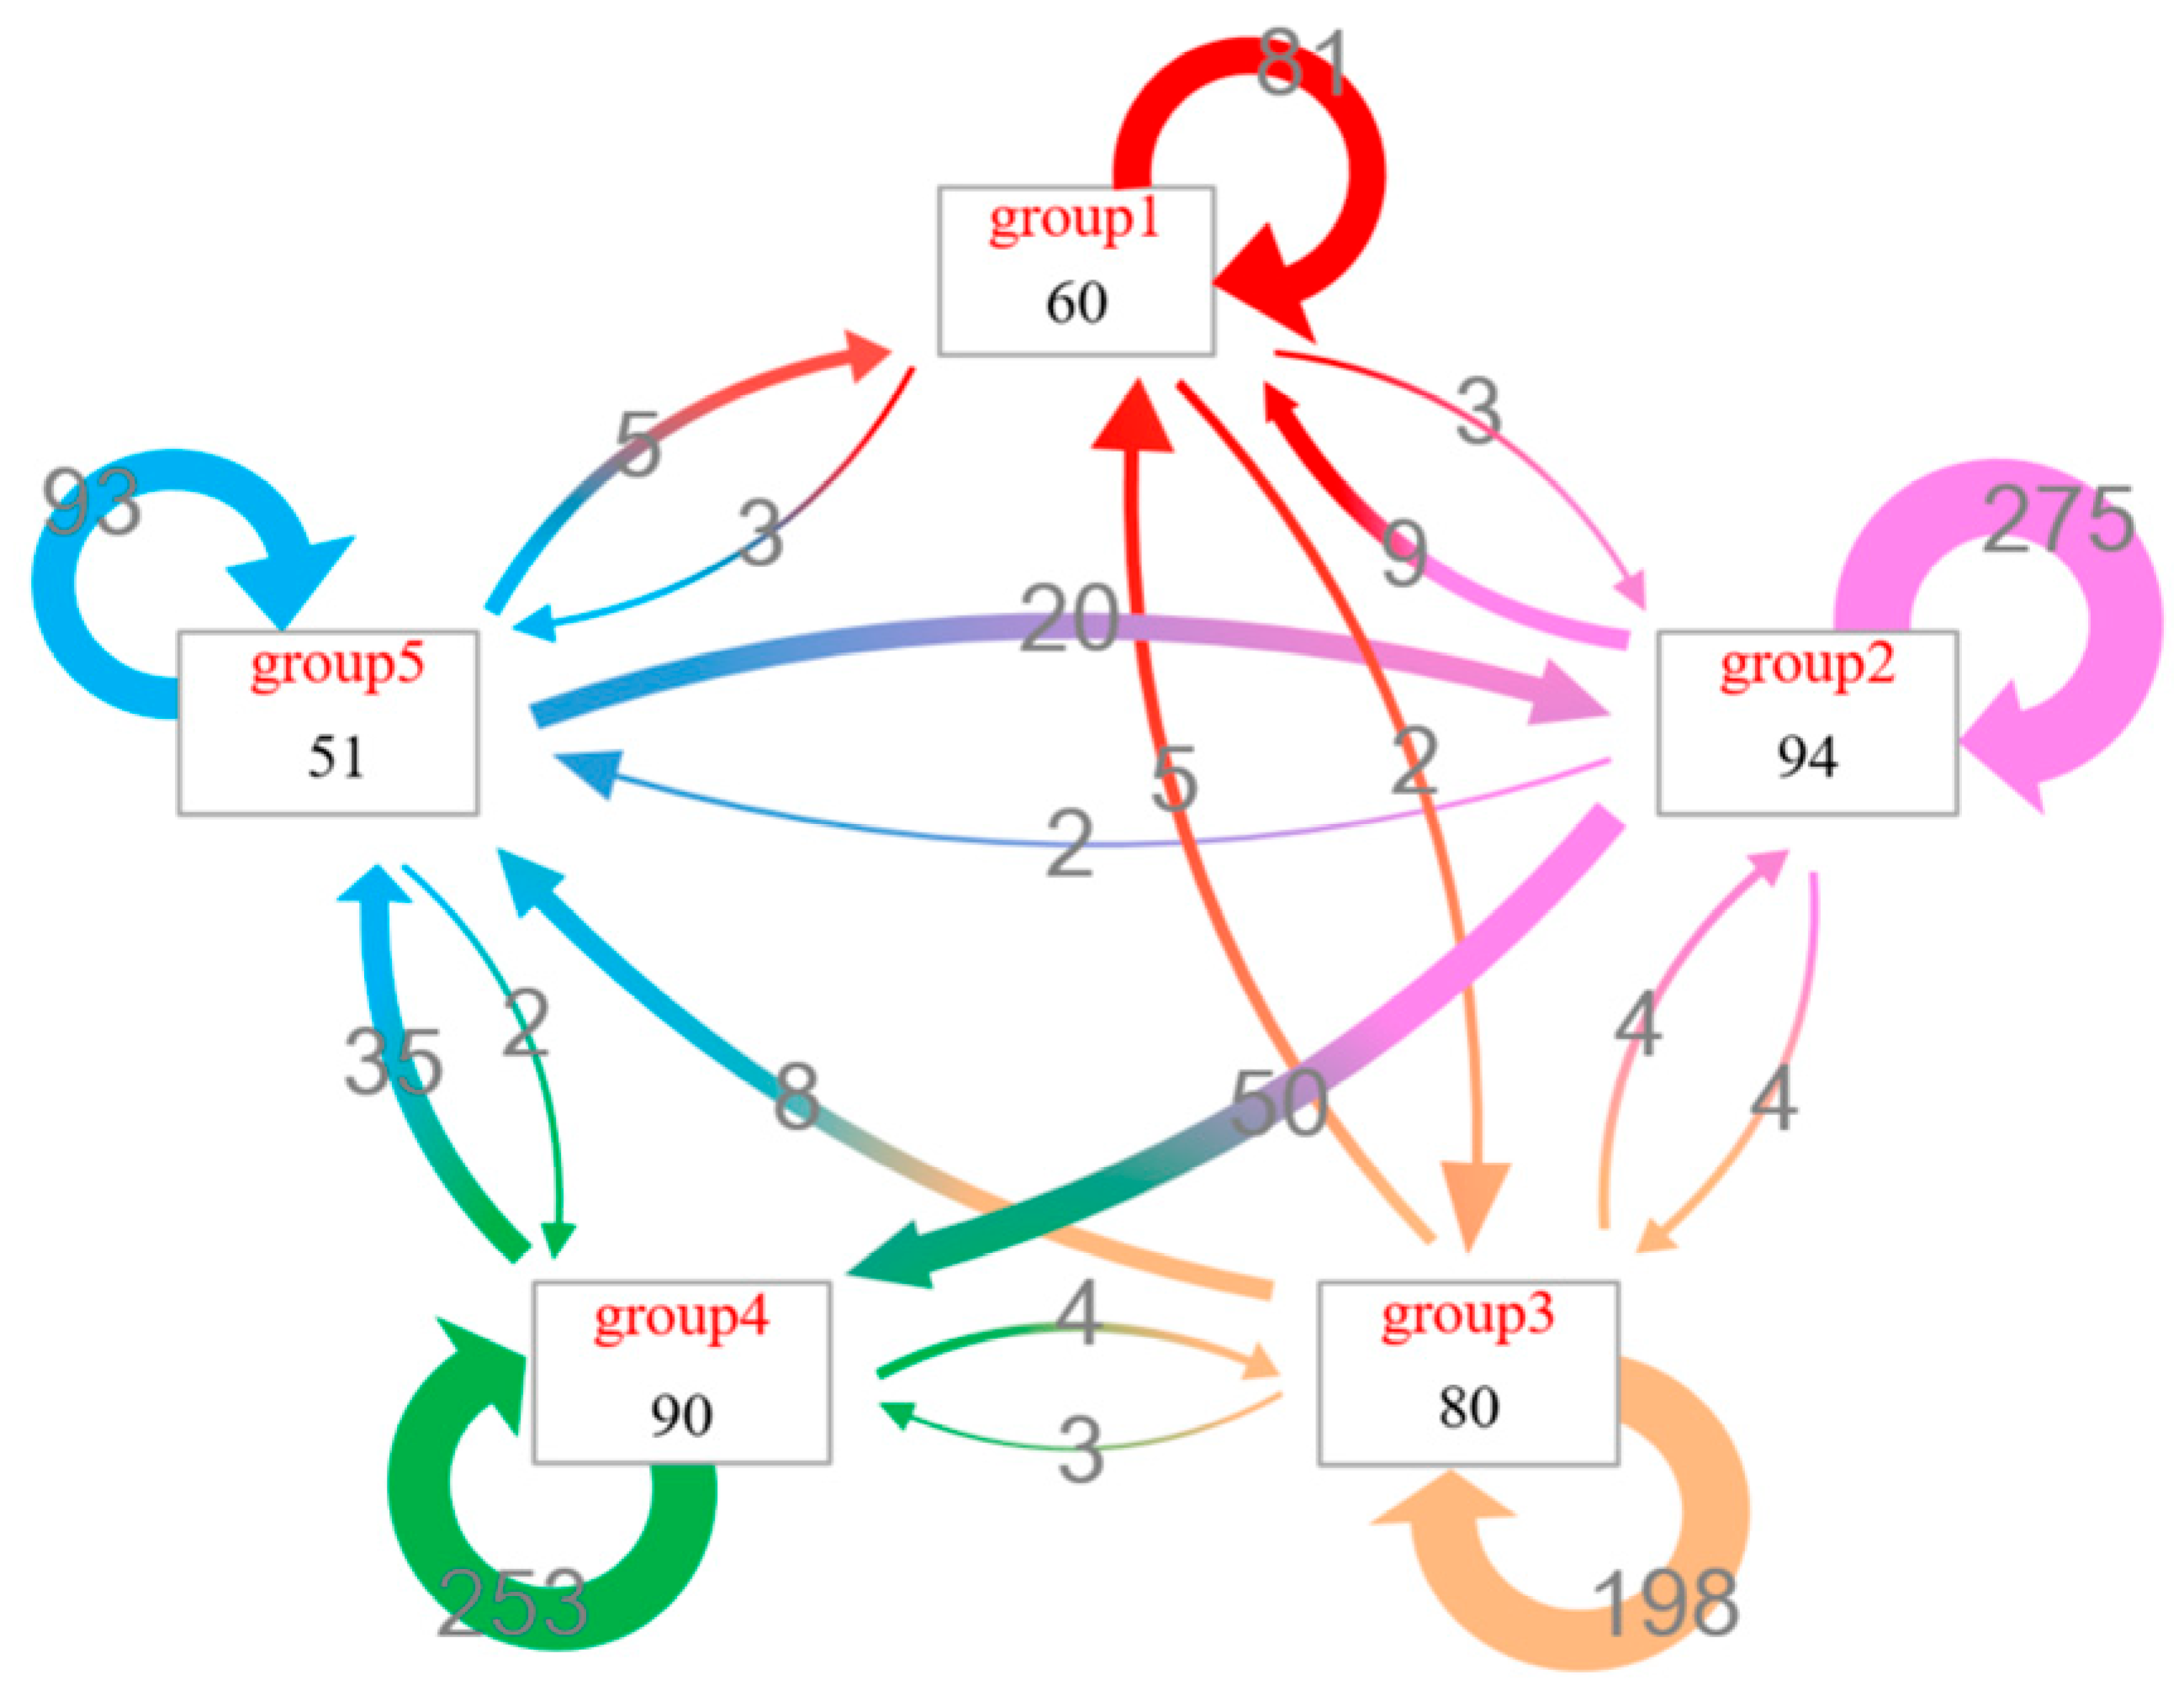
As shown in Figure 11, the interaction pattern among all communities on Layer1 is displayed, where all nodes of Layer1 are divided into five groups. The node counts in each community are 60, 94, 80, 90, and 51, respectively, while the inner-edge counts are 84, 275, 198, 253, and 193. The number of edges from group2 to group4 is 50, indicating that the connection from group2 to group4 is the strongest; the reverse connection count is 0.
Figure 11.
Interaction pattern view of Layer1 in case network.
4.3.3. Interactive Control Module
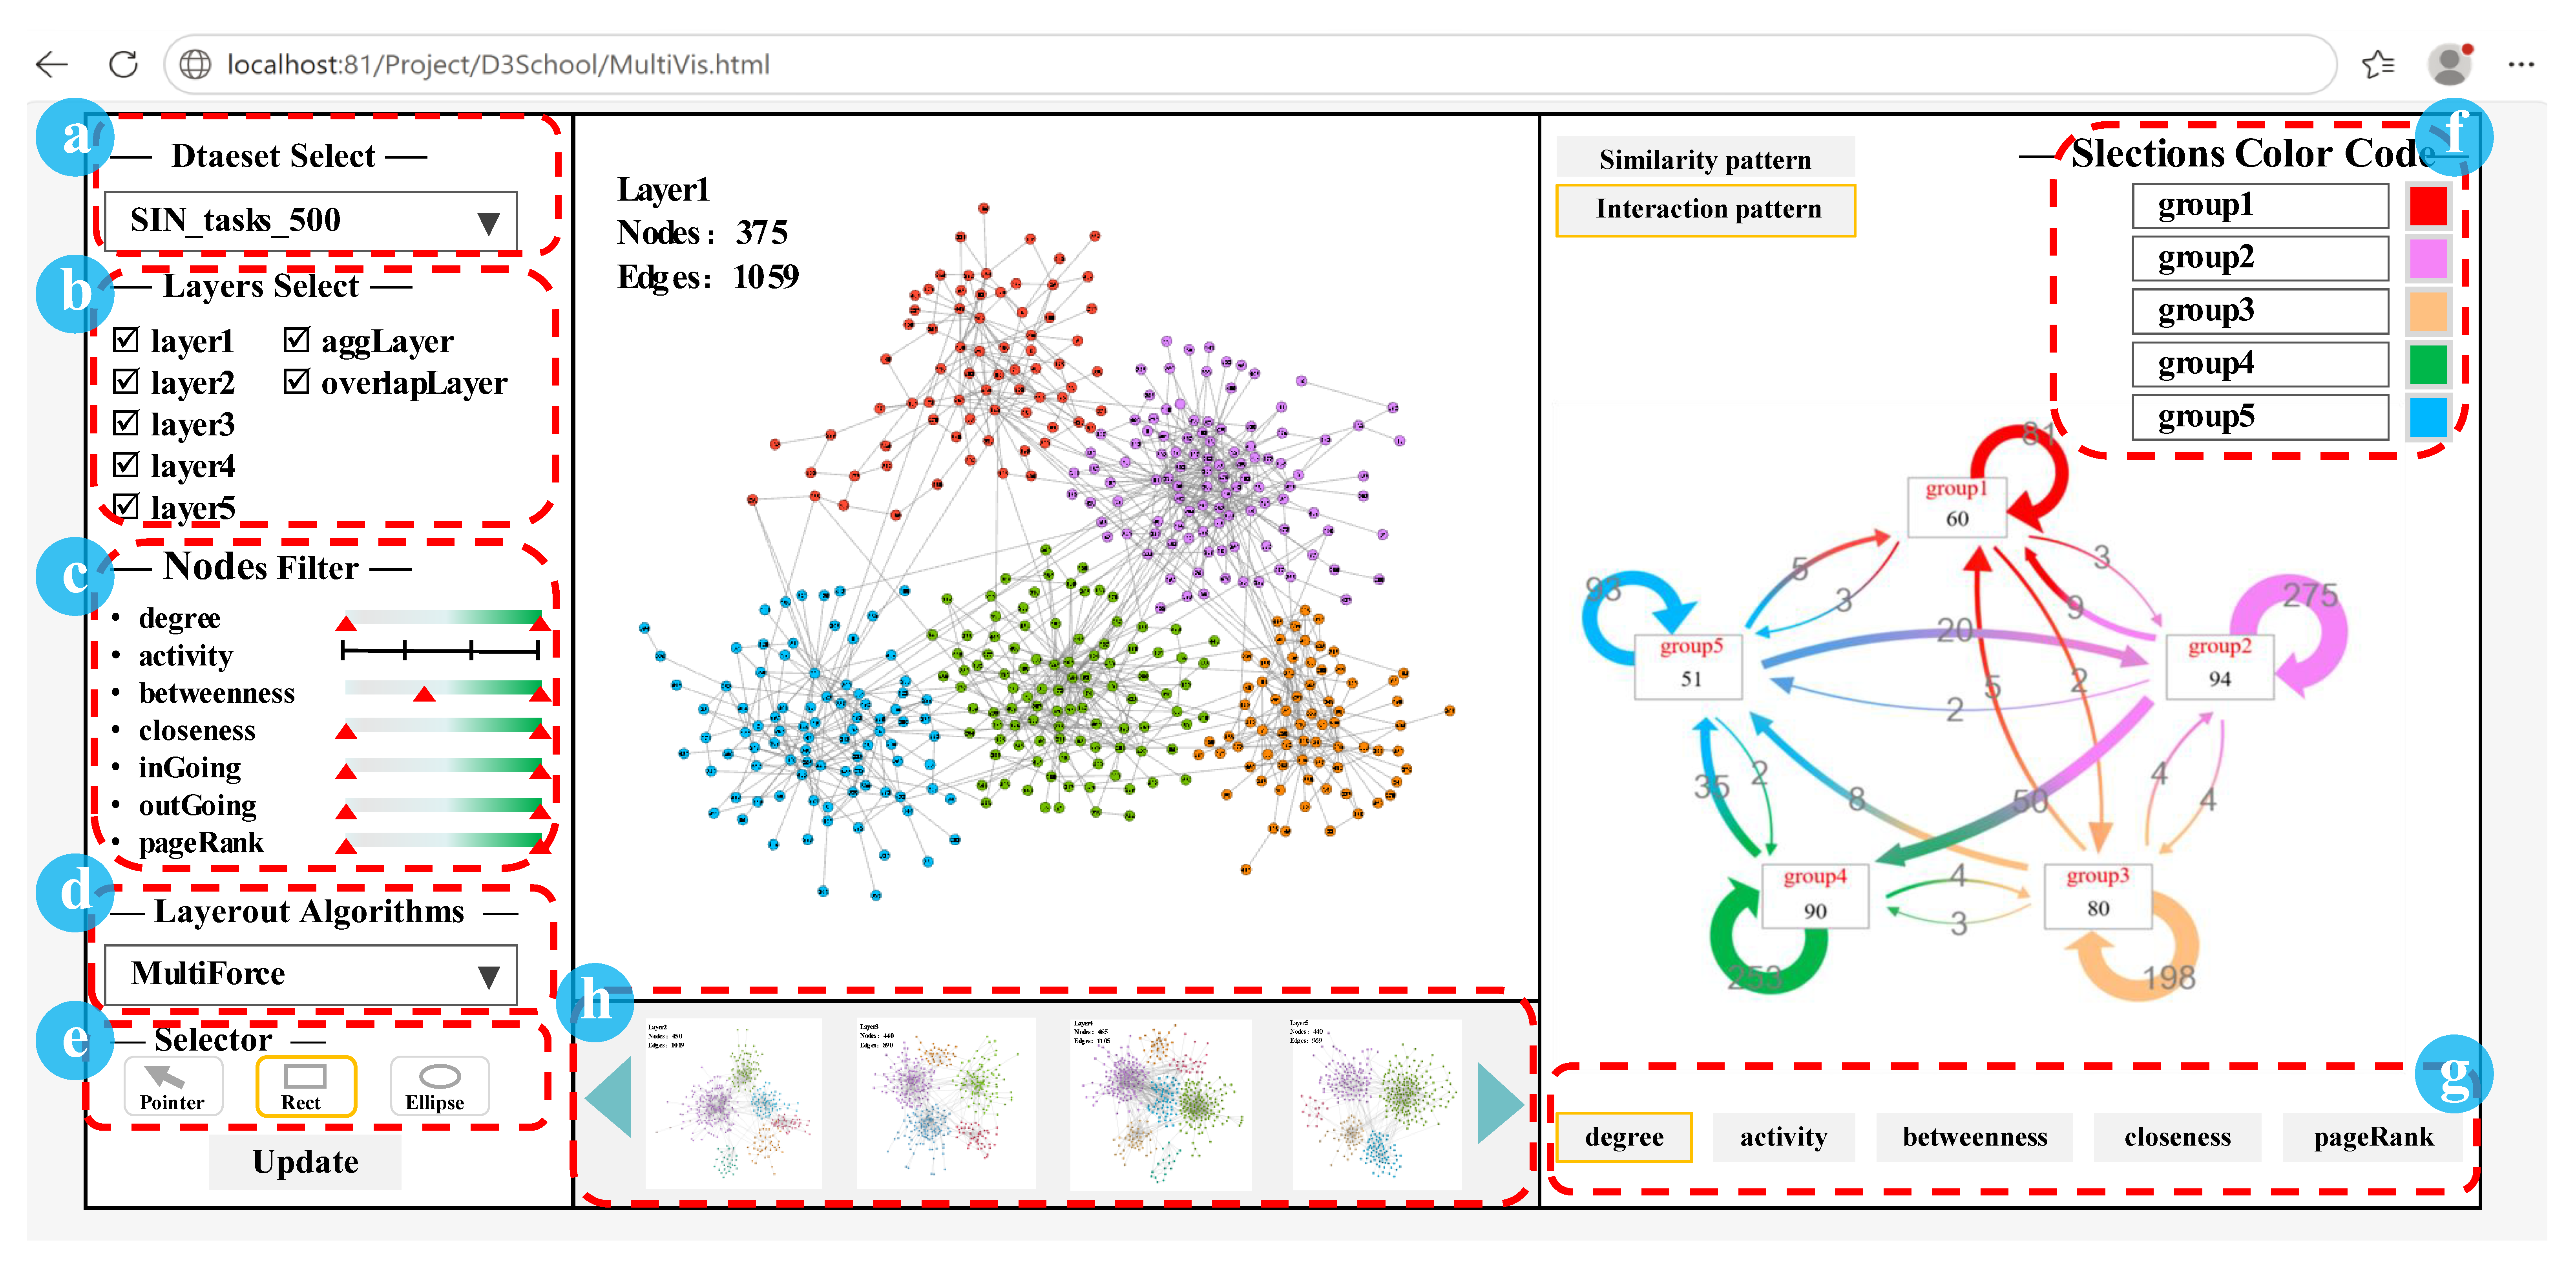
The interactive control module controls the output of visual views by regulating data, layout methods, visual elements, and views, as shown in Figure 12. The interface is divided into the following three parts: the left side is the data control panel, including (a) data selection, (b) layer selection, (c) node filtering, (d) layout algorithm, and (e) selector; the right side is the high-order pattern-information view control panel, including (f) selection color coding and (g) attribute list; and the middle is the topology-view control panel, including the currently presented network layer and (h) candidate network layers.
Figure 12.
Interactive control module interface.
4.4. Case Dataset
The multilayer network used in this manuscript is a synthetic simulated multilayer dataset with five layers. Each layer corresponds to one type of interaction relation in the abstract complex system. Nodes represent abstract system entities; each node can appear in one or multiple layers (node duplication across layers). Edges represent pairwise interaction relationships among entities within each layer. Edges are undirected and unweighted. The dataset contains 622 unique total nodes across five layers; per-layer node and edge statistics are summarized in Table 2. The synthetic multilayer dataset is generated with configurable community size, inter-layer node-overlap ratio and intra-layer edge density.
Table 2.
Statistics of the case multilayer-network dataset.
5. Discussion
To evaluate the perceived usefulness and usability of MultiVisSys, we conducted a user study comparing it with the following four representative tools: Gephi (version 0.10.1 [21]), MultiNets (web-based prototype, Piskorec et al. [13]), the, and MuxViz (version 3.1, De Domenico et al. [16]). The layer-aggregation method of De Domenico et al. [15] and edge-bundling method of Bourqui et al. [14] were excluded from the comparison because they address layer or edge reduction rather than topological visualization.
5.1. User-Study Setup
Thirteen participants were recruited through voluntary laboratory recruitment. The cohort comprised three PhD students specializing in information visualization, five master’s students, and five undergraduate students, all with prior exposure to information visualization and data mining. Each participant’s self-reported experience with multilayer-network visualization was recorded on a five-point Likert scale (1 = no experience; 5 = extensive experience). Aggregated statistics: mean = 2.77, median = 3, standard deviation = 0.92, indicating a moderate level of domain familiarity.
The study employed a within-subjects design in which every participant used all four systems, including Gephi (v0.10.1), MultiNets web prototype, MuxViz-v3.1 web interface and MultiVisSys. All systems were tested using the same case dataset described in Section 4.3 and the same set of analytical tasks. Before the evaluation, each participant received a standardized 10 min training session consisting of a demonstration video and a hands-on practice exercise with a sample dataset. Participants then performed the following three standardized analytical tasks: (T1) identify overlapping node sets across layers; (T2) compare macro skeleton structural differences between network layers; and (T3) analyze the intra-community interaction pattern within a selected layer. The total evaluation time per participant was approximately 45 min, including training.
A feature-oriented qualitative comparison was conducted among MultiVisSys and three representative multilayer-network-visualization tools, namely Gephi, MultiNets, and MuxViz. The software versions and the corresponding system configurations of the four tools are summarized in Table 3. Six dimensions were considered in the comparison, including support for multilayer topology, cross-layer comparison capability, quantification of node and edge overlap, multi-view interaction, visual encoding, and filtering operations.
Table 3.
Software and system configurations for evaluated tools.
Several limitations were acknowledged in the study design. The order in which systems were presented was not randomized using a Latin-square design, which may introduce learning or ordering effects. Task completion time and accuracy were not systematically recorded; the evaluation relies on subjective perceived usefulness rather than objective performance metrics. The comparison was performed mainly to characterize functional differences. No objective performance metrics were measured to demonstrate that superior analytical performance is achieved by MultiVisSys over the baseline tools. Therefore, all claims presented in this section are restricted to functional characteristics and to the usability perceived by users. These limitations are discussed further in Section 5.3.
5.2. Questionnaire Design and Results
After completing the tasks with each system, participants provided brief feedback on task success and task load. Then, participants completed a nine-item questionnaire rated on a five-point Likert scale (1 = strongly disagree, 5 = strongly agree). The items cover the following four dimensions, as shown in Table 4: (1) single-layer topology display (Q1–Q3), (2) inter-layer comparative analysis (Q4–Q6), (3) community-detection or layout algorithms flexibility (Q7), and (4) interaction flexibility (Q8–Q9).
Table 4.
The items cover four dimensions in questionnaire designing.
However, the full customized Likert-scale questionnaire (Table 4) was only administered after participants used MultiVisSys. This questionnaire was specially designed to measure the subjective perceived usability of the proposed prototype, rather than to conduct head-to-head subjective scoring against the three baseline tools.
Table 5 reports the mean, median and standard deviation for each item across all participants for MultiVisSys. Given the small sample size (N = 13), formal statistical significance tests were not conducted; the results should be interpreted as indicative of perceived usefulness rather than conclusive evidence of performance differences.
Table 5.
Likert-scale questionnaire aggregated statistics from user study for MultiVisSys (N = 13, scale 1–5).
Table 5 summarizes aggregated results from the 5-point Likert-scale questionnaire. All items obtain mean values above 3, indicating generally positive perceived usability of MultiVisSys among participants. Item Q5 achieves the highest mean score of 4.31 (SD = 0.63), demonstrating strong participant agreement regarding multi-granular comparative capacity for inter-layer topological similarity, which corresponds to the core design goal of our framework. In contrast, Q3 obtains the relatively lowest mean value of 3.38 with the largest standard deviation of 0.96, reflecting divergent participant experiences in target-node localization, which suggests a direction for future prototype improvement. It should be emphasized that given the small sample size (N = 13) and the absence of randomization for tool-usage order, no formal statistical significance tests are performed. These results reflect only subjective perceived usability rather than proven objective analytical performance advantages.
It should be noted that the Likert-scale questionnaire (Table 5) is specially tailored for evaluating the functional characteristics of MultiVisSys; these items are not fully applicable to competing tools (Gephi, MultiNets, MuxViz). Therefore, complete Likert-scale questionnaire data for other compared tools were not collected in the present user study. Qualitative feature differences across tools are reported in Table 1 instead of quantitative questionnaire scores. The within-subject setting allows participants to gain hands-on experience with all tools under identical datasets and tasks, which supports the qualitative feature comparison, rather than a quantitative head-to-head performance benchmark.
Aggregated results from the five-point Likert-scale questionnaire are summarized in Table 4. The questionnaire items are custom-tailored for the functional characteristics of MultiVisSys and are developed to validate the perceived usability of the proposed prototype rather than to facilitate cross-tool quantitative head-to-head benchmarking. No corresponding Likert-scale ratings for competing tools are collected, as the designed items cannot be fairly applied to other multilayer-network-visualization systems.
Generally satisfactory perceived satisfaction with MultiVisSys is reflected by the survey data. Mean values above 3.0 are yielded for all nine questionnaire items. The highest ratings are obtained for item Q5 (mean = 4.31, SD = 0.63), which addresses multi-granular inter-layer topological comparison from global, skeleton and local perspectives. Small standard deviation for Q5 indicates high consistency among participants, and strong subjective recognition of the core design objective of the presented framework. Moderately positive scores are returned for the remaining items except Q3. Relatively low mean value (3.38) together with the largest standard deviation (0.96) is reported for Q3 concerning target-node and local-structure localization, from which divergent user experiences can be inferred.
Given the small participant sample size and the absence of randomization for tool-usage order, formal statistical significance tests are not conducted. Only subjective perceived usability is demonstrated, while objective analytical performance superiority is not proven by current evidence.
For future investigations, a cross-tool validated general-purpose questionnaire should be constructed to support quantitative comparative evaluations among different multilayer-network-visualization prototypes. Enlarged participant cohorts with balanced expertise backgrounds are recommended to reduce sampling bias. Further optimization of target-node-localization functions and visual-encoding customization is also suggested to mitigate user-experience discrepancies observed in the present study.
5.3. Limitations
Several important limitations of the present study should be acknowledged, which can be divided into the following three categories: limitations of the visual-analysis approach, evaluation-dataset constraints, and user-study constraints.
- Limitations of the proposed visual-analysis approach
- Scalability and computational cost: This work focuses on visual-analysis framework design rather than performance optimization. Computational overhead and frontend rendering performance are heavily dependent on network scale and hardware specifications. Increased node-and-edge quantity leads to higher runtime costs. Hardware upgrades, sampling-based preprocessing and underlying-algorithm optimization are possible mitigation strategies, while performance for ultra-large-scale multilayer networks remains a subject for future work.
- Visual clutter: Substantial visual clutter may arise when the number of network layers increases, interfering with visual perception.
- Venn-diagram constraints: The area-proportional Venn-based similarity-pattern view works well for 2–3 layers, and its readability deteriorates significantly for networks with four or more layers.
- Interaction-mechanism restrictions: The current interactive pipeline is designed for datasets with a moderate number of layers, and further extensions are required for highly complex multilayer scenarios.
- Layout dependency: Analysis quality partly relies on outputs from layout algorithms; unsatisfactory layout results may degrade user exploration experience.
- Evaluation-dataset constraints
All evaluations are conducted based on synthetic simulated multilayer datasets. Conclusions drawn in this paper are primarily constrained to the synthetic dataset scenario. Further comprehensive evaluation across diverse real-world multilayer networks remains as future work.
- 3.
- User-study constraints
The user study is limited by a small participant sample size (N = 13). In addition, randomization of tool-usage order was not performed in the original experiment, which may introduce potential learning-order effects. Therefore, only subjective perceived usability can be inferred instead of rigorously proven objective analytical effectiveness.
6. Conclusions
This paper presents MultiVis, a conceptual visual-analysis framework for multilayer networks, and its browser-based prototype implementation, MultiVisSys. MultiVis establishes topology views and high-order pattern views (similarity-pattern view and interaction-pattern view) to support comparative exploration of inter-layer topological characteristics. The area-proportional Venn-diagram representation provides a quantitative means of comparing node and edge set overlap across layers, complementing conventional topology-centric visualizations. Multiple existing algorithms for network compression, community detection and node layout are integrated within the framework to realize multi-granularity multilayer structural display. It is explicitly noted that the novelty resides in visual encoding and multi-view interaction workflow, rather than these reused base algorithms. MultiVisSys implements the above-mentioned views and multidirectional interactive controls.
A user study with 13 participants suggests that the system is perceived as useful for inter-layer similarity comparison and multi-granularity structural analysis. However, what should be emphasized is that the current evaluation measures feature capability and perceived usability rather than demonstrated analytical effectiveness. Objective evidence of improved analytical performance—through task completion time, accuracy, and error-rate metrics in larger controlled studies—remains as future work.
Several limitations constrain the current work, including limited scalability to very large networks, computational overhead of layout algorithms, Venn-diagram interpretability for more than three layers, and a small user-study sample. For future work, performance-targeted optimizations, advanced de-clutter methods and enhanced visual-encoding schemes will be explored to address scalability, visual clutter and Venn-diagram-related constraints. Evaluations over diverse real-world multilayer-network datasets are needed. Furthermore, improved user-study protocols including cross-tool questionnaires, enlarged cohorts and order-randomization should be implemented to acquire more reliable evaluation outcomes.
Author Contributions
Conceptualization, X.Z. and Z.Y.; methodology, X.Z.; software, Z.Y.; formal analysis, Z.Y.; resources, Y.L.; data curation, Y.L.; writing—original draft preparation, X.Z.; writing—review and editing, X.Z.; visualization, X.Z. All authors have read and agreed to the published version of the manuscript.
Funding
This research was funded by National Natural Science Foundation of China, grant number No. 62405378.
Data Availability Statement
The synthetic multilayer-network dataset, data generation scripts, and reproduction instructions will be released in a persistent public repository upon acceptance of this manuscript.
Conflicts of Interest
The authors declare no conflicts of interest.
References
- De Domenico, M. More is different in real-world multilayer networks. Nat. Phys. 2023, 19, 1247–1262. [Google Scholar] [CrossRef] [Scilit]
- Cardillo, A.; Zanin, M.; Gómez-Gardeñes, J. Modeling the multi-layer nature of the European Air Transport Network: Resilience and passengers re-scheduling under random failures. Eur. Phys. J. Spec. Top. 2013, 215, 23–33. [Google Scholar] [CrossRef] [Scilit]
- Zhang, Y.Z.; Kang, H.H.; Deng, Y.L. Vulnerability analysis of cascading failure of Sino-Europe sea-rail transport network from the perspective of multi-layer network. Comput. Eng. Appl. 2025, 61, 298–308. [Google Scholar]
- Domenico, M.D. Multilayer Modeling and Analysis of Human Brain Networks. Gigascience 2017, 6, gix004. [Google Scholar] [CrossRef] [Scilit] [PubMed]
- Vaiana, M.; Muldoon, S.F. Multilayer Brain Networks. J. Nonlinear Sci. 2020, 30, 2147–2169. [Google Scholar] [CrossRef] [Scilit]
- Llorente, D.; Ballesteros, M.; Cruz-Ortiz, D. Brain Computer Interface for Speech Synthesis Based on Multilayer Differential Neural Networks. Cybern. Syst. 2022, 53, 126–140. [Google Scholar] [CrossRef] [Scilit]
- Ke, M.; Cao, P.; Chai, X.; Yao, X.; Liu, G. Dynamic analysis of frequency specificity in multilayer brain networks. Brain Res. 2025, 1850, 149418. [Google Scholar] [CrossRef] [Scilit] [PubMed]
- Shen, A.; Guo, J.; Suo, Q.; Wang, F. Modeling and analysis of supply chain finance based on multiplex networks. Appl. Res. Comput. 2017, 34, 3621–3631. [Google Scholar]
- Peng, X.; Zhang, Y. On dynamic equilibrium model of supply chain networks with time-varying demand. Syst. Eng. Theory Pract. 2013, 33, 1158–1166. [Google Scholar]
- Liu, M.; Li, J.; Yang, Z.; Yang, K. Modeling method of hybrid warfare system-of-systems based on multi-layer network. Syst. Eng. Electron. 2025, 47, 1195–1205. [Google Scholar]
- Lu, T.L.; Chen, W.H.; Ge, B.F.; Deng, Q.L. Multilayer network modeling for combat system of systems under information support. Syst. Eng. Electron. 2022, 44, 520–528. [Google Scholar]
- Rossi, L.; Magnani, M. Towards Effective Visual Analytics on Multiplex and multilayer networks. Chaos Solitons Fractals 2015, 72, 68–76. [Google Scholar] [CrossRef] [Scilit]
- Piskorec, M.; Sluban, B.; Smuc, T. MultiNets: Web-Based Multilayer Networks Visualization. In Proceedings of the European Conference on Machine Learning and Knowledge Discovery in Databases (ECML PKDD 2015), Porto, Portugal, 7–11 September 2015; Springer: Cham, Switzerland, 2015. [Google Scholar]
- Bourqui, R.; Ienco, D.; Sallaberry, A.; Poncelet, P. Multilayer Graph Edge Bundling. In Proceedings of the 2016 IEEE Pacific Visualization Symposium (PacificVis), Taipei, Taiwan, 19–22 April 2016. [Google Scholar] [CrossRef] [Scilit]
- De Domenico, M.; Nicosia, V.; Arenas, A.; Latora, V. Structural reducibility of multilayer networks. Nat. Commun. 2015, 6, 6864. [Google Scholar] [CrossRef] [Scilit] [PubMed]
- De Domenico, M. Multilayer Networks: Analysis and Visualization: Introduction to MuxViz with R; Springer Nature: Cham, Switzerland, 2022; ISBN 978-3030757182. [Google Scholar]
- Card, S.K.; Mackinlay, J.D.; Shneiderman, B. Readings in Information Visualization: Using Vision to Think; Morgan Kaufmann Publishers Inc.: Burlington, MA, USA, 1999. [Google Scholar]
- Cao, J.; Xu, W.; Jin, D.; Ding, W. Survey of Community Discovery in Complex Networks. Comput. Sci. 2023, 50, 414–424. [Google Scholar]
- Wang, J.; Luo, Y.; Xu, X.; Du, Z.; Li, P. Identifying Influential Nodes in Multilayer Networks Based on Layer Weighting and Gravity Centrality. Comput. Sci. 2025, 52, 92–101. [Google Scholar]
- Xuan, Y.; Xiao, F. An improved gravity model to identify influential nodes in complex networks based on k-shell method. Knowl.-Based Syst. 2021, 227, 107198. [Google Scholar] [CrossRef] [Scilit]
- Gephi. Version 0.10.1. Available online: https://gephi.org/ (accessed on 10 July 2026).

Disclaimer/Publisher’s Note: The statements, opinions and data contained in all publications are solely those of the individual author(s) and contributor(s) and not of MDPI and/or the editor(s). MDPI and/or the editor(s) disclaim responsibility for any injury to people or property resulting from any ideas, methods, instructions or products referred to in the content. |
© 2026 by the authors. Licensee MDPI, Basel, Switzerland. This article is an open access article distributed under the terms and conditions of the Creative Commons Attribution (CC BY) license.