


Abstract
Analyses of electric two-wheeler (E2W) accident causes often overlook individual heterogeneity and non-linear effects among influencing factors, causing risk prediction models to fail. Based on 742 motor vehicle–E2W collisions from the China In-Depth Accident Study (CIDAS) database, we established the correlated random parameter ordered probit model with heterogeneity in means (CRPOPH) and the generalized additive model (GAM) to analyze the effects of discrete and continuous variables on E2W accident severity. The results show that injury severity increases significantly for the following characteristics: male, 51–60 years old, <170 cm, SUV or truck, intersection road, non-asphalt pavement, daytime and side impact accidents. With all other factors held constant, injury severity decreases with increasing seat height and seat–handlebar distance; when the wheelbase is approximately between 1000 mm and 1400 mm, injury severity tends to be the lowest; when the E2W speed is about 15–30 km/h, injury severity is positively correlated with speed; in other speed ranges, E2W speed is negatively correlated with injury severity. Compared with traditional linear models, the proposed method achieves both high interpretability and high fitting accuracy in modeling E2W accident severity.
1. Introduction
In recent years, the electric two-wheeler (E2W) has become one of the preferred means of transportation for short distance travel because of its convenience and environmental protection. However, accompanied by it, the safety problem of E2Ws has become increasingly prominent. In 2021, the death toll of global powered two- and three-wheeled vehicles users accounted for 30% of the total deaths in road traffic accidents [1]. Between 2017 and 2022, the number of injuries related to electric bicycles in the United States increased thirtyfold [2]. From 2019 to 2023, the annual growth rate of traffic accident casualties involving electric bicycles in China was 5.85% [3]. Therefore, how to effectively reduce the accident injury of E2Ws has become an important issue to be solved in the field of traffic safety.
As a vulnerable road user, E2W riders are usually the more seriously injured party in traffic accidents. Therefore, in order to reduce the injury caused by E2W accidents, we need to understand the influencing factors of the injury severity of E2W riders and its mechanism. In the analysis of road traffic accident severity, the probit model has better sensitivity to tail extreme events and collaborative modeling ability to unobserved behavior than the logit model. Initially, accident severity was dichotomized (e.g., death vs. non-death) and analyzed using binary probit models (BPM) [4,5]. However, BPM cannot accommodate multi-level injury outcomes. To address this limitation, the ordered probit model (OPM) was introduced [6,7,8], which extends the binary framework to ordered multi-classification and remains widely used due to its parsimony and interpretability. The models discussed above (BPM and OPM) are fixed-parameter discrete choice models, assuming that the effects of explanatory variables are constant across individuals, thereby ignoring unobserved heterogeneity such as differences in riding behavior or attention level. To overcome this limitation, the random parameter probit model (RPM) was developed [9,10]. This type of model introduces random coefficients, allows parameters to follow an individual-level distribution, and can effectively capture hidden individual differences, especially when the distribution of injury outcomes is asymmetric or tail risk is prominent. Nevertheless, the RPM assumes that all random coefficients follow the same distribution and fails to fully account for the heterogeneity of parameter distributions. To relax the independence assumption of the RPM, the correlated random parameter ordered probit model with heterogeneity in means (CRPOPH) was further proposed [11,12,13]. Through a structured grouping mechanism, this model accurately identifies and quantifies systematic heterogeneity at the group level, thereby significantly improving explanatory power and goodness of fit without sacrificing estimation efficiency. All the above models are discrete choice models (DCMs), which have limitations in dealing with nonlinear effects between variables. The generalized additive model (GAM) can significantly improve the ability to capture complex nonlinear relationships by introducing smooth spline functions to perform nonparametric fitting on continuous covariates without prespecifying the functional form [14,15,16].
This study aims to analyze the factors affecting E2W accident severity by integrating the correlated random parameter ordered probit model with heterogeneity in means (CRPOPH) and the generalized additive model (GAM). This joint framework accounts for both individual heterogeneity and nonlinear effects of continuous variables—two aspects that traditional discrete choice models often overlook or treat separately. By capturing both sources of complexity simultaneously, our approach yields more accurate estimates and a more comprehensive understanding of the factors affecting E2W accident severity.
2. Materials and Methods
2.1. Data Collection
A total of 742 E2W accident cases from the years 2014 to 2020 were extracted from the CIDAS database for this study. These accidents met the following criteria: (1) Motor vehicle vs. E2W collision; (2) complete accident information records; (3) involvement of a single motor vehicle and an E2W; (4) the E2W rider sustained at least minor injuries; (5) the E2W rider was above 18 years of age. The accident statistics are shown in Table 1.
Table 1.
Descriptive statistics of E2W accident data.
2.2. Model Development
2.2.1. The Correlated Random Parameter Ordered Probit Model with Heterogeneity in Means
The ordered probit model (OPM) has been widely used to model damage severity. The model takes into account the ordered discrete nature of the data, but the model assumes that the influence of various factors on the accident severity is fixed in different accidents, which is inconsistent with the reality. Therefore, in order to capture the influence of heterogeneous factors not observed in the accident data, the random parameter modeling method is used. By adding random items to , the random parameter ordered probit model (RPOP) is introduced:
where is the mean vector of the random parameter vector; is the random term that obeys the standard normal distribution; is the Cholesky matrix, which is the lower triangular matrix used to estimate the covariance matrix and correlation coefficient of random parameters.
In order to analyze the influence of unobserved heterogeneity on the mean of random parameters, the random parameter ordered probit model with heterogeneity in the means is introduced:
where is the vector that affects the heterogeneity of the mean value of random parameters; is the coefficient vector.
The random parameter ordered probit model with heterogeneity in the means assumes that the random parameters are uncorrelated and the matrix is restricted to a diagonal matrix. However, the correlated random parameter ordered probit model with heterogeneity in means (CRPOPH) relaxes the restriction that the nondiagonal elements of the covariance matrix are 0, which allows the nondiagonal elements of the matrix to be not 0, and it can capture the correlation effect between random parameters. The variance–covariance matrix v of the random parameters is derived from the Cholesky matrix decomposition:
We calculated the standard deviation of each relevant random parameter using the diagonal and non-diagonal element values of the variance covariance matrix:
where is the standard deviation of the j-th random parameter; and is the diagonal element of the Γ matrix corresponding to the specific random parameter j. In addition, , … represents the nondiagonal elements of the U matrix corresponding to the specific random parameter j.
In order to check the statistical significance of these standard deviations, the Z-test statistics corresponding to the relevant random parameters can be calculated according to the observation-specific standard deviation estimates generated by the software:
where is the standard deviation of the random parameter k, is the standard error of the standard deviation , and is the software-generated standard deviation of the random parameter of accident w; is the standard deviation of ; N is the number of cases, and Z is the Z-test statistic corresponding to the standard deviation of random parameters.
The correlation coefficient between random variables is calculated as follows:
where is the covariance between the two random variables and , and and are the standard deviations associated with these two random variables.
The maximum likelihood method was used to estimate the CRPOPH. In order to evaluate the overall goodness of fit of the model, Akaike information criterion (AIC) was used. The smaller the AIC, the better the fitting effect of the model. In order to determine the impact of changes in independent variables on the severity of each type of damage, it is necessary to calculate the marginal effect. The marginal effect is calculated as follows:
where is the density function of the standard normal distribution; is the probability of causing damage severity J in accident W, and the expression is as follows:
where is the probability distribution function of the standard normal distribution.
Binary variables can be fitted with this model. For multi-class variables, N−1 dummy variables need to be used to replace N-class variables. For example, the impact point on E2W is divided into four categories, so three dummy variables need to be set.
The study used NLOGIT5.0 software to estimate the severity of injuries to E2W riders using maximum likelihood estimation methods, including OPM, RPOP, and CRPOPH. Take a significance level of 0.1 as the threshold for screening significant variables. Using the backward fitting method, all independent variables are first included in the model, and then insignificant parameters are removed. The fitting continues until all parameters under all categories are significant at a significance level of 0.1.
2.2.2. The Generalized Additive Model
Establish a GAM to analyze the nonlinear mechanism of continuous independent variables on the severity of E2W accidents. The expression is shown as follows:
where Y is the dependent variable; X is the independent variable; p is the number of independent variables; is the intercept term; m is the number of smoothing terms; and is the smoothing function for non-parametric terms. is the probability of different E2W accident severities; and is the connection function.
In the study, chose the logit model and required the dependent variable to be binary. However, the dependent variable in the study was the severity of E2W accidents, which was classified into three categories. Therefore, moderate injury accidents and serious injury or death accidents were classified as one category, namely serious injury accidents. According to this classification method, there were 457 minor injury accidents and 285 serious injury accidents. Set as a binary dependent variable reflecting the severity of the E2W accident, . When is 1, it indicates that the accident is a serious injury accident, and when is 0, it indicates that the accident is a minor injury accident. Therefore, GAM is expressed as follows:
If all variables in the GAM model are introduced in non-parametric form, it is easy to cause overfitting of the model and insufficient explanatory power. Therefore, based on the GAM model, a semiparametric generalized additive model is proposed to analyze both continuous and discrete independent variables. Using the backward-fitting algorithm with a confidence level of 0.1, the final constructed GAM model is as follows:
where is the parameter part; is the non-parametric part; is a smoothing function; and m is the number of smoothing terms; is the estimated parameter for categorical variables.
In order to ensure the smoothness of the spline curve, it is necessary to minimize the objective function:
where is the sum of squared residuals, which is used to evaluate the goodness of fit of the model. The smaller its value, the better the fit of the model; is the model penalty term used to measure the overall smoothness of the interval; λ is the smoothing parameter, being too high or too low will result in the model being over-smoothed or under-smoothed.
The overall goodness of fit criterion of the AIC evaluation model using Akaike information criterion is studied. The smaller the AIC, the better the fitting effect of the model. In addition, the Pearson chi square value was used to evaluate whether the smoothing function of each factor was significant; The root mean square error (RMSE) and mean absolute error (MAE) were used to measure the prediction accuracy of different models.
where n is the number of observations, is the observed value, and is the predicted value.
3. Results
3.1. Analysis of CRPOPH Results
According to the MAIS value of riders in the accident, E2W accidents are divided into minor injury accidents (MAIS = 1), moderate injury accidents (MAIS = 2) and serious injury or death accidents (MAIS ≥ 3). The data used in the study included 457 minor injury accidents (61.59%), 152 moderate injury accidents (20.49%) and 133 serious injury or death accidents (17.92%).
The goodness of fit comparisons for OPM, RPOP, and CRPOPH are presented in Table 2. The initial log-likelihood was −691.111 across all three models. At convergence, OPM yielded a log-likelihood of −613.588 and a McFadden R2 of 0.112, both lower than those of RPOP (−611.017 and 0.131, respectively) and CRPOPH (−605.794 and 0.141, respectively). Conversely, the AIC of OPM (1269.6) was larger than that of RPOP (1262.0) and CRPOPH (1261.2), indicating that models accounting for heterogeneity provide superior fit to the traditional ordered probit specification. Between the two heterogeneity-adjusted models, CRPOPH outperformed RPOP, with a higher log-likelihood at convergence (Δ = 5.223), higher McFadden R2 (0.141 vs. 0.131), and a lower AIC (1261.2 vs. 1262.0). This suggests that incorporating both correlation among random parameters and their mean heterogeneity further improves model performance over considering random parameters alone. Taken together, CRPOPH exhibits clear advantages in terms of goodness of fit, as well as its capacity to capture heterogeneity and interactive effects across factors. Therefore, we adopted CRPOPH as the primary analytical framework to examine the determinants of injury severity among E2W riders.
Table 2.
Comparison of model goodness of fit indexes.
Table 3 presents the estimation results for the non-random parameters. All reported variables were significant at the 0.1 level (|z| > 1.645). In this ordered probit framework, a positive coefficient indicates that the variable increases the probability of being in a higher injury severity category (MAIS ≥ 2 or MAIS ≥ 3), whereas a negative coefficient suggests a higher probability of remaining in the lowest severity category (MAIS = 1). Among rider-related factors, females (β = −0.425, z = −2.77) and riders of height 170–175 cm (β = −0.404, z = −2.55) or >175 cm (β = −0.430, z = −2.02) were significantly associated with a lower likelihood of more severe injuries. In contrast, riders aged 51–60 years (β = 0.493, z = 4.15) exhibited a significantly higher probability of severe outcomes. Regarding crash characteristics, truck–E2W collisions (β = 0.245, z = 1.77) and SUV–E2W collisions (β = 0.616, z = 5.91) significantly increased injury severity, as did non-asphalt roads (β = 0.311, z = 3.13) and right-side impacts (β = 0.402, z = 3.85). Conversely, non-intersection locations (β = −0.267, z = −2.19) and nighttime conditions (β = −0.385, z = −2.62) were associated with a reduced probability of serious injury.
Table 3.
Model estimates for OPM, RPOP and CRPOPH.
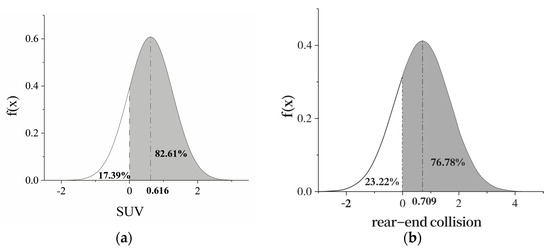
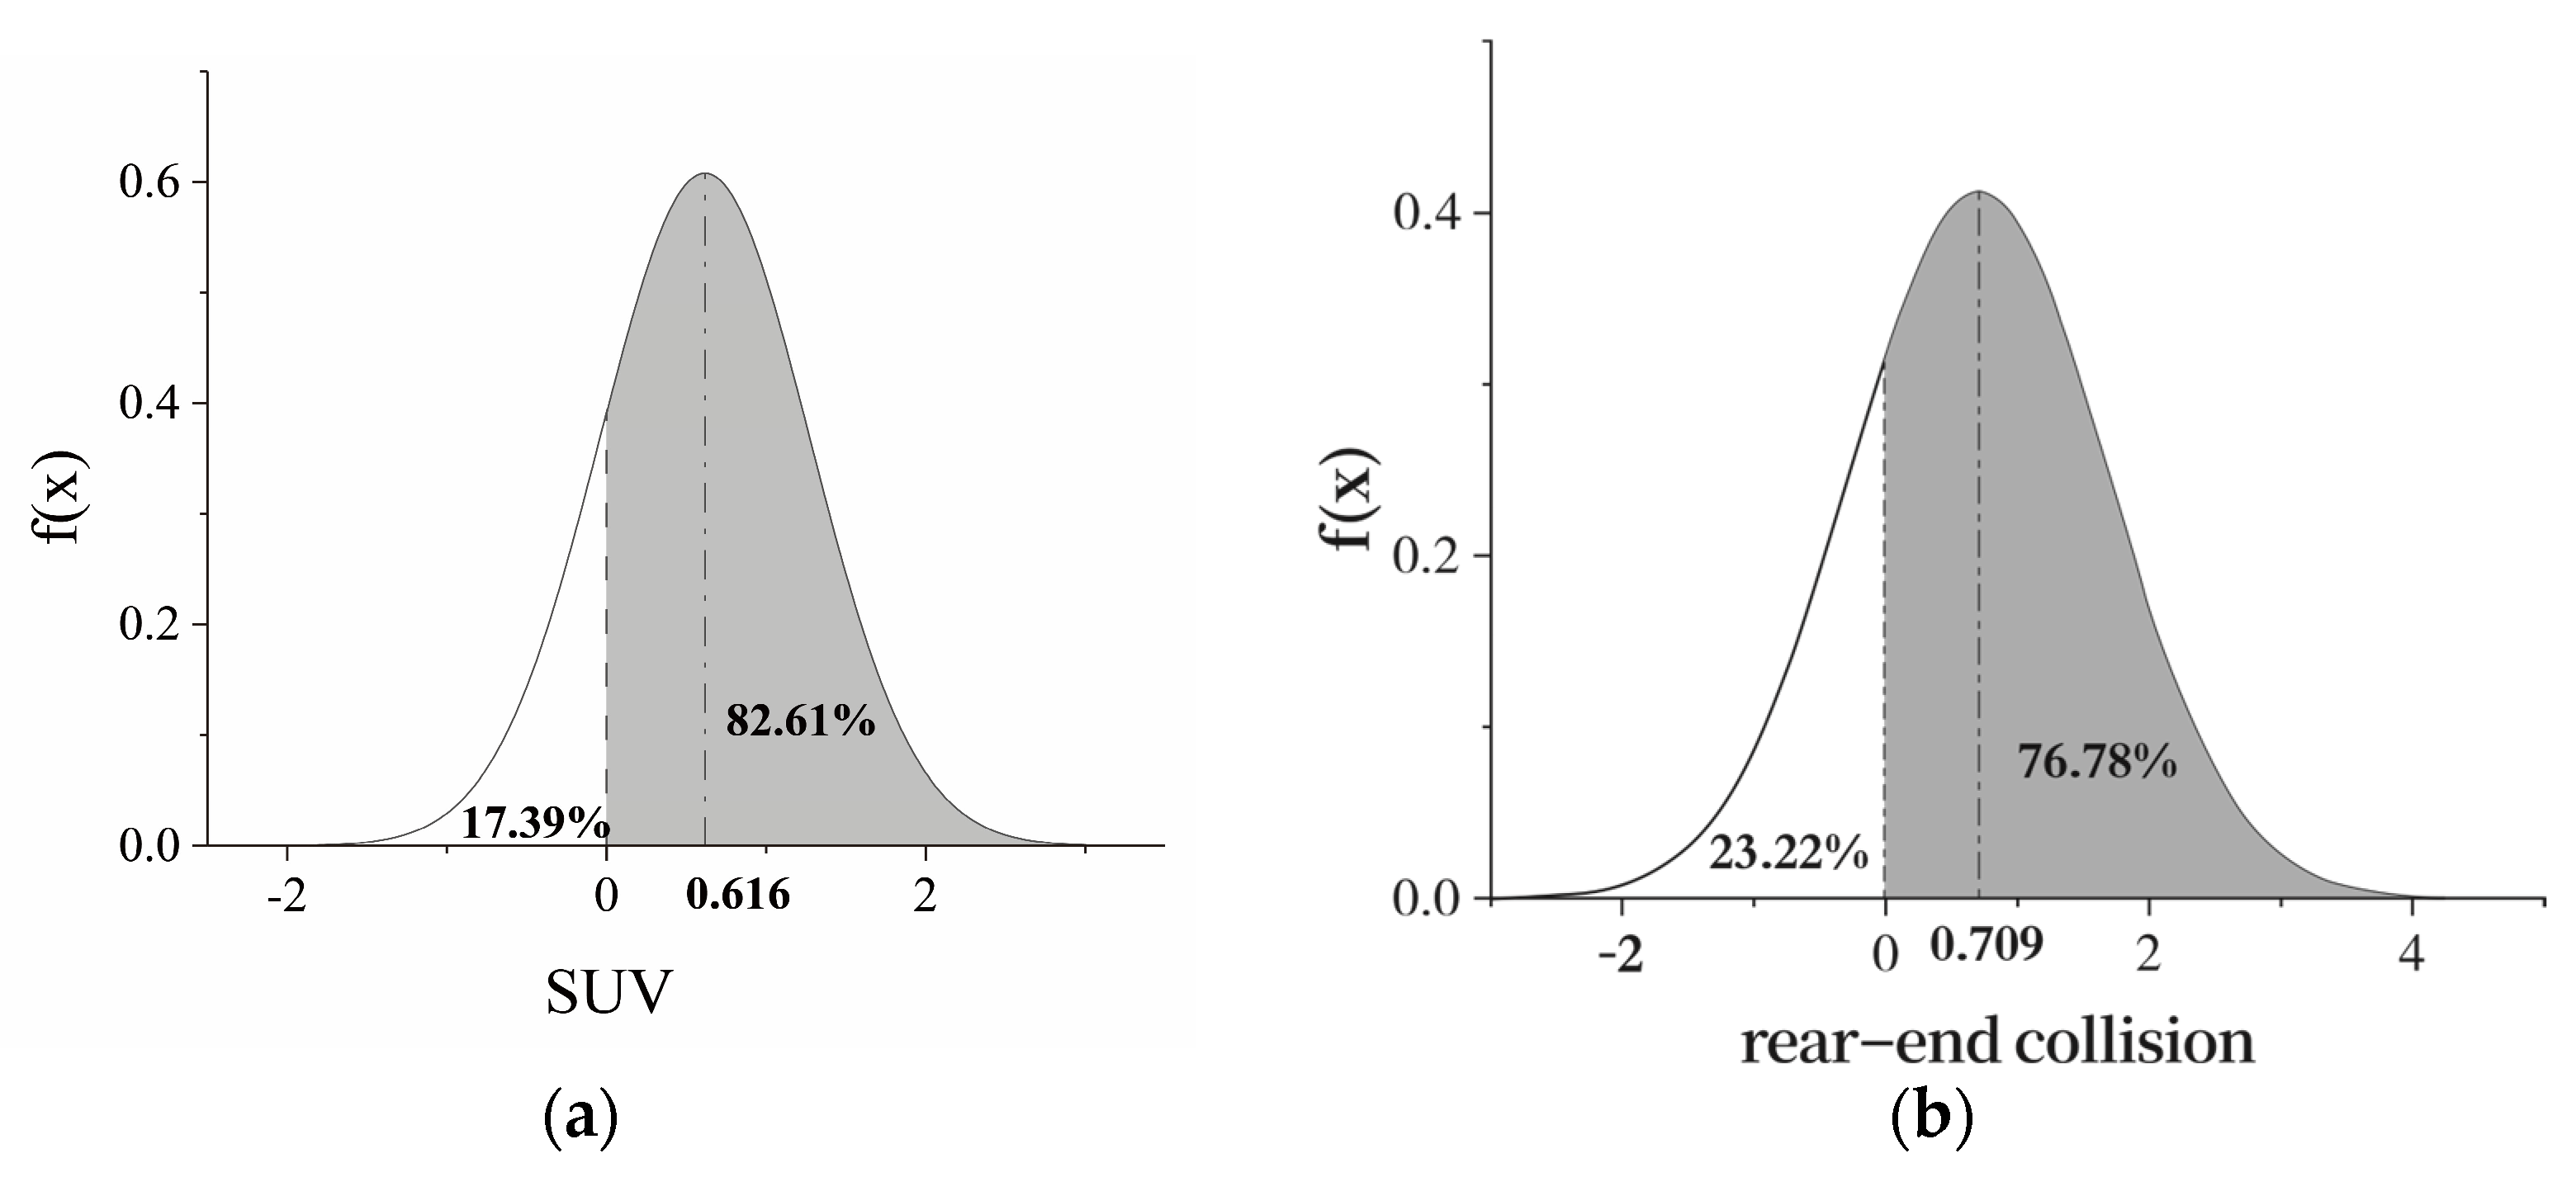
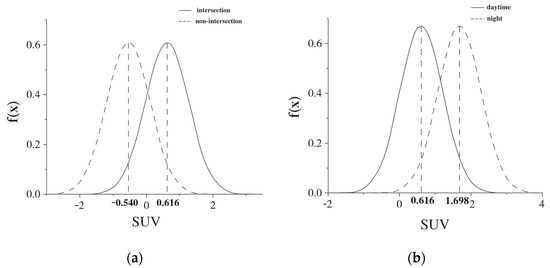
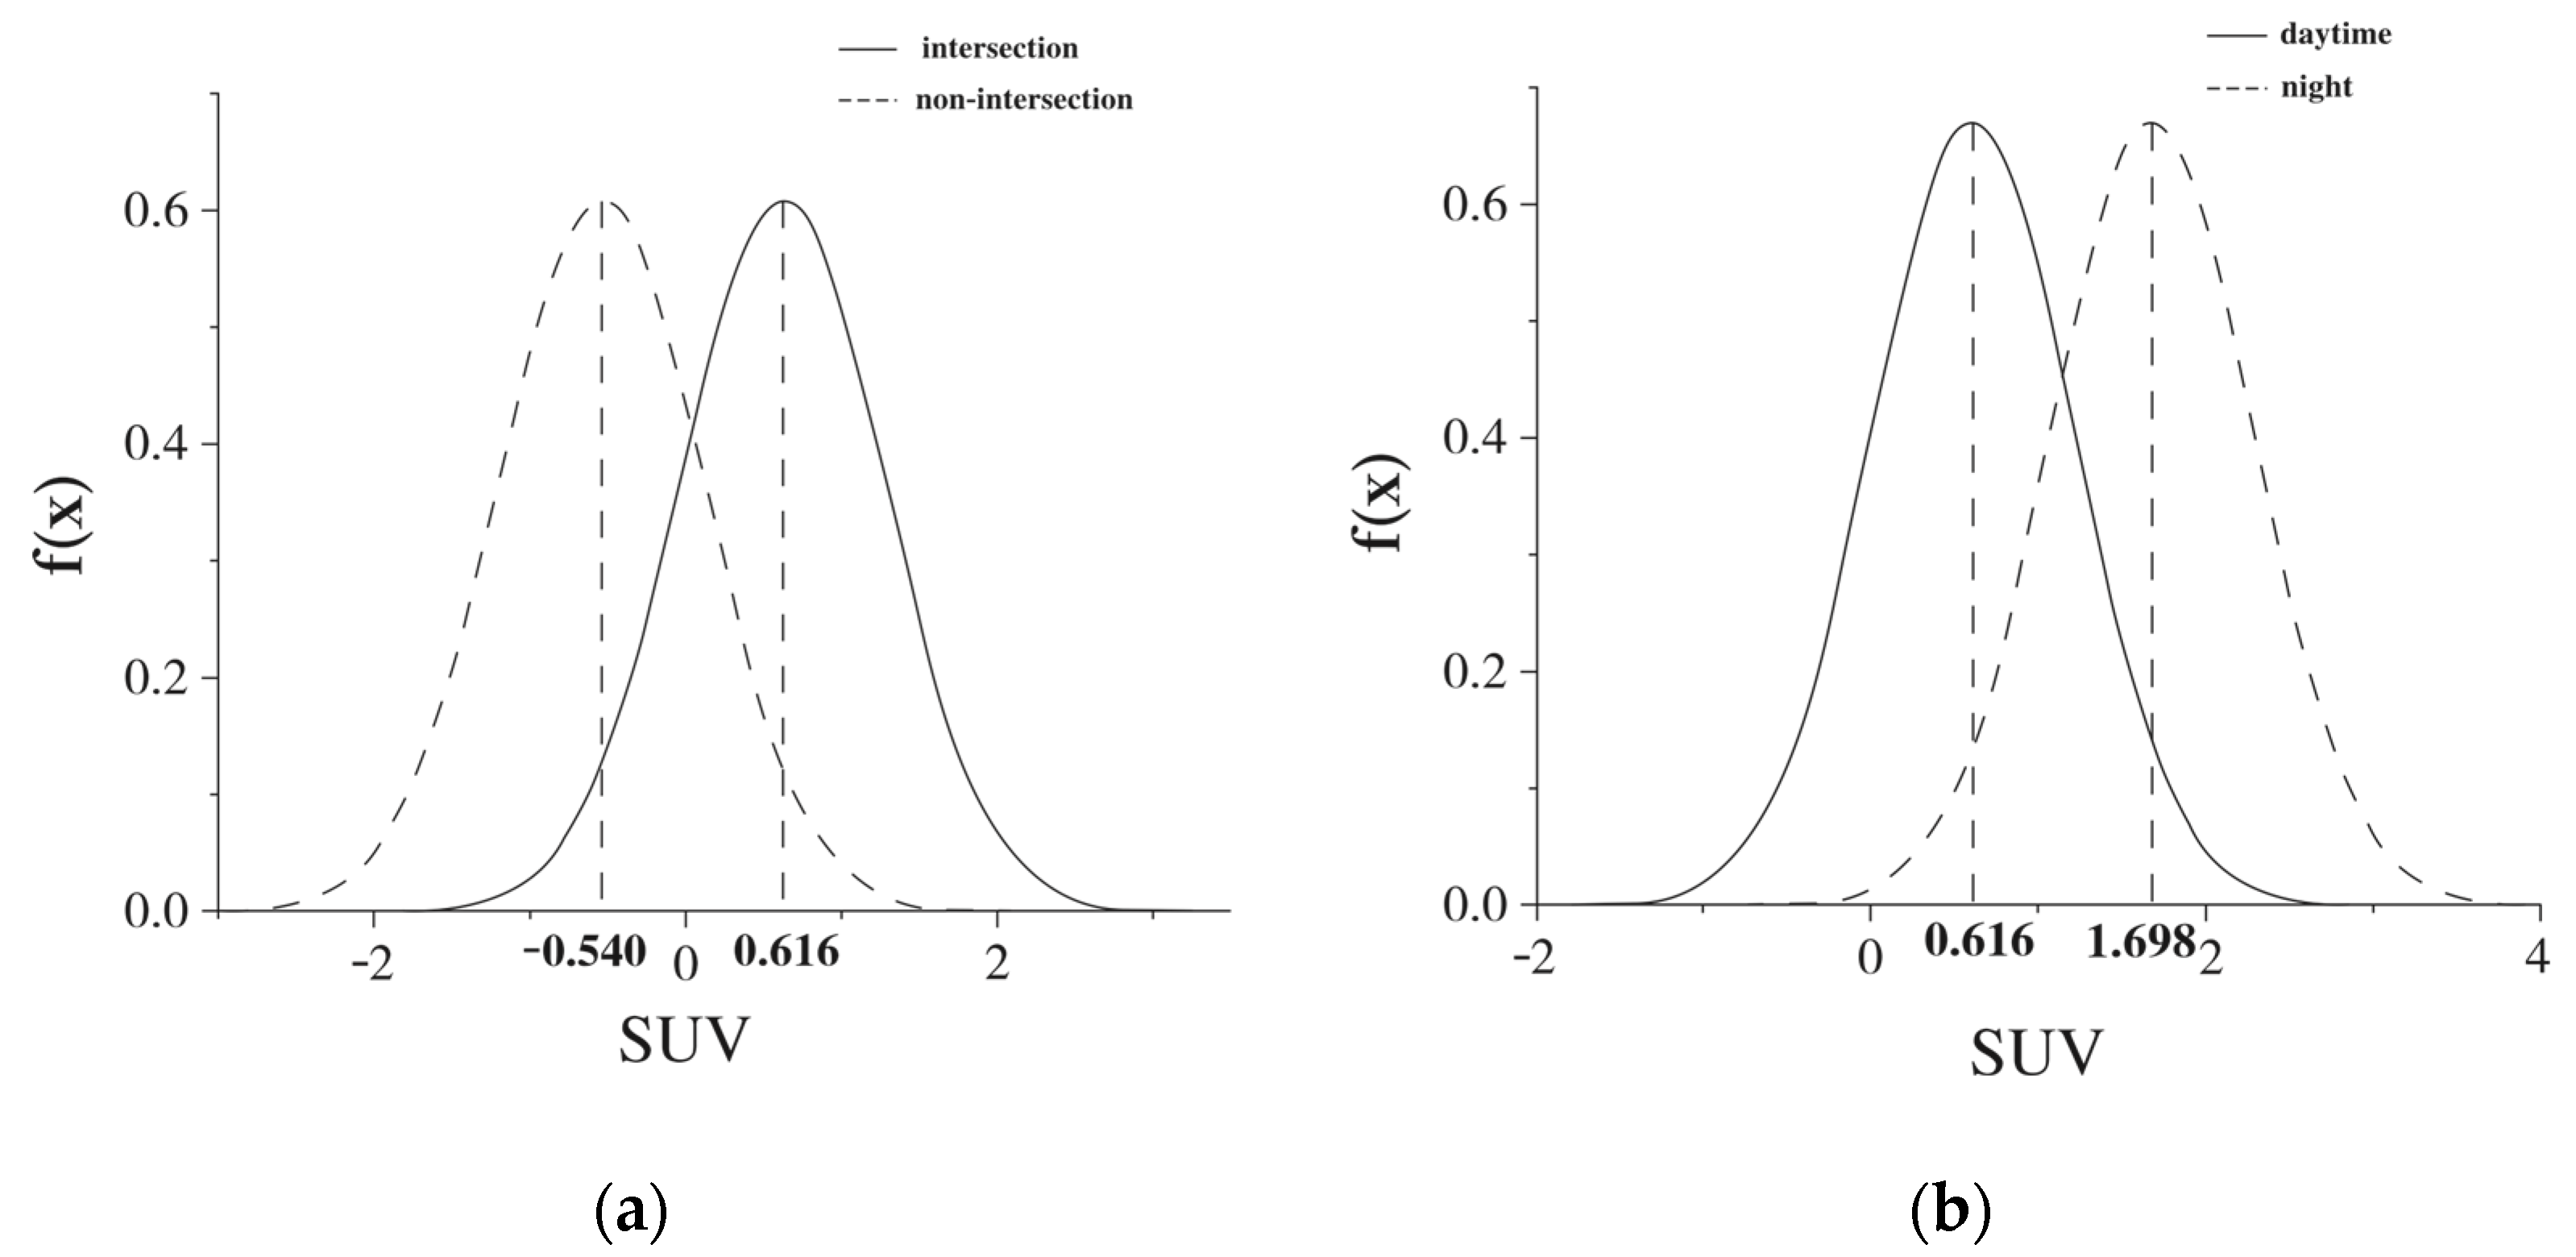
In terms of random parameters, as shown in Figure 1a, 82.61% of E2W riders sustained serious injuries in SUV–E2W collisions, compared with 61.59% in sedan–E2W collisions, indicating that E2W riders are more susceptible to serious injuries when involved in collisions with SUVs. Figure 1b further reveals that 76.78% of E2W riders suffer serious injuries when rear-ended by a motor vehicle, compared with side-impact collisions, suggesting that rear-end impacts pose a greater safety risk to E2W riders. Regarding heterogeneity, the results indicate that road characteristics and collision time significantly influence the mean of the random parameter for SUV. As shown in Figure 2a, this mean is negatively correlated with non-intersections, implying that although collisions with SUVs increase the probability of serious injury to riders, this probability is reduced when such crashes occur at non-intersections. Specifically, the estimated mean of the random parameter for SUV–E2W collisions is 0.616 at intersections, but decreases to −0.540 at non-intersections, indicating that SUV–E2W crashes at intersections tend to result in more serious injuries than those on non-intersections. In contrast, the mean of the random parameter for SUV exhibits a positive association with collision time. As depicted in Figure 2b, the mean is 0.616 for daytime collisions, whereas it rises to 1.698 for nighttime crashes, indicating that E2W riders face a significantly higher risk of severe injury when colliding with an SUV at night.
Figure 1.
Distribution of random parameters in CRPOPH: (a) SUV. (b) Rear-end collision.
Figure 2.
Heterogeneity analysis of the mean of random parameters in SUV−E2W collisions. (a) Non-intersection−SUV. (b) Night−SUV.
In order to further examine the interdependencies among unobserved factors, the CRPOPH also estimates the correlation coefficients between the random parameters. Table 4 shows the Cholesky matrix for the random parameters, with Z-test statistics shown in brackets. Table 5 presents the variance–covariance matrix of the random parameters. As shown in Table 6, there is a significant positive correlation between the unobserved heterogeneity of the random parameters associated with rear-end collisions involving SUVs and E2W collision sites, indicating that when an SUV rear-ends an E2W, the probability of serious injury to the E2W rider increases significantly.
Table 4.
Cholesky matrix of random parameters.
Table 5.
Variance–covariance matrix of random parameters.
Table 6.
Correlation coefficient matrix of random parameters.
To quantitatively examine the influence of independent variables on E2W accident severity, we calculated the average marginal effects, with results presented in Table 7. Regarding rider characteristics, female riders are more likely to sustain minor injuries but are 7.2% and 8.4% less likely to experience moderate or severe/fatal injuries than their male counterparts. In terms of age and height, riders aged 51–60 exhibit a higher risk of moderate and severe/fatal injuries (+6.9% and +12.3%) relative to those aged 18–30; similarly, taller riders (170–175 cm and >175 cm) show a greater propensity for minor injuries (+15.0% and +15.1%) but a lower probability of severe/fatal outcomes (−8.3% and −7.4%) compared to shorter riders (<170 cm). Turning to vehicle characteristics, collisions with SUVs and trucks elevate the likelihood of moderate injuries (+3.8% and +2.2%, respectively) and severe/fatal injuries (+5.7% and +53.3%, respectively) relative to sedan collisions. For road features, non-intersection locations decrease the probability of moderate and severe/fatal accidents by 4.6% and 5.3%, whereas non-asphalt pavement increases these risks by 2.38% and 5.4%. Regarding environmental conditions, nighttime riding is associated with a 14% higher probability of minor injuries but a 6.7% and 7.3% lower probability of moderate and severe/fatal injuries compared to daytime. Finally, in terms of collision characteristics, side impacts (right side) increase moderate and severe/fatal injury risks by 6.2% and 9.2%, while rear-end collisions exert the most pronounced effect, raising these probabilities by 7.4% and 20.3% relative to frontal collisions.
Table 7.
Results of the marginal effects analysis for significant variables.
3.2. Analysis of GAM Results
To evaluate the fitting performance of the Generalized Additive Model (GAM), we included the Generalized Linear Model (GLM) as a benchmark for comparison. The results of the GLM are presented in Table 8, and those of the GAM are shown in Table 9 and Table 10. In Table 10, the effective degrees of freedom (edf) reflect the degree of curvature of the smoothing functions. An edf value close to 1 indicates an approximately linear relationship between the variable and the dependent variable, whereas a larger edf suggests a more pronounced nonlinear trend. The reference degrees of freedom (Ref.df) represent the theoretical maximum complexity of the smooth terms; the closer the edf is to the Ref.df, the stronger the data support for the corresponding smooth term. The statistical significance of these nonlinear effects is determined by the associated p-values.
Table 8.
Estimation of linear terms in GLM.
Table 9.
Estimation of linear terms in GAM.
Table 10.
Estimation results of smooth terms in GAM.
The combined results from both the GLM and GAM indicate that, among the discrete variables, age group 51–60 years (GLM: z = 3.541, p = 0.046; GAM: z = 1.794, p = 0.073), SUV involvement (GLM: z = 5.101, p < 0.001; GAM: z = 5.121, p < 0.001), and nighttime driving (GLM: z = −1.822, p = 0.068; GAM: z = −1.678, p = 0.093) are associated with crash severity. For the continuous variables, the nonlinear terms of wheelbase (GLM: z = 1.689, p = 0.046; GAM: χ2 = 16.757, p = 0.033), seat height (GLM: z = −2.214, p = 0.027; GAM: χ2 = 8.142, p = 0.049), seat–handlebar distance (GLM: z = −3.688, p < 0.001; GAM: χ2 = 13.814, p < 0.001), and speed (GLM: z = 1.788, p = 0.017; GAM: χ2 = 8.543, p = 0.035) were all statistically significant.
In terms of model fit, the GAM achieved a lower AIC value (618.29) compared to the GLM (625.68), suggesting that incorporating nonlinear relationships substantially improved the model fit. Furthermore, as shown in Table 11, the GAM consistently outperformed the GLM on both the training and test sets, with lower RMSE and MAE values and higher R2 values, indicating superior predictive capability. According to Table 9, the 51–60 age group (z = 1.794, p = 0.073) and SUV involvement (z = 5.121, p < 0.001) are positively associated with crash severity, while nighttime driving (z = −1.678, p = 0.093) is negatively associated with crash severity. These findings are consistent with the results obtained from the CRPOPH analysis.
Table 11.
Comparison of GLM and GAM prediction results and goodness of fit.
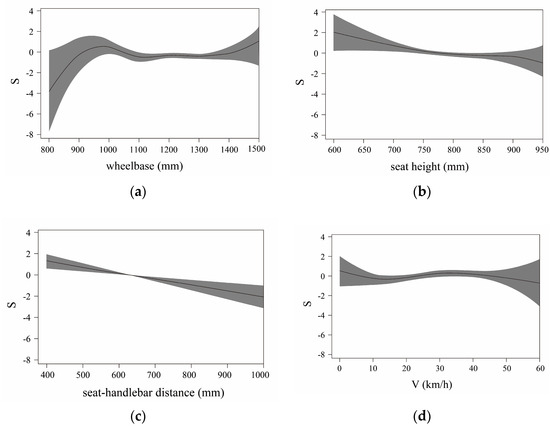
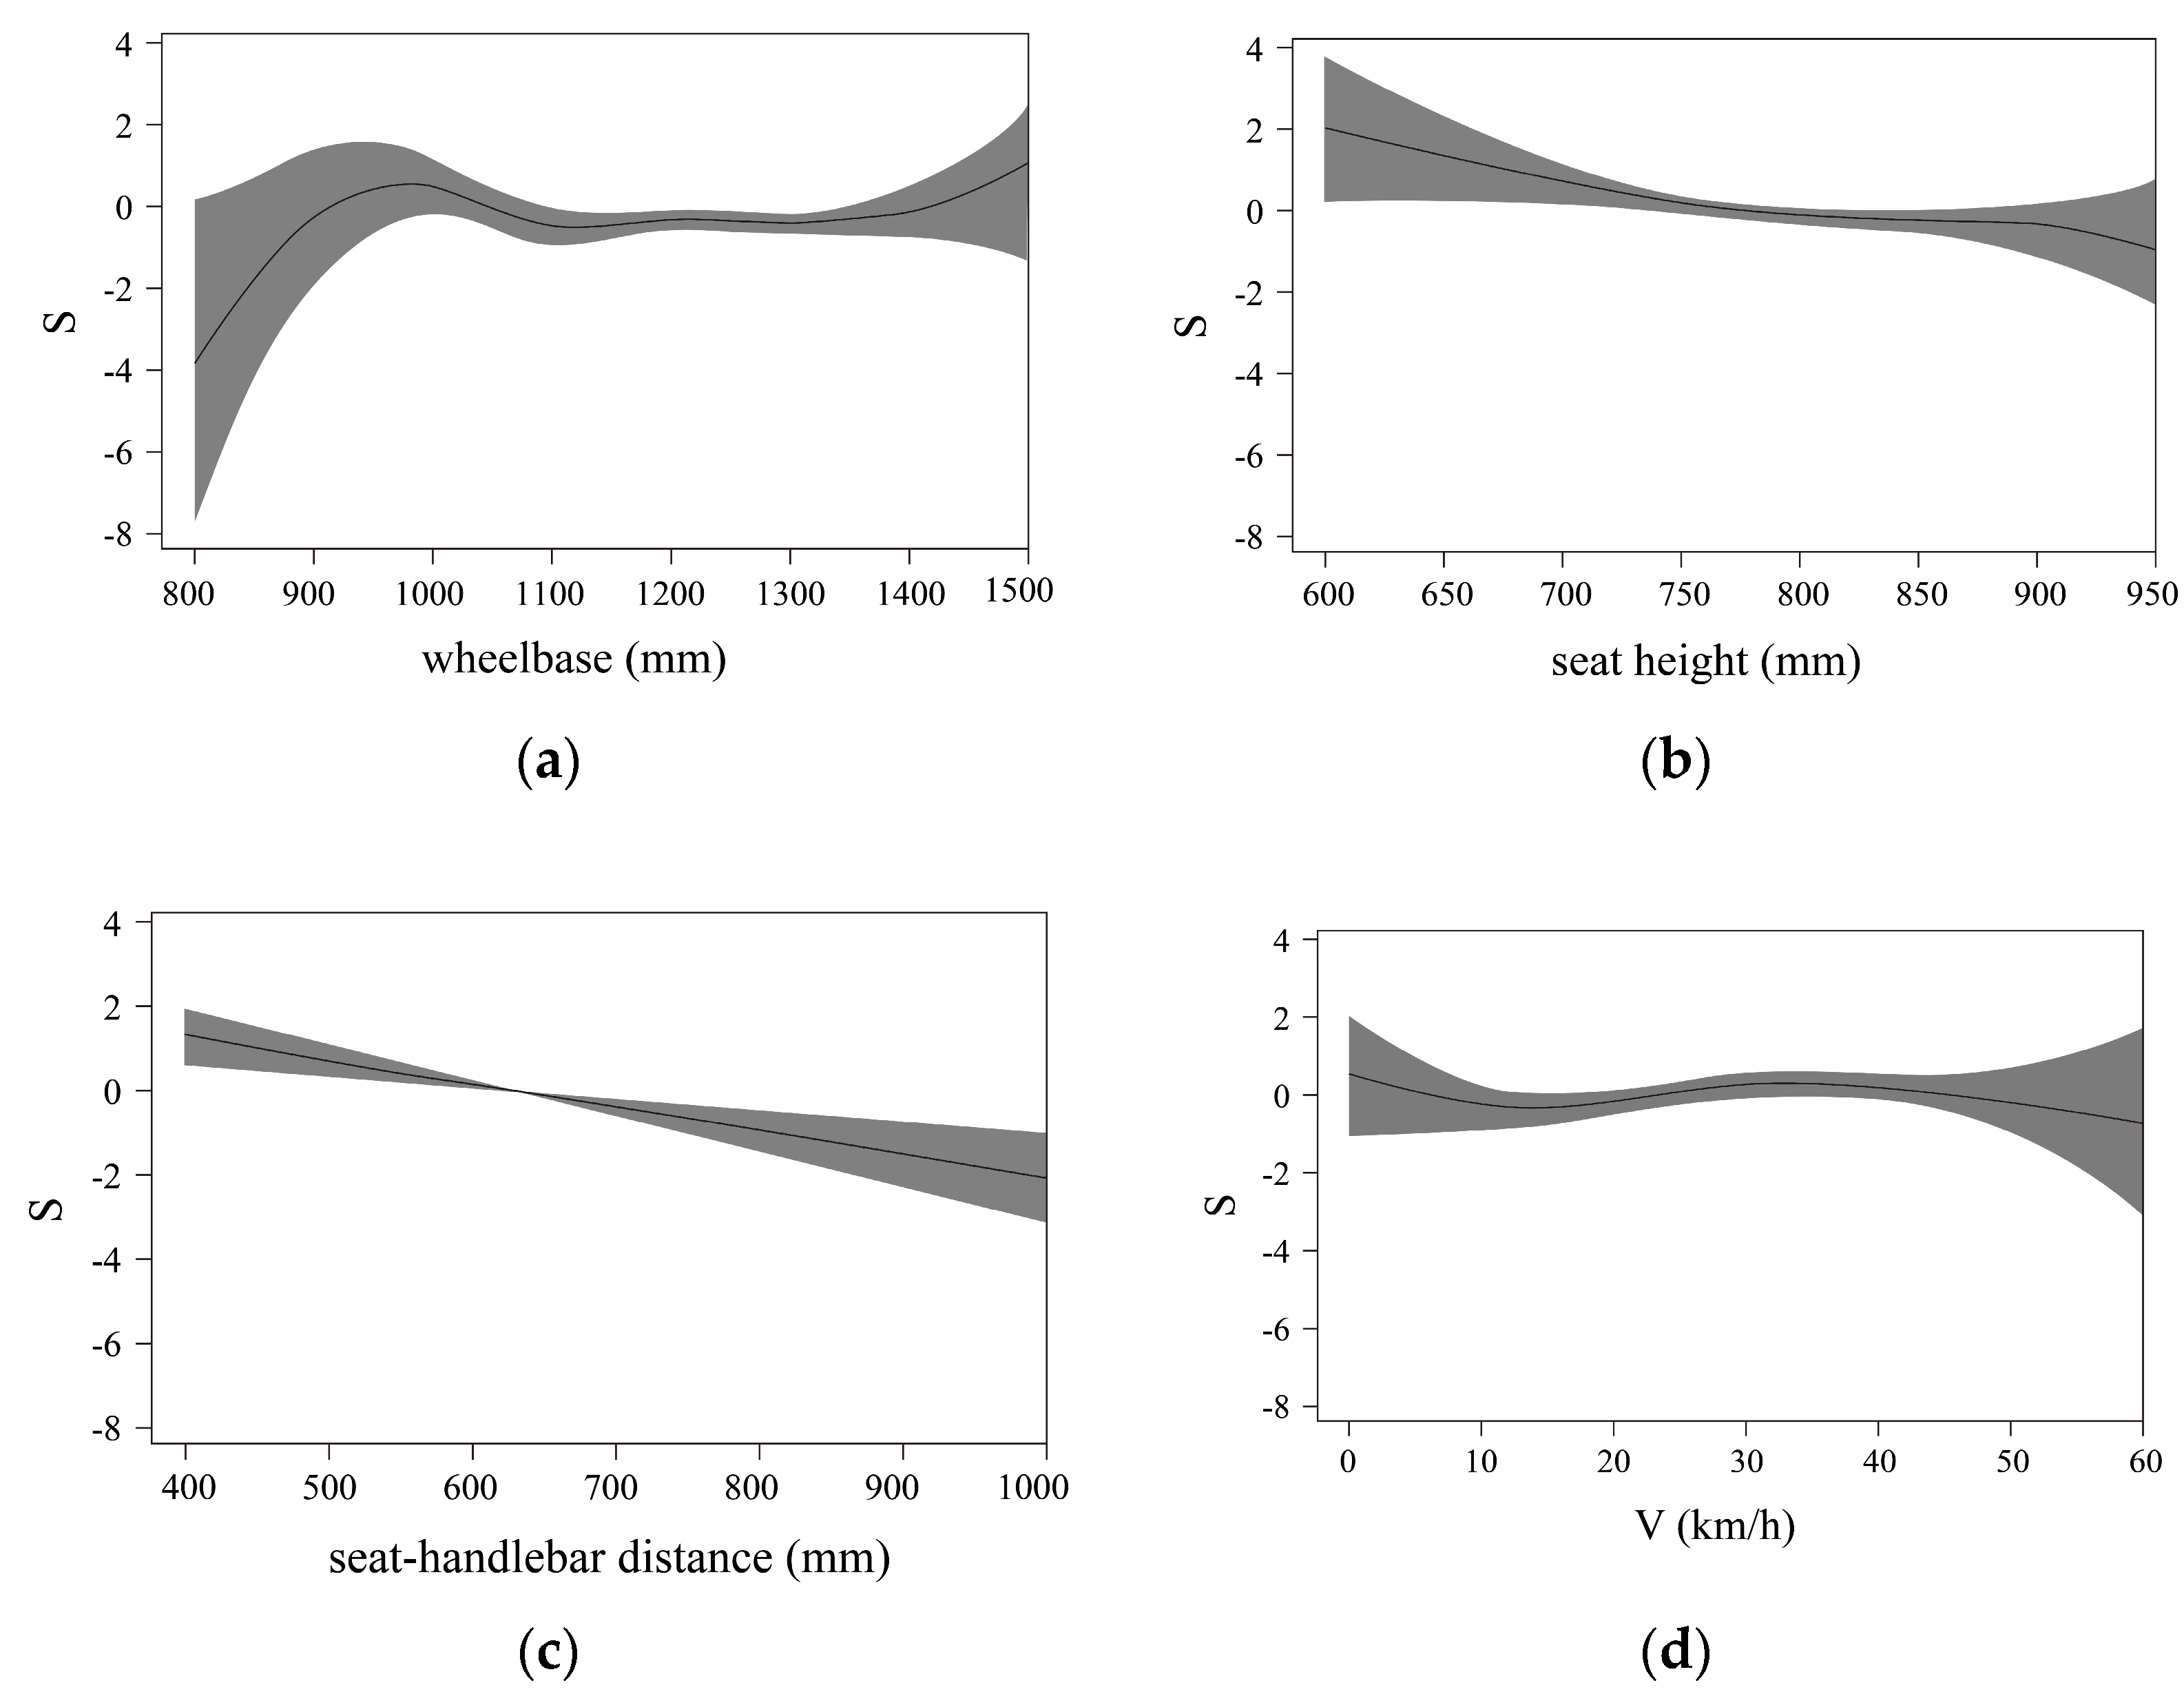
As shown in Figure 3a, there is a complex nonlinear relationship between E2W wheelbase and accident severity. When the wheelbase is below approximately 1000 mm, accident severity increases with wheelbase. When the wheelbase is roughly 1000–1100 mm, accident severity decreases as wheelbase increases. In the approximate range of 1100–1400 mm, accident severity fluctuates with increasing wheelbase. When the wheelbase exceeds about 1400 mm, accident severity increases with wheelbase. According to Figure 3b, there is no significant nonlinear relationship between E2W seat height and accident severity. Accident severity decreases monotonically as seat height increases. Based on Table 10, the estimated degree of freedom for seat–handlebar distance is 1, indicating a linear correlation between accident severity and seat–handlebar distance. As shown in Figure 3c, accident severity decreases monotonically with increasing seat–handlebar distance. A complex nonlinear relationship exists between E2W speed and accident severity. As illustrated in Figure 3d, when E2W speed is below about 15 km/h or above about 30 km/h, accident severity decreases with speed; when speed is approximately 15–30 km/h, accident severity significantly increases with speed.
Figure 3.
Non-linear influence of continuous variables on the severity of E2W accidents. (a) wheelbase. (b) seat height. (c) seat−handlebar distance. (d) V.
4. Discussion
E2W accidents involve multiple characteristic factors, which may have correlations, non-linear relationships, interactions, and unobserved heterogeneous effects with the severity of the E2W accident. The study takes the severity of E2W accidents as the dependent variable and selects potential factors that may affect the severity of E2W accidents from five aspects: rider characteristics, vehicle characteristics, road characteristics, environmental characteristics, and collision characteristics as independent variables. A correlated random parameter ordered probit model with heterogeneity in means and generalized additive model (GAM) considering mean heterogeneity are constructed to analyze whether the independent variables have a significant impact on the severity of E2W accidents and the mechanism of the significant influencing factors.
4.1. Rider Characteristics
The study found that male E2W riders have a higher probability of serious injury or death and a lower probability of minor injuries compared to female riders. Riders aged 51–60 have a higher probability of serious injury or death than those aged 18–30. Several mechanisms have been proposed in the literature to explain such patterns. For example, some studies suggest that male riders may have faster perception and reaction times, potentially reducing minor collisions [17], while others point to riskier behaviors (e.g., speeding, red-light running, drunk driving) that lead to more severe outcomes [18]. Older riders may have slower reaction times and greater physical fragility [19,20]. However, due to the lack of gender-specific and age-specific exposure data (e.g., total riding distance or number of riders per group), our study cannot determine whether the observed probability differences reflect true per-ride risk differences or simply differences in riding share across groups. Additionally, the inherent probability-mass constraint of ordered probability models means that a lower probability of moderate/severe crashes for one group necessarily implies a higher probability of minor crashes. Therefore, the above findings should be interpreted as conditional associations within the sample, not as causal evidence for any specific behavioral mechanism. Regarding helmet use, although not included in our statistical models, the helmet-wearing rate among E2W riders in our sample was only 13.6%, as E2W riders in China are not legally required to wear helmets. Previous research on E2W accidents has consistently shown that head injuries are the most common type of injury [21,22]. Consequently, mandatory helmet wearing may be an effective strategy to reduce injury severity in E2W accidents, a topic for future research.
4.2. Vehicle Characteristics
The study found that the larger the size of the vehicle involved in a collision, the higher the probability of serious injury or fatality for E2W riders. This may be attributed to the greater kinetic energy possessed by larger vehicles at the same speed. Additionally, larger vehicles have larger blind spots, making it difficult for drivers to detect E2Ws, thereby increasing the risk of collision incidents [23,24]. Furthermore, the structural dimensions of E2Ws are a critical factor influencing accident severity. In addition, the structural size of E2Ws is a key factor affecting the severity of the accident. The structural dimensions of different E2Ws will affect the collision kinematics of the rider, resulting in changes in injury. Therefore, optimizing the structural design of E2Ws is an important way to improve the safety of riders.
4.3. Road Characteristics
The study found that serious accidents involving E2Ws are more likely to occur at intersections, potentially due to the increased number of directional conflicts and restricted driver vision. Additionally, the probability of serious E2W accidents on non-asphalt surfaces is higher than on asphalt pavements, likely because asphalt provides greater surface smoothness and friction coefficient, thereby reducing collision impact speeds. Therefore, enhancing traffic management at intersections and conducting regular inspection and maintenance of road surfaces can significantly improve the safety of E2W riders.
4.4. Environmental Characteristics
The study found that E2W riders are less likely to sustain serious injuries when riding at night. This may be because road traffic is heavier and vehicle speeds are higher during the day, and E2W riders tend to engage in riskier behavior, whereas at night, visibility is reduced and E2W riders tend to ride more cautiously. Although weather factors were not analyzed in this study, previous research has shown that adverse weather conditions can lead to E2W accidents [25]. For example, rain and snow can reduce road grip, while fog can decrease visibility and prolong reaction times for both car drivers and E2W riders. Strong winds may also reduce the stability of E2Ws. Investigating the impact of weather conditions on the severity of E2W accidents will be the next direction of our research.
4.5. Collision Characteristics
The study found that, compared with frontal collisions, E2Ws are more likely to be involved in serious accidents when they are hit on the right side or rear. Compared with driving straight, E2Ws face more traffic conflicts from other lanes when turning, which increases the probability of collisions with motor vehicles. In addition, when E2Ws are rear-ended, riders have difficulty taking emergency evasive action because they do not have enough time to react, increasing the probability of serious injury to E2W riders in accidents. The study also found a complex non-linear relationship between the collision speed of E2Ws and the severity of E2W accidents, with a corresponding threshold of 30 km/h. When the speed of an E2W is 30 km/h, the probability of the rider suffering serious injury is highest. This may be because different E2W speeds result in different collision locations and collision kinematics for riders, but the detailed reasons need to be confirmed by conducting further research.
5. Conclusions
This study identifies several factors that significantly affect E2W accident severity, including rider demographics (gender, age, height), vehicle type, collision time and location, road surface, E2W geometry (wheelbase, seat height, seat–handlebar distance), speed, and impact point. All else being equal, male riders have a higher probability of serious injury than female riders, riders aged 51–60 have a higher probability than those aged 18–30, and riders shorter than 170 cm have a higher probability than taller riders. Collisions with SUVs or trucks lead to a greater risk of serious injury than collisions with sedans. Regarding environmental conditions, serious injuries are more probable at intersections versus non-intersections, on non-asphalt roads rather than asphalt roads, and during daytime instead of nighttime. In terms of impact configuration, right-side or rear-end crashes carry a higher risk compared to frontal collisions. With regard to the design of E2Ws, the risk of serious injury is lowest when the wheelbase is about 1000–1400 mm; furthermore, a higher seat height and a greater seat–handlebar distance can reduce injury severity. The relationship between the speed of E2Ws and injury severity is non-linear: within the speed range of approximately 15 km/h to 30 km/h, there is a positive correlation between the two, while at other speeds there is a negative correlation.
Author Contributions
Conceptualization, H.L. and T.Z.; methodology, H.L. and T.Z.; validation, X.L.; formal analysis, T.Z.; investigation, X.L.; data curation, X.L.; fund management, T.Z.; writing—original draft preparation, X.L.; writing—review and editing, X.L.; supervision, H.L.; project administration, H.L. and T.Z.; All authors have read and agreed to the published version of the manuscript.
Funding
This work was supported by the National Natural Science Foundation of China (Grant Numbers: 62273057); National Key Research and Development Program of China (Grant Numbers: 2019YFE0108000).
Data Availability Statement
Data can be made available on reasonable request.
Conflicts of Interest
The authors declare no conflicts of interest.
Abbreviations
The following abbreviations are used in this manuscript:
| E2W | Electric two-wheeler |
| CIDAS | China In-Depth Accident Study |
| OPM | The ordered probit model |
| RPOP | The random parameter ordered probit model |
| CRPOPH | Correlated random parameter ordered probit model with heterogeneity in means |
| GLM | Generalized Linear Model |
| GAM | Generalized Additive Model |
References
- World Health Organization. Global Status Report on Road Safety 2023. Available online: https://www.who.int/publications/i/item/9789240086517 (accessed on 17 April 2026).
- Fernandez, A.M.; Li, K.D.; Patel, H.V.; Allen, I.E.; Ghaffar, U.; Hakam, N.; Breyer, B.N. Electric Bicycle Injuries and Hospitalizations. JAMA Surg. 2024, 159, 586–588. [Google Scholar] [CrossRef] [Scilit] [PubMed]
- National Bureau of Statistics. Chinese Statistical Yearbook; Chinese Statistical Press: Beijing, China, 2023.
- Iworiso, J.; Vrontos, S. On the directional predictability of equity premium using machine learning techniques. J. Forecast. 2020, 39, 449–469. [Google Scholar] [CrossRef] [Scilit]
- Lusiana, E.D. Performance and separation occurrence of binary probit regression estimator using maximum likelihood method and Firths approach under different sample size. AIP Conf. Proc. 2017, 1913, 020036. [Google Scholar] [CrossRef] [Scilit]
- Park, S.; Park, J. Multilevel mixed-effects models to identify contributing factors on freight vehicle crash severity. Sustainability 2022, 14, 11804. [Google Scholar] [CrossRef] [Scilit]
- Cirillo, C.; Liu, Y.; Tremblay, J.M. Simulation, numerical approximation and closed forms for joint discrete continuous models with an application to household vehicle ownership and use. Transportation 2022, 44, 1105–1125. [Google Scholar] [CrossRef] [Scilit]
- Xiao, D.; Jin, X.; Xu, X.; Kang, S. Determinants of Crash Fatalities in Urban Area: A Bayesian Ordered Probit with Sample Selection Model. In CICTP 2020; American Society of Civil Engineers: Reston, VA, USA, 2020; pp. 2746–2757. [Google Scholar]
- Wen, H.; Huang, K.; Ma, Z.; Huang, J. Determinants of driver injury severity in electric vehicle crashes: A random parameters binary probit model with heterogeneity in means and variances. J. Transp. Saf. Secur. 2025, 17, 427–455. [Google Scholar] [CrossRef] [Scilit]
- Darban Khales, S.; Kunt, M.M.; Dimitrijevic, B. Analysis of the impacts of risk factors on teenage and older driver injury severity using random-parameter ordered probit. Can. J. Civ. Eng. 2020, 47, 1249–1257. [Google Scholar] [CrossRef] [Scilit]
- Fountas, G.; Fonzone, A.; Olowosegun, A.; McTigue, C. Addressing unobserved heterogeneity in the analysis of bicycle crash injuries in Scotland: A correlated random parameters ordered probit approach with heterogeneity in means. Anal. Methods Accid. Res. 2021, 32, 100181. [Google Scholar] [CrossRef] [Scilit]
- Zhipeng, P.; Yuan, R.; Qin, Y.; Wang, Y.; Gu, X. A comparative analysis of factors affecting injury severity in speeding-related crashes on rural and urban roads. Int. J. Crashworthiness 2024, 29, 794–805. [Google Scholar] [CrossRef] [Scilit]
- Olowosegun, A.; Babajide, N.; Akintola, A.; Fountas, G.; Fonzone, A. Analysis of pedestrian accident injury-severities at road junctions and crossings using an advanced random parameter modelling framework: The case of Scotland. Accid. Anal. Prev. 2022, 169, 106610. [Google Scholar] [CrossRef] [Scilit] [PubMed]
- Becker, N.; Rust, H.W.; Ulbrich, U. Weather impacts on various types of road crashes: A quantitative analysis using generalized additive models. Eur. Transp. Res. Rev. 2022, 14, 37. [Google Scholar] [CrossRef] [Scilit]
- Rezapour, M.; Ksaibati, K. Contributory factors to the severity of single-vehicle rollover crashes on a mountainous area, generalized additive model. Int. J. Inj. Control Saf. Promot. 2022, 29, 281–288. [Google Scholar] [CrossRef] [Scilit] [PubMed]
- Mao, H.; Deng, X.; Jiang, H.; Shi, L.; Li, H.; Tuo, L.; Shi, D.; Guo, F. Driving safety assessment for ride-hailing drivers. Accid. Anal. Prev. 2021, 149, 105574. [Google Scholar] [CrossRef] [Scilit] [PubMed]
- Hichim, M.F.; Khusheef, A.S.; Raheemah, S. The effects of driver age and gender on vehicle stopping distance under different speeds. Eur. Transp. 2020, 2020, 1–11. [Google Scholar] [CrossRef] [Scilit]
- Rhodes, N.; Pivik, K. Age and gender differences in risky driving: The roles of positive affect and risk perception. Accid. Anal. Prev. 2011, 43, 923–931. [Google Scholar] [CrossRef] [Scilit] [PubMed]
- Lamb, D.G.; Correa, L.N.; Seider, T.R.; Mosquera, D.M.; Rodriguez, J.A., Jr.; Salazar, L.; Schwartz, Z.J.; Cohen, R.A.; Falchook, A.D.; Heilman, K.M. The aging brain: Movement speed and spatial control. Brain Cogn. 2016, 109, 105–111. [Google Scholar] [CrossRef] [Scilit] [PubMed]
- Cruz-Jentoft, A.J.; Baeyens, J.P.; Bauer, J.M.; Boirie, Y.; Cederholm, T.; Landi, F.; Martin, F.C.; Michel, J.-P.; Rolland, Y.; Schneider, S.M. Sarcopenia: European consensus on definition and diagnosis: Report of the European Working Group on Sarcopenia in Older People. Age Ageing 2010, 39, 412–423. [Google Scholar] [CrossRef] [Scilit] [PubMed]
- Baschera, D.; Feiler, S.; Jäger, D.; Z’Graggen, W.; Raabe, A.; Exadaktylos, A.; Hasler, R. Incidence and severity of head injury due to e-bike accidents compared to normal bicycle accidents. J. Neurol. Surg. A Cent. Eur. Neurosurg. 2017, 78, O19. [Google Scholar] [CrossRef] [Scilit]
- Zhou, S.A.; Ho, A.F.W.; Ong, M.E.H.; Liu, N.; Pek, P.P.; Wang, Y.Q.; Jin, T.; Yan, G.Z.; Han, N.N.; Li, G. Electric bicycle-related injuries presenting to a provincial hospital in China: A retrospective study. Medicine 2017, 96, e7395. [Google Scholar] [CrossRef] [Scilit] [PubMed]
- Summerskill, S.; Marshall, R.; Cook, S.; Lenard, J.; Richardson, J. The use of volumetric projections in Digital Human Modelling software for the identification of Large Goods Vehicle blind spots. Appl. Ergon. 2016, 53, 267–280. [Google Scholar] [CrossRef] [Scilit] [PubMed]
- Li, J.; Fang, S.; Guo, J.; Fu, T.; Qiu, M. A motorcyclist-injury severity analysis: A comparison of single-, two-, and multi-vehicle crashes using latent class ordered probit model. Accid. Anal. Prev. 2021, 151, 105953. [Google Scholar] [CrossRef] [Scilit] [PubMed]
- Robartes, E.; Chen, T.D. The effect of crash characteristics on cyclist injuries: An analysis of Virginia automobile-bicycle crash data. Accid. Anal. Prev. 2017, 104, 165–173. [Google Scholar] [CrossRef] [Scilit] [PubMed]

Disclaimer/Publisher’s Note: The statements, opinions and data contained in all publications are solely those of the individual author(s) and contributor(s) and not of MDPI and/or the editor(s). MDPI and/or the editor(s) disclaim responsibility for any injury to people or property resulting from any ideas, methods, instructions or products referred to in the content. |
© 2026 by the authors. Licensee MDPI, Basel, Switzerland. This article is an open access article distributed under the terms and conditions of the Creative Commons Attribution (CC BY) license.