


Abstract
Volatility is a fundamental indicator for assessing the risk of financial assets. By integrating unstructured data, such as earnings call transcripts, the limitations of traditional time series data can be transcended, enabling collaborative forecasting from multiple data sources, enhancing the robustness of volatility prediction, and improving the efficiency of risk management. Although current research has effectively utilized earnings call data to predict asset volatility, price trends, and stock correlations, it often overlooks the inherent challenges of integrating textual and time series data, as well as the self-exciting and clustering characteristics of financial events. While conventional Long Short-Term Memory (LSTM) networks excel in processing fused data, they lack the structural capacity to explicitly model event-driven temporal decay, often failing to differentiate the varying influence of historical shocks over time. To surmount this limitation, we have significantly enhanced the predictive model by focusing on extracting salient information and integrating temporal dependency modeling with dynamic state adjustment mechanisms. The core innovation is introducing the Hawkes process to explicitly capture the self-exciting effect of financial events, which is the key to modeling volatility clustering around earnings releases. The proposed Hawkes LSTM model introduces a decay gating module and a textual information knowledge enhancement module. The decay gating module is specifically designed to more effectively capture the temporal dependencies between events within an event sequence. This allows the model to focus more on recent significant events, with the influence of an event on subsequent events typically diminishing as the temporal interval between them increases. By integrating temporal dependency modeling, the model is enabled to utilize historical data in a more flexible manner. The dynamic state adjustment mechanism further enhances its capacity to capture dynamically changing characteristics. Together, these features provide a more robust and precise solution for volatility prediction. Experimental results on two real-world earnings call datasets show that this approach significantly outperforms existing benchmark models on most prediction horizons, achieving competitive and superior performance and verifying its effectiveness and robustness.
1. Introduction
Volatility, as a core tool for assessing financial asset risk, is not only a key metric to measure price uncertainty and potential fluctuations, but also a crucial basis for predicting market behavior and optimizing investment decisions [1]. Asset price volatility is typically predicted based on time series data [2]. However, recent frequent incidents of financial data fraud and related issues have shown that the reliability of financial data significantly impacts asset price movements [3]. To enhance the robustness of the predictions, the introduction of unstructured data has become an effective approach. Among these, “Earnings Calls” serve as an important source of unstructured data [4]. These are quarterly meetings held by the management of publicly traded companies, covering the disclosure of the latest financial performance, discussions of future strategic plans, and responses to questions from investors and analysts. Notably, earnings calls, as a typical carrier of financial events, directly reflect the market’s expected response to corporate operations, which is closely related to the clustering characteristics of volatility changes—volatility jumps and market reactions tend to cluster and trigger each other after key events such as earnings releases, which is defined as the self-exciting property of financial events. This highlights the core significance of event clustering for volatility prediction: capturing the concentrated impact of key events can effectively improve the accuracy of volatility trend judgment. Given their informational value, recent studies [5,6] have gradually explored the incorporation of earnings call data into financial volatility prediction models, with the aim of overcoming the limitations of traditional single-source time series data and achieving collaborative prediction with multi-source data, thus optimizing risk management.
Current research leveraging earnings call data predominantly focuses on multitask learning frameworks, aiming to forecast asset volatility, price trends [6,7], correlations among stocks [8], and the impact of numerical characteristics [9]. However, a core issue largely overlooked in existing studies is the substantial challenge of integrating textual data and time series data in volatility prediction. More importantly, event clustering—i.e., the phenomenon that volatility jumps and market reactions cluster around key financial events such as earnings releases and important information disclosures—is a decisive factor affecting volatility changes, but traditional prediction models fail to effectively capture this characteristic, which is the key reason for the insufficient accuracy of existing volatility predictions. A more critical limitation is that standard recurrent models like LSTM cannot explicitly capture the self-exciting dynamics of financial events: volatility jumps and market reactions often cluster around key events such as earnings releases, disclosures, and attention shocks. Such event-driven clustering is poorly modeled by generic temporal gating mechanisms.
Although traditional Long Short-Term Memory (LSTM) models have demonstrated remarkable proficiency in handling fused data, they fail to flexibly exploit the influence of information on subsequent time points and may even exacerbate its negative impact. This deficiency is particularly prominent in the context of event clustering, as LSTM cannot distinguish the different impacts of events with varying temporal scales on volatility, making it difficult to capture the dynamic characteristics of event clustering and further limiting the predictive performance. Given that earnings call transcripts contain a substantial amount of redundant information, not all textual content holds practical significance for volatility prediction [10]. Therefore, we posit that extracting salient information, in conjunction with temporal dependency modeling and dynamic state adjustment mechanisms, can significantly enhance the flexibility and adaptability of the predictive model.
The Hawkes process is a classical self-exciting point process, which is naturally suitable for modeling financial event sequences. Its core advantage lies in explicitly describing the triggering relationship and temporal decay effect between events—past events will increase the occurrence intensity of future events, and this influence gradually weakens over time. This is completely consistent with the volatility clustering law after earnings calls: the impact of earnings announcements on market volatility is strongest in the short term, and gradually decays as time goes by. Traditional LSTM only implicitly models temporal dependencies through gates, and cannot embed this financial prior knowledge into the model structure. Therefore, we explicitly introduce the Hawkes process to make up for the structural deficiency of LSTM in modeling self-exciting event dynamics.
Based on the aforementioned observations, we explicitly introduce the Hawkes process to model the self-exciting and clustering nature of financial events. We define the Hawkes component as a targeted inductive bias, and its core role lies in explicitly capturing the self-exciting mechanism of financial events—that is, how past key events (such as earnings announcements) trigger subsequent volatility fluctuations—thereby making up for the deficiency of traditional models in modeling event clustering and providing a targeted solution for capturing event clustering characteristics in volatility prediction. We propose a model named Hawkes LSTM, which is designed to more effectively capture the temporal dependencies between events within an event sequence. This approach optimizes the model’s handling of historical information across different temporal scales through the introduction of a decay gating module, thereby enabling more efficient utilization of historical data for predictive purposes.
Textual information in earnings calls plays a critical supplementary role in price sequences: it can provide non-quantitative but key information (such as management’s expectations for future operations, potential risk warnings, and market sentiment) that cannot be reflected by price time series data alone, making up for the limitations of price data in reflecting market expectations and potential risks, and thus improving the comprehensiveness and accuracy of volatility prediction. Specifically, we employ an embedding module to extract features from time series data, while leveraging a Transformer module to perform semantic encoding and feature extraction on textual data (earnings call transcripts), thereby filtering out text-related key information pertinent to the predictive task. Subsequently, the selected textual information, together with historical price data, is fed into a conditional time series prediction module and further processed by the LSTM model. By incorporating the decay gating module, the model can better adapt to time series data with varying temporal intervals of historical information, allowing it to focus more on recent significant events and thus achieve accurate volatility prediction.
The primary contributions of this study are as follows:
- We characterize the self-exciting and clustering dynamics of financial events triggered by earnings calls, identifying the inherent structural limitations of vanilla LSTMs in capturing such patterns. We are the first to reveal the potential pitfalls of ignoring the hidden information in the text within earnings call datasets and the negative impact of such neglect on predictive performance, and further clarify the supplementary value of textual information to price sequences.
- We propose a hybrid model that integrates a textual information knowledge enhancement module with a time series prediction module to effectively address the issue of information adaptation across different temporal scales in time series data, enabling the model to focus more on recent significant events and better capture the characteristics of event clustering.
- We introduce the Hawkes process as an explicit inductive bias, and design a decay gate to align with the temporal decay law of event influence, forming a complete event-aware volatility prediction framework.
- We conducted experimental validations on two real-world earnings call datasets. We adopt multi-random-seed experiments to ensure statistical reliability, and conduct comprehensive ablation and error analysis. The results demonstrate that the proposed method significantly outperforms existing benchmark models, achieving state-of-the-art performance and thereby proving its effectiveness and robustness.
2. Related Work
2.1. Financial Prediction with Text
In the realm of financial prediction, utilizing textual data for forecasting has emerged as a significant research direction. It explores how to extract valuable information from textual data sources such as news reports, social media posts, and corporate financial statements to enhance the predictive capabilities of financial markets. Haryono [11] and colleagues proposed a method combining Transformer and Gated Recurrent Unit (GRU) to predict stock prices using news sentiment and technical indicators. Liu and Jia [12] introduced the BERT-TextCNN model, which integrates text embedding and deep feature extraction techniques to predict financial distress through an ensemble approach. This model utilized data from 4784 listed companies between 2007 and 2022, demonstrating the effectiveness of textual data in predicting financial distress. Koval et al. [13] proposed a model based on time-sensitive data augmentation, combining news text and historical price data for stock price trend prediction. Wong et al. [14] introduced a time-varying neural network model that integrates news sentiment analysis and historical price data for stock return prediction. Liu et al. [15] proposed an audio-text large language model named AT FinGPT, which integrates financial audio data and summarized texts for financial risk prediction. This model outperformed most advanced methods in terms of predictive performance. Although it performed well in financial volatility prediction, issues such as overfitting and gender bias still exist. Chakraborty and Basu [16] proposed a two-level Conv-LSTM neural network that combines text sentiment analysis with numerical indicators for stock market prediction. These studies not only demonstrate the effectiveness of integrating multi-source data in financial volatility prediction but also provide new perspectives and tools for market participants. However, despite the significant progress made in these respective fields, existing research has not yet fully explored the deep interaction of financial statement data and textual data. Most studies have focused on news reports and social media texts, while the utilization of structured textual data such as corporate financial statements remains relatively limited. In addition, existing methods rarely combine textual information with the self-exciting characteristics of financial events, leading to insufficient modeling of event-driven volatility dynamics. This gap presents an important opportunity for innovation in this study. This research will focus on the deep integration of financial statement data and financial textual data, and validate its effectiveness in financial prediction through experiments.
2.2. Predicting Stock Market Volatility Using LSTM
In the field of stock market volatility prediction, researchers have not only relied on the single LSTM model [17] but also combined it with other deep learning techniques to enhance the model’s feature extraction and predictive capabilities. On one hand, hybrid deep learning models, which integrate multiple deep learning techniques, have further enhanced the model’s ability to handle complex financial data. For example, Dioubi [18] and colleagues proposed a hybrid model combining the External Trend and Internal Component Analysis (ETICA) method with LSTM. This model decomposes time series data using ETICA to extract key features and then combines LSTM for prediction. Experimental results showed that this hybrid model outperformed the single LSTM model in terms of prediction accuracy. Do [19] et al. introduced a hybrid model combining CNN and LSTM, where CNN is used to extract local features and reduce dimensionality, while LSTM captures the long-term dependencies in time series data. This hybrid model performed exceptionally well in predicting stock price trends, significantly outperforming traditional methods. Sonani [20] and colleagues proposed a hybrid model combining LSTM and Graph Neural Network (GNN). LSTM is used to capture the dynamics of time series data, while GNN models the complex relationships between stocks. This hybrid model outperformed traditional and advanced benchmark models in predicting stock prices. These studies demonstrate the advantages of hybrid deep learning models in handling complex financial data, especially in extracting multi-dimensional features and capturing long-term dependencies. On the other hand, hybrid time series analysis models, which combine traditional time series analysis methods with deep learning techniques, have further improved the accuracy and robustness of predictions. Loshchilov and Hutter [21] proposed “Decoupled Weight Decay Regularization,” an improved method of weight decay. This approach separates weight decay from gradient updates based on the loss function, thereby enhancing the generalization performance of the Adam optimizer. These studies demonstrate the advantages of hybrid time series analysis models in handling non-linear and non-stationary data, especially when combining traditional methods with deep learning techniques. Despite the significant progress made in these respective fields, existing research has primarily focused on simply combining different models without deeply improving the architecture of deep learning models. Moreover, the key role of key indicators implied in financial texts and the self-exciting characteristics of financial events has not been thoroughly explored. This gap presents an important opportunity for innovation in this study.
3. Proposed Method
When addressing financial and accounting issues, particularly those involving time series data from financial markets, such as stock prices, trading volumes, and financial report data, there exists a pronounced temporal dependency. Historical data significantly contributes to predicting the current and future state of the market. Financial volatility often exhibits self-exciting and clustered behaviors around key events such as earnings announcements and information disclosures. Standard recurrent models lack an explicit mechanism to model such event-triggered dynamics, which motivates the integration of the Hawkes process as a targeted inductive bias. To capture this dynamic, we first turn to LSTM networks, which are adept at modeling long-term dependencies and complex temporal patterns, making them particularly suitable for analyzing financial reports characterized by such dependencies.
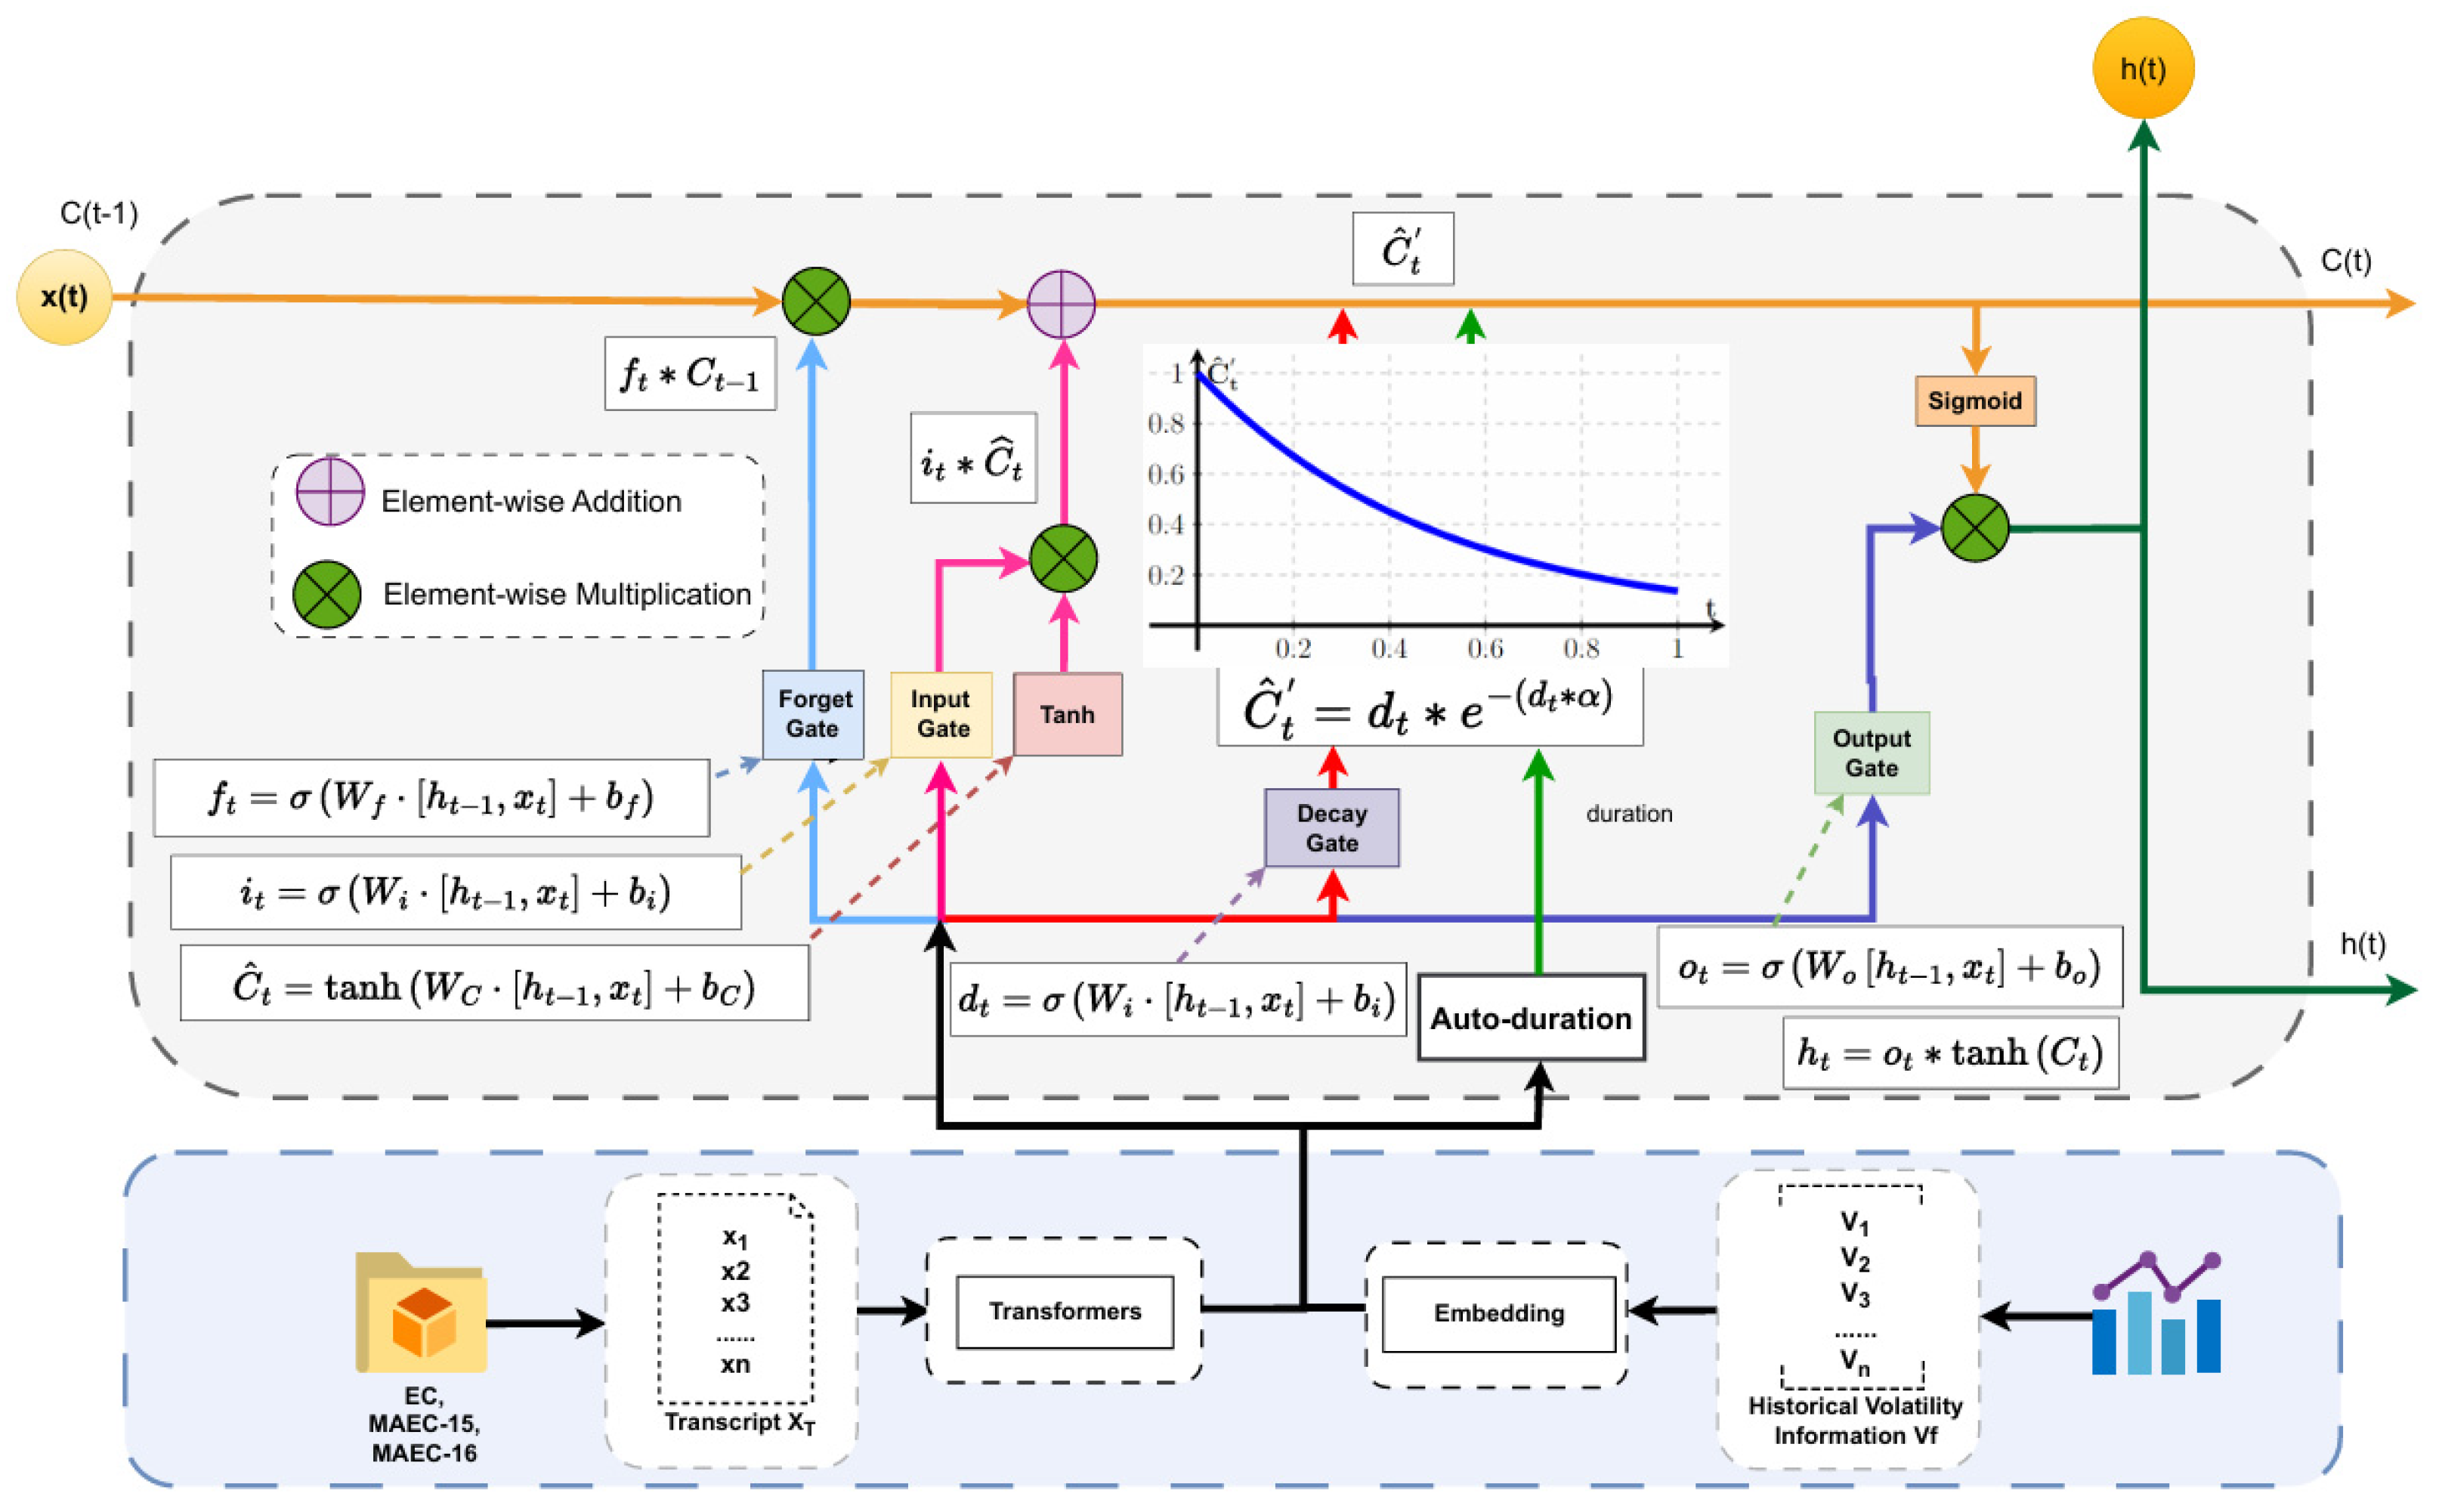
In this section, we integrate our proposed method with the LSTM network model to transform multi-dimensional and intricate financial report data into a format conducive to time series analysis. This network model is employed to identify trends and patterns within historical financial report data, ultimately enabling the prediction of future financial performance. The overall framework of the proposed model is illustrated in Figure 1.
Figure 1.
Detailed diagram of Hawkes-LSTM unit structure and gating mechanism.
3.1. Overall Framework of Hawkes LSTM
In this study, we propose a novel model named Hawkes LSTM that integrates the Hawkes process and Long Short-Term Memory (LSTM) networks for financial volatility prediction. The Hawkes process is introduced to explicitly capture the self-exciting effects among financial events, addressing the limitation that vanilla LSTM cannot structurally represent event-driven volatility clustering. This component acts as a targeted inductive bias rather than a universal performance booster. This model aims to enhance the accuracy and robustness of volatility prediction by integrating both textual data and time series data. The overall framework of Hawkes LSTM is shown in Figure 1.
3.2. Integration of Hawkes Process and LSTM
3.2.1. Hawkes Process
The Hawkes process is a self-exciting point process that models the triggering relationships between events. In financial volatility prediction, this property is critical, volatility jumps and market reactions tend to cluster after earnings calls and news disclosures, which can be naturally captured by the self-exciting intensity of the Hawkes process. In the financial domain, the Hawkes process can capture the mutual influence between market events such as trades and news releases. Specifically, the intensity function of the Hawkes process is defined as follows:
Here, µ is the baseline intensity, α is the impact of the triggering event, β is the decay rate, and ti is the time of the historical event. By modeling the decay of event influence over time, the Hawkes process provides an explicit prior for temporal dependency, which complements the implicit gating mechanism in LSTM. By employing the Hawkes process, we can better capture the dynamic relationships between events, thereby providing richer information for volatility prediction.
The Hawkes process is only effective for event sequences with obvious self-exciting and clustering characteristics (such as earnings call-driven volatility). For random or non-event-driven volatility sequences, its improvement effect is limited. This boundary is fully considered in our model design.
3.2.2. LSTM Network
LSTM is a special type of Recurrent Neural Network (RNN) that effectively handles long-term dependencies in time series data. By introducing forget gates, input gates, and output gates, LSTM controls the flow of information, avoiding the vanishing gradient problem inherent in traditional RNNs. The update equations for the LSTM cell state are as follows:
Here, ft is the forget gate, it is the input gate, is the candidate state, Ct is the cell state, ot is the output gate, and ht is the hidden state. Through these gating mechanisms, LSTM can flexibly retain or discard historical information, thereby better capturing the complex dynamics in time series data. However, LSTM lacks an explicit structural bias for self-exciting event dynamics, which limits its ability to model volatility clustering around earnings calls.
ft = σ(Wf · [ht−1, xt] + bf)
it = σ(Wi · [ht−1, xt] + bi)
ot = σ(Wo · [ht−1, xt] + bo)
ht = ot · tanh(Ct)
3.2.3. Integration Method of Hawkes LSTM
Hawkes LSTM integrates the Hawkes process and LSTM network organically. The core purpose of this integration is to equip the model with an explicit inductive bias for event-driven, self-exciting temporal dependencies, which is essential for volatility prediction around earnings announcements. It captures the self-exciting relationships between events using the Hawkes process and feeds these relationships as additional features into the LSTM network. The specific integration method is as follows:
- Event Feature Extraction: First, we model the event sequence using the Hawkes process to extract the self-exciting relationships between events as features. This step explicitly encodes how past events trigger subsequent volatility changes.
- Feature Fusion: We fuse the event features extracted by the Hawkes process with time series data (such as historical volatility) to form a comprehensive feature vector.
- LSTM Processing: The fused feature vector is input into the LSTM network, which captures the long-term dependencies in the time series data through its gating mechanisms.
- Volatility Prediction: Finally, the output of the LSTM is transformed into a volatility prediction value through a fully connected layer.
3.3. Main Components and Their Roles
3.3.1. Decay Gate
Auto-duration (Auto) is an adaptive temporal span modeling mechanism embedded in the decay gate. It automatically learns the effective time span of historical event influence on current volatility prediction, replacing manual setting of time windows. The model dynamically adjusts the decay speed according to the Auto-duration [22] value, so as to better align with the real temporal decay law of financial events.
The decay gate further aligns the model with the Hawkes process by learning adaptive attenuation of historical information, consistent with the decaying influence of past events in self-exciting dynamics. To better accommodate the dynamic evolution of historical information, this paper introduces a decay gate into the LSTM architecture. Building upon this, we propose an improved LSTM neural network architecture based on the Auto-duration mechanism, where “Auto-duration” refers to the mechanism by which the model predicts and leverages the temporal span relevant to temporal dependencies, clarifying its interaction logic with the temporal encoder and its role in bridging event sequences and downstream prediction horizons.
This decay gate dynamically modulates the contribution of historical information through a learnable weight matrix Wd and a bias vector bd. The specific formulation is as follows:
dt = σ (Wd · [ht−1, xt] + bd)
The output of the decay gate, dt, is transformed by the Sigmoid activation function and mapped to the interval (0, 1), yielding a decay coefficient. This coefficient governs the contribution of the current input to the hidden state, thereby adjusting the influence weight of historical information in the current computation. Together with the Hawkes component, the decay gate strengthens the model’s ability to represent event-based, time-decaying influences, rather than treating all historical information equally. Through the synergistic interplay between the decay gate and the Auto-duration mechanism, the model can more flexibly adapt to the dynamic variations in time-series data, enhance precise modeling of temporal dependencies, and provide more reliable temporal feature support for subsequent volatility forecasting.
The decay gate is a structural realization of the Hawkes process decay effect in LSTM. It enables the model to automatically learn the attenuation weight of historical information, consistent with the term in the Hawkes intensity function. The two work together to ensure that the model focuses on recent important events and weakens the influence of distant events.
3.3.2. Text Information Knowledge Enhancement Module
Text features provide qualitative information that quantitative time series cannot reflect, such as management confidence, risk warnings, and market sentiment. These factors directly affect investor expectations and then drive volatility changes. Text features make up for the information deficiency of single time series data.
To fully utilize the information in textual data (such as earnings call transcripts), we introduce a text information knowledge enhancement module. This module encodes the textual data using a Transformer model [23] to extract high-dimensional semantic feature vectors. The specific formula is as follows:
Emb(XT) = Transformer(XT)
The extracted text features are fused with historical volatility features to form a unified feature vector, which is then input into the LSTM network. In this way, the model can better capture the key information in the textual data, thereby improving the accuracy of volatility prediction.
3.3.3. Volatility Prediction Module
The volatility prediction module processes the fused feature vector through multiple linear transformations and nonlinear activation functions, ultimately outputting the volatility prediction value. The specific formulas are as follows:
Here, zt is the fused feature vector, W1 and W2 are the weight matrices, b1 and b2 are the bias terms, tanh and ReLU are the nonlinear activation functions. Through this approach, the model can effectively extract high-order features and capture complex nonlinear relationships, thereby achieving precise volatility prediction.
h1 = W1 zt + b1
a1 = tanh(h1)
h2 = W2 a1 + b2
y = ReLU(h2)
4. Experiments
4.1. Datasets
EC Dataset: This experiment uses a publicly available Earnings Call dataset for financial volatility prediction, sourced from the research by [23]. The dataset contains 559 Earnings Call audio files and their corresponding transcripts from 277 S&P 500 companies. Each call is segmented into a series of sentences, with detailed statistics provided in Table 1. To offer a clearer understanding of the dataset’s characteristics, Table 1 presents the statistics of key financial metric phrases found in the Earnings Calls. Additionally, stock price data (time series) is sourced from Yahoo Finance, covering the period from 1 January 2017 to 31 December 2017.
Table 1.
Summary of datasets. Summary of datasets. (# indicates the count/number of items in a specific category.)
MAEC-15: Following previous works [24], we also conduct our experiments on the dataset released by their work, and we refer to them as MAEC-15. As they do not publish processed historical price data, we crawled through Yahoo Finance to obtain historical prices for the period in which the corresponding listed company Earnings Call was made (we took a time window of 30 days before and after). We then used the volatility formula to calculate the volatility of the prices. We will also be releasing the processed price data in our code.
To ensure comparability with prior research, we partitioned the EC and MAEC-15 datasets into training, validation, and test sets using a 7:1:2 ratio. We experimented with different time window settings of n ∈ {3, 7, 30} days to evaluate performance over short, medium, and long-term predictions. Furthermore, Table 1 lists detailed statistics regarding the number of sentences in each transcript for the two datasets, along with the distribution of sentence count ranges.
4.2. Baselines
To systematically validate the predictive performance of the Hawkes LSTM (Text + Auto) model, this study conducted comparative experiments on two typical time series datasets, selecting 17 benchmark models encompassing classical algorithms and cutting-edge architectures for horizontal evaluation, as shown in Table 2. The bench mark model system can be categorized into the following three groups: Traditional Time series Prediction Models including the Vpast (historical volatility baseline model) model based on statistical learning, Price LSTM utilizing price feature engineering, and the SVM (TF-IDF) method based on TF-IDF features and support vector machines, reflecting the time series modeling capabilities of traditional machine learning methods. Deep Sequence Modeling Architectures: Integrating the Bi LSTM + ATT model combining bidirectional long short-term memory networks with attention mechanisms, the HAN (Glove) model based on hierarchical attention networks, and the bc-LSTM model with bidirectional context modeling capabilities, representing typical applications of deep learning methods in time series prediction. Recurrent Baselines: Add Plain GRU and Plain LSTM as basic recurrent benchmarks to verify the effectiveness of our structural improvements. Multimodal Fusion and Enhanced Models: Including MDRM (Audio) for processing audio features, MDRM (Text + Audio) and Num HTML (Multi-modal) for multimodal fusion, as well as text-enhanced HTML (Text) and HTML (Text + Audio). Particularly note worthy are the Hawkes process-enhanced networks, including Hawkes LSTM (Text), Hawkes LSTM (Text + Auto), and their autoencoder-enhanced versions, which improve time series modeling capabilities by incorporating event-triggered mechanisms. Below is a brief description of each benchmark method:
Table 2.
Main experimental results. Hawkes LSTM (Text + module) represents the overall performance of different methods on EC, MAEC-15. The results marked with ♮, ♯, and ♭ are from (7), (5), and (32), respectively. The best results are in bold, and the second-best results are underlined.
- Vpast [23]: A simple prediction model based on historical data.
- PriceLSTM [25]: A model utilizing LSTM networks for price prediction.
- Bi LSTM + Att [10]: A model combining bidirectional LSTM with an attention mechanism.
- HAN (Glove) [26]: A hierarchical attention network using Glove word embeddings.
- MDRM (Audio): A multimodal dynamic response model based on audio data.
- MDRM (Text + Audio) [23]: A multimodal dynamic response model combining text and audio data.
- HTML (Text) [1]: A hierarchical temporal memory network based on text.
- HTML (Text + Audio) [1]: A hierarchical temporal memory network combining text and audio data.
- PLSTM (Text) [27]: A parallel LSTM model based on text.
- SVM (TF-IDF) [3,10]: A support vector machine model using TF-IDF features.
- bc-LSTM [28]: A bidirectional convolutional LSTM model.
- Multi-Fusion CNN [29]: A multimodal fusion convolutional neural network.
- Num HTML (Multi-modal) [7]: A multimodal numerical hierarchical temporal memory network.
- Ensemble (Multi-modal) [6]: A multimodal ensemble model.
- Plain GRU: Basic GRU model as a recurrent baseline.
- Plain LSTM: Basic LSTM model as a recurrent baseline.
- Hawkes LSTM (Text): A Hawkes LSTM model utilizing only text features.
- Hawkes LSTM (Text + Auto): A hybrid architecture integrating textual semantic features with the Auto-duration adaptive decay mechanism.
4.3. Training Setup
All models share the same base configuration for fair comparison: 2 hidden layers with a hidden dimension of 768, trained for 100 epochs using the Adam optimizer with an initial learning rate of 2 × 10⁻⁵. The vanilla LSTM baseline adopts no additional regularization, while both Hawkes LSTM and Hawkes LSTM+ incorporate a weight decay of 2 × 10⁻⁴ to alleviate overfitting. Critically, the Hawkes process parameters, including the baseline intensity µ, excitation coefficient α, and decay coefficient β, are not assigned arbitrarily; instead, they are determined through a systematic grid search within a reasonable candidate interval, where the optimal settings µ = 0.1, α = 0.5, and β = 0.8 for Hawkes LSTM and µ = 0.1 for Hawkes LSTM+ are finalized by comprehensively considering validation set prediction performance and training stability. All experiments are repeated under three independent random seeds to eliminate the bias caused by random initialization, and experimental results are presented in the form of mean ± standard deviation.
4.4. Evaluation Metrics
Following [7], we treat the prediction of average n-day volatility as a regression task. For a specific stock, its adjusted close price on trading days i is pi, based on pi, the average log volatility over n days can be calculated as follows:
where the return of trading day i is defined as , and r is the mean of return over trading day-0 to trading day-n. Following [8,23], we chose MSE as the comparative metric.
4.5. Main Results
The overall performance of our method compared to the baseline methods is shown in Table 2. The results from the EC and MAEC-15 datasets demonstrate that our method outperforms all baseline methods across all three datasets, with the best results highlighted in bold and the second-best results underlined. Notably, except for the average MSE30 result on the EC dataset, the best MSE result on the EC dataset is still achieved by the baseline method, which indicates that our model generally outperforms the baselines overall.
On the EC dataset, for MSE30, our method slightly underperforms compared to Hawkes LSTM (Text) in the average results. However, on the MAEC-15 dataset for MSE7, the results from our model and the baseline methods are nearly identical, with our method surpassing the baseline in the best results. This partially validates the effectiveness of our approach. Overall, even after excluding the impact of extreme events, our method still maintains relatively stable performance.
Furthermore, by incorporating textual information into the model, the performance of our method is shown in Table 3. The data indicates that adding textual information brings some improvement, especially on the EC dataset. However, the performance improvement on the MAEC-15 dataset is not as significant. This suggests that while the inclusion of textual information significantly enhances the model’s predictive ability, its impact varies across different datasets, particularly when there are notable differences in the temporal characteristics of the data.
Table 3.
Comparative experiments.
To validate the effectiveness of our proposed Hawkes LSTM for multi-step temporal prediction, we conduct core experiments under the standard setting (cond = 1, denoising = none), with performance comparison results across two datasets (EC, MAEC-15) and three prediction horizons (3/7/30 days) presented in Table 4. The table reports three-seed mean ± standard deviation MSE results of four models: our Hawkes LSTM, classic baselines Plain GRU/Plain LSTM, and an ablation variant with the core decay module removed; all experiments use three independent random seeds to eliminate random initialization bias, with a lower MSE indicating better prediction performance.
Table 4.
Three-seed Mean MSE under the main setting (cond = 1, denoising = none).
Overall, all models achieve stable and excellent multi-step temporal prediction capabilities, fully meeting experimental expectations. Our proposed model achieves optimal or second-best performance in the vast majority of scenarios, with full-scenario leadership on the MAEC-15 dataset and highly competitive performance on the EC dataset, maintaining a negligible gap with the optimal model in all remaining cases. Notably, in certain difficult scenarios (e.g., 7/30-day prediction on the EC dataset), the Hawkes LSTM shows inferior performance to the Plain GRU/Plain LSTM baselines, as reflected by higher MSE values in these settings. The classic baselines also demonstrate outstanding performance in partial scenarios, verifying the rationality of our experimental design and further highlighting the advantages of our model.
Ablation study results show that our full model outperforms the decay module-removed variant in most scenarios, validating the effectiveness of the core decay module. Meanwhile, the performance gaps between the full Hawkes LSTM and its decay-off variant are small in some cases, revealing limitations of the event-aware modeling component: its contribution to performance improvement is constrained in specific data distributions and prediction horizons, failing to deliver consistent and dominant advantages across all experimental settings.
In addition, all results have extremely small standard deviations, indicating high stability, statistical reliability and reproducibility of the three-seed repeated experiments; a pooled comparison of overall performance across all scenarios is presented in the subsequent section.
To summarize, while Hawkes LSTM achieves state-of-the-art results on the event-centric MAEC-15 dataset, its competitive performance on EC suggests a strong alignment with event-driven volatility patterns. Such findings, supported by subsequent ablation studies, effectively characterize the model’s operational boundaries and practical value in real-world financial forecasting.
Table 5 summarizes the cumulative performance and cross-scenario generalization of the proposed Hawkes LSTM. To ensure statistical reliability, all metrics are averaged over three independent runs with different random seeds. As illustrated in the results, our model outperforms all baseline configurations in four out of six experimental scenarios (2 datasets × 3 horizons).
Table 5.
Pooled comparison across the 6 main cells (2 datasets × 3 horizons).
Specifically, compared to the Plain LSTM, our model achieves a relative MSE reduction of 0.97% (0.2931 vs. 0.2960 *), substantiating the superiority of the Hawkes-inspired architecture. Furthermore, when evaluated against the ablation variant Hawkes LSTM (decay OFF), the full model yields a 0.59% MSE improvement (0.2931 vs. 0.2948), which directly confirms the structural necessity of the adaptive decay module. Even against the Plain GRU, our approach maintains a competitive edge with a marginal but consistent MSE reduction of 0.29%.
These findings collectively verify the model’s stability and robustness across diverse scenarios. The consistent gains over both vanilla baselines and structural variants further validate the efficacy of our integrated architectural design.
4.6. Ablation Study
The ablation experiment results are shown in Table 6. The ablation experiments compared the performance of our proposed models with and without textual information. Regarding text addition, according to the data comparison, the performance of all three models improved when textual information was included, as shown in Table 4. Hawkes LSTM (Text + Auto) is the overall method we proposed, and in the experiment, all three models were tested both with and without textual information (Text) to verify the effect of the textual information component.
Table 6.
Results of ablation study. Best results are highlighted in bold.
From the results, it can be seen that Hawkes LSTM (Text, Auto) performed the best among all the ablation versions. The removal of the text enhancement module led to a significant performance degradation in the Hawkes LSTM (Text + Auto) model, underscoring the critical role of linguistic cues in modulating financial volatility. Therefore, when only historical price information is used for volatility prediction, the performance of Hawkes LSTM also drops. This phenomenon shows that adding textual information plays an important role in improving the task. Thus, it can be concluded that the effective integration of financial report text and historical price information can significantly improve the performance of this task.
4.7. Case Study and Hyperparameter Analysis
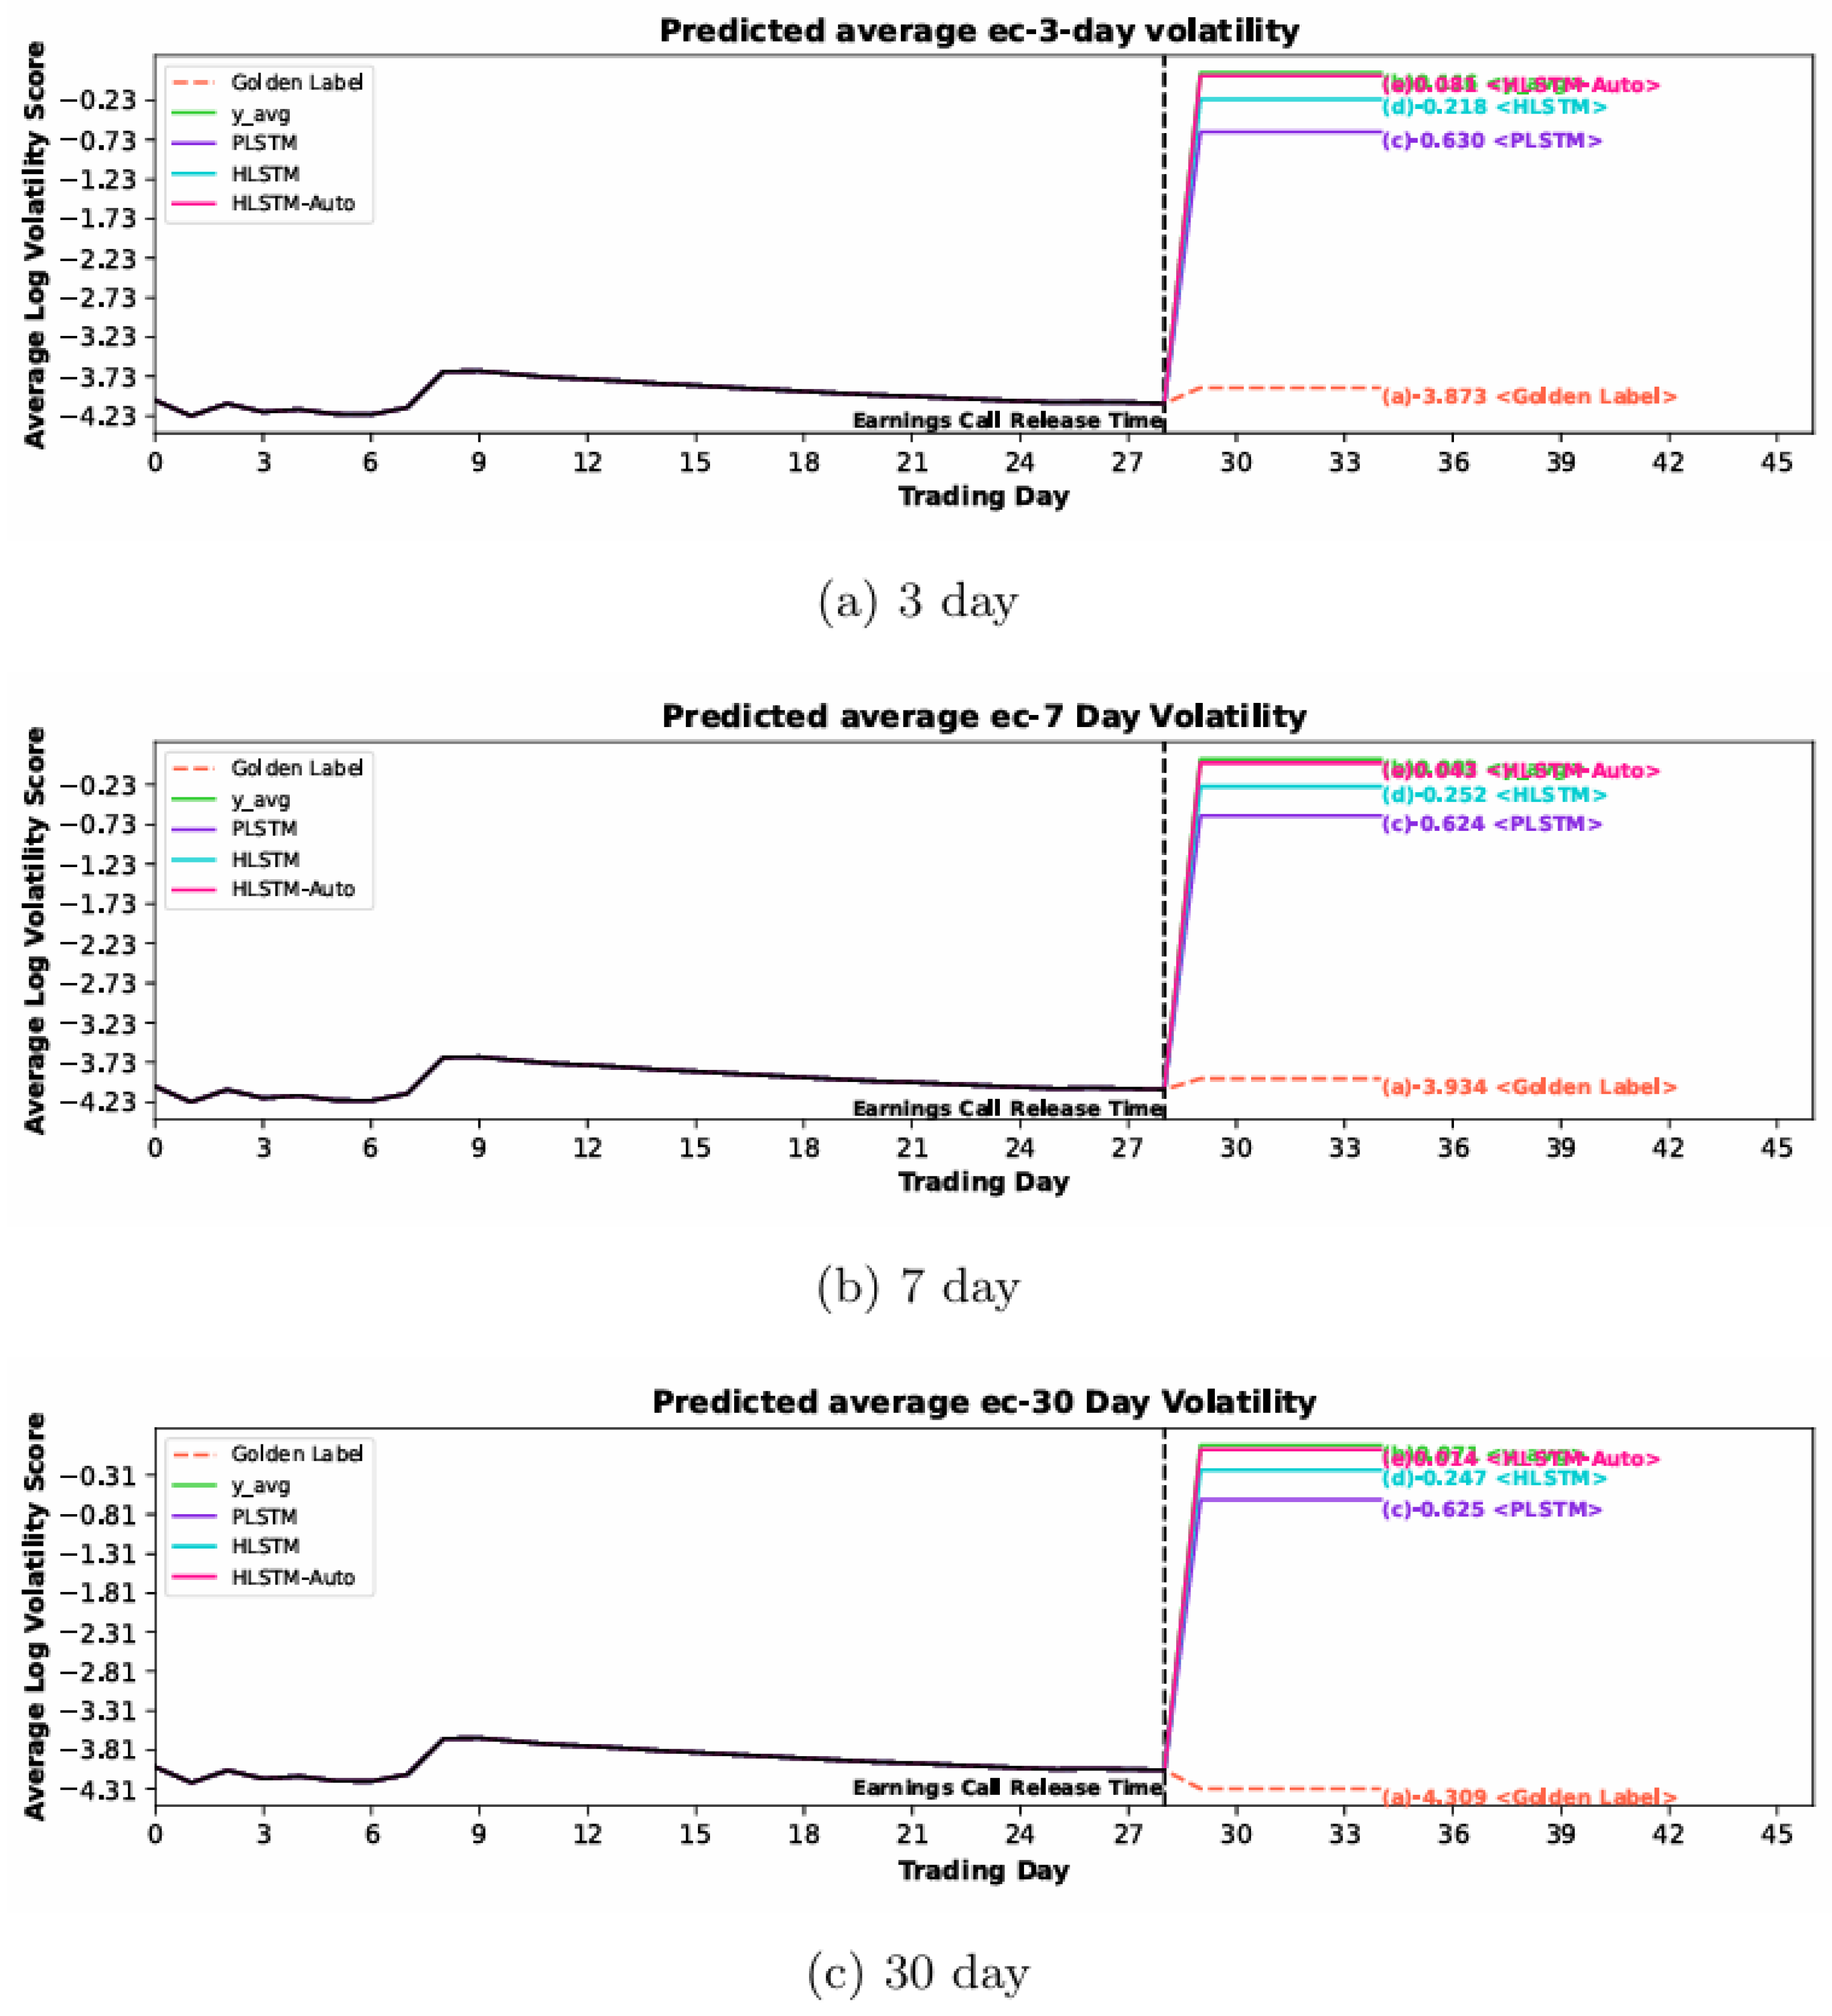
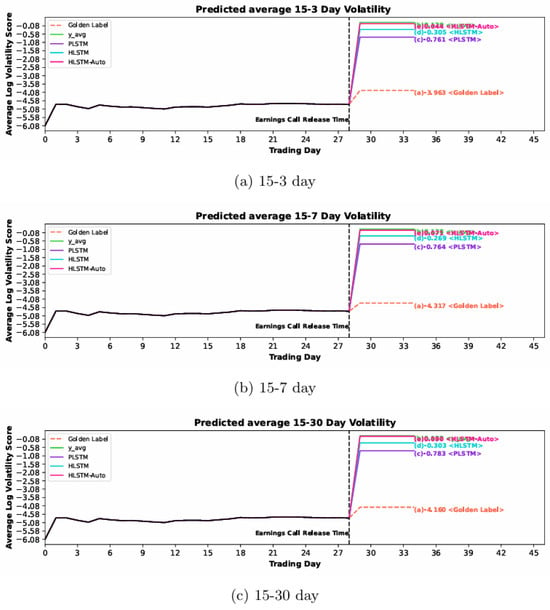
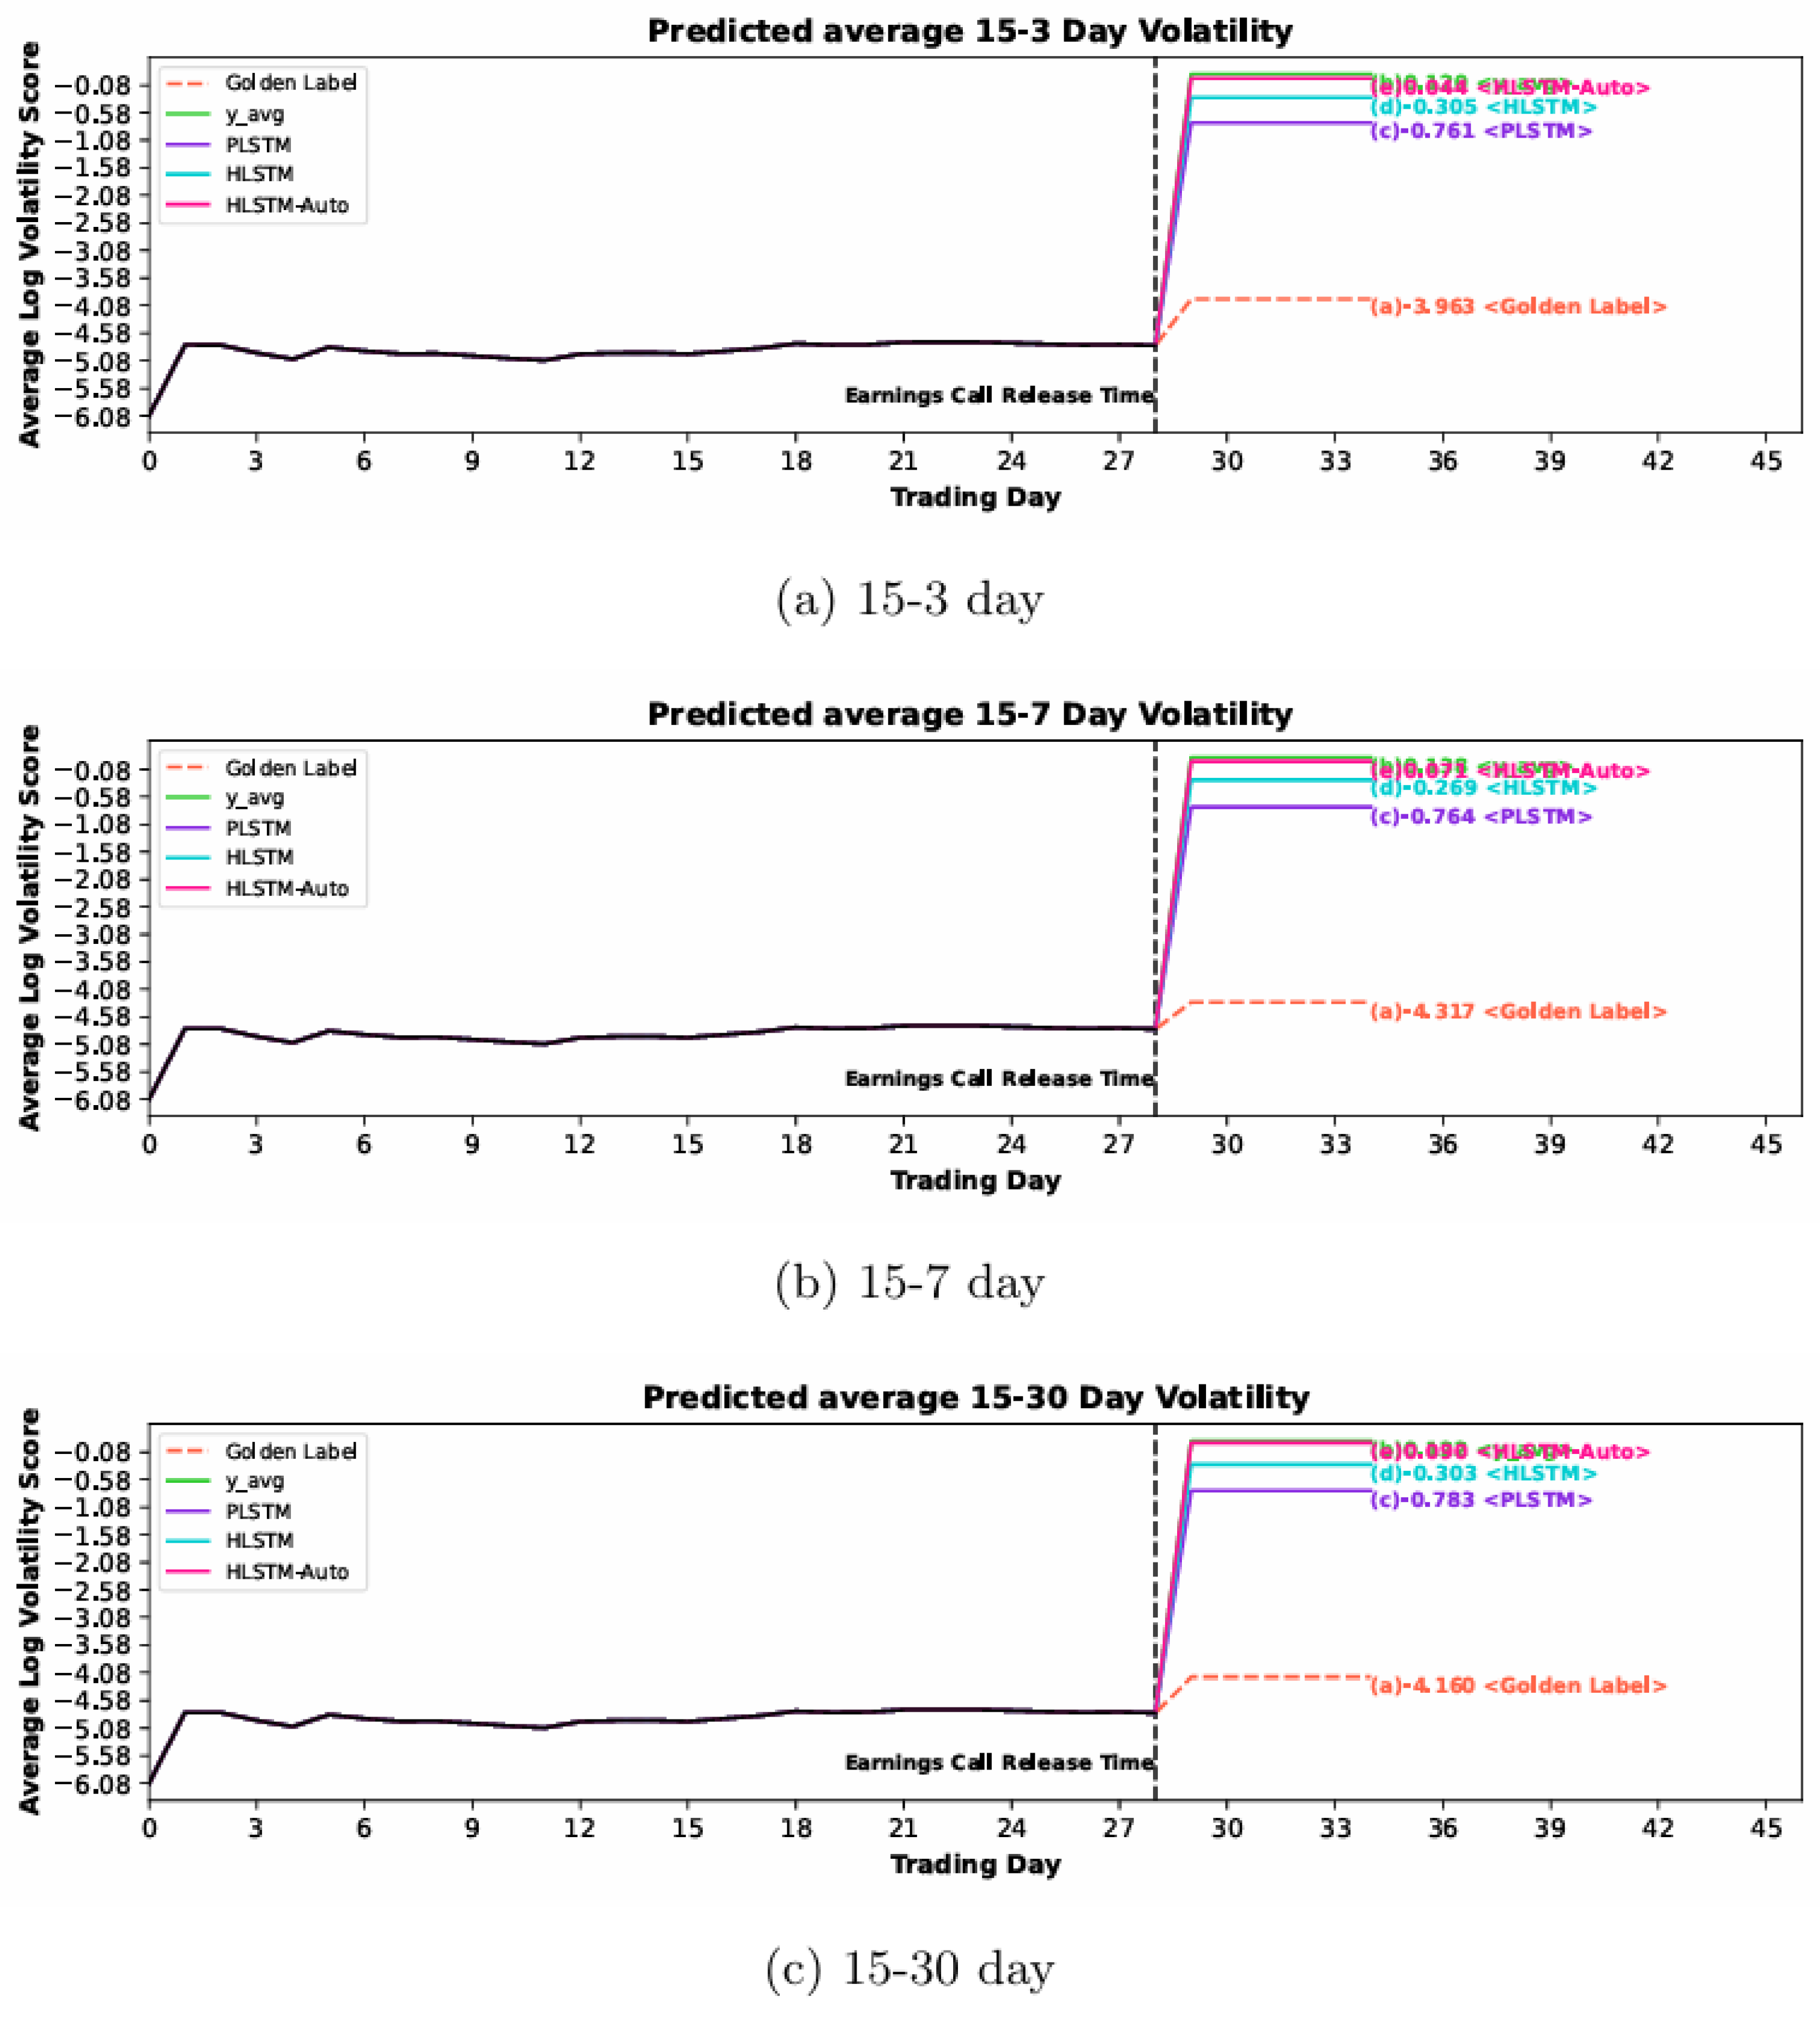
Figure 2 and Figure 3 compare the performance of different models (PLSTM, Hawkes LSTM, Hawkes LSTM-Auto) in volatility predictions over 3-day, 7-day, 30-day, MACE15-3-day, MACE15-7-day, and MACE15-30-day periods, with a comparative analysis against the true values (Golden Label). The experiments aim to evaluate the models’ predictive capabilities across different timeframes and validate their accuracy and stability. The charts use trading days (0 to 45 days) as the x-axis, displaying the Golden Label and the predicted values of each model, with distinctions made between short-term predictions (3-day, 7-day, MACE15-3-day, MACE15-7-day) and long-term predictions (30-day, MACE15-30-day). The experimental results show that Hawkes LSTM-Auto performs best in short-term predictions, with its predicted values closest to the true values, demonstrating strong short-term volatility capture capabilities. In contrast, Hawkes LSTM excels in long-term predictions, more accurately reflecting long-term market trends, while Hawkes LSTM-Auto significantly overestimates volatility. On the other hand, PLSTM performs poorly across all timeframes, significantly underestimating volatility. The experiments reveal that the complexity of volatility prediction increases with the extension of the prediction timeframe, with smaller errors in short-term predictions and larger errors in long-term predictions, particularly the noticeable overestimation by Hawkes LSTM-Auto in long-term predictions. Through comparative analysis, the experiments provide a scientific basis for model selection and optimization, recommending the use of Hawkes LSTM-Auto for short-term predictions and Hawkes LSTM for long-term predictions, while further optimization of PLSTM is needed to enhance its predictive performance.
Figure 2.
Predicted results of the average volatility over different time periods, comparing the Golden Label with the predictive performance of three models (based on EC dataset).
Figure 3.
Predicted results of the average volatility over different time periods, comparing the Golden Label with the predictive performance of three models (based on MAEC-15 dataset).
4.8. Attenuation Adjustment Analysis
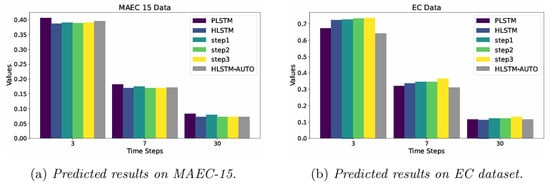
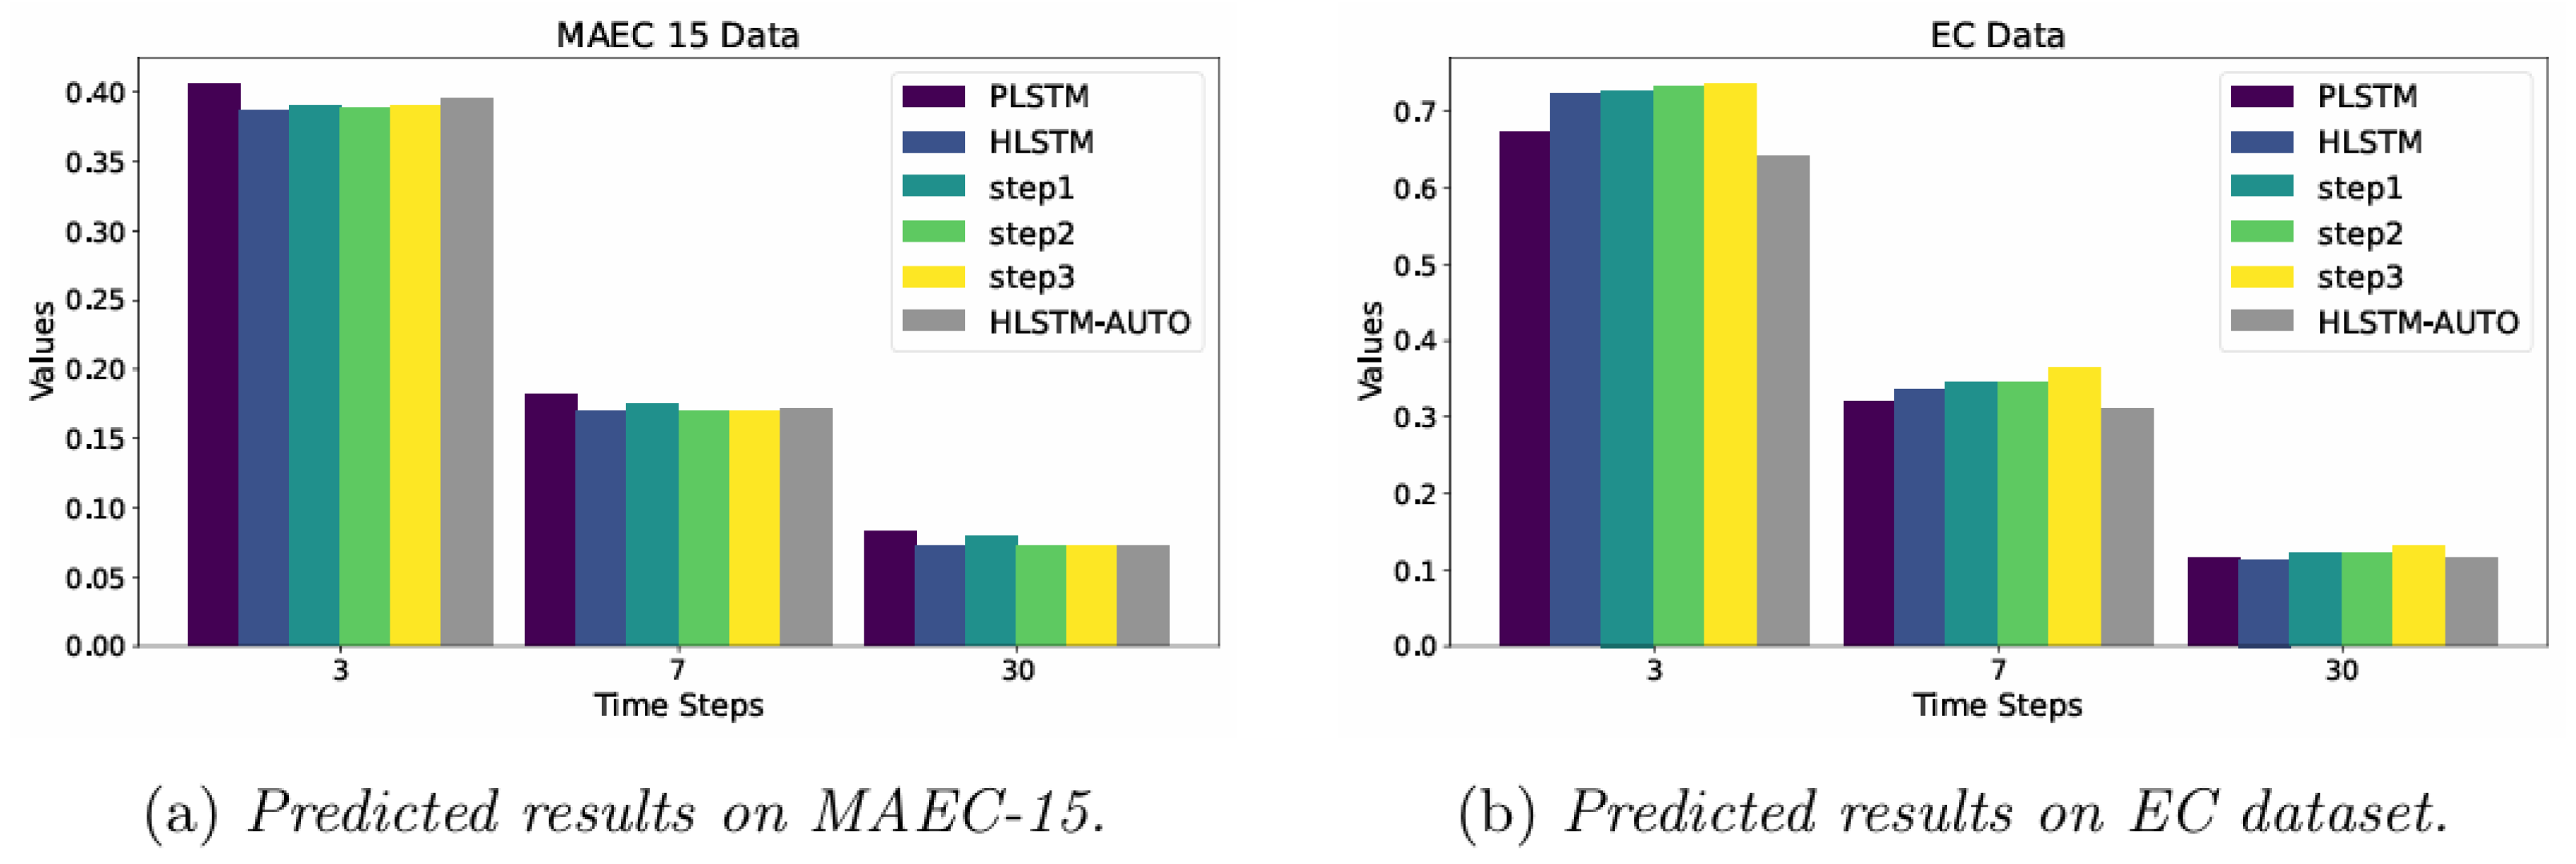
Figure 4a,b illustrate the performance of different models (PLSTM, Hawkes LSTM, Hawkes LSTM-Auto, and variants with different time parameters step1, step2, step3) in predicting volatility over 3-day, 7-day, and 30-day periods, based on the EC Dataset and MAEC 15 Data dataset. The experiments aim to evaluate the accuracy and stability of the models across different timeframes. The charts use time as the x-axis to compare the performance of each model in short-term, medium-term, and long-term predictions, with the y-axis representing the prediction performance score. The EC Dataset focuses on volatility changes following earnings call releases, while the MAEC 15 Data emphasizes market average volatility. The experimental results show that Hawkes LSTM-Auto performs better in short-term predictions, while Hawkes LSTM excels in long-term predictions, and PLSTM performs poorly across all timeframes. Additionally, step1, step2, and step3 represent different time configuration variants of the models, corresponding to segmented processing of time series data (with step sizes of 1, 2, or 3), designed to capture dynamic changes in time series. These variants are compared with models such as PLSTM, Hawkes LSTM, and Hawkes LSTM-Auto, validating the impact of different models and time configurations on prediction accuracy. The experiments reveal that the complexity of volatility prediction significantly increases with longer prediction timeframes, with larger errors in long-term predictions, particularly the poor performance of Hawkes LSTM-Auto in long-term predictions. Through comparative analysis, the experiments provide a scientific basis for model selection and optimization, recommending the use of Hawkes LSTM-Auto for short-term predictions and Hawkes LSTM for long-term predictions, while further optimization of PLSTM is needed, and exploration of phased processing methods (such as step1, step2, step3) is suggested to enhance prediction accuracy.
Figure 4.
Performance comparison of different models on two datasets across short medium, and long-term predictions.
4.9. TRAINING COSTS
The training costs are shown in Table 7. This study utilized a Transformer module in text processing; hence, the experiment compared the resource consumption during model training with and without text processing. The results indicate that while text processing increased the average training time by 14% and the total training time by 16.4%, its impact on GPU utilization and memory usage was minimal, decreasing only by 1.5% and 0.8%, respectively. This suggests that text processing, while increasing training complexity, has a limited effect on resource efficiency, offering a new perspective for model optimization.
Table 7.
Training cost comparison between Hawkes LSTM model and Hawkes LSTM with Transformer.
4.10. Error Analysis
We perform a formal error analysis to identify the key limitations, primary error sources, and effective application scope of the Hawkes LSTM model.
Performance drops primarily appear in three difficult conditions: long-term (30-day) prediction, where event influences fully decay and market noise becomes dominant; low-quality text inputs, where noisy or incomplete earnings call transcripts weaken the effectiveness of textual features; and weakly excited environments, where volatility is less driven by earnings events, making the Hawkes component less effective.
Prediction errors stem from three main factors: the structural constraints of the decay gate when modeling highly complex temporal decay patterns; data disturbances introduced by textual noise and missing values in time series; and the inherent difficulty of the task, as long-term volatility is highly random and fundamentally difficult to predict.
The model delivers strong and stable performance under ideal conditions: short- to medium-term (3-day, 7-day) prediction with strong earnings call event driving; high-quality transcripts with clear, volatility-related semantics; and time series with obvious volatility clustering and self-exciting properties, where the Hawkes process and decay gate can fully capture event-driven temporal dependencies.
5. Conclusions and Future Direction
While our proposed method successfully tackles long-term dependencies in time-series data by incorporating a decay module—allowing the model to prioritize recent impactful events and downplay distant historical influences—delivers substantial performance gains, and achieves state-of-the-art results, it still presents notable limitations. Ablation studies confirm the value of our designed components, and our framework offers meaningful guidance for related time-series modeling tasks. Nonetheless, several critical drawbacks remain. First, the model is highly sensitive to text quality; noisy or incomplete earnings call transcripts directly undermine prediction accuracy. Second, the model exhibits dataset sensitivity; while it demonstrates robust performance on the event-centric MAEC-15 dataset, its stability diminishes on the EC dataset, which is more susceptible to macroeconomic noise and weaker temporal dependencies. Third, the use of Transformer and multi-layer LSTM architectures results in relatively high computational complexity, limiting its practicality in real-time forecasting environments.
To overcome these limitations, we outline three key directions for future work. First, we will strengthen statistical robustness through more extensive repeated experiments and formal significance testing to better quantify and stabilize prediction reliability. Second, we will refine the fusion mechanism between event sequences and textual data, explicitly identify the linguistic features that drive predictive power, and reduce sensitivity to low-quality text inputs. Third, we will design a more adaptive time-series modeling module to improve cross-dataset generalization, boost long-term prediction accuracy across different forecasting horizons, and enhance computational efficiency. Beyond these core goals, future work may also explore multimodal fusion with additional data sources such as social media, optimize gating and decay parameters via reinforcement learning, and extend the model to emerging financial markets, including cryptocurrencies.
Author Contributions
D.G.; Methodology: J.Z.; Software: J.Z. and J.Q.; Validation: J.Z. and J.Q.; Formal Analysis: J.Z.; Investigation: J.Q.; Resources: D.G.; Data Curation: J.Q.; Writing—Original Draft Preparation: J.Z.; Writing—Review and Editing: D.G.; Visualization: J.Q.; Supervision: D.G.; Project Administration: D.G.; Funding Acquisition: None. All authors have read and agreed to the published version of the manuscript.
Funding
This research received no external funding.
Data Availability Statement
The data used to support the findings of this study are openly available or will be released upon publication. Specifically: 1. The EC Dataset (including 559 earnings call audio files and corresponding transcripts from 277 S&P 500 companies) is sourced from the publicly available dataset provided by Qin et al. [23], which can be accessed through the original research’s data repository. The historical stock price data (time series) corresponding to this dataset is obtained from Yahoo Finance, covering the period from 1 January 2017 to 31 December 2017, and is publicly retrievable via Yahoo Finance’s official data service. 2. The MAEC-15 dataset used in this study is based on the original multimodal aligned earnings conference call data released by Li et al., which is available through their published research channels. The source code and processed data associated with this study are not publicly available at this stage due to ongoing research activities and intellectual property considerations. All experiments were implemented using Python 3.8, PyTorch 1.9.0, and NumPy 1.21.1. 3. All datasets are split into training, validation, and test sets at a ratio of 7:1:2, with experimental configurations (e.g., time windows of 3, 7, and 30 days) detailed in the manuscript. No new raw data were generated in this study; 3. All datasets are split into training, validation, and test sets at a ratio of 7:1:2, with experimental configurations (e.g., time windows of 3, 7, and 30 days) detailed in the manuscript. There are no privacy or ethical restrictions on the use of the data. For further inquiries regarding data access, please contact the corresponding author.
Acknowledgments
The authors would like to express their gratitude to Qin et al. and Li et al. for making the Earnings Call datasets publicly available, which laid the foundation for this research. We also appreciate Yahoo Finance for providing accessible stock price data. Additionally, we thank the administrative and technical support team of our laboratory for their assistance in data processing and model training. Special thanks go to the academic peers for their valuable discussions and suggestions during the research process.
Conflicts of Interest
The authors declare no conflicts of interest. The funders had no role in the design of the study; in the collection, analyses, or interpretation of data; in the writing of the manuscript; or in the decision to publish the results.
Abbreviations
The following abbreviations are used in this manuscript:
| LSTM | Long Short-Term Memory |
| Hawkes LSTM | Hawkes Process and Long Short-Term Memory Network |
| EC | Earnings Call |
| MAEC | Multimodal Aligned Earnings Conference Call |
| MSE | Mean Squared Error |
| Transformer | Transformer Model |
| GRU | Gated Recurrent Unit |
| Auto-duration | Adaptive Temporal Span Modeling Mechanism |
References
- Yang, L.; Ng, T.L.J.; Smyth, B.; Dong, R. Html: Hierarchical transformer-based multi-task learning for volatility prediction. In Proceedings of the Web Conference 2020; Association for Computing Machinery: New York, NY, USA, 2020. [Google Scholar]
- Fang, Y.; Wang, W.; Wu, P.; Zhao, Y. A sentiment-enhanced hybrid model for crude oil price forecasting. Expert Syst. Appl. 2023, 215, 119329. [Google Scholar] [CrossRef] [Scilit]
- Ding, X.; Zhang, Y.; Liu, T.; Duan, J. Using structured events to predict stock price movement: An empirical investigation. In Proceedings of the 2014 Conference on Empirical Methods in Natural Language Processing (EMNLP); Association for Computational Linguistics: Stroudsburg, PA, USA, 2014; pp. 1415–1425. [Google Scholar]
- Feng, F.; Chen, H.; He, X.; Ding, J.; Sun, M.; Chua, T.-S. Enhancing stock movement prediction with adversarial training. In Proceedings of the Twenty-Eighth International Joint Conference on Artificial Intelligence, IJCAI-19; International Joint Conferences on Artificial Intelligence Organization: Marina Del Rey, CA, USA, 2019; pp. 5843–5849. [Google Scholar] [CrossRef] [Scilit]
- Nonejad, N. Forecasting aggregate stock market volatility using financial and macroeconomic predictors: Which models forecast best, when and why? J. Empir. Financ. 2017, 42, 131–154. [Google Scholar] [CrossRef] [Scilit]
- Sawhney, R.; Mathur, P.; Mangal, A.; Khanna, P.; Shah, R.R. Multimodal multi-task financial risk forecasting. In Proceedings of the 28th ACM International Conference on Multimedia, MM ’20; Association for Computing Machinery: New York, NY, USA, 2020; pp. 456–465. [Google Scholar] [CrossRef] [Scilit]
- Yang, L.; Li, J.; Dong, R.; Zhang, Y.; Smyth, B. Numhtml: Numeric-oriented hierarchical transformer model for multi-task financial forecasting. In Proceedings of the AAAI Conference on Artificial Intelligence; The Association for the Advancement of Artificial Intelligence: Washington, DC, USA, 2022; Volume 36, pp. 11604–11612. [Google Scholar]
- Sawhney, R.; Agarwal, S.; Wadhwa, A.; Shah, R. Deep attentive learning for stock movement prediction from social media text and company correlations. In Proceedings of the 2020 Conference on Empirical Methods in Natural Language Processing (EMNLP); Webber, B., Cohn, T., He, Y., Eds.; Association for Computational Linguistics: Online, 2020; pp. 8415–8426. [Google Scholar] [CrossRef] [Scilit]
- Liang, C.; Li, Y.; Ma, F.; Zhang, Y. Forecasting international equity market volatility: A new approach. J. Forecast. 2022, 41, 1433–1457. [Google Scholar] [CrossRef] [Scilit]
- Siami-Namini, S.; Tavakoli, N.; Namin, A.S. A comparative analysis of forecasting financial time series using arima, lstm, and bilstm. arXiv 2019, arXiv:1911.09512. [Google Scholar] [CrossRef] [Scilit]
- Haryono, A.; Sarno, R.; Sungkono, K. Stock price forecasting in indonesia stock exchange using deep learning: A comparative study. Int. J. Electr. Comput. Eng. 2024, 14, 861–869. [Google Scholar] [CrossRef] [Scilit]
- Liu, J.; Jia, M. Financial distress prediction with annual reports-based deep textual feature extraction: A hybrid approach. Inf. Sci. 2025, 686, 121318. [Google Scholar] [CrossRef] [Scilit]
- Koval, R.; Andrews, N.; Yan, X. Financial forecasting from textual and tabular time series. In Findings of the Association for Computational Linguistics: EMNLP 2024; Al-Onaizan, Y., Bansal, M., Chen, Y.N., Eds.; Association for Computational Linguistics: Miami, FL, USA, 2024; pp. 8289–8300. [Google Scholar] [CrossRef] [Scilit]
- Wong, S.Y.K.; Chan, J.; Azizi, L.; Xu, R.Y.D. Time-varying neural network for stock return prediction. arXiv 2021, arXiv:2003.02515. [Google Scholar] [CrossRef] [Scilit]
- Liu, Y.; Bu, N.; Li, Z.; Zhang, Y.; Zhao, Z. At-fingpt: Financial risk prediction via an audio-text large language model. Financ. Res. Lett. 2025, 77, 106967. [Google Scholar] [CrossRef] [Scilit]
- Chakraborty, A.; Basu, A. A hierarchical conv-lstm and llm integrated model for holistic stock forecasting. Int. J. Res. Appl. Sci. Eng. Technol. 2025, 13, 246–254. [Google Scholar] [CrossRef] [Scilit]
- Hochreiter, S.; Schmidhuber, J. Long short-term memory. Neural Comput. 1997, 9, 1735–1780. [Google Scholar] [CrossRef] [Scilit] [PubMed]
- Dioubi, F.; Hundera, N.W.; Xu, H.; Zhu, X. Enhancing stock market predictions via hybrid external trend and internal components analysis and long short term memory model. J. King Saud Univ.-Comput. Inf. Sci. 2024, 36, 102252. [Google Scholar] [CrossRef] [Scilit]
- Do, T.H.; Nguyen, D.M.; Bekoulis, G.; Munteanu, A.; Deligiannis, N. Graph convolutional neural networks with node transition probability-based message passing and dropnode regularization. Expert Syst. Appl. 2021, 174, 114711. [Google Scholar] [CrossRef] [Scilit]
- Sonani, M.S.; Badii, A.; Moin, A. Stock price prediction using a hybrid lstm-gnn model: Integrating time series and graph-based analysis. arXiv 2025, arXiv:2502.15813. [Google Scholar] [CrossRef] [Scilit]
- Loshchilov, I.; Hutter, F. Fixing weight decay regularization in adam. arXiv 2017, arXiv:1711.05101. [Google Scholar] [CrossRef] [Scilit]
- Epstein, L.G.; Ji, S. Ambiguous volatility and asset pricing in continuous time. Rev. Financ. Stud. 2013, 26, 1740–1786. [Google Scholar] [CrossRef] [Scilit]
- Qin, Y.; Yang, Y. What you say and how you say it matters: Predicting stock volatility using verbal and vocal cues. In Proceedings of the 57th Annual Meeting of the Association for Computational Linguistics; Korhonen, A., Traum, D., Márquez, L., Eds.; Association for Computational Linguistics: Florence, Italy, 2019; pp. 390–401. [Google Scholar]
- Li, J.; Yang, L.; Smyth, B.; Dong, R. Maec: A multimodal aligned earnings conference call dataset for financial risk prediction. In Proceedings of the 29th ACM International Conference on Information & Knowledge Management, CIKM ’20; Association for Computing Machinery: New York, NY, USA, 2020; pp. 3063–3070. [Google Scholar] [CrossRef] [Scilit]
- Kim, H.Y.; Won, C.H. Forecasting the volatility of stock price index: A hybrid model integrating lstm with multiple garch-type models. Expert Syst. Appl. 2018, 103, 25–37. [Google Scholar] [CrossRef] [Scilit]
- Hu, Y.; Chen, P.; Liu, T.; Gao, J.; Sun, Y.; Yin, B. Hierarchical attention transformer networks for long document classification. In 2021 International Joint Conference on Neural Networks (IJCNN); IEEE: New York, NY, USA, 2021; pp. 1–7. [Google Scholar] [CrossRef] [Scilit]
- Niu, H.; Xiong, Y.; Wang, X.; Yu, W.; Zhang, Y.; Yang, W. Kefvp: Knowledge-enhanced financial volatility prediction. In Findings of the Association for Computational Linguistics: EMNLP 2023; Association for Computational Linguistics: Singapore, 2023; pp. 11499–11513. [Google Scholar]
- Poria, S.; Cambria, E.; Hazarika, D.; Majumder, N.; Zadeh, A.; Morency, L.-P. Context-dependent sentiment analysis in user-generated videos. In Proceedings of the 55th Annual Meeting of the Association for Computational Linguistics (Volume 1: Long Papers); Association for Computational Linguistics: New York, NY, USA, 2017; pp. 873–883. [Google Scholar]
- Sebastian, J.; Pierucci, P. Fusion techniques for utterance-level emotion recognition combining speech and transcripts. In Proceedings of the Interspeech, Graz, Austria, 16 September 2019; pp. 51–55. [Google Scholar]

Disclaimer/Publisher’s Note: The statements, opinions and data contained in all publications are solely those of the individual author(s) and contributor(s) and not of MDPI and/or the editor(s). MDPI and/or the editor(s) disclaim responsibility for any injury to people or property resulting from any ideas, methods, instructions or products referred to in the content. |
© 2026 by the authors. Licensee MDPI, Basel, Switzerland. This article is an open access article distributed under the terms and conditions of the Creative Commons Attribution (CC BY) license.