


Abstract
This study explores the adsorption performance of clean peanut husk (CPH) as a sustainable and low-cost biosorbent for removing methylene blue (MB) from aqueous solutions. Batch experiments investigated the effects of dye concentration, biosorbent dosage, pH, particle size, and temperature. FT-IR analysis confirmed the involvement of hydroxyl, carbonyl, and aromatic groups, with spectral changes indicating both physical and chemical adsorption mechanisms. Adsorption capacity increased with initial dye concentration and decreased with larger particle size or excessive adsorbent dosage. The process was highly pH-sensitive, favoring adsorption under neutral to alkaline conditions, while temperature had minimal influence, a finding compatible with a physisorption-dominated contribution to the overall process. Kinetic data were best described by the pseudo-second-order model, and equilibrium behavior was best described by the Langmuir isotherm; however, these mathematical fits are interpreted here as indicative of, rather than definitive proof of, the specific molecular mechanism, and the overall adsorption process is best described as involving a combination of physisorption and chemisorption contributions. The separation factor (RL) values indicated favorable adsorption. Furthermore, an exploratory artificial neural network (ANN) analysis, based on a limited dataset of 39 experimental observations, achieved a high goodness-of-fit (R2 = 0.99) in describing the nonlinear relationships between each individual operational parameter and the adsorption capacity; given the small sample size and limited validation strategy employed, these results should be regarded as a preliminary demonstration of feasibility rather than evidence of robust predictive generalization. The findings support the potential of CPH as an efficient biosorbent for dye-contaminated wastewater.
1. Introduction
In early human history, people extracted natural dyes from plants, insects, and minerals. Plants such as madder root, turmeric, and indigo were widely used due to their rich colors and relatively stable dyeing effects. However, with the industrial revolution and the development of synthetic chemistry, synthetic dyes gradually replaced natural dyes and began to be widely used due to their advantages such as bright colors, good durability, stable production, and low cost [1]. This transition, while revolutionizing the dyeing industry, also introduced complex aromatic compounds into the environment that are chemically stable and resistant to biodegradation, thereby rendering conventional biological and physicochemical wastewater treatment systems largely ineffective against them. Synthetic dyes began to accumulate in effluents, contributing significantly to aquatic toxicity, carcinogenicity, and eutrophication, as well as impacting photosynthetic activity in aquatic flora and posing threats to public health and ecosystems alike [2].
The recognition of these adverse effects led to the development of various dye removal strategies over time, including chemical precipitation, membrane filtration, advanced oxidation processes, and adsorption. Among them, adsorption gained considerable attention owing to its operational simplicity, economic feasibility, and adaptability to diverse dye structures. Conventional adsorbents such as activated carbon were extensively used but suffered from limitations related to cost, regeneration challenges, and secondary pollution [3]. At the same time, with the increasing awareness of sustainable development, people have begun to pay attention to bio-based materials and agricultural residues as eco-friendly adsorbents. A key advancement in this regard was the valorization of lignocellulosic biomass, such as rice husks, coconut shells, and banana peels, which provided abundant surface functional groups for dye molecule interaction through electrostatic attraction, hydrogen bonding, and π–π interactions. These natural materials not only exhibited commendable adsorption capacities but also aligned with principles of circular economy and waste minimization [4]. Over time, studies demonstrated that such biosorbents could be engineered or chemically modified to further enhance their performance, bringing them closer to or even surpassing traditional synthetic adsorbents. The application of enzymatic and microbial systems also emerged as complementary approaches for dye decolorization and detoxification, utilizing oxidoreductive enzymes like laccases and peroxidases for the breakdown of complex dye structures into less toxic and more biodegradable intermediates [5]. Nevertheless, biosorption using untreated or minimally processed agro-wastes remained one of the most promising directions due to its cost-effectiveness, availability, and negligible environmental footprint. In this context, peanut husk, an abundant agricultural by-product, has recently garnered attention as a potent biosorbent due to their fibrous matrix rich in cellulose, hemicellulose, and lignin, which provides multiple active sites for dye uptake. Specifically, their potential in adsorbing methylene blue (MB), a cationic dye commonly found in textile effluents, has been the subject of intensive research, positioning them as an effective solution within the broader framework of sustainable wastewater treatment and bio-waste reutilization [6].
The application of kinetic and equilibrium models in adsorption research has long served as a cornerstone for understanding adsorption mechanisms and optimizing operational parameters in wastewater treatment processes. Among the kinetic models, the pseudo-first-order (PFO) and pseudo-second-order (PSO) equations have been foundational in describing the temporal progression of solute uptake. The PFO model, originally derived from Lagergren’s rate law, assumes that the rate of occupation of adsorption sites is proportional to the number of unoccupied sites, and is often applicable in the initial stages of adsorption when surface binding dominates. In contrast, the PSO model is based on the assumption that chemisorption governs the rate-controlling step through electron sharing or exchange between adsorbent and adsorbate, and has shown superior accuracy in systems where adsorption is influenced by chemical interaction. The Elovich model, originally proposed to describe activated chemisorption processes, has gained prominence for its ability to capture systems with heterogeneous surfaces and variable activation energies, making it particularly effective in modeling adsorption on biosorbents like peanut husk. These three models collectively provide a mathematical framework for describing the temporal adsorption profile and estimating kinetic constants that inform the scaling-up of adsorption technologies; the model providing the best statistical fit is commonly interpreted, by analogy with the literature, as being compatible with a particular rate-limiting step (physical or chemical), although such interpretations should ideally be corroborated by independent mechanistic evidence [7]. In parallel, adsorption equilibrium studies commonly rely on isotherm models to interpret the interaction between adsorbate molecules and the adsorbent surface at constant temperature. The Langmuir isotherm assumes a homogenous surface with monolayer adsorption and no interaction between adsorbed molecules, providing a clear estimate of maximum adsorption capacity. The Freundlich isotherm, on the other hand, accounts for surface heterogeneity and multilayer adsorption, making it more suitable for complex biosorbents with variable energy sites. The Temkin isotherm introduces the concept of adsorbate–adsorbent interactions and energy distribution, providing valuable insights in systems where adsorbent–adsorbate binding energy decreases linearly with coverage. These isotherms are indispensable in determining equilibrium constants, modeling adsorption capacities, and predicting system behavior under various concentration conditions [8].
In recent years, Artificial Neural Networks (ANN) have increasingly been explored as a data-driven, exploratory modeling approach in adsorption science, offering a complementary curve-fitting tool alongside traditional kinetic and isotherm models. Unlike traditional models that require predefined kinetic or isotherm assumptions, ANN is a data-driven approach capable of capturing complex, nonlinear relationships between individual input variables and the output response. By training the network with experimental data, ANN models can accurately simulate and optimize adsorption efficiency across a wide range of operational conditions including pH, temperature, dosage, particle size, and dye concentration. Their adaptability and high predictive precision make ANN an essential complement to classical adsorption modeling, especially in studies involving biosorbents and multifactorial parameter interactions [9]. The hybrid use of kinetic, isotherm, and ANN models thus enables a comprehensive, multi-level understanding of the adsorption process, contributing both mechanistic insights and optimization strategies in the design of sustainable adsorbent systems.
The present study aims to comprehensively investigate the adsorption behavior of methylene blue onto peanut husk under varying operational parameters, including initial dye concentration, biosorbent dosage, particle size, solution pH, and temperature. By examining these factors, the adsorption efficiency and mechanisms involved will be elucidated to assess the viability of peanut husk as a low-cost, eco-friendly biosorbent. Experimental design will evaluate how increasing dye concentration affects saturation kinetics, how variations in particle size alter surface area availability, and how dosage levels contribute to the total number of accessible binding sites. pH influences surface charge and dye ionization, while temperature modulates the thermodynamic feasibility of the process [10]. To gain further insight into the rate and mechanism of adsorption, kinetic modeling will be employed using pseudo-first-order and pseudo-second-order models, along with Elovich models, to determine the dominant transport mechanisms across different conditions [11]. The equilibrium behavior will be assessed via adsorption isotherm models such as Langmuir, Freundlich, and Temkin to evaluate which model best describes the experimental equilibrium data, providing indications compatible with monolayer versus multilayer adsorption tendencies and the energy distribution of active sites on the peanut husk surface [12]. Furthermore, this work incorporates ANN modeling as an exploratory computational approach to examine the nonlinear relationship between each operational parameter and dye removal efficiency, based on the limited univariate experimental dataset available in this study [9]. ANN models, constructed using multilayer perceptron architectures, allow dynamic mapping of input variables such as pH, dose, and temperature against output removal efficiency, facilitating the prediction and optimization of adsorption performance under complex conditions [13]. It should be noted that, as a data-driven predictive tool, the ANN model captures statistical relationships between input parameters and adsorption performance, rather than providing direct, independent evidence of the underlying molecular adsorption mechanism. The integration of experimental observations with kinetic, isotherm, thermodynamic, and ANN modeling not only enhances the robustness of analysis but also reflects an interdisciplinary strategy bridging traditional environmental engineering with modern machine learning techniques to better predict, validate, and optimize biosorption processes [14].
2. Materials and Methods
2.1. Preparation of Adsorbent
In this study, the peanut husks were obtained from traditional markets in Taiwan. Upon collection, the biomass was initially subjected to repeated washing with deionized water until the rinsate became visually transparent, thereby ensuring the removal of surface-bound debris and water-soluble impurities. To further enhance the purity of the material, an additional rinsing step was conducted using reverse osmosis (RO) water. The cleaned peanut husks were subsequently dried in a convection oven maintained at 358.15 ± 5 K (85 ± 5 °C) for a period of 12 h. Once completely dried, the material was mechanically milled and passed through a standard mesh sieve to achieve the target particle size distribution. The resulting clean peanut husk (CPH) adsorbent was preserved in airtight, high-density polyethylene containers to prevent moisture uptake and contamination prior to its use in adsorption experiments.
2.2. Preparation of Dye Solution
MB, a cationic dye with the anhydrous molecular formula C16H18ClN3S and a molecular weight of 319.85 g·mol−1, was employed in this study as a representative adsorbate. The reagent was of analytical/reagent-grade purity. A primary stock solution with a concentration of 1000 mg·L−1 was prepared by accurately dissolving a quantified mass of MB in deionized water. Subsequent working solutions of desired concentrations were obtained by performing systematic dilutions of the stock using deionized water.
2.3. Characterization
Fourier Transform Infrared (FT-IR) spectroscopy serves as a robust analytical technique for elucidating surface functional groups that play critical roles in the adsorption of dye molecules and heavy metal ions. In this study, the chemical functionalities present on the surface of the adsorbent, before and after MB adsorption, were analyzed using an FT-IR spectrometer (PerkinElmer Spectrum RX1, PerkinElmer Inc., Waltham, MA, USA) operated under ambient laboratory conditions. FTIR spectra were acquired in transmission mode using the KBr pellet technique: the dried CPH sample (before or after MB adsorption) was finely ground and homogeneously mixed with spectroscopic-grade KBr powder at a sample-to-KBr ratio of approximately 1:100 (w/w), and the mixture was compressed into a thin, transparent pellet prior to spectral acquisition. Spectra were acquired in the spectral range of 4000–400 cm−1 at a resolution of 4 cm−1, with 32 scans co-added per measurement. For the post-adsorption sample, MB-loaded CPH was separated from the residual solution by filtration and directly oven-dried at 358.15 ± 5 K/85 ± 5 °C for 12 h without an additional rinsing step prior to FTIR analysis. Consequently, the possibility that residual surface-adherent MB, rather than solely adsorption-induced structural changes, contributed to some of the observed spectral features cannot be entirely excluded; this is acknowledged as a limitation of the present characterization, and a rinsing step prior to FTIR analysis will be incorporated in future studies to more rigorously distinguish adsorption-related spectral changes from residual surface dye.
2.4. ANN Model Development
Given the relatively small dataset available in this study (39 experimentally obtained data points), the artificial neural network (ANN) analysis presented here was conducted as an exploratory, preliminary modeling exercise, intended to examine the feasibility of a data-driven approach for describing the effects of key operational parameters on the adsorption performance for dye removal from aqueous media, rather than to establish a robustly validated predictive model. Input variables for the model included initial dye concentration, solution pH, system temperature, particle size, sorbent dosage, and contact time, while the adsorption capacity at a given time point (qt) served as the output target. The ANN framework was implemented in the MATLAB (R2019b) computing environment, where model training, validation, and testing were systematically conducted. Experimental data were randomly divided into three subsets: 70% for training, 15% for validation, and the remaining 15% for testing purposes. For the initial model construction and performance assessment, a single hidden layer containing 10 neurons was adopted based on an iterative trial-and-error modeling procedure. During model development, the network architecture was adjusted iteratively and the resulting predictive performance was examined to obtain a stable and accurate representation of the experimental adsorption behavior. The 10-neuron architecture was subsequently used for the ANN analysis presented in this study. The dataset consisted of 39 experimentally obtained data points, which were divided into training (70%), validation (15%), and testing (15%) subsets. The validation and testing datasets were used to assess the predictive performance and generalization capability of the developed ANN model. Data normalization was performed using MATLAB’s mapminmax function. The hidden layer employed the tansig (hyperbolic tangent sigmoid) activation function, and the output layer employed a linear (purelin) activation function. Network training was performed using the Levenberg–Marquardt backpropagation algorithm (trainlm), with the number of hidden neurons determined through iterative trial-and-error evaluation of validation performance.
2.5. Batch Adsorption Studies
Batch adsorption experiments were systematically performed using centrifuge tubes containing 50 mL of MB solution and 0.1 g of the prepared CPH adsorbent. All adsorption studies were conducted under constant agitation at 125 rpm using an orbital shaker (YIH DER MODEL: LM-570R, YIH DER Technology Co., Ltd., New Taipei City, Taiwan). Unless otherwise specified, the pH of the solutions was maintained at the pH of the dye, approximately 6.0. To assess the influence of initial dye concentration on the adsorption capacity, MB solutions with concentrations ranging from 25 to 150 mg·L−1 were prepared and studied at a fixed temperature of 298.15 K. Each solution was contacted with 0.1 g of CPH in centrifuge tubes and agitated under the aforementioned conditions for a fixed contact time of 180 min, consistent with the equilibrium time established in the kinetic experiments, prior to determination of the adsorption capacity (qt). The effect of adsorbent dosage was evaluated by varying the amount of CPH used in each experiment: 0.1, 0.125, 0.15, 0.2, 0.3, and 0.5 g were tested against a fixed 50 mL MB solution (50 mg·L−1), with each mixture agitated for a fixed contact time of 180 min to determine the optimal mass-to-solution ratio for effective dye removal. Particle size distribution was investigated by employing CPH fractions with defined mesh ranges: >26 mesh, 26–40 mesh, 40–60 mesh, 60–80 mesh, 80–100 mesh, and <100 mesh. All six fractions were evaluated experimentally; however, as the two extreme fractions (>26 mesh and <100 mesh) represent open-ended size ranges without a defined upper or lower bound, they were excluded from the ANN input dataset (Section 3.2), as no single representative numerical particle-size value could be reliably assigned to these unbounded fractions. Each particle size fraction (0.1 g) was exposed to 50 mL of MB solution (50 mg·L−1) under identical shaking and pH conditions for a fixed contact time of 180 min to determine the influence of surface area and diffusion path length on adsorption performance. The effect of solution pH on dye removal efficiency was explored by adjusting the initial pH values from 2 to 12 using 0.1 N HCl or 0.1 N NaOH solutions. A fixed dose of 0.1 g CPH was added to 50 mL of 50 mg·L−1 MB solution at 298.15 K and mixed under constant agitation for a fixed contact time of 180 min to evaluate the pH dependency of the adsorption mechanism. To investigate thermal effects on the adsorption process, isothermal experiments were conducted at four different temperatures: 298.15, 308.15, 318.15, and 328.15 K. These studies utilized 0.1 g of CPH in 50 mL of 50 mg·L−1 MB solution agitated in a temperature-controlled shaker for a fixed contact time of 180 min to evaluate the temperature dependence of adsorption performance, with temperature serving as one of the input variables for the ANN model described in Section 2.4. For the kinetic experiments, aliquots were collected at predetermined contact times of 0, 5, 10, 15, 20, 25, 30, 40, 50, 60, 80, 100, 140, and 180 min. At each designated time point, an aliquot was withdrawn and immediately subjected to centrifugation and filtration to separate the CPH adsorbent from the aqueous phase. The filtrate was subsequently analyzed using a UV–Vis spectrophotometer (Hitachi U-1800, Tokyo, Japan) at 660 nm, corresponding to the maximum absorbance wavelength of methylene blue (MB). As the various experimental series in this study were conducted on different days, a fresh MB calibration curve was constructed on each measurement day using six freshly prepared standard solutions spanning a linear concentration range of 0–10 mg·L−1, each measured as a single instrumental reading, prior to sample analysis. Only calibration curves meeting an acceptance criterion of R2 ≥ 0.99 within this linear range were used for quantification of that day’s samples. All adsorption experiments in this study were performed as single measurements under fixed and well-controlled conditions, and a single representative dataset was adopted for subsequent isotherm and kinetic model fitting. As no replicate measurements were performed, the resulting experimental uncertainty (e.g., arising from weighing, dilution, pH adjustment, adsorbent heterogeneity, and instrumental response) could not be quantified, and no error bars, standard deviations, or confidence intervals are reported for the experimental data points presented in this study. This absence of replication constitutes a limitation of the present study: the kinetic and isotherm parameters reported in Section 3.9 and Section 3.10, and the ANN analysis described in Section 2.4, are each based on single-point observations per condition, and the extent to which measurement uncertainty may have influenced the fitted parameters and the ANN’s exploratory performance metrics cannot be determined from the present dataset. The amount of MB adsorbed at any given time (qt, mg.g−1) and at equilibrium (qe, mg.g−1) was calculated using standard adsorption equations, specifically Equations (1) and (2), as detailed in prior literature [15].
The adsorption equations employed in this study incorporate key physicochemical parameters to quantitatively characterize the dye removal process. Herein, Ci, Ct, and Ce refer to the concentrations of methylene blue (MB) at the initial stage, at a specific contact time t, and at equilibrium, respectively, all expressed in units of milligrams per liter (mg·L−1). The volume of the aqueous MB solution is denoted by V (L), while M (g) signifies the dry weight of the CPH adsorbent utilized in each experimental run.
2.6. Kinetics of Adsorption
To elucidate the relationship between adsorption rate and the underlying mechanisms governing methylene blue (MB) uptake by CPH, a comparative kinetic analysis was conducted using established adsorption models [16]. The experimentally determined values obtained at contact times of 0–180 min were used to construct the adsorption kinetic profiles and to fit the kinetic models. Kinetic modeling was performed based on the experimental data obtained from batch adsorption studies, wherein three widely recognized models were applied to interpret the adsorption behavior. Specifically, the kinetic profiles were evaluated using the pseudo-first-order model, the pseudo-second-order model, and the Elovich rate equation, each providing mechanistic insights into the interaction kinetics between MB molecules and the CPH surface.
2.6.1. Pseudo-First-Order Kinetic Model
The pseudo-first-order kinetic model is predicated on the assumption that the adsorption rate is directly proportional to the number of unoccupied active sites present on the adsorbent surface. In the present investigation, the corresponding rate constant was derived through the linear transformation of the pseudo-first-order kinetic equation, as formulated in previous literature [17].
In the framework of the pseudo-first-order kinetic model, the rate constant associated with the adsorption process is represented by K1 (min−1). The variables qt, qe, and t, corresponding to the amount of adsorbate adsorbed at time t, the equilibrium adsorption capacity, and the contact time, respectively, have been defined in earlier sections.
2.6.2. Pseudo-Second-Order Kinetic Model
The pseudo-second-order kinetic model posits that the overall adsorption rate is governed by a chemisorption mechanism, wherein electron exchange or sharing occurs between functional groups on the adsorbent surface and the adsorbate, such as methylene blue. This model suggests that as adsorption proceeds, the rate gradually declines in a non-linear fashion due to the progressive occupation of available binding sites. The linearized form of the pseudo-second-order expression, which enables the estimation of kinetic parameters, is provided in Equation (4) below [17].
Within the context of the pseudo-second-order kinetic framework, the adsorption rate constant is denoted as K2, and is expressed in units of g·mg−1·min−1. The terms qt, qe, and t, corresponding to the amount of solute adsorbed at time t, the equilibrium adsorption capacity, and contact time, respectively, have been defined earlier in this study.
2.6.3. Elovich Model
To evaluate the heterogeneity of the active adsorption sites and elucidate the adsorption mechanism of MB onto CPH, the Elovich kinetic model was employed. This model was specifically utilized to determine whether the adsorption process occurred irreversibly without substantial desorption and whether the extent of surface coverage increased concurrently with a progressive decline in adsorption rate. Additionally, the Elovich formalism served to examine the energetic distribution of non-uniform adsorption sites present on the CPH surface, thereby offering insights into site-specific interaction behavior [18]. The mathematical representation of the Elovich kinetic expression is provided below [19].
As previously described, qt corresponds to the quantity of methylene blue adsorbed at a given contact time t, whereas t represents the temporal variable itself. The parameter α, expressed in units of mg·g−1·min−1, represents the initial adsorption rate constant, reflecting the rate of MB uptake at the onset of the adsorption process. The parameter β, expressed in units of g·mg−1, signifies the desorption constant, which is related to the extent of surface coverage and the activation energy for chemisorption, and reflects the extent of surface interaction resistance during the adsorption process.
2.7. Adsorption Isotherms
2.7.1. Langmuir Isotherm
The Langmuir isotherm model is based on the assumption that adsorption occurs on a structurally uniform surface with identical and energetically equivalent active sites, where each site can accommodate only one adsorbate molecule. Furthermore, it postulates that the Gibbs free energy of adsorption remains constant across all binding sites. The adsorption capacity reaches its theoretical maximum when the entire adsorbent surface is occupied by a single, saturated monolayer of adsorbate [20]. The mathematical representation of the Langmuir isotherm is provided in Equation (6):
As outlined in the preceding discussion, Ce denotes the equilibrium concentration of methylene blue (MB) in the liquid phase, expressed in mg·L−1. The term qe corresponds to the equilibrium adsorption capacity, representing the quantity of MB adsorbed per unit mass of adsorbent at equilibrium, with units of mg·g−1. The parameter qmax defines the theoretical monolayer adsorption capacity achievable under equilibrium conditions, also reported in mg·g−1. The constant KL signifies the Langmuir equilibrium constant, which reflects the affinity of the adsorbent for the adsorbate, and is expressed in L·mg−1.
To gain additional insight into the feasibility and thermodynamic favorability of the adsorption process, a dimensionless parameter known as the separation factor (RL) was employed, as initially proposed by Webber and Chakravorti. This factor is calculated based on the initial concentration of the adsorbate in solution (Ci, mg·L−1) and the Langmuir equilibrium constant (KL), which has been previously defined. The value of RL provides critical information regarding the nature of adsorption, indicating whether the process is unfavorable, linear, favorable, or irreversible.
The value of the separation factor (RL) offers predictive insight into the adsorption characteristics and can be interpreted under four distinct conditions: (i) adsorption is considered favorable when 0 < RL < 1; (ii) an RL value greater than 1 suggests that the adsorption is unfavorable; (iii) when RL = 1, the adsorption behavior is classified as linear; and (iv) a value of RL = 0 indicates that the adsorption process is irreversible.
2.7.2. Freundlich Isotherm
The Freundlich isotherm is an empirical expression that describes adsorption on energetically heterogeneous surfaces, where multiple layers of adsorbate can form and adsorption sites possess varying levels of affinity. This model is particularly effective for capturing non-ideal and reversible adsorption behavior across a broad concentration range. The corresponding mathematical form of the Freundlich equation is provided in Equation (8).
As previously defined, qe denotes the equilibrium adsorption capacity, while Ce refers to the equilibrium concentration of the adsorbate in the solution phase. Within the Freundlich isotherm framework, two empirical constants KF and n are introduced. The constant KF, expressed in units of mg1−(1/n) L1/n g−1, represents the adsorption capacity of the adsorbent, whereas the exponent n provides insight into the adsorption intensity and surface heterogeneity of the system.
2.7.3. Temkin Isotherm
The Temkin isotherm model is particularly suitable for describing chemisorption processes driven by substantial electrostatic interactions between oppositely charged species. This model is often applied to systems involving the adsorption of dilute pollutants onto both homogeneous and heterogeneous surfaces. The general form of the Temkin equation, as presented in Equation (9), captures the influence of adsorption energy distribution and surface interactions [21].
The equation incorporates several thermodynamic and system specific parameters, including qe, Ce, BT, AT, R, and T. Here, qe and Ce refer to the equilibrium adsorption capacity and equilibrium adsorbate concentration, respectively, as defined earlier. The Temkin constant BT is related to the heat of adsorption and is expressed in joules per mole (J·mol−1), while AT represents the Temkin equilibrium binding constant, reported in liters per gram (L·g−1). The universal gas constant R is taken as 8.314 J·mol−1·K−1, and T denotes the absolute temperature in Kelvin.
3. Results and Discussion
3.1. Characterization
Notable spectral differences observed in the Fourier Transform Infrared (FTIR) spectra of CPH before and after methylene blue (MB) adsorption highlight the involvement of surface functional groups in the adsorption mechanism (Figure 1). The FTIR spectrum of CPH reveals a broad and intense absorption band around 3325 cm−1, attributed to the stretching vibrations of hydroxyl (–OH) and amine (–NH) groups, indicating the presence of abundant hydrogen-bonding interactions within cellulose, hemicellulose, and lignin matrices. The band near 2924 cm−1 corresponds to asymmetric C–H stretching vibrations, which are typically associated with the aliphatic chains of cellulose and lignin. An absorption band at 1735 cm−1 is characteristic of C=O stretching in carboxylic or ester groups commonly present in hemicellulose and pectin structures. A moderate-intensity band at 1634 cm−1 represents aromatic C=C stretching, and may also overlap with the bending vibration of water molecules adsorbed onto cellulose. The band observed at 1049 cm−1 is associated with C–O–C or C–OH stretching, signifying the presence of ether linkages within polysaccharides. These spectral features align with those reported in previous studies characterizing agricultural biomass materials, confirming the presence of diverse functional groups that contribute to the adsorption potential of CPH [22,23]. In Fourier Transform Infrared (FTIR) spectroscopy, the spectral region ranging from 400 to 1000 cm−1, commonly referred to as the fingerprint region, is critical for elucidating subtle changes in the molecular framework of biosorbents such as CPH before and after MB adsorption. In the unmodified CPH spectrum, a prominent band at approximately 895 cm−1 corresponds to β-glycosidic linkages, indicative of the cellulose backbone, thereby confirming its polysaccharide-rich structure. Additionally, absorption bands observed near 804 cm−1 and 757 cm−1 are attributable to out-of-plane bending vibrations of aromatic rings and C–H bending of benzene derivatives, respectively, which are characteristic of lignin moieties and mirror the spectral profiles reported for native lignocellulosic materials [23]. Minor absorption bands appearing around 681 cm−1 and 599 cm−1 may be associated with halogenated functional groups such as C–Cl or C–Br, or alternatively with C–O bending vibrations, potentially indicating the presence of trace non-typical functional groups or residual impurities in the biomass. After MB adsorption, notable spectral changes are evident. It should be noted that, as the MB-loaded CPH sample was not rinsed prior to FTIR analysis (Section 2.3) and a reference FTIR spectrum of pure MB was not obtained in this study, it is not possible to reliably distinguish among (i) bands originating from MB itself, (ii) changes in CPH bands resulting from genuine adsorption-related interactions, and (iii) simple spectral overlap caused by residual surface-adherent MB. Accordingly, the following spectral observations are reported descriptively, and the associated mechanistic interpretations should be regarded as tentative rather than confirmed. The broad –OH stretching band at 3325 cm−1 becomes narrower and decreases in intensity, suggesting partial disruption or involvement of hydrogen bonding during complex formation with MB molecules, potentially through interactions involving the tertiary dimethylamino (–N(CH3)2) groups and the thiazine-ring nitrogen and sulfur atoms present in the MB structure [24]. A red shift in the C=O stretching band from 1735 cm−1 to 1720 cm−1 indicates potential electrostatic interactions or electron density redistribution between carboxyl groups and the cationic dye. The enhanced intensity of the band at 1634 cm−1, originally attributed to aromatic C=C or water bending, may reflect π–π interactions between the aromatic rings of MB and the biosorbent. Alterations in the band position and intensity at 1049 cm−1 further support the hypothesis that ether or alcohol groups on the surface participate in the adsorption process. A new band emerging at 1431 cm−1, tentatively associated with C–N stretching vibrations, is observed following MB exposure; while this may be consistent with the presence of MB-related species on or within the adsorbent, it cannot be conclusively attributed to genuine adsorption versus residual surface MB in the absence of a pure-MB reference spectrum [25]. The β-glycosidic linkage signal at 895 cm−1 demonstrates a noticeable reduction in intensity and slight blue shift, implying conformational changes likely due to steric hindrance or altered electron density during dye interaction. Moreover, the enhanced intensities of the bands at 804 cm−1 and 757 cm−1 following MB adsorption may be associated with changes in the aromatic ring environment of the adsorbent, which is consistent with, but does not conclusively confirm, the involvement of π–π interactions between MB’s aromatic system and the lignin-based moieties. A new shoulder band is observed near 720 cm−1 following MB adsorption; in the absence of independent porosity characterization (e.g., BET, SEM), no conclusion regarding micropore-level insertion of MB molecules can be drawn from this observation alone. Minor shifts in the bands at 681 cm−1 and 599 cm−1 after MB adsorption may reflect changes in the local chemical environment of the corresponding functional groups; however, these spectral shifts alone do not provide definitive evidence of a specific interaction mechanism. Collectively, these spectral changes are consistent with the presence of MB on the CPH surface and with possible involvement of surface functional groups in the adsorption process; however, given the limitations discussed above (absence of a pure-MB reference spectrum and of a pre-FTIR rinsing step), these observations should be regarded as suggestive rather than conclusive evidence of specific interaction mechanisms such as hydrogen bonding, electrostatic interaction, or coordination [26]. The FTIR changes observed in this study align well with previous literature. For instance, Ali et al. reported that shifts in OH and C=O bands were critical indicators of MB adsorption onto rice husk, with electron rearrangement in carboxylic and aromatic groups significantly influencing adsorption capacity [27]. Similarly, Zhou et al. found that the appearance of a new C–N band and corresponding shifts in functional group positions after MB adsorption onto orange peel confirmed the generality of these interaction mechanisms [28]. Similarly, Crini and Badot reported the appearance of additional bands and morphological changes in the 600–900 cm−1 range, supporting a dual adsorption mechanism involving both chemisorption and electrostatic forces; alterations in aromatic ring-associated bands were highlighted as reliable indicators of resonance interactions [24]. Furthermore, Garg et al. linked spectral changes in the 800–1000 cm−1 region in lignocellulosic matrices to π–π stacking with dye molecules, supporting the use of fingerprint region band shifts and intensity modulations as an indicator of successful adsorption [24,26]. Accordingly, the observed modifications in the FTIR spectra of MB-loaded CPH are consistent with the involvement of surface functional groups during dye adsorption, although these spectral observations alone do not independently confirm the specific mechanisms (e.g., hydrogen bonding, π–π interactions, coordination) or definitively establish a combined physical–chemical adsorption mechanism.
Figure 1.
(a). FTIR spectrum of the CPH before adsorption of MB. (b). FTIR spectrum of the CPH after adsorption of MB.
3.2. Neural Network Performance
To evaluate the adsorption performance of the CPH adsorbent, an ANN was developed using a dataset comprising 39 experimentally obtained data points under controlled laboratory conditions. The network was designed with six independent input variables: contact time (ranging from 5 to 180 min), initial MB concentration (25, 50, 75, 100, 125, and 150 mg·L−1), solution temperature (298.15 K, 308.15 K, 318.15 K, and 328.15 K), pH levels (ranging from 2 to 12), adsorbent particle size, represented by the four bounded mesh fractions (26–40 mesh, 40–60 mesh, 60–80 mesh, and 80–100 mesh; the two open-ended extreme fractions, >26 mesh and <100 mesh, were excluded from the ANN dataset as no well-defined representative particle-size value could be assigned to these unbounded ranges), and adsorbent dosage (0.1 g, 0.125 g, 0.15 g, 0.2 g, 0.3 g, and 0.5 g). These variables were selected based on their relevance to adsorption behavior and were subsequently used as inputs in the ANN modeling framework. During ANN model development, the hidden-layer architecture was adjusted through an iterative trial-and-error procedure. Based on the resulting model performance and stability, a single hidden layer with 10 neurons was adopted for the subsequent analysis. The model was evaluated using training, validation, and testing datasets to assess its predictive capability and generalization performance, as illustrated in Figure 2. The ANN regression plots depicting the relationships between the predicted and experimental adsorption capacities for training, validation, testing, and the complete dataset are presented in Figure 3. The regression analysis reveals a strong correlation between the network-predicted values and the experimentally measured adsorption capacities of CPH across all dataset subsets. The coefficient of determination (R2) for the training, validation, and testing sets were 0.99, 0.98, and 0.99, respectively, and the R2 value for the entire dataset stood at 0.99. These results indicate a strong mathematical fit between the ANN-predicted and experimentally measured adsorption capacities under the specific conditions evaluated in this exploratory analysis; given the constraints discussed below, these R2 values should not be interpreted as evidence of robust predictive performance or validated generalization capability. However, given the limited dataset size (39 points, partitioned into approximately 27 training, 6 validation, and 6 testing observations) relative to the number of adjustable parameters in the 6–10–1 network architecture, and given that data partitioning was performed by random selection of individual points (which may place highly similar observations from the same experimental series into both training and testing subsets), these R2 values should be interpreted as a measure of goodness-of-fit rather than as definitive evidence of robust generalization performance. It should further be noted that the ANN-predicted curves presented in this study (Section 3.3, Section 3.4, Section 3.5, Section 3.6, Section 3.7 and Section 3.8) were generated using the final model trained on the complete dataset, and therefore illustrate only the model’s fit to data it was trained on, rather than predictive performance on independent, unseen data. Given the sample-size and data-partitioning limitations described above, even the training/validation/testing partition analysis should not be regarded as unambiguous, independent confirmation of predictive generalization; accordingly, none of the R2 -based results reported in this study should be interpreted as demonstrating validated predictive capability beyond the specific dataset. It should be noted that the relatively small dataset size (39 points) relative to the number of adjustable parameters in the 6–10–1 network architecture, together with the use of random (rather than stratified or series-aware) data partitioning, means that the risk of overfitting and of an overly optimistic performance estimate cannot be excluded. RMSE/MAE values for the training, validation, and testing subsets, the specific random seed used, and a systematic record of the number of architectures evaluated were not retained in the present modeling workflow. Cross-validation or repeated independent data partitioning, as well as a generalization assessment based on excluding complete experimental series (e.g., an entire concentration or temperature series) rather than individual randomly selected points, were not performed in this study. These are acknowledged as limitations of the current ANN evaluation and are recommended as directions for more rigorous validation in future work.
Figure 2.
Schematic diagram of the artificial neural network (ANN) architecture.
Figure 3.
The correlation coefficient results obtained from the analysis using the ANN algorithm. In each panel, the fitted regression equation is displayed in the default MATLAB plotregression format (“Output ~= slope*Target + intercept”), where “*” denotes multiplication.
3.3. Effect of Contact Time
The influence of contact time on the adsorption capacity of CPH for MB removal was thoroughly investigated using both experimental measurements and artificial neural network (ANN) simulation, as illustrated in Figure 4. The data clearly demonstrate a sharp initial rise in adsorption capacity within the early stages of contact (0–60 min), attributed to the abundance of available active sites on the CPH surface. As time progresses, the rate of adsorption gradually diminishes and approaches equilibrium around 120–150 min, indicating near-saturation of the binding sites and kinetic equilibrium between the MB ions in solution and those adsorbed onto the biosorbent. This biphasic behavior, characterized by a rapid initial uptake followed by a slower approach to equilibrium, is commonly observed in batch adsorption systems and is consistent with the kinetic profiles captured by the pseudo-first-order, pseudo-second-order, and Elovich models evaluated in this study (Section 3.9) [29]. The ANN-predicted values, generated from the final model trained on the complete dataset, closely align with experimental data across all time points, illustrating the model’s goodness-of-fit to the observed kinetic trend of MB uptake; as noted in Section 3.2, this agreement reflects fit to previously seen data and should not be interpreted as demonstrated predictive validation on independent data. This consistency is supported by previous studies showing that ANN frameworks are highly effective in modeling nonlinear adsorption processes, capturing both the initial rapid phase and the later equilibrium plateau with minimal error. In particular, the regression coefficients (R2 values) exceeding 0.99 for training, validation, and testing sets reflect a strong mathematical fit between predicted and experimental adsorption capacities; however, as discussed in Section 3.2, this should not be taken as a robust demonstration of the model’s forecasting reliability under conditions not represented in the dataset. Furthermore, the observed decrease in adsorption rate with increasing contact time is consistent with the gradual occupation of available surface binding sites, as reflected by the pseudo-second-order model’s superior fit to the experimental data (Section 3.9). As an explicit intraparticle diffusion analysis (e.g., Weber–Morris plot) was not performed in this study, this discussion is restricted to the kinetic behavior captured by the PFO, PSO, and Elovich models evaluated herein [30]. The ANN’s excellent agreement with experimental outcomes across both rapid and equilibrium phases suggests its potential as a surrogate modeling approach for optimizing batch adsorption operations. This application becomes particularly important in real-world scenarios where rapid estimation of operational conditions is required without extensive experimental iteration.
Figure 4.
Effect of contact time on the removal of MB by CPH.
3.4. Effect of Dye Concentration
The experimental results in Figure 5 demonstrate a biphasic response of MB adsorption capacity (qt) by ground CPH in relation to the initial MB concentration. In the concentration range of 25–125 mg·L−1, a rapid and nearly linear increase in qt is observed, indicating that CPH possesses a large number of available active sites for dye binding in this range. This stage corresponds to the initial unsaturated phase of adsorption, where the driving force for mass transfer is high and the available sites are readily accessible. The linearity of qt with increasing MB concentration supports the assumption of proportional loading during the early phase of adsorption, a behavior commonly reported in biomass-based adsorbents where pore diffusion and external mass transfer dominate [31]. Beyond 125 mg·L−1, however, the trend exhibits a notable deviation. Between 125 and 150 mg·L−1, the increase in qt is marginal, suggesting that the surface of the adsorbent nears saturation. This transition from an active adsorption phase to a plateau phase corroborates the monolayer coverage behavior described by the Langmuir adsorption model, in which the number of active sites becomes limiting as solute concentration increases [32]. This behavior has also been observed in similar systems using natural bioadsorbents, where the capacity to uptake MB plateaus once equilibrium is approached and no further marked adsorption enhancement is observed despite increases in dye concentration [33]. The ANN model predictions shown in Figure 5, obtained from the final model trained on the complete dataset, remain closely aligned with the experimental data across both phases; as clarified in Section 3.2, this reflects the model’s fit to the training data and does not, by itself, demonstrate predictive generalization. Particularly in the plateau region (125–150 mg·L−1), the ANN captures the minimal change in qt accurately, demonstrating its efficacy in modeling saturation kinetics. This confirms the ANN’s capacity to simulate not only rapid adsorption kinetics but also the equilibrium-limited phase. Mechanistically, the rapid increase in qt from 25 to 125 mg·L−1 can be attributed to the high chemical affinity between MB molecules and the functional groups on the CPH surface, such as hydroxyl and carboxyl groups inherent in cellulose and lignin fractions, which facilitate electrostatic interactions and π–π stacking [24]. In contrast, the limited increase from 125 to 150 mg·L−1 signifies that either steric hindrance or complete occupation of surface functional groups has occurred, restricting further dye uptake. A similar inflection point has been reported in MB adsorption using other agrowaste-derived adsorbents, indicating this is a general phenomenon for such systems [34]. Thus, the overall adsorption behavior of CPH toward MB under varying concentrations suggests a concentration-dependent mechanism with a clear adsorption saturation limit, which the ANN model was able to mathematically describe across the range of conditions evaluated in this study. This finding is essential for the practical application of CPH in wastewater treatment, particularly in optimizing dosage relative to pollutant load and designing system capacities to avoid operation in the ineffective plateau region.
Figure 5.
Effect of MB concentration on the removal of MB by CPH, measured at a fixed contact time of 180 min.
3.5. Effect of Temperature
The adsorption behavior of MB onto CPH, as illustrated in Figure 6, shows that increasing temperature from the tested range does not markedly enhance the adsorption capacity (qt). In contrast to many biosorbent systems where elevated temperatures improve dye uptake, the experimental data here indicate that qt remains nearly constant or slightly decreases with temperature rise. This trend is compatible with a temperature-independent adsorption process; however, as a formal thermodynamic analysis (ΔG°, ΔH°, ΔS°) was not performed in this study, this observation should not be interpreted as demonstrating an exothermic mechanism, and no such thermodynamic characterization is claimed. This behavior is compatible with a contribution from physical interactions, such as van der Waals forces or weak electrostatic attractions, which are typically less temperature-sensitive; however, this temperature-dependence trend alone cannot exclude a concurrent chemisorption contribution, as further discussed in Section 3.9 in relation to the kinetic modeling results. Temperature-dependent desorption effects have similarly been noted in other biosorbent systems, such as coirpith-derived activated carbon used for heavy metal ion adsorption [35], suggesting that adsorbent–adsorbate interaction stability under thermal stress may be a broadly relevant phenomenon across different adsorption systems, though direct comparison with the present MB–CPH system should be made with caution given the differing adsorbate and material characteristics. The plateau or slight decline in qt with temperature suggests that the adsorption process is not thermally driven and may involve physisorption rather than chemisorption, where no activation energy or enthalpic gain is required for effective binding. This trend contrasts with endothermic adsorption processes typically observed in biomass–dye systems but accords with reports on MB removal using untreated lignocellulosic wastes, where binding is primarily governed by surface functional groups rather than energy-enhanced diffusion [36]. Moreover, the observed decline at higher temperatures may be attributed to increased kinetic energy of MB molecules, which in turn leads to destabilization of previously adsorbed dye species and thus promotes desorption. Such thermally induced desorption behavior has been described in adsorption studies using rice-husk- and sawdust-based activated carbons for acid dye removal [37], suggesting that reduced adsorption capacity at elevated temperatures may reflect a broader phenomenon across lignocellulosic adsorbent systems, although the adsorbate systems differ from MB. The ANN model in Figure 6 closely predicts the experimental trend across all temperature conditions, accurately reflecting the minimal or negative correlation between temperature and adsorption capacity. This consistency illustrates the model’s ability to mathematically describe non-monotonic adsorption behavior within the dataset examined, a task at which traditional isotherm models often fail; this observation does not, however, constitute independent evidence of predictive robustness. The ANN’s flexibility to accommodate nonlinear, even weakly correlated parameters makes it a superior tool for modeling biosorption systems under various thermodynamic constraints. Prior research has highlighted the utility of neural networks in predicting adsorption under complex, weak-response systems where experimental behavior does not follow classic thermodynamic expectations [9]. These results collectively suggest that the CPH–MB system operates under a mechanism largely independent of thermal input, relying instead on surface-based interactions such as hydrogen bonding, π–π interactions, or electrostatic attraction between MB’s cationic groups and negatively charged moieties on CPH. As temperature increases, these interactions may weaken or become less favorable, thus explaining the marginal decrease in qt. Such observations have been corroborated in investigations involving other agricultural adsorbents such as maize stalk and banana peels, which show similar thermal trends due to the passive nature of their adsorption mechanisms [25]. Therefore, temperature regulation is not a critical factor in the design of MB removal systems using CPH, and ambient conditions may suffice for optimal adsorption efficiency, simplifying the operational requirements for industrial application.
Figure 6.
Effect of temperature on the removal of MB by CPH, measured at a fixed contact time of 180 min.
It should be noted that a formal thermodynamic analysis was not conducted in this study, as temperature was investigated primarily as an input variable for the ANN model (Section 2.4). References to adsorption favorability in this manuscript therefore pertain specifically to the Langmuir isotherm-derived separation factor (RL) and should not be interpreted as an independently confirmed thermodynamic conclusion. Future work incorporating a complete thermodynamic analysis is recommended to further characterize the exothermic/endothermic nature of the process.
3.6. Effect of pH
Based on the experimental and ANN-predicted data shown in Figure 7, the adsorption capacity (qt) of CPH for MB demonstrates a distinct pH-dependent behavior, exhibiting four different phases across the pH range of 2 to 12. In the acidic region from pH 2 to 4, qt rises sharply, indicating that increased pH in this interval greatly enhances the adsorption efficiency. This is likely due to the reduction in electrostatic repulsion between the positively charged MB molecules and the highly protonated CPH surface under low pH, which suppresses adsorption. As the pH increases to around 4, deprotonation of functional groups on the adsorbent surface is hypothesized to begin, which would be expected to facilitate attractive electrostatic interactions with the cationic MB species; this proposed mechanism is consistent with trends reported for other lignocellulosic biosorbents [38,39], although the surface charge of CPH was not directly measured in the present study. Between pH 4 and 6, qt continues to increase but at a slower rate, suggesting a transitional adsorption regime where surface functional groups such as carboxyl and phenolic moieties are gradually ionized, thereby moderately improving electrostatic interactions with MB. In this region, the dye adsorption mechanism appears to be a combination of electrostatic interaction and π–π stacking; pH-dependent modulation of surface charge density and active-site availability has similarly been reported in studies using coir-pith-derived activated carbon for anionic dye (Congo Red) removal [40], indicating that pH-dependent surface charge effects are a broadly relevant phenomenon across adsorbent–dye systems, notwithstanding differences in adsorbate charge type. The ANN model closely tracks the experimental data during this segment, accurately capturing the change in gradient and reflecting its capacity to mathematically describe nonlinearity in pH-dependent surface chemistry within the dataset evaluated. From pH 6 to 10, qt reaches a quasi-plateau, with only marginal increases despite continued pH elevation. This plateau phase implies that the majority of available binding sites have already been deprotonated and engaged in MB interaction, thus limiting further enhancement in qt. Additionally, at these near-neutral to mildly alkaline conditions, the CPH surface is hypothesized to remain predominantly deprotonated (negatively charged), which would be expected to sustain electrostatic attraction toward the MB cation; the plateau in qt observed in this pH range may therefore reflect saturation of the available binding sites rather than a reduction in electrostatic attraction, as no new favorable interaction mechanisms appear to be introduced. Similar stagnation in adsorption capacity with increasing pH has been reported in studies involving MB removal using modified agricultural by-products, indicating saturation of interaction potential under optimal pH conditions [33]. Interestingly, a renewed gradual increase in qt is observed from pH 10 to 12, suggesting the onset of secondary interactions or activation of additional basic functional groups on the adsorbent surface. At high pH, competition between hydroxide ions and dye cations may be expected; however, the slight qt increase observed here indicates that specific high-pH-active groups such as phenolates or possibly hydrogen bonding interactions may facilitate additional MB binding. Comparable late-phase qt increases have been recorded in MB adsorption by alkaline-treated biomass, where enhanced pore accessibility and additional reactive sites become relevant under strongly basic conditions [41]. The ANN model successfully describes this complex pH-dependent behavior, including the inflection points and saturation tendencies, illustrating its ability to capture nuanced patterns in the physicochemical interactions governing dye adsorption in variable pH environments, within the scope of the data examined.
Figure 7.
Effect of pH on the removal of MB by CPH, measured at a fixed contact time of 180 min.
3.7. Effect of Particle Size
Based on the experimental and ANN-simulated data presented in Figure 8, the adsorption capacity (qt) of CPH for MB is markedly influenced by the particle size of the adsorbent. The figure clearly shows that smaller particle sizes exhibit notably higher qt values, and as the particle size increases, the adsorption capacity decreases markedly. This trend can be attributed to the fact that smaller particles provide a larger specific surface area and shorter intraparticle diffusion paths, thereby offering more accessible active sites for MB molecules to bind. Such an inverse relationship between particle size and adsorption capacity has been widely reported in the literature on dye adsorption by lignocellulosic biosorbents, where surface area enhancement due to particle size reduction leads to improved adsorption efficiency [39]. In this study, as the particle size increases, the resistance to mass transfer also increases, thereby limiting the penetration of dye molecules into the inner adsorption sites of the adsorbent. Larger particles tend to have less external surface area relative to volume, resulting in a reduced number of exposed active sites. This limitation has been discussed in prior work on agricultural waste adsorbents such as rice husk and sawdust, where the diffusion resistance in larger particles was found to adversely affect both adsorption rate and capacity [33]. Moreover, the aggregation potential of larger particles can further hinder dye uptake by reducing the effective surface available for adsorption. The experimental trend observed here thus parallels theoretical models of mass transport in porous materials, where particle size directly affects both external film diffusion and internal pore diffusion [42]. The ANN model, trained on the complete dataset, closely follows the experimental data across the entire range of particle sizes, accurately capturing the nonlinear decline in adsorption capacity with increasing particle diameter; as discussed in Section 3.2, this reflects the model’s fit to the available data rather than demonstrated predictive reliability on unseen data. This high correlation between predicted and observed qt values illustrates the ANN’s ability to mathematically describe complex physical systems with multiple interacting parameters within the dataset examined, consistent with the exploratory scope of this analysis (Section 3.2). Additionally, smaller particles may expose more functional groups such as hydroxyl, carboxyl, and aromatic rings, which facilitate electrostatic and π–π interactions with cationic dye molecules like MB. Particle size reduction can also enhance the surface charge density and increase the accessibility of these active moieties, leading to improved sorption performance. These findings are in agreement with other studies on MB adsorption using fine biomass powders, where enhanced dye removal was associated with greater surface availability and increased contact area per unit mass [41]. Consequently, from both a mechanistic and modeling perspective, reducing the particle size of CPH is a practical and effective approach for maximizing dye removal from aqueous systems.
Figure 8.
Effect of particle size on the removal of MB by CPH, measured at a fixed contact time of 180 min.
3.8. Effect of Adsorbent Dosage
According to the experimental and ANN-simulated data presented in Figure 9, the adsorption capacity (qt) of CPH for MB exhibits a clear inverse relationship with the adsorbent dosage. As the adsorbent dosage increases, the adsorption capacity per unit mass (qt) decreases substantially. This behavior can be attributed to the phenomenon of unsaturation of adsorption sites, where at higher adsorbent dosages, the total surface area available increases, but the amount of dye molecules in the system remains constant, leading to a lower dye-to-site ratio and consequently lower qt. This dilution effect of active sites has been consistently reported in studies using various biomass-based adsorbents, where increasing dosage leads to decreased qt due to overlapping or aggregation of adsorption sites, which reduces the total number of effective binding sites available for dye interaction [39]. At low adsorbent dosages, there is a high concentration gradient between MB molecules and active sites, which drives the diffusion and facilitates efficient utilization of available surface functionalities, leading to higher qt values. However, as the amount of CPH increases, competition among active sites for the limited number of MB molecules results in underutilization, and thus a decline in qt. This finding is in agreement with prior reports on MB adsorption using materials such as banana peels and coconut coir, where increased adsorbent loading resulted in particle agglomeration and reduced accessible surface area, ultimately leading to diminished sorption capacity per unit weight [33]. Moreover, the external mass transfer resistance may also increase at higher dosages due to thickening of the boundary layer and limited solution mixing, further constraining dye access to interior sites [25]. The ANN model predictions, generated using the final model trained on the complete dataset, exhibit strong concordance with experimental values across the dosage range, accurately capturing the steep decline in qt and the asymptotic behavior at higher dosages; consistent with the clarification in Section 3.2, this concordance reflects goodness-of-fit to the training data rather than demonstrated predictive generalization. This confirms the ANN’s ability to simulate not only linear but also highly nonlinear system kinetics, particularly in cases where multiple interdependent variables, such as surface aggregation, site accessibility, and dye saturation effects, govern the system response. Mechanistically, the observed inverse trend can also be interpreted through the lens of reduced driving force for mass transfer at higher dosages, where equilibrium is reached faster but with lower individual site occupancy. Additionally, inter-particle diffusion becomes less efficient as adsorbent loading increases, due to particle–particle shielding and reduced mixing efficiency. This behavior is particularly critical in the design of adsorption systems for wastewater treatment, where optimal dosage must balance total removal efficiency with per-unit sorption performance to maintain both economic and functional feasibility. Similar outcomes have been documented in MB adsorption by other agrowaste adsorbents, where excessive dosage reduced qt without significantly improving total removal percentage, underscoring the necessity for precise dosage optimization [41].
Figure 9.
Effect of adsorbent dosage on the removal of MB by CPH, measured at a fixed contact time of 180 min.
3.9. Adsorption Kinetics
Based on the data shown in Figure 10 and Table 1, the adsorption of MB onto CPH at varying initial MB concentrations reveals both concentration-dependent uptake behavior and distinct kinetic model performance. The comparative modeling analysis in the figure evaluates three kinetic models: pseudo-first-order (PFO), pseudo-second-order (PSO), and Elovich. Among these, the PSO model provides the best mathematical fit (highest R2) across all concentrations, closely following the experimental data with minimal deviation. This result indicates that the experimental kinetic data were better described by the PSO equation than by the PFO or Elovich models; while this behavior is compatible with a chemisorption-related rate-controlling step involving electron sharing or exchange between MB molecules and active surface sites, the superior R2 alone does not, by itself, constitute direct proof of this specific molecular mechanism. The superior fit of the PSO model over the PFO model suggests that the experimental data are more consistent with a rate-limiting step involving chemical interaction rather than purely physical diffusion; however, this interpretation should be regarded as compatible with, rather than conclusively demonstrated by, the kinetic fitting result, consistent with the cautious interpretive approach adopted for similar biomass-based adsorbents such as sawdust, jute fiber, and rice husk [29]. Furthermore, PSO’s superior performance under different concentration levels demonstrates its flexibility in capturing the kinetics of systems with variable site saturation kinetics, a trait less evident in the PFO model, which tends to underestimate adsorption rates at higher dye concentrations [43]. The Elovich model provides a reasonable but slightly less accurate prediction of adsorption kinetics, particularly at higher MB concentrations. This model assumes heterogeneous surface energies and an exponential decrease in adsorption rate as coverage increases, which is partially applicable to the CPH surface composed of diverse functional groups. However, its prediction underestimates the initial adsorption rate compared to PSO, likely due to the model’s limitation in systems where surface saturation is quickly approached under high solute loading. Nonetheless, the Elovich model remains relevant in interpreting the involvement of activated surface sites during the initial adsorption phase. In contrast, the PFO model shows the poorest fit across all tested concentrations, with substantial deviations from the experimental time profiles, particularly in the initial phase where adsorption is rapid. This misalignment suggests that physisorption or surface diffusion is not the primary mechanism in the MB–CPH system. The inability of the PFO model to accurately describe qt values at high concentration further supports that the system follows a more complex kinetic mechanism, possibly involving multilayer adsorption or pore-filling processes, which are better captured by PSO and Elovich frameworks. Similar kinetic discrepancies have been reported in studies involving the adsorption of cationic dyes onto low-cost adsorbents, where pseudo-first-order assumptions fail under conditions of rapid initial uptake and nonlinear saturation behavior [41]. Therefore, the adsorption kinetics of MB onto CPH under varying concentrations are best described by the pseudo-second-order model, indicating the dominant role of chemisorption, supported by the Elovich model in systems where surface heterogeneity and activation energy barriers are relevant. These findings highlight the necessity of using multiple models for kinetic interpretation and reaffirm the importance of fitting experimental data to models that account for both sorption mechanisms and structural properties of the adsorbent surface. Such integrated modeling approaches have been widely advocated for in adsorption science to ensure accurate prediction and scale-up of dye removal systems using agrowaste biosorbents [44,45]. The kinetic parameters reported here were obtained from linearized forms of the PFO, PSO, and Elovich models. Linearization can introduce systematic bias relative to nonlinear regression estimates; therefore, the reported parameters and R2-based comparisons should be interpreted cautiously. It should be noted that goodness-of-fit metrics beyond R2 (e.g., RMSE, SSE) were not calculated for the kinetic models in this study; accordingly, the relative ranking of the PFO, PSO, and Elovich models based on R2 alone should not be regarded as a definitive or statistically confirmed determination of the best-fitting model.
Figure 10.
Comparison between the measured and modeled time profiles and comparison of kinetic models in predicting qt for the adsorption of MB onto CPH at different initial MB concentrations.
Table 1.
Kinetic parameters for the effects of initial dye concentration on adsorption of MB onto CPH.
3.10. Adsorption Isotherms
Figure 11 presents the experimental adsorption data of MB onto CPH under varying initial dye concentrations and compares the fitting performance of three commonly applied isotherm models: Langmuir, Freundlich, and Temkin. Among the tested models, the experimental equilibrium data were better described by the Langmuir model across the full range of concentrations than by the Freundlich or Temkin models under the evaluated conditions. While this result is compatible with a monolayer adsorption assumption, it should be noted that the Langmuir model’s assumption of energetically equivalent surface sites is a mathematical idealization; given that the FTIR analysis (Section 3.1) identifies multiple distinct functional groups on the CPH surface, and that the Elovich kinetic model (Section 3.9) is used to describe surface heterogeneity, some degree of energetic heterogeneity on the actual CPH surface cannot be excluded, and the superior Langmuir fit should not be interpreted as direct proof of a homogeneous, energetically equivalent surface. The higher R2 value obtained for the Langmuir model indicates that the experimental equilibrium data are better described by this model than by the Freundlich or Temkin models under the evaluated conditions; superior Langmuir fitting performance has similarly been reported in studies of chromium adsorption onto treated sawdust [46], suggesting that this modeling behavior is not unique to MB-specific biosorbent systems, although direct comparison should be made with caution given the differing adsorbate (chromium vs. MB) and experimental conditions. This result should be interpreted as reflecting the best empirical fit among the models tested in the present study, rather than as direct confirmation of a strictly uniform surface binding mechanism. In contrast, the Freundlich isotherm, which accounts for heterogeneous surface energies and multilayer adsorption, showed moderate agreement with the data, particularly at lower dye concentrations, indicating the potential presence of a limited number of heterogeneous active sites; however, the deviation at higher concentrations suggests saturation effects incompatible with the model’s assumptions. The Temkin isotherm, which considers the influence of adsorbate–adsorbent interactions and assumes a linear decrease in adsorption heat with coverage, showed the least agreement among the three, indicating that temperature-independent adsorption energy variations might not substantially govern the process in this system. The better mathematical fit of the Langmuir model is compatible with monolayer adsorption onto a finite number of active sites on the CPH surface; while comparable equilibrium behavior has been associated with chemisorption in studies of Congo Red adsorption using bagasse fly ash and activated carbon [47], the isotherm fit alone does not independently confirm the molecular nature (physisorption vs. chemisorption) of the adsorption mechanism in the present MB–CPH system. Figure 12 illustrates the separation factor (RL), derived from the Langmuir constant, plotted against different initial MB concentrations, serving as an important criterion for evaluating the favorability of the adsorption process. The RL values across the tested concentration range were consistently within the range of 0 < RL < 1, signifying that the adsorption of MB onto CPH is favorable within the framework of the Langmuir model under all experimental conditions; this parameter is discussed solely within the context of the Langmuir isotherm and does not serve as a substitute for formal thermodynamic parameters (ΔG°, ΔH°, ΔS°). The downward trend of RL values with increasing MB concentration suggests that the adsorption becomes more efficient at higher concentrations, a behavior that is typically associated with strong adsorbent–adsorbate interactions and high affinity of active sites toward the dye molecules. This trend is in accordance with earlier findings using biosorbents such as banana peels and sugarcane bagasse, where decreasing RL values indicated progressive saturation of adsorption sites and increased binding efficiency [29]. The results from both the isotherm fitting (Figure 11) and RL analysis (Figure 12) support the applicability of the Langmuir model in describing the equilibrium adsorption behavior of MB onto CPH, within the specific context of this modeling framework. The equilibrium adsorption behavior of MB onto CPH was assessed using the Langmuir, Freundlich, and Temkin isotherm models, and the corresponding fitting parameters are summarized in Table 2. A clear difference in the goodness of fit was observed among the three models, with the Langmuir model exhibiting the highest correlation coefficient (R2 = 0.98), followed by the Temkin (R2 = 0.96) and Freundlich (R2 = 0.92) models. The superior Langmuir fit indicates that, among the models tested, the equilibrium adsorption profile of MB on CPH was best described by adsorption onto a finite population of available surface sites, with the formation of an adsorbed layer approaching monolayer coverage under the evaluated conditions. The estimated Langmuir maximum adsorption capacity was 33.33 mg·g−1, and the Langmuir affinity constant (KL) was 0.10 L·mg−1, both obtained via linearized regression of the equilibrium data. It should be noted that linearization of isotherm equations can introduce systematic bias into the estimated qmax and KL values relative to nonlinear regression, even when the resulting R2 values are high; the reported qmax, KL, and corresponding Freundlich and Temkin parameters should therefore be interpreted with this methodological consideration in mind. It should similarly be noted that goodness-of-fit metrics beyond R2 (e.g., RMSE, SSE) were not calculated for the isotherm models in this study; accordingly, the relative ranking of the Langmuir, Freundlich, and Temkin models based on R2 alone should not be regarded as a definitive or statistically confirmed determination of the best-fitting model.
Figure 11.
Experimental points and comparison of the fitted curves from various adsorption isotherms for the adsorption of MB onto CPH.
Figure 12.
Plot of separation factor versus initial methylene blue concentration.
Table 2.
Isotherm parameters for MB adsorption onto CPH.
As summarized in Table 3, the MB adsorption capacity of CPH prepared in this study compares favorably with previously reported adsorbents [48,49], demonstrating performance equal to or exceeding that of several low-cost biosorbents and activated carbon-based materials previously employed for methylene blue removal from aqueous solutions.
Table 3.
Comparison of adsorption capacities of various adsorbents for methylene blue.
4. Conclusions
This study comprehensively and thoroughly investigated the adsorption behavior of MB onto CPH, integrating experimental data with various modeling tools, successfully elucidating the potential of CPH as an efficient and environmentally friendly biosorbent.
1. Involvement of Functional Groups and Adsorption Mechanism: Fourier Transform Infrared (FTIR) analysis clearly revealed the involvement of abundant hydroxyl (–OH), carboxyl (C=O), ester groups, and aromatic rings on the CPH surface. Notable changes in spectra before and after adsorption, such as the broad –OH stretching band at 3325 cm−1 becoming narrower and decreasing in intensity, the C=O stretching band red-shifting from 1735 cm−1 to 1720 cm−1, the 1634 cm−1 band intensity increasing, and changes in the 1049 cm−1 band position and intensity, all supported the participation of surface functional groups. Crucially, a new band appeared at 1431 cm−1, attributed to C–N stretching vibrations from MB’s amine groups, confirming successful dye binding onto the adsorbent’s surface functional groups. Furthermore, notable enhancements in band intensities at 804 cm−1 and 757 cm−1 suggested π–π interactions or resonance effects between MB’s aromatic systems and the adsorbent’s lignin-based moieties. These spectral changes are consistent with the presence of MB on the CPH surface; however, in the absence of a pure-MB reference spectrum and given that the sample was not rinsed prior to FTIR analysis, the specific involvement of hydrogen bonding, electrostatic interactions, or π–π stacking could not be conclusively distinguished from residual surface MB, and these mechanistic interpretations should therefore be regarded as tentative. These FTIR observations align well with findings in previous literature concerning MB adsorption on various biomass materials.
2. Adsorption Kinetics and Rate-Controlling Step: Batch experimental results showed that the MB adsorption process rapidly occurred in the initial stage (0–60 min), then gradually slowed, reaching adsorption equilibrium in approximately 120–150 min. The kinetic data fitting results indicated that the pseudo-second-order kinetic model provided the best mathematical description of the overall adsorption process among the models tested, based on the coefficient of determination (R2). This result is compatible with, though does not independently prove, a chemisorption-related rate-controlling step involving electron sharing or exchange between MB molecules and active sites on the CPH surface; a more definitive mechanistic assignment would require additional statistical model comparison (e.g., RMSE) and complementary characterization evidence. In contrast, the pseudo-first-order kinetic model showed the poorest fit, suggesting that physisorption or surface diffusion is not the primary mechanism in the MB–CPH system. The Elovich model, while providing a reasonable fit, indicated the involvement of activated surface sites and heterogeneous diffusion resistance, particularly in the initial adsorption phase.
3. Adsorption Equilibrium and Site Properties: Adsorption isotherm studies demonstrated that the Langmuir model provided the best fit for the experimental data, with the highest coefficient of determination. This supports the hypothesis of monolayer adsorption of MB on the CPH surface, assuming uniform and energetically equivalent adsorption sites. Furthermore, the calculated separation factor (RL) values consistently remained between 0 and 1 across the tested concentration range, indicating that the MB adsorption process on CPH is favorable within the Langmuir framework under the experimental conditions tested; this parameter does not represent a formal thermodynamic assessment of the process. The decreasing trend of RL values with increasing MB concentration suggests that the adsorption becomes more efficient at higher concentrations, indicative of strong adsorbent–adsorbate interactions.
4. Effect of Operational Parameters:
Contact Time: Adsorption capacity increased with contact time until saturation was reached.
Initial Dye Concentration: Adsorption capacity increased with increasing initial dye concentration (25–125 mg·L−1) but reached saturation at higher concentrations (125–150 mg·L−1), indicating the finite nature of active sites.
pH Value: Adsorption capacity exhibited a distinct pH dependency. It sharply increased from pH 2 to 4, then slowed from pH 4 to 6, reaching a quasi-plateau from pH 6 to 10. A renewed gradual increase was observed from pH 10 to 12, attributed to the deprotonation of adsorbent surface functional groups and the activation of new basic sites.
Particle Size: Smaller CPH particle sizes markedly enhanced adsorption capacity, primarily due to a larger specific surface area and shorter internal diffusion paths, providing more accessible active sites.
Adsorbent Dosage: The adsorption capacity per unit mass (qt) exhibited an inverse relationship with adsorbent dosage, primarily due to the unsaturation of adsorption sites and potential particle aggregation at higher dosages, leading to reduced utilization of active sites.
Temperature: Temperature had a minimal impact on MB adsorption capacity, even showing a slight decrease. This suggests that the adsorption process is not strongly thermally driven and may involve physical adsorption interactions that are less sensitive to temperature changes.
5. Exploratory ANN Analysis: The exploratory ANN analysis achieved a high goodness-of-fit (R2 = 0.99) in describing MB adsorption behavior within the limited 39-point dataset examined. Given the small sample size relative to the number of adjustable network parameters, the random point-wise data partitioning, and the absence of RMSE/MAE reporting, cross-validation, or series-aware validation, these results should be regarded as a preliminary, exploratory demonstration of the ANN’s curve-fitting capability rather than evidence of a robustly validated, generalizable predictive tool. A more rigorous validation strategy, incorporating the elements requested by peer review, is identified as a necessary direction for future development of this modeling approach.
Taken together, the temperature-dependence data, kinetic modeling (PSO fit), isotherm modeling (Langmuir fit), and FTIR spectral changes each provide evidence that is individually compatible with either physisorption or chemisorption contributions, but none of these lines of evidence, considered in isolation, definitively demonstrates a single dominant molecular mechanism. The overall weight of evidence is most consistent with a mixed physisorption–chemisorption mechanism, in which weak physical interactions (e.g., van der Waals forces, hydrogen bonding) and stronger chemical interactions (e.g., electron sharing at specific functional-group sites) may operate concurrently or sequentially during MB adsorption onto CPH. Future work incorporating complementary statistical model comparisons (e.g., RMSE, chi-square), additional independent surface characterization (e.g., BET surface area analysis, SEM imaging, XPS, zeta potential), a complete thermodynamic analysis (ΔG°, ΔH°, ΔS°), and a systematic evaluation of salinity/ionic-strength effects on adsorption performance is recommended to more definitively resolve the relative contributions of the proposed adsorption mechanisms and to further strengthen the practical applicability of this biosorbent system.
In conclusion, the findings of this study indicate that treated CPH is a promising, low-cost, and environmentally friendly biosorbent candidate, exhibiting adsorption behavior compatible with a combined physisorption–chemisorption mechanism under the specific laboratory conditions tested. These findings are limited to the experimental conditions examined and should be interpreted in light of the absence of experimental replication and independent model validation in the present study; further work incorporating replicate measurements, nonlinear regression, and additional characterization is needed to more definitively establish the mechanism and generalizability of MB removal by CPH. By integrating experimental analysis with advanced mathematical models (including kinetic, isotherm, and ANN), this research provides comprehensive insights and strategies for the design, validation, and optimization of sustainable biosorption systems, holding great significance for promoting the valorization of agricultural waste and the development of green technologies.
Author Contributions
Conceptualization, M.-C.S.; methodology, M.-C.S.; software, Y.-T.H.; validation, M.-C.S.; formal analysis, Y.-T.H.; investigation, Y.-T.H.; resources, M.-C.S.; data curation, Y.-T.H.; writing—original draft preparation, Y.-T.H.; writing—review and editing, M.-C.S.; visualization, Y.-T.H.; supervision, M.-C.S.; project administration, M.-C.S.; funding acquisition, M.-C.S. All authors have read and agreed to the published version of the manuscript.
Funding
This research received no external funding.
Data Availability Statement
The original contributions presented in this study are included in the article. Further inquiries can be directed to the corresponding author.
Acknowledgments
The authors would like to acknowledge the Bioprocess Engineering and Fermentation Laboratory personnel in Department of Medical Science and Biotechnology, I-Shou University for their assistance during experiment operation.
Conflicts of Interest
The authors declare no conflict of interest.
References
- Sutlović, A.; Ferenčak, V.; Đukanović, J.; Đukanović, S. Revitalisation of natural dyes: Red shades of textiles dyed with Rubia tinctorum under different process parameters. In Proceedings of the 7th International Scientific Conference Contemporary Trends and Innovations in Textile Industry–CT&ITI 2024, Belgrade, Serbia, 19–20 September 2024; pp. 14–23. [Google Scholar]
- Forgacs, E.; Cserháti, T.; Oros, G. Removal of synthetic dyes from wastewaters: A review. Environ. Int. 2004, 30, 953–971. [Google Scholar] [CrossRef] [Scilit]
- Kyzas, G.Z.; Fu, J.; Matis, K.A. The change from past to future for adsorbent materials in treatment of dyeing wastewaters. Materials 2013, 6, 5131–5158. [Google Scholar] [CrossRef] [Scilit]
- Karić, N.; Maia, A.S.; Teodorović, A.; Atanasova, N.; Langergraber, G.; Crini, G.; Ribeiro, A.R.; Đolić, M. Bio-waste valorisation: Agricultural wastes as biosorbents for removal of (in) organic pollutants in wastewater treatment. Chem. Eng. J. Adv. 2022, 9, 100239. [Google Scholar] [CrossRef] [Scilit]
- Ardila-Leal, L.D.; Poutou-Piñales, R.A.; Pedroza-Rodríguez, A.M.; Quevedo-Hidalgo, B.E. A brief history of colour, the environmental impact of synthetic dyes and removal by using laccases. Molecules 2021, 26, 3813. [Google Scholar] [CrossRef] [Scilit]
- Hamad, H.N.; Idrus, S. Recent developments in the application of bio-waste-derived adsorbents for the removal of methylene blue from wastewater: A review. Polymers 2022, 14, 783. [Google Scholar] [CrossRef] [Scilit]
- Panaligan, T.R.L.; Aquino, J.R.; Almario, A.; Francia, J.D.; Mendoza, I.A. A Comparative Analysis of Zn2+ Adsorption from Simulated Mining Wastewater Using Unmodified and NaClO-Modified Sugarcane Bagasse-Derived Biochar. Key Eng. Mater. 2025, 1017, 83–88. [Google Scholar] [CrossRef] [Scilit]
- Aryee, A.A.; Gao, C.; Han, R.; Qu, L. Functionalized magnetic biocomposite based on peanut husk for the efficient sequestration of basic dyes in single and binary systems: Adsorption mechanism and antibacterial study. J. Environ. Chem. Eng. 2022, 10, 108205. [Google Scholar] [CrossRef] [Scilit]
- Yildiz, S. Artificial neural network approach for modeling of Ni (II) adsorption from aqueous solution by peanut shell. Ecol. Chem. Eng. 2018, 25, 581–604. [Google Scholar] [CrossRef] [Scilit]
- Benjelloun, M.; Miyah, Y.; Bouslamti, R.; Nahali, L.; Mejbar, F.; Lairini, S. The fast-efficient adsorption process of the toxic dye onto shells powders of walnut and peanut: Experiments, equilibrium, thermodynamic, and regeneration studies. Chem. Afr. 2022, 5, 375–393. [Google Scholar] [CrossRef] [Scilit]
- Taşar, Ş.; Özer, A. A Thermodynamic and Kinetic Evaluation of the Adsorption of Pb(II) Ions Using Peanut (Arachis Hypogaea) Shell-Based Biochar from Aqueous Media. Pol. J. Environ. Stud. 2020, 29, 293–305. [Google Scholar] [CrossRef] [Scilit]
- Reghioua, A.; Atia, D.; Hamidi, A.; Jawad, A.H.; Abdulhameed, A.S.; Mbuvi, H.M. Production of eco-friendly adsorbent of kaolin clay and cellulose extracted from peanut shells for removal of methylene blue and congo red removal dyes. Int. J. Biol. Macromol. 2024, 263, 130304. [Google Scholar] [CrossRef] [Scilit]
- Albalasmeh, A.; Gharaibeh, M.A.; Mohawesh, O.; Alajlouni, M.; Quzaih, M.; Masad, M.; El Hanandeh, A. Characterization and Artificial Neural Networks Modelling of methylene blue adsorption of biochar derived from agricultural residues: Effect of biomass type, pyrolysis temperature, particle size. J. Saudi Chem. Soc. 2020, 24, 811–823. [Google Scholar] [CrossRef] [Scilit]
- Banerjee, M.; Bar, N.; Basu, R.K.; Das, S.K. Comparative study of adsorptive removal of Cr(VI) ion from aqueous solution in fixed bed column by peanut shell and almond shell using empirical models and ANN. Environ. Sci. Pollut. Res. 2017, 24, 10604–10620. [Google Scholar] [CrossRef] [Scilit]
- Shih, M.-C. Kinetics of the batch adsorption of methylene blue from aqueous solutions onto rice husk: Effect of acid-modified process and dye concentration. Desalin. Water Treat. 2012, 37, 200–214. [Google Scholar] [CrossRef]
- Lestari, D.Y.; Laksono, E.W. Kinetics and thermodynamics studies of copper (II) adsorption onto activated carbon prepared from salacca zalacca peel. Molekul 2020, 15, 63–72. [Google Scholar] [CrossRef] [Scilit]
- Olasehinde, E.F.; Abegunde, S.M.; Adebayo, M.A. Adsorption isotherms, kinetics and thermodynamic studies of methylene blue dye removal using Raphia taedigera seed activated carbon. Casp. J. Environ. Sci. 2020, 18, 329–344. [Google Scholar] [CrossRef] [Scilit]
- Alkan, M.; Doğan, M.; Turhan, Y.; Demirbaş, Ö.; Turan, P. Adsorption kinetics and mechanism of maxilon blue 5G dye on sepiolite from aqueous solutions. Chem. Eng. J. 2008, 139, 213–223. [Google Scholar] [CrossRef] [Scilit]
- Cheung, C.; Porter, J.; Mckay, G. Sorption kinetic analysis for the removal of cadmium ions from effluents using bone char. Water Res. 2001, 35, 605–612. [Google Scholar] [CrossRef] [Scilit]
- Üner, O.; Geçgel, Ü.; Bayrak, Y. Adsorption of methylene blue by an efficient activated carbon prepared from Citrullus lanatus rind: Kinetic, isotherm, thermodynamic, and mechanism analysis. Water Air Soil Pollut. 2016, 227, 247. [Google Scholar] [CrossRef] [Scilit]
- Sarrai, A.E.; Belaissa, Y.; Kirdi, R.; Hanini, S.; Szabo, T.; Nagy, L. Modeling and optimization of Tylosin adsorption using dehydrated wheat bran: Adsorption behaviors, kinetic and thermodynamic studies. React. Kinet. Mech. Catal. 2022, 135, 1905–1928. [Google Scholar] [CrossRef] [Scilit]
- Javier-Astete, R.; Jimenez-Davalos, J.; Zolla, G. Determination of hemicellulose, cellulose, holocellulose and lignin content using FTIR in Calycophyllum spruceanum (Benth.) K. Schum. and Guazuma crinita Lam. PLoS ONE 2021, 16, e0256559. [Google Scholar] [CrossRef] [Scilit]
- Demirbas, A. Agricultural based activated carbons for the removal of dyes from aqueous solutions: A review. J. Hazard. Mater. 2009, 167, 1–9. [Google Scholar] [CrossRef] [Scilit]
- Crini, G.; Badot, P.-M. Application of chitosan, a natural aminopolysaccharide, for dye removal from aqueous solutions by adsorption processes using batch studies: A review of recent literature. Prog. Polym. Sci. 2008, 33, 399–447. [Google Scholar] [CrossRef] [Scilit]
- Annadurai, G.; Juang, R.-S.; Lee, D.-J. Use of cellulose-based wastes for adsorption of dyes from aqueous solutions. J. Hazard. Mater. 2002, 92, 263–274. [Google Scholar] [CrossRef] [Scilit]
- Garg, V.K.; Amita, M.; Kumar, R.; Gupta, R. Basic dye (methylene blue) removal from simulated wastewater by adsorption using Indian Rosewood sawdust: A timber industry waste. Dyes Pigment. 2004, 63, 243–250. [Google Scholar] [CrossRef] [Scilit]
- Ali, I.; Asim, M.; Khan, T.A. Low cost adsorbents for the removal of organic pollutants from wastewater. J. Environ. Manag. 2012, 113, 170–183. [Google Scholar] [CrossRef] [Scilit]
- Zhou, Y.; Lu, J.; Zhou, Y.; Liu, Y. Recent advances for dyes removal using novel adsorbents: A review. Environ. Pollut. 2019, 252, 352–365. [Google Scholar] [CrossRef] [Scilit]
- Ho, Y.-S.; McKay, G. Pseudo-second order model for sorption processes. Process Biochem. 1999, 34, 451–465. [Google Scholar] [CrossRef] [Scilit]
- Weber, W.J., Jr.; Morris, J.C. Kinetics of adsorption on carbon from solution. J. Sanit. Eng. Div. 1963, 89, 31–59. [Google Scholar] [CrossRef] [Scilit]
- Akar, T.; Tunali, S. Biosorption characteristics of Aspergillus flavus biomass for removal of Pb(II) and Cu(II) ions from an aqueous solution. Bioresour. Technol. 2006, 97, 1780–1787. [Google Scholar] [CrossRef] [Scilit]
- Foo, K.Y.; Hameed, B.H. Insights into the modeling of adsorption isotherm systems. Chem. Eng. J. 2010, 156, 2–10. [Google Scholar] [CrossRef] [Scilit]
- Salleh, M.A.M.; Mahmoud, D.K.; Karim, W.A.W.A.; Idris, A. Cationic and anionic dye adsorption by agricultural solid wastes: A comprehensive review. Desalination 2011, 280, 1–13. [Google Scholar] [CrossRef] [Scilit]
- Tan, I.; Ahmad, A.L.; Hameed, B. Adsorption of basic dye on high-surface-area activated carbon prepared from coconut husk: Equilibrium, kinetic and thermodynamic studies. J. Hazard. Mater. 2008, 154, 337–346. [Google Scholar] [CrossRef] [Scilit]
- Kadirvelu, K.; Thamaraiselvi, K.; Namasivayam, C. Adsorption of nickel (II) from aqueous solution onto activated carbon prepared from coirpith. Sep. Purif. Technol. 2001, 24, 497–505. [Google Scholar] [CrossRef] [Scilit]
- Ahmad, R.; Kumar, R. Adsorption studies of hazardous malachite green onto treated ginger waste. J. Environ. Manag. 2010, 91, 1032–1038. [Google Scholar] [CrossRef] [Scilit]
- Malik, P.K. Use of activated carbons prepared from sawdust and rice-husk for adsorption of acid dyes: A case study of Acid Yellow 36. Dyes Pigment. 2003, 56, 239–249. [Google Scholar] [CrossRef] [Scilit]
- Al-Ghouti, M.A.; Da’ana, D.A. Guidelines for the use and interpretation of adsorption isotherm models: A review. J. Hazard. Mater. 2020, 393, 122383. [Google Scholar] [CrossRef] [Scilit]
- Crini, G. Non-conventional low-cost adsorbents for dye removal: A review. Bioresour. Technol. 2006, 97, 1061–1085. [Google Scholar] [CrossRef] [Scilit]
- Namasivayam, C.; Kavitha, D. Removal of Congo Red from water by adsorption onto activated carbon prepared from coir pith, an agricultural solid waste. Dyes Pigment. 2002, 54, 47–58. [Google Scholar] [CrossRef] [Scilit]
- Garg, V.; Gupta, R.; Yadav, A.B.; Kumar, R. Dye removal from aqueous solution by adsorption on treated sawdust. Bioresour. Technol. 2003, 89, 121–124. [Google Scholar] [CrossRef] [Scilit]
- Ho, Y.; McKay, G. The kinetics of sorption of basic dyes from aqueous solution by sphagnum moss peat. Can. J. Chem. Eng. 1998, 76, 822–827. [Google Scholar] [CrossRef] [Scilit]
- Azizian, S. Kinetic models of sorption: A theoretical analysis. J. Colloid Interface Sci. 2004, 276, 47–52. [Google Scholar] [CrossRef] [Scilit]
- Wu, F.-C.; Tseng, R.-L.; Juang, R.-S. Initial behavior of intraparticle diffusion model used in the description of adsorption kinetics. Chem. Eng. J. 2009, 153, 1–8. [Google Scholar] [CrossRef] [Scilit]
- Bhatnagar, A.; Minocha, A. Conventional and non-conventional adsorbents for removal of pollutants from water—A review. Indian J. Chem. Technol. 2006, 13, 203–217. [Google Scholar]
- Garg, V.; Gupta, R.; Kumar, R.; Gupta, R. Adsorption of chromium from aqueous solution on treated sawdust. Bioresour. Technol. 2004, 92, 79–81. [Google Scholar] [CrossRef] [Scilit]
- Mall, I.D.; Srivastava, V.C.; Agarwal, N.K.; Mishra, I.M. Removal of congo red from aqueous solution by bagasse fly ash and activated carbon: Kinetic study and equilibrium isotherm analyses. Chemosphere 2005, 61, 492–501. [Google Scholar] [CrossRef] [Scilit]
- Huang, Y.-T.; Shih, M.-C. Kinetic, isotherm, and thermodynamic modeling of methylene blue adsorption using natural rice husk: A sustainable approach. Separations 2025, 12, 189. [Google Scholar] [CrossRef] [Scilit]
- Rafatullah, M.; Sulaiman, O.; Hashim, R.; Ahmad, A. Adsorption of methylene blue on low-cost adsorbents: A review. J. Hazard. Mater. 2010, 177, 70–80. [Google Scholar] [CrossRef] [Scilit]
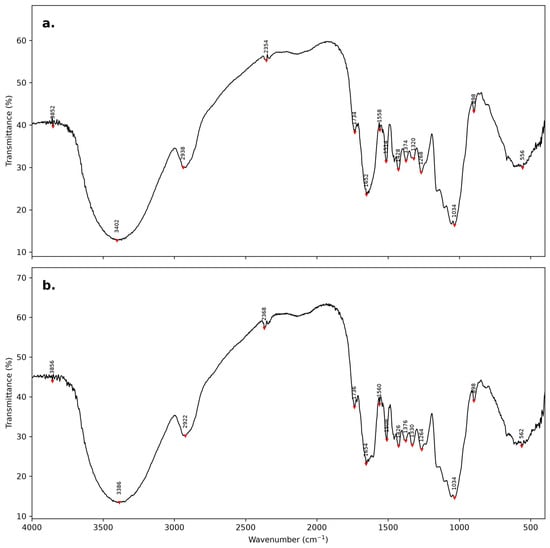
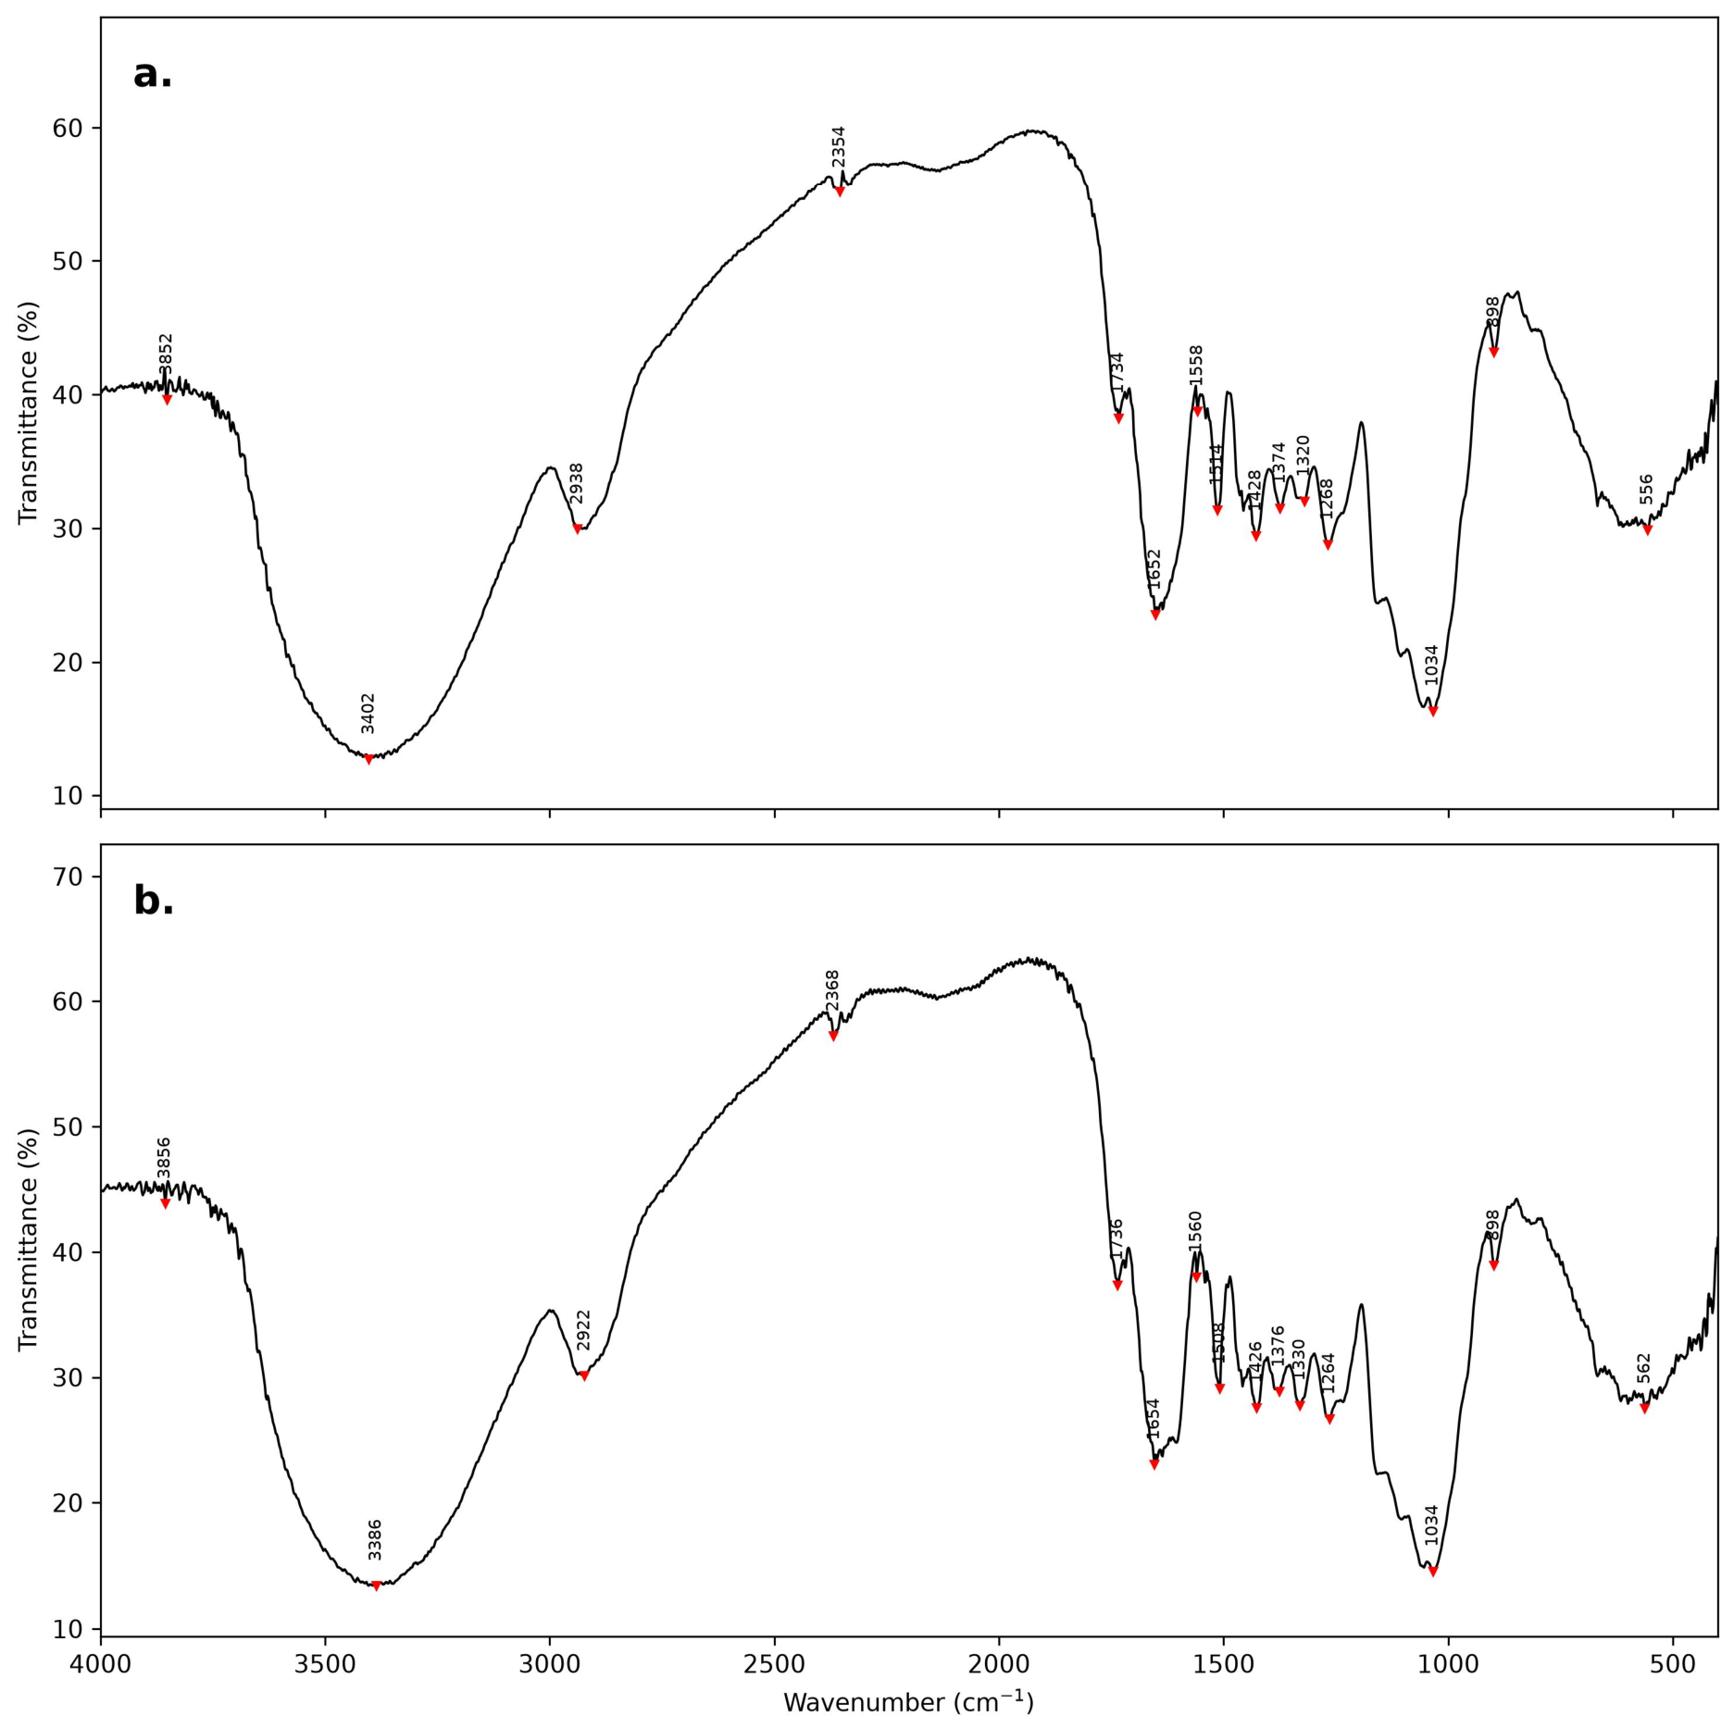


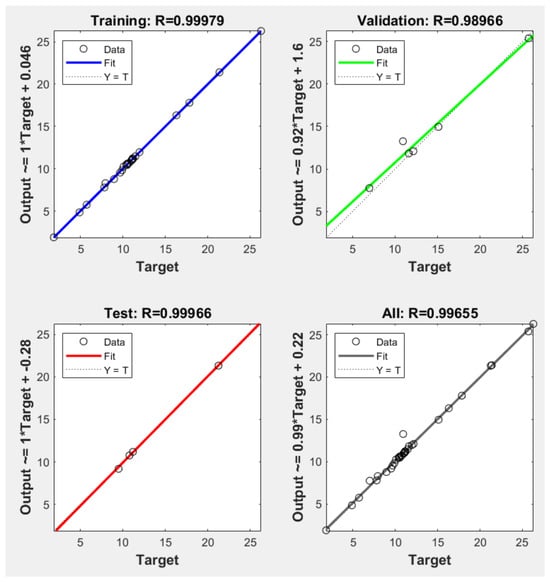
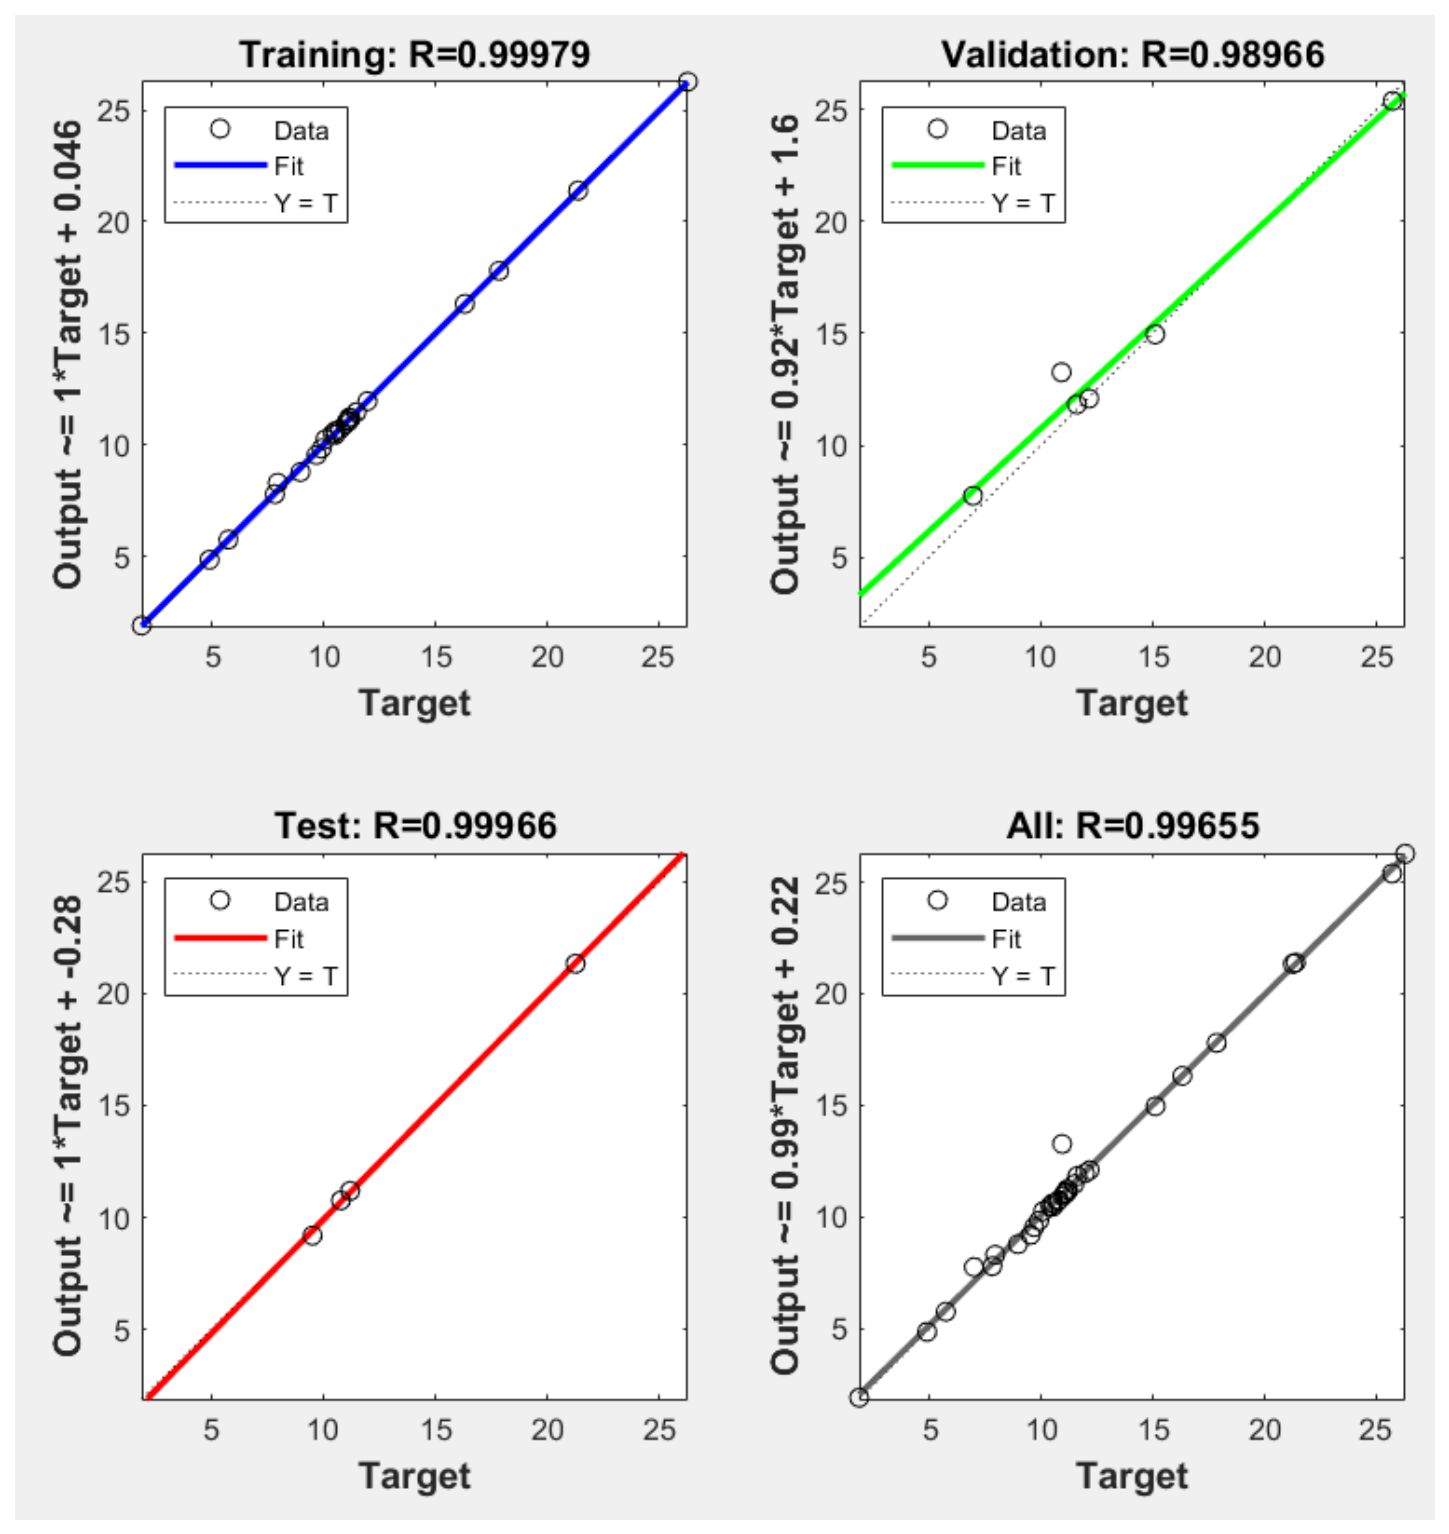
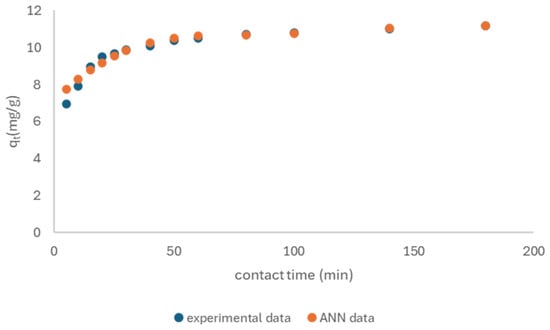
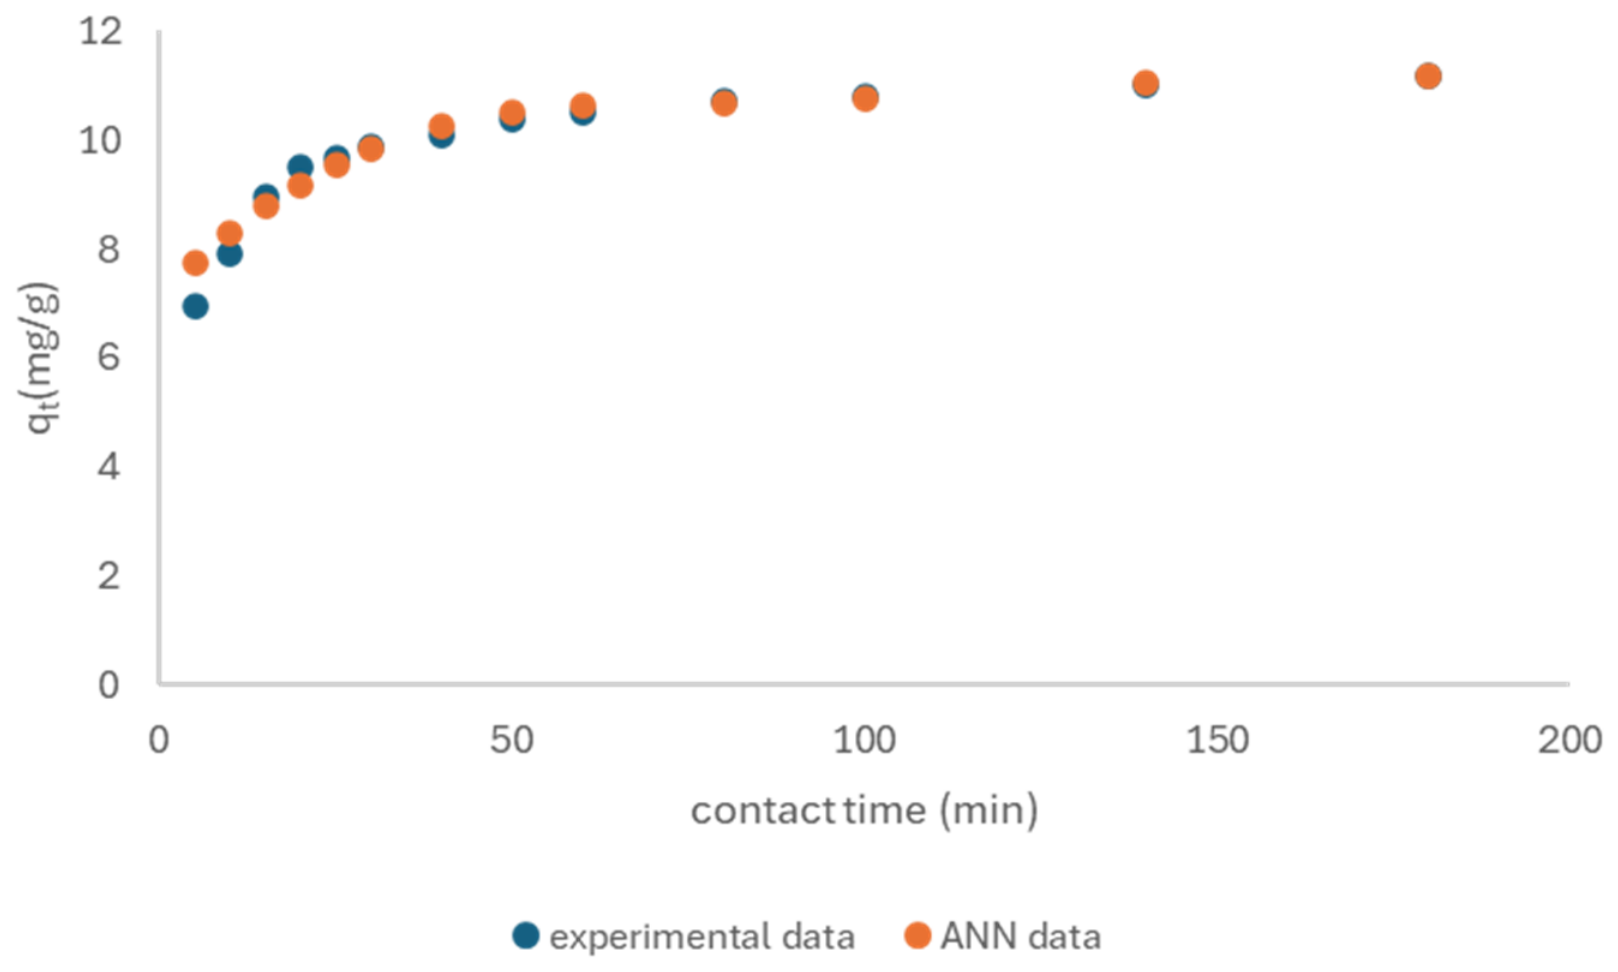
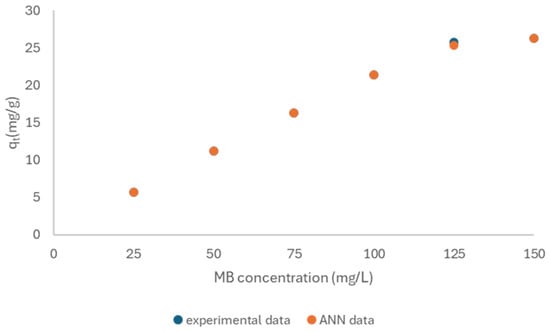
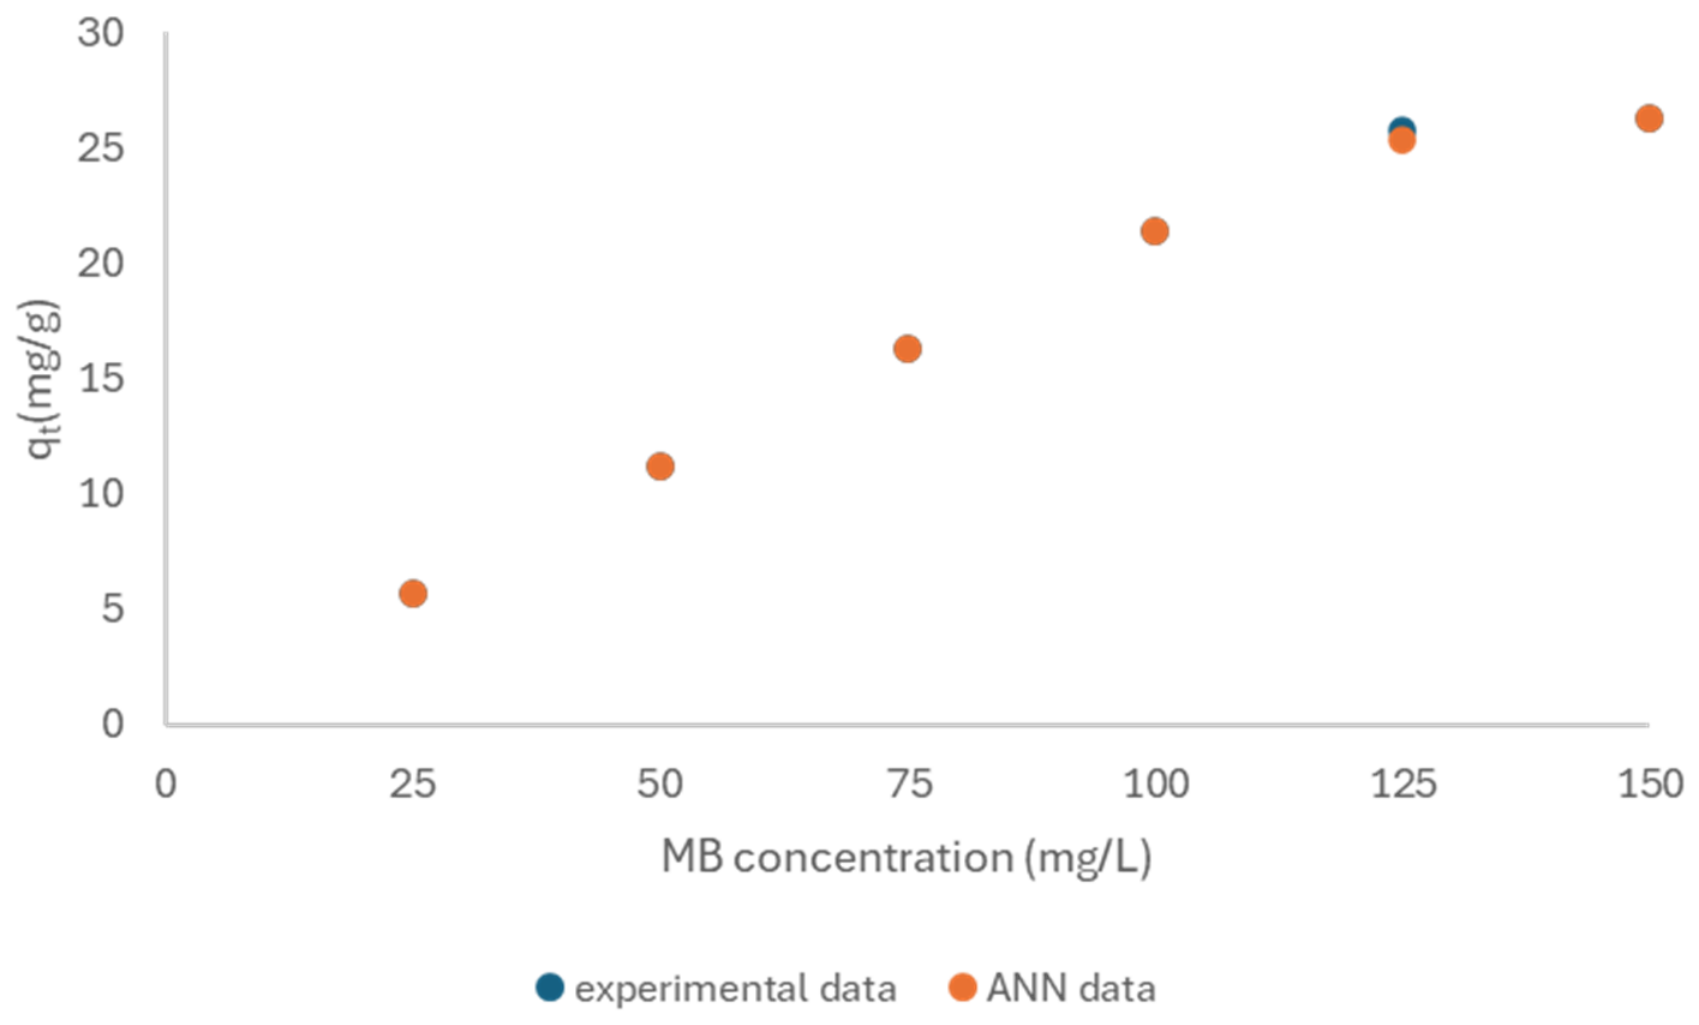
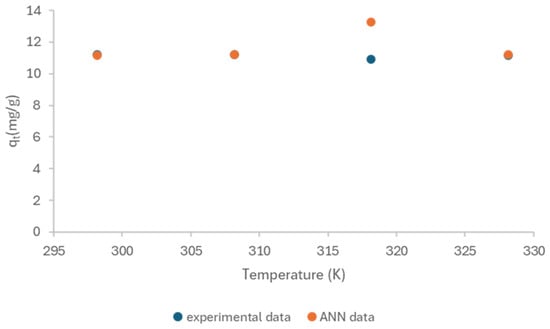
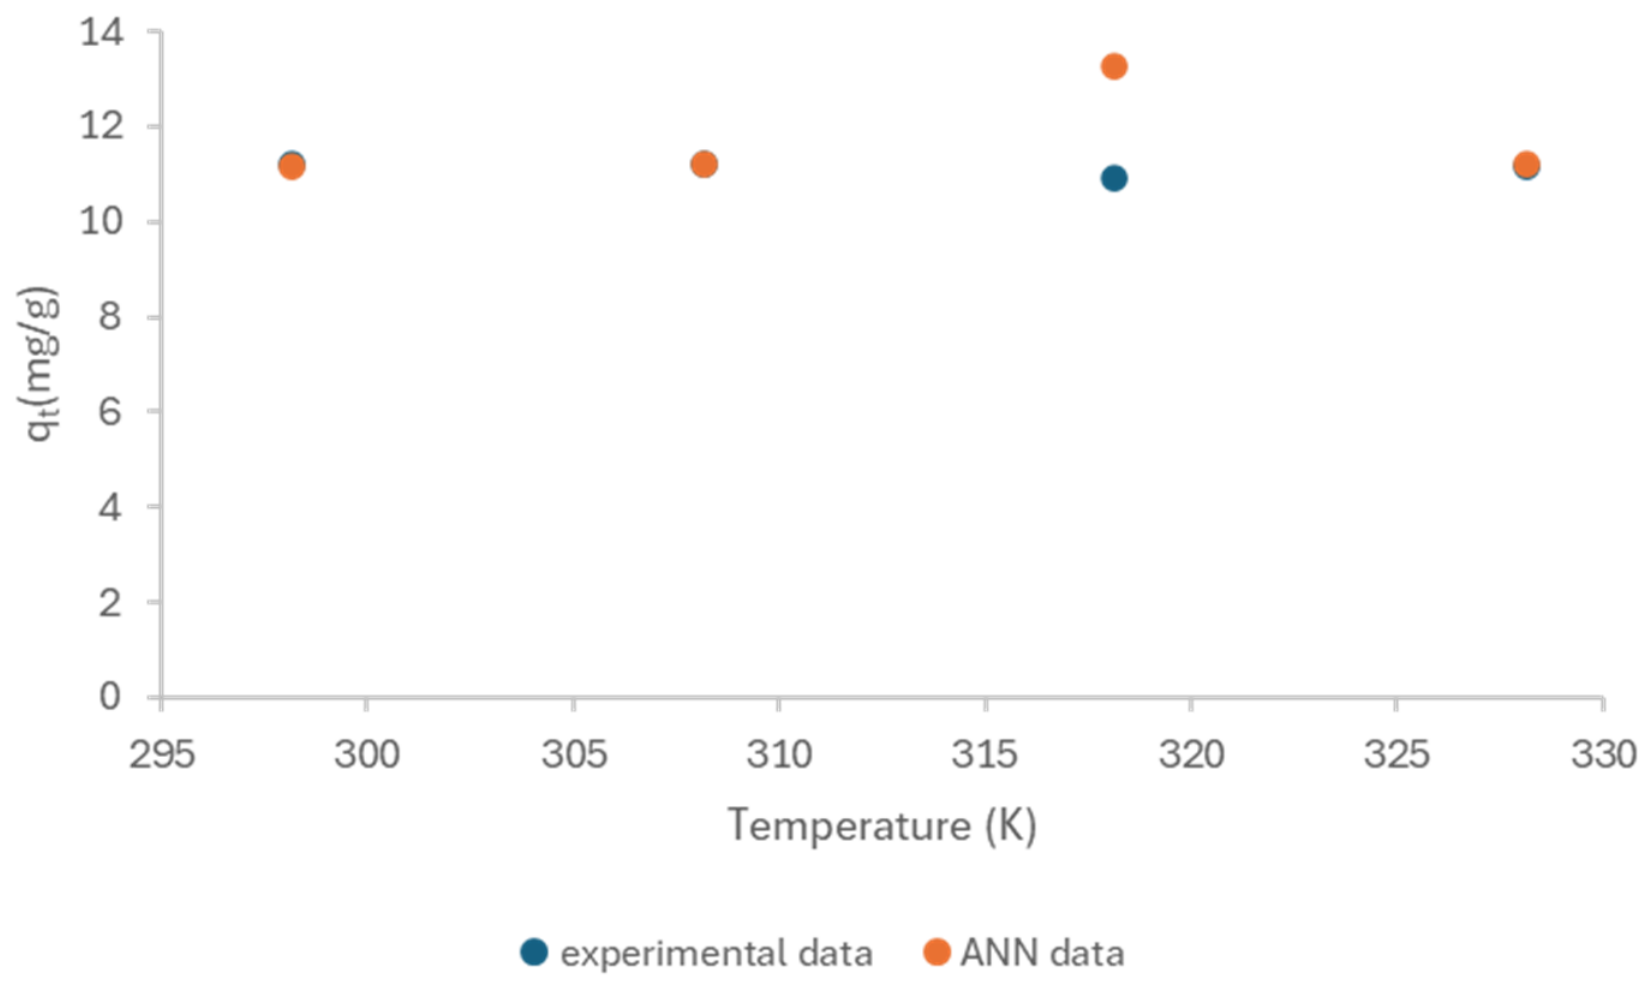
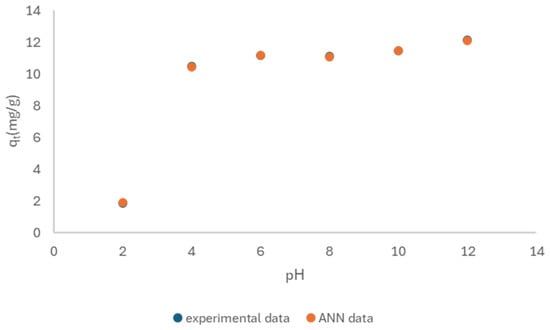
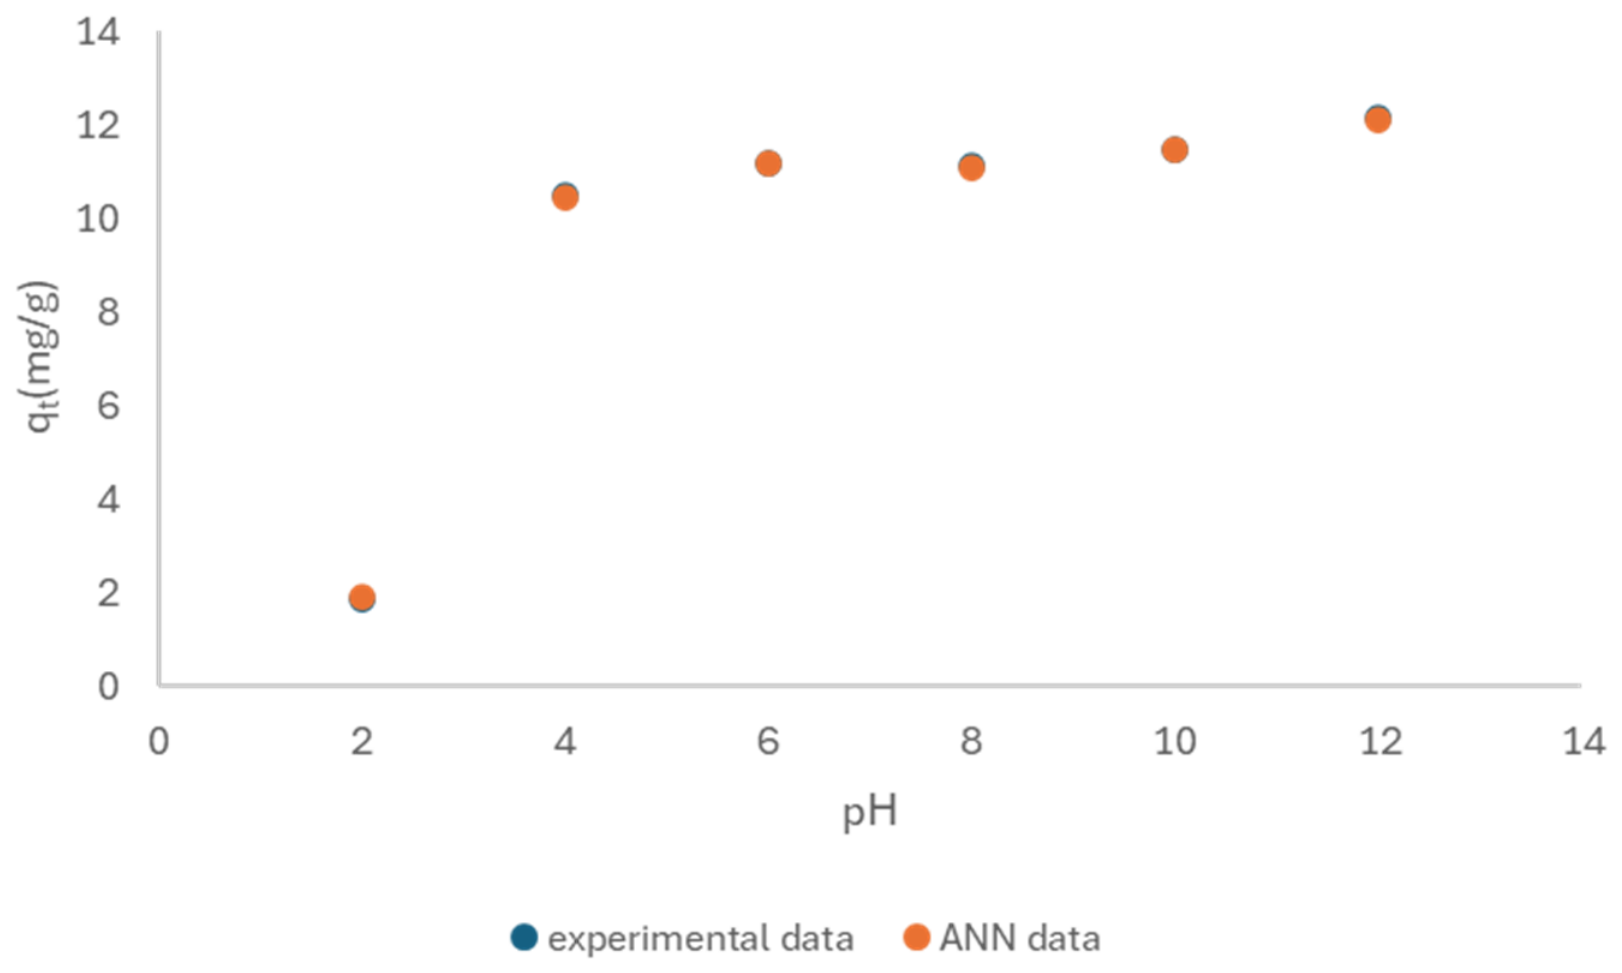
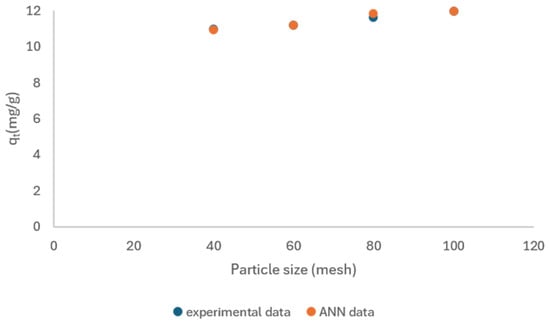
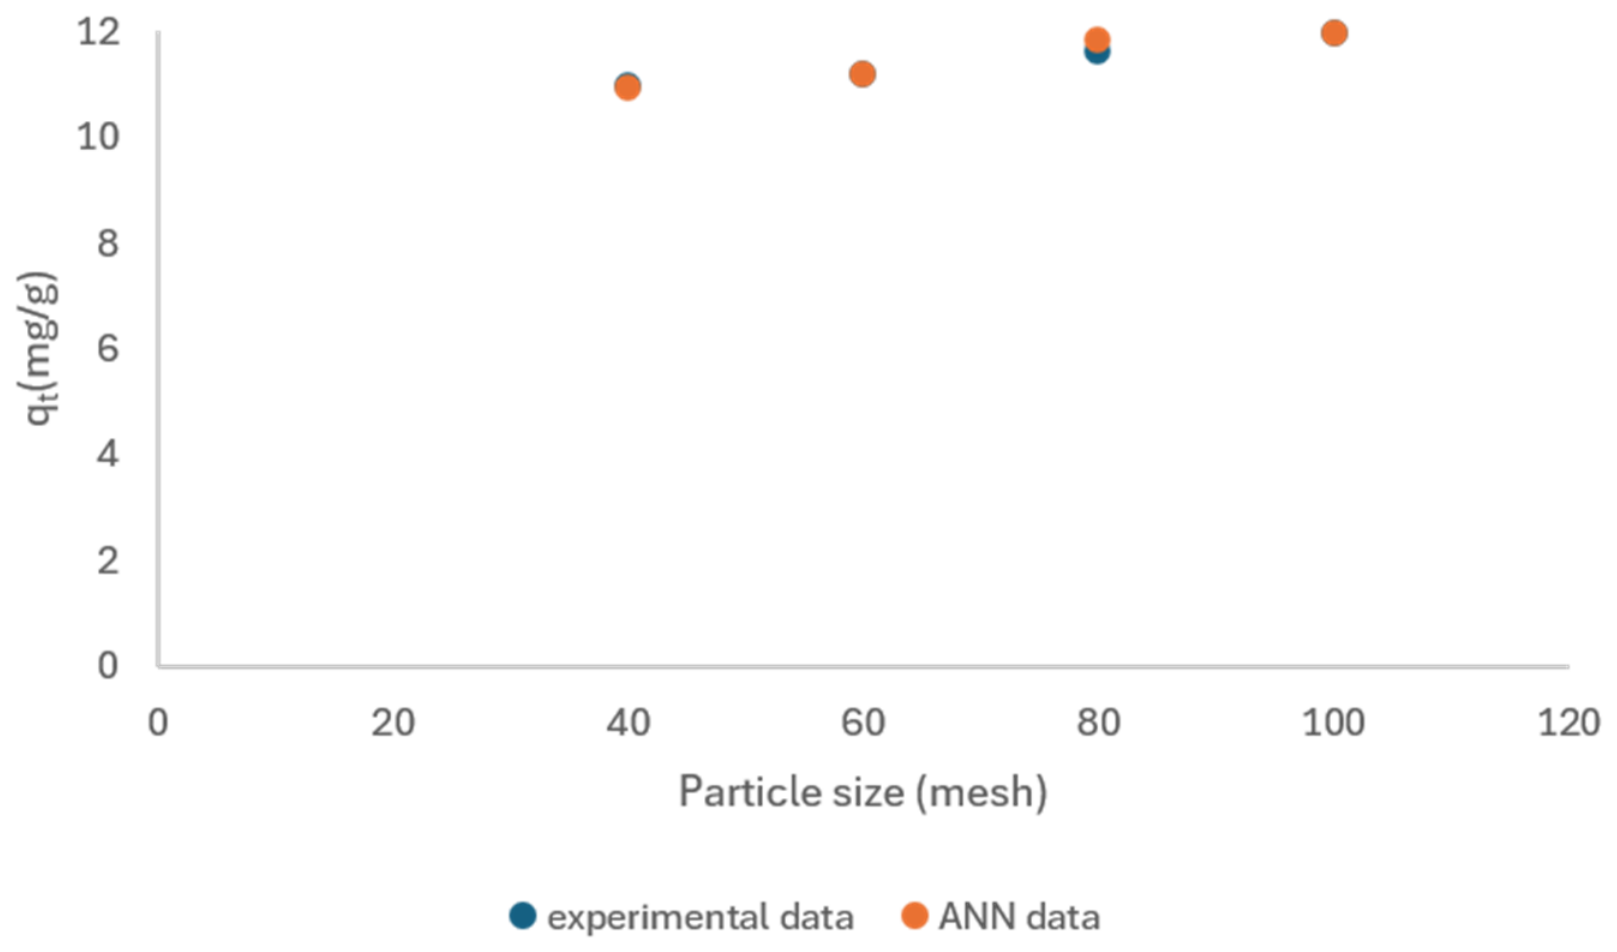
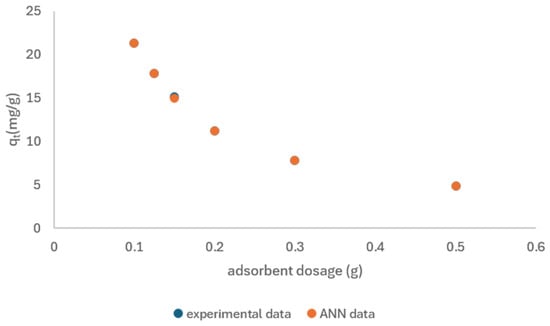
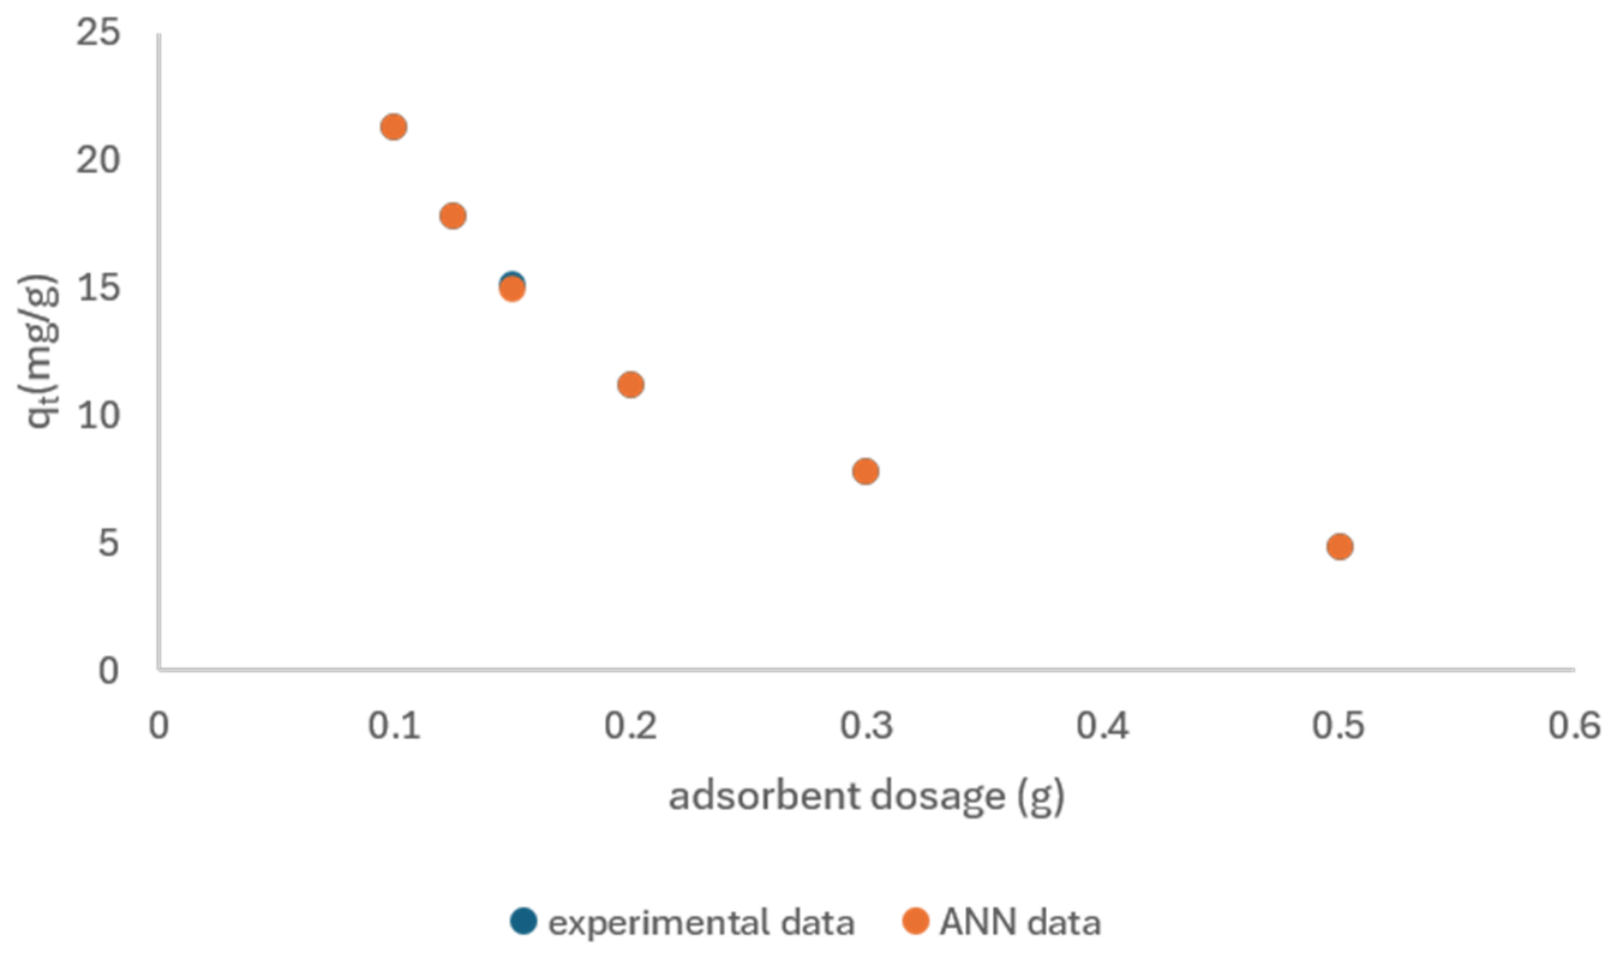
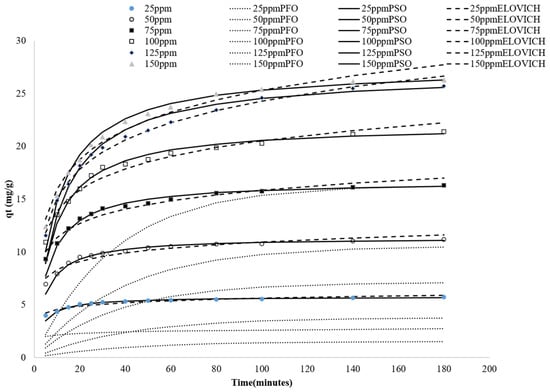
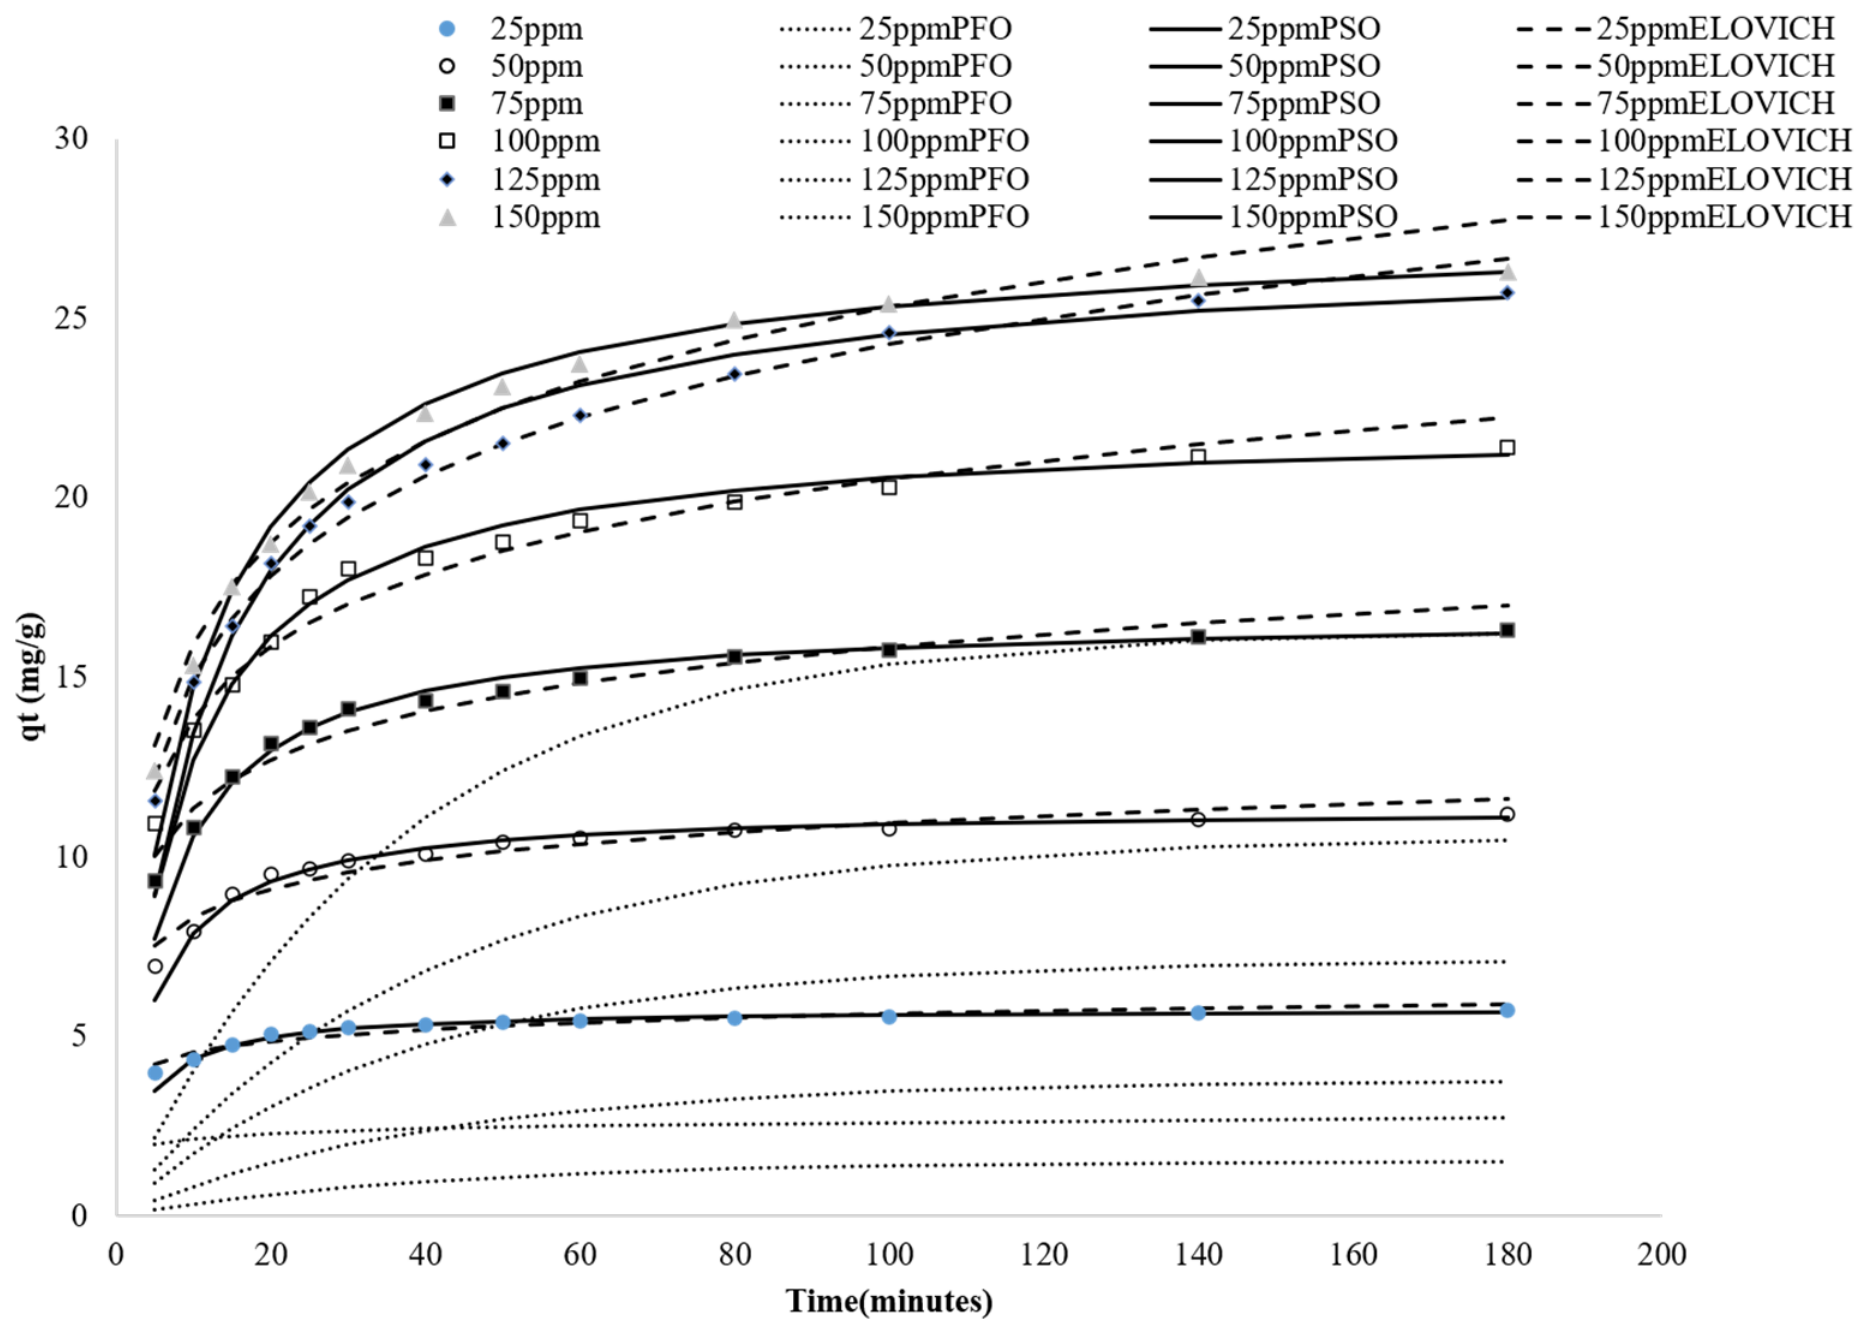
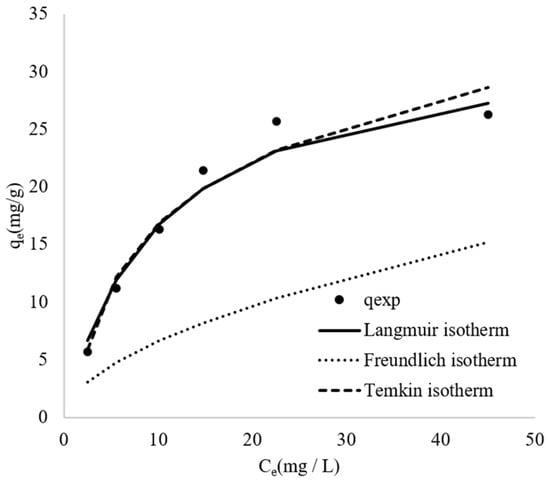
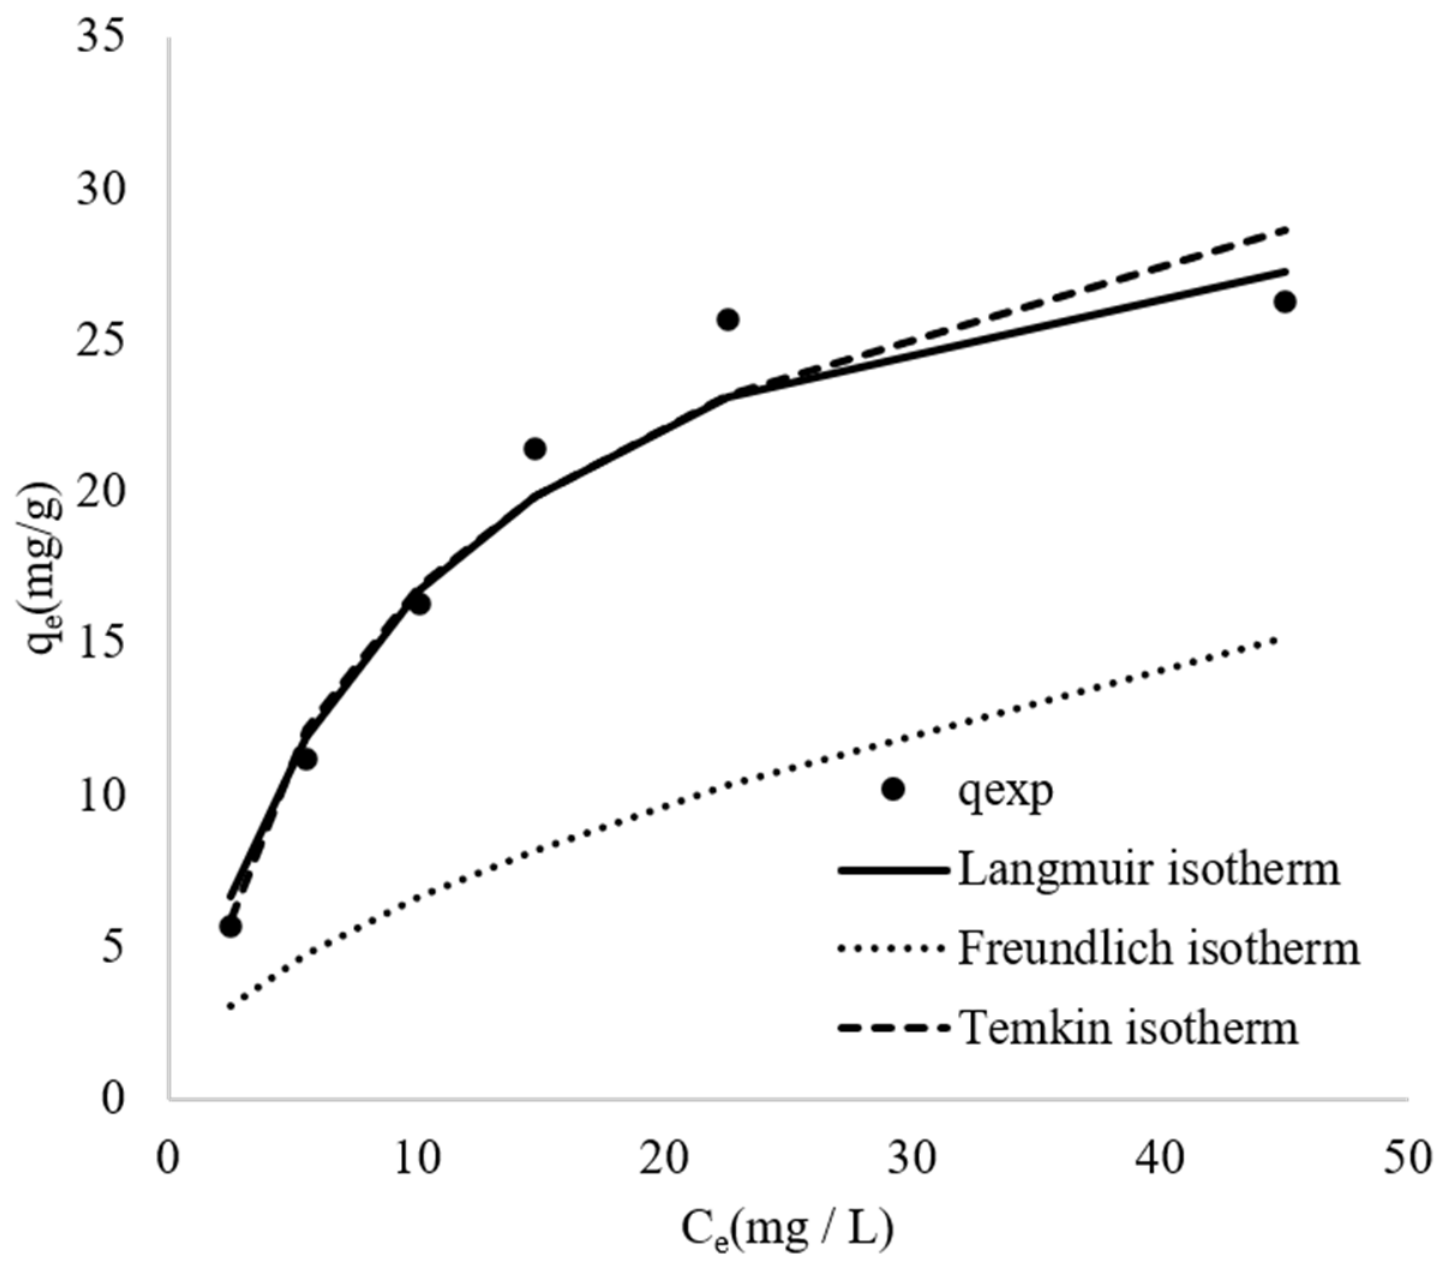
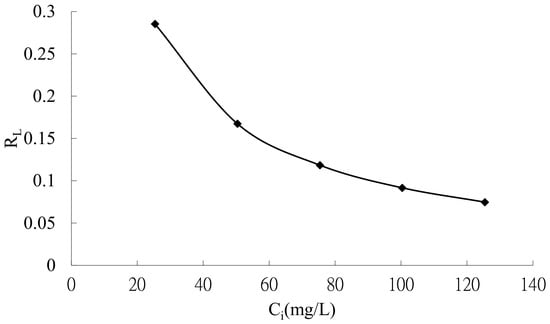
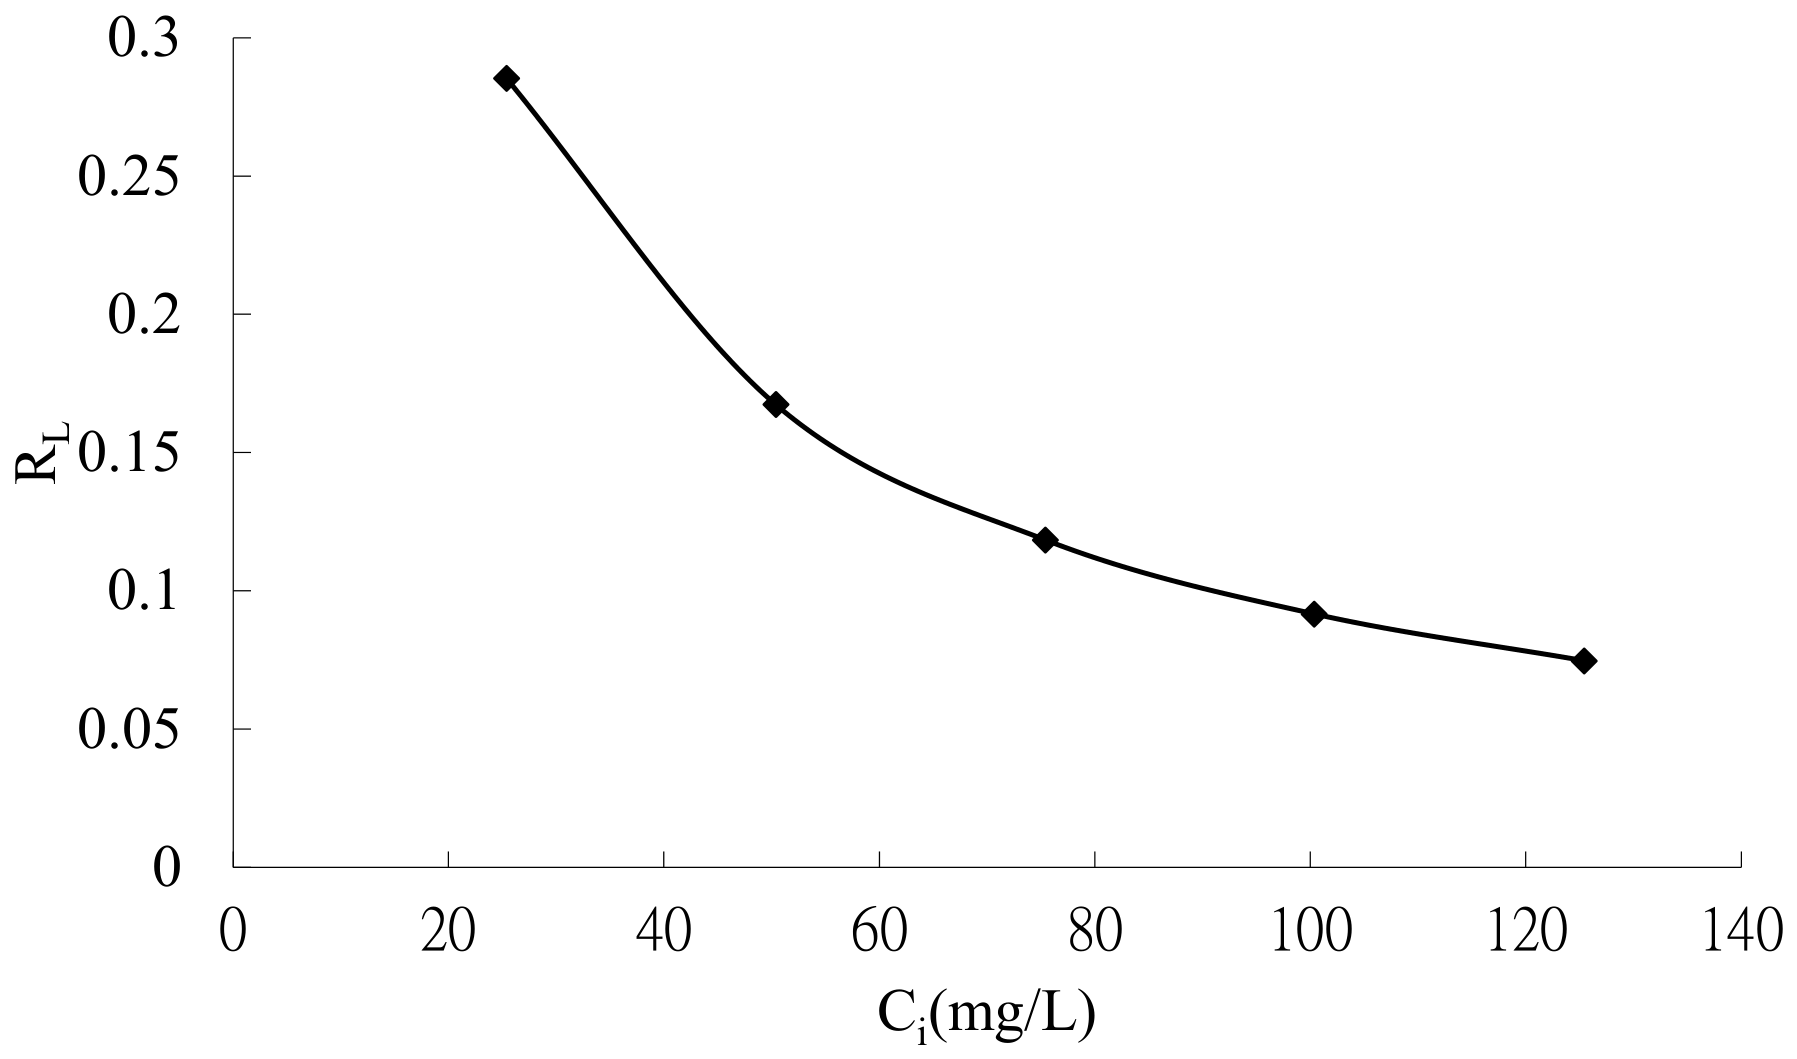

Disclaimer/Publisher’s Note: The statements, opinions and data contained in all publications are solely those of the individual author(s) and contributor(s) and not of MDPI and/or the editor(s). MDPI and/or the editor(s) disclaim responsibility for any injury to people or property resulting from any ideas, methods, instructions or products referred to in the content. |
© 2026 by the authors. Licensee MDPI, Basel, Switzerland. This article is an open access article distributed under the terms and conditions of the Creative Commons Attribution (CC BY) license.