


Abstract
Accurate prediction of flotation concentrate grade is essential for maintaining product quality and supporting timely process adjustment. However, mechanistic prediction remains difficult because industrial flotation involves nonlinear multivariable interactions and partially observed operating states. Recent advances in machine learning have increased interest in data-driven methods, with encouraging results. Although recent studies have incorporated temporal dependencies into flotation-grade prediction, explicitly modeling the condition-dependent evolution of multivariate process–quality relationships under changing plant conditions remains challenging. In this study, industrial flotation records were systematically analyzed from a data-driven perspective to identify challenges affecting concentrate-grade prediction. Statistical analyses showed that variable–grade relationships are condition-dependent and vary across operating periods, indicating that measured variables only partially characterize evolving flotation states and that fixed input–output mappings may be inadequate. Accordingly, a DGraFormer-based model was developed to capture evolving inter-variable dependencies and multi-scale temporal patterns. For one-hour-ahead forecasting, the model achieved an RMSE of 0.7587 and an of 0.5423 for iron concentrate grade, and an RMSE of 0.6917 and an of 0.6384 for silica concentrate grade, outperforming the evaluated machine-learning and deep-learning baselines overall. These results underscore the importance of dynamic multivariate modeling for accurate concentrate-grade forecasting.
1. Introduction
Froth flotation is a key separation process in mineral processing, in which valuable minerals are selectively recovered from gangue through differences in their surface properties [1]. Concentrate grade is one of the most important indicators of flotation performance, product quality, and the effectiveness of operating adjustments. In continuous industrial production, timely knowledge of future concentrate quality can help operators identify potential deviations before they become significant and adjust the operating conditions accordingly [2]. Reliable short-term prediction of concentrate grade is therefore important for maintaining production stability, reducing quality fluctuations, and supporting the intelligent monitoring, control, and optimization of flotation processes [3].
Existing flotation-prediction approaches can be broadly categorized as physics-based, hybrid or physics-informed, and purely data-driven models. Physics-based models explicitly represent flotation behavior through mechanistic relationships. Quintanilla et al. developed a dynamic flotation model incorporating mass balances and pulp- and froth-phase physics for predictive control [4]. Oosthuizen et al. combined fundamental and phenomenological relationships with online measurements to infer unmeasured flotation characteristics [5]. Huang et al. modeled bubble–particle interactions and flotation kinetics to predict grade–recovery relationships from mineral liberation data [6]. These models provide physically interpretable predictions based on established flotation mechanisms. However, their industrial application commonly requires numerous assumptions, parameters, and calibration data because of the inherent complexity of the flotation process. Flotation performance is jointly influenced by multiple factors. For example, feed grade alone cannot distinguish liberated minerals from composite particles, while liberation characteristics may change continuously with ore properties. Reagent additions may also respond to head grade, and adjustments to collector dosage, aeration, and froth depth can introduce a trade-off between concentrate grade and recovery. These factors interact through complex physical, chemical, and hydrodynamic mechanisms, and their effects may vary under different operating conditions [7,8,9].
In addition, data-driven and hybrid methods have been increasingly applied to flotation concentrate-grade prediction [10]. Existing approaches can generally be grouped into two categories: process-variable-based methods and froth-vision-based methods. Process-variable-based methods estimate concentrate quality from routinely recorded information, including feed properties, reagent dosages, pulp conditions, equipment operating variables, and historical product grades. Early studies demonstrated that machine-learning algorithms could serve as effective alternatives to complete mechanism-based models by learning the complex nonlinear relationships between process conditions and flotation performance. For example, Pural [11] compared ridge regression, multilayer perceptron, and random forest models for silicate impurity prediction and found that the random forest model using the complete set of process variables achieved the best performance. Subsequent studies introduced deep-learning architectures to exploit temporal information contained in historical process measurements. Pu et al. [12] applied an LSTM model to hourly flotation data, demonstrating the value of historical observations for concentrate-quality prediction. Costa et al. [13] further combined convolutional layers with LSTM units to capture local process patterns and their temporal evolution. Pu et al. subsequently proposed FlotationNet [14], which organized feed and operating variables according to their functional roles and incorporated this process structure into the prediction architecture. Cubillos and Lima integrated a first-principles flotation structure with a PCA-based neural network for kinetic-parameter estimation and rougher-circuit control [15]. Nasiri Abarbekouh et al. constrained neural networks using flotation kinetics, ordinary differential equations, mass balances, and domain knowledge [16]. Seppi et al. incorporated mass-balance-based loss functions into CNN, GRU, and LSTM models for multivariate multistep forecasting [17], whereas Lu et al. combined simplified mechanistic grade relationships with data-driven modeling [18].
However, most existing process-variable-based studies have not explicitly addressed the dynamic nature of multivariate process–quality relationships. The effect of a given process variable is not necessarily constant across the operating domain. For example, the influence of a unit change in amine dosage on concentrate grade may differ under different pulp pH, density, feed composition, or aeration conditions because these variables jointly determine the flotation state. Moreover, some important operating conditions, such as mineralogical composition, particle-size distribution, degree of liberation, and froth stability, may not be continuously measured. When these state-defining factors are unavailable, their evolution may be observed only indirectly as time-varying and condition-dependent effects of the recorded variables. Therefore, it is more reasonable for flotation to be treated as a partially observable dynamic system in which the relationships among process variables and concentrate grades evolve with changing operating conditions. This interpretation is also consistent with evidence from froth-vision-based studies, which have shown that flotation conditions cannot always be adequately characterized using isolated static observations. For example, Zhang et al. [19] exploited the dynamic consistency between froth-feature sequences and measured grades for tailings-grade prediction. Zheng et al. [20] extracted dynamic and semantic representations from consecutive froth observations, while Zhong et al. [21] modeled both short- and long-term temporal dependencies in froth videos.
To address this limitation, this study investigates the dynamic relationships among measured flotation variables and develops a dynamic-relationship-aware prediction model based on DGraFomer for the one-hour-ahead prediction of iron and silica concentrate grades. The major contributions of this study are summarized as follows:
- 1.
- From a data-driven perspective, industrial flotation records are systematically analyzed to identify the key challenges affecting concentrate-grade forecasting.
- 2.
- Statistical evidence reveals that variable–grade relationships are condition-dependent and evolve across operating periods, underscoring the importance of explicitly accounting for flotation dynamics in predictive modeling.
- 3.
- A DGraFormer-based forecasting model is developed to capture evolving inter-variable dependencies and multi-scale temporal patterns. The model achieves superior overall performance compared with conventional machine-learning and deep-learning baselines in one-hour-ahead forecasting of both iron and silica concentrate grades.
The remainder of this paper is organized as follows. Section 2 describes the industrial flotation dataset and the preprocessing procedures. Section 3 presents the exploratory data analysis, including contemporaneous relationships, interaction effects, and time-varying lag structures. Section 4 introduces the forecasting methodology, including DGraFormer and the comparison models. Section 5 reports and discusses the prediction results for iron and silica concentrate grades. Finally, Section 6 summarizes the main conclusions, limitations, and directions for future work.
2. Data Description
The dataset used in this study was obtained from the publicly available industrial flotation dataset released by [22]. The data were collected from an iron-ore froth flotation plant between March 2017 and September 2017 and were recorded on an hourly basis. A total of 24 variables were included in the dataset, consisting of one time-related variable and 23 process and quality-related variables, as summarized in Table 1. According to their physical meanings and positions within the flotation process, the variables were categorized into five groups: time information, feed and pulp conditions, flotation-column air flow, flotation-column level, and product quality indicators. The time information provides the temporal reference for each observation. The feed and pulp condition variables describe the characteristics of the material entering the flotation process and the corresponding chemical and physical operating conditions, including feed composition, reagent addition, pulp flow, pH, and density. The flotation-column air-flow and level variables represent the operating states of individual flotation columns, reflecting the hydrodynamic conditions during the separation process. The product quality variables correspond to the final flotation concentrate measurements, including iron concentrate grade and silica concentrate grade.
Table 1.
Variables contained in the public industrial flotation dataset.
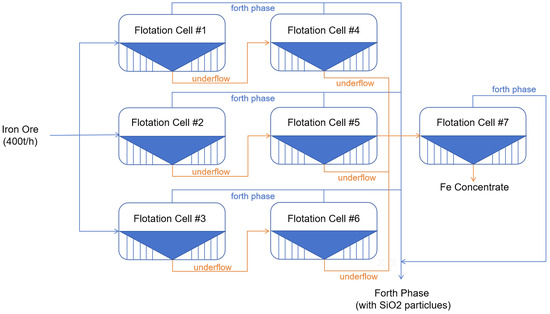
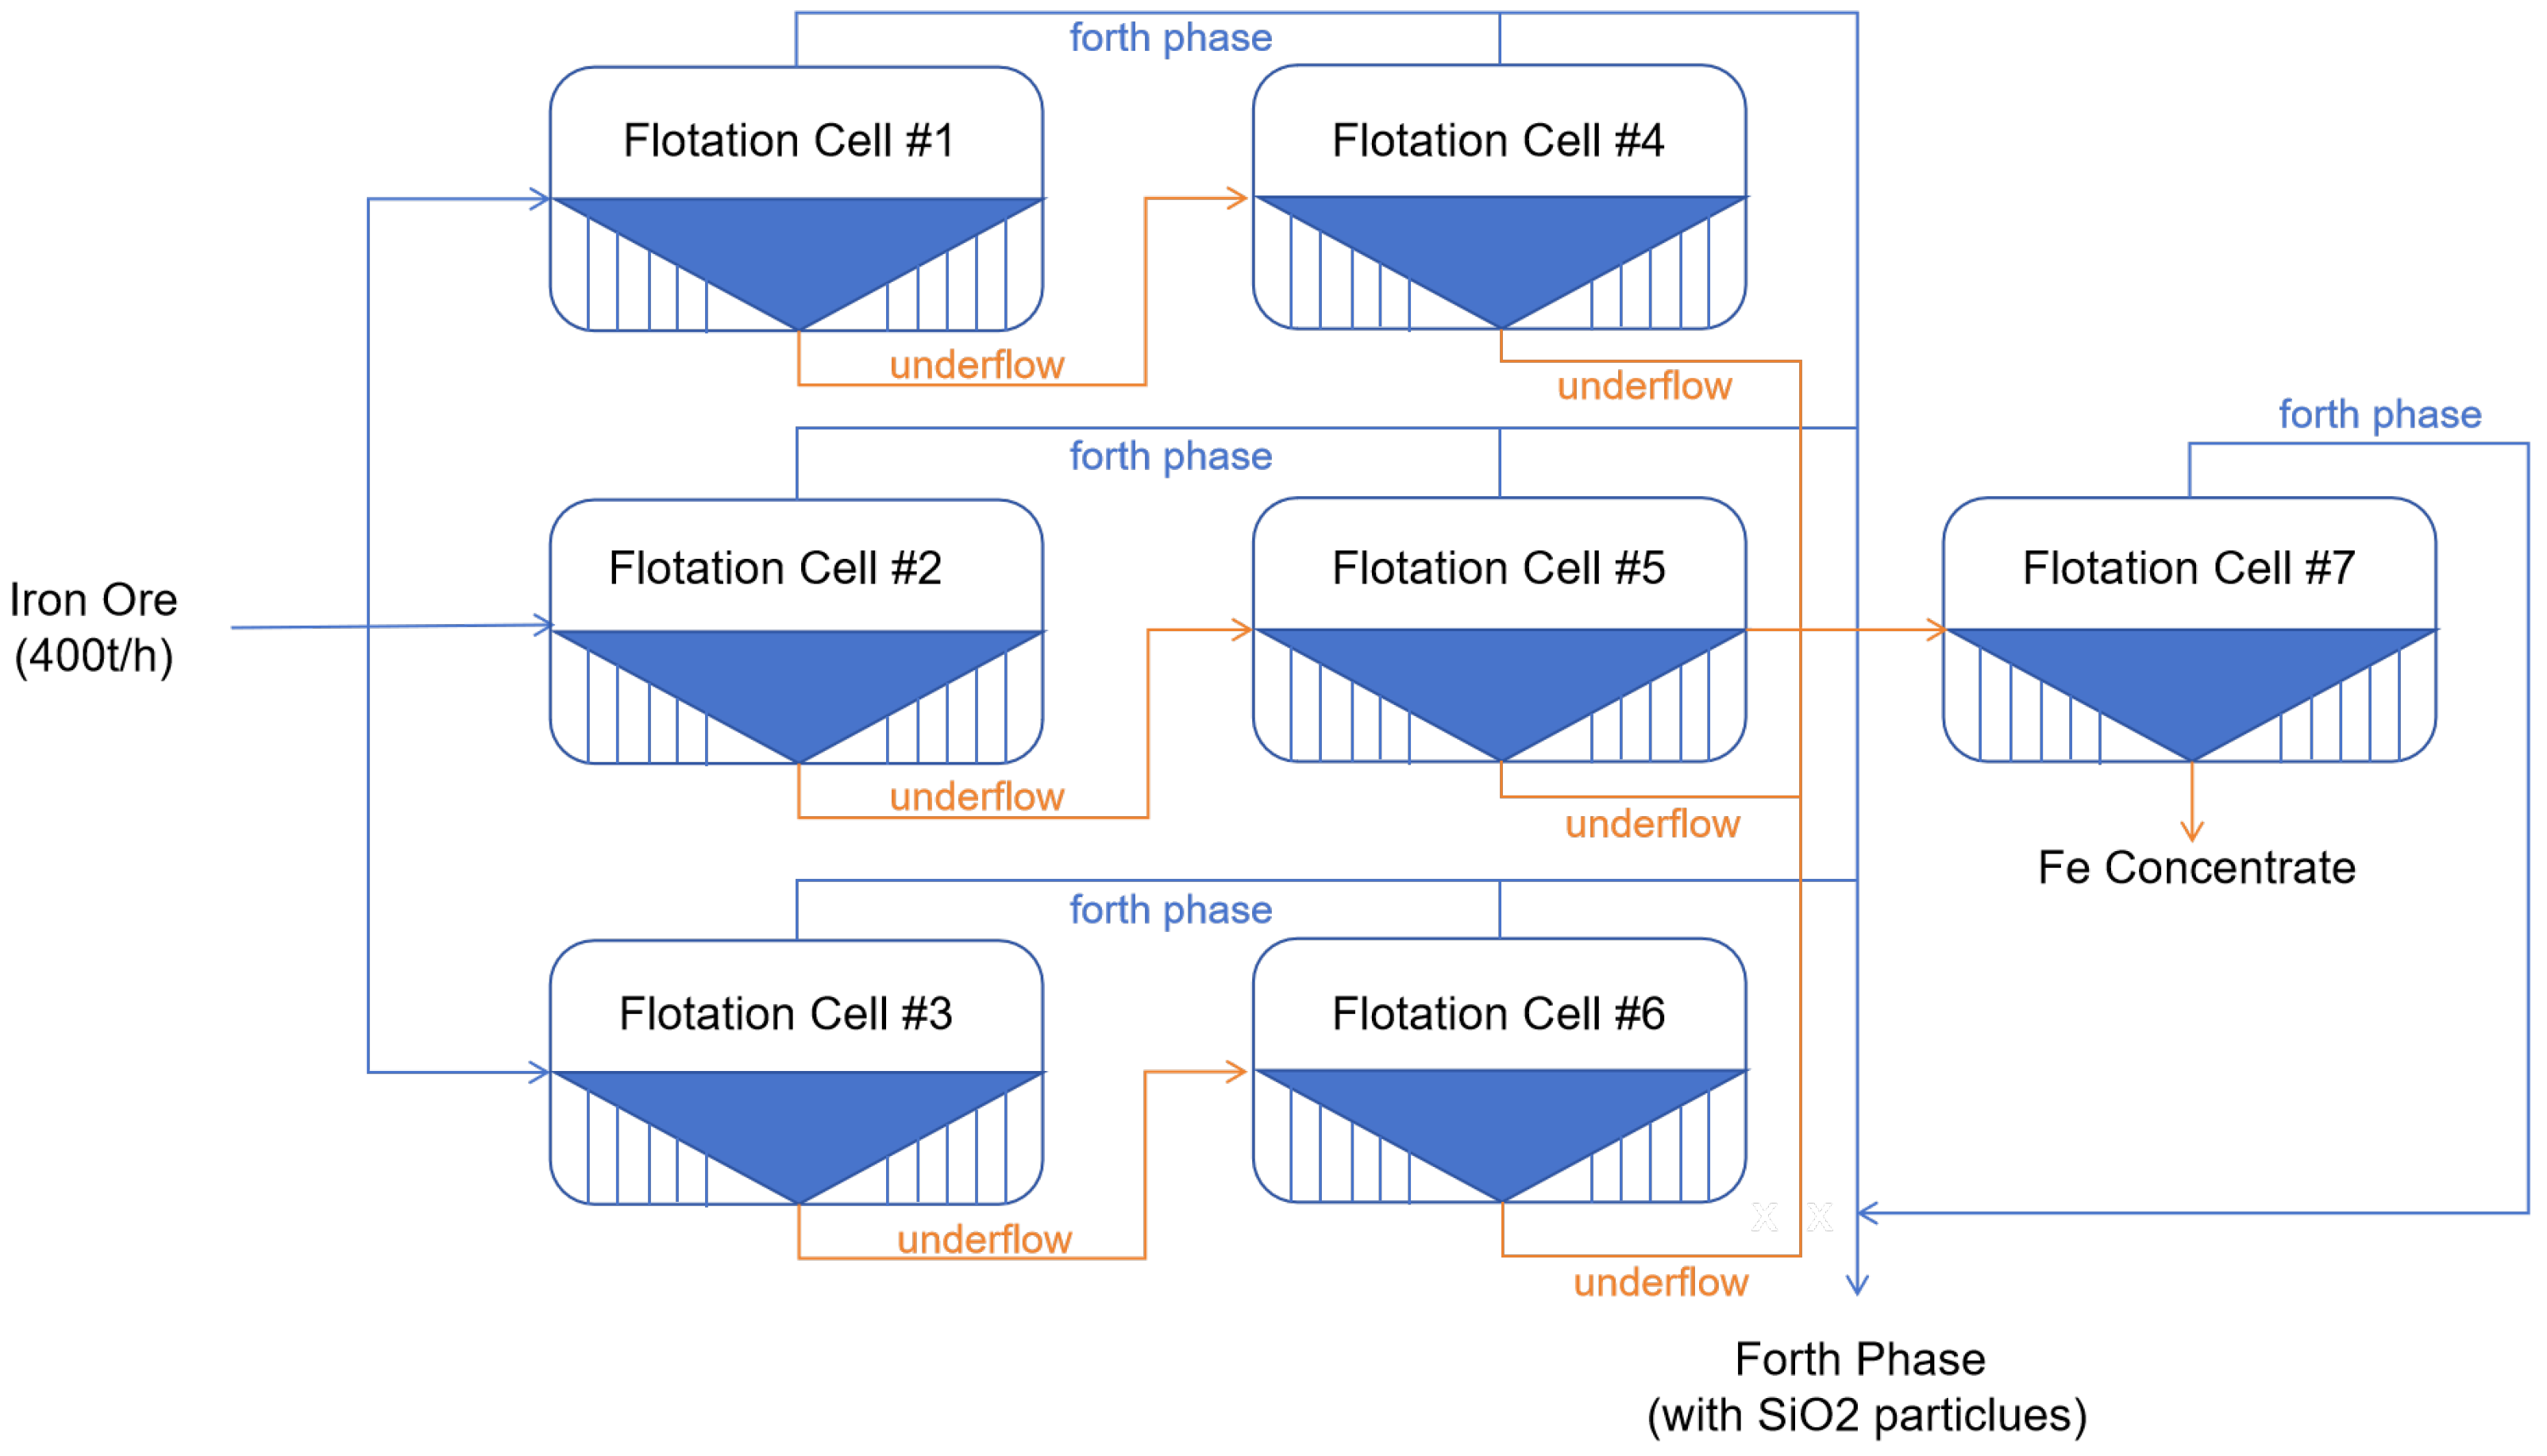
The flotation column system investigated in this study consists of a multi-stage flotation circuit, as illustrated in Figure 1. Approximately 400 tons of iron ore pulp are continuously fed into the flotation circuit per hour. In the first stage, the incoming pulp is divided into three parallel streams and processed by flotation columns 1–3. During flotation, silica-bearing particles are attached to air bubbles and removed from the pulp through the froth phase, forming a silica-rich concentrate. In contrast, iron-bearing minerals exhibit hydrophilic characteristics and remain in the pulp phase, resulting in an iron-enriched underflow. The underflow streams from the first-stage flotation columns are subsequently transferred to the second-stage flotation columns (columns 4–6), where the separation process is further repeated to improve the removal of remaining silica particles. The combined underflow from these columns is then introduced into the final flotation column (column 7) for further upgrading. Through this multi-stage separation process, two final products are obtained: a silica concentrate enriched with unwanted silica particles and an iron concentrate with a high iron grade and reduced silica content.
Figure 1.
Schematic representation of the industrial iron-ore flotation circuit. The figure is reproduced from Pu et al. [14].
Considering the continuous and multi-stage characteristics of the flotation circuit, the relationships between process variables and final concentrate quality cannot be fully characterized by simple static relationships. The effect of an operating variable may depend on other process conditions, and its influence on concentrate quality may emerge with different response delays due to material transfer and process dynamics. Therefore, a comprehensive investigation of the inherent characteristics of the flotation dataset is necessary before developing prediction models for iron concentrate grade and silica concentrate grade.
3. Exploratory Data Analysis
Exploratory Data Analysis (EDA) is a necessary step for understanding the statistical and process-related characteristics of complex industrial data before predictive models are developed. In a continuous flotation process, concentrate quality is jointly affected by feed conditions, operating variables, and internal process states. These factors may interact through nonlinear, coupled, and delayed mechanisms. Consequently, directly applying predictive models without first examining the relationships contained in the observed data may obscure important process characteristics and lead to an inadequate representation of the underlying flotation system.
The objective of the EDA is therefore to characterize the dependency structure among the observed flotation variables and their relationships with the two concentrate-quality targets: iron concentrate grade and silica concentrate grade. To examine the nonlinear interactions and temporal characteristics of the continuous flotation process, the exploratory analysis is conducted from three complementary perspectives:
(1) To determine whether the measured process variables exhibit structured interdependence rather than behaving as independent inputs and whether substantial redundancy exists among variables describing similar operating conditions.
(2) To determine whether the relationships between process variables and iron and silica concentrate grades are condition-dependent, such that the predictive contribution of one variable changes with the operating levels of other variables rather than remaining fixed across the process.
(3) To determine whether the relationships between process variables and concentrate grades remain stable over time or evolve across different operating periods, including possible changes in both the magnitude and direction of the observed associations.
Together, these analyses provide an empirical characterization of the key features of the observed process data, including contemporaneous associations, condition-dependent interactions, and time-varying response delays. The resulting insights provide a basis for selecting an appropriate prediction framework and guide the development of a model capable of accurately capturing the complex and dynamic relationships within the flotation process.
3.1. Contemporaneous Relationships Among Process Variables
To characterize the inherent structure of the flotation dataset, the contemporaneous dependencies among process variables measured at different stages of the flotation circuit were first examined. This analysis was intended to determine whether the observed variables exhibited strong direct associations, potential redundancy, or coordinated operating patterns within the same sampling interval. Kendall correlation analysis was therefore performed before investigating the relationships between the process variables and concentrate quality.
Kendall’s rank correlation coefficient was used to quantify the contemporaneous monotonic association between each pair of process variables [23]. Unlike conventional correlation measures calculated directly from the original measurement values, Kendall’s correlation is determined from the relative ordering and concordance of observation pairs. It is therefore less sensitive to extreme values and does not require the variables to follow a normal distribution, making it suitable for industrial process data characterized by non-normal distributions, monotonic nonlinear relationships, and measurement variability [24]. For each variable pair, a hypothesis test was conducted to determine whether the observed monotonic association was statistically significant. The null hypothesis assumed that no monotonic association existed between the two variables. Because multiple variable pairs were tested simultaneously, the resulting p-values were adjusted using the Holm procedure [25] to control the family-wise error rate. Associations with Holm-adjusted p-values below 0.05 were considered statistically significant.
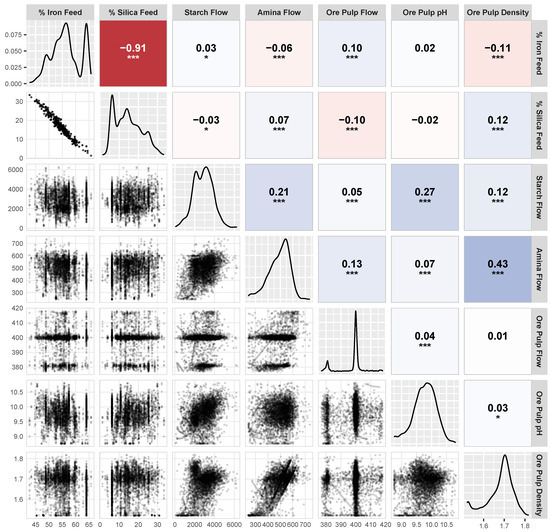
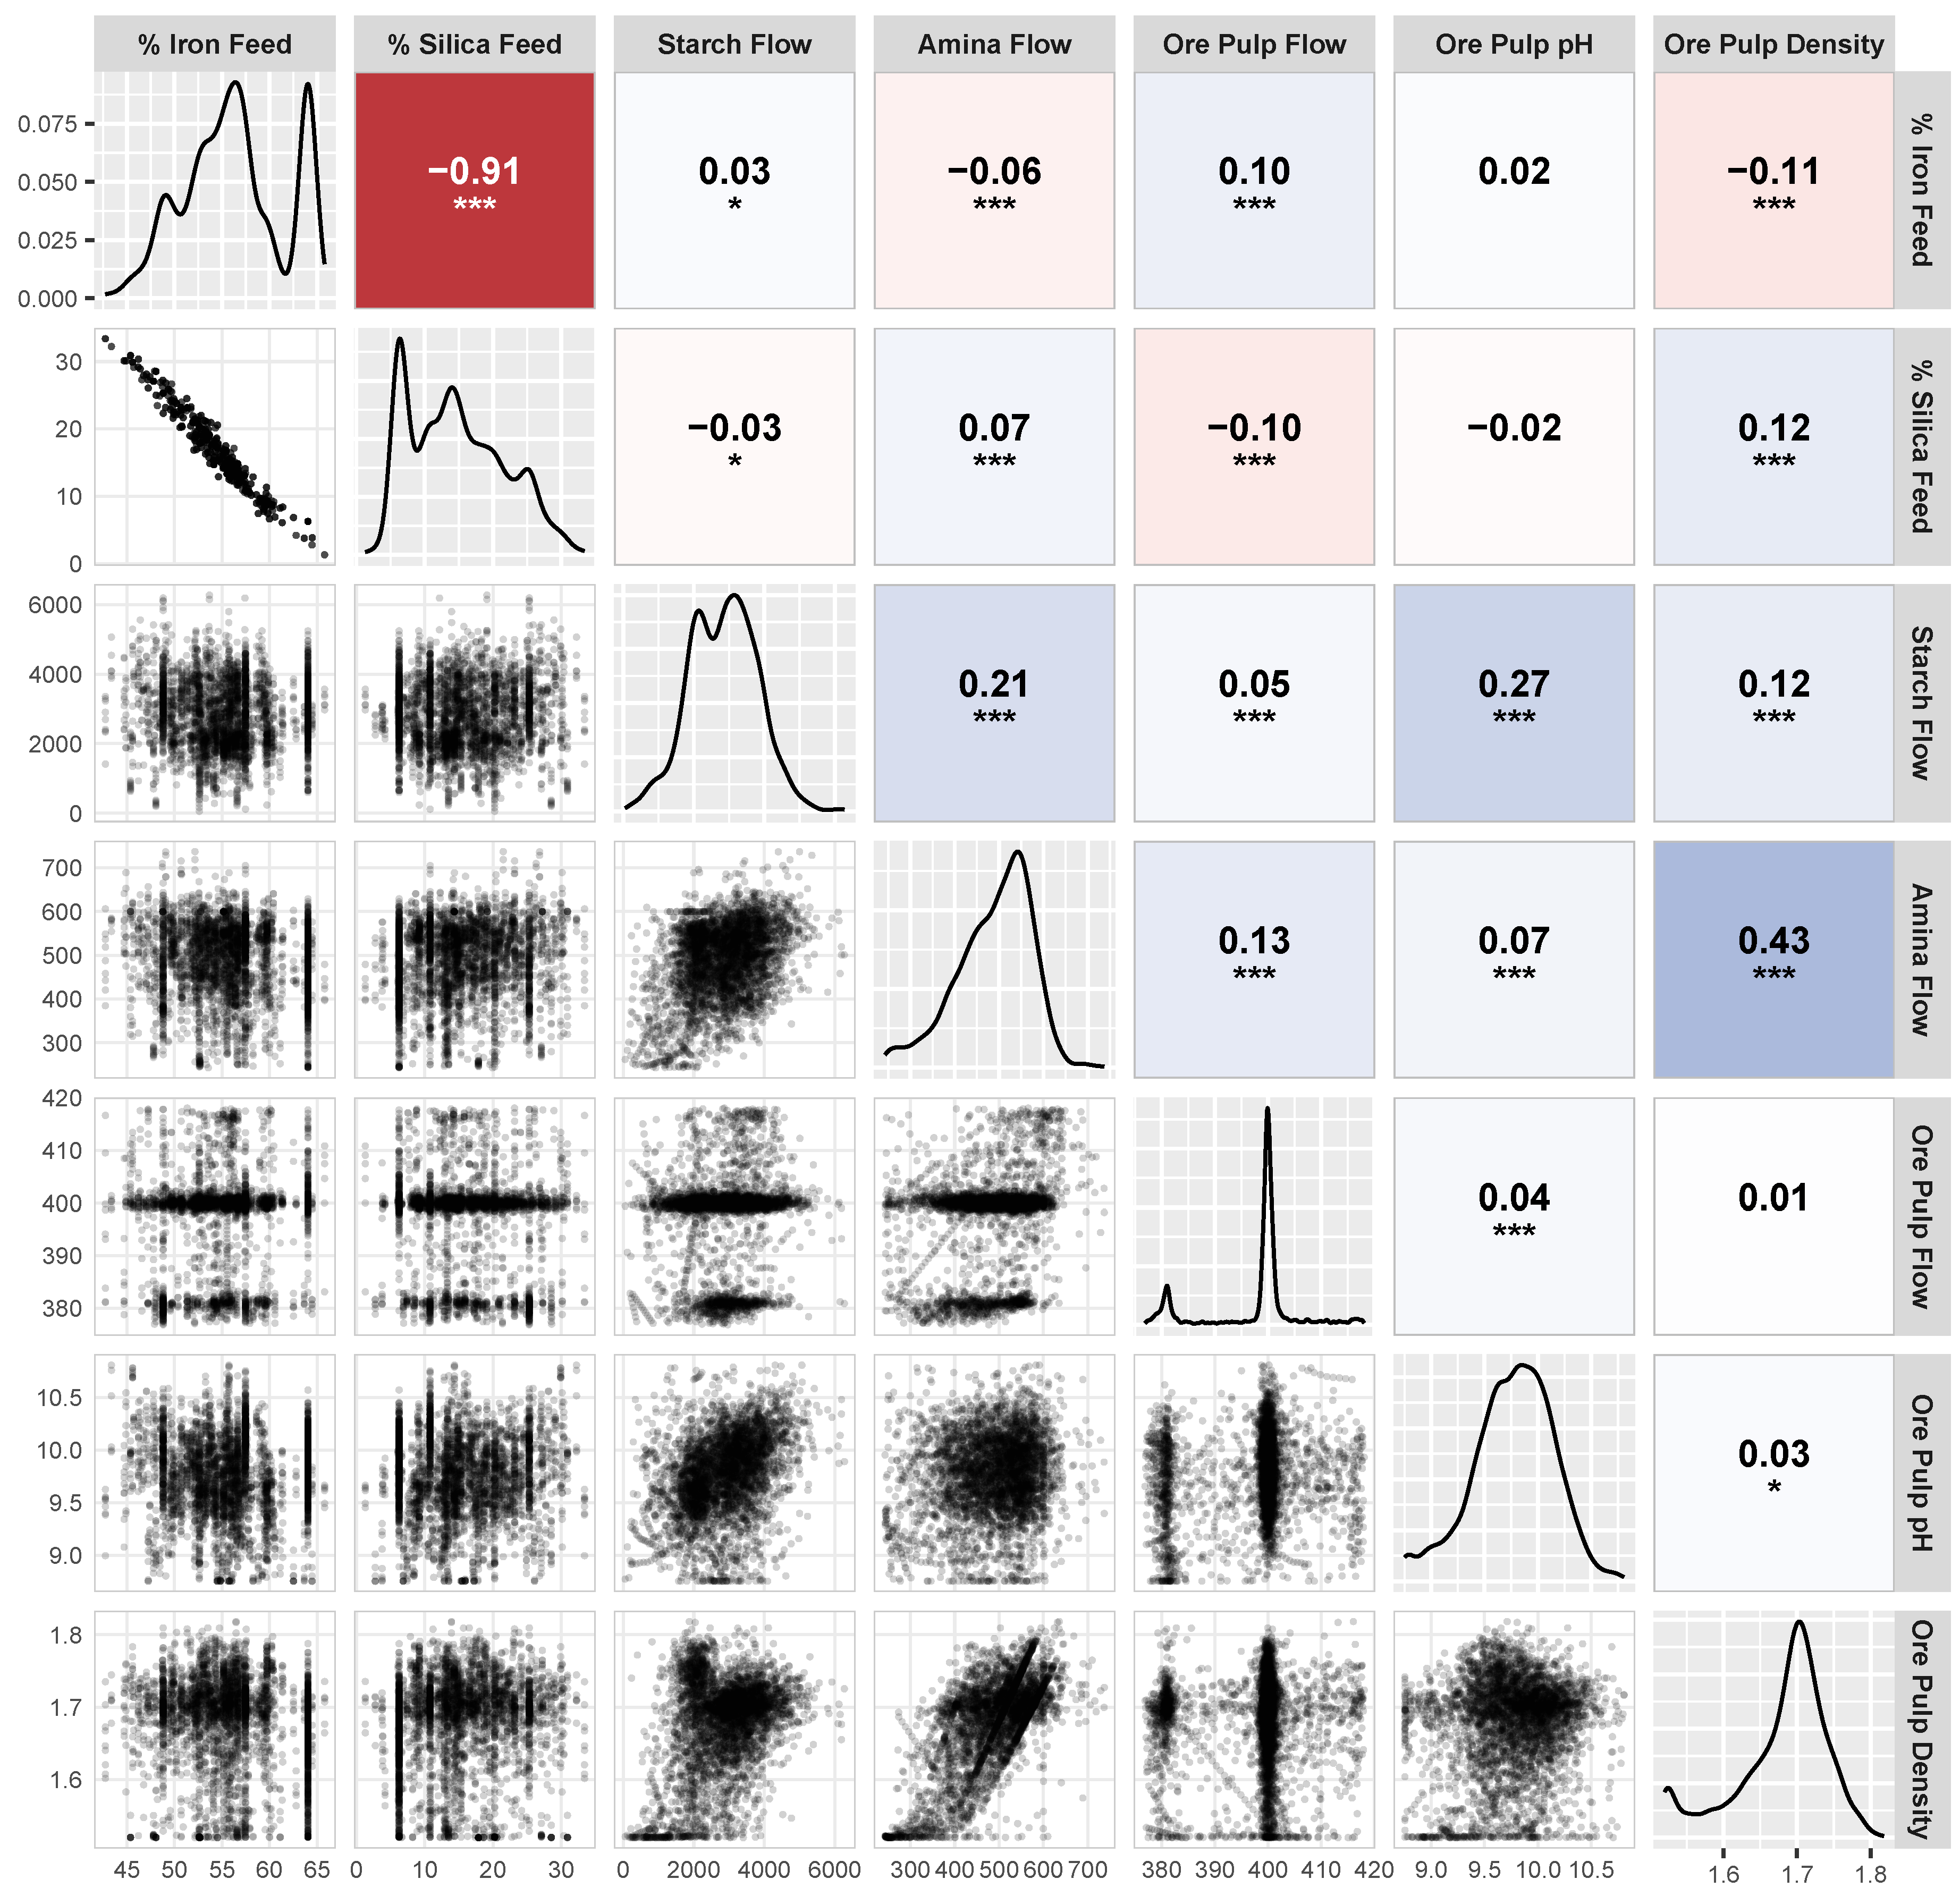
For the feed and pulp condition group, the Kendall correlation matrix is presented in Figure 2. Each subplot was generated separately for each process-variable group to visualize the variable distributions and pairwise contemporaneous relationships. In each matrix, the lower triangle contains scatter plots for individual variable pairs, whereas the upper triangle reports the corresponding Kendall correlation coefficients and significance levels. The background color indicates the direction and magnitude of the association: warm colors represent negative associations, cool colors represent positive associations, and colors approaching white indicate weak associations. The color intensity increases with the absolute magnitude of the correlation coefficient. The diagonal panels display the marginal distribution of each variable. Statistical significance is denoted by asterisks, where ***, **, and * correspond to Holm-adjusted (p)-values below 0.001, 0.01, and 0.05, respectively. Among all variable pairs, iron feed grade and silica feed grade exhibit the strongest contemporaneous association, with a Kendall correlation coefficient of . This strong negative association reflects the compositional characteristics of the ore feed, whereby an increase in iron grade is generally accompanied by a decrease in silica grade. In contrast, the remaining variables, including reagent dosages and pulp conditions, show only weak to moderate contemporaneous associations with the feed-grade variables and with one another. This suggests that their operating levels are not determined by feed composition alone, but may reflect the combined effects of multiple process conditions and operational adjustments. For example, although starch and amina perform different functions in the flotation separation process, their dosage patterns cannot be explained solely by variations in iron and silica feed grades. Instead, their changes may also depend on pulp properties, operating objectives, and the prevailing process state. These results indicate that simple pairwise correlations are insufficient to fully characterize how individual operating variables are related to concentrate quality, motivating further analysis of condition-dependent interactions and temporal dependencies.
Figure 2.
Contemporaneous relationships among feed and pulp condition variables. Other than the strong negative correlation between iron and silica feed grades, no other strong correlations were observed. Statistical significance is indicated by asterisks, where ***, **, and * denote Holm-adjusted p-values of p < 0.001, p < 0.01, and p < 0.05, respectively.
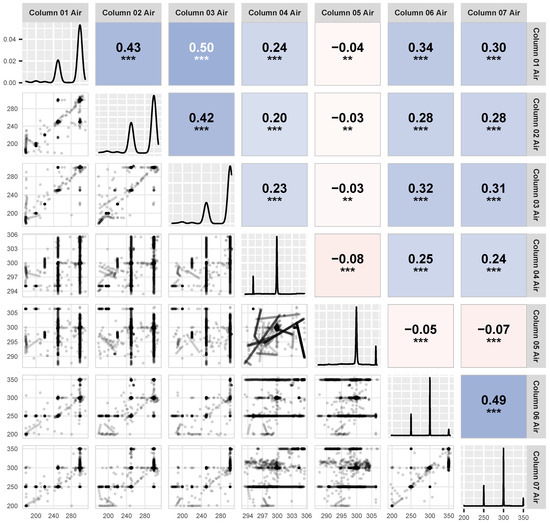
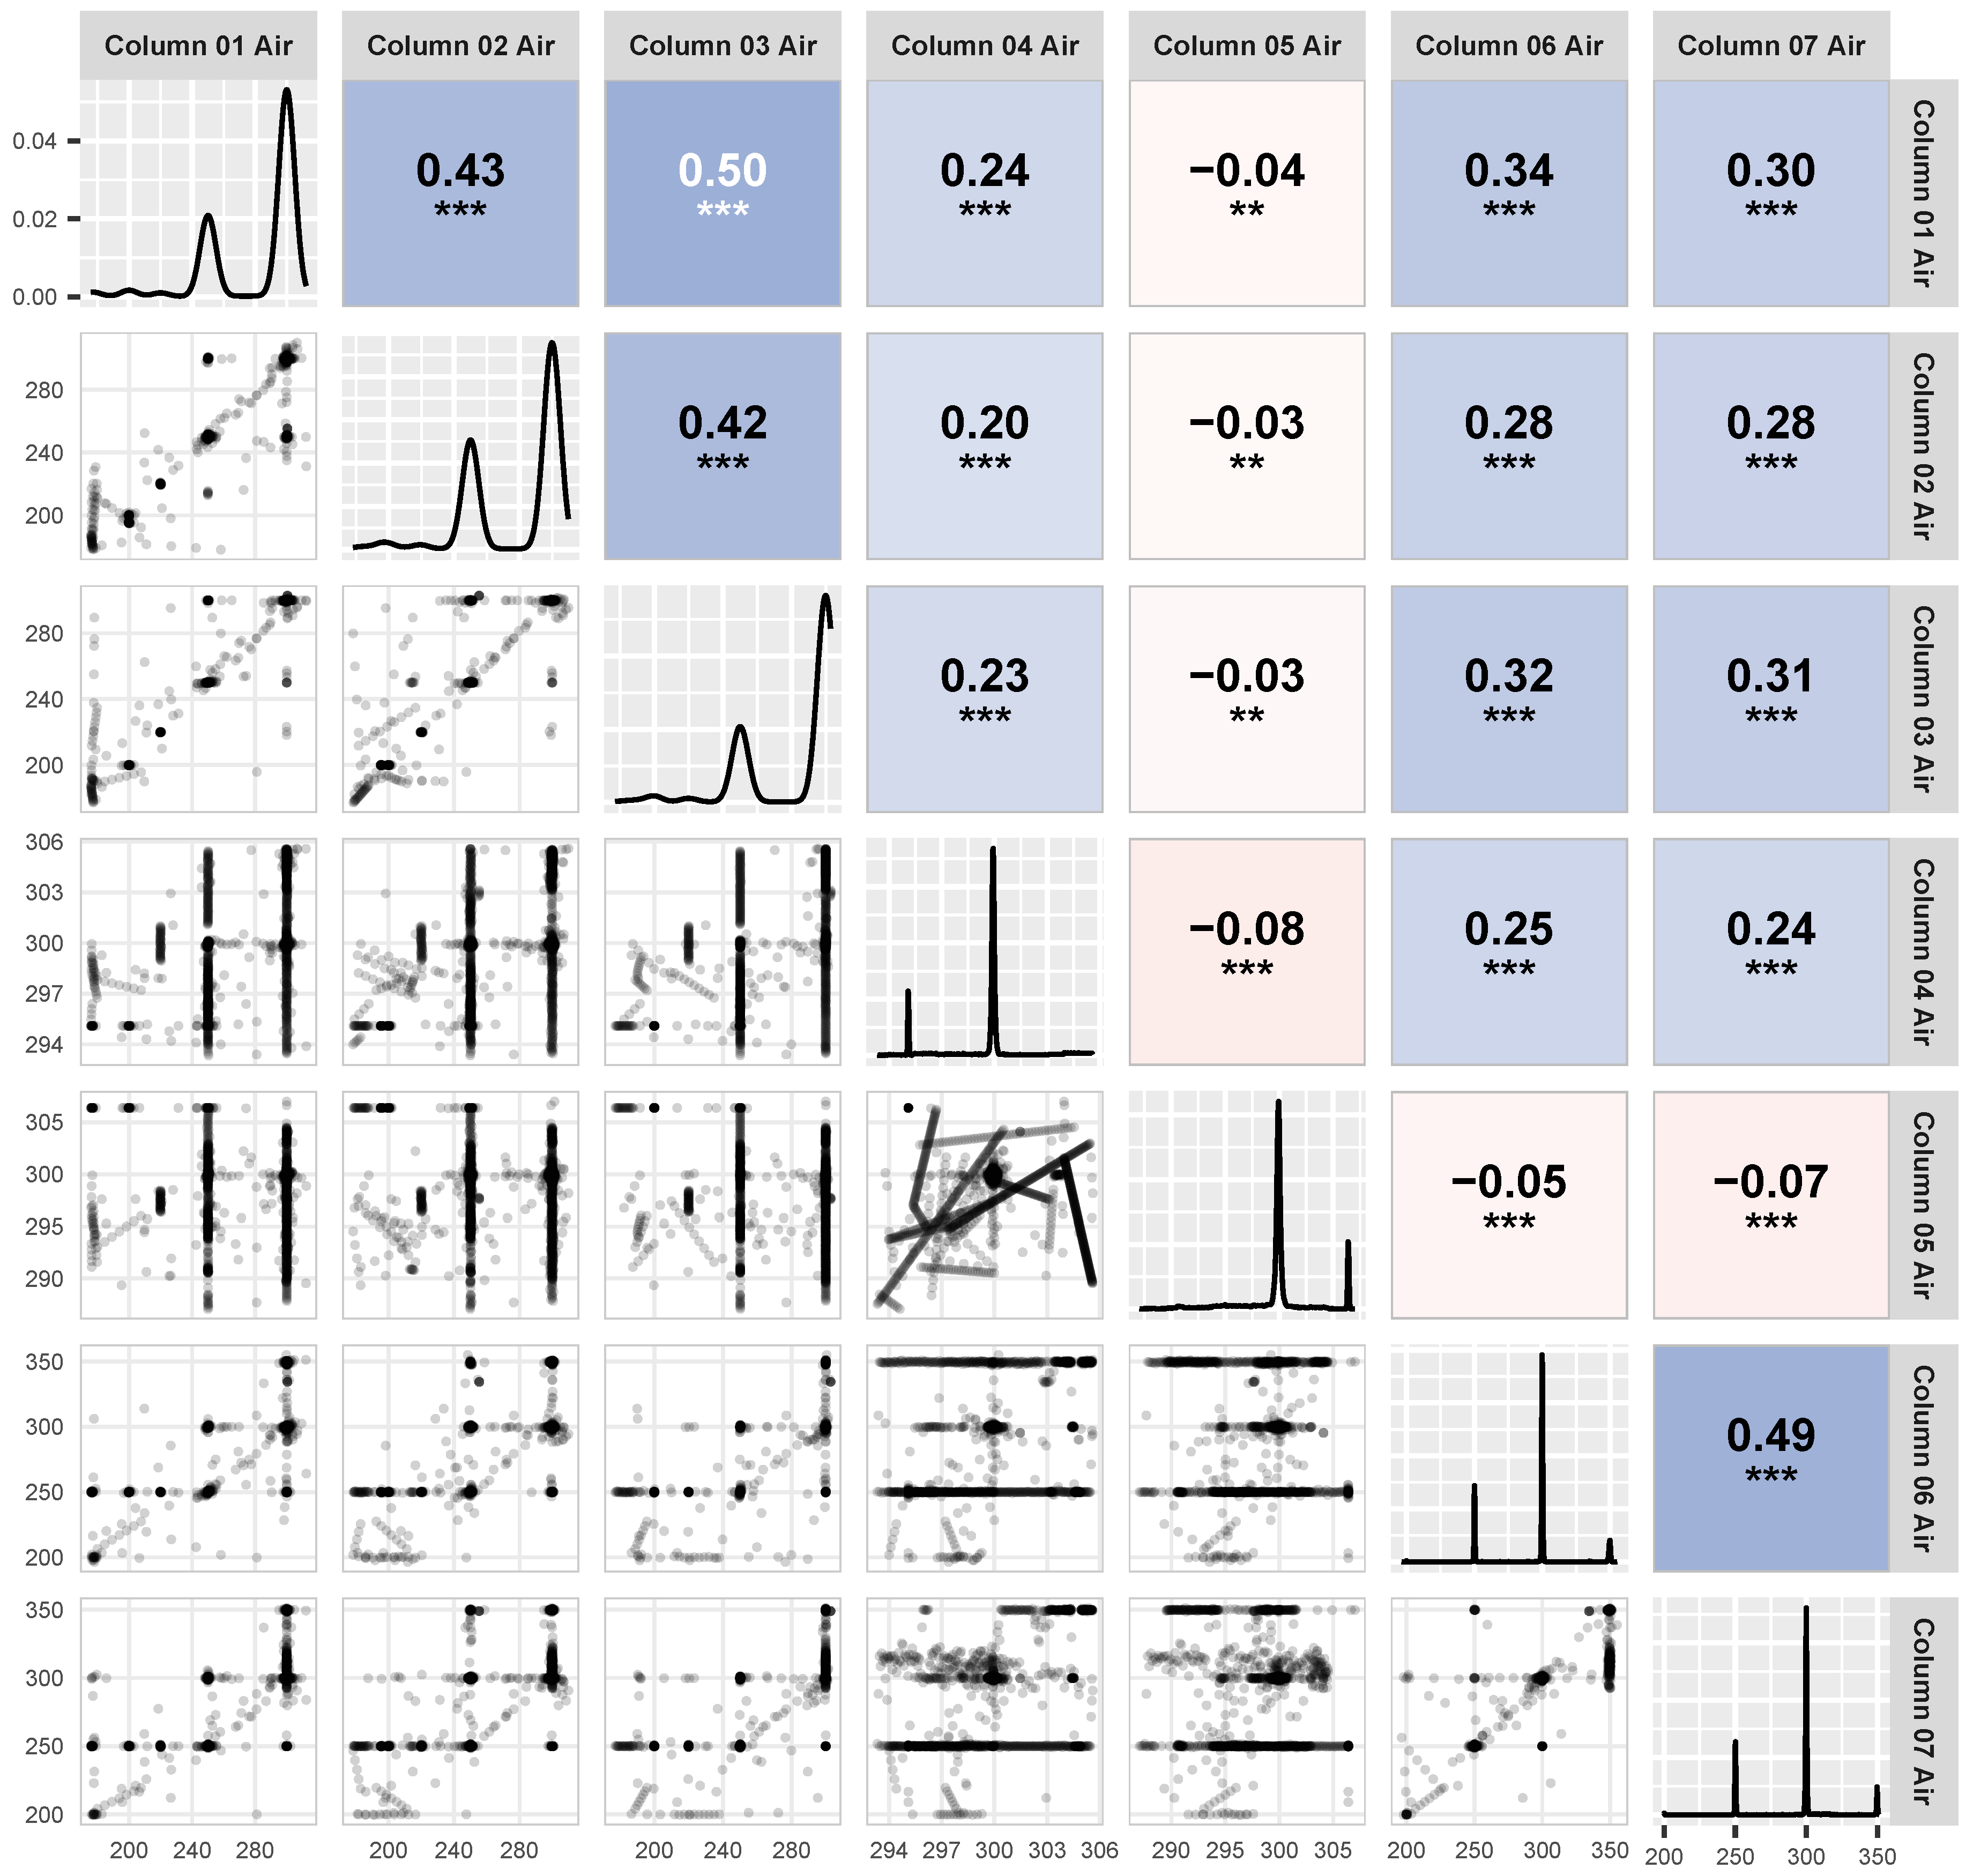
For the flotation-column air-flow group, the Kendall correlation matrix is presented in Figure 3. The air-flow variables generally exhibit positive contemporaneous associations across the flotation columns, and most column pairs show statistically significant positive correlations of moderate magnitude. This overall pattern suggests that the air-flow settings partly follow coordinated operating adjustments within the flotation circuit. In contrast, the air flow of Flotation Column 05 is significantly negatively correlated with those of the other columns, indicating that this column may follow a distinct operating pattern. This difference may be related to its specific position, function, or control strategy within the flotation circuit. Nevertheless, the correlations among the remaining columns are not uniformly strong, suggesting that, despite a degree of coordinated operation, individual columns retain distinct operating behaviors according to their respective roles and local process conditions.
Figure 3.
Contemporaneous relationships among flotation-column air-flow variables. No strong correlations were observed, although the air flow in Column 05 exhibited a distinct correlation pattern compared with the other columns. Statistical significance is indicated by asterisks, where ***, **, and * denote Holm-adjusted p-values of p < 0.001, p < 0.01, and p < 0.05, respectively.
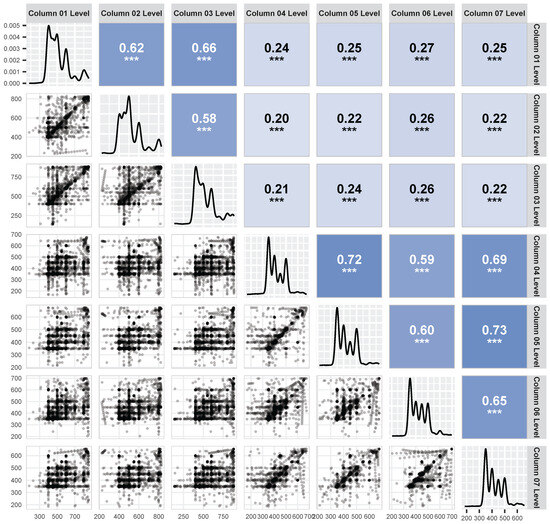
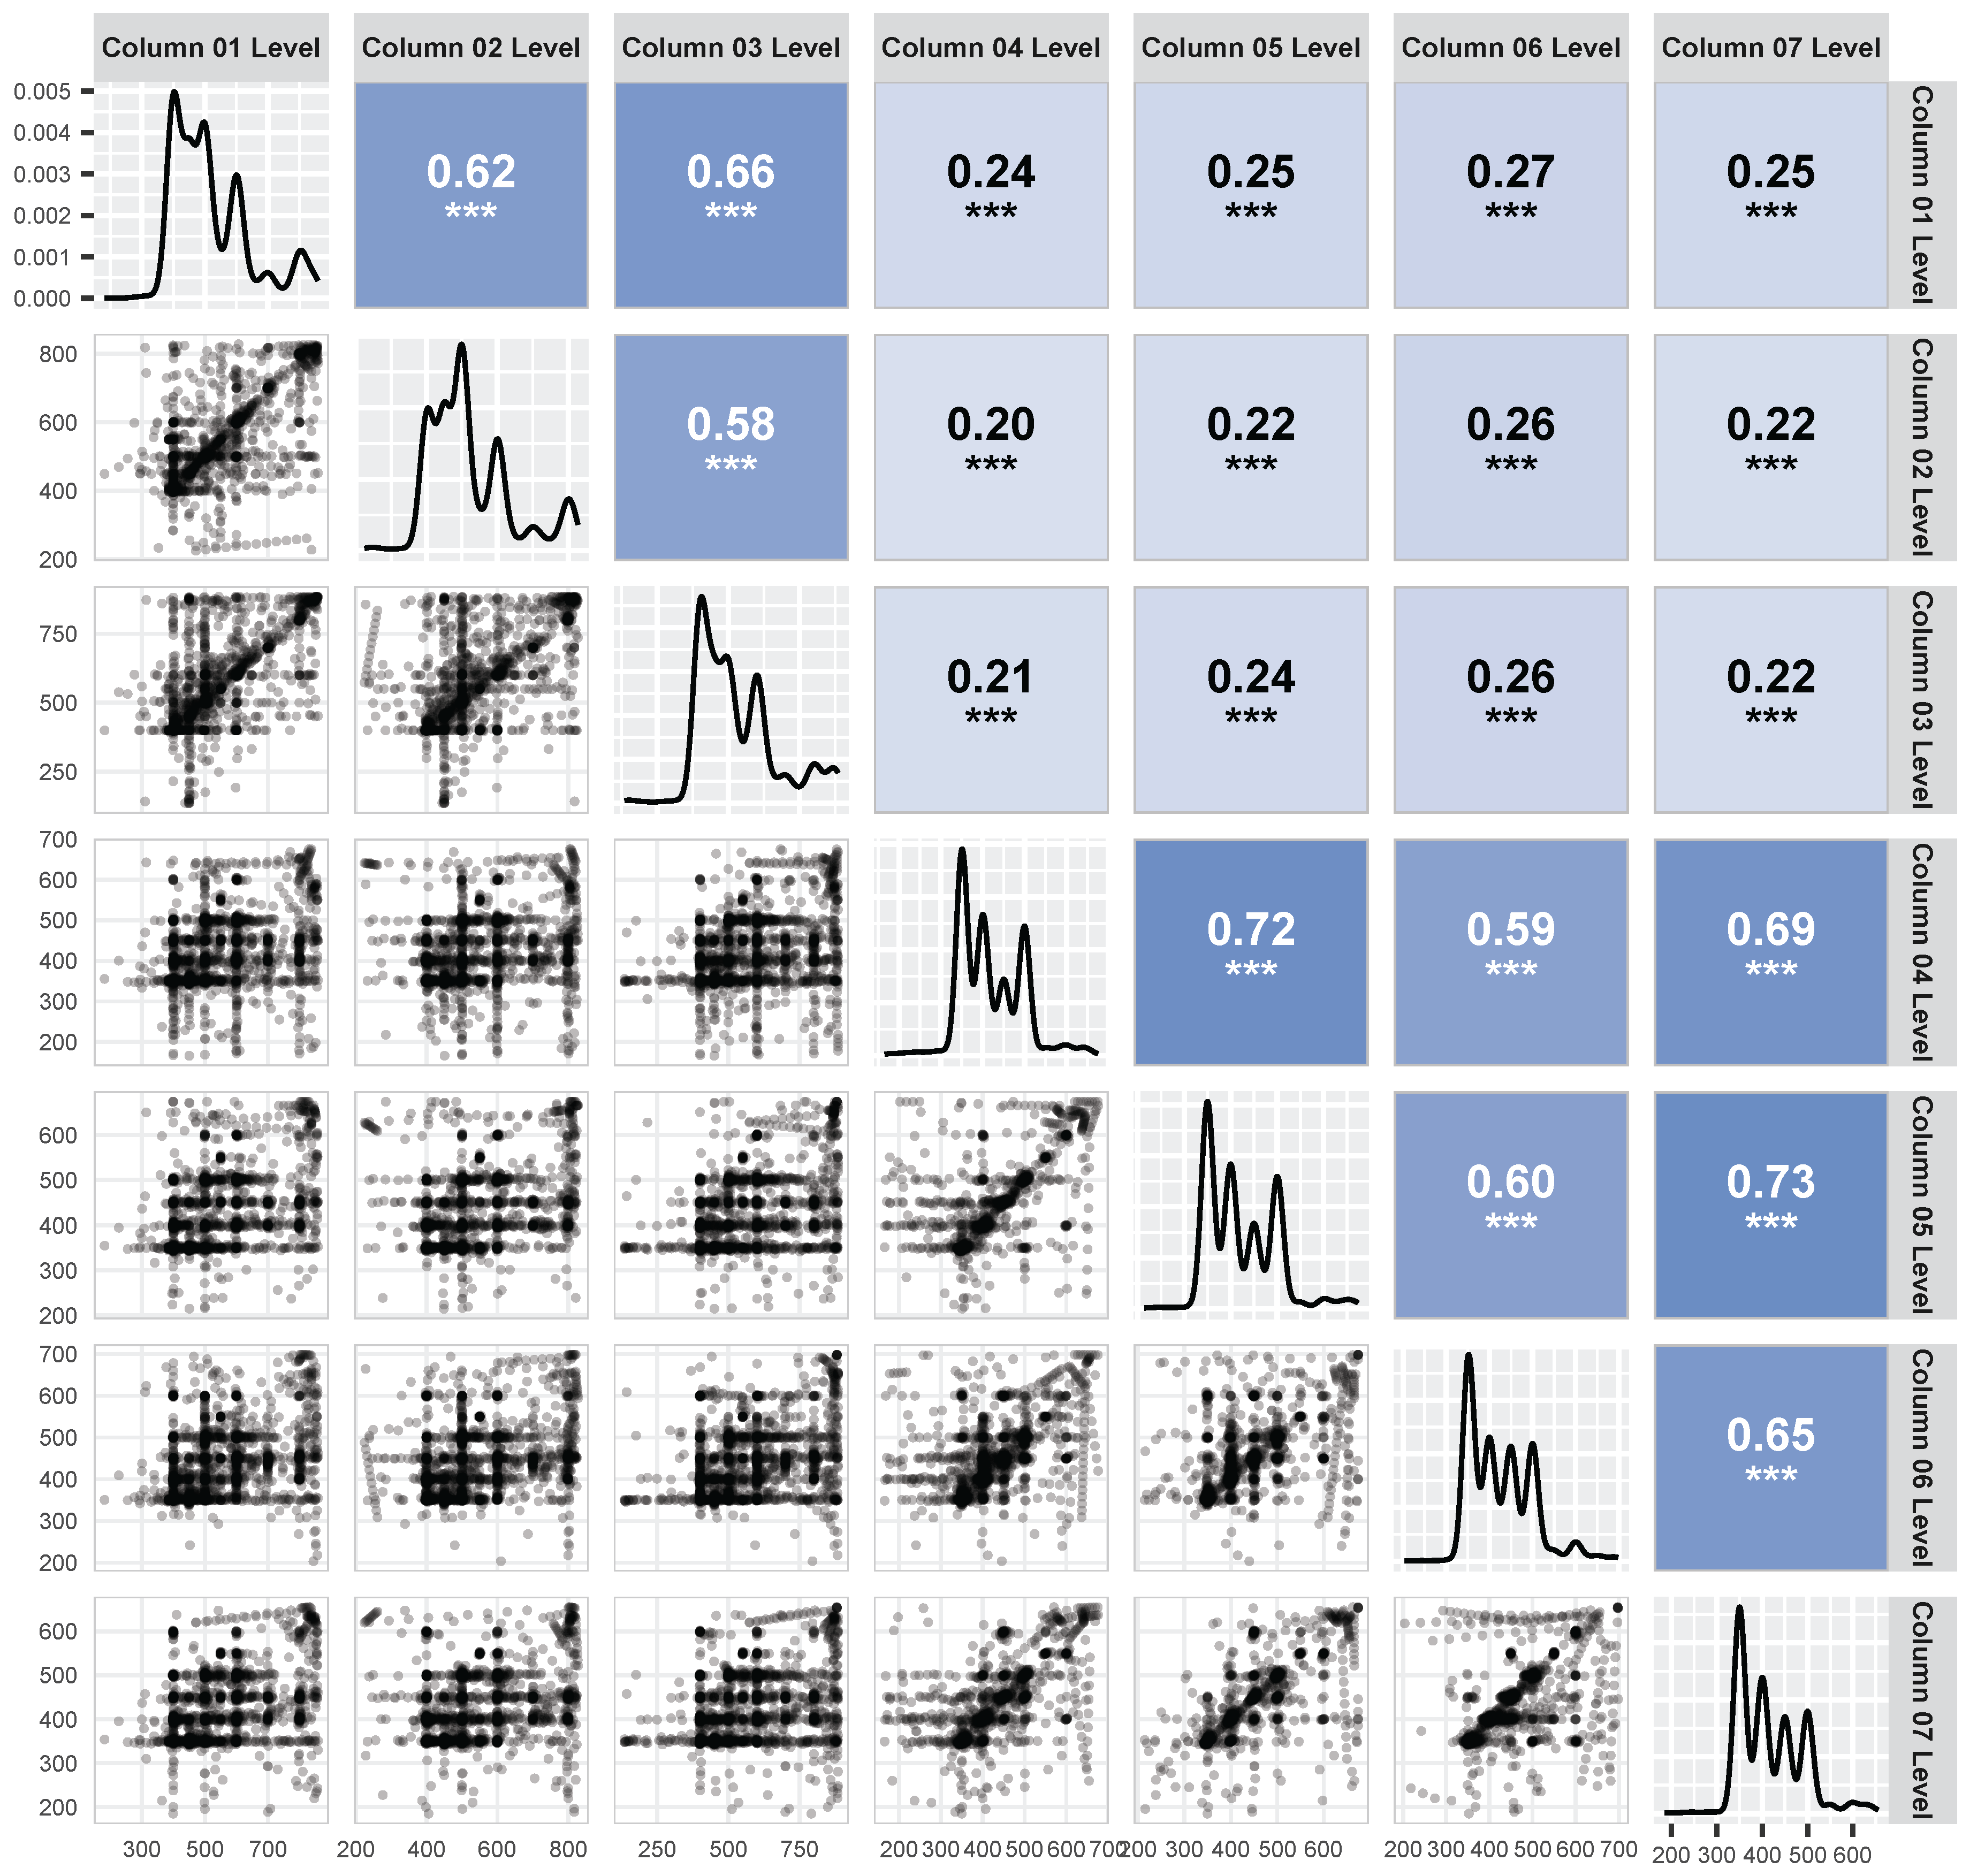
For the flotation-column level variables, the Kendall correlation results are presented in Figure 4. The stronger contemporaneous associations observed within specific groups of flotation columns are consistent with the hierarchical and interconnected structure of the flotation circuit. Flotation Columns 01–03 operate in parallel in the first stage, whereas Columns 04–06 form a subsequent processing stage that receives material from the upstream units. Flotation Column 07 serves as the final flotation unit and processes streams transferred from the preceding stages. The stronger within-group correlations may therefore reflect the effects of continuous material transfer, shared upstream disturbances, and coordinated level control among hydraulically connected units. The variation in correlation strength across different column pairs indicates that each column also retains distinct operating characteristics associated with its position and function within the flotation circuit.
Figure 4.
Contemporaneous relationships among flotation-column level variables. Strong within-group correlations were observed among Columns 01–03 and among Columns 04–07. Statistical significance is indicated by asterisks, where ***, **, and * denote Holm-adjusted p-values of p < 0.001, p < 0.01, and p < 0.05, respectively.
In summary, the currently recorded variables may not fully characterize the underlying complex flotation process. For example, particle-size-related information, such as particle-size distribution and liberation characteristics, is unavailable. These factors are important because they directly affect flotation behavior, separation selectivity, and reagent requirements, and therefore influence both concentrate grade and operational decisions such as reagent dosage adjustment. However, information on equipment condition is not available. Without such information, it is difficult to determine whether observed differences among flotation columns reflect persistent equipment-specific characteristics or only temporary operating events. For example, the distinctive behavior observed for Column 05 cannot be conclusively attributed to its inherent operating condition or to a transient process disturbance. Consequently, the recorded variables provide only a partial representation of the actual operating state. Changes in unobserved material properties and equipment conditions may therefore appear in the data as time-varying relationships among the measured process variables and concentrate grades. These findings therefore motivate further analysis of condition-dependent interactions and temporal relationships.
3.2. Main and Interaction Effects on Concentrate Grades
After examining the contemporaneous relationships among the input variables, this subsection further investigates how the measured process variables are associated with the prediction of iron and silica concentrate grades. Because the predictive contribution of an individual variable may depend on the levels of other operating variables, interaction terms were incorporated into the LASSO regression models to identify condition-dependent relationships within the flotation process.
The least absolute shrinkage and selection operator (LASSO) is a regularized regression method that introduces an penalty on the model coefficients [26]. This penalty shrinks coefficients with limited predictive contribution toward zero and can set some coefficients exactly to zero, thereby enabling simultaneous model estimation and feature selection within a large candidate space. This property is particularly useful in the present analysis because the inclusion of high-order interactions causes the number of candidate terms to increase rapidly [27,28]. Separate LASSO models were therefore constructed for iron concentrate grade and silica concentrate grade to determine which main effects and interaction terms contributed to the prediction of each quality target.
Before generating the interaction terms, the predictor set was reduced because of the limited sample size and available degrees of freedom. First, % Silica Feed was removed because of its strong inverse association with % Iron Feed. Second, the level measurements of Flotation Columns 02–06 were removed because of their strong contemporaneous associations with the retained column-level variables. Third, the date variable was excluded because it represents the observation index rather than a measured process condition. Finally, % Iron Concentrate and % Silica Concentrate were used only as response variables and were therefore excluded from the predictor set. This screening retained 15 process variables. Main effects and interaction terms up to the fourth order were then generated to examine whether variable–grade relationships changed under different combinations of operating conditions.
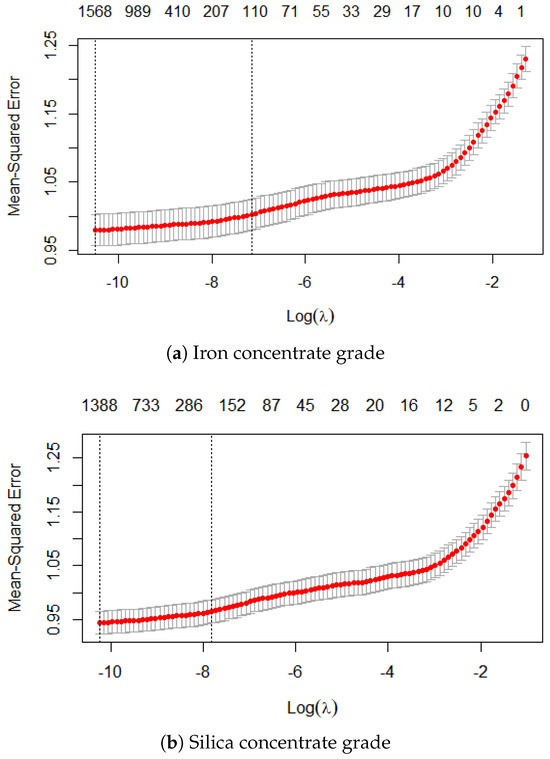
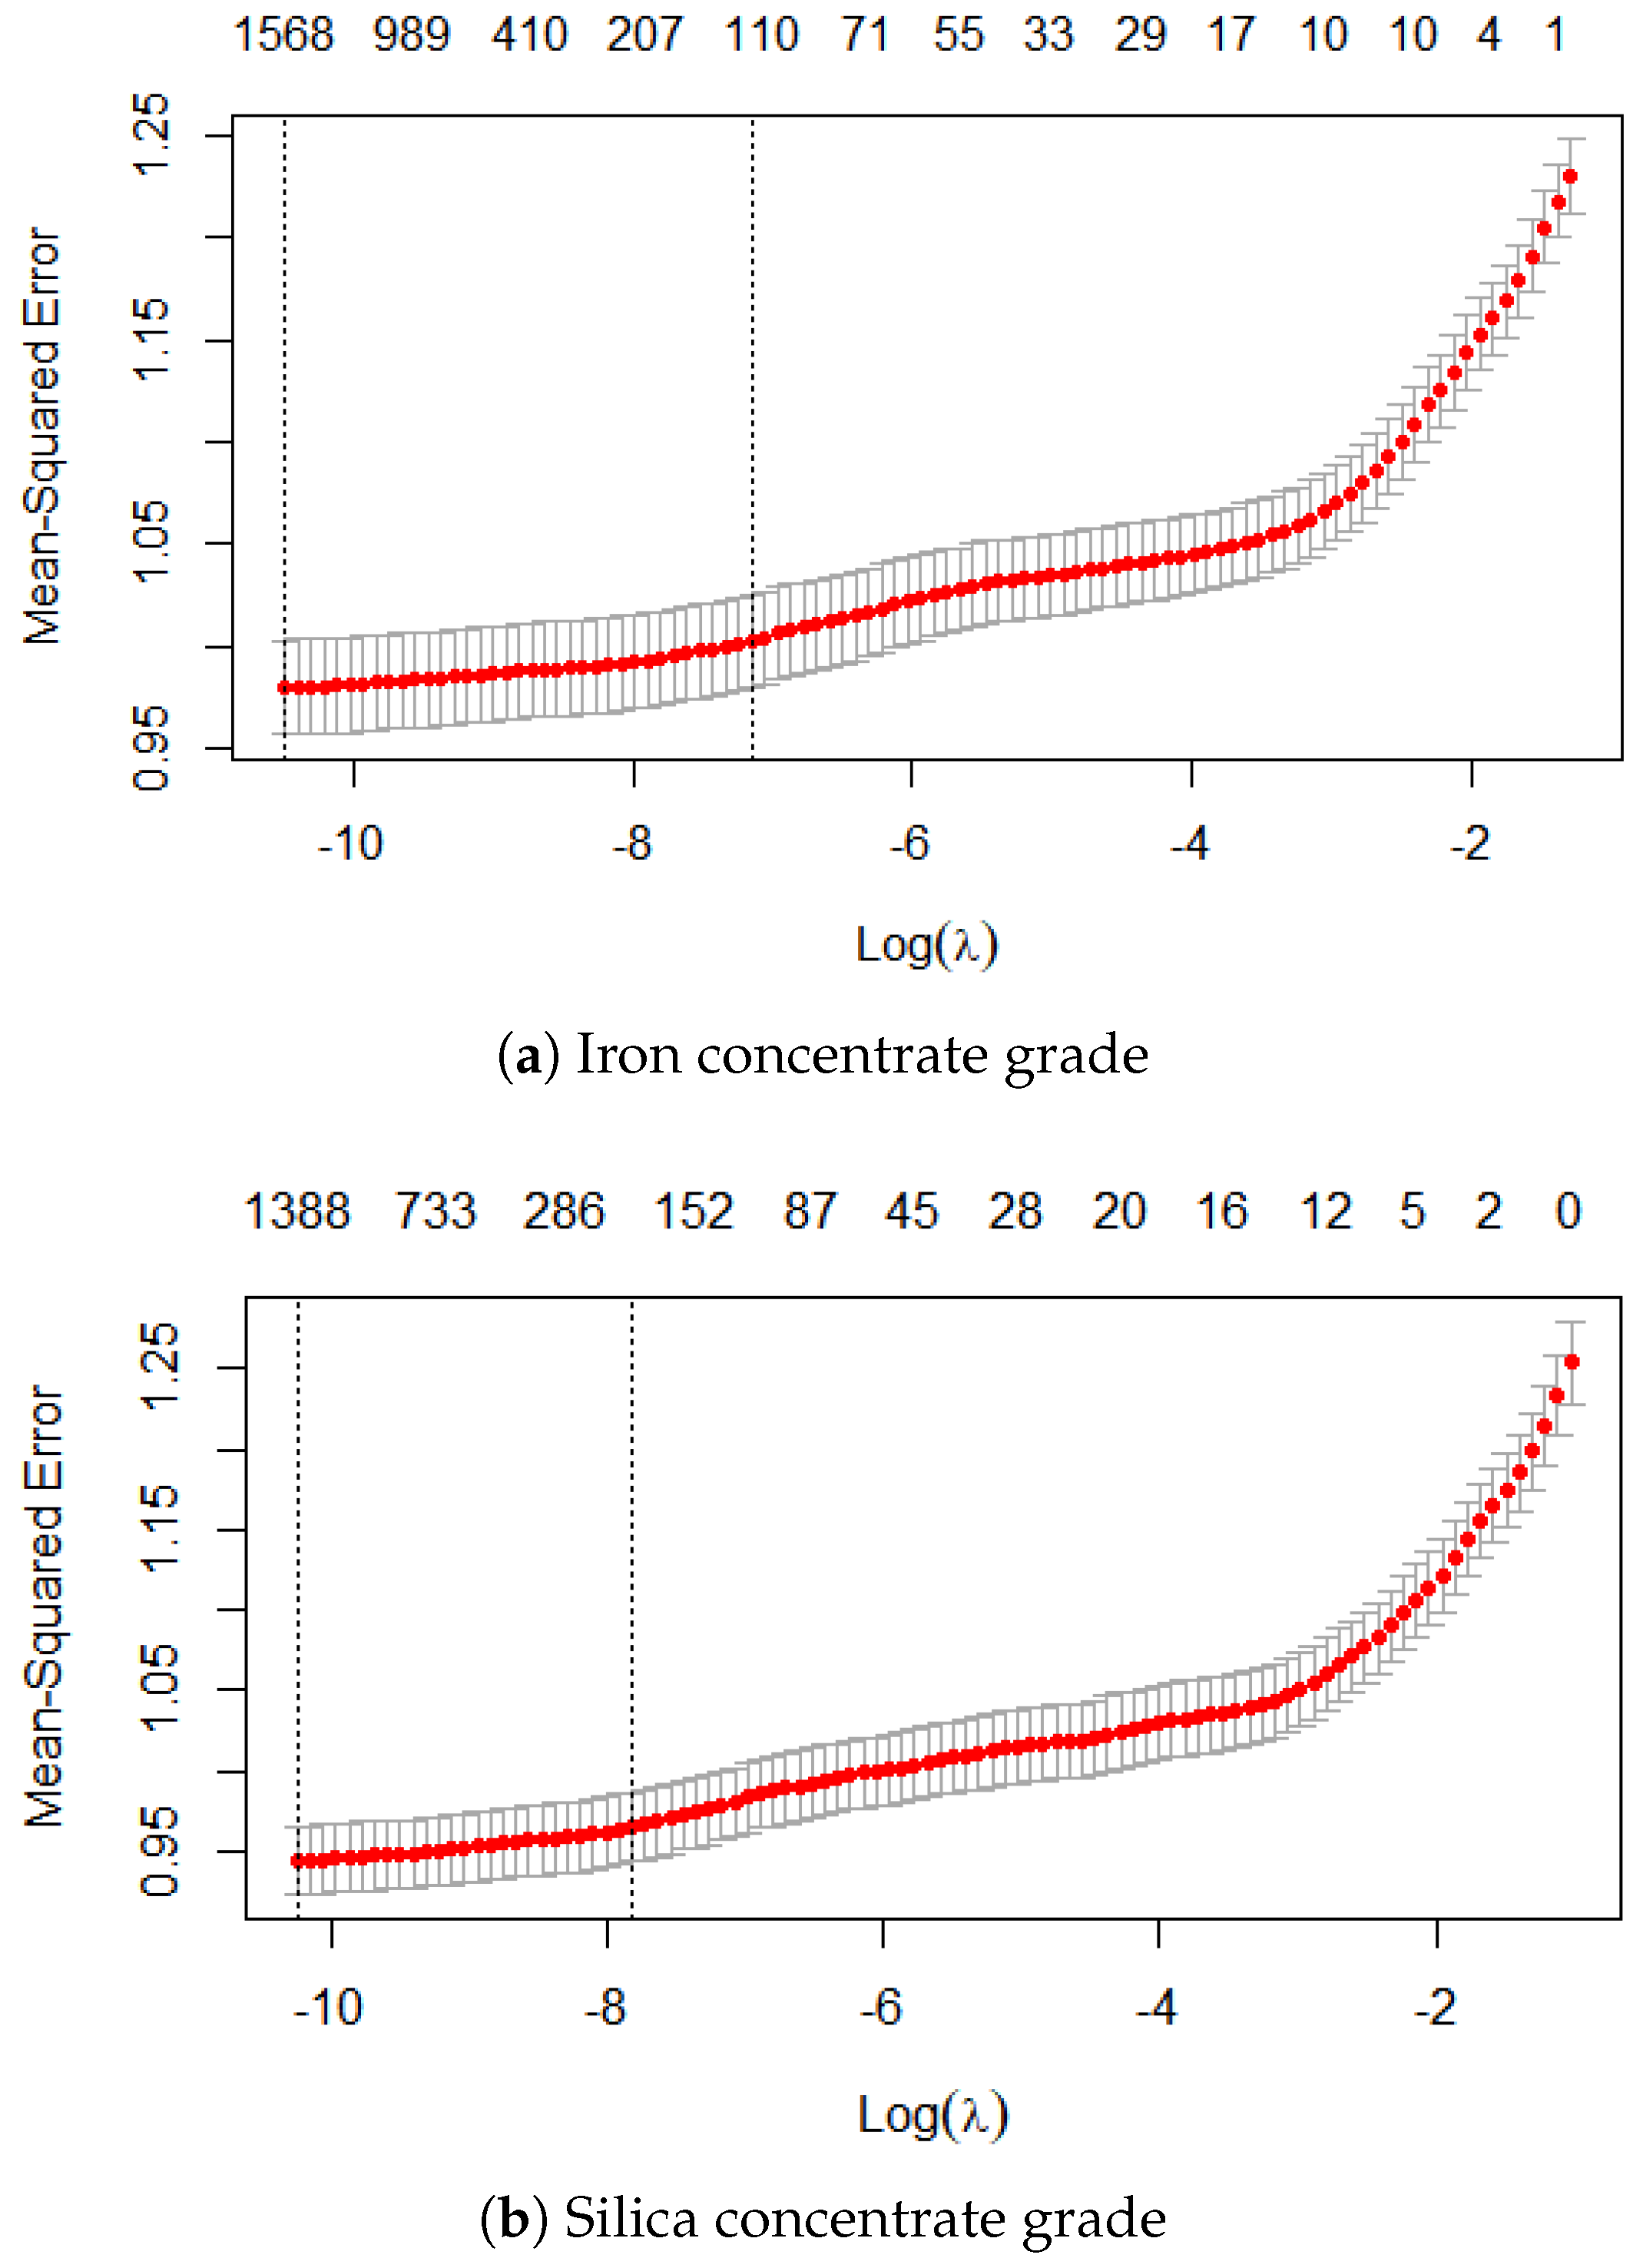
The regularization parameters for the iron and silica concentrate grade models were selected using cross-validation, as shown in Figure 5. The minimum cross-validation error for iron concentrate grade was obtained at , whereas the corresponding value for silica concentrate grade was . These values define the levels of coefficient shrinkage that achieved the best predictive performance along the candidate regularization paths. At the selected values of , the LASSO models retain the main effects and interaction terms that contribute to out-of-sample prediction while shrinking less informative terms toward zero. The selected models therefore provide a data-driven balance between predictive information retention and model sparsity for the subsequent analysis of main and interaction effects.
Figure 5.
Cross-validation curves used to select the LASSO regularization parameters for (a) iron concentrate grade, with a selected value of , and (b) silica concentrate grade, with a selected value of .
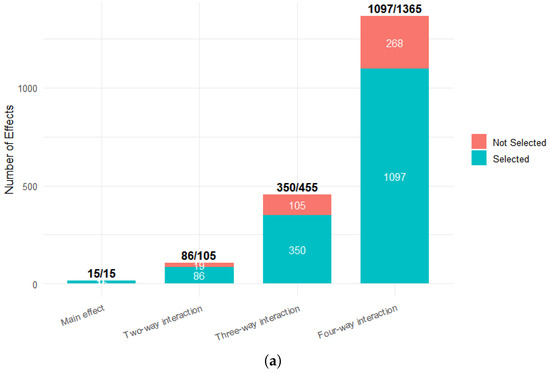
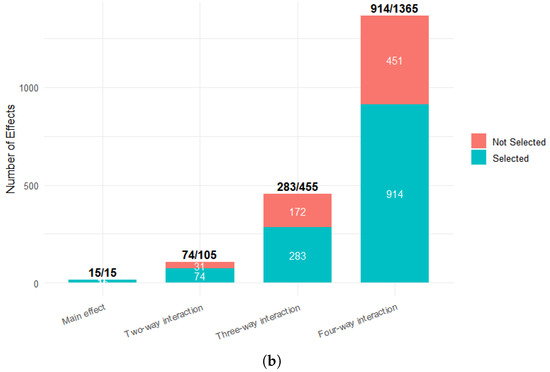
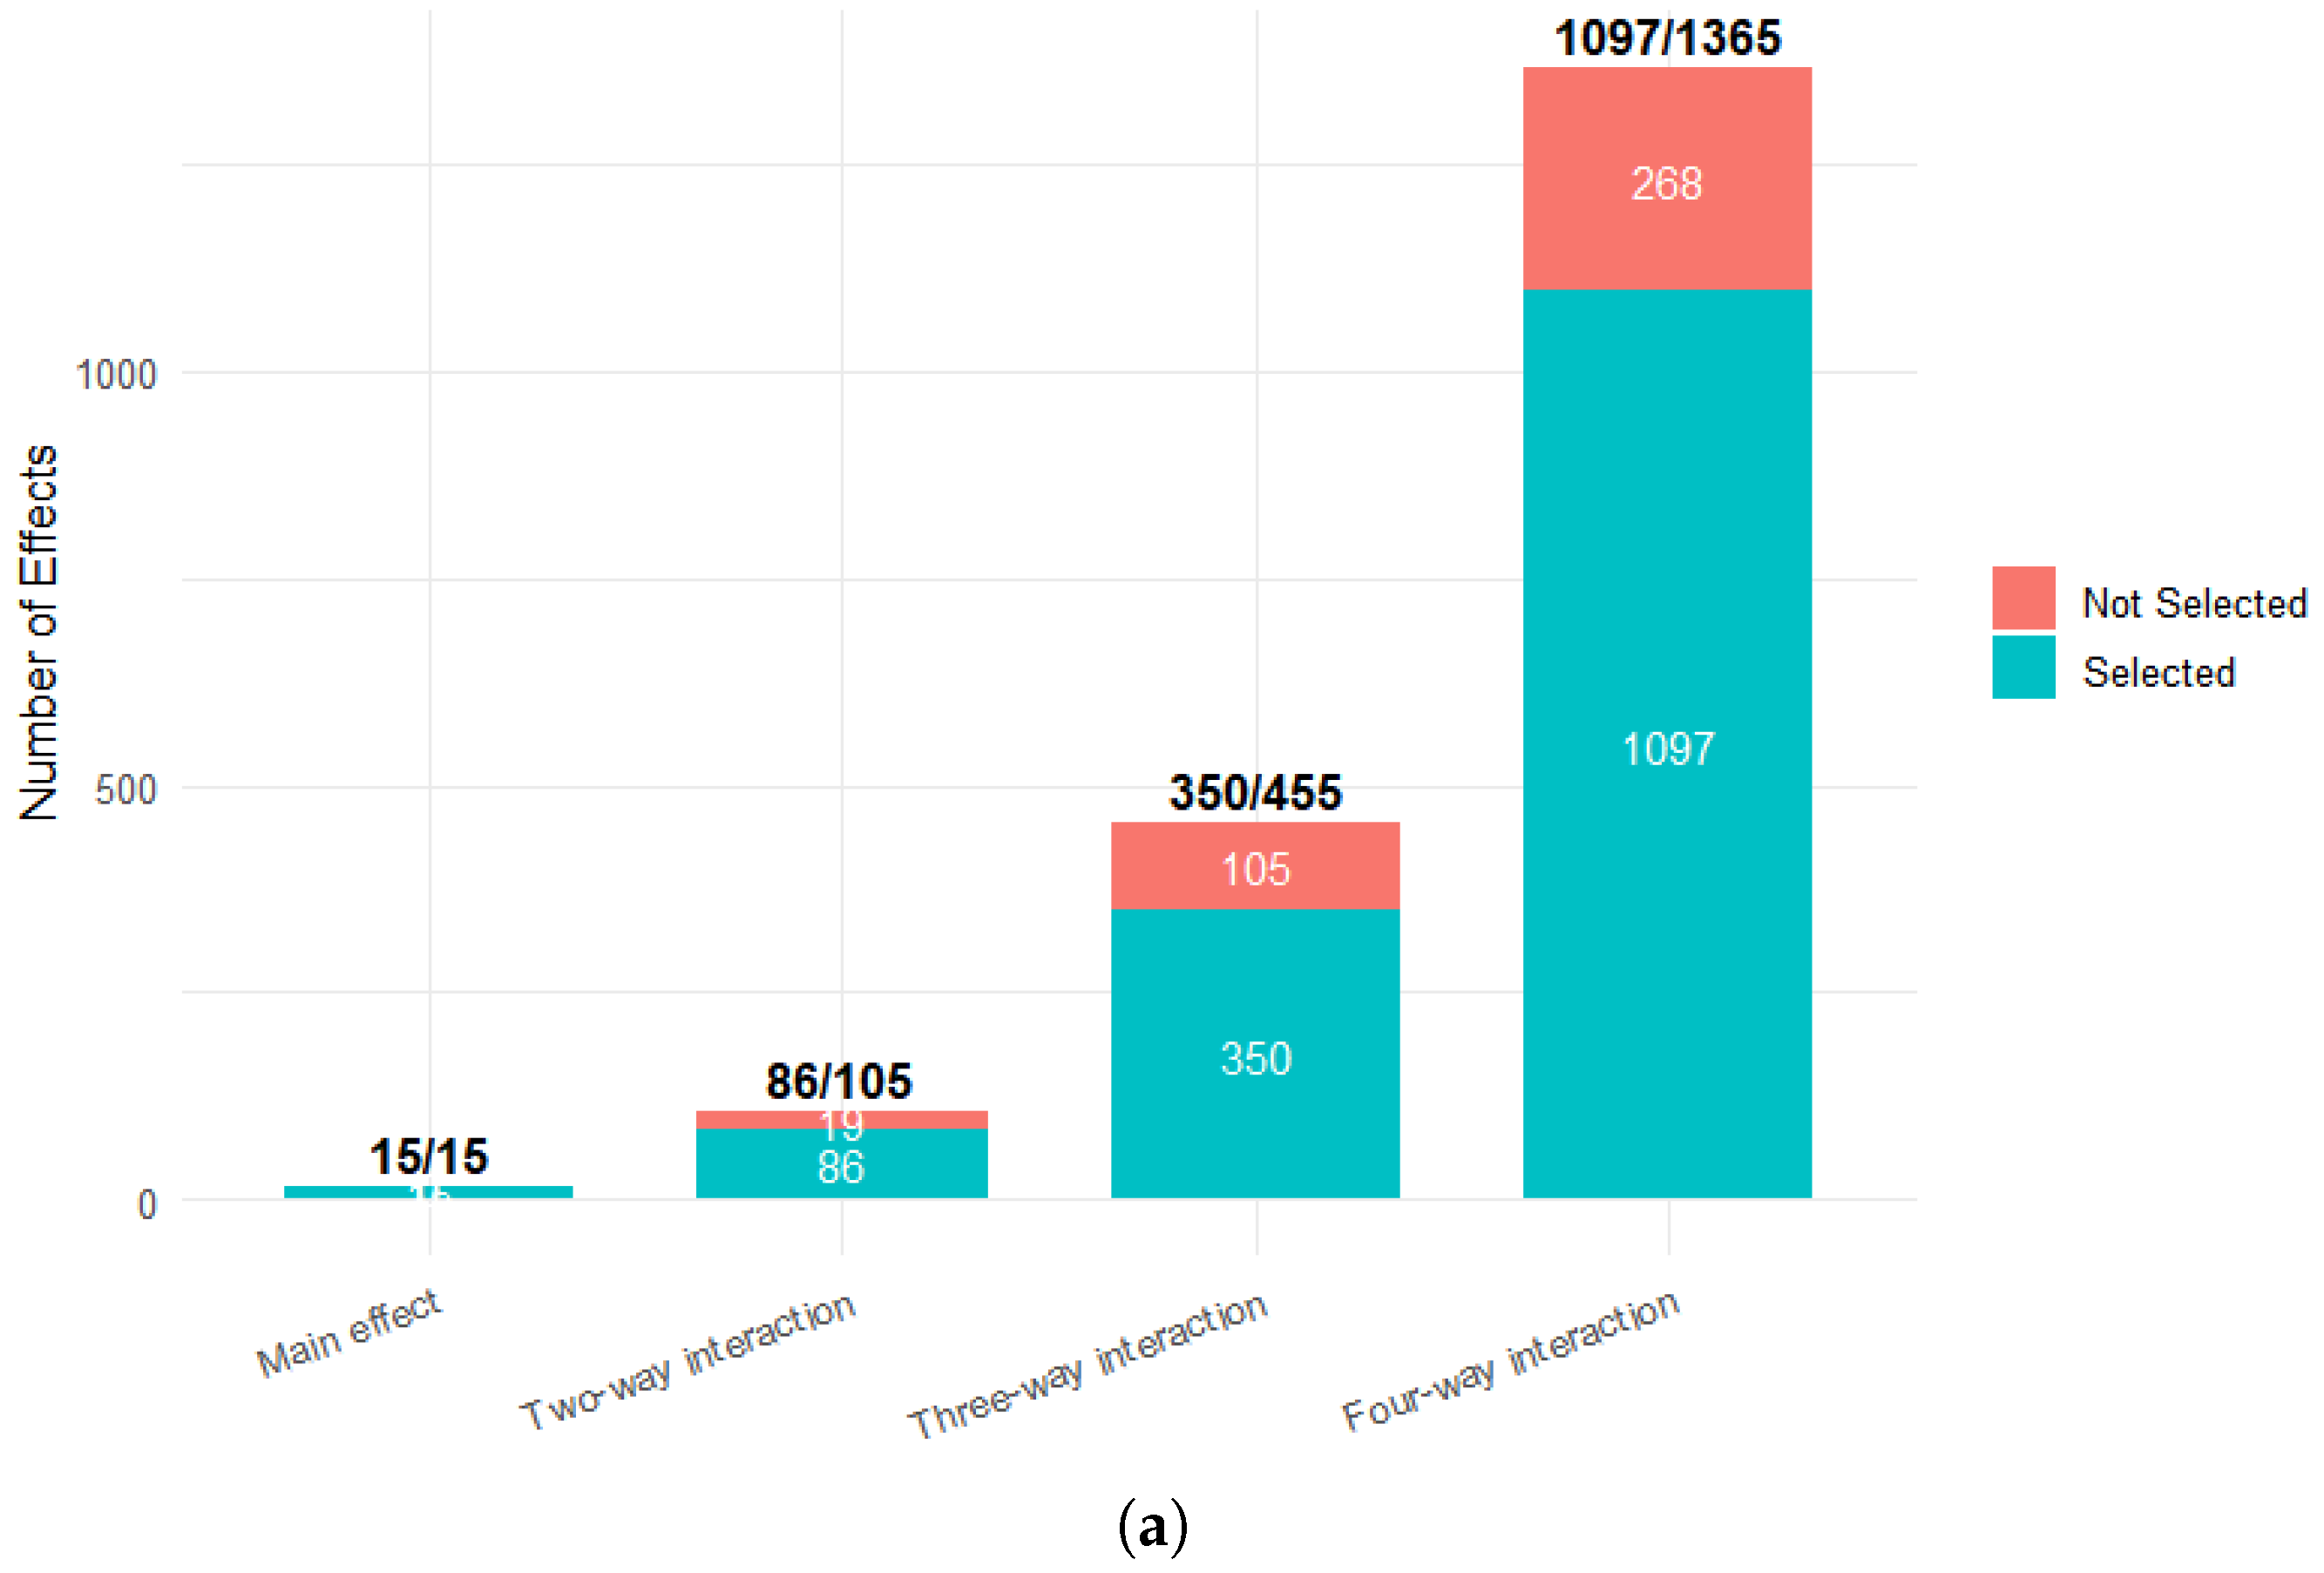
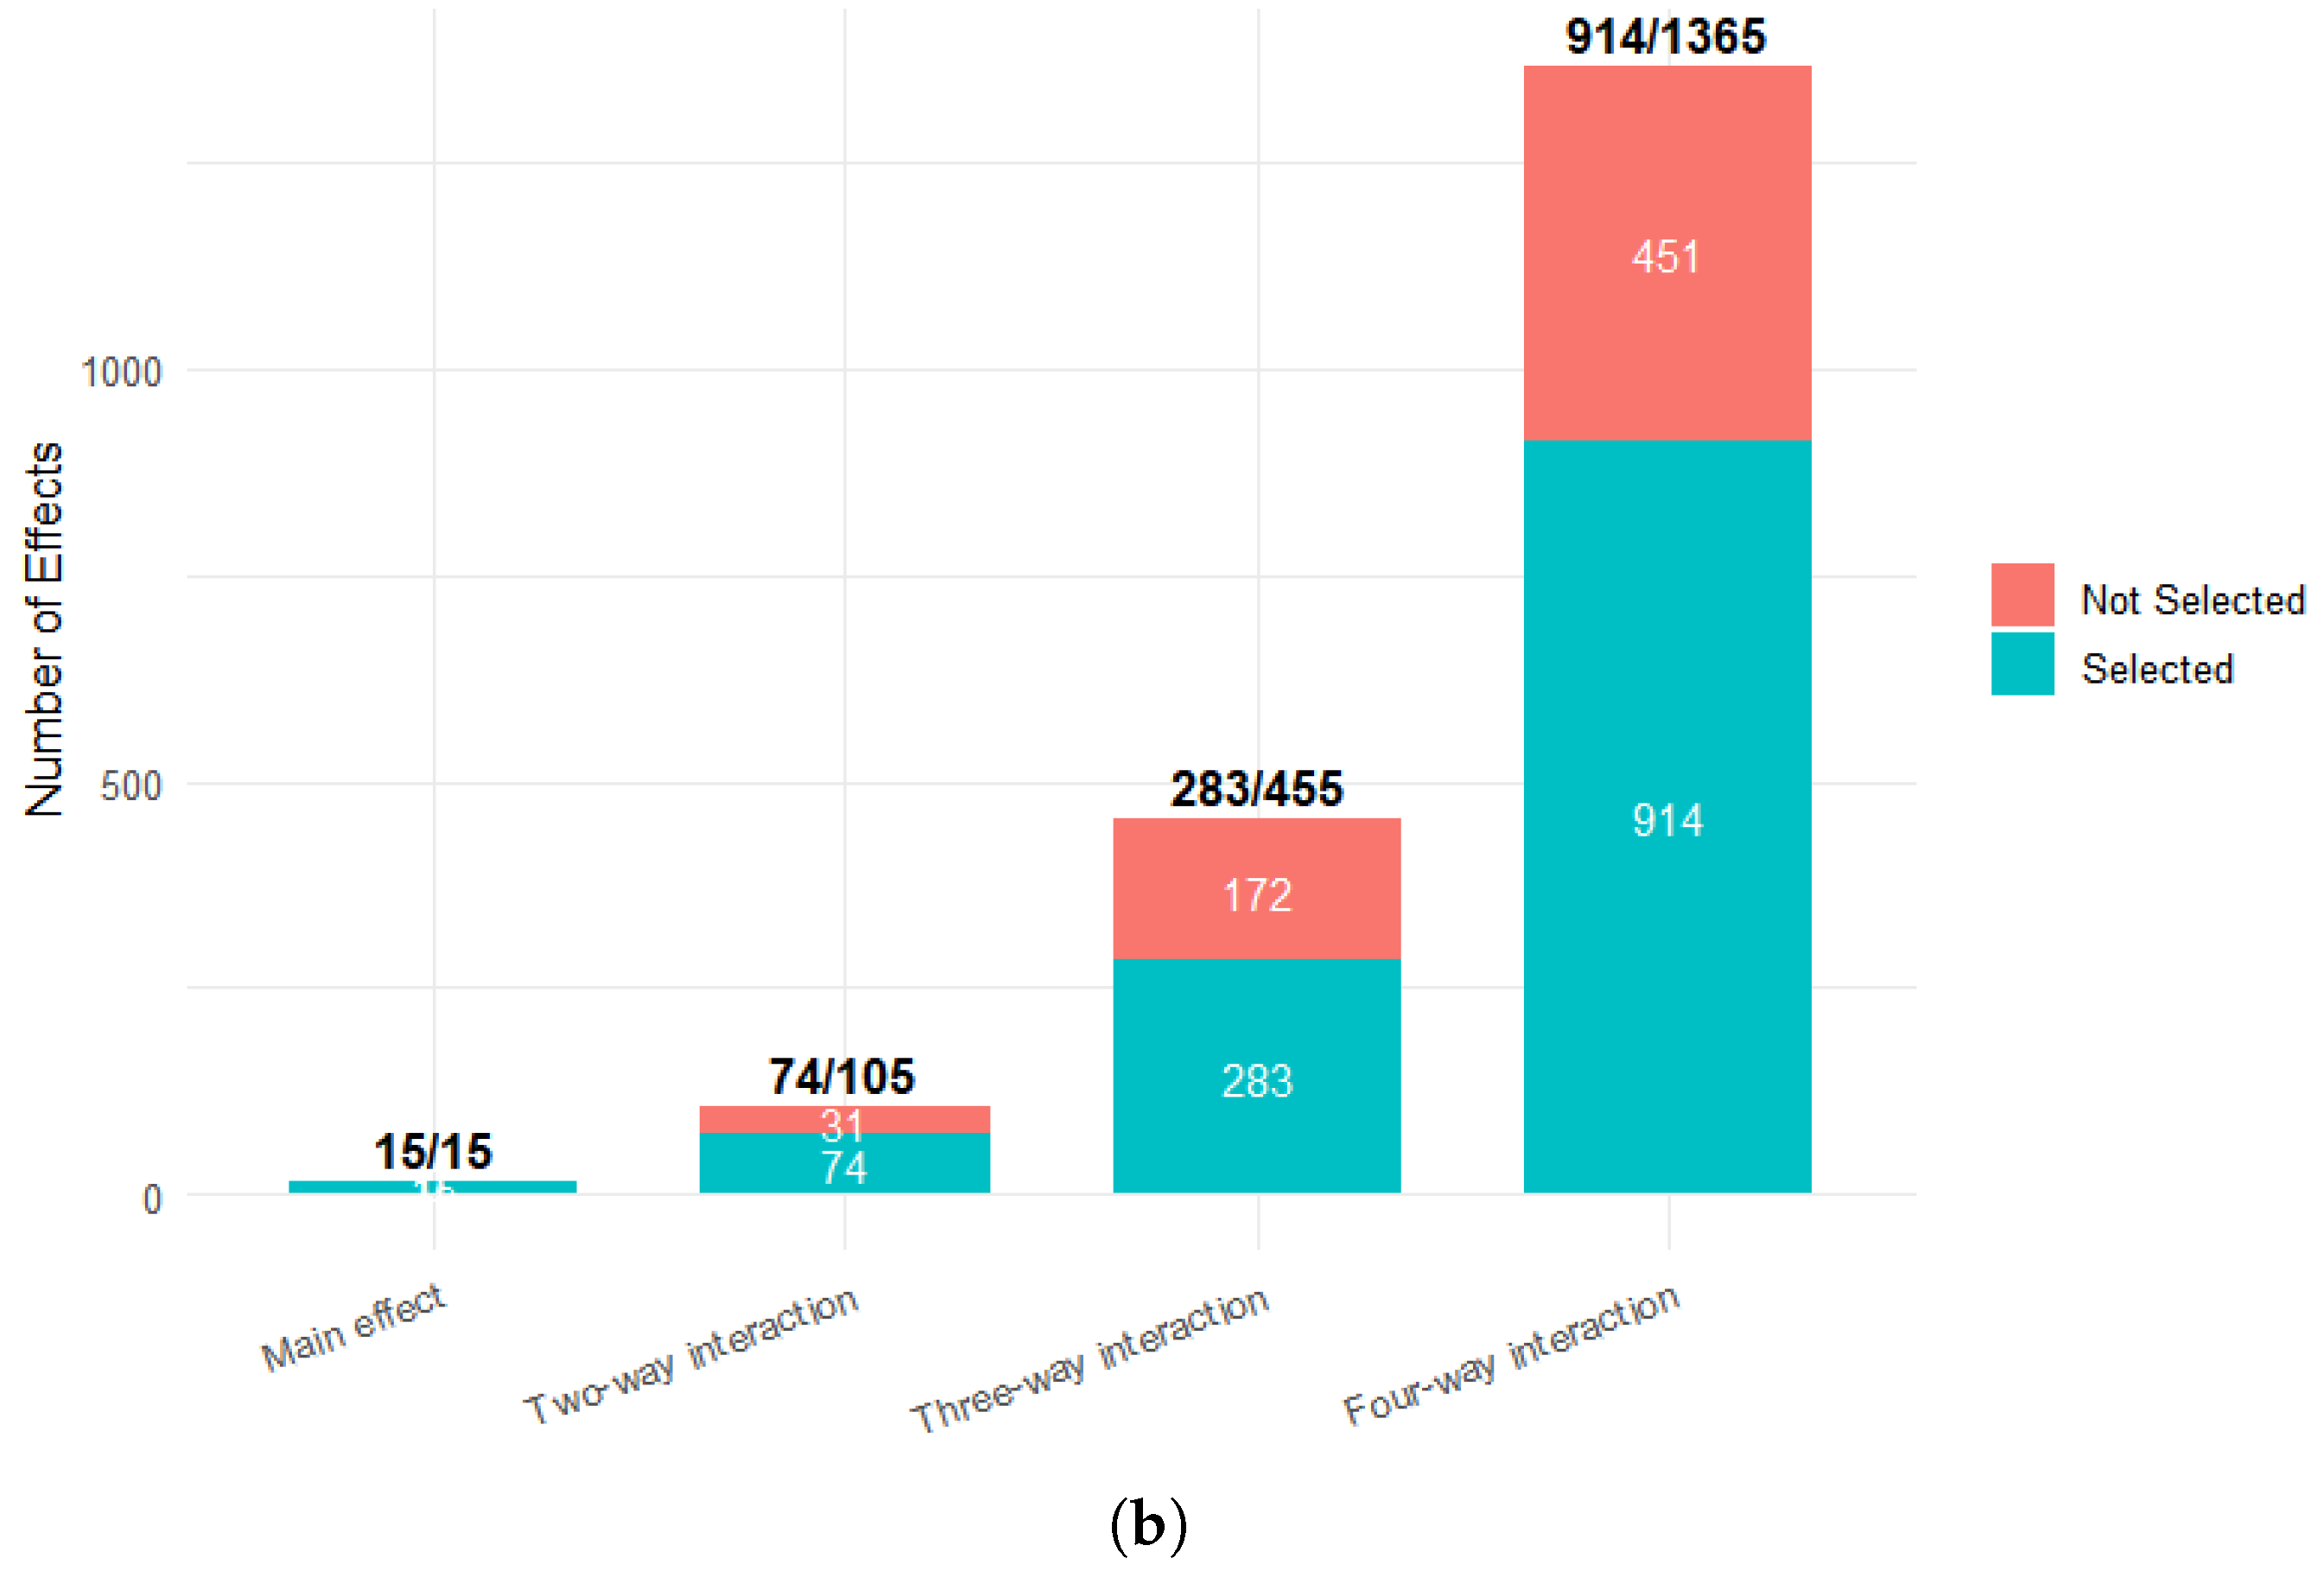
The stacked bar plots summarizing the selected terms for iron and silica concentrate grades are presented in Figure 6. For both prediction targets, all main effects were retained, together with a substantial proportion of the two-way, three-way, and four-way interaction terms. This result indicates that concentrate quality is not determined solely by the independent contribution of individual process variables, but also by their combined operating conditions. Such a pattern is consistent with the underlying flotation mechanism. For example, the effect of amina dosage on concentrate quality is unlikely to remain constant across all operating conditions, as its performance may depend on pulp pH, pulp density, and other process variables. The retention of numerous high-order interactions therefore suggests that the relationships between process variables and concentrate quality are strongly condition-dependent. As these operating conditions change over time, the effective influence of individual variables may also vary, contributing to the time-varying behavior observed in the flotation process.
Figure 6.
Numbers of candidate and LASSO-selected main and interaction effects for (a) iron concentrate grade and (b) silica concentrate grade. Majority of the candidate two-, three-, and four-way interaction terms received nonzero coefficients, indicating complex and condition-dependent relationships between the process variables and concentrate grades.
In summary, the LASSO analysis indicates that the prediction of both iron and silica concentrate grades depends on a combination of main effects and higher-order interactions among the process variables. The retention of numerous two-way, three-way, and four-way interaction terms suggests that the predictive contribution of an individual variable varies with the surrounding operating conditions rather than remaining constant across the entire process. These condition-dependent relationships highlight the nonlinear and coupled characteristics of the flotation system and support the use of prediction models capable of representing complex multivariable dependencies.
3.3. Temporal Evolution of Variable–Grade Relationships
Following the contemporaneous and interaction analyses, the temporal stability of the relationships between process variables and concentrate quality was further examined. Observations were arranged chronologically and divided into ten consecutive intervals of equal time duration. Within each interval, Kendall’s rank correlation coefficient was calculated between each of the 15 retained process variables and the two concentrate-quality variables. This produced a sequence of ten period-specific correlation coefficients for each variable–grade pair, allowing changes in both the magnitude and direction of the observed associations to be examined over time.
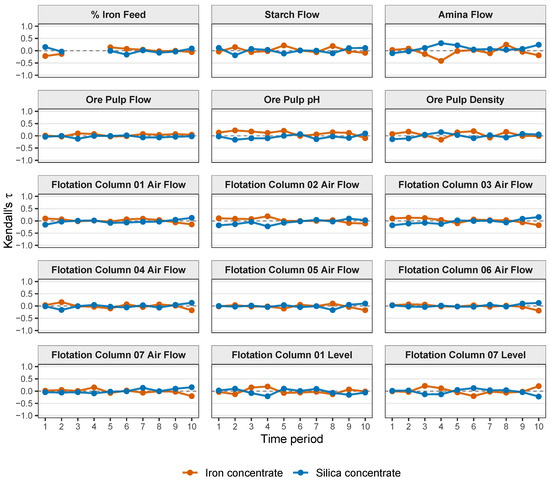
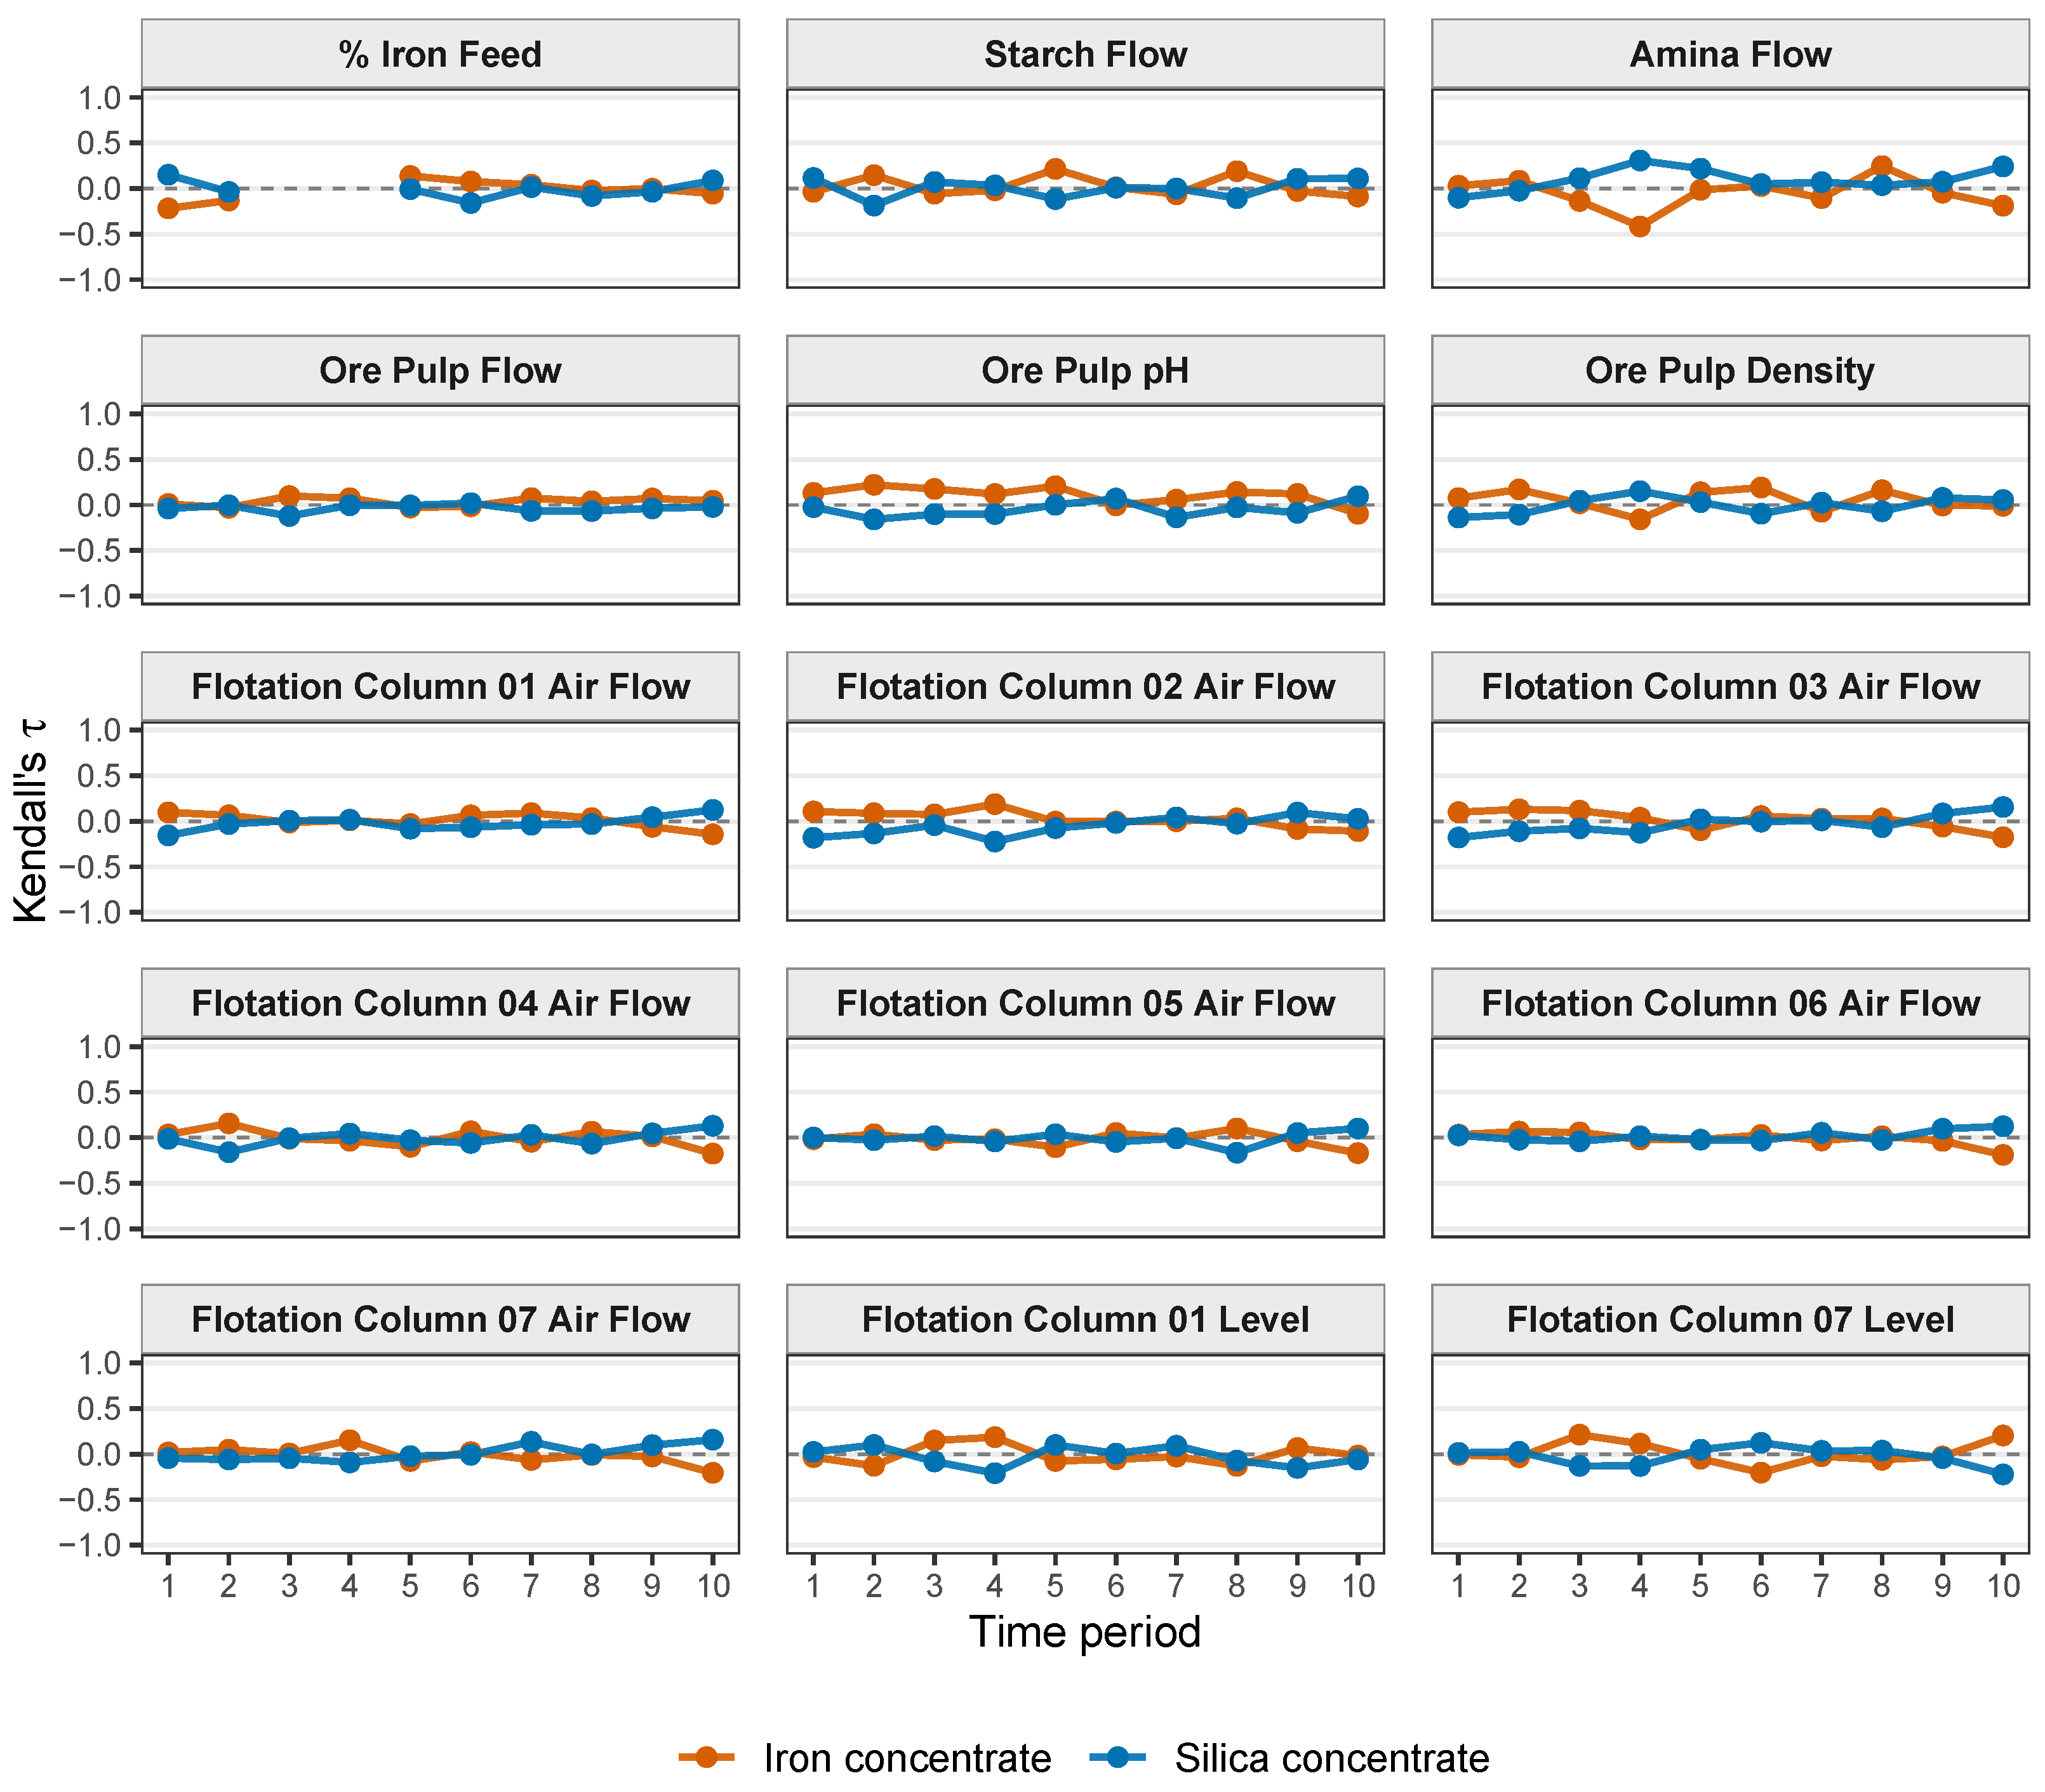
The resulting correlation trajectories are shown in Figure 7 separately for each process variable, with the relationships with iron and silica concentrate grades represented by the red and blue lines, respectively. The correlation coefficients vary noticeably across the ten operating periods. For several process variables, not only the magnitude but also the direction of the association changes over time, with positive correlations observed in some periods and negative correlations in others. These results indicate that the relationships between the recorded process variables and concentrate grades are not temporally invariant and cannot be fully characterized by a single correlation structure estimated over the entire operating period.
Figure 7.
Period-specific Kendall correlations between the retained process variables and the iron and silica concentrate grades across ten consecutive operating periods. The correlations varied in magnitude across the periods and, in some cases, reversed sign, indicating that the associations between the measured process variables and concentrate grades were not static.
Taken together, these observations indicate that a static input–output mapping is insufficient to characterize the flotation process. The relationships between measured process variables and concentrate quality evolve as operating conditions, material properties, equipment states, and internal process conditions change. Because not all of these factors are directly observed, their influence may appear through changes in the dependence structure among the recorded variables. A prediction model must therefore be able to exploit historical multivariate information and adapt to evolving relationships rather than assuming that the same variable interactions remain valid throughout the entire operating period. From this perspective, explicitly modeling dynamic multivariate dependencies is essential for reliable concentrate-grade forecasting under changing flotation conditions.
4. Methodology
Previous studies on flotation concentrate-grade prediction have mainly relied on conventional machine-learning and deep-learning models that learn a global relationship between historical process measurements and concentrate quality. Typical approaches include tree-based models, recurrent neural networks, and Transformer-based architectures. Although these methods can capture nonlinear input–output relationships, the dependency structure among process variables is generally treated as fixed or is learned implicitly through a single global model. This assumption may be restrictive for flotation processes based on the results from the EDA section.
To better represent such dynamic multivariate relationships, a Dynamic Graph Learning Guided Multi-Scale Transformer (DGraFormer) was proposed at IJCAI-25 [29]. DGraFormer constructs correlation graphs from different historical windows to capture time-varying relationships among variables and combines this dynamic graph representation with multi-scale temporal modeling. The overall architecture consists of two main components: Dynamic Correlation-aware Graph Learning (DCGL) and the Multi-Scale Temporal Transformer (MTT). The DCGL component focuses on identifying and aggregating informative relationships among process variables, whereas the MTT component extracts temporal features from historical observations at different resolutions. The representations generated by these two components are subsequently integrated and passed to the prediction layer to produce the concentrate-grade forecast. This architecture is well suited to the flotation forecasting problem considered in this study, where the relationships between recorded process variables and concentrate grades may evolve across operating states. Accordingly, DGraFormer is used to model the dynamic multivariate dependencies of the flotation process and to predict future iron and silica concentrate grades.
In this section, DGraFormer is treated as the primary forecasting model, and its effectiveness is evaluated through comparison with several representative baseline methods. To ensure a fair comparison, all models are trained and evaluated using the same input variables, chronological data split, forecasting horizon, and evaluation metrics with all possible variables. The comparison is designed to determine whether explicitly modeling evolving multivariate dependencies provides an advantage over other commonly used machine-learning and deep-learning approaches for flotation concentrate-grade prediction. Performance is evaluated separately for iron and silica concentrate grades.
4.1. DGraFormer-Based Prediction Framework
For the flotation forecasting task, the historical multivariate observations are represented as
where N denotes the number of measured process variables and T denotes the length of the historical look-back window. Each contains the measurements of all variables at time step t. In this study, the forecasting horizon is one hour. For the iron- and silica-concentrate prediction tasks, the corresponding next-step target is expressed as
where q denotes the concentrate-grade variable being predicted. Thus, DGraFormer uses the historical multivariate sequence to forecast the iron or silica concentrate grade at the subsequent hour.
DGraFormer represents the multivariate sequence as a graph , in which the process variables are treated as graph nodes and their relationships are represented by graph edges. The DCGL component is used to capture inter-variable relationships that may change across different parts of the historical sequence. Instead of imposing a single fixed graph, the input sequence is divided into multiple temporal windows, and a window-specific correlation structure is learned for each window. For the w-th window, the graph weight matrix is constructed by combining an overall correlation matrix with a learnable window-specific correlation matrix :
where controls the relative contribution of the overall and window-specific correlation information. To reduce the influence of weak or potentially noisy relationships, an information-focusing mask is further applied:
where ⊙ denotes element-wise multiplication. represents the strengths of inter-variable relationships within the w-th temporal window and is learned jointly with the forecasting network, whereas dynamically determines which relationships in are retained for graph-based message passing by preserving a predefined proportion of the strongest correlation weights and suppressing weaker or potentially noisy relationships. The resulting window-specific graph weights guide message passing among the process variables, allowing the information exchanged between variables to vary with the corresponding operating window. This provides a mechanism for representing evolving relationships among feed conditions, reagent additions, pulp properties, and flotation-column operating variables.
The correlation-aware representation generated by DCGL is subsequently processed by the MTT component to extract temporal patterns at different resolutions. Given the DCGL output , the historical sequence of each variable is divided into non-overlapping temporal patches and encoded by a Transformer. Neighboring patches are then progressively combined to form coarser temporal representations. At the l-th encoding stage, this process is expressed as
where denotes the representation from the preceding stage, is the combined patch representation, is the number of patches at the preceding scale, and denotes the Transformer encoder at the l-th stage. Through progressive patch aggregation, MTT captures both local fluctuations and broader temporal patterns in the historical flotation sequence.
Finally, the learned dynamic graph and multi-scale temporal representations are mapped through the prediction layer to obtain
which represents the predicted iron or silica concentrate grade for the subsequent hour. By jointly modeling window-dependent inter-variable relationships and multi-scale temporal patterns, DGraFormer avoids assuming that a single fixed dependency structure remains valid throughout the flotation process.
4.2. Experimental Design
Two one-hour-ahead forecasting experiments were conducted for iron concentrate grade and silica concentrate grade, respectively. For each experiment, all variables available in the dataset, except for the date variable, were used as model inputs. Although several variables exhibited strong contemporaneous correlations, they were retained because their joint historical trajectories may still provide complementary information for characterizing evolving operating conditions. This consideration is particularly relevant to DGraFormer, which uses historical multivariate observations to learn dynamic inter-variable dependencies and represent changes in the underlying process state.
Before sequence construction, all observations were arranged chronologically according to their timestamps. A 64-h historical window was then used to predict the concentrate grade one hour ahead. Historical values of the corresponding prediction target were retained within the input sequence because they preceded the forecast time and therefore did not introduce future information into the models. The processed observations were subsequently divided in chronological order into training, validation, and test sets using proportions of 70%, 10%, and 20%, respectively. The earliest 70% of the observations were used for model training, the following 10% were used for validation and hyperparameter selection, and the final 20% were reserved for independent performance evaluation.
For performance comparison, DGraFormer was evaluated against XGBoost, random forest (RF), long short-term memory (LSTM), and Transformer models. XGBoost and RF were selected as representative tree-based ensemble methods. XGBoost uses a boosting strategy to sequentially improve weak learners, whereas RF applies a bagging strategy to aggregate multiple independently trained decision trees. LSTM was selected as a recurrent time-series model for capturing sequential dependencies and long-term temporal information. The standard Transformer was used as an attention-based baseline to assess whether the dynamic graph learning and multi-scale temporal modeling components of DGraFormer provide additional predictive benefits beyond conventional self-attention-based sequence modeling. In addition, a persistence model was included as a simple reference baseline. This model assumes that the concentrate grade in the next hour remains equal to the most recently observed value. In the experiment, all models were evaluated using the same input variables, chronological data partitions, 64-h historical windows, and a one-hour prediction horizon.
Prediction performance was evaluated using the mean absolute error (MAE), root mean squared error (RMSE), and coefficient of determination . These metrics are defined as follows:
where n denotes the number of test samples, and represent the observed and predicted concentrate grades for sample i, respectively, and denotes the mean of the observed concentrate grades. Lower MAE and RMSE values indicate smaller prediction errors, whereas a higher value indicates that the model explains a larger proportion of the variation in the observed concentrate grade. Model selection was based on validation-set performance, while the final performance comparison was conducted exclusively on the independent test set.
5. Results
For iron concentrate grade, the results are summarized in Table 2. DGraFormer achieved an RMSE of 0.7587, an MAE of 0.5549, and an of 0.5423, outperforming all comparison models across the three evaluation metrics. Compared with the persistence baseline, DGraFormer reduced RMSE and MAE by 7.36% and 3.82%, respectively, while increasing from 0.4660 to 0.5423. DGraFormer also outperformed the standard Transformer and LSTM models. Relative to the Transformer, its RMSE and MAE were reduced by 9.80% and 15.92%, respectively. The Transformer and LSTM produced similar results, whereas XGBoost and Random Forest showed lower predictive accuracy.
Table 2.
Prediction performance of the compared models for iron concentrate grade.
To further assess whether the observed performance differences were statistically significant, 95% confidence intervals were calculated for the differences in RMSE, MAE, and between DGraFormer and each comparison model. A confidence interval containing zero indicates that the performance difference is not statistically significant at the 0.05 level, whereas an interval excluding zero indicates a statistically significant difference. Because the difference was defined as the DGraFormer metric minus the comparison-model metric, negative differences in RMSE and MAE and positive differences in favor DGraFormer. As shown in Table 3, none of the confidence intervals contained zero, indicating that DGraFormer achieved statistically significant improvements over all comparison models across the three metrics for iron concentrate-grade prediction.
Table 3.
Paired comparisons and 95% confidence intervals for iron concentrate-grade prediction.
For silica concentrate grade, the results are summarized in Table 4. DGraFormer obtained the lowest RMSE of 0.6917 and the highest of 0.6384. Compared with the persistence baseline, DGraFormer reduced RMSE by 4.09% and increased from 0.6065 to 0.6384. However, persistence achieved a slightly lower MAE than DGraFormer, with values of 0.4469 and 0.4590, respectively. Compared with the Transformer, DGraFormer reduced RMSE and MAE by 7.80% and 17.76%, respectively, while increasing by 0.0643. The performance gradually deteriorated from Transformer and LSTM to XGBoost and Random Forest.
Table 4.
Prediction performance of the compared models for silica concentrate grade.
Similarly, Table 5 presents the 95% confidence intervals for the performance differences in silica concentrate-grade prediction. All confidence intervals excluded zero except for the MAE difference between DGraFormer and persistence. Although persistence achieved a slightly lower MAE than DGraFormer, the corresponding confidence interval indicates that this difference was not statistically significant and may reflect sampling variability. Other than that, DGraFormer achieved statistically significant improvements in RMSE and over persistence and across all three metrics relative to the other comparison models.
Table 5.
Paired comparisons and 95% confidence interval for silica concentrate-grade prediction.
Overall, DGraFormer achieved better performance in most of the metrics among all methods, demonstrating that the historical evolution of multiple process variables provided additional predictive information beyond the most recent target observation. Its advantage over the standard Transformer and LSTM further suggests that jointly modeling temporal patterns and time-varying inter-variable dependencies is beneficial for short-term flotation concentrate-grade prediction.
6. Sensitivity Analysis
The selection of the look-back window is an important step in constructing input samples for time-series model training because it determines the amount of historical process information available to the model. Industrial mineral-processing plants commonly operate three 8-h shifts per day. Therefore, a 64-h window, comprising eight complete operating shifts, was initially selected to capture process variations across multiple shifts while remaining aligned with the typical shift duration. To assess whether the window length influenced the prediction results, a sensitivity analysis was conducted using windows of 32, 64, 96, and 128 h. DGraFormer was retrained separately for each window while the other experimental settings were kept unchanged, and the resulting RMSE, MAE, and values were compared.
For iron concentrate-grade prediction, Table 6 shows that the model performance varied only marginally across the evaluated window lengths. The 96-h window achieved the lowest RMSE (0.756) and the highest (0.546), while the 32-h window produced the lowest MAE (0.547). However, the 95% confidence intervals for all metric differences relative to the 64-h window included zero. This means no statistically significant differences were identified, suggesting that DGraFormer was relatively insensitive to the look-back-window length within the evaluated range in the iron concentrate-grade prediction.
Table 6.
The 95% confidence intervals for differences in iron concentrate-grade prediction performance relative to the 64-h look-back window.
For silica concentrate-grade prediction, Table 7 similarly shows only small variations in model performance across the evaluated window lengths. The 32-h window achieved the lowest RMSE (0.685) and MAE (0.449), as well as the highest (0.645). However, the 95% confidence intervals for all metric differences relative to the 64-h window included zero. Therefore, no other significant differences were identified, suggesting that the silica-grade prediction performance was also relatively stable across the evaluated window lengths.
Table 7.
The 95% confidence intervals for differences in silica concentrate-grade prediction performance relative to the 64-h look-back window.
7. Conclusions
First, this study demonstrated that the flotation process exhibits pronounced dynamic characteristics that cannot be fully represented by a single static input–output relationship. The associations between measured process variables and concentrate grades changed across different operating periods, and the predictive contribution of individual variables was also affected by their interactions with other process variables. These findings indicate that the effective operating state of the flotation system evolves over time. At the same time, the available measurements provide only a partial description of this state. Important information related to ore mineralogy, particle-size distribution, degree of liberation, intrinsic floatability, equipment condition, and other internal process characteristics was not recorded in the dataset. As these unobserved factors change, their influence may be reflected indirectly through changing relationships among the measured variables and concentrate quality. Therefore, the observed dynamics should not be interpreted as being caused by time itself, but rather as the manifestation of changing operating conditions that are only partially represented by the available measurements.
Second, to address this characteristic, this study introduced a dynamic forecasting method based on DGraFormer. Instead of assuming that the same dependency structure remains valid throughout the complete operating period, DGraFormer learns window-dependent relationships among process variables and combines them with multi-scale temporal representations extracted from historical observations. This allows the model to adapt its representation of the process according to the evolving information contained in the recent operating history. Such a formulation is particularly suitable for flotation concentrate-grade prediction, where the same measured variable may carry different predictive information under different combinations of feed conditions, reagent additions, pulp properties, and equipment states. The results therefore support the use of historical multivariate trajectories not merely as additional lagged inputs, but as information that helps characterize the changing process state.
Finally, the developed DGraFormer-based model achieved the strongest overall forecasting performance among the compared models for both iron and silica concentrate grades. For iron concentrate grade, it obtained an RMSE of 0.7587, an MAE of 0.5549, and an of 0.5423. For silica concentrate grade, it achieved an RMSE of 0.6917 and an of 0.6384. These results indicate that explicitly representing evolving inter-variable dependencies and temporal patterns provides a practical advantage over models based on more static or implicitly learned relationships. More broadly, the findings suggest that reliable short-term flotation forecasting requires not only nonlinear prediction capability, but also the ability to accommodate changes in the underlying process state. The proposed framework therefore provides a useful basis for earlier identification of concentrate-quality deviations and more timely operational adjustment. Future work should validate this conclusion across additional plants and operating periods, incorporate more complete measurements of ore, particle, and equipment conditions, and investigate online adaptation, uncertainty quantification, and longer forecasting horizons under continuously changing flotation conditions. In addition, more variables such as measurements of mineral liberation, hydrophobicity, and stage-specific Fe and SiO2 assays should be collected and analyzed to investigate how upstream separation performance propagates through subsequent flotation stages and ultimately affects final concentrate quality.
Author Contributions
Conceptualization, F.Q. and H.C.; methodology, L.Z. and F.Q.; software, L.Z.; formal analysis, L.Z., H.C., Z.L. and Y.J.; writing—original draft, L.Z., F.Q., H.C., Z.L., Y.J. and X.L.; writing—review & editing, L.Z., F.Q., H.C., Z.L., Y.J. and X.L.; project administration, F.Q. and X.L. All authors have read and agreed to the published version of the manuscript.
Funding
This research received no external funding.
Data Availability Statement
No new data were created or analyzed in this study. Data sharing is not applicable to this article.
Conflicts of Interest
The authors declare no conflicts of interest.
References
- Zhang, D.; Gao, X.; Qi, W. Soft sensor of iron tailings grade based on froth image features for reverse flotation. Trans. Inst. Meas. Control 2022, 44, 2928–2940. [Google Scholar] [CrossRef] [Scilit]
- Zhang, D.; Gao, X.; Wang, H. Prediction model of iron reverse flotation tailings grade based on multi-feature fusion. Measurement 2023, 206, 112062. [Google Scholar] [CrossRef] [Scilit]
- Li, H.; Tang, Z.; Dai, Z.; Huang, Y.; Xie, Y. Grade prediction in the first rougher of zinc flotation based on a multiscale fusion iCrossformer model. Miner. Eng. 2026, 235, 109909. [Google Scholar] [CrossRef] [Scilit]
- Quintanilla, P.; Neethling, S.J.; Navia, D.; Brito-Parada, P.R. A dynamic flotation model for predictive control incorporating froth physics. Part I: Model development. Miner. Eng. 2021, 173, 107192. [Google Scholar] [CrossRef] [Scilit]
- Oosthuizen, D.J.; le Roux, J.D.; Craig, I.K. A dynamic flotation model to infer process characteristics from online measurements. Miner. Eng. 2021, 167, 106878. [Google Scholar] [CrossRef] [Scilit]
- Huang, K.; Keles, S.; Sherrell, I.; Noble, A.; Yoon, R.-H. Development of a flotation simulator that can predict grade vs. recovery curves from mineral liberation data. Miner. Eng. 2022, 181, 107510. [Google Scholar] [CrossRef] [Scilit]
- Aldrich, C.; Avelar, E.; Liu, X. Recent advances in flotation froth image analysis. Miner. Eng. 2022, 188, 107823. [Google Scholar] [CrossRef] [Scilit]
- Liu, W.; Zhao, Q.; Zhang, R.; Zhao, P.; Liu, W.; Han, C.; Shen, Y. Study on selective adsorption behavior and mechanism of quartz and magnesite with a new biodegradable collector. Separations 2023, 10, 590. [Google Scholar] [CrossRef] [Scilit]
- Gomez-Flores, A.; Heyes, G.W.; Ilyas, S.; Kim, H. Prediction of grade and recovery in flotation from physicochemical and operational aspects using machine learning models. Miner. Eng. 2022, 183, 107627. [Google Scholar] [CrossRef] [Scilit]
- Xu, P.; Tian, L.; Liu, J.; Luo, D.; Jahanshahi, H. MsFfTsGP: Multi-source features-fused two-stage grade prediction of zinc tailings in lead-zinc flotation process via multi-stream 3D convolution with attention mechanism. Eng. Appl. Artif. Intell. 2024, 129, 107647. [Google Scholar] [CrossRef] [Scilit]
- Pural, Y.E. Developing a data-driven soft sensor to predict silicate impurity in iron ore flotation concentrate. Physicochem. Probl. Miner. Process. 2023, 59, 169823. [Google Scholar] [CrossRef] [Scilit]
- Pu, Y.; Szmigiel, A.; Apel, D.B. Purities prediction in a manufacturing froth flotation plant: The deep learning techniques. Neural Comput. Appl. 2020, 32, 13639–13649. [Google Scholar] [CrossRef] [Scilit]
- Costa, A.C.A.A.; Campos, F.V.; Araujo, L.R.G.; Torres, L.C.B.; Braga, A.P. Deep architecture for silica forecasting of a real industrial froth flotation process. Eng. Appl. Artif. Intell. 2022, 115, 105196. [Google Scholar] [CrossRef] [Scilit]
- Pu, Y.; Szmigiel, A.; Chen, J.; Apel, D.B. FlotationNet: A hierarchical deep learning network for froth flotation recovery prediction. Powder Technol. 2020, 375, 317–326. [Google Scholar] [CrossRef] [Scilit]
- Cubillos, F.A.; Lima, E.L. Identification and optimizing control of a rougher flotation circuit using an adaptable hybrid-neural model. Miner. Eng. 1997, 10, 707–721. [Google Scholar] [CrossRef] [Scilit]
- Nasiri Abarbekouh, M.; Iqbal, S.; Särkkä, S. Physics-informed machine learning for grade prediction in froth flotation. Miner. Eng. 2025, 227, 109297. [Google Scholar] [CrossRef] [Scilit]
- Seppi, M.; Linnosmaa, J.; Zeb, A. Physics-informed machine learning surrogate models: Enhancing data-driven forecasting for digital twins in mineral processing. Miner. Eng. 2025, 230, 109424. [Google Scholar] [CrossRef] [Scilit]
- Lu, M.; Li, Y.; He, X.; He, L.; Zou, Y.; Yi, Z.; Li, P. The flotation grade prediction model based on mechanism-guided and data-driven approaches. J. Process Control 2025, 156, 103588. [Google Scholar] [CrossRef] [Scilit]
- Zhang, H.; Tang, Z.; Xie, Y.; Luo, J.; Chen, Q.; Gui, W. Grade prediction of zinc tailings using an encoder–decoder model in froth flotation. Miner. Eng. 2021, 172, 107173. [Google Scholar] [CrossRef] [Scilit]
- Zheng, B.; Xu, D.; Tan, G.; Chen, Y.; Cai, Y. A novel semi-supervised soft sensor modeling method based on deep dynamic and semantic information extraction for concentrate grade prediction in froth flotation. Miner. Eng. 2023, 201, 108179. [Google Scholar] [CrossRef] [Scilit]
- Zhong, Y.; Tang, Z.; Zhang, H.; Xie, Y.; Guo, J. Short-long temporal graph convolution network for grade monitoring in a first zinc rougher. Miner. Eng. 2024, 205, 108457. [Google Scholar] [CrossRef] [Scilit]
- Pu, Y. Data for: FlotationNet: A hierarchical deep learning network for froth flotation recovery prediction. Mendeley Data 2020. [Google Scholar] [CrossRef]
- Kendall, M.G. A new measure of rank correlation. Biometrika 1938, 30, 81–93. [Google Scholar] [CrossRef] [Scilit]
- Lu, Y. Kendall’s tau and Spearman’s rho for normal location-scale and skew-normal scale mixture copulas. J. Multivar. Anal. 2026, 214, 105633. [Google Scholar] [CrossRef] [Scilit]
- Holm, S. A simple sequentially rejective multiple test procedure. Scand. J. Stat. 1979, 6, 65–70. [Google Scholar]
- Tibshirani, R. Regression shrinkage and selection via the Lasso. J. R. Stat. Soc. Ser. B Stat. Methodol. 1996, 58, 267–288. [Google Scholar] [CrossRef] [Scilit]
- Efron, B.; Hastie, T.; Johnstone, I.; Tibshirani, R. Least angle regression. Ann. Stat. 2004, 32, 407–451. [Google Scholar] [CrossRef] [Scilit]
- Friedman, J.H.; Hastie, T.; Tibshirani, R. Regularization paths for generalized linear models via coordinate descent. J. Stat. Softw. 2011, 33, 1–22. [Google Scholar] [CrossRef] [Scilit]
- Yan, H.; Chen, D.; Jiang, G.; Wang, B.; Cao, L.; Dong, J.; Yu, Y. DGraFormer: Dynamic graph learning guided multi-scale Transformer for multivariate time series forecasting. In Proceedings of the Thirty-Fourth International Joint Conference on Artificial Intelligence (IJCAI-25); Kwok, J., Ed.; International Joint Conferences on Artificial Intelligence Organization: Vienna, Austria, 2025; pp. 3516–3524. [Google Scholar] [CrossRef] [Scilit] [PubMed]

Disclaimer/Publisher’s Note: The statements, opinions and data contained in all publications are solely those of the individual author(s) and contributor(s) and not of MDPI and/or the editor(s). MDPI and/or the editor(s) disclaim responsibility for any injury to people or property resulting from any ideas, methods, instructions or products referred to in the content. |
© 2026 by the authors. Licensee MDPI, Basel, Switzerland. This article is an open access article distributed under the terms and conditions of the Creative Commons Attribution (CC BY) license.