


Abstract
Short-circuit flow severely degrades cyclone separation, yet its influence zone has not been clearly defined. In this work, the Reynolds stress model (RSM) was adopted to perform numerical simulations for a 300 mm PV-type cyclone separator, and the simulation results were validated against published tangential-velocity experimental data. The radial velocity along the extension lines of the vortex finder’s inner wall was analyzed to define the short-circuit flow influence zone, and a sector-resolved intensity index was proposed to quantify its circumferential non-uniformity. The results show that the lower boundary of the influence zone is a circumferentially varying curved surface rather than a horizontal plane. Among the four sectors, the 180–270° sector exhibits the greatest penetration depth (55 mm) and the highest inward radial velocity (−15.45 m/s). The proposed index indicates that Sector III contributes 38.7% of the total short-circuit flow intensity, and the dimensionless index is 0.127 for the present case. Within the influence zone, the inward radial velocity peaks at Z = 12 mm and approaches zero by Z = 53 mm, while the tangential velocity increases from 4.22 to 57.13 m/s, indicating Rankine vortex development. The short-circuit flow is governed by the coupled effects of inlet jet squeezing, vortex-core displacement, and the interaction between upward and downward flows. The proposed influence-zone definition and intensity index provide a quantitative framework for describing short-circuit flow and may be useful for evaluating cyclone design and short-circuit-flow suppression strategies.
1. Introduction
The cyclone separator is a core device for gas–solid separation in fluid catalytic cracking units and is currently the only industrial gas–solid separator capable of large-scale, long-term operation. Its performance has a direct impact on energy conservation, emission reduction, cost control, and production efficiency in industrial plants. Cyclone separation relies on centrifugal forces generated by a high-speed swirling flow to separate particles from the dust-laden gas stream [1,2,3]. In addition to the dominant three-dimensional swirling turbulent flow, several secondary flows occur inside the cyclone and adversely affect separation performance, including short-circuit flow between the inlet and the vortex finder (also known as lip leakage [1]), longitudinal circulation in the annular space, and back-mixing in the hopper. Among these, short-circuit flow is one of the main causes of reduced separation efficiency because it can carry particles directly into the vortex finder before they are fully separated [4,5]. Therefore, a clearer understanding of short-circuit flow formation is of great significance for improving cyclone performance.
At present, researchers have a basic understanding of short-circuit flow: a portion of the fluid, without being sufficiently separated, flows directly from the inlet region of the annular space along the outer wall of the vortex finder, “taking a shortcut” into the vortex finder and escaping. In the flow field, this phenomenon is manifested as a strong radial inward movement near the inlet of the vortex finder. The greater the short-circuit flow, the lower the separation efficiency. In terms of short-circuit flow suppression, Li et al. [6] found that an inclined cut on the vortex finder increases short-circuit flow; studies by Guo et al. [7] and Fu et al. [8] indicated that a slotted vortex finder can almost completely suppress short-circuit flow; Zhao et al. [9] pointed out that an excessively large vortex finder diameter or insufficient insertion depth further aggravates short-circuit flow; and Zhang et al. [10] added a filter at the bottom of the vortex finder, effectively suppressing short-circuit flow. Regarding the quantification of short-circuit flow, Dong et al. [11] measured the proportion of short-circuit flow using a tracer particle method; Jiang et al. [5] found that an expanded, curved overflow pipe can reduce short-circuit flow and coarse particle escape; and studies by Chang et al. [12] and Zhang et al. [13] demonstrate that short-circuit flow is closely related to particle size and its inlet position.
Although many studies have proposed technical approaches for suppressing short-circuit flow, the flow characteristics and formation mechanism of short-circuit flow itself remain only qualitatively understood. The main limitations are as follows: ① The influence zone of short-circuit flow is not clearly defined. Most studies treat the short-circuit-flow region as a cylindrical surface with a fixed axial extent [10], without considering circumferential variations in penetration depth. Owing to inlet asymmetry and vortex-core displacement, the influence depth may vary significantly with circumferential position [14]. ② Quantitative characterization indices are lacking. Short-circuit flow is often described qualitatively, for example, as “enhanced” or “suppressed,” whereas quantitative metrics capable of comprehensively reflecting its intensity and circumferential distribution are still limited [15]. This makes it difficult to objectively compare different operating conditions and cyclone configurations. ③ The formation mechanism remains unclear. Existing studies often focus on a single factor, such as inlet impact or entrainment by upward flow [16], and therefore do not provide a systematic analysis of the coupled effects of multiple factors.
Accordingly, to address the above-mentioned limitations, this study performs a transient RSM-based numerical investigation of short-circuit flow in a PV-type cyclone separator, with emphasis on the circumferential non-uniformity of its influence zone. The objectives are to (i) identify the three-dimensional influence zone of short-circuit flow by analyzing the radial velocity along the extensions of the vortex finder’s inner wall in different circumferential directions, thereby revealing the circumferential non-uniformity of its lower boundary; (ii) develop a sector-resolved short-circuit-flow intensity index that can quantitatively describe the strength and spatial distribution of short-circuit flow; and (iii) clarify the coupled formation mechanism by systematically examining the velocity and pressure fields within the influence zone. The proposed framework provides an objective basis for comparing cyclone geometries and operating conditions and for guiding the design of vortex-finder modifications and other short-circuit flow suppression strategies.
2. Numerical Method
2.1. Geometry and Meshing
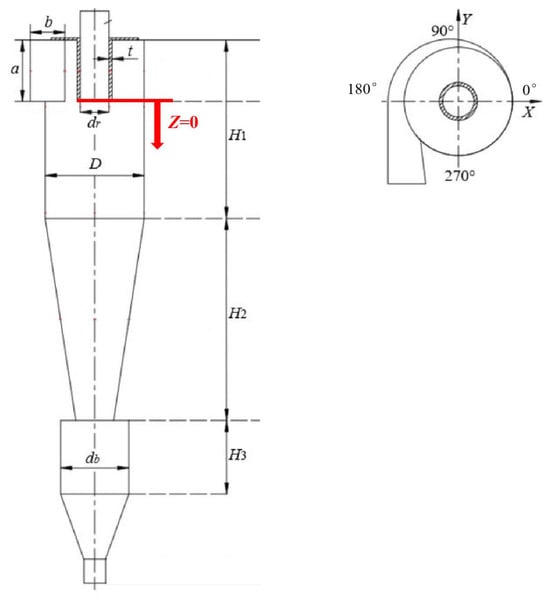
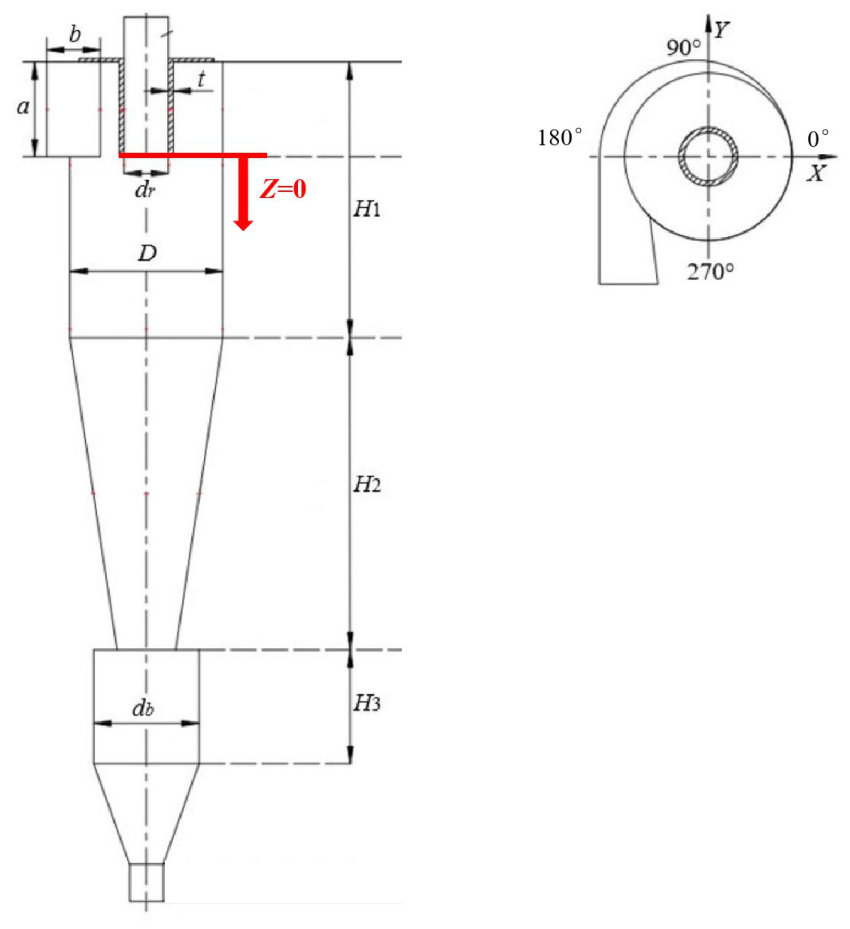
Figure 1 and Table 1 present the structural dimensions of the PV-type cyclone separator (a standard tangential reverse-flow cyclone configuration commonly used in the petroleum and chemical industry) used in this study. The separator has a diameter of 300 mm, and the vortex finder insertion depth is 176 mm, which is consistent with the inlet height.
Figure 1.
Schematic diagram of the cyclone structure.
Table 1.
Cyclone sizes (mm).
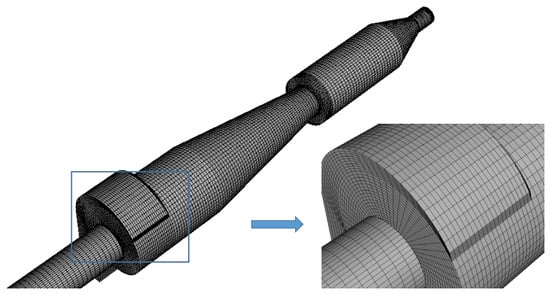
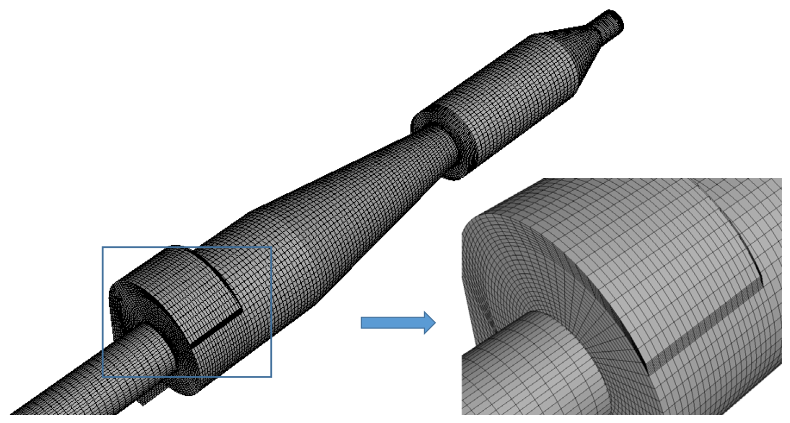
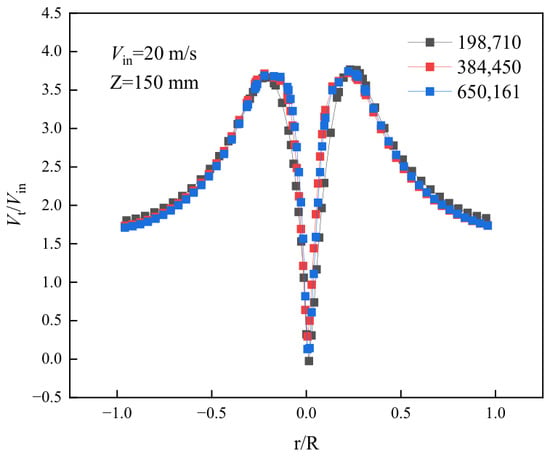
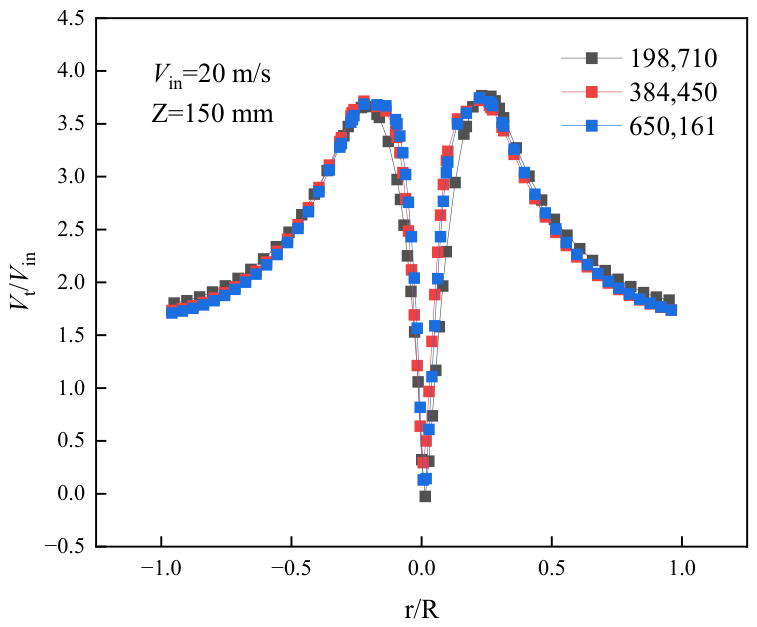
The mesh was generated using ICEM software (Version 19.0), as shown in Figure 2. To verify grid independence, several mesh resolutions were tested before selecting the final mesh. The tangential velocity distribution at Z = 150 mm was used as the representative indicator for this verification because tangential velocity is the dominant feature of the swirling flow in cyclone separators and is sensitive to mesh resolution. As the mesh number increased from 384,450 to 650,161, the tangential velocity profile changed negligibly, as shown in Figure 3, indicating that the main swirling-flow structure had already been adequately resolved. Therefore, the mesh with 384,450 nodes was finally adopted to balance numerical accuracy and computational cost. For subsequent cases with different cyclone sizes, the mesh number was maintained between 380,000 and 480,000 to ensure consistent computational efficiency.
Figure 2.
CFD mesh.
Figure 3.
Distribution of dimensional tangential velocity under different grid numbers.
2.2. Computational Control Equation
The Reynolds stress model (RSM) accounts for anisotropic effects such as rotation effects, near-wall effects, buoyancy effects, and curvature effects and is widely used for simulating the flow field in cyclone separators. Because the flow in a cyclone is dominated by strong swirl and highly anisotropic turbulence, the RSM is more appropriate than isotropic eddy-viscosity models for capturing the complex stress distribution and secondary-flow structure. This modeling choice is also supported by recent studies employing advanced turbulence-resolving approaches for anisotropic and unsteady flows, such as large-eddy simulation of film cooling flows with crossflow coolant configurations, which further demonstrate the importance of using turbulence models capable of capturing complex flow anisotropy [17]. The governing equations of this model are as follows:
- Continuity equation:
- Momentum equation:
- In the RSM, the transport equation used to determine the components of the Reynolds stress is as follows:
- Turbulent diffusion term:
- Stress production term:
- Buoyancy production term:
- Pressure–strain redistribution term:
- Dissipation term:
- Rotation production term:
- After further modeling, the turbulent kinetic energy equation and the dissipation rate equation become
- (for boundaries)
- or
2.3. Boundary Conditions
The inlet boundary is set as a velocity inlet, with the velocity direction perpendicular to the inlet cross-section. The outlet boundary is set as outflow, and the flow rate weighting at the vortex finder outlet is 1. The working medium is air at ambient temperature and pressure, with an inlet gas velocity of 20 m/s, density = 1.225 kg/m3, and viscosity . Turbulence is defined using the hydraulic diameter DH and turbulence intensity I.
The hydraulic diameter is defined as
where a and b are the height and width of the inlet, respectively. For the cyclone separator in this study, a = 176 mm and b = 84 mm.
Turbulence intensity:
where is the gas Reynolds number based on the hydraulic diameter.
For the cyclone separator model used in this study, 1.51%.
To ensure the accuracy of the wall shear stress, the standard wall function is employed in the calculations, and a no-slip condition is applied at the walls.
In this study, the fluid velocity in the cyclone separator is less than 100 m/s, and the air is considered incompressible; therefore, the internal flow field of the cyclone separator is assumed to be an incompressible viscous flow.
Transient calculations are performed using a pressure-based transient solver. The pressure–velocity coupling is handled using the SIMPLEC algorithm, while the pressure gradient term is discretized with the PRESTO! scheme, and the momentum and convective terms are discretized using the QUICK scheme. The residual convergence criterion for all governing equations is set to 1 × 10⁻⁵, the time step size is 1 × 10⁻⁴ s, and the total simulated physical time is 2 s. No separate time-averaging procedure is applied in this study; the velocity and pressure fields shown in the following figures are instantaneous snapshots extracted from the converged transient solution after the flow field reaches a statistically stable state.
2.4. Model Validation
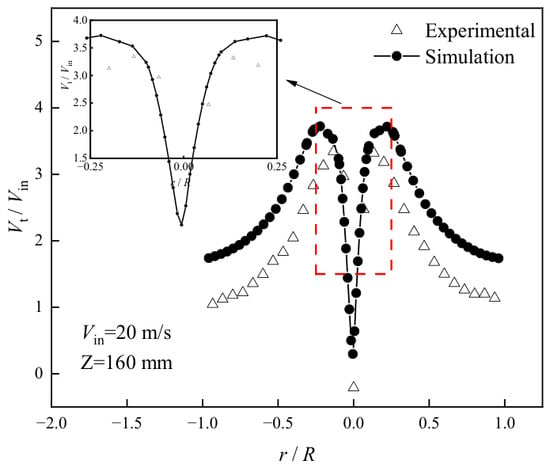
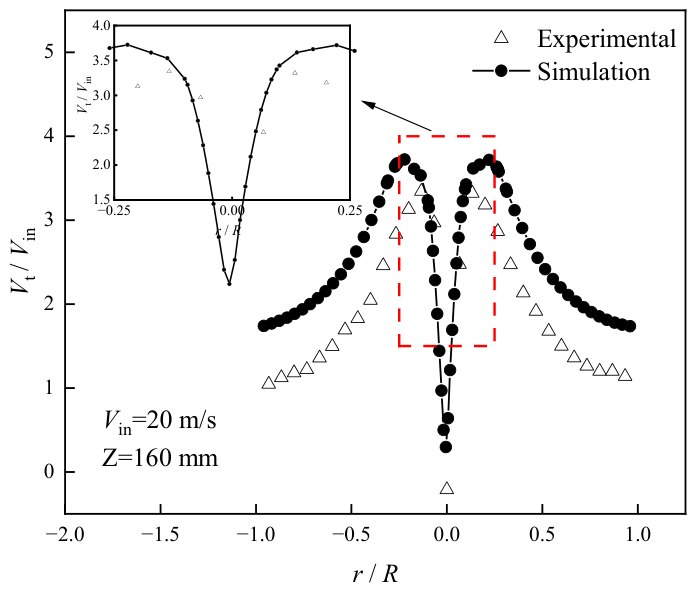
To verify the accuracy of the computational method, the numerical simulation results are compared with the experimental data obtained by Chen [18] for a cyclone separator of the same dimensions. This type of benchmark comparison follows common CFD validation practice, as also demonstrated in recent experimental and numerical studies [19], where available global-flow quantities are first used to verify the numerical model before local flow mechanisms are discussed. The tangential velocity along the centerline of the cross-section at Z = 160 mm was selected for comparison. As shown in Figure 4, the simulated tangential velocity distribution agrees well with the experimental values in terms of the variation trend, confirming the reliability of the numerical method adopted in this study.
Figure 4.
Comparison of experimental and simulated results of dimensional tangential velocity.
It should be noted that the available experimental data provide validation for the global swirling-flow field rather than for local short-circuit flow penetration depths or radial-velocity magnitudes. Therefore, the comparison with tangential velocity is used here as a representative verification of the numerical model. Based on this, the same numerical settings are applied to all subsequent calculations for cyclone separators with other structures. This validation strategy is consistent with recent CFD-based studies on complex flow systems, where experimentally available global quantities are first used to establish the reliability of the numerical method before local flow mechanisms are further analyzed [20].
3. Results and Discussion
3.1. Determination and Analysis of the Short-Circuit Flow Region
Based on the continuity equation, the radial velocity at the vortex finder radius, r = d/2, can be expressed as
where is the downward flow rate, m3/s. This relation indicates that a relatively large radial velocity is expected near the lower opening of the vortex finder to satisfy local flow continuity. Therefore, the radial velocity along the extension lines of the vortex finder’s inner wall can be used as an effective indicator for identifying the short-circuit flow influence zone.
To analyze the flow characteristics of the short-circuit flow, it is first necessary to determine the extent of its influence zone. The radial velocities along the extension lines of the vortex finder’s inner wall (D = 96 mm) in different circumferential directions were extracted, because these lines provide a direct wall-normal reference for tracking the inward penetration of the leakage flow from the annular space into the vortex finder. The sampling locations are shown in Figure 5. This type of circumferentially varying transport path is consistent with the non-uniform and tortuous three-dimensional flow routes observed in other complex transport systems [21].
Figure 5.
Circumferential sampling directions along the extension lines of the vortex finder inner wall.
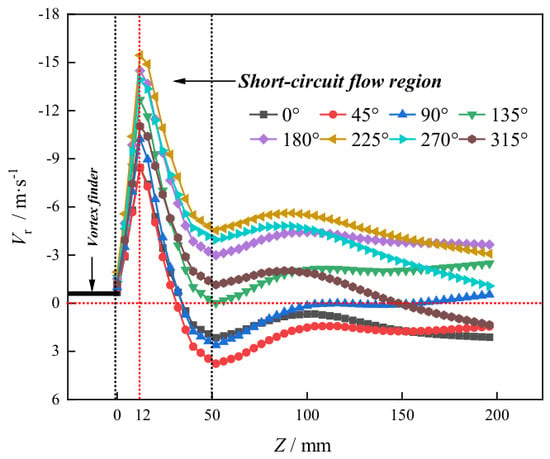
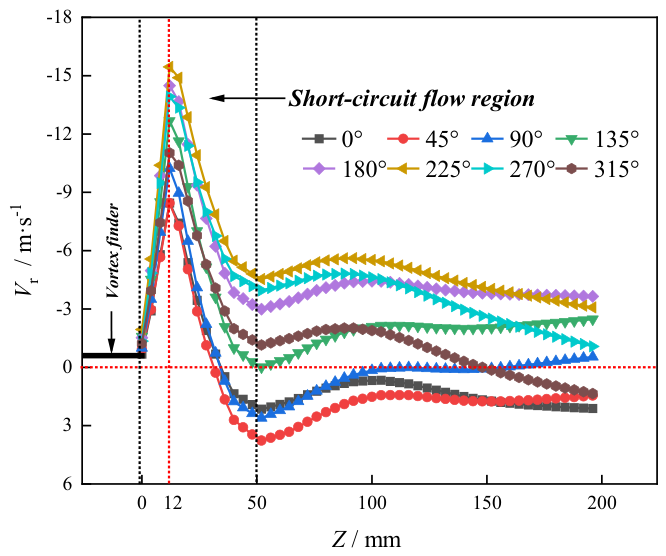
Figure 6 shows the radial velocity variation curves along the extension lines of the inner wall of the vortex finder in different circumferential directions, where a negative value denotes inward motion. Although all directions exhibit a pronounced inward radial motion near the vortex-finder inlet, the peak magnitude and the decay depth vary significantly with circumferential position, demonstrating strong angular non-uniformity of the short-circuit flow influence. In particular, the sector opposite the inlet (about 180–270°) shows the deepest penetration and the largest inward radial velocity, whereas the inlet-side sectors (0–90°) decay earlier. This sector-dependent behavior is similar to other transport processes in which local structural differences lead to spatially varying responses [22]. Therefore, the short-circuit flow influence zone should be quantified by a sector-resolved metric.
Figure 6.
Radial velocity variation curves along the extension lines of the inner wall of the vortex finder in various directions.
In the present work, the four-sector division adopted in the subsequent index calculation provides a practical representation of the dominant circumferential asymmetry, while an eight-sector partition can be used as a sensitivity check to verify that the main conclusions are not altered by a finer angular discretization.
When the airflow reaches the vortex finder inlet, the radial velocity increases sharply and reaches a maximum near Z = 12 mm in all directions (red dashed line), indicating that the short-circuit flow is most intense at this axial position. The smallest peak inward radial velocity, −8.45 m/s, occurs in the 0–45° range, while the largest value, −15.45 m/s, is found near 225°. This circumferential difference reflects the combined effect of the annular-space flow converging toward the vortex finder and compression caused by the incoming jet.
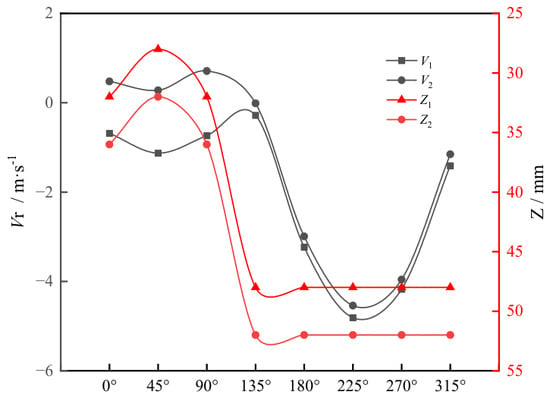
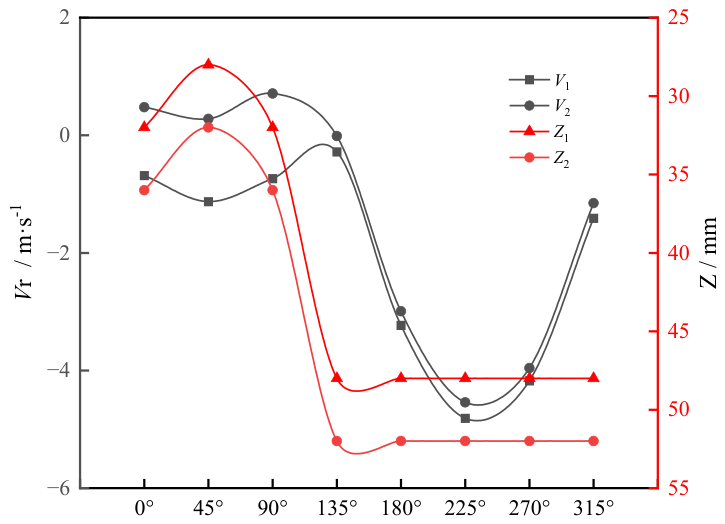
As the axial position decreases, the inward radial velocity gradually declines. However, the axial position at which the radial velocity changes trend varies significantly with circumferential location, as shown in Figure 7. For each circumferential sampling line, the turning point is identified as the axial position at which the inward radial velocity curve reaches its local minimum and then begins to recover, namely, where the curve changes from a decreasing trend to a non-decreasing trend or from negative values towards zero or positive values. Here, V1 and V2 are used to identify the turning point of the radial-velocity profile, and Z1 and Z2 denote the corresponding axial coordinates on both sides of this turning region. These parameters are introduced to characterize the local turning behavior of the radial-velocity curve and to determine the lower boundary of the short-circuit flow influence zone. The coordinate denotes the axial position where the inward radial velocity attains its maximum magnitude in sector i, and it is determined as the minimum value on the corresponding radial-velocity curve before the turning point.
Figure 7.
Short-circuit flow boundary.
In the 0–90° sector, the turning point appears at approximately Z = 35 mm; in the 90–180° sector, at approximately Z = 45 mm; in the 180–270° sector, at approximately Z = 55 mm; and in the 270–360° sector, at approximately Z = 50 mm. These results indicate that the lower boundary of the short-circuit flow influence zone is not a horizontal plane but a circumferentially varying curved surface. Among the four sectors, the 180–270° sector exhibits the greatest penetration depth, which also corresponds to the strongest inward radial flow.
To quantitatively characterize the short-circuit flow intensity, a short-circuit flow intensity index is defined as
where A is the cross-sectional area of the short-circuit flow influence zone, and is the inward radial velocity, with only negative values considered. The integrated quantity therefore represents the inward radial mass flux within the effective leakage region and has the unit of kg/s.
The eight-direction sampling shown in Figure 6 is used as a sensitivity check to verify the robustness of the proposed sector-resolved description. Since the same effective influence zone is integrated, refinement from four sectors to eight sectors does not alter the global index value; it only improves the circumferential resolution of the flow-field description. The dominant leakage region remains on the side opposite the inlet under both discretizations.
The proposed reflects the overall inward transport capacity within the influence zone, rather than a local velocity extreme at a single point. By integrating the negative radial velocity over the identified three-dimensional region, the index captures both the intensity of inward motion and the spatial extent of the leakage path. Since the lower boundary of the influence zone varies circumferentially, a sector-wise treatment is necessary to avoid underestimating or overestimating local contributions from regions with different penetration depths.
Based on the above analysis, the lower boundary of the short-circuit flow influence zone is not a horizontal plane but a curved surface that varies circumferentially. To simplify the calculation, a short-circuit flow intensity index considering circumferential non-uniformity is proposed here. The circumference is divided into four sectors, namely Sector I (0–90°), Sector II (90–180°), Sector III (180–270°), and Sector IV (270–360°), and the influence depth of the short-circuit flow is determined separately for each sector. Under this definition, the contribution of each sector to can be compared directly, and the dominant short-circuit channel can be identified unambiguously. The influence depth in each sector is determined separately; the definition is as follows:
where is the outer wall radius of the vortex finder (47.5 mm), and are the circumferential limits of sector i, is the lower boundary of the short-circuit-flow influence zone in sector i, is the inward radial velocity (only negative values are considered), and ρ is the air density. This expression quantifies the total short-circuit flow mass rate by integrating the inward radial mass flux over the sector-wise influence zone. To further eliminate the influence of operating conditions, a dimensionless form is introduced:
The normalization in Equation (20) is performed by dividing the short-circuit flow mass flow rate by the total inlet mass flow rate, thereby yielding a dimensionless index. The calculation results show that Sector III (180–270°) contributes the largest proportion, accounting for 38.7% of the total , which is consistent with the observation in Figure 7 that the peak inward radial velocity is highest in this region. For the present case, = 0.127 indicates that approximately 12.7% of the inlet mass flow rate is associated with effective short-circuit leakage.
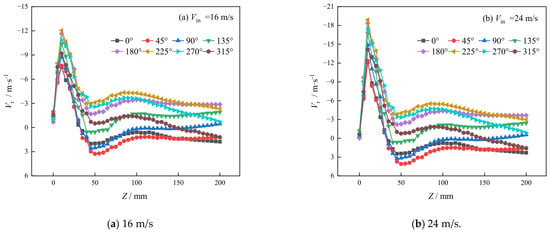
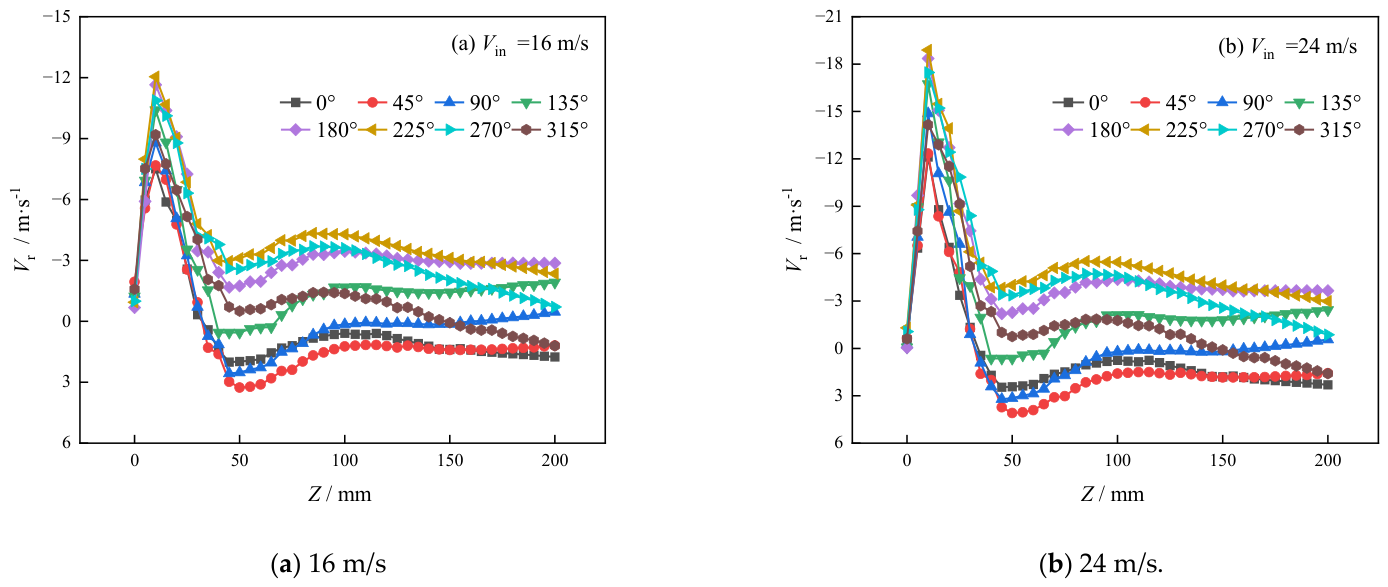
To further investigate the effect of inlet velocity on the short-circuit flow intensity, the inlet velocity was set to 16 m/s and 24 m/s, respectively, while keeping the geometry, boundary conditions, and turbulence model unchanged. The radial velocity Vr along the extension line of the vortex finder’s inner wall was extracted at each circumferential position using the same procedure as that adopted for the baseline case. Figure 8a,b present the resulting Vr–Z distributions for the 16 m/s and 24 m/s cases, respectively. The overall evolution of the curves under both inlet velocities is consistent with that of the 20 m/s baseline condition: the near-wall radial velocity reaches a peak inward value at approximately 12 mm and then gradually decays with increasing Z, approaching zero or changing direction within 35–55 mm depending on the circumferential position. For the 16 m/s case, the influence depths of the short-circuit flow are approximately 35 mm, 45 mm, 55 mm, and 50 mm in the four sectors, respectively, while the corresponding values for the 24 m/s case remain essentially unchanged. This indicates that varying the inlet velocity within the present range does not significantly alter the circumferential non-uniformity of the short-circuit flow influence zone. Furthermore, by integrating the negative radial velocity within the sector-wise influence zones according to Equation (19) and normalizing the result by the total inlet mass flow rate according to Equation (20), the dimensionless short-circuit flow intensity index is approximately 0.127 for both the 16 and 24 m/s cases. This result indicates that, within the limited inlet-velocity range examined in this study, the normalized short-circuit flow intensity remains nearly unchanged; however, broader verification over a wider velocity range is still needed.
Figure 8.
Radial velocity variation curves along the extension line of the vortex finder’s inner wall under different inlet velocities.
3.2. Velocity and Static Pressure Distributions in Planes at Different Axial Positions
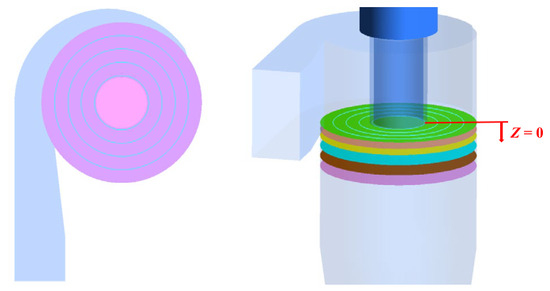
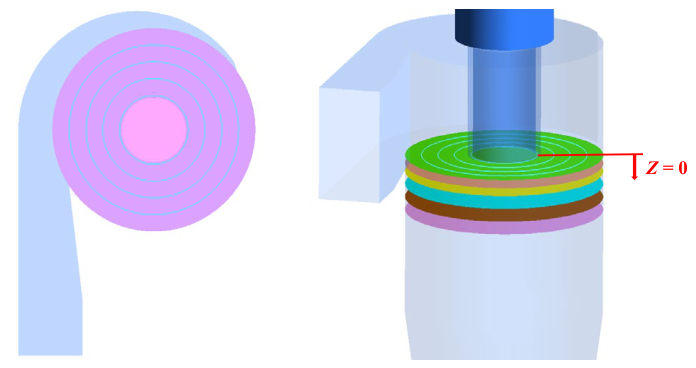
To gain in-depth insight into the flow characteristics within the short-circuit flow influence zone, based on the short-circuit flow region determined in Section 3.1 (axial range 0–55 mm, with circumferentially divided boundaries), six typical axial cross-sections (Z = 1, 12, 24, 32, 53, and 60 mm) and four radial positions (D = 100, 150, 200, and 250 mm) were selected for velocity field analysis. The sampling locations are shown in Figure 9. The circumferentially non-uniform velocity patterns on these cross-sections agree well with the sector-resolved penetration depths derived above. Among these, the cross-section at Z = 12 mm corresponds to the peak radial inward velocity, and Z = 53 mm is close to the lower boundary of the short-circuit flow influence zone.
Figure 9.
Sampling locations. The horizontal planes shown from top to bottom correspond to Z = 1, 12, 24, 32, 53, and 60 mm, respectively.
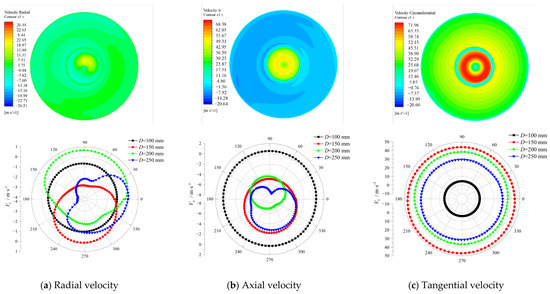
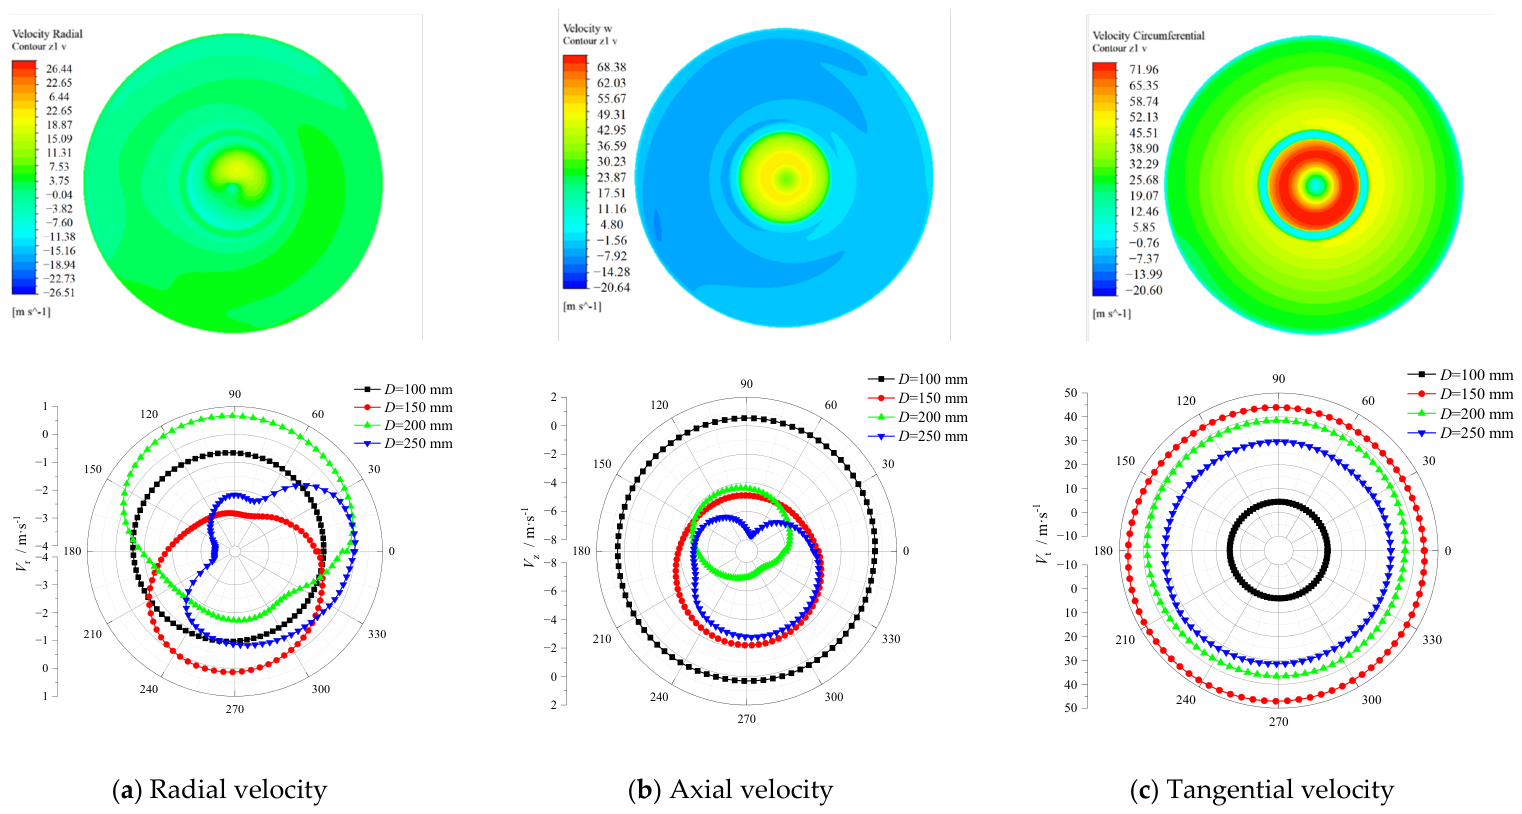
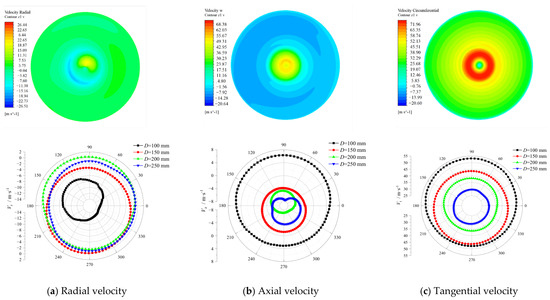
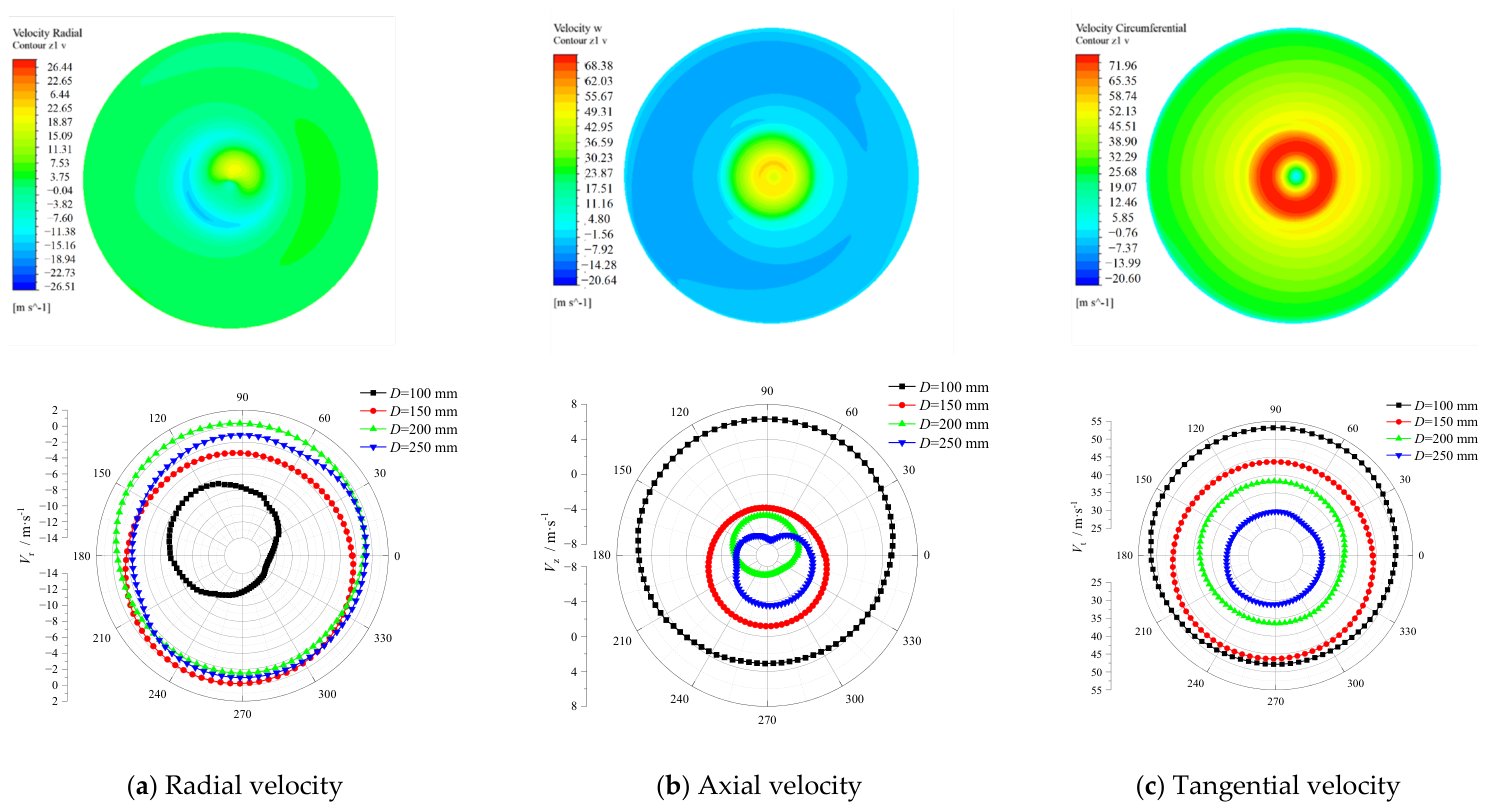
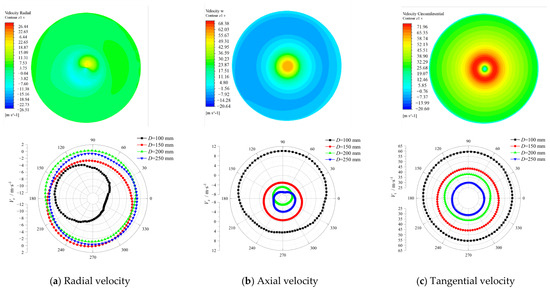
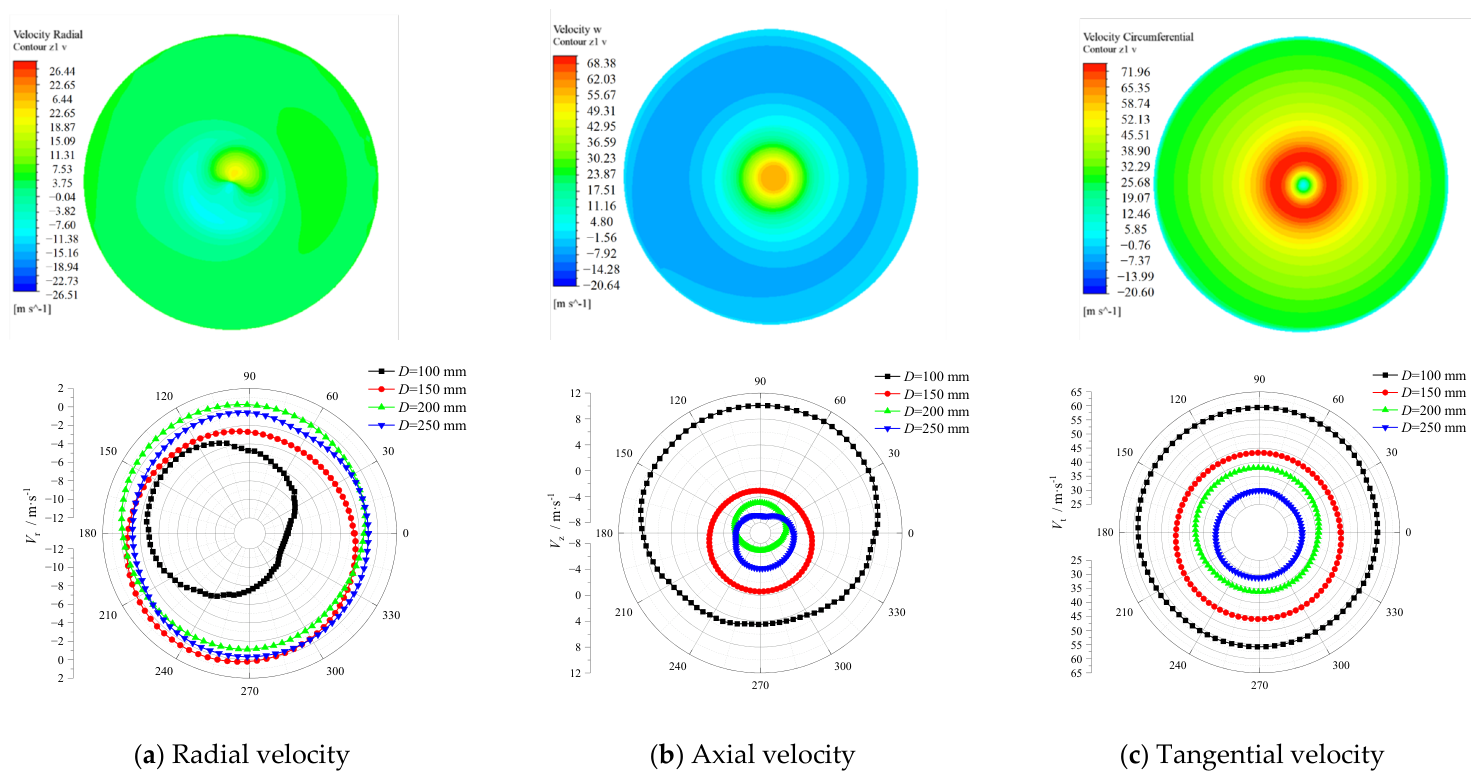
The distributions of the radial, axial, and tangential velocities along the circumferential direction at different radial positions on different cross-sections are shown in Figure 10, Figure 11, Figure 12, Figure 13, Figure 14 and Figure 15, respectively. Positive and negative values indicate different velocity directions: a positive radial velocity is directed outward, while a negative radial velocity denotes an inward velocity; a positive axial velocity points upward, and a negative axial velocity points downward. The magnitude of the tangential velocity is the main factor influencing the centrifugal force acting on particles. A higher tangential velocity generates a stronger centrifugal field, thereby achieving greater separation efficiency. A large tangential velocity can effectively prevent particles from escaping via the short-circuit flow.
Figure 10.
Velocity distribution in the plane at Z = 1 mm.
Figure 11.
Velocity distribution in the plane at Z = 12 mm.
Figure 12.
Velocity distribution in the plane at Z = 24 mm.
Figure 13.
Velocity distribution in the plane at Z = 32 mm.
Figure 14.
Velocity distribution in the plane at Z = 53 mm.
Figure 15.
Velocity distribution in the plane at Z = 60 mm.
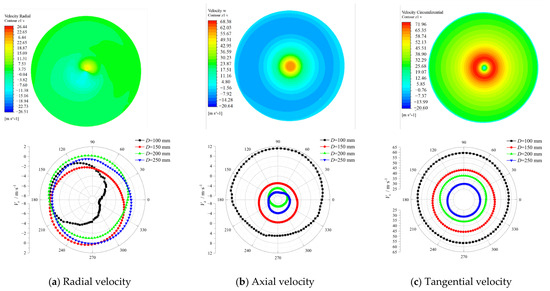
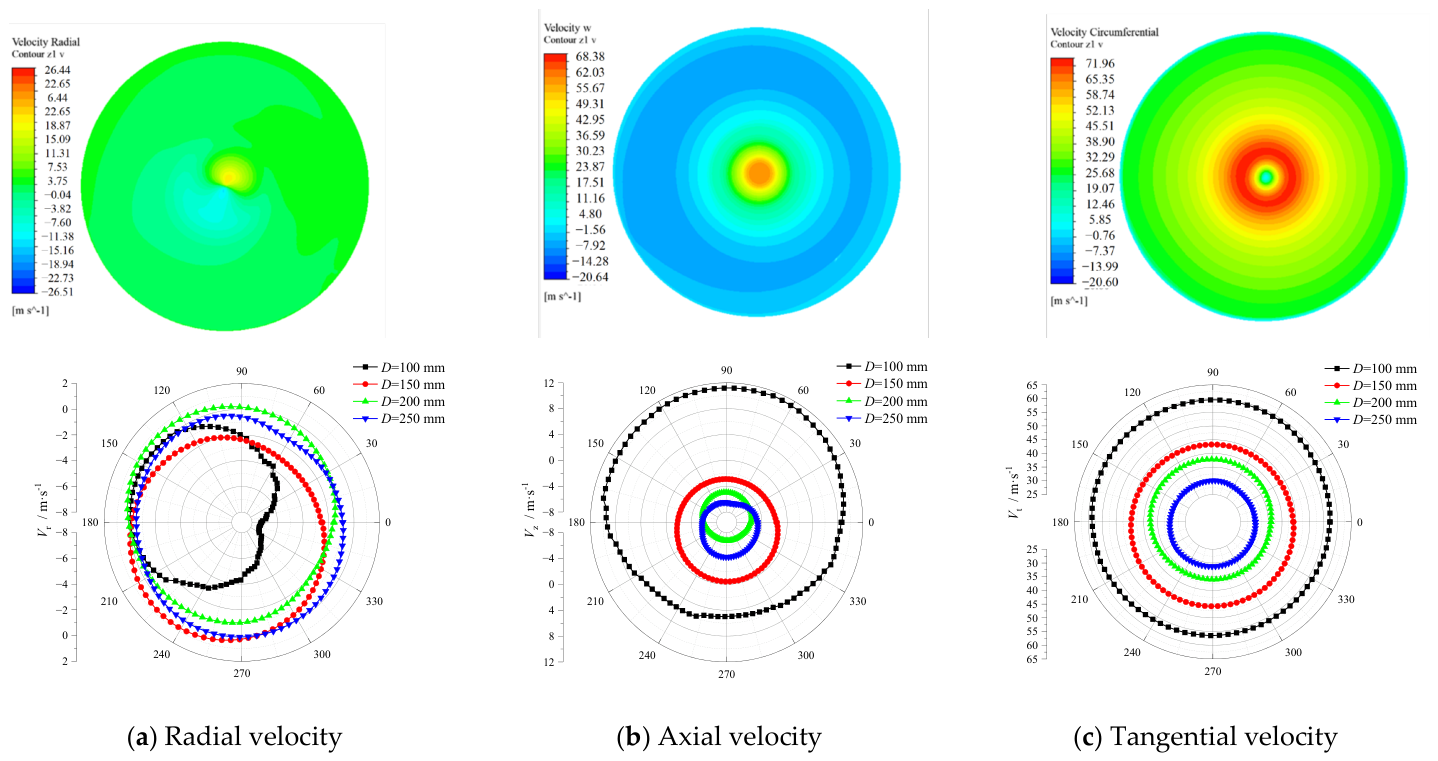
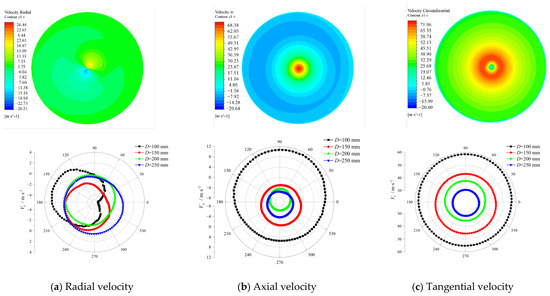
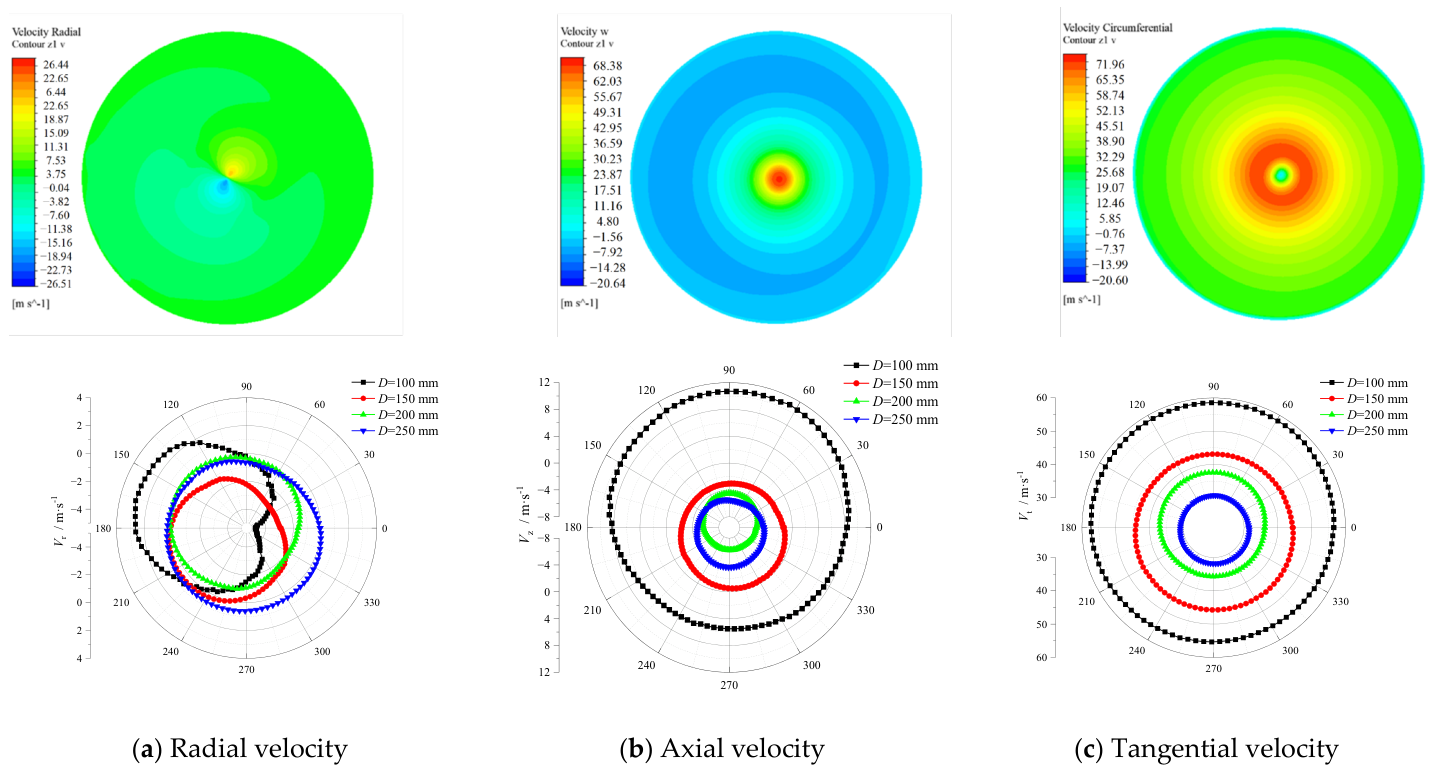
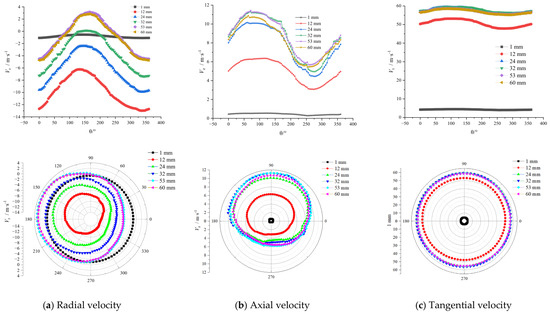
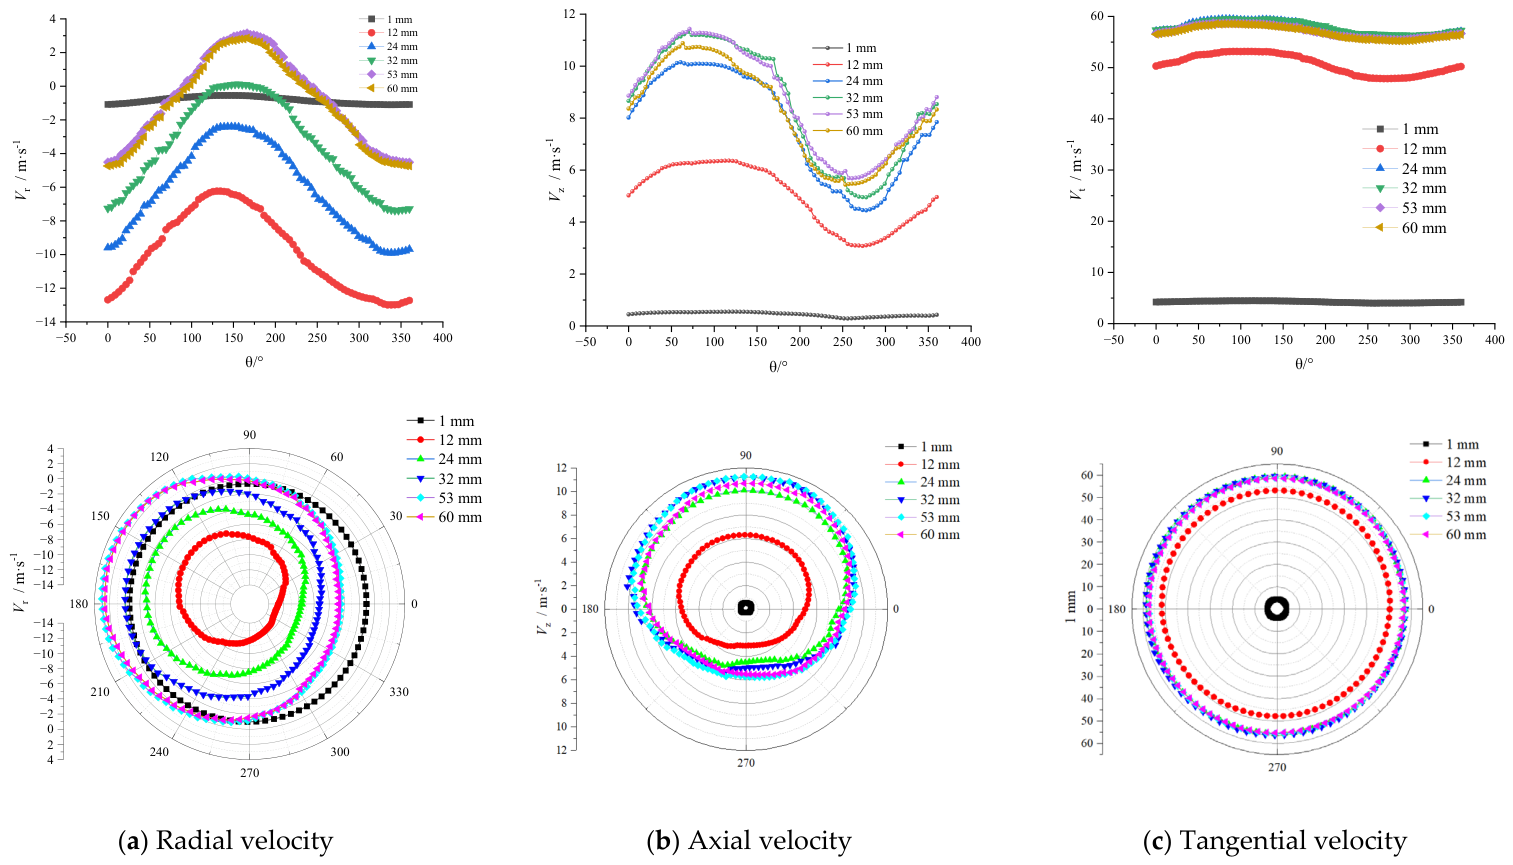
From the velocity distribution in the plane at Z = 1 mm (Figure 10), it can be observed that the tangential velocity exhibits relatively good symmetry, whereas the radial and axial velocity distributions display significant asymmetry, which results from the asymmetry of the inlet structure. It is noteworthy that on the annulus close to the vortex finder (D = 100 mm), the distributions of all three velocity components are relatively uniform. This indicates that the fluid in the central region is hardly affected by the inlet flow, while the fluid in the outer region is strongly influenced by it.
As shown in Figure 10a, in the near-axis region (D = 100 mm), the radial velocity Vr remains negative at all circumferential positions, indicating that the fluid continuously converges toward the axis (inward flow). With increasing radial position, the radial velocity in the outer annular region exhibits considerable fluctuation. At D = 150 mm, the inward radial velocity is relatively large within the range of 30–210°, but as the radius increases to 200 mm, Vr in this direction changes from negative to positive, suggesting weak centrifugal motion of the fluid in this zone. This behavior results from the combined effects of inlet-jet compression and vortex-core displacement: the inlet jet mainly produces a local high-pressure region near the inlet side, whereas the displaced low-pressure vortex core shifts circumferentially and alters the radial pressure gradient, causing Vr to alternate between positive and negative values.
From the axial velocity distribution (Figure 10b), it can be observed that at D = 100 mm (near the vortex finder), Vz takes a small positive value, indicating upward flow at this radial position. As the radius increases, Vz changes from positive to negative, and the negative value increases with the radius, suggesting that the main flow in the outer annular region moves downward. On the outer side of the inlet region (D = 250 mm), the overall axial velocity is higher than that on the opposite side, and it further increases in the negative direction. This phenomenon arises because, after passing through the narrow inlet, the flow velocity increases sharply, converting dynamic pressure into static pressure, causing the gas to rapidly change from straight-through motion to centrifugal motion upon entering the separator. The gas then spirals downward along the cylinder wall in the direction of the incoming flow, simultaneously squeezing the fluid near the inlet and forcing it to flow downward rapidly.
Regarding the tangential velocity (Figure 10c), it varies little in the circumferential direction but differs significantly in different radial positions. Near D = 100 mm, the velocity remains between 4 and 4.5 m/s. As the radius increases to D = 150 mm, it surges to approximately 45 m/s. Due to the presence of the boundary layer and frictional resistance, with a further increase in radius, the tangential velocity of the swirling flow near the wall decreases sharply, forming a typical “Rankine vortex” structure.
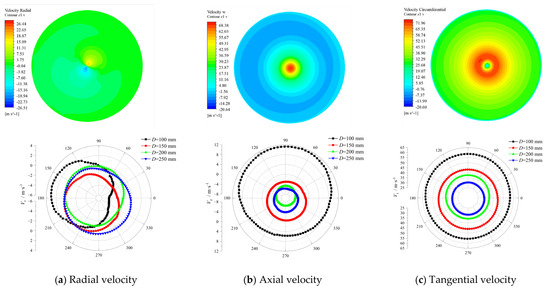
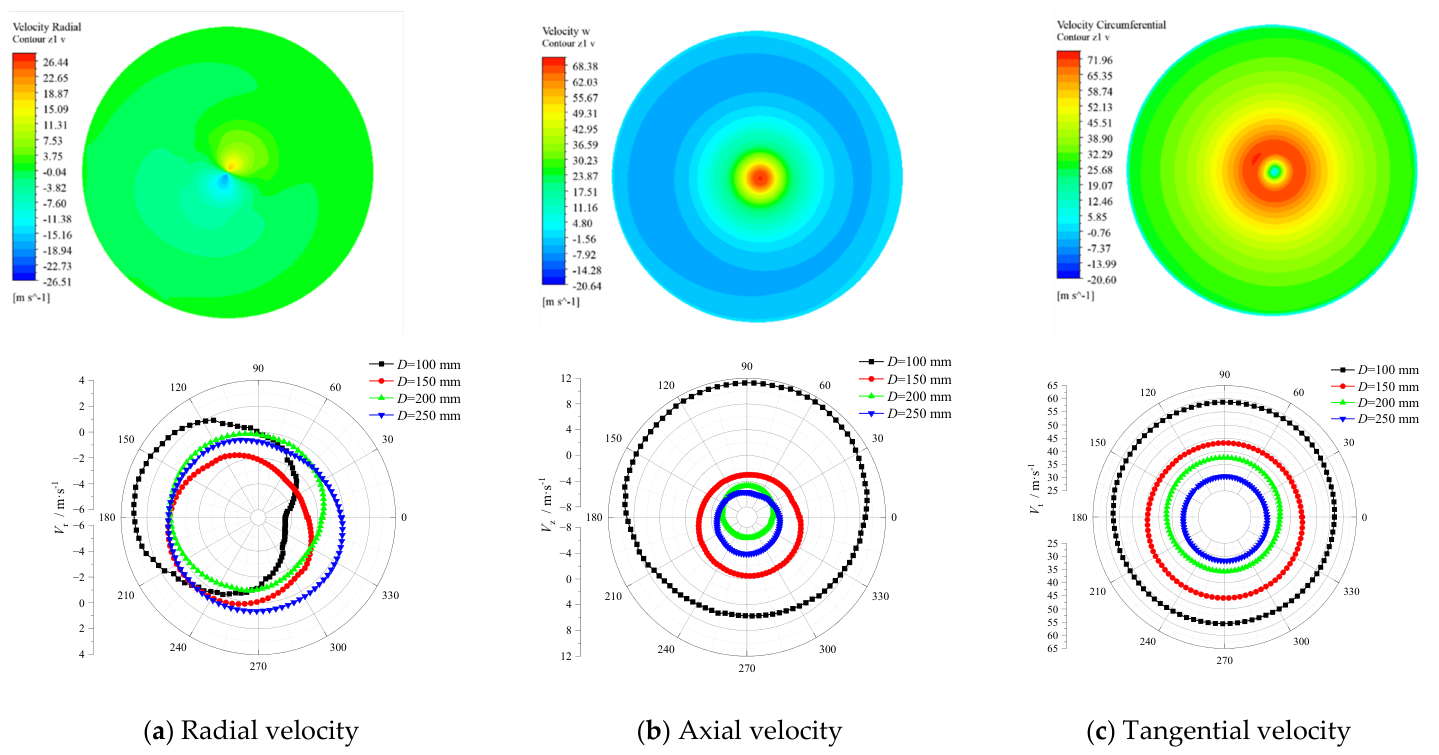
As shown in Figure 11, with the downward movement of the airflow, the radial velocity at D = 100 mm still exhibits pronounced asymmetry, and at this radial position the radial velocities in all circumferential directions are inward. In particular, the inward radial velocity in the range from 270° to 360° is noticeably higher than in other directions, indicating that this direction is the main pathway for the short-circuit flow. At D = 150 mm, Vr remains negative (−2.54 to −3.65 m/s), suggesting the persistent presence of inward flow. As the radius continues to increase, Vr turns positive in certain angular ranges, marking a transition from inward flow to outward flow.
At D = 100 mm, Vz is positive over most circumferential ranges, indicating upward flow in the axial region, but it is higher within the 60–120° range (θ = 60–120°, Vz ≈ 5.0–6.3 m/s). As the radius increases, Vz becomes negative (−2.7 to −7.76 m/s), with the largest negative values occurring in the 60–240° range, corresponding to the squeezing effect of the inlet jet.
The tangential velocity is relatively uniformly distributed along the circumferential direction but differs significantly at different radial positions. Unlike the plane at Z = 1 mm, on this plane the tangential velocity at the radial position D = 100 mm is much higher than that in the outer annular region, and the tangential velocity decreases with increasing radius, conforming to the characteristics of a free vortex.
As the airflow continues to spiral downward, the axial and radial velocity distributions on each plane are very similar to those on the plane at Z = 12 mm (Figure 12, Figure 13, Figure 14 and Figure 15). Only the radial velocity distribution varies considerably, particularly the radial velocity near the axis. As the axial position decreases, the radial inward velocity gradually diminishes, and by Z = 53 mm, centrifugal flow (Vr > 0) appears in some regions (90–240°) (see Figure 14a and Figure 15a), indicating that the short-circuit flow influence has essentially vanished at this cross-section. This attenuation trend is consistent with the short-circuit flow influence depth (35–55 mm) determined for each sector in Section 3.1, further validating the rationality of the sector-wise integration method.
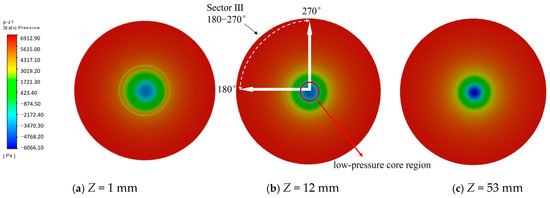
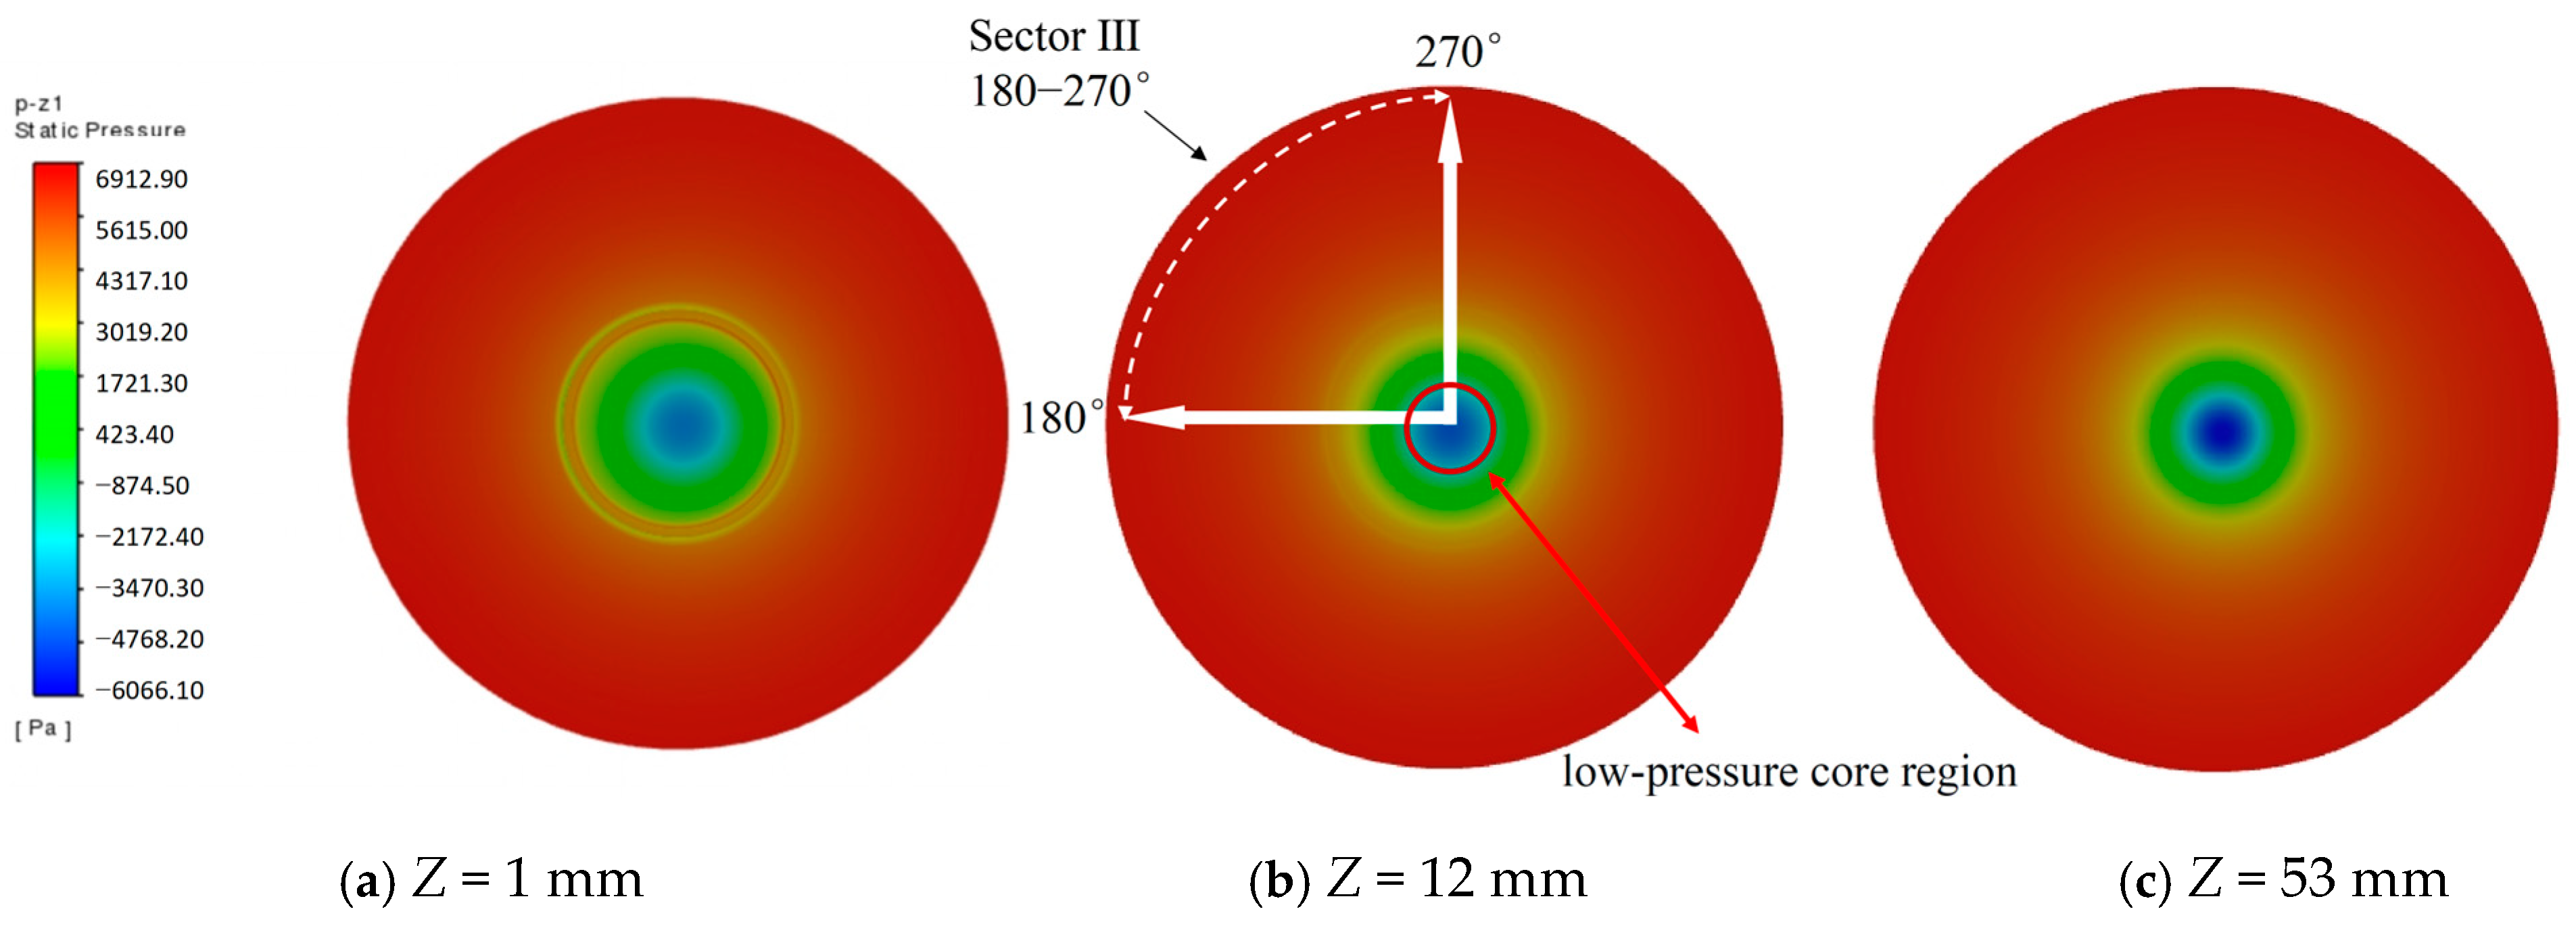
To further elucidate the pressure field associated with the short-circuit flow influence zone, Figure 16 shows the static pressure distributions at Z = 1, 12, and 53 mm. At Z = 1 mm, a distinct high-pressure region is observed near the inlet side, indicating an immediate pressure rise after the inlet jet enters the cyclone. At Z = 12 mm, the pressure difference between the inlet side and the vortex-core region becomes most pronounced, which is consistent with the maximum inward radial velocity observed in the corresponding velocity field. As shown in Figure 16b, the low-pressure core region is displaced toward Sector III (180–270°), which coincides with the sector exhibiting the maximum short-circuit flow intensity. This spatial correspondence indicates that the circumferential pressure imbalance and vortex-core displacement jointly promote the strongest inward leakage in this sector. At Z = 53 mm, the pressure gradient weakens markedly, suggesting that the pressure-driven leakage has largely decayed near the lower boundary of the influence zone. These results are consistent with the interpretation that the short-circuit flow is promoted by the coupled effects of inlet-jet compression and vortex-core displacement, which together form a circumferentially non-uniform pressure field and drive inward radial migration.
Figure 16.
Static pressure distributions on the cross-sections.
3.3. Velocity Distribution in the Axial Region
To further clarify the flow evolution near the axis, the radial velocity distributions at different axial positions in the near-axis region (D = 100 mm) were compared in two coordinate systems, as shown in Figure 17. This region is not only where the radial inward flow develops most strongly but also where the flow transitions from the annular space into the separation space. In this zone, the velocity and pressure fields undergo abrupt changes, and the tangential velocity distribution evolves from a simple swirling pattern to a Rankine vortex structure.
Figure 17.
Velocity distribution at different axial positions in the axial region.
According to the moment-of-momentum equation,
After differentiating with respect to time,
At a radial position , the increment of the tangential velocity is proportional to the radial velocity . Near the vortex finder inlet (Z = 1–24 mm), the radial velocity is relatively large, so the tangential velocity increases substantially (from 4.22 to 57.13; see Figure 10c, Figure 11c and Figure 12c). Further downward along the axial direction, the tangential velocity essentially remains constant. This region therefore coincides with the core zone of short-circuit flow development.
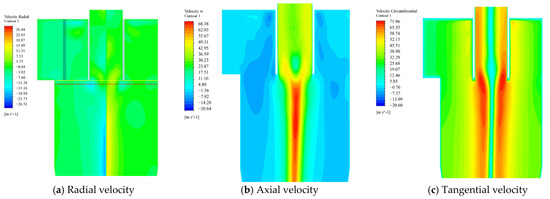
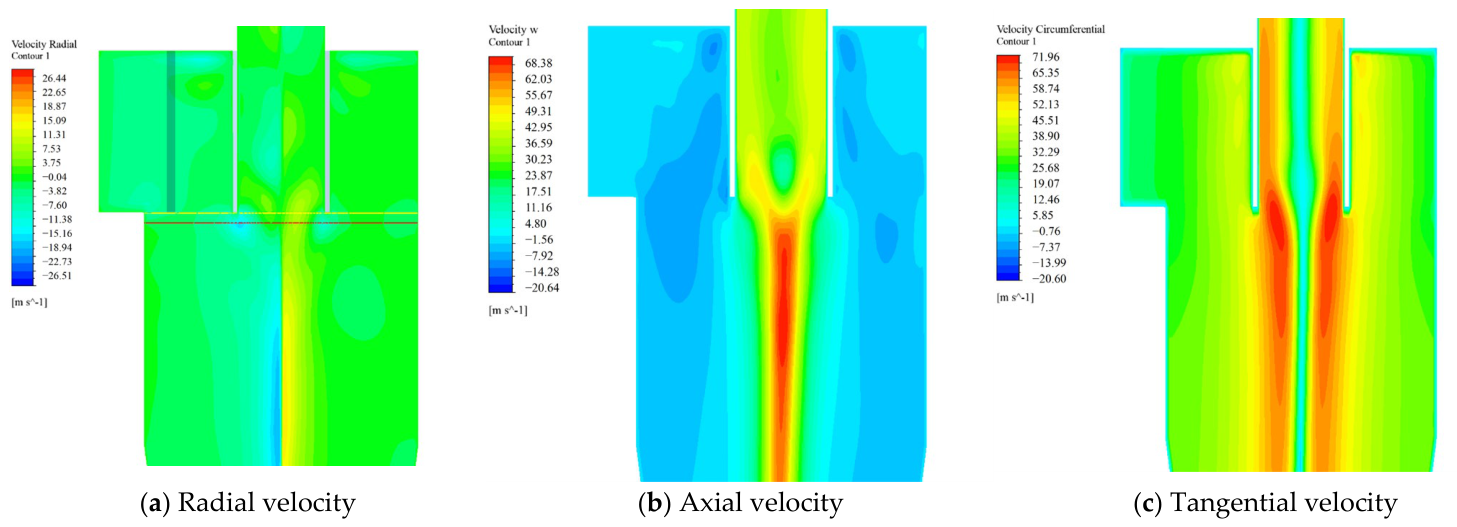
Figure 18 shows the velocity distributions in the XZ plane. From the axial velocity contour in Figure 18b, it can be observed that there exists a high-speed downward flow region near the wall of the vortex finder. Affected by the upward flow outside the axial region, the normal downward movement of the airflow in this area is obstructed. The downward flow near the end of the vortex finder is entrained by the upward flow outside the axial region, turning into an inward radial flow and eventually entering the vortex finder. The radial velocity contour (Figure 18a) also reveals an obvious high radial inward velocity zone at the end of the vortex finder, indicating a severe short-circuit flow phenomenon at this axial position (Z = 12 mm, marked by the red straight line), which is consistent with the conclusion drawn in Section 3.1. Meanwhile, the high-velocity region on the left side is significantly larger than that on the right side, which is attributed to the fact that the left side is close to the airflow inlet and is squeezed by the incoming flow.
Figure 18.
Velocity distribution in the XZ plane.
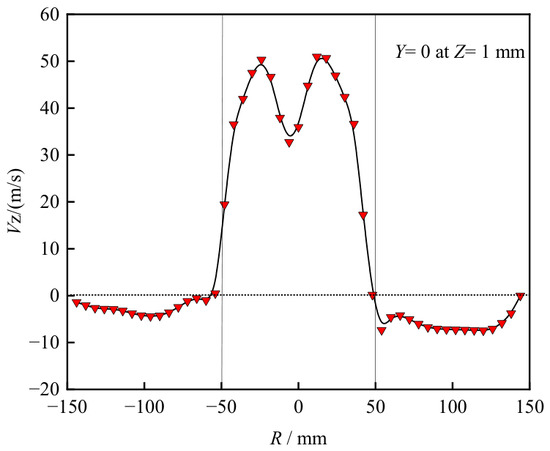
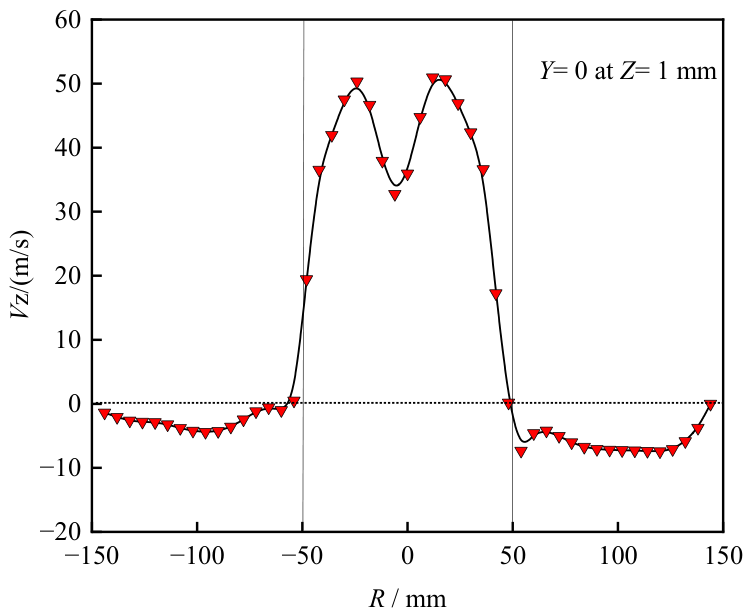
Figure 19 presents the axial velocity distribution along the line Y = 0 at Z = 1 mm, with the sampling location indicated by the yellow line in Figure 18a. Near the inner wall of the vortex finder, a small portion of the downward flow traveling along the wall is impacted by the upward flow, causing the axial velocity near the lower edge of the outer wall of the vortex finder to approach zero. This velocity is far lower than the downward main flow in the outer annular region, severely disrupting the normal development of the downward flow.
Figure 19.
Axial velocity distribution along line Y = 0 at Z = 1 mm.
The formation of short-circuit flow can be understood as a sequential process driven by the circumferentially non-uniform pressure field and expressed through the velocity field, in which inlet-jet compression, vortex-core displacement, and the interaction between downward wall flow and upward core flow act together. This type of coupled-mechanism interpretation is consistent with recent studies that analyze complex flow evolution through the interaction of multiple physical factors, rather than attributing the observed behavior to a single cause [23]. After the high-speed inlet jet enters the cyclone, its sudden deceleration converts part of the dynamic pressure into static pressure, producing a local high-pressure region near the inlet side of the cylinder. Meanwhile, the vortex core remains a low-pressure region and is displaced circumferentially due to the asymmetric inlet momentum. This pressure imbalance drives the gas to move inward in the radial direction, while the axial upward flow near the vortex finder further modifies the trajectory of the descending fluid. As a result, a preferred leakage path gradually develops beneath the vortex finder inlet and eventually evolves into a stable short-circuit flow channel.
It can thus be concluded that the generation of short-circuit flow results from the coupled effects of inlet-jet compression, vortex-core displacement, and the interaction between downward wall flow and upward core flow, rather than from a single dominant factor alone. After the high-velocity airflow passes through the narrow inlet and enters the cylinder body, the flow velocity drops abruptly, dynamic pressure is converted into static pressure, and a local high-pressure zone is formed within the range of θ = 80–270°. The pressure gradient between this high-pressure zone and the low-pressure vortex core drives the airflow to migrate toward the axis, while the displaced vortex core further enhances the circumferential asymmetry of the inward radial motion. The resulting inward motion interacts with the upward flow in the axial zone, causing part of the airflow to be drawn into the vortex finder before reaching the separation zone, thereby resulting in the short-circuit flow phenomenon.
4. Conclusions
Based on the Reynolds stress model (RSM), this study numerically investigated the flow characteristics of short-circuit flow in a PV-type cyclone separator. The short-circuit-flow influence zone was identified by analyzing the radial velocity along the extension lines of the vortex finder’s inner wall in different circumferential directions, and a sector-resolved short-circuit flow intensity index was proposed to quantify its circumferential non-uniformity. The velocity distributions at different axial positions within the identified influence zone were further examined to reveal the evolution of the radial, axial, and tangential flow structures. By combining the velocity and pressure fields, the formation mechanism of short-circuit flow was clarified. The main conclusions are as follows:
(1) The short-circuit flow influence zone is not bounded by a horizontal plane but by a circumferentially varying curved surface. The influence depth is approximately 35 mm in the 0–90° sector, 45 mm in the 90–180° sector, 55 mm in the 180–270° sector, and 50 mm in the 270–360° sector. Among these, the 180–270° sector, opposite the inlet, exhibits the greatest penetration depth and the strongest inward radial velocity (−15.45 m/s), indicating that the main short-circuit channel is located on the side opposite the inlet.
(2) To quantitatively characterize short-circuit flow, a sector-resolved short-circuit flow intensity index was proposed. Its dimensionless form provides a normalized measure of the short-circuit flow strength under the present operating condition. For the present case, Sector III (180–270°) contributes 38.7% of the total intensity, and the overall dimensionless index is 0.127, which indicates that approximately 12.7% of the inlet mass flow rate is associated with effective short-circuit leakage.
(3) Within the identified influence zone, the inward radial velocity reaches its maximum at Z = 12 mm and then gradually decays. By Z = 53 mm, the radial flow in some circumferential regions has already reversed outward, suggesting that the short-circuit flow influence has largely diminished. Meanwhile, the tangential velocity increases from 4.22 to 57.13 m/s in the same region and develops a Rankine-type vortex structure, indicating that the short-circuit flow zone is also a key region for swirl development.
(4) The formation of short-circuit flow is governed by the coupled effects of inlet jet squeezing, vortex-core displacement, and the interaction between downward wall flow and upward core flow. After entering the cyclone, the high-speed gas jet generates a circumferentially non-uniform pressure field, which promotes radial inward migration toward the vortex finder. At the same time, the upward flow near the axis entrains part of the downward wall flow, creating a preferential leakage path beneath the vortex finder. In this process, inlet-jet compression mainly produces a local high-pressure region near the inlet side, whereas vortex-core displacement shifts the low-pressure core circumferentially and strengthens the non-uniformity of the radial pressure gradient.
(5) The proposed influence-zone definition and intensity index provide a useful quantitative basis for comparing cyclone structures and operating conditions and for evaluating the effectiveness of vortex-finder modifications and other short-circuit flow suppression strategies. In particular, a lower index value indicates a weaker short-circuit leakage tendency and is expected to correspond to reduced particle bypass. Future work should further examine the influence of inlet configuration, vortex-finder geometry, and operating conditions on the proposed index and relate the index more directly to separation efficiency and particle escape behavior.
Author Contributions
Conceptualization, Y.L., M.C. and Y.W.; software, Y.L.; formal analysis, Y.L.; investigation, M.C., X.D., Y.Y. and D.Z.; data curation, M.C. and X.D.; writing—original draft preparation, Y.L.; writing—review and editing, J.S. and Y.W.; visualization, X.D., Y.Y. and D.Z.; supervision, J.S. and Y.W.; funding acquisition, J.S. All authors have read and agreed to the published version of the manuscript.
Funding
This research was funded by the National Natural Science Foundation of China (Grant No. 22178382).
Data Availability Statement
All data generated or analyzed during this study are included in the article.
Conflicts of Interest
Authors Yingli Li and Meixi Cui were employed by the company China National Petroleum Corporation. The remaining authors declare that the research was conducted in the absence of any commercial or financial relationships that could be construed as a potential conflict of interest.
References
- Ding, X.; Song, J.; Liu, J.; Wu, X.; Wei, F. Dynamic behaviors of heavy oil droplets impacting solid surfaces and liquid films. Powder Technol. 2025, 463, 121127. [Google Scholar] [CrossRef] [Scilit]
- Benzaza, M.I.; Uystepruyst, D.; Beaubert, F.; Méresse, D.; Delcourt, F.; Morin, C. Modeling and analysis of swirling flow in cyclone separators using various hybrid scale-resolving approaches. Comput. Fluids 2026, 307, 106972. [Google Scholar] [CrossRef] [Scilit]
- Parker, M.J.; Savory, E.; Straatman, A.G. Development of a compact cyclone particle separator. Sep. Purif. Technol. 2026, 393, 137198. [Google Scholar] [CrossRef] [Scilit]
- Zhang, Z.; Dong, S.; Jin, R.; Dong, K.; Hou, L.; Wang, B. Vortex characteristics of a gas cyclone determined with different vortex identification methods. Powder Technol. Int. J. Sci. Technol. Wet. Dry. Part. Syst. 2022, 404, 117370. [Google Scholar] [CrossRef] [Scilit]
- Jiang, L.; Liu, P.; Yang, X.; Zhang, Y. Short-Circuit Flow in Hydrocyclones with Arc-Shaped Vortex Finders. Chem. Eng. Technol. 2018, 41, 1783–1792. [Google Scholar] [CrossRef] [Scilit]
- Li, Q.; Wang, Q.; Xu, W.; Zhu, Z.; Zhu, K. Experimental and computational analysis of a cyclone separator with a novel vortex finder. Powder Technol. 2020, 360, 398–410. [Google Scholar] [CrossRef] [Scilit]
- Guo, M.; Yang, L.; Son, H.; Le, D.K.; Manickam, S.; Sun, X.; Yoon, J.Y. An overview of novel geometrical modifications and optimizations of gas-particle cyclone separators. Sep. Purif. Technol. 2024, 329, 24. [Google Scholar] [CrossRef] [Scilit]
- Fu, S.; Zhou, F.; Sun, G.; Yuan, H.; Zhu, J. Performance evaluation of industrial large-scale cyclone separator with novel vortex finder. Adv. Powder Technol. 2021, 32, 931–939. [Google Scholar] [CrossRef] [Scilit]
- Zhao, X. Study on the Erosion Mechanism of Cyclone Separator Wall by Gas-Solid Two-Phase Flow. Ph.D. Thesis, China University of Petroleum, Beijing, China, 2010. [Google Scholar]
- Zhang, Z.; Dong, S.; Dong, K.; Hou, L.; Wang, W.; Wei, Y.; Wang, B. Experimental and numerical study of a gas cyclone with a central filter. Particuology 2022, 63, 47–59. [Google Scholar] [CrossRef] [Scilit]
- Dong, S.; Wang, C.; Zhang, Z.; Cai, Q.; Dong, K.; Cheng, T.; Wang, B. Numerical study of short-circuiting flow and particles in a gas cyclone. Particuology 2023, 72, 81–93. [Google Scholar] [CrossRef] [Scilit]
- Chang, Y.-L.; Jiang, X.; Li, J.-P.; Fu, P.-B.; Yuan, W.; Xin, R.-K.; Huang, Y.; Wang, H.-L. Inlet particle-sorting cyclones configured along a spiral channel for the enhancement of PM2.5 separation. Sep. Purif. Technol. 2021, 257, 117901. [Google Scholar] [CrossRef] [Scilit]
- Zhang, Z.; Yan, S.; Dong, S.; Dong, K.; Zhang, Y.; Wang, B. Study of the short-circuit flow and circulation flow’s impact on separation performance of cyclone separator with volute-helical inlet. Adv. Powder Technol. 2024, 35, 104281. [Google Scholar] [CrossRef] [Scilit]
- Yuan, S.; Sun, G.; Cao, G.; Habudula, G.; Liu, J. Numerical Calculation on the Short-circuit Flow Rate in a Gas Cyclone. Chem. Eng. Res. Des. 2024, 206, 489–498. [Google Scholar] [CrossRef] [Scilit]
- Cao, G.; Sun, J.; Sun, G. Synergistic optimization of coke catcher and anti-backmixing cone in FCC cyclone separator for coke shedding control. Sep. Purif. Technol. 2026, 385, 136388. [Google Scholar] [CrossRef] [Scilit]
- Guo, M.; Xue, H.; Pang, J.; Le, D.K.; Sun, X.; Yoon, J.Y. Numerical investigation on the swirling vortical characteristics of a Stairmand cyclone separator with slotted vortex finder. Powder Technol. 2023, 416, 118236. [Google Scholar] [CrossRef] [Scilit]
- Ye, L.; Guo, H.; Zhu, Y.; Jiang, P. Large eddy simulation of film cooling flow from diffusion slot hole with crossflow coolant configuration. Phys. Fluids 2023, 35, 055101. [Google Scholar] [CrossRef] [Scilit]
- Chen, J. Research on the Separation Theory and Optimal Design Method of Tangential Reverse-Flow Cyclone Separators. Ph.D. Thesis, China University of Petroleum, Beijing, China, 2007. [Google Scholar]
- Amini, Y.; Karimi-Sabet, J.; Esfahany, M.N. Experimental and Numerical Simulation of Dry Pressure Drop in High-Capacity Structured Packings. Chem. Eng. Technol. 2016, 39, 1161–1170. [Google Scholar] [CrossRef] [Scilit]
- Di, D.; Wang, R.; Fang, H.; Shi, M.; Sun, B.; Wang, N.; Li, B. High-resolution analysis of hydraulic response characteristics of silted stormwater pipeline and manholes in urban catchments using GASM-TranGRU and CFD-DEM. Eng. Appl. Comput. Fluid Mech. 2025, 19, 2447389. [Google Scholar] [CrossRef] [Scilit]
- Zhang, J.; Fang, Z.; Zhang, X.; Yu, Y.; Wang, S.; Cao, Y. 3D Fractal Tortuosity Quantification of Impact-Induced Coal Fractures: A Permeability Enhancement Model for Gas Extraction. Rock Mech. Rock Eng. 2026. [Google Scholar] [CrossRef] [Scilit]
- Wu, K.; Li, S.; Zhang, H.; You, B.; Ma, H.; Li, B.; Chen, Y.; Wang, F. Initial Characteristics of Gas Desorption in High-Rank Soft and Hard Coals and the Causes of the Differences. ACS Omega 2025, 10, 33208–33219. [Google Scholar] [CrossRef] [Scilit] [PubMed]
- Gu, Z.; Zhang, C.; Cao, X.; Li, P.; Liu, L.; Li, Z. Mechanistic insights into flue gas-assisted steam flooding: Regulation of heat-mass transfer, energy allocation, and carbon mitigation in heavy oil reservoirs. Energy Convers. Manag. 2026, 364, 121678. [Google Scholar] [CrossRef] [Scilit]

Disclaimer/Publisher’s Note: The statements, opinions and data contained in all publications are solely those of the individual author(s) and contributor(s) and not of MDPI and/or the editor(s). MDPI and/or the editor(s) disclaim responsibility for any injury to people or property resulting from any ideas, methods, instructions or products referred to in the content. |
© 2026 by the authors. Licensee MDPI, Basel, Switzerland. This article is an open access article distributed under the terms and conditions of the Creative Commons Attribution (CC BY) license.