


Abstract
During coal beneficiation in a gas–solid fluidized bed, coarse feed particles act as moving intruders whose size and shape can reorganize the local gas–solid flow field. This study combines particle-surface differential-pressure measurements, synchronized visual observation, pressure-signal analysis, and Eulerian–Eulerian CFD to distinguish the disturbance caused by the feed particle from the background fluctuation of the dense medium. Unlike studies that characterize only the global bed pressure drop, the present work resolves the pressure response on the upper and lower surfaces of individual 13–50 mm feed particles and links it to bubble attachment, bypassing, and medium-particle recirculation. Within a fluidization-number range of 1.0–1.6, the disturbance intensified with feed-particle size: the 50 mm particle produced the largest upper–lower pressure difference and pressure-drop fluctuations exceeding 100 Pa. Particle shape also altered the local flow topology; the flat lower face of the block-shaped particle promoted a persistent gas cushion, localized pressure concentration, and medium recirculation; whereas, the spherical particle generated a comparatively symmetric disturbance. Synchronized images confirmed the transition from intermittent small bubbles near minimum fluidization to bubble coalescence and vigorous recirculation at higher gas velocities. At N = 1.2, the CFD results reproduced the experimental size and shape rankings, with case-by-case relative errors of 4.7–7.0% and a mean absolute relative error of 5.5%. Coherence analysis further showed that the influence of a large particle decayed with distance and produced a stepwise axial distribution of local flow states. These results provide a particle-scale basis for controlling feed-induced disturbances in gas–solid fluidized-bed separation.
1. Introduction
Dry beneficiation is particularly attractive for coal resources located in arid and water-scarce regions, where wet separation is constrained by water consumption and the tendency of low-rank coal to slime upon contact with water [1,2]. Gas–solid fluidized-bed separation uses a fluidized dense medium to generate a pseudo-fluid whose apparent density enables density-based stratification [3]. However, the bed is not a spatially uniform continuum: pressure, solids holdup, bubble population, and apparent density fluctuate in the axial, radial, and local particle-scale directions [4,5]. These fluctuations become more pronounced after coarse feed particles enter the bed, because the feed particles are one to two orders of magnitude larger than the dense-medium particles and therefore behave as finite-size flow obstructions rather than as passive tracers.
Pressure fluctuations in bubbling fluidized beds contain contributions from local bubble passage, bed-surface oscillation, distributor dynamics, and pressure-wave propagation [6,7,8]. Consequently, time-domain statistics alone cannot uniquely identify the source of a disturbance; frequency-domain and spatial-correlation analyses are required to separate local and global dynamics [9,10,11,12]. International studies have used pressure spectra, coherence, electrical capacitance tomography, PIV, magnetic particle tracking, and image analysis to characterize bubble size, rise velocity, solids circulation, and flow-regime transitions [13,14,15,16]. These studies establish the diagnostic value of pressure and imaging, but most focus on the bulk bed or on beds composed of a single particle class.
A second body of work has examined intruders or immersed objects in granular and fluidized beds. Large objects redirect gas around their projected area, generate wakes and stagnant zones, and may experience non-classical floating or sinking behavior near incipient fluidization [17,18,19,20,21,22]. The magnitude and spatial range of the disturbance depend not only on the intruder-to-medium size ratio but also on the local bubble structure and the rheology of the emulsion phase [23,24]. Nevertheless, quantitative information on the pressure difference measured directly across the upper and lower surfaces of a coarse feed particle remains limited, especially under operating conditions relevant to dry coal beneficiation.
Particle shape introduces an additional scale of heterogeneity. Experiments and simulations on spherical, elongated, ellipsoidal, and irregular particles have shown that shape modifies minimum fluidization, bed expansion, drag, effective cluster size, gas bypassing, and bubble dynamics [25,26,27,28,29]. Prior work generally treats shape as a property of the bed inventory itself. In contrast, a separation bed contains fine dense-medium particles together with a small number of much larger feed particles. The local flow around an isolated non-spherical feed particle, particularly the formation of a gas cushion beneath a flat face and the associated pressure concentration, has not been sufficiently connected to measurable particle-surface pressure signals.
The novelty of the present study therefore lies in a coupled particle-scale diagnostic framework rather than in the general observation that a larger or blunter obstruction produces a larger pressure disturbance. Specifically, (i) differential-pressure signals are acquired simultaneously from the upper and lower surfaces of individual feed particles, allowing the net local pressure contribution to be separated from the background bed pressure; (ii) time-domain statistics, PSD, coherence, and synchronized camera observations are combined to associate signal features with bubble formation, attachment, coalescence, and collapse; and (iii) a two-fluid CFD model is used to visualize the pressure field, gas-volume-fraction field, and medium-particle recirculation that cannot be resolved by the pressure probes alone. Feed particles of 13, 25, and 50 mm and three representative shapes are examined over a broad fluidization-number range. The combined evidence is used to identify the operating window in which particle characteristics dominate the local disturbance and the high-velocity regime in which background gas–solid turbulence masks these differences [30].
2. Materials and Methods
2.1. Experimental Apparatus and Procedures
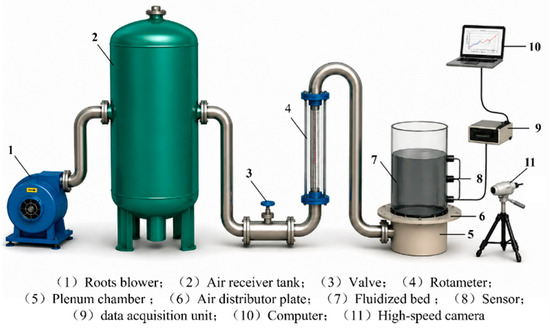
The three-dimensional gas–solid fluidized-bed separation system is shown in Figure 1. The apparatus comprises an air-supply system, a cylindrical fluidized bed (Self-built, Xuzhou, China), a synchronized signal-acquisition system, and an optical observation system. The bed has an inner diameter of 200 mm and a height of 450 mm and consists of a lower steel windbox and an upper transparent acrylic column. An umbrella-shaped flow distributor (Self-fabricated, Xuzhou, China) and an alloy perforated plate (5 mm hole diameter; 15% open area, Self-fabricated, Xuzhou, China) with two filter-cloth layers were used to attenuate inlet jets and improve gas uniformity. Air was supplied by a Roots blower (ZSR80, Shandong Jingong Blower Co., Ltd., Jinan, China) through an air receiver and rotameter. Differential-pressure signals were measured using Alpha168 sensors (accuracy ± 1.0% FS, Alpha Instruments Inc., Acton, MA, USA) and acquired through an INV 3018C unit (China Orient Institute of Noise & Vibration, Beijing, China). Axial and radial measurement points were arranged on the upper, middle, and lower cross-sections of the bed, with a 30 mm spacing between adjacent points. The pressure signals and camera trigger were synchronized in LabVIEW 2021 so that individual bubble events could be matched with the corresponding pressure-drop response. The optical system recorded the transparent bed at 32 frames s−1 for 60 s under each condition. The camera was positioned normal to the bed wall, and constant front illumination and fixed exposure settings were used to maintain comparable bubble-boundary contrast among operating conditions.
Figure 1.
The three-dimensional gas–solid fluidized bed sorting system.
2.2. Material Properties and Experimental Conditions
In actual coal beneficiation processes, the particle size distribution and shape characteristics of the feed material are complex and diverse, directly affecting the gas–solid flow behavior and the uniformity of density distribution within the fluidized bed. To simulate real-world sorting conditions, simulated particles with varying particle sizes and shapes were used to represent coal particles. As shown in Table 1, the simulated particles took three typical geometric forms: spherical, block-shaped, and polygonal, with particle sizes of 50 mm, 25 mm, and 13 mm, respectively, covering the range of coarse particle sizes commonly found in feed coal. The particle shells were molded from photosensitive resin and filled with varying proportions of magnetite powder and polymethyl methacrylate powder to precisely adjust the overall density of the particles to 1.4 g/cm3, 1.8 g/cm3, and 2.1 g/cm3, respectively. This approach simulates the physical properties of different coal components, such as low-density clean coal, medium-density intermediate products, and high-density gangue. The simulated particle system constructed in this manner retains the particle size and shape diversity of actual coal particles while enabling controlled characterization of density differences among feed components, providing a reliable experimental basis for studying the evolution of bed porosity and density distribution under loading conditions.
Table 1.
The physical parameters of the simulated particles.
In the experiment, magnetite powder was used as the fluidizing medium. Its particle size distribution and physical properties were determined using the BT-2900 particle size analysis system (Bettersize Instruments Co., Ltd., Dandong, China), as shown in Table 2. The dominant particle size range of the fluidizing medium was 0.15–0.3 mm, which corresponds to Geldart Class B particles.
Table 2.
Physical properties of dense medium.
The fluidization number was defined as N = U/Umf, where U is the superficial gas velocity and Umf is the minimum fluidization velocity of the magnetite medium. Three distinct particle-size scales are used in this work and should not be conflated. The 13, 25, and 50 mm values in Table 1 are the equivalent diameters of the coarse simulated feed particles. The 0.074–0.30 mm range in Table 2 is the measured size distribution of the magnetite dense medium used in the experiments. The 0.20 mm value in Table 3 is the representative mean diameter assigned to the magnetite solid phase in the CFD model. Thus, Table 3 does not redefine the feed-particle size; it coarse-grains the experimentally measured medium-size distribution into a single representative diameter for the continuum solid phase.
Table 3.
Principal numerical-model and grid-sensitivity parameters.
2.3. Signal Processing and Data Analysis Methods
To quantify the intensity of disturbances caused by feed particles to the local flow field within the bed and to reveal their frequency characteristics, a systematic multidimensional analysis was performed on the collected time-domain pressure drop signals, including time-domain statistics, frequency-domain analysis, and coherence analysis. The principles of each method and their application in this study are described below.
For each pressure-drop time series collected under a given operating condition, the time-averaged pressure and standard deviation were calculated. The time-averaged pressure reflects the mean pressure level at the upper and lower particle surfaces and at different positions in the bed; whereas, the standard deviation characterizes the intensity of instantaneous pressure-drop fluctuations. A larger standard deviation indicates stronger local gas–solid flow unsteadiness and a more pronounced disturbance caused by the feed particles. These quantities were calculated as follows:
The average pressure difference between the lower and upper surfaces of a particle was then defined as:
Here, and represent the time-averaged pressures on the upper and lower surfaces of the particle, respectively. A positive indicates that the pressure on the lower surface is higher than that on the upper surface, corresponding to an upward pressure contribution acting on the particle.
The original time-domain pressure-drop signal was transformed into the frequency domain using the Fast Fourier Transform (FFT) to obtain the power spectral density (PSD). The PSD describes the distribution of signal energy in the frequency domain and is commonly used to identify the characteristic frequencies of bubble behavior in fluidized beds. Peaks in the PSD correspond to periodic pressure fluctuations at specific frequencies. In gas–solid fluidized beds, the dominant low-frequency PSD peak is typically associated with bubble formation, coalescence, and collapse. In this study, PSD analysis was performed on the pressure-drop signals at the particle surfaces under different fluidization numbers, and the dominant PSD peak intensity was used to characterize the contribution of bubble activity to the local pressure field. Specifically, segmented FFTs were performed on 60 s pressure-drop sequences (4096 points per segment, Hanning window, 50% overlap), and the results from multiple segments were averaged to obtain a smoothed PSD estimate.
Coherence analysis was employed to quantitatively evaluate the frequency-domain correlation between pressure-drop signals measured at different locations within the bed. The coherence function describes the strength of the linear relationship between two signals at each frequency, with values normalized between 0 and 1. A coherence value closer to 1 indicates more similar frequency-domain fluctuation patterns between the two pressure signals. In this study, high-density and low-density simulated particles were placed at the bed bottom and bed surface, respectively. Pressure-drop signals were measured continuously at different heights in the bed. The coherence between the signal at each measurement position and the reference signal at the particle surface was calculated to quantify the spatial influence range of large-particle-induced flow-field perturbations. The magnitude-squared coherence is expressed as follows [31]:
where and are the auto-power spectral densities of pressure signals and , respectively, and is their cross-power spectral density.
Through a complementary analysis of the three methods described above, this study has established a multidimensional characterization system that integrates time-domain fluctuation intensity, frequency-domain bubble characteristics, and spatial coherence, with the aim of systematically elucidating the mechanisms by which feed-particle characteristics perturb the local flow field within the bed.
2.4. Numerical Simulation Methodology
To complement the particle-surface pressure measurements with internal flow-field information, CFD simulations were performed using Ansys Fluent (2022 R2). The 110 mm × 52 mm × 400 mm dimensions refer to the external experimental-bed envelope used to construct the SolidWorks (2021) geometry. After extraction of the two-dimensional fluid domain, the effective solution plane was W × Hg = 101 mm × 350 mm, with an initial static-bed height Hs = 200 mm (Table 3). The geometry was imported into SpaceClaim and Ansys Meshing for fluid-domain definition and mesh generation.
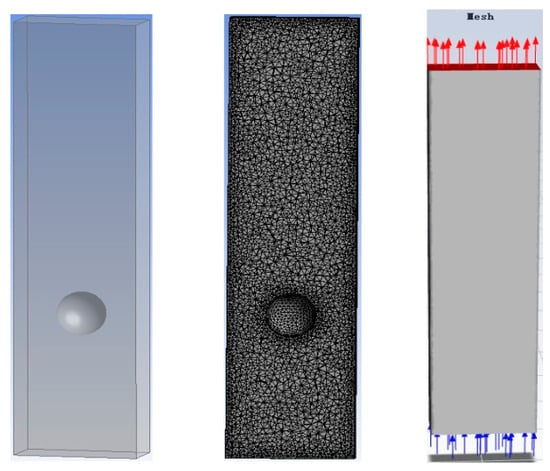
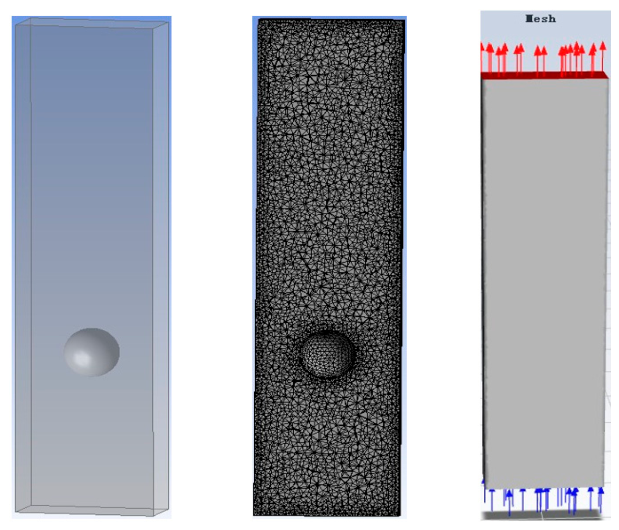
As shown in Figure 2, the fluid domain was discretized using unstructured triangular cells, with identical local-refinement regions near the feed-particle boundary and gas inlet. Three systematically refined meshes were generated with a constant linear refinement ratio r = 1.5 and minimum local cell sizes of 4.5, 3.0, and 2.0 mm. Their actual cell and node counts are listed in Table 3. Grid sensitivity was evaluated at N = 1.2 for the 50 mm spherical particle using the time-averaged absolute pressure difference between its lower and upper surfaces, ΔPUL = |plower − pupper|. Averaging over t = 1.0–3.0 s gave 577.5, 590.0, and 595.6 Pa for the coarse, medium, and fine meshes, respectively. With the fine mesh as the reference, the corresponding coarse- and medium-mesh deviations were 3.04% and 0.94%. The 3.0 mm medium mesh was therefore selected because it reproduced the fine-mesh result within 1% while using 44.4% of its cells. With dp = 0.2 mm, the hmin/dp ratios were 22.5, 15, and 10, respectively. This quantity-of-interest-based assessment is consistent with published TFM grid-resolution studies [32,33,34].
Figure 2.
Two-dimensional computational domain and adopted locally refined unstructured triangular mesh (minimum local cell size: 3.0 mm).
Because the gas–solid separation bed is a dense-phase bubbling fluidized bed, the gas and fine-solid phases were treated as interpenetrating continua and solved with an Eulerian–Eulerian two-fluid model. The bottom boundary was specified as a gas-velocity inlet, the top as a pressure outlet, and both sides as no-slip walls. Each transient case was calculated for 3 s using a time step of 1 × 10⁻⁵ s, corresponding to 300,000 time steps.
Pressure-velocity coupling was handled with the SIMPLE algorithm. The transient term was discretized implicitly, and the momentum and phase-volume-fraction equations used second-order upwind-type spatial discretization. Iteration within each time step continued until the scaled residuals were no greater than 1 × 10⁻⁵. For U = 0.0752 m s−1, Δt = 1 × 10⁻⁵ s, and hmin = 0.003 m, the inlet-based Courant number was 2.51 × 10⁻⁴. The detailed mesh and solver settings are summarized in Table 3.
During pseudofluid formation, gravity, interparticle interactions, wall-particle friction, and gas–solid momentum exchange jointly affect the flow behavior; therefore, selecting an appropriate interphase force model is critical for numerical simulation of gas–solid fluidized beds. Drag is the dominant interphase force in the present gas–solid flow and is a key parameter for characterizing momentum exchange. In this study, the Gidaspow drag model was used to describe interphase momentum exchange between the gas and solid phases. Turbulence closure was achieved using the SST model. The simulation parameters are shown in Table 3.
The two-fluid model treats the fine-particle phase of magnetite powder as a continuous phase; it is also known as the continuous-medium model or pseudo-fluid model. In this model, the gas and solid phases are regarded as coexisting and mutually interpenetrating continua, and the flow field is solved by establishing the conservation equations of mass and momentum in an Eulerian coordinate system [35].
In numerical simulations using the two-fluid model, the gas and fine-particle phases are treated as continuous media. The flow characteristics of both phases were calculated using the Eulerian framework, and numerical solutions were obtained from the locally averaged Navier–Stokes equations. The gas-phase and solid-phase continuity equations and the representative gas-phase momentum equation are given below [36]. Gas-phase continuity equation:
Solid-phase continuity equation:
Gas-phase momentum equation:
where and are the gas- and solid-phase volume fractions, respectively; and are the phase densities; and are the gas- and solid-phase velocity vectors; is the gas pressure; is the gas-phase stress tensor; is the interphase momentum exchange coefficient; and is the gravitational acceleration vector.
The gas-phase stress tensor is expressed as:
where is the dynamic viscosity of the gas phase and is the identity tensor.
The SST two-equation turbulence model was adopted because it combines the near-wall robustness of the model with the free-stream behavior of the model through a blending function. In the SST model, the transport equation for turbulent kinetic energy is expressed as follows:
The transport equation for the specific dissipation rate is:
The simulations were evaluated using gas volume fraction, static pressure, medium-particle velocity, and solid volume fraction. Based on the experimental results, N = 1.2 was selected for the principal particle-to-particle comparison because size- and shape-dependent differences were pronounced while the bed had not yet entered the strongly turbulent regime that masked those differences at N ≥ 1.6.
3. Results
3.1. Effect of Feed-Particle Size on the Local Flow Field in the Bed
In a gas–solid fluidized classification system, magnetite powder comes into full contact with the gas and becomes fluidized to form a relatively stable pseudo-fluid, allowing the fluidized particles to move freely within the gas stream. When feed-particles enter the fluid, they affect the flow state of both the gas and solid phases, causing local changes in the bed’s flow conditions and disrupting the uniformity and stability of the bed’s fluidization during the settling process. Larger particles may exert a more significant perturbing effect on gas flow, including turbulence and wake effects around the particles, which in turn affect the distribution of gas and particles within the bed. Furthermore, when large particles are immersed in a gas–solid fluidized bed, there may be significant differences in the flow field characteristics between their upper and lower surfaces, directly affecting the motion and settling processes of the feed particles. Therefore, it is necessary to investigate the influence of particle size on the local flow field and, by analyzing changes in the surrounding pressure drop signals under different operating parameters, gain a deeper understanding of the disturbance mechanisms of feed particle size on the gas–solid fluidized bed.
Spherical simulated particles with three different equivalent diameters—50 mm, 25 mm, and 13 mm—were used. The static bed height was set to 200 mm, and the fluidization number was set to 0.8, 1.0, 1.2, 1.4, 1.6, and 1.8. The pressure-drop signals on the upper and lower surfaces of the feed particles were measured, and the local pressure-drop fluctuations around the particles were collected to analyze the influence of particle size on the surrounding gas–solid two-phase flow under different gas velocities.
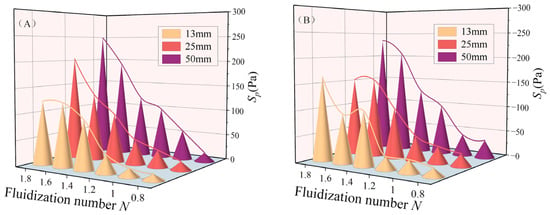
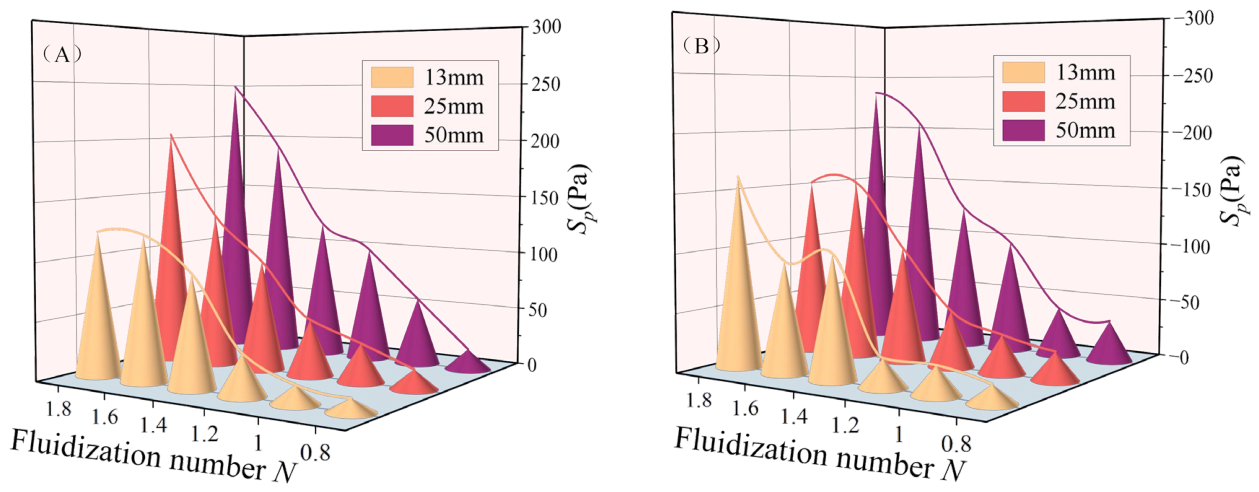
Figure 3 summarizes the pressure-drop fluctuation characteristics on the surfaces of particles of different sizes under various fluidization number conditions and analyzes the standard deviations of pressure drop fluctuations on the upper and lower surfaces of the particles. As shown in Figure 3, when the fluidization number N = 0.8, the pressure drop fluctuated slightly under low gas velocity conditions, with insignificant fluctuations, indicating that the bed is not fluidized, the internal particles are relatively stationary, and there was no significant flow. Furthermore, the pressure drop signal spectrum shows no dominant peak in the low-frequency region, with dominant PSD peak intensities below 20 Pa2/Hz, indicating that the bed generates almost no bubbles in the non-fluidized state. This may be because, during the initial stage of fluidization, the upward gas flow merely balances the gravitational force of the stacked particles, interparticle forces, and friction, failing to generate a sufficient number of bubbles to drive particle motion. Consequently, the pressure distribution within the bed remains stable, with no significant pressure drop fluctuations. As shown in Figure 3B, the standard deviation of pressure-drop fluctuations on the upper surface of the particles is 57 Pa, slightly higher than that on the lower surface. This indicates that as particle size increases, the influence of the particles on the surrounding flow field becomes more significant, leading to greater disturbances in the gas–solid flow state.
Figure 3.
Surface pressure drop fluctuations for different particle sizes: (A) upper surface; (B) lower surface of the particle.
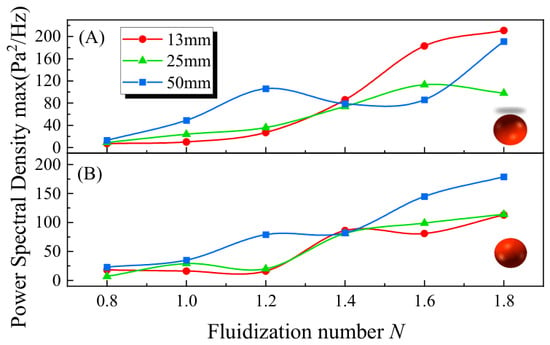
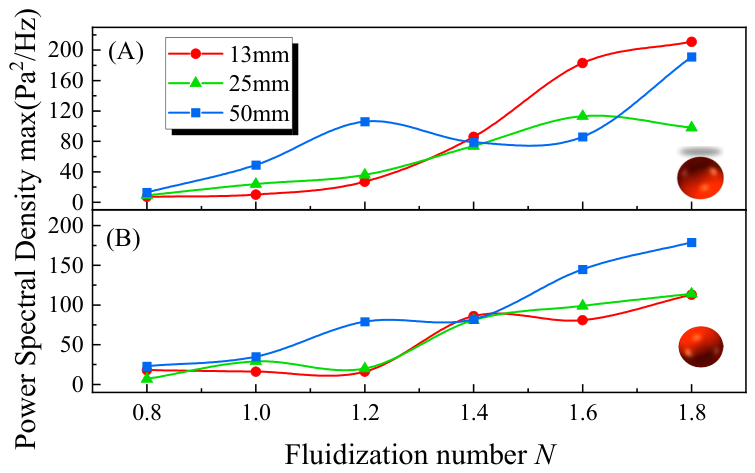
Figure 4 presents the frequency-domain analysis of the raw time-domain pressure-drop signals, revealing how the PSD at the particle surface varied with gas velocity. When the fluidization number increased to N = 1.0, the pressure-drop signal began to fluctuate with time, and the average pressure drop increased. The dominant PSD peak intensity increased markedly, and clear differences appeared among particles of different sizes. The pressure-drop fluctuations around the 13 mm particles were the weakest, indicating that only a limited number of small bubbles were generated. As particle size increased, the surrounding flow field became more disturbed; the number of bubbles around the 25 mm particles increased, and the dominant PSD peak intensity at the lower particle surface reached 29 Pa2/Hz. When the particle size increased to 50 mm, the pressure-drop fluctuations became stronger. After the bed entered the fluidized state, differences also appeared between the pressure-drop signals on the upper and lower surfaces of the feed particles. Larger particles impeded gas flow, resulting in relatively weaker flow on their upper surfaces. In contrast, the lower surfaces were in direct contact with the rising gas stream and were therefore subjected to stronger gas impact and higher pressure.
Figure 4.
Dominant PSD peak intensity on the surface of particles of different sizes: (A) upper surface; (B) lower surface of particles.
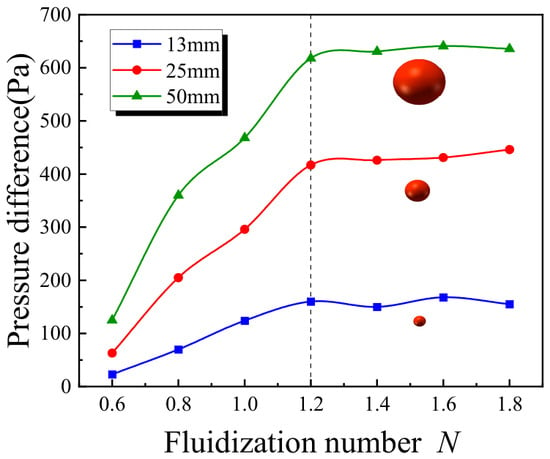
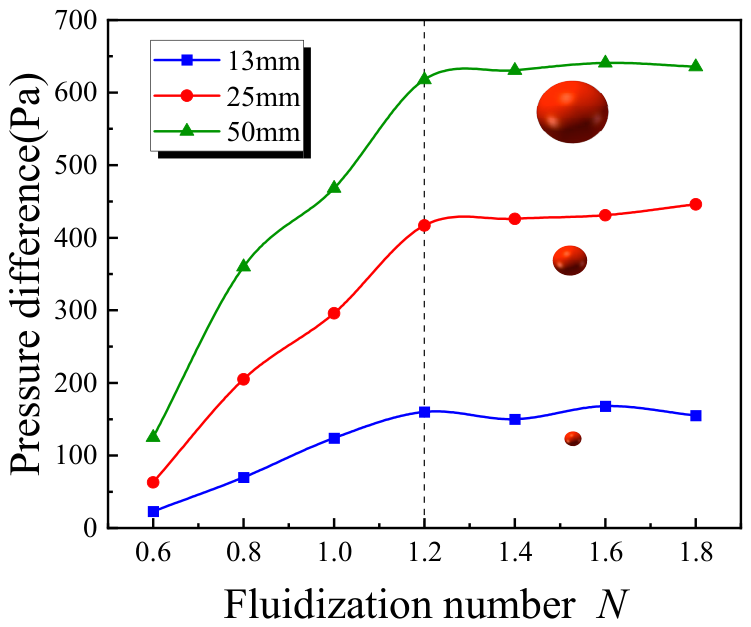
As shown in Figure 5, the average pressure difference between the upper and lower surfaces of the 50 mm particles was consistently higher than those of the 25 mm and 13 mm particles, and the pressure difference decreased as particle size decreased. This indicates that larger particles generate a stronger local pressure gradient between their lower and upper surfaces. After the bed became fully fluidized, a further increase in gas velocity did not cause a proportional increase in the average pressure drop, indicating that bed stability gradually decreased as gas velocity increased. When N = 1.2, the pressure-drop fluctuation amplitudes on the upper and lower surfaces of the 13 mm and 25 mm particles were close to 50 Pa; whereas, those of the 50 mm particles approached 100 Pa, and the dominant PSD peak intensity reached 106 Pa2/Hz. Thus, under these operating conditions, smaller particles had a weaker influence on the gas–solid flow structure; whereas, larger particles caused stronger local disturbance. When N = 1.4, the difference between the upper- and lower-surface flow responses decreased, and the dominant PSD peak intensities on both surfaces fluctuated around 80 Pa2/Hz. As the fluidization number further increased to 1.6 and 1.8, the bed pressure drop fluctuated violently, the standard deviation of pressure-drop fluctuations increased to more than 200 Pa, and bed stability decreased significantly. Multiple PSD peaks appeared within the bed, with the highest peak intensity exceeding 200 Pa2/Hz. Under high gas velocity conditions, the overall gas–solid turbulence became dominant. Therefore, the particle-size effect became less distinguishable, although instantaneous pressure fluctuations remained large. This indicates that within a moderate gas-velocity range, feed-particle size strongly affects gas–solid flow; whereas, at excessively high gas velocities, gas motion dominates the bed flow field and the relative influence of particle size weakens.
Figure 5.
Differential pressure between the upper and lower surfaces of particles of different sizes.
The synchronized camera records provide an independent physical interpretation of the pressure signals. At N = 0.8, no sustained bubble passage was visible and the pressure trace remained nearly stationary. Near N = 1.0, intermittent small bubbles formed below the feed particle and produced isolated low-frequency pressure events. At N = 1.2–1.4, bubbles repeatedly attached to the lower particle surface, coalesced, and detached along the particle sides; these events corresponded to the increase in PSD peak intensity and to the divergence between upper- and lower-surface pressure signals. At N ≥ 1.6, bubble overlap and medium recirculation became continuous, explaining why the background turbulence increasingly obscured particle-size differences. The visual and signal observations are summarized in Table 4.
Table 4.
Synchronized visual observations and pressure-signal characteristics.
Therefore, in a gas–solid separation fluidized bed, when feed particles of different sizes enter the bed, their floating or sinking behavior is governed primarily by the density difference between the particle and the bed, while particle size affects the magnitude of the pressure and buoyancy-related forces. For particles with the same density contrast relative to the bed, larger particles have a larger displaced bed volume and projected area, leading to a larger net pressure contribution and stronger disturbance to the surrounding flow field. Consequently, low-density large particles more readily float to the bed surface; whereas, high-density large particles sink to the bed bottom under the combined action of gravity and pressure. In contrast, smaller particles experience weaker pressure differences and smaller buoyancy-related forces and are therefore more likely to remain suspended or move with the fluidized medium [37].
The observed size effect is consistent with studies showing that finite-size intruders redirect the emulsion-phase flow and that pressure-based forces scale with projected area and displaced bed volume. The present result extends those studies by locating the disturbance at the upper and lower surfaces of a feed particle and by demonstrating an operating-window effect: the size dependence is clearest at intermediate N; whereas, at high N the variance generated by bulk bubbling exceeds the incremental variance caused by the intruder. This distinction is important for separation control because simply increasing gas velocity does not monotonically improve the discriminability of particles with different sizes.
3.2. Effect of Feed-Particle Shape on the Local Flow Field in the Bed
The influence of particle shape on the surrounding flow field in gas–solid fluidized beds is an important and complex area of research. The fluid flow characteristics around particles of different shapes vary, which in turn affects the gas flow distribution and the overall flow structure of the bed. In addition, the surfaces of irregularly shaped particles may cause local pressure concentrations, affecting particle motion and sedimentation processes [38].
To investigate the effect of feed-particle shape on the local flow conditions in a gas–solid fluidized bed, simulated particles of three different shapes—spherical, block-shaped, and polygonal—were placed within the bed. The static bed height was set to 200 mm, and the fluidization number was set to 0.8, 1.0, 1.2, 1.4, 1.6, and 1.8. Since the effect of particle size on the flow field was discussed in the previous section and was found to increase with particle size, the equivalent diameter of all three particle shapes was set to 50 mm. By adjusting the fluidization number and measuring the pressure changes around particles of different shapes in real time, the effects of feed-particle shape on the surrounding flow field and on the gas–solid two-phase distribution were analyzed.
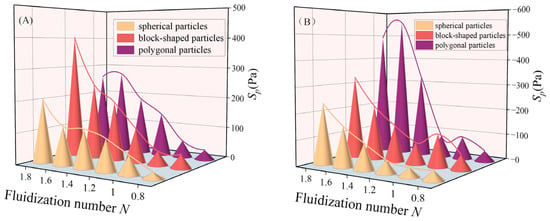
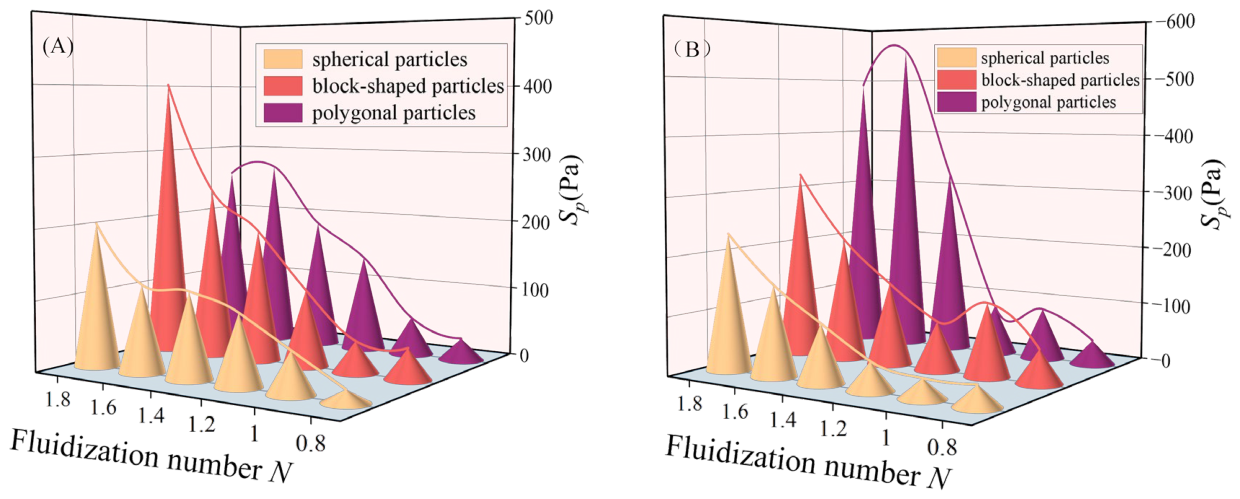
Figure 6 shows the variation in the standard deviation of pressure drop fluctuations on the upper and lower surfaces of particles at different gas velocities, indicating that pressure drop variations are significantly influenced by gas velocity and particle shape. When N < 1, the particle bed is not fluidized, and differences in pressure drop fluctuations appear on the surfaces of particles with different shapes. The pressure drop fluctuations on the upper surface of spherical particles are minimal, with low pressure-fluctuation intensity, indicating that spherical particles have almost no effect on the surrounding flow field when the bed is not fluidized; the pressure drop on the surface of polygonal particles exhibits slight fluctuations; and the pressure fluctuations on the surface of block-shaped particles are the most severe, with a standard deviation of pressure drop fluctuations approaching 60 Pa.
Figure 6.
Surface pressure drop fluctuations for different particle shapes: (A) upper surface; (B) lower surface of the particle.
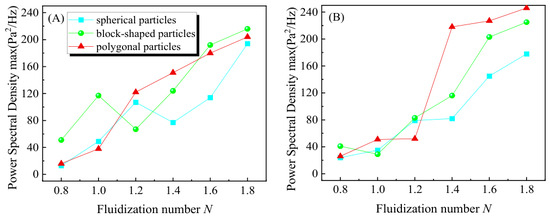
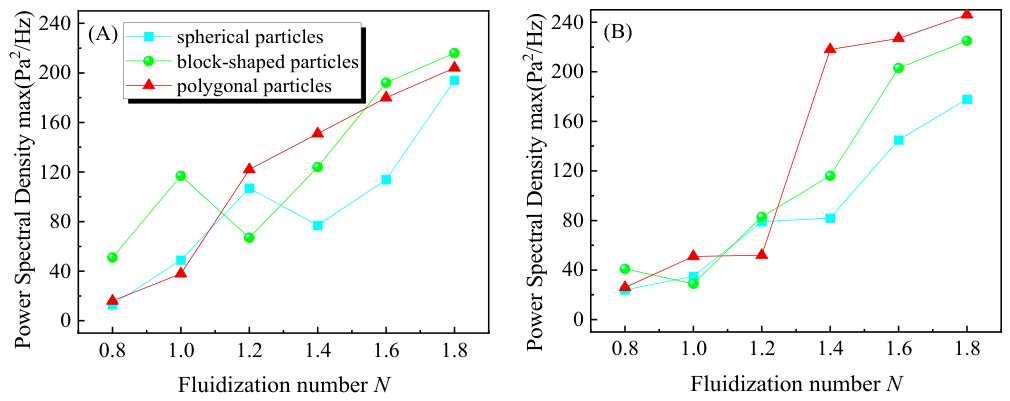
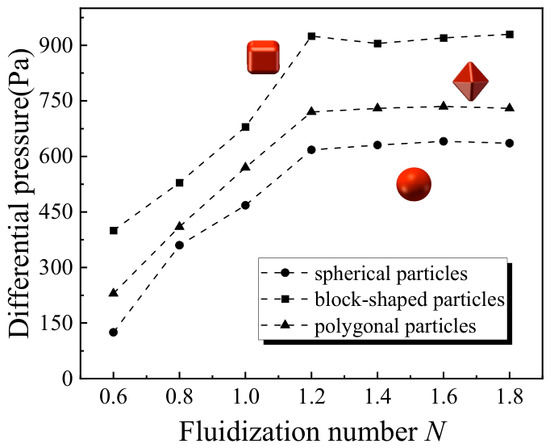
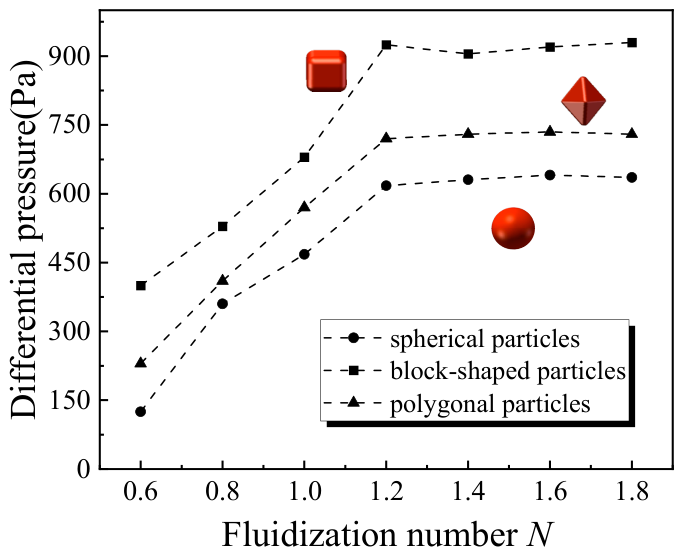
When N = 1, the bed enters a fluidized state, and the surface pressure drop signals of particles with different shapes show significant differences in the dominant PSD peaks. As shown in Figure 6, the surface pressure drop signal of spherical particles exhibits distinct fluctuations. Spectral analysis reveals that the dominant PSD peak intensity on the upper surface is 49 Pa2/Hz; whereas, the lower surface shows a relatively flat PSD profile. This indicates that, after fluidization, strong gas–solid interactions occur around the spherical particles, and large particles have a significant impact on the flow field. In contrast, the surface pressure drop fluctuations for polygonal and block-shaped particles are more severe; the standard deviation of surface pressure drop fluctuations for block-shaped particles exceeds 100 Pa, and the average pressure difference between the upper and lower surfaces exceeds 500 Pa. As shown in Figure 7, the dominant PSD peak intensity on the upper surface of block-shaped particles reaches 120 Pa2/Hz; whereas, that on the lower surface is only 29 Pa2/Hz. In contrast, the dominant PSD peak intensities on the upper and lower surfaces of spherical and polygonal particles are similar. This indicates that block-shaped particles exert a greater influence on the surrounding gas–solid flow and distribution, and the difference in bubble motion between the upper and lower surfaces is significant.
Figure 7.
Dominant PSD peak intensity on the surface of particles of different shapes: (A) upper surface; (B) lower surface of particles.
As the operating gas velocity was further increased, the amplitude of pressure-drop fluctuations in the bed increased, while the average pressure drop did not rise significantly. Differences in gas pressure distribution on the surfaces of particles of different shapes and in particle flow became even more pronounced. When N = 1.4, the amplitude of pressure-drop fluctuations on the surfaces of polygonal particles increased significantly. Figure 7B shows that the dominant PSD peak intensity reached approximately 200 Pa2/Hz, indicating that as the gas velocity increased, the number of bubbles within the bed increased, and the flow became more turbulent. The sharp edges of non-spherical particles were prone to forming turbulent regions, resulting in pronounced pressure drop fluctuations. The pressure difference between the upper and lower surfaces of block-shaped particles remains the highest; however, once the fluidization number exceeds 1.2, the pressure difference no longer increases significantly. When N ≥ 1.6, the pressure drop across the bed exhibits severe fluctuations, the average pressure drop increases significantly, and multiple PSD peaks appear in the spectral analysis, indicating that the influence of particle shape on the flow field weakens. As the fluidization number continues to increase to N = 1.8, the standard deviation of pressure drop fluctuations on the surfaces of polygonal particles exceeds 300 Pa, and the dominant PSD peak intensity reached 240 Pa2/Hz. This indicates that when the gas velocity is too high, the gas flow becomes extremely rapid, forming high-speed gas flows and turbulence, which generate intense rotation and mixing effects. This leads to the generation of a large number of bubbles and intense re-mixing of the fine-particle medium, gas kinetic energy dominates the flow field, and the influence of particle shape is relatively weakened.
As shown in Figure 8, the pressure difference between the upper and lower surfaces of block-shaped particles exceeds 400 Pa, indicating that the particle’s sharp edges may cause complex flow structures to form on its surface, resulting in significant fluctuations in the local pressure drop signal. Introducing large particles into a stable gas–solid two-phase flow system disrupts the stability of the original flow field, and particle shape also has a significant impact on bubble formation behavior and the motion of particles in the medium. Due to differences in surface structure and gas contact mechanisms, particles of different shapes exhibit distinct pressure drop signal characteristics, resulting in non-uniform gas pressure distributions on their surfaces. The flat bottom of block-shaped particles tends to cause localized pressure concentration; whereas, the pressure distribution on the surface of spherical particles is relatively uniform. Furthermore, particle shape affects the intensity of surrounding turbulence; angular particles may exacerbate recirculation; whereas, spherical particles exhibit relatively lower recirculation levels. In such cases, the influence of particle shape is relatively diminished.
Figure 8.
Differential pressure between the upper and lower surfaces of particles of different shapes.
The shape-dependent ranking agrees with international work showing that non-spherical particles alter drag, gas bypassing, and bubble morphology. However, the mechanism identified here differs from a generic sphericity effect. The decisive feature is the orientation-dependent lower-face geometry of an isolated coarse feed particle: the broad horizontal face of the block-shaped particle traps gas and stabilizes a low-solids region; whereas, the curved sphere promotes lateral gas release and a more symmetric pressure field. The result therefore links a measurable surface-pressure difference to a specific local topology—the gas cushion and the two recirculation cells beside the particle.
3.3. Analysis of Pressure Signals at Different Positions in the Bed Layer
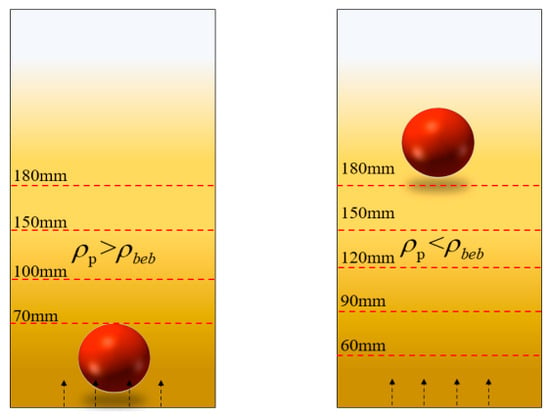
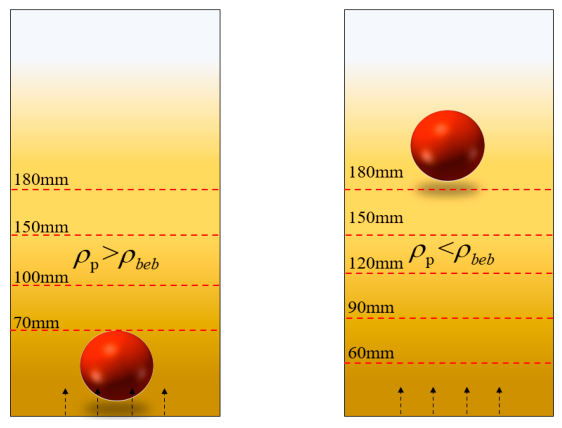
After entering the fluidized bed, feed particles are separated based on their density. As shown in Figure 9, when the density of a feed particle is lower than that of the bed, the particle rises to the surface; conversely, it sinks. When particles accumulate at different locations within the bed, the surrounding flow field also varies accordingly.
Figure 9.
Distribution of pressure drop measurement points at different locations in the bed.
Through time-domain and frequency-domain analysis, the patterns of pressure drop fluctuations on the upper and lower surfaces of the feed particles were revealed, and it was found that the pressure drop signals are jointly influenced by particle and bubble motion, as well as gas–solid two-phase flow. High-density and low-density simulated particles were placed at the bottom and surface of the bed, and continuous measurements of pressure drop signals were taken at different positions along the bed height. Coherence analysis was performed based on Equation (3) to quantify the correlation strength of the pressure signals at different positions relative to the reference signal at the particle surface.
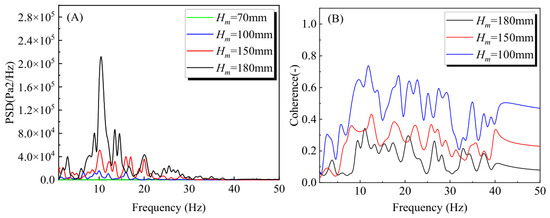
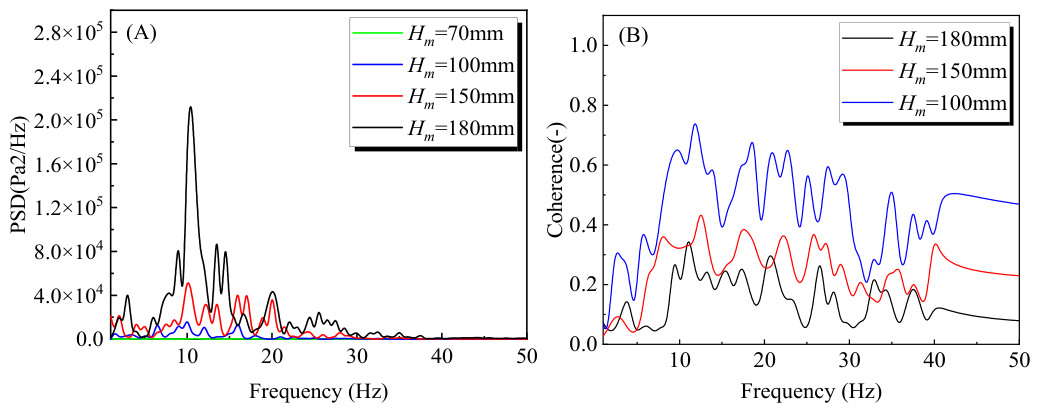
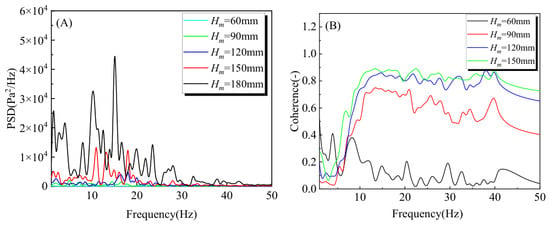
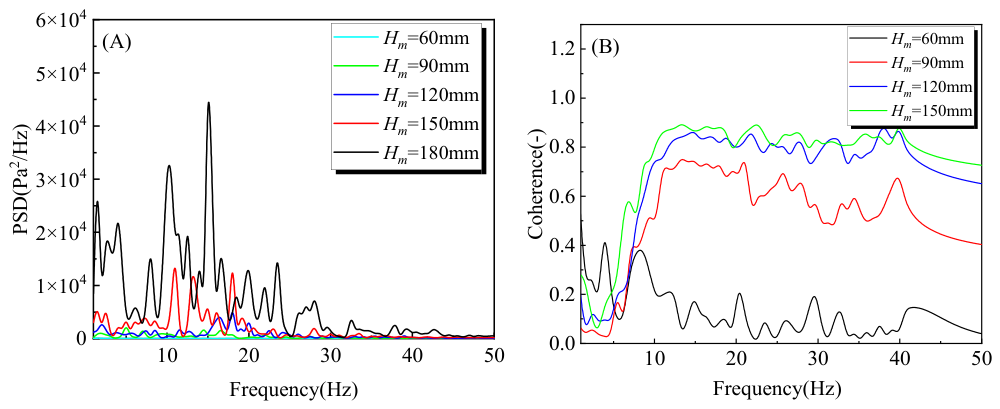
As shown in Figure 10A, when high-density particles settled at the bottom of the bed, the PSDs of pressure fluctuations at different measurement heights showed dominant peaks in the low-frequency range, and signal energy decreased with increasing frequency. Here, denotes the measurement height above the distributor. In the lower bed region near , the dominant peak was relatively weak, indicating that pressure-drop fluctuations near the settled large particles were suppressed. Although gas entering from the bottom distributor typically forms many small bubbles in the lower bed, the large particles settled at the bottom obstructed bubble and particle motion, thereby reducing the local signal energy near the particle surface. In the upper bed region farther from the bottom particles, bubbles detached, recombined, and grew, producing more vigorous fluid activity and larger PSD peaks. Figure 10B compares the coherence between pressure-drop signals at and the reference signal near the bottom particle surface. At , the coherence was closest to 1, indicating that this signal was most similar to the reference signal near the large particle. As the distance from the large particle increased, the coherence decreased, confirming that the influence of the large particle weakened with distance.
Figure 10.
Pressure-drop signal analysis for high-density particles at the bed bottom: (A) power spectral density function; (B) coherence.
After low-density large particles enter the bed, they remain suspended at the bed surface due to continuous impact from the fluid and large bubbles at their base. As shown in Figure 11A, the highest energy distribution is observed at the base of the large particles. Figure 11B indicates that the pressure signal correlation is highest near the particle base, approaching 1, while the correlation at the bed bottom is significantly lower. This suggests that the greater the distance from the large particles, the greater the local differences in the flow field. This may be due to the motion of the large particles and their bottom adhesion behavior, which increases the collision frequency in the shallow bed region and may even lead to the formation of structures such as vortices and turbulence, resulting in enhanced pressure signal energy. Analysis of the coherence of pressure drop signals at different depths within the loaded bed reveals that the degree of non-uniformity in the flow distribution varies in a stepwise manner along the axial direction. In the shallow bed region, the gas–solid contact rate is higher, particle motion is more intense, and pressure drop signal fluctuations are more frequent. The presence of large particles disrupts the regular variation in the pressure drop signal, and there are significant differences in the fluctuation patterns of the pressure drop signal between the particle surfaces and other locations.
Figure 11.
Pressure-drop signal analysis for low-density particles at the bed surface: (A) power spectral density function; (B) coherence.
3.4. Numerical Simulation Results and Mechanistic Comparison
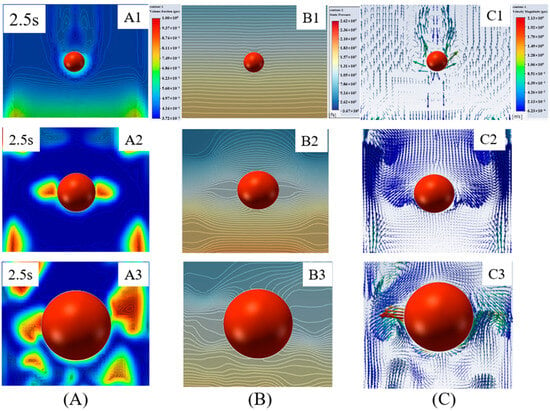
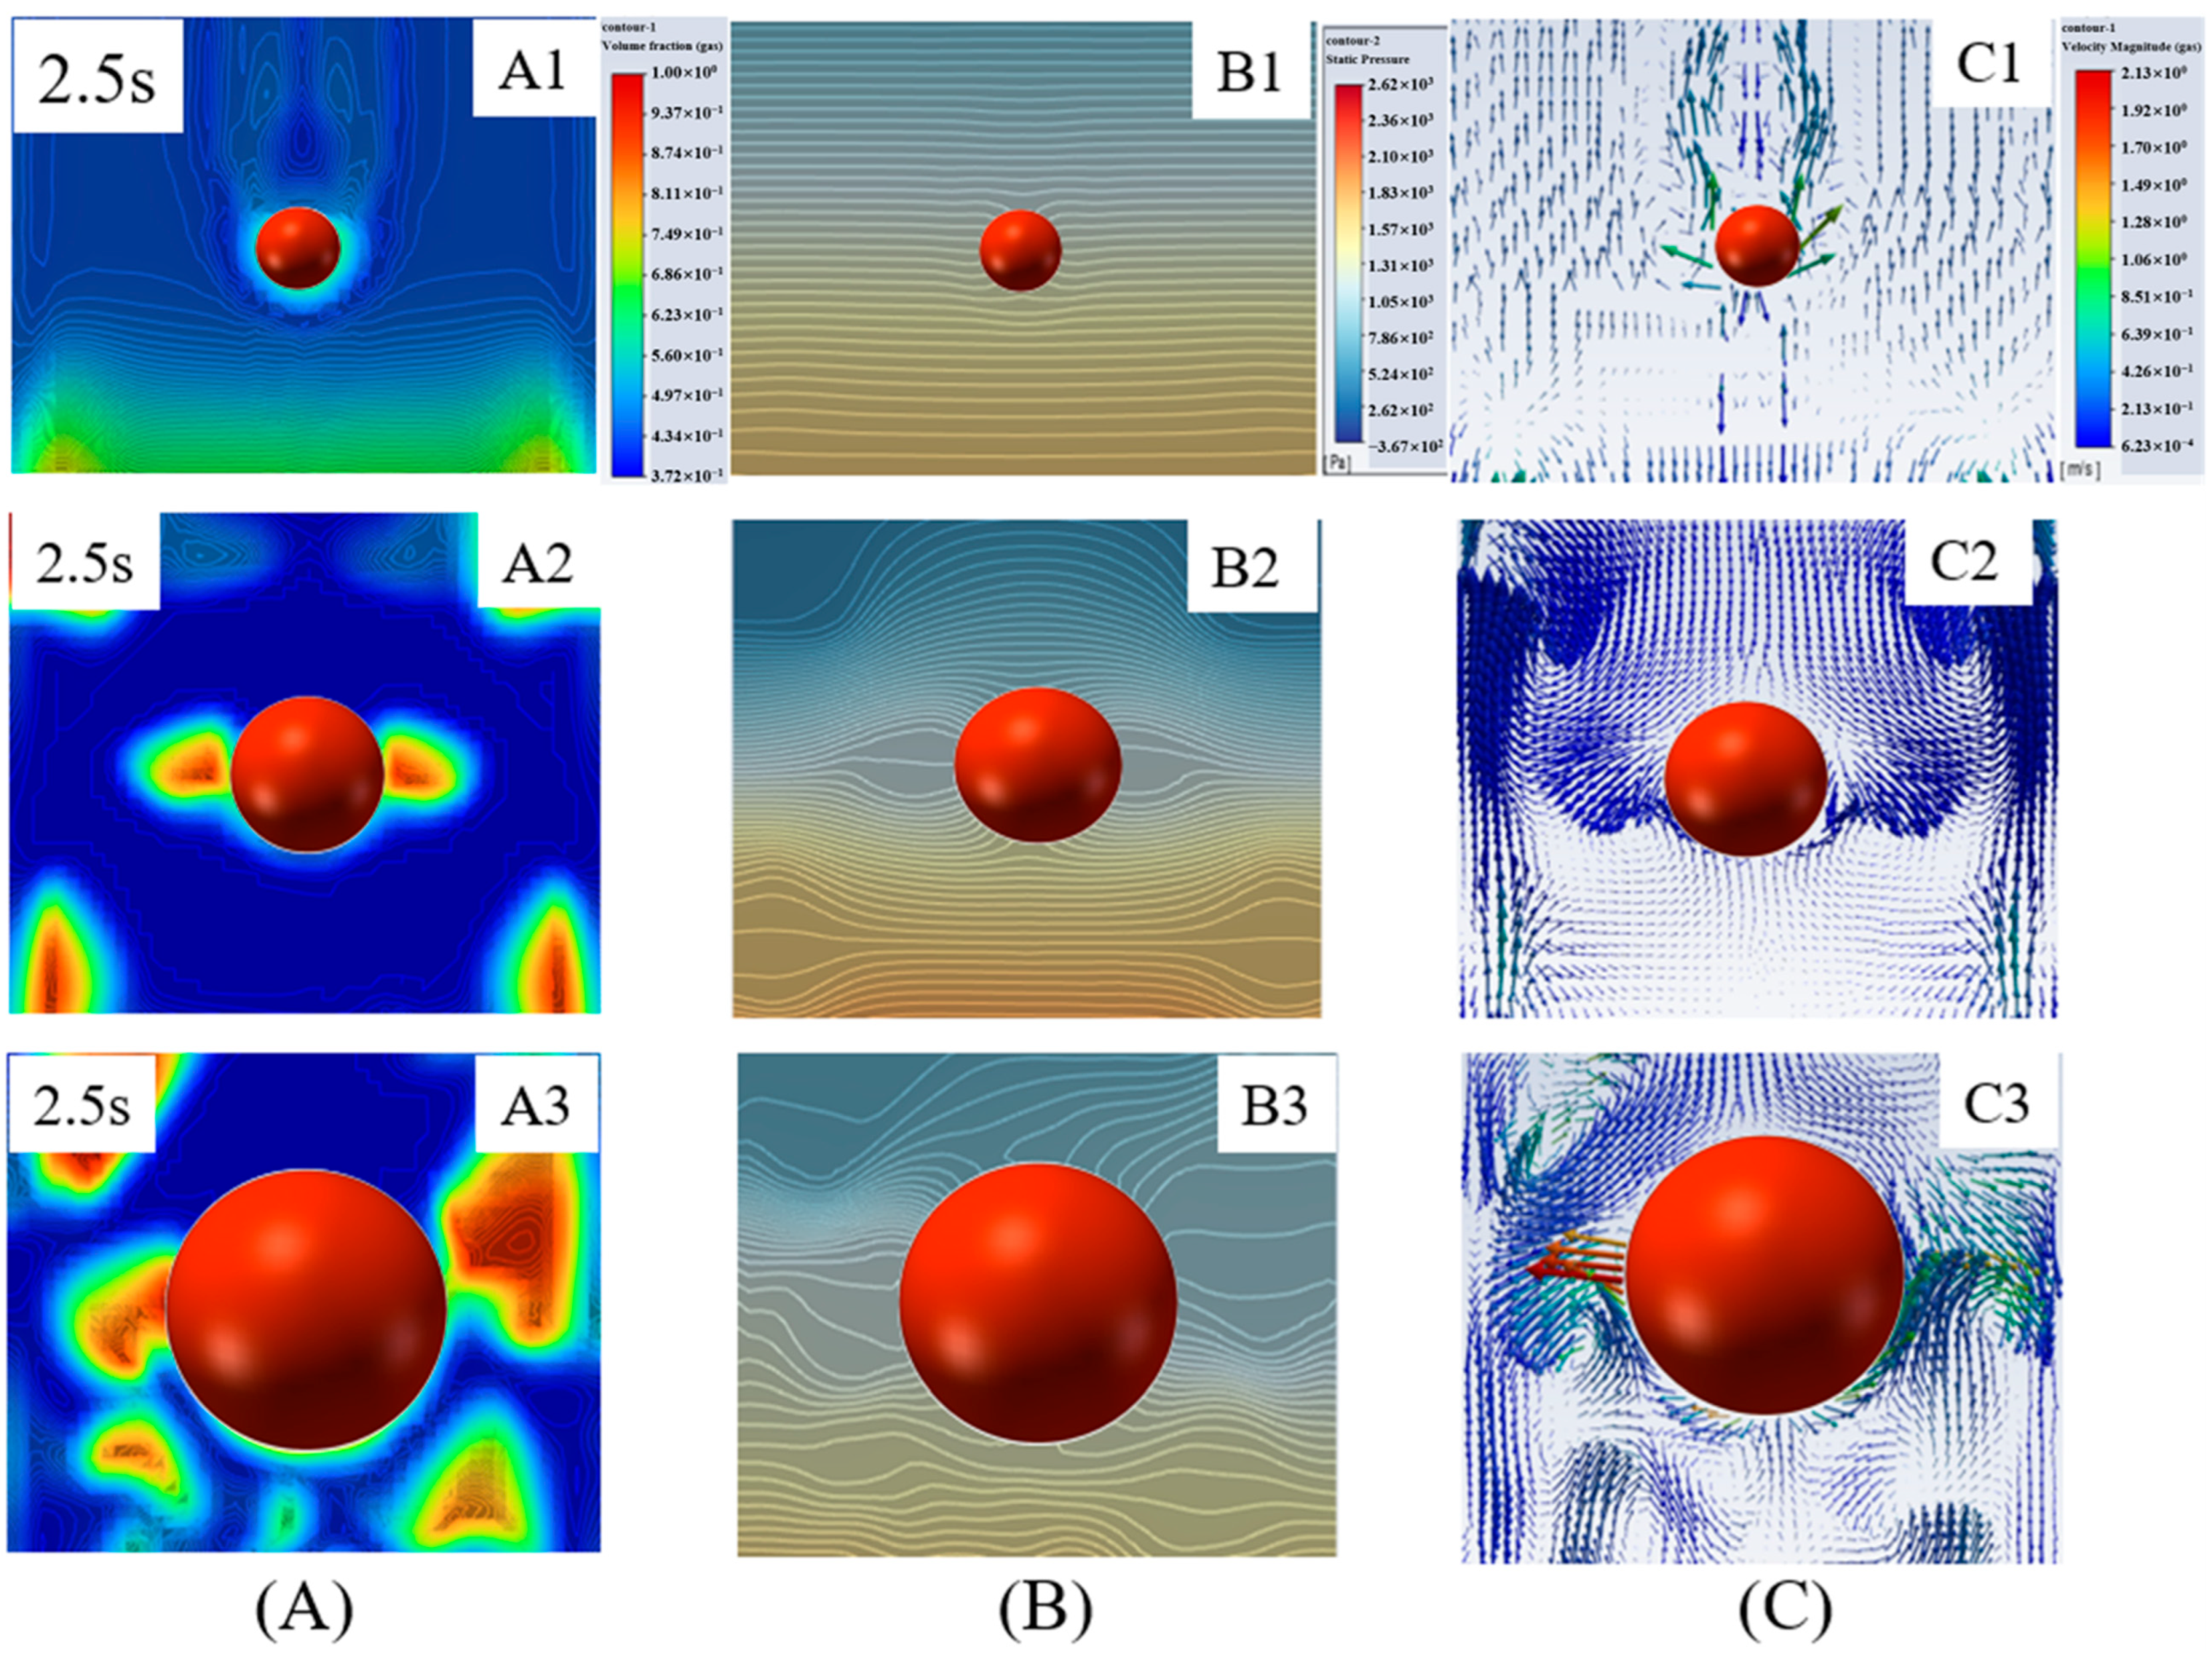
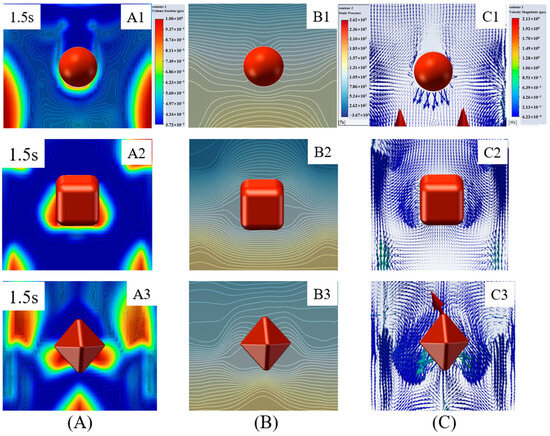
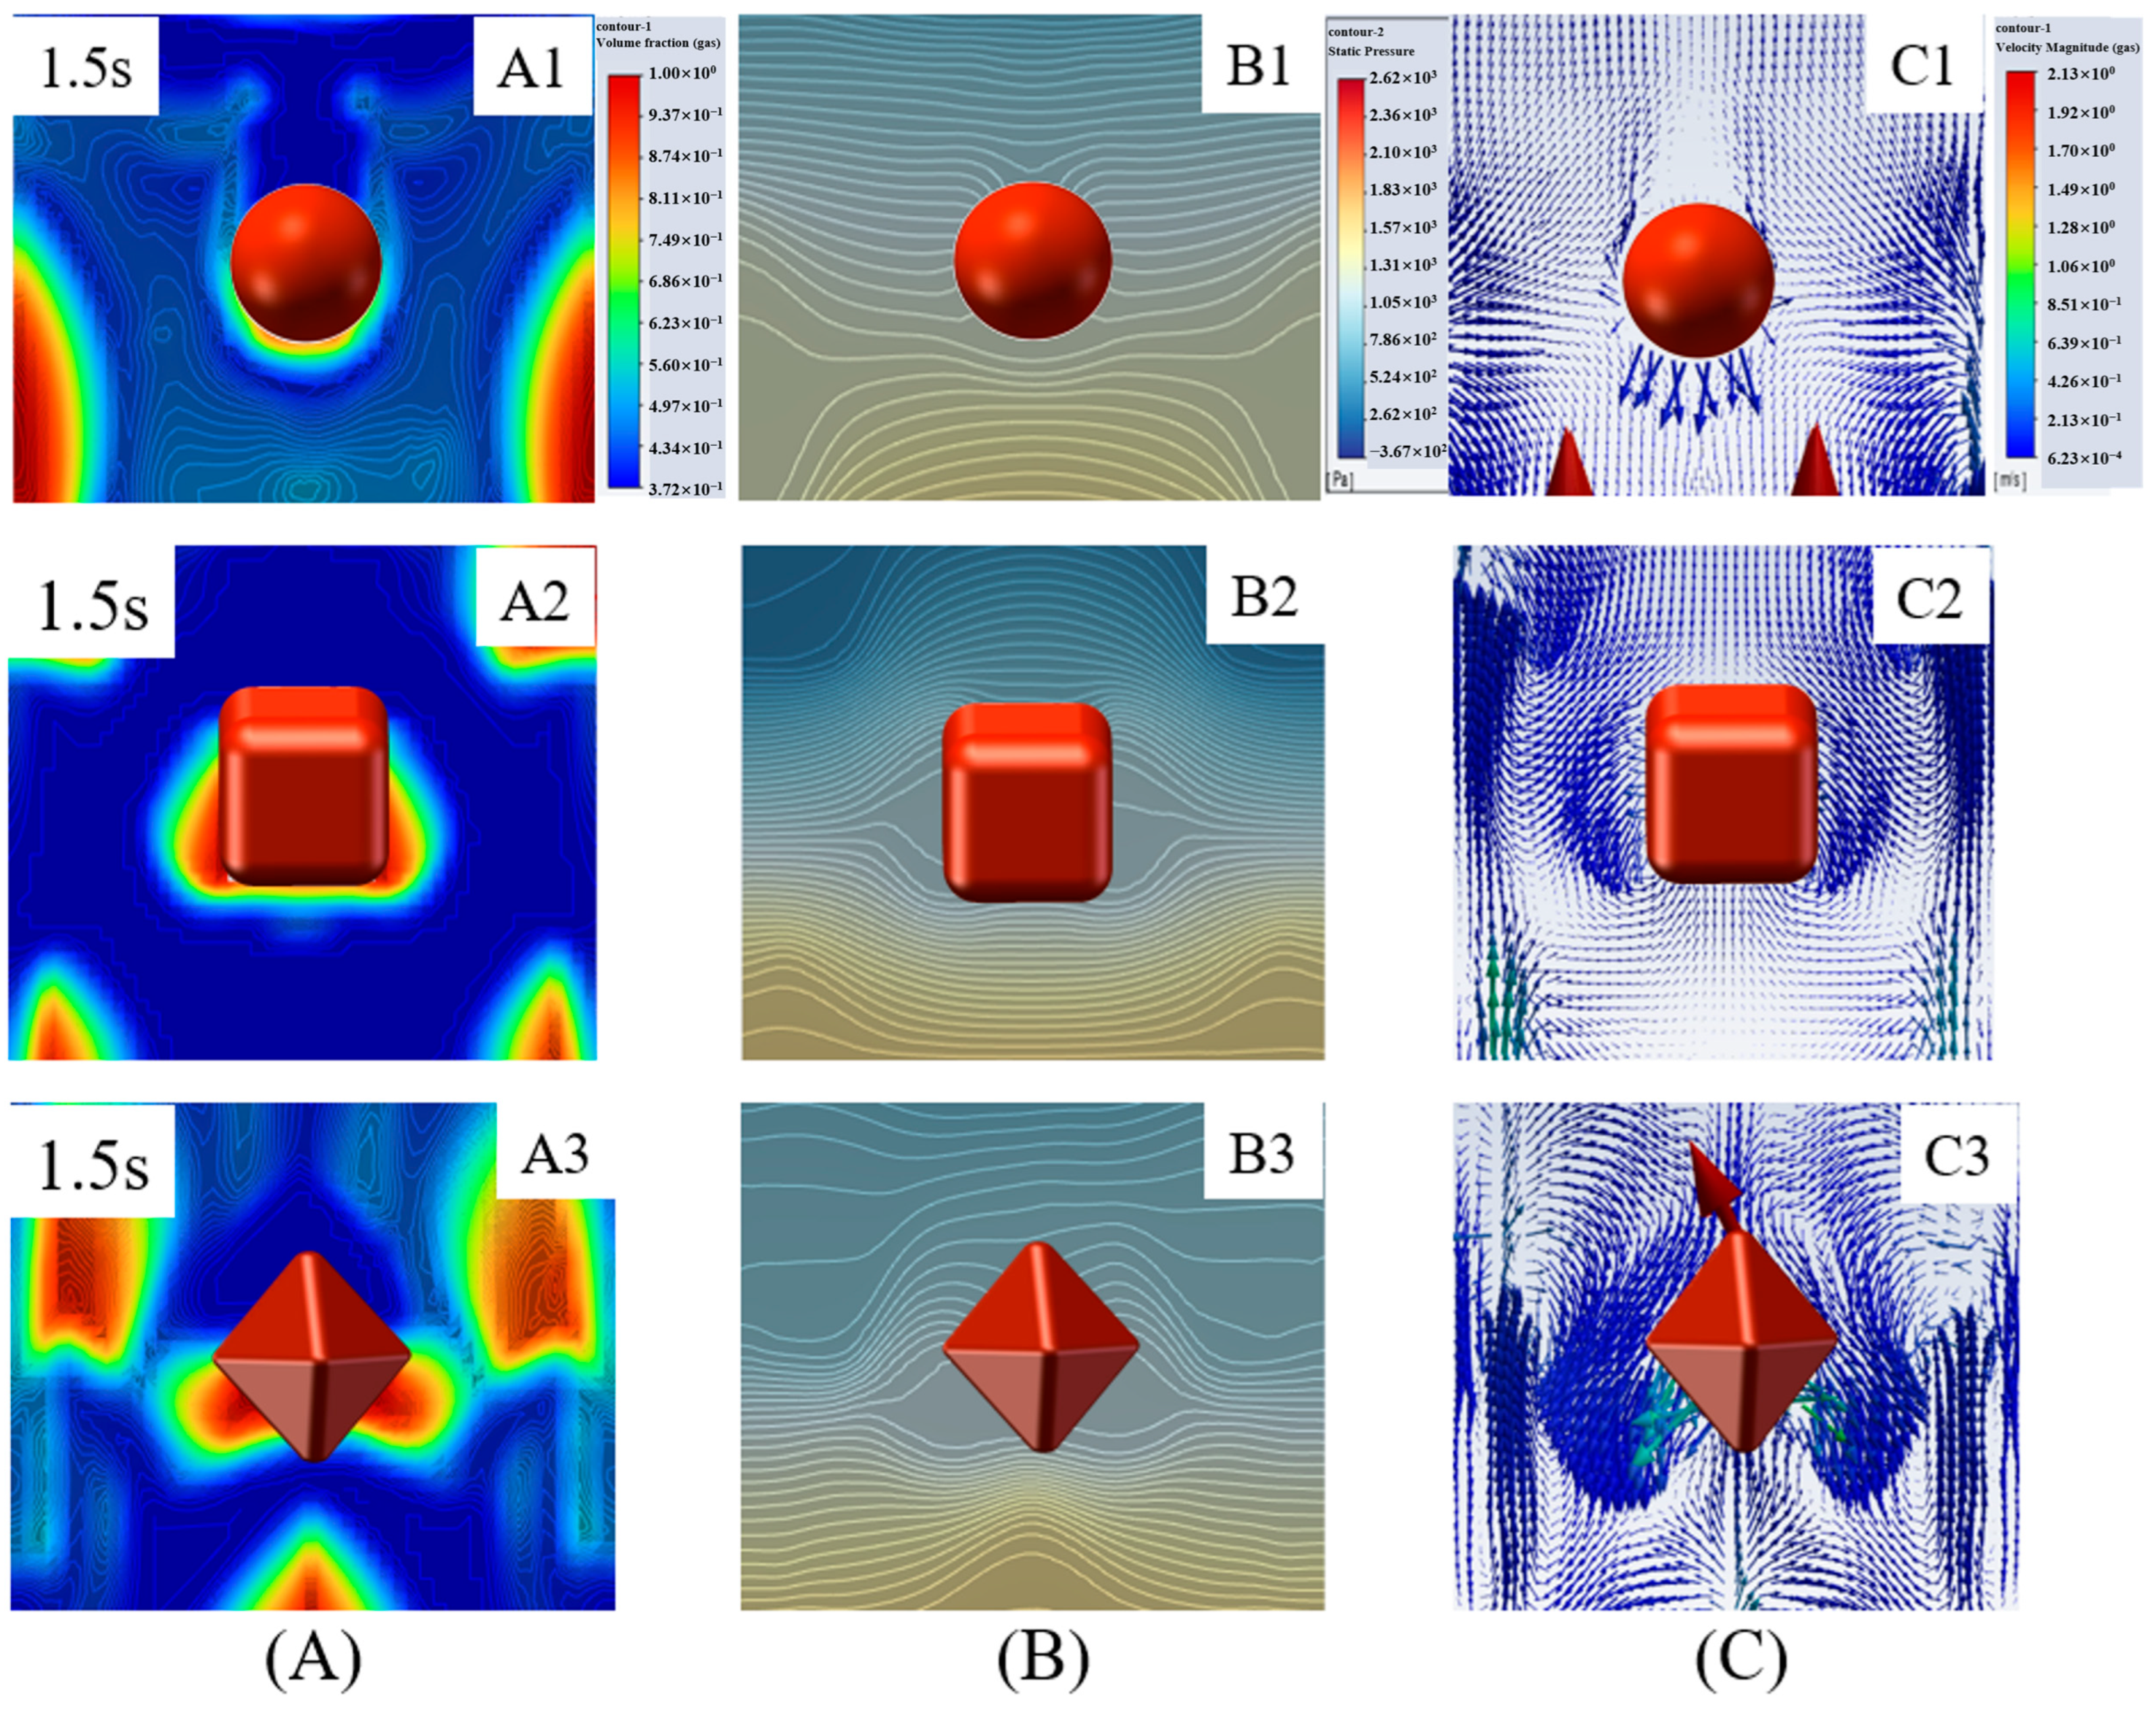
Figure 12 compares the gas volume fraction, static pressure, and medium-particle velocity fields around feed particles of different sizes at N = 1.2. The numerical fields reproduce the experimental trend that the local disturbance expands as the feed-particle diameter increases: contour-line curvature, bubble residence beneath the particle, and lateral medium displacement are weakest for the 13 mm particle and strongest for the 50 mm particle.
Figure 12.
Flow field distribution around particles with different sizes: (A1) bubble variation for spherical particles; (A2) bubble variation for blocky particles; (A3) bubble variation for polygonal particles; (B1) pressure distribution for spherical particles; (B2) pressure distribution for blocky particles; (B3) pressure distribution for polygonal particles; (C1) velocity of medium particles for spherical particles; (C2) velocity of medium particles for blocky particles; (C3) velocity of medium particles for polygonal particles.
As shown in Figure 12A, the bubble growth and detachment process is clearly observable. At t = 2.5 s, excess gas forms small bubbles that continuously merge, grow, and collapse as they rise, thereby affecting the large particles within the bed. The gas pressure inside the bubbles is nearly uniform. As bubbles pass near the spheres, the pressure gradient around the spherical particles is slightly weakened. However, the repeated detachment of bubbles from the surfaces of large particles may cause changes in the forces acting on the particles, thereby affecting their buoyancy-driven motion [39]. As shown in Figure 12(B3), 50 mm spherical particles influence the surrounding gas–solid two-phase flow. During their ascent, bubbles aggregate and adhere to the surface of the spherical particles, disrupting the local pressure distribution within the bed. Pressure contour lines bend at the particle surface, and fluid medium particles are squeezed under the action of the bubbles. Furthermore, numerical studies have shown that the immersion of large particles into a fluidized bed disrupts the gas–solid two-phase flow field. In Figure 12(C3), the presence of large particles obstructs the normal flow of solid particles, forcing them toward the bed walls; simultaneously, a large number of medium particles on the upper surface move downward, resulting in an uneven particle distribution. When the feed-particle size was reduced to 25 mm and 13 mm, as shown in Figure 12(A1,A2,B1,B2), the size of the bubbles attached to the particle surfaces decreased, and the pressure contour lines on the particle surfaces tended to stabilize. Observation of the particle motion vectors in Figure 12(C1,C2) revealed that the surface medium particles moved in an orderly manner, and the particle distribution was relatively uniform. This indicates that as the feed-particle size decreases, the influence of large particles on the local flow field gradually weakens, and the fluidization state within the bed tends to stabilize. This is consistent with the experimental results in Section 3.1, where the 13 mm particles exhibited the smallest pressure drop fluctuations.
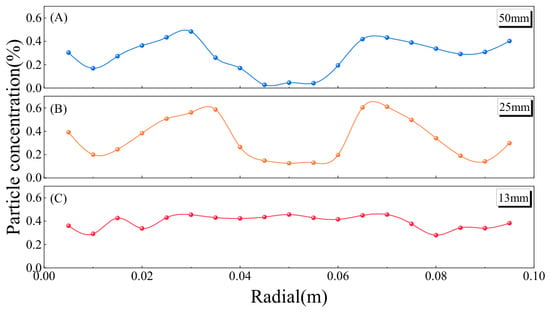
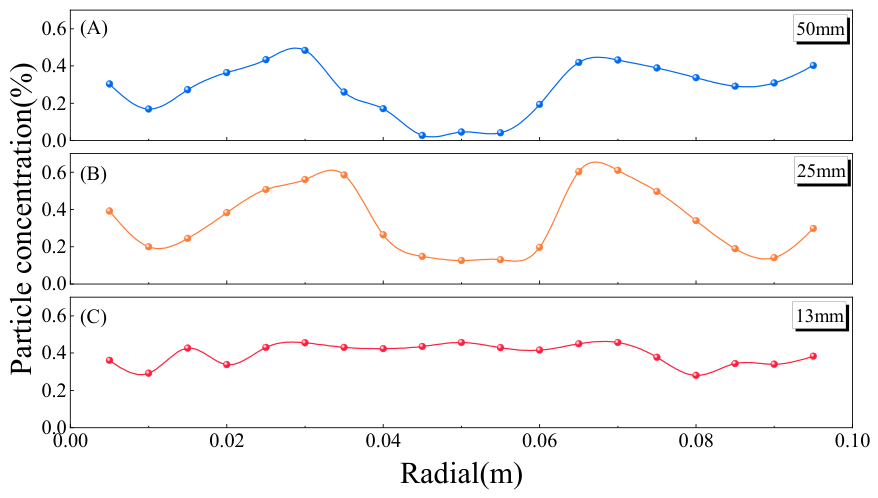
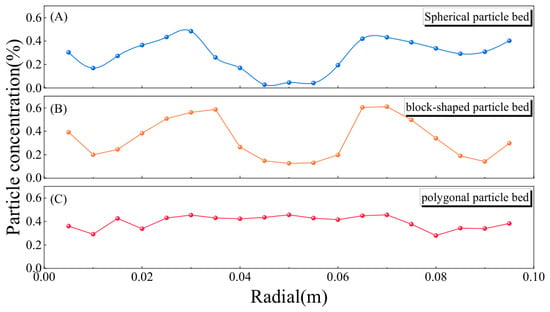
As shown in Figure 13A, the concentration of fine particles in the bubble zone fluctuates dramatically; bubbles adhere to the bottoms of large particles, resulting in a significant decrease in the concentration of the medium at the bottom. As shown in Figure 13B,C, as particle size decreases, large bubbles gradually cease to adhere to the particles; instead, upon contact, they break into small bubbles that disperse on both sides of the incoming particles, causing localized fluctuations in medium concentration.
Figure 13.
Distribution of medium concentration at the bottom of feed particles with different sizes: (A) 50 mm particle; (B) 25 mm particle; (C) 15 mm particle.
As shown in Figure 14, numerical simulations were conducted to analyze the influence of particles with different shapes on the variation patterns of the local flow field within the bed. Upon entering a stable flow field, large particles disrupt the gas–solid flow, and the extent of this impact varies depending on the shape of the incoming particles. Figure 14A illustrates the local fluidization state of spherical, block-shaped, and polygonal particles after they are introduced into the fluidized bed at t = 1.5 s. Under identical conditions, bubbles adhering to the particle surfaces create expansion zones around the particles, while the sides of the particles are squeezed by bubbles and larger particles, leading to particle accumulation and the formation of compaction zones. As bubbles move, they adhere to the bottom of the particles, forming an “air cushion,” which may cause uneven forces on the upper and lower surfaces of large particles and consequently affect their motion. Spherical and block-shaped particles have smooth bottoms without sharp edges, making it easy for bubbles to adhere and form air cushions. As shown in Figure 14(B1,C1), spherical particles have smooth and uniform geometries; fewer bubbles adhere to their lower surfaces, and the bubbles gradually dissipate as they rise with the airflow. The volume distribution of surrounding solid-phase particles is relatively uniform, pressure drop contour lines are distributed regularly, and the medium particles flow in an ordered manner [40]. As shown in Figure 14(A2,B2,C2), the bottom surface of block-shaped particles has a large area in direct contact with the gas flow. The bubbles adhering to the bottom continue to grow as they rise, causing bubbles to adhere to most of the particle’s surface and form a large air cushion. This creates a large expansion zone, leading to local flow field disturbances. Medium particles on both sides of the particle rapidly mix downward, resulting in non-uniformity in the flow field within the bed and local fluctuations in pressure drop. These simulation results are consistent with the observations in Experiment 3.2, where the pressure difference across the upper and lower surfaces of the block-shaped particles exceeded 400 Pa, and pressure drop fluctuations were most severe. This indicates that the air cushion effect at the bottom of the block-shaped particles is the key mechanism causing pressure concentration and medium recirculation around them. As shown in Figure 14(A3,B3,C3), large bubbles rupture upon encountering polygonal particles, forming small bubbles that disperse across the particle surface and then recombine into large bubbles on both sides and at the top. This may cause an increase in local gas velocity and flow disturbances, leading to significant pressure drop fluctuations within the bed.
Figure 14.
Flow field distribution around particles of different shapes: (A1) bubble variation around spherical particles; (A2) bubble variation around blocky particles; (A3) bubble variation around polygonal particles; (B1) pressure distribution around spherical particles; (B2) pressure distribution around blocky particles; (B3) pressure distribution around polygonal particles; (C1) velocity of medium particles around spherical particles; (C2) velocity of medium particles around blocky particles; (C3) velocity of medium particles around polygonal particles.
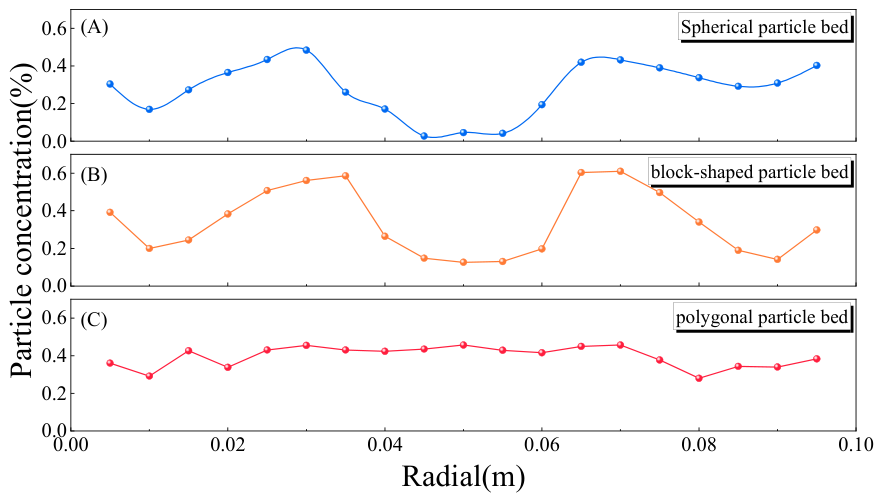
As shown in Figure 15B, the air cushion causes a significant decrease in the concentration of the fluid medium beneath the block-shaped particles. The sharp edges at the bottom and top of the polygonal particles alter the direction of gas flow, resulting in a more complex flow pattern. In Figure 15C, the concentration of the medium beneath the polygonal particles does not fluctuate significantly; whereas, the flow of the medium on either side fluctuates frequently due to the presence of a large number of bubbles.
Figure 15.
Radial distribution of medium-particle concentration beneath feed particles with different shapes: (A) spherical, (B) block-shaped, (C) polygonal particles.
3.5. Experimental-Numerical Validation and Scope
A direct comparison was performed at N = 1.2 using the same evaluation metric for the experimental and CFD data: the time-averaged absolute pressure difference between the lower and upper feed-particle surfaces, ΔP = |plower − pupper|. The experimental and numerical data were processed according to this consistent definition, and the resulting values and case-by-case relative errors are reported in Table 5.
Table 5.
Direct comparison of experimental and CFD particle-surface pressure differences at N = 1.2.
Table 5 shows that the CFD model reproduces both experimental orderings: 13 < 25 < 50 mm for the spherical particles and spherical < polygonal < block-shaped for the 50 mm particles. The case-by-case relative errors range from 4.7% to 7.0%, with a mean absolute relative error of 5.5%; the maximum error occurs for the block-shaped particle. The CFD values are slightly lower than the experimental values in all five cases, which may be associated with the two-dimensional model simplification and the representation of the polydisperse magnetite medium by a single mean diameter. Overall, the agreement confirms that the model reliably captures both the magnitude of the particle-surface pressure difference and the effects of particle size and shape.
4. Conclusions
- (1)
- Coarse feed particles produce a measurable particle-scale disturbance that is superimposed on the background bubbling of the dense medium. At N = 0.8, the bed remains unfluidized and both the pressure standard deviation and low-frequency PSD energy are small. In the intermediate range 1.0 ≤ N < 1.6, the upper–lower pressure difference and PSD response increase strongly with feed-particle size, and synchronized images show repeated bubble attachment and detachment around the particle. At N ≥ 1.6, bulk-bed turbulence and bubble overlap dominate the signal, reducing the relative distinguishability of particle-size effects.
- (2)
- Particle shape controls the topology of the local gas path. The spherical particle produces the most symmetric pressure field and the weakest recirculation. The flat lower face of the block-shaped particle traps gas, forms a persistent gas cushion, and generates the largest upper–lower pressure difference; whereas, the polygonal particle promotes bubble splitting and recombination at its edges. Thus, the relevant mechanism is not sphericity alone but the interaction between face orientation, projected area, and local bubble attachment.
- (3)
- At N = 1.2, the time-averaged particle-surface pressure differences over t = 1.0–3.0 s were 577.5, 590.0, and 595.6 Pa for the 4.5, 3.0, and 2.0 mm meshes, respectively. Relative to the fine grid, the coarse- and medium-grid deviations were 3.04% and 0.94%; consequently, the 3.0 mm mesh was adopted. The experimental-CFD comparison reproduced the measured size and shape rankings, with case-by-case relative errors of 4.7–7.0% and a mean absolute relative error of 5.5%. Increasing particle size promoted bubble residence beneath the particle; whereas, the flat lower face of the block-shaped particle produced the strongest gas cushion and local pressure concentration. Although the calculation is two-dimensional and represents the polydisperse medium by one diameter, the agreement confirms that the model captures the pressure scale and comparative mechanisms.
Author Contributions
Conceptualization, Z.C. and Y.Z.; methodology, Z.C. and S.Z.; software, Z.C. and B.L.; validation, Z.C., S.Z., G.Z., D.Z. and E.Z.; formal analysis, Z.C. and S.Z.; investigation, Z.C., S.Z., G.Z. and B.L.; resources, Y.Z. and E.Z.; data curation, Z.C., S.Z., G.Z. and D.Z.; writing—original draft preparation, Z.C.; writing—review and editing, Y.Z. and E.Z.; visualization, Z.C. and D.Z.; supervision, Y.Z. and E.Z.; project administration, Y.Z.; funding acquisition, Y.Z. and E.Z. All authors have read and agreed to the published version of the manuscript.
Funding
This research was funded by the National Natural Science Foundation of China, grant number 52304306, and the Jiangsu Provincial Natural Science Foundation, grant number BK20231073.
Data Availability Statement
The original contributions presented in this study are included in the article. Further inquiries can be directed to the corresponding author(s).
Acknowledgments
This research was funded by the National Natural Science Foundation of China (No. 52304306) and the Jiangsu Provincial Natural Science Foundation (Grant No. BK20231073).
Conflicts of Interest
The authors declare no conflicts of interest.
References
- Zhao, Y.; Zhang, Y.; Zhou, E.; Zhou, C.; Dong, L.; Zhang, B.; Duan, C. Research Progress and Prospects of Clean and Efficient Dry Coal Beneficiation. J. China Univ. Min. Technol. 2022, 51, 607–616. [Google Scholar]
- Dai, L.; Fang, S.; Li, S.; Lyu, G.; Chai, X.; Duan, C.; Zhou, E. Investigation on force characteristics and separation ofcoal in dry dense medium fluidized bed. J. Clean. Coal Technol. 2021, 27, 17–24. [Google Scholar]
- Xi, T.; Ren, Y.; Li, Y.; Duan, C.; Zhao, Y. Study on the Collision and Adhesion Characteristics of Heavy-Media Particles and Coal Surfaces in a Dry Heavy-Media Fluidized Bed. J. Taiyuan Univ. Technol. 2024, 55, 937–947. [Google Scholar]
- Zhang, G.; Dong, L.; Zhou, E.; Duan, C.; Zhao, Y. Multiscale Pressure Analysis and Fluidization Quality Characterization of a Dry Heavy-Media Fluidized Bed. Coal Sci. Technol. 2023, 51, 215–223. [Google Scholar]
- Karimipour, S.; Pugsley, T. Study of gas streaming in a deep fluidized bed containing Geldart’s Group A particles. Chem. Eng. Sci. 2010, 65, 3508–3517. [Google Scholar] [CrossRef] [Scilit]
- Hao, W. A Study on the Characteristics of Non-Uniform Structures in Bubbling Fluidized Beds and Methods for Their Control. Ph.D. Thesis, Chongqing University, Chongqing, China, 2021. [Google Scholar]
- Wang, S.; Yu, W.; Chen, J.; Liu, Y.; Li, H. Multiscale Numerical Simulation of Flow Characteristics in a Bubbling Fluidized Bed. Acta Mech. Sin. 2016, 48, 585–592. [Google Scholar]
- Yan, S. A Study on the Gas-Solid Two-Phase Flow Characteristics of Irregularly Shaped Particles in a Bubbling Fluidized Bed. Ph.D. Thesis, Harbin Institute of Technology, Harbin, China, 2014. [Google Scholar]
- Bi, H.T. A critical review of the complex pressure fluctuation phenomenon in gas–solids fluidized beds. Chem. Eng. Sci. 2007, 62, 3473–3493. [Google Scholar] [CrossRef] [Scilit]
- Van Ommen, J.R.; Sasic, S.; Van der Schaaf, J.; Gheorghiu, S.; Johnsson, F.; Coppens, M.-O. Time-series analysis of pressure fluctuations in gas–solid fluidized beds—A review. Int. J. Multiph. Flow 2011, 37, 403–428. [Google Scholar] [CrossRef] [Scilit]
- Johnsson, F.; Zijerveld, R.C.; Schouten, J.C.; Bleek, C.v.D.; Leckner, B. Characterization of fluidization regimes by time-series analysis of pressure fluctuations. Int. J. Multiph. Flow 2000, 26, 663–715. [Google Scholar] [CrossRef] [Scilit]
- Sobrino, C.; Sánchez-Delgado, S.; García-Hernando, N.; de Vega, M. Standard deviation of absolute and differential pressure fluctuations in fluidized beds of group B particles. Chem. Eng. Res. Des. 2008, 86, 1236–1242. [Google Scholar] [CrossRef] [Scilit]
- Porter, L.; Meyer, B.; Graebner, M.; Richter, A. A reference data set for bubbling fluidized bed model validation: PIV and Pressure measurements. Powder Technol. 2025, 453, 120552. [Google Scholar] [CrossRef] [Scilit]
- Errigo, M.; Windows-Yule, C.; Materazzi, M.; Werner, D.; Lettieri, P. Non-invasive and non-intrusive diagnostic techniques for gas-solid fluidized beds—A review. Powder Technol. 2024, 431, 119098. [Google Scholar] [CrossRef] [Scilit]
- Liu, M.; Zhang, Y.; Bi, H.; Grace, J.R.; Zhu, Y. Non-intrusive determination of bubble size in a gas–solid fluidized bed: An evaluation. Chem. Eng. Sci. 2010, 65, 3485–3493. [Google Scholar] [CrossRef] [Scilit]
- Vollmari, K.; Jasevičius, R.; Kruggel-Emden, H. Experimental and numerical study of fluidization and pressure drop of spherical and non-spherical particles in a model scale fluidized bed. Powder Technol. 2016, 291, 506–521. [Google Scholar] [CrossRef] [Scilit]
- Wang, Y. The Effect of Feed Particle Size on Fluidization in Sorting and Its Separation Behavior. Master’s Thesis, China University of Mining and Technology, Xuzhou, China, 2017. [Google Scholar]
- Ganguli, A.; Bhatt, V. CFD simulations to study bed characteristics in gas–solid fluidized beds with binary mixtures of Geldart-B particles: A qualitative analysis. Front. Energy Res. 2023, 11, 1059503. [Google Scholar] [CrossRef] [Scilit]
- Bai, T.; Sun, Z.; Guo, Z.; Zhu, J.; Barghi, S. Bubble dynamics in a binary Gas-Solid fluidization system of Geldart B and Geldart D particles. Chem. Eng. Sci. 2022, 258, 117771. [Google Scholar] [CrossRef] [Scilit]
- Deivendran, B.; De Somer, C.; Coene, A.; Buelens, L.C.; Poelman, H.; Galvita, V.V.; Dupre, L.; Van Geem, K.M.; Heynderickx, G.J. Gas-solid magnetically fluidized beds—A review. Powder Technol. 2025, 453, 120615. [Google Scholar] [CrossRef] [Scilit]
- Xie, J.; Gao, H.; Zhang, Q.; Chen, J.; Wang, Z.; Zhang, C.; Bai, D. Characteristics of mass transfer between bubble and emulsion phases of high-temperature gas–solid bubbling fluidized beds. Particuology 2025, 107, 26–34. [Google Scholar] [CrossRef] [Scilit]
- Tsuji, T.; Penn, A.; Hattori, T.; Pruessmann, K.P.; Müller, C.R.; Oshitani, J.; Washino, K.; Tanaka, T. Mechanism of anomalous sinking of an intruder in a granular packing close to incipient fluidization. Phys. Rev. Fluids 2021, 6, 064305. [Google Scholar] [CrossRef] [Scilit]
- Köhler, A.; Guío-Pérez, D.C.; Prati, A.; Larcher, M.; Pallarès, D. Rheological effects of a gas fluidized bed emulsion on falling and rising spheres. Powder Technol. 2021, 393, 510–518. [Google Scholar] [CrossRef] [Scilit]
- Lindborg, H.Å.; Lysberg, M.; Jakobsen, H.A. Practical validation of the two-fluid model applied to dense gas–solid flows in fluidized beds. Chem. Eng. Sci. 2007, 62, 5854–5869. [Google Scholar] [CrossRef] [Scilit]
- Han, J.; Chen, P.; Gui, D.; Li, Y. Examination of particle motion in fluidized bed flotation columns: Effect of particle shape. Powder Technol. 2024, 447, 120229. [Google Scholar] [CrossRef] [Scilit]
- Neogi, A.; Mohanta, H.K.; Sande, P.C. Study of fluidized bed freeboard for effect of Geldart A particles shape using particle image velocimetry (PIV). Powder Technol. 2024, 433, 119235. [Google Scholar] [CrossRef] [Scilit]
- Tian, C.; Wang, Q.; Zhang, X.; Liu, Y.; Li, B. Influence of Circulating Fluidized Bed Internal Structures on Local Flow Characteristics. J. Process Eng. 2009, 9, 139–145. [Google Scholar]
- Mema, I.; Buist, K.A.; Kuipers, J.A.M.; Padding, J.T. Fluidization of spherical versus elongated particles: Experimental investigation using magnetic particle tracking. AIChE J. 2020, 66, e16895. [Google Scholar] [CrossRef] [Scilit]
- Boyce, C.M.; Ozel, A.; Rice, N.P.; Rubinstein, G.J. Effective particle diameters for simulating fluidization of non-spherical particles: CFD-DEM models vs. MRI measurements. AIChE J. 2017, 63, 2555–2568. [Google Scholar] [CrossRef] [Scilit]
- Wang, C. Simulation Study on the Optimization of Distribution Plates and Particle Properties in Gas-Solid Fluidized Beds. Master’s Thesis, Xi’an University of Technology, Xi’an, China, 2021. [Google Scholar] [CrossRef]
- van der Schaaf, J.; Schouten, J.C.; Johnsson, F.; Bleek, C.v.D. Non-intrusive determination of bubble and slug length scales in fluidized beds by decomposition of the power spectral density of pressure time series. Int. J. Multiph. Flow 2002, 28, 865–880. [Google Scholar] [CrossRef] [Scilit]
- Moliner, C.; Marchelli, F.; Ong, L.; Martinez-Felipe, A.; Van der A, D.; Arato, E. Sensitivity analysis and validation of a Two Fluid Method (TFM) model for a spouted bed. Chem. Eng. Sci. 2019, 207, 39–53. [Google Scholar] [CrossRef] [Scilit]
- Adnan, M.; Sun, J.; Ahmad, N.; Wei, J.J. Validation and sensitivity analysis of an Eulerian-Eulerian two-fluid model (TFM) for 3D simulations of a tapered fluidized bed. Powder Technol. 2022, 396, 490–518. [Google Scholar] [CrossRef] [Scilit]
- Cloete, S.; Johansen, S.T.; Amini, S. Grid independence behaviour of fluidized bed reactor simulations using the Two Fluid Model: Detailed parametric study. Powder Technol. 2016, 289, 65–70. [Google Scholar] [CrossRef] [Scilit]
- Guo, L. Analysis of Gas-Solid Two-Phase Flow in a Large-Scale Vibrating Fluidized Bed. Master’s Thesis, Northeastern University, Shenyang, China, 2011. [Google Scholar]
- Yang, J. A Study on the Gas-Solid Flow Structure and Heat and Mass Transfer Characteristics in a Wet Granular Vibrating Fluidized Bed. Ph.D. Thesis, China University of Mining and Technology, Xuzhou, China, 2023. [Google Scholar]
- Honda, Y.; Saito, S.; Anzai, T.; Harada, S.; Tsuji, T.; Washino, K.; Oshitani, J.; Kajiwara, H.; Matsuoka, K. Experimental verification of the Brinkman equation around objects with various shapes in gas–solid stationary and fluidized beds. Int. J. Multiph. Flow 2023, 160, 104359. [Google Scholar] [CrossRef] [Scilit]
- Chen, Z.Q.; Zhao, S.Z.; Zhang, J.; Xu, X.; Zhang, Y.; Zhou, E.; Duan, C. Effect of fluidized bed shapes on gas-solid fluidization characteristics and flow regime transition. Chem. Eng. Res. Des. 2024, 204, 147–158. [Google Scholar] [CrossRef] [Scilit]
- Mier-torrecilla, M.; Idelsohn, S.R.; Oñate, E. Advances in the simulation of multi-fluid flows with the particle finite element method. Application to bubble dynamics. Int. J. Numer. Methods Fluids 2011, 67, 1516–1539. [Google Scholar] [CrossRef] [Scilit]
- Shrestha, S.; Kuang, S.; Yu, A.; Zhou, Z. Bubble dynamics in bubbling fluidized beds of ellipsoidal particles. AIChE J. 2019, 65, e16736. [Google Scholar] [CrossRef] [Scilit]



Disclaimer/Publisher’s Note: The statements, opinions and data contained in all publications are solely those of the individual author(s) and contributor(s) and not of MDPI and/or the editor(s). MDPI and/or the editor(s) disclaim responsibility for any injury to people or property resulting from any ideas, methods, instructions or products referred to in the content. |
© 2026 by the authors. Licensee MDPI, Basel, Switzerland. This article is an open access article distributed under the terms and conditions of the Creative Commons Attribution (CC BY) license.