


Abstract
Gas–solid fluidized bed separation uses upward gas flow to fluidize a dense medium. By controlling medium properties, gas velocity, and bed height, the apparent bed density can be adjusted so that low-density particles float and high-density particles sink. In practice, separation density may differ from measured bed density. Large feed particles can cause local defluidization near the upper bed, increasing resistance and effective particle weight. Bubble behavior also affects separation: near minimum fluidization, limited bed activity restricts particle motion, whereas higher gas velocities promote bubble growth, coalescence, and wake-induced upward transport of medium particles. Fine low-density particles may also pass through bubbles, disrupting normal separation. These effects are especially important in high-bed Geldart A systems. This study developed a separation-density model for a Geldart A dense-medium gas–solid fluidized bed from the force balance of spherical particles and compared it with a Geldart B model. Forces on spherical simulated feed particles were measured under different operating conditions, and theoretical separation densities were calculated. Separation tests were then performed to evaluate the effects of gas velocity and bed height, compare bed and separation densities, and assess model reliability. The results support density regulation and scale-up of dry beneficiation using Geldart A media.
1. Introduction
In a gas–solid fluidized bed separator, dense-medium particles form a bed with fluid-like properties under the action of an upward gas flow [1,2,3]. By selecting appropriate medium materials and adjusting the gas velocity and bed height, the apparent density of the bed can be regulated. Theoretically, when feed particles are introduced into the bed, separation particles with a density lower than that of the bed will float on the surface, while those with a higher density will sink to the bottom. In this way, feed particles with different densities can be separated within the gas–solid fluidized bed.
However, compared with the liquid–solid separation environment, the bed conditions in a gas–solid fluidized bed are more easily affected by the introduction of feed particles [4,5]. For instance, when large separation particles are fed into the bed, a defluidized region, or dead zone, is likely to form in the upper part of the bed. This non-fluidized area increases the apparent weight and effective density of the particles, thereby hindering normal separation.
In addition, the bubble phase in a gas–solid fluidized bed can also influence the separation of feed particles. When the gas velocity is low and approaches the minimum fluidization velocity, few bubbles appear, resulting in low bed activity. Under these conditions, the motion of dense-medium particles is limited, the resistance of the dense-medium particles to the separation particles increases, and the settling time of the separation particles becomes longer. As the gas velocity increases and larger bubbles form, bubbles tend to coalesce during their upward movement, creating larger gas pockets. On one hand, the rising bubbles carry dense-medium particles upward in their wake, which interferes with the normal settling and separation of separation particles. On the other hand, since the bubble phase has a density and velocity much lower than that of the separation particles, low-density separation particles smaller than the bubbles may pass directly through them, significantly affecting the separation of fine particles.
Due to these factors, the actual separation density of separation particles may differ from the apparent bed density. Therefore, it is necessary to conduct separation experiments in Geldart Group A dense medium fluidized beds to analyze the relationship between the separation density and the bed density, and to establish a separation density model applicable to Group A dense medium fluidized beds under high-bed conditions. Geldart Group A powders are fine particles classified according to their mean particle size and the particle–gas density difference. They characteristically exhibit appreciable homogeneous bed expansion between the minimum fluidization velocity (Umf) and the minimum bubbling velocity (Umb) [6,7,8]. In this study, a Geldart A dense medium refers to a gas-fluidized bed formed by fine magnetite particles, with a mean particle size of approximately 83.2 μm, whose expanded particle-rich phase provides the apparent density used for dry separation.
In this study, the theoretical model of separation density is developed based on the force analysis of spherical separation particles in Group A dense-medium fluidized beds and compared with the separation density of separation particles in Group B beds. Furthermore, the forces acting on spherical simulated feed particles in the gas–solid fluidized bed are measured to investigate the influence of different operational parameters on the particle forces and to determine the theoretical separation density. Based on these analyses, separation experiments using spherical simulated feed particles are conducted to explore the effects of gas velocity and bed height on separation density, to examine the differences between separation density and bed density, and to verify the reliability of the proposed model. Ultimately, a separation theory for gas–solid fluidization in Group A dense medium systems is proposed, providing a theoretical foundation for the large-scale industrial application and development of gas–solid fluidized bed separation technology.
2. Theoretical Analysis of Separation Density
2.1. Force Characteristics of Spherical Separation Particles in a Fluidized Bed
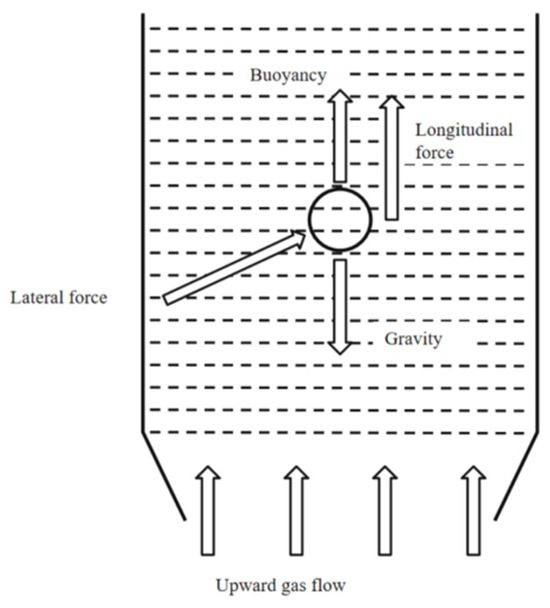
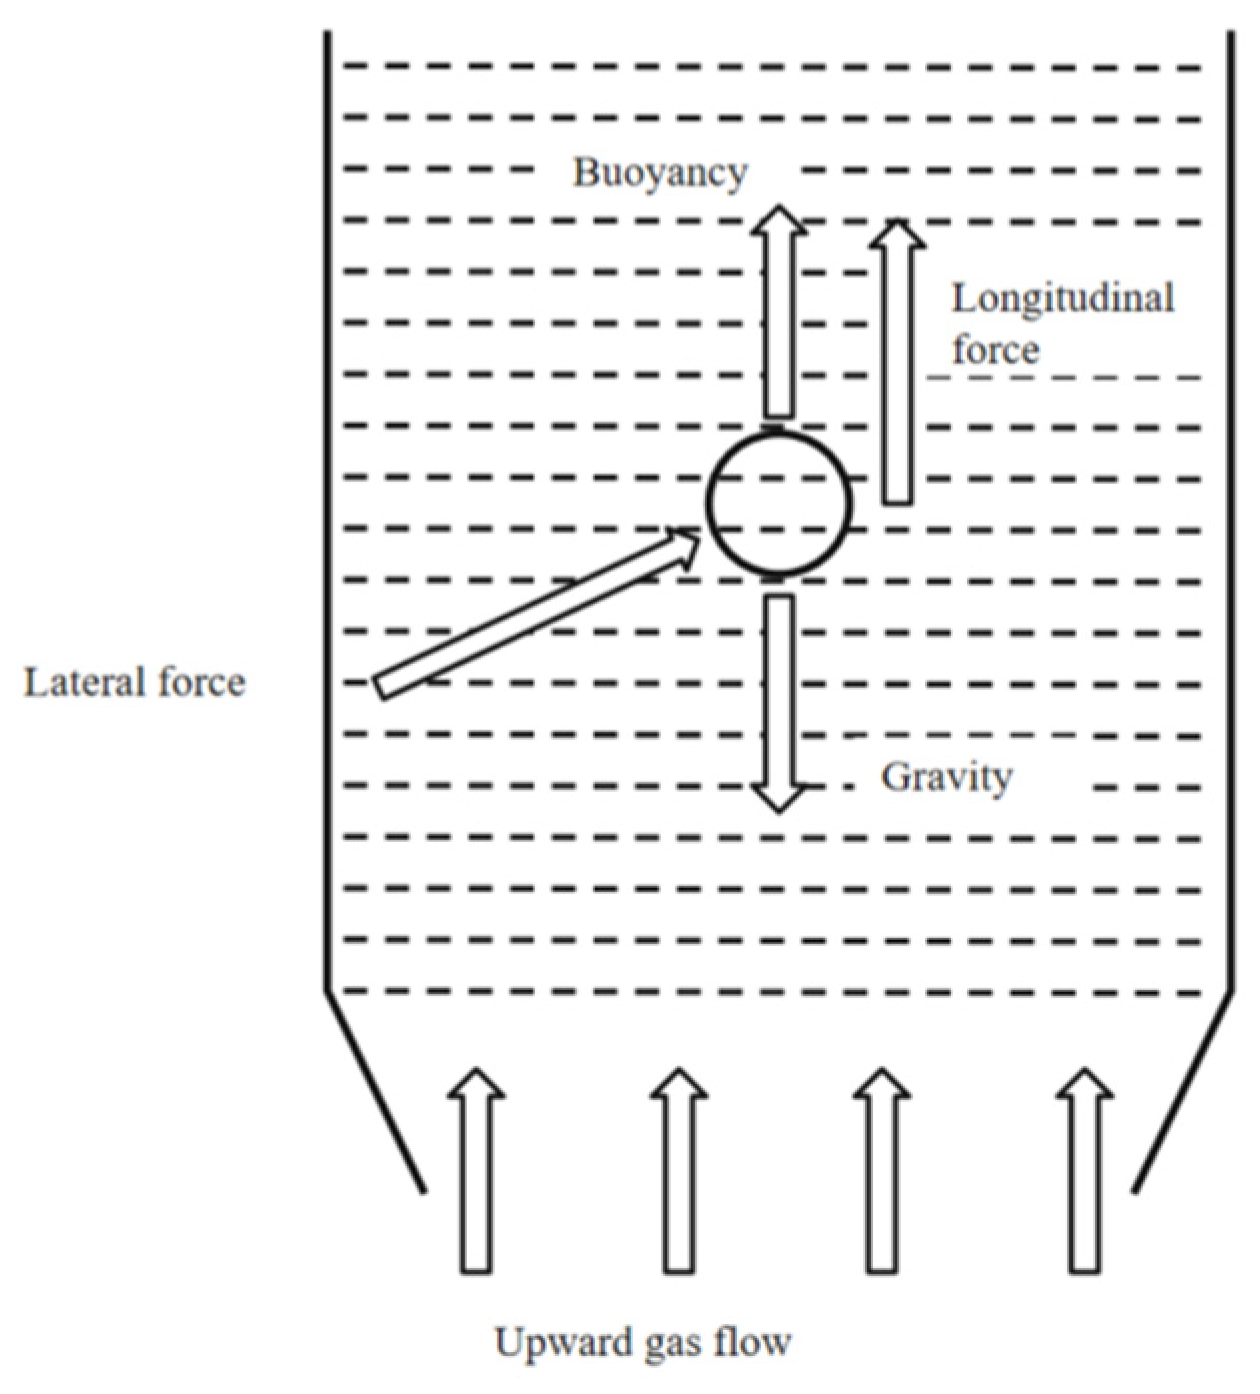
In a gas–solid fluidized bed, the motion of the particles being separated is controlled by several coupled factors: collisions and contact with dense-medium particles, bubble motion, particle size, and the properties of the selected medium. Because these effects occur at the same time, the separation behavior cannot be described only by the static bed density. A force analysis is therefore needed before the separation density can be interpreted. For a spherical separation particle in the bed, the main forces are gravity (G), buoyancy caused by the pressure gradient in the bed (Ff), and the drag force (Fd) from the gas flow. Additional forces—including added mass, Basset history force, Saffman lift, and Magnus force—may also appear during transient motion. With the sign convention stated above, the equation of motion can be written as follows:
Here, mp is the separation-particle mass; Ff, Fd, Fam, FB, FM, and FS denote pressure-gradient buoyancy, gas drag, added-mass force, Basset history force, Magnus force, and Saffman lift, respectively; and G denotes gravity. All force terms are expressed in N.
2.1.1. Particle Mass and Acceleration
For the isolated rigid spherical separation particle, the particle mass is determined from its diameter and density:
Here, ρp represents the density of the separation particle, up represents the particle velocity (m·s−1), and dp represents the particle diameter (m).
2.1.2. Gravity G
Gravity is determined by the mass of the separation particle and acts downward throughout the separation process. For a spherical particle, it is related to particle density and diameter and is given by:
where g represents the acceleration due to gravity, 9.81 m·s−2.
2.1.3. Buoyant Force Ff
The buoyant force Ff is produced by the pressure difference between the upper and lower surfaces of the particle in the bed. It is equivalent to the weight of the fluidized medium displaced by the particle:
where ρbed represents the bed density of the fluidized bed.
Because the gas–solid fluidized bed has fluid-like behavior, its bed density depends on the relative amounts of the particle-rich dense phase (traditionally termed the emulsion phase) and the bubble phase. Here, “emulsion phase” is a conventional gas–solid fluidization term and does not denote a liquid–liquid emulsion; “dense phase” is used hereafter. The bed density can therefore be written as:
where ρs represents the density of the dense phase, ρg represents the gas density, and εb represents the dimensionless volume fraction of the bubble phase.
Thus, the buoyancy acting on a separation particle is closely linked to the gas–solid phase distribution in the bed. Changes in the dense-phase and bubble fractions will directly affect the force balance and, consequently, the separation performance.
2.1.4. Gas Drag Force Fd
During separation, the spherical separation particle moves relative to the upward gas flow. This slip velocity generates viscous resistance, which is usually treated as the gas drag force. When the particle is fully exposed to the gas flow, the drag force can be estimated as:
where Cd is the dimensionless drag coefficient, u is the gas velocity, and up is the particle velocity.
The drag coefficient depends on the particle Reynolds number , where μ is the dynamic viscosity of the gas [9,10]. Different Reynolds-number ranges correspond to laminar, transitional, and turbulent flow, so the coefficient used in the calculation should be selected according to the actual operating conditions.
2.1.5. Basset Force FB
When a particle first enters the fluidized bed, its motion includes a short acceleration stage. During this period, relative acceleration between the particle and the surrounding dense medium makes the local flow field unsteady. The resulting history force is commonly referred to as the Basset force, which can be expressed as:
In Equation (7), t is time, t′ is the history-integration variable, and ξ(t′) is the time derivative of the gas–particle slip velocity at t′. Because the acceleration stage is short and the subsequent motion is relatively stable, FB is neglected in the present quasi-steady calculation. This simplification is a model assumption and should be reassessed under different flow conditions.
2.1.6. Added-Mass Force Fam
As a separation particle accelerates in the gas–solid bed, part of the surrounding gas is accelerated together with it. This effect increases the apparent inertia of the moving particle and is described by the added mass force. The force changes with particle position and may be written as:
Here, ζ = Du/Dt − dup/dt is the relative acceleration between the undisturbed gas and the separation particle, and D/Dt denotes the material derivative.
2.1.7. Magnus Force FM
A spherical separation particle may also rotate under the combined action of gas flow and dense-medium-particle contact. This rotation can produce a Magnus force, expressed as:
where ω is the angular velocity of the particle. No pronounced rotation of the spherical simulated feed particle was observed during force measurement; therefore, FM is neglected in the present quasi-steady analysis.
2.1.8. Saffman Lift FS
The Saffman lift is relevant mainly for a spherical particle moving in an infinite uniform shear flow at low Reynolds number. It can be written as:
In Equation (10), du/dy is the local gas-velocity gradient. Because the present one-dimensional framework does not resolve a sustained transverse velocity gradient, FS is neglected. This simplification is a model assumption and should be reassessed for different flow fields or geometries.
2.2. Derivation of Separation Density in the Fluidized Bed
Under the present quasi-steady conditions, the Basset, added-mass, Magnus, and Saffman terms are omitted, leaving gravity, buoyancy, and gas drag in the vertical force balance:
Substituting the force magnitudes gives:
When dup/dt = 0, the separation particle reaches its terminal settling velocity in the fluidized bed, and Equation (12) can be expressed as:
The drag coefficient Cd is selected according to the particle Reynolds number Rep. The Stokes regime is not universal in gas fluidized beds; as the particle size or gas particle slip velocity increases, Rep may enter the transition or Newton regime, for which non-Stokes drag correlations are required.
- Stokes regime:In the Stokes regime (Rep ≤ 0.1), viscous resistance is dominant and the drag coefficient is:
- In the transition regime (0.1 < Rep < 1000), the Schiller–Naumann correlation is used [11]:
- Newton regime:In the Newton regime (Rep ≥ 1000), pressure drag dominates and the drag coefficient can be approximated as:
For Geldart B magnetite powder, the minimum fluidization velocity is approximately 0.10 m·s−1, and the calculated particle Reynolds number lies outside the Stokes limit. The Schiller–Naumann correlation is therefore used for the drag coefficient.
By combining the bubble–dense-phase description of a bubbling gas–solid fluidized bed, Fu Zhijie et al. developed a density model for Geldart B dense media and then used it to describe separation density [12].
Here, ρeff is the effective separation density and ρdrag is the drag-induced equivalent-density contribution.
After Equation (15) is combined with the Geldart B two-phase model, the theoretical separation-density expression for the gas–solid fluidized bed is obtained as:
In Equation (19), εmf is the dimensionless voidage at minimum fluidization, H is the bed height, AD is the bed cross-sectional area, U is the superficial gas velocity, and Umf is the minimum fluidization velocity.
Where the value of Y is:
Here, Y is a dimensionless empirical correction factor, Ar is the dimensionless Archimedes number, and Ug is the superficial gas velocity.
For Geldart A magnetite powder, the minimum fluidization velocity is much lower, approximately 0.010 m·s−1. In the present system, Rep is approximately 0.05, so viscous drag dominates and the Stokes expression in Equation (14) is used. This assumption restricts the present model to the tested low-Rep conditions.
Combining the average bed-density model with the drag expression gives the separation-density model for Geldart A conditions:
In Equation (22), Ub is the bubble-rise velocity; the coefficient 0.85 and Y are dimensionless, and ρeff is expressed in kg·m−3.
The present model treats the object being separated as an isolated rigid sphere. Particle non-sphericity, particle–wall contact, and shape-dependent rotational effects are not explicitly resolved; therefore, the model should not be extrapolated to irregular feed particles without further validation. The vertical upward direction is defined as positive.
2.3. Prediction Model for Separation Density in Gas–Solid Fluidized Beds
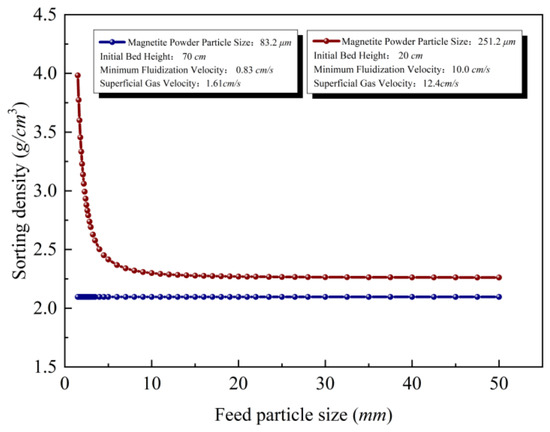
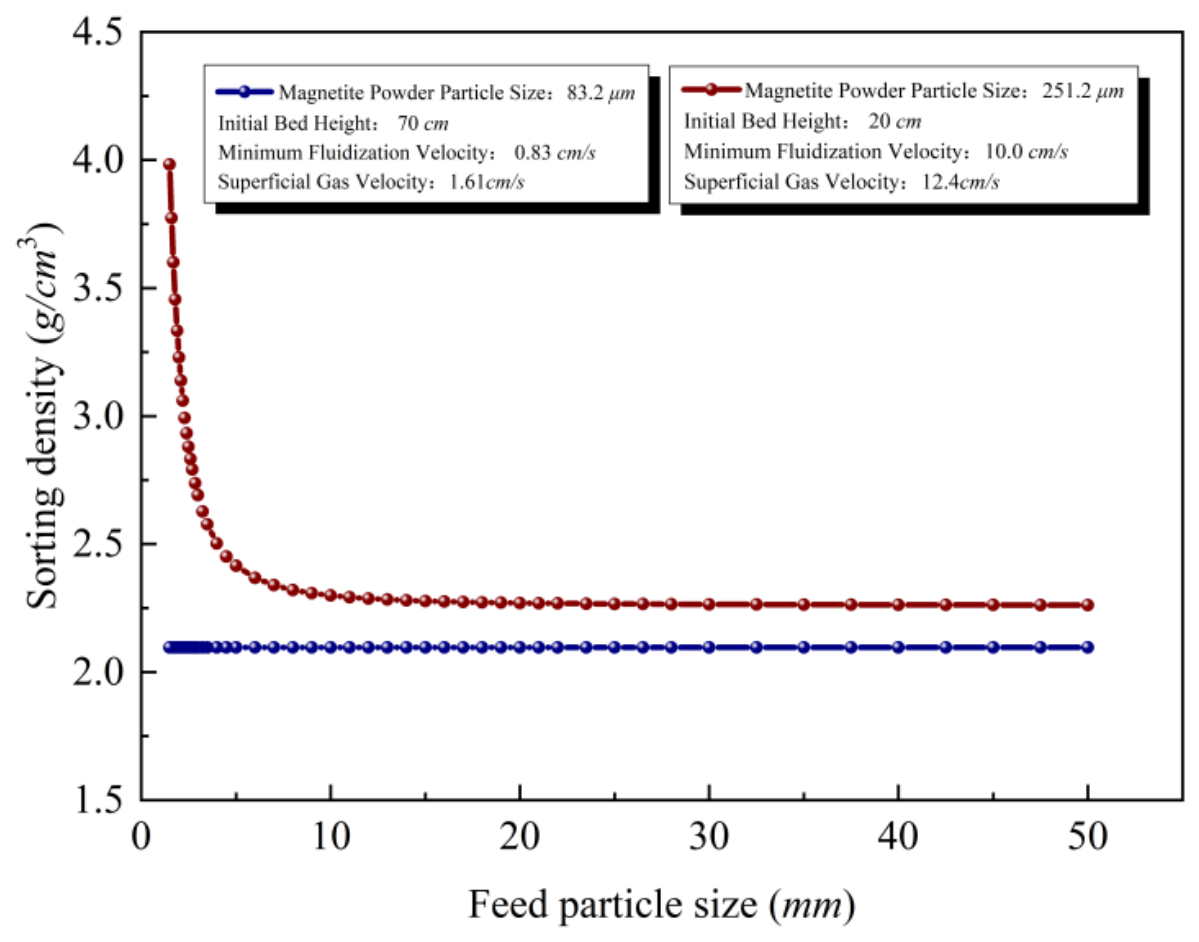
The Geldart A and Geldart B separation-density models were used to predict the separation density for mineral particles of different sizes [7]. For the Geldart B dense-medium system, the magnetite powder reported by Fu Zhijie et al., with a particle size of 150–300 μm, was used for comparison; the minimum fluidization velocity was 10 cm/s, the operating gas velocity was 12.4 cm/s, and the initial bed height was 20 cm. For the Geldart A system, magnetite powder with an average particle size of 83.2 μm was used. Its minimum fluidization velocity was 0.83 cm/s, with operating gas velocities of 1.38 and 1.61 cm/s and an initial bed height of 70 cm. Figure 1 and Figure 2 compares the predicted separation densities for the two media. The calculated bed density of the Geldart A medium is lower than that of the Geldart B medium, and the difference becomes more evident when the mineral particle size is below 10 mm. This behavior is mainly related to the stronger bed expansion of the Geldart A medium, which gives a wider adjustable density range. By contrast, the Geldart B system has a higher lower-size limit for effective separation, and the mineral particle size generally needs to remain above 10 mm. The Geldart A medium is more favorable for fine-particle separation; even for particles smaller than 3 mm, the model still predicts stable separation. In addition, the smaller bubbles in the Geldart A bed reduce density fluctuations, allowing the bed to maintain a stable separation density even at a bed height of 70 cm.
Figure 1.
Force of spherical simulated feed particles in the air dense-medium fluidized bed.
Figure 2.
Theoretical separation density of separation particles in fluidized beds using Geldart A and Geldart B dense media.
3. Experimental Study on Force Measurement of Spherical Simulated Feed Particles
The experiments were conducted in a cylindrical acrylic fluidized bed with an inner diameter of 15.2 cm and a total height of 92 cm. Air passed successively through a surge tank, a flow meter, a plenum, and a uniformly porous sintered distributor with a nominal pore size of 10 μm. Eight pressure taps were installed uniformly along the wall; the lowest tap was 5 cm above the distributor and the vertical spacing between adjacent taps was 10 cm.
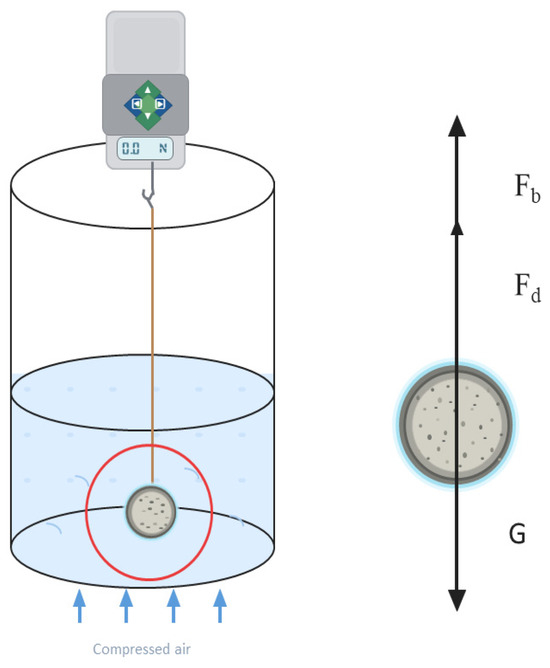
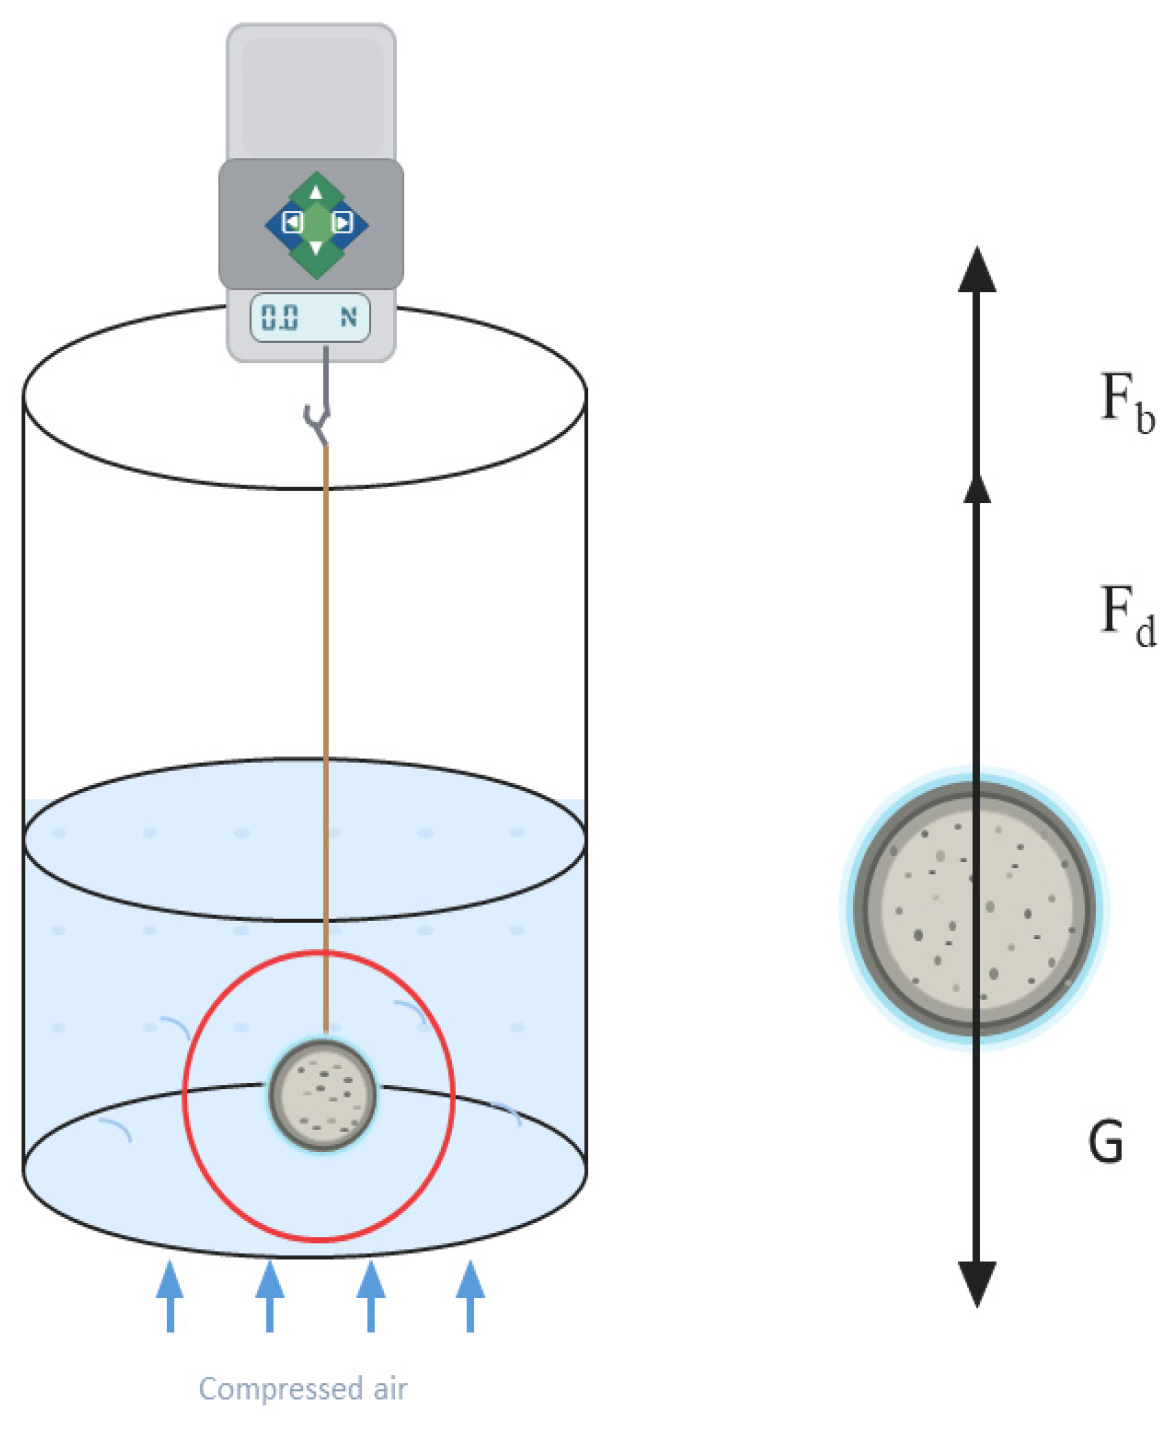
The force acting on spherical simulated feed particles directly determines their motion in the gas–solid fluidized bed. Because the measured bed density does not always equal the actual separation density, a force-measurement experiment was designed to clarify this relationship. A table-tennis ball with a diameter of 40 mm was used as the spherical simulated feed particle, and iron powder was added to adjust its density to 4 g/cm3, which was much higher than the overall bed density. This design reduced the influence of bubble-induced floating and made the measured force more reliable. During the experiment, the spherical simulated feed particle was connected by a thin string to an SF-3 digital push–pull dynamometer with a range of 0–2.94 N and a stated accuracy of ±0.5%, and it was suspended vertically at different heights in the bed. After the gas velocity and the display had stabilized, the resultant-force reading was read and photographed; no continuous electronic data-acquisition rate was used. The measured force and the particle force balance were then used to calculate separation density, as shown in Figure 3.
Figure 3.
Schematic diagram of force measurement of spherical simulated feed particles in the fluidized bed. (The gray spheres are the feed mineral particles, and the surrounding region represents the dense-medium fluidized bed environment).
According to the force balance of the spherical simulated feed particle in the fluidized bed, the resultant force can be expressed as:
where Fadd is the measured resultant force acting on the spherical simulated feed particle.
The separation density of the spherical simulated feed particle can then be calculated as:
Previous density-distribution and stability tests showed that, when the operating gas-velocity difference ΔU was 0.18–0.78 cm/s, the bed-density fluctuation was small and the separation environment was relatively stable [9]. Based on this range, the force measurements were carried out at ΔU = 0.18–0.78 cm/s and bed positions of H = 30–70 cm. Each force value was obtained by repeated readings and averaging; the data are summarized in Table 1.
Table 1.
Summary of resultant force of spherical simulated feed particles in the fluidized bed.
Using the measured resultant force and Equation (24), the separation density of the spherical simulated feed particle was calculated under different operating conditions, as shown in Figure 4. When the gas velocity was 0.55–0.78 cm/s, the separation density remained relatively stable at about 2.0–2.1 g/cm3, which was close to the measured bed density. This suggests that, once the dense medium is fully expanded and bubble disturbance is limited, the bed density can be used as a reasonable estimate of the actual separation density. At lower gas velocities, however, the calculated separation density increased and reached nearly 2.4 g/cm3. In this case, the dense medium was not fully expanded, the local bed density was higher, and the spherical simulated feed particle experienced greater resistance. Overall, the force-measurement results show that a Geldart A dense-medium bed can maintain a stable separation density of 2.0–2.1 g/cm3 under suitable expansion conditions, even when the bed height is relatively large. This result is useful for the scale-up of gas–solid fluidized bed separators.
Figure 4.
Theoretical separation density of spherical simulated feed particles in the fluidized bed based on force measurement.
4. Experimental Study on Spherical Simulated Feed Particle Separation
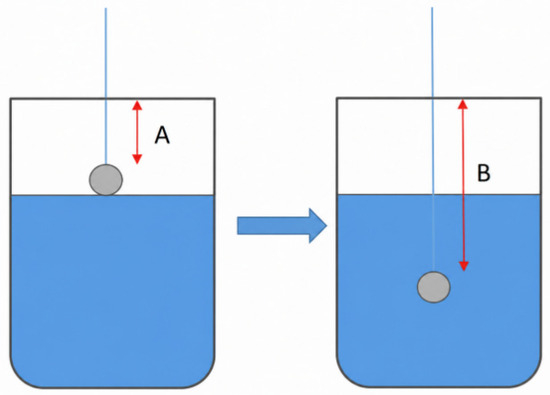
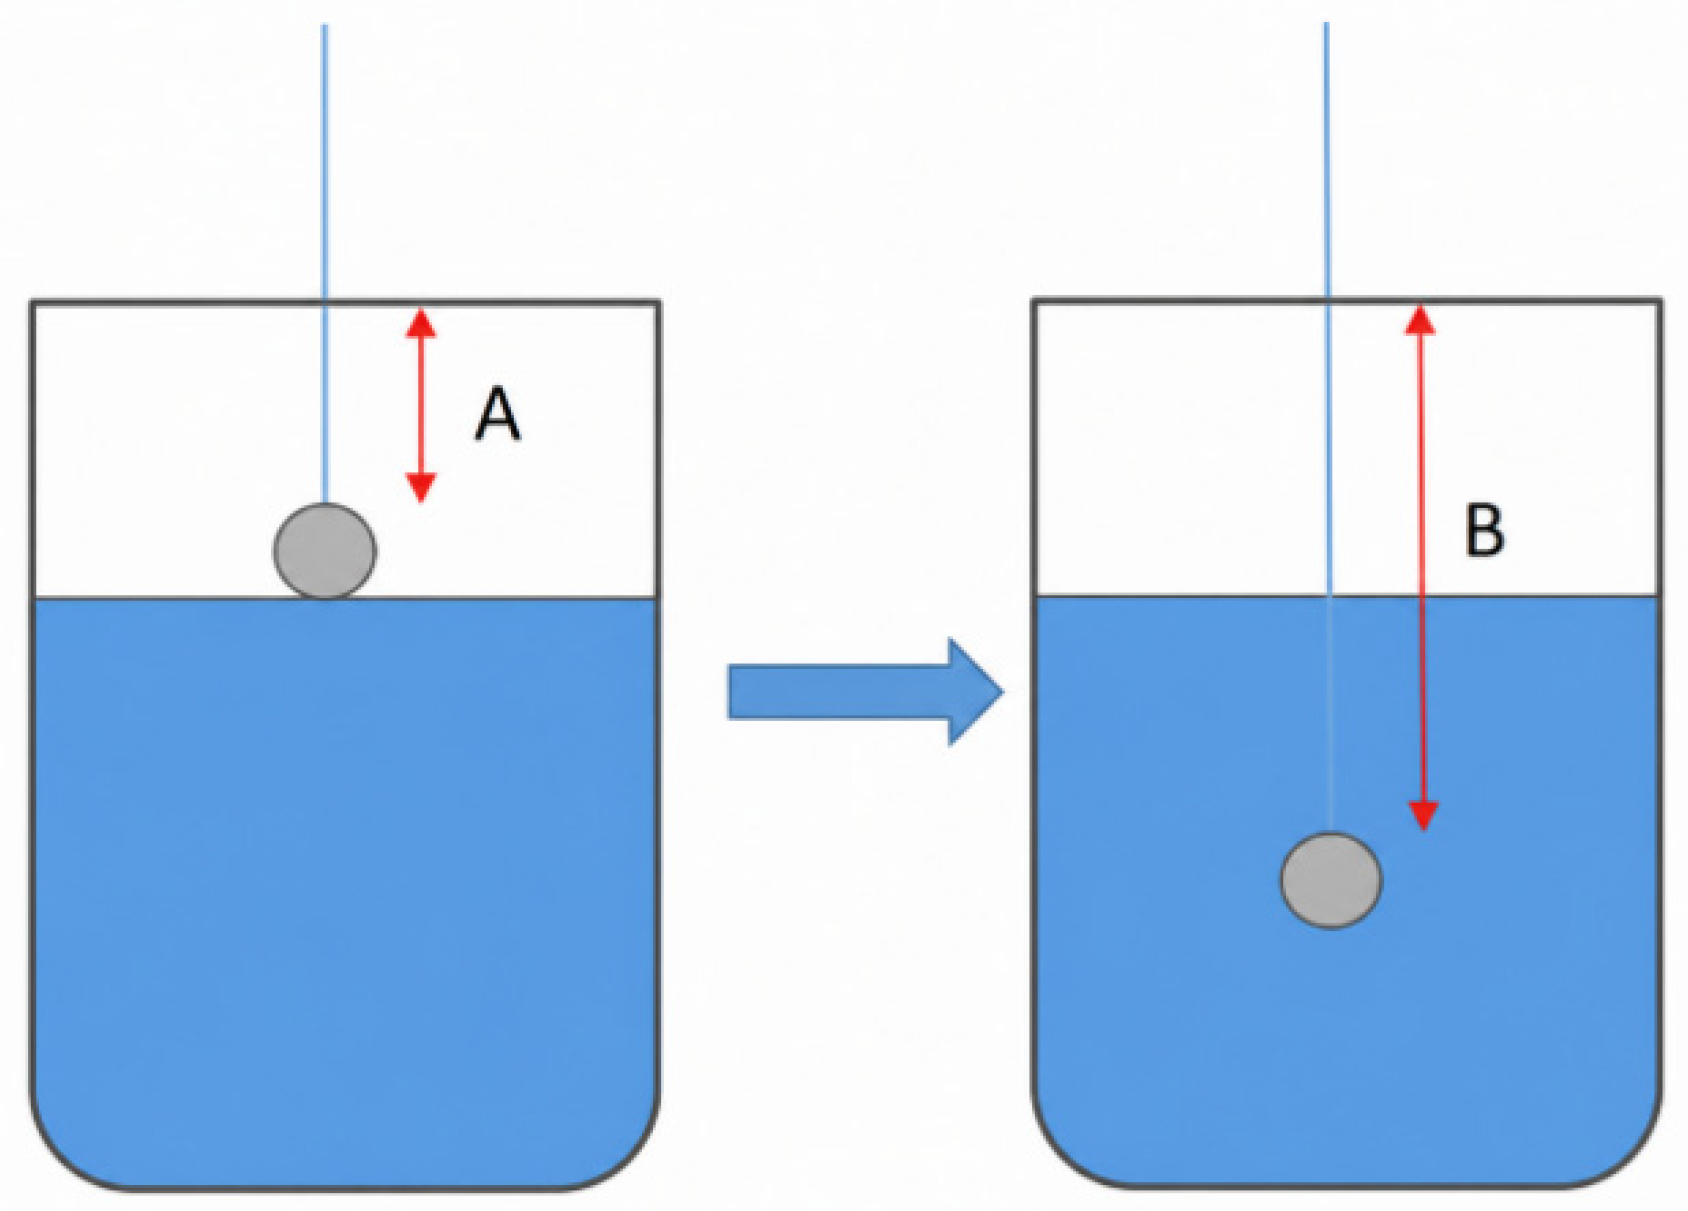
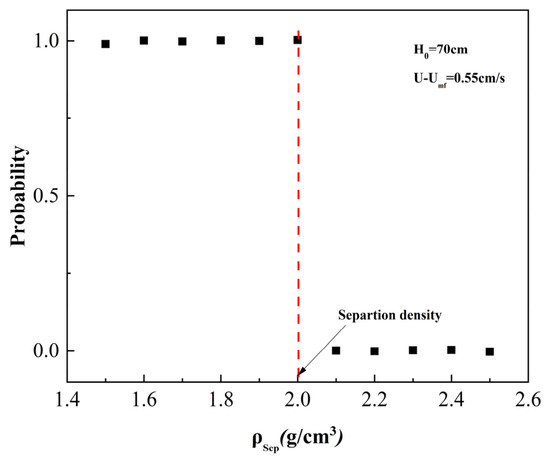
For the separation experiments, table-tennis balls with a diameter of 40 mm were filled with sand and iron powder to prepare spherical simulated feed particles with densities of 1.3–3.0 g/cm3. The earlier bed-density measurements showed that the main bed-density range was 2.0–2.1 g/cm3. Therefore, the bed height and gas velocity were adjusted to obtain a stable fluidized state before each test. Spherical simulated feed particles with densities from 1.5 to 2.5 g/cm3 were fed from the bed surface in sequence, and each separation test lasted 2 min. Every condition was repeated five times. A thin string was attached to one end of each spherical simulated feed particle so that its initial and final positions could be recorded. The settling distance was then used to judge whether the particle had settled. If the settling distance exceeded the bed midpoint, the particle was recorded as fully settled; if it floated at the surface or remained in the upper layer, it was recorded as not settled. The separation density was determined from these observations, as shown in Figure 5.
Figure 5.
Schematic diagram for measuring spherical simulated feed particle movement distance in the fluidized bed. (The gray spheres are the feed mineral particles, and the surrounding region represents the dense-medium fluidized bed environment). A: height from bed surface before separation; B: height from bed surface after separation.
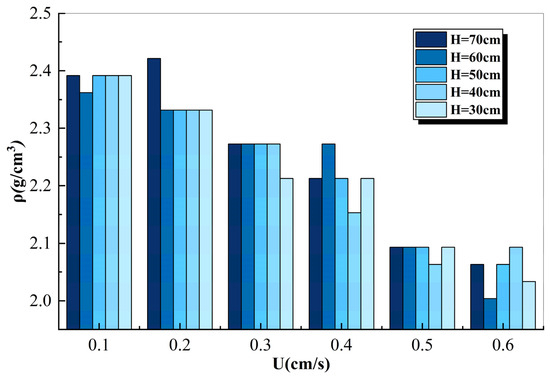
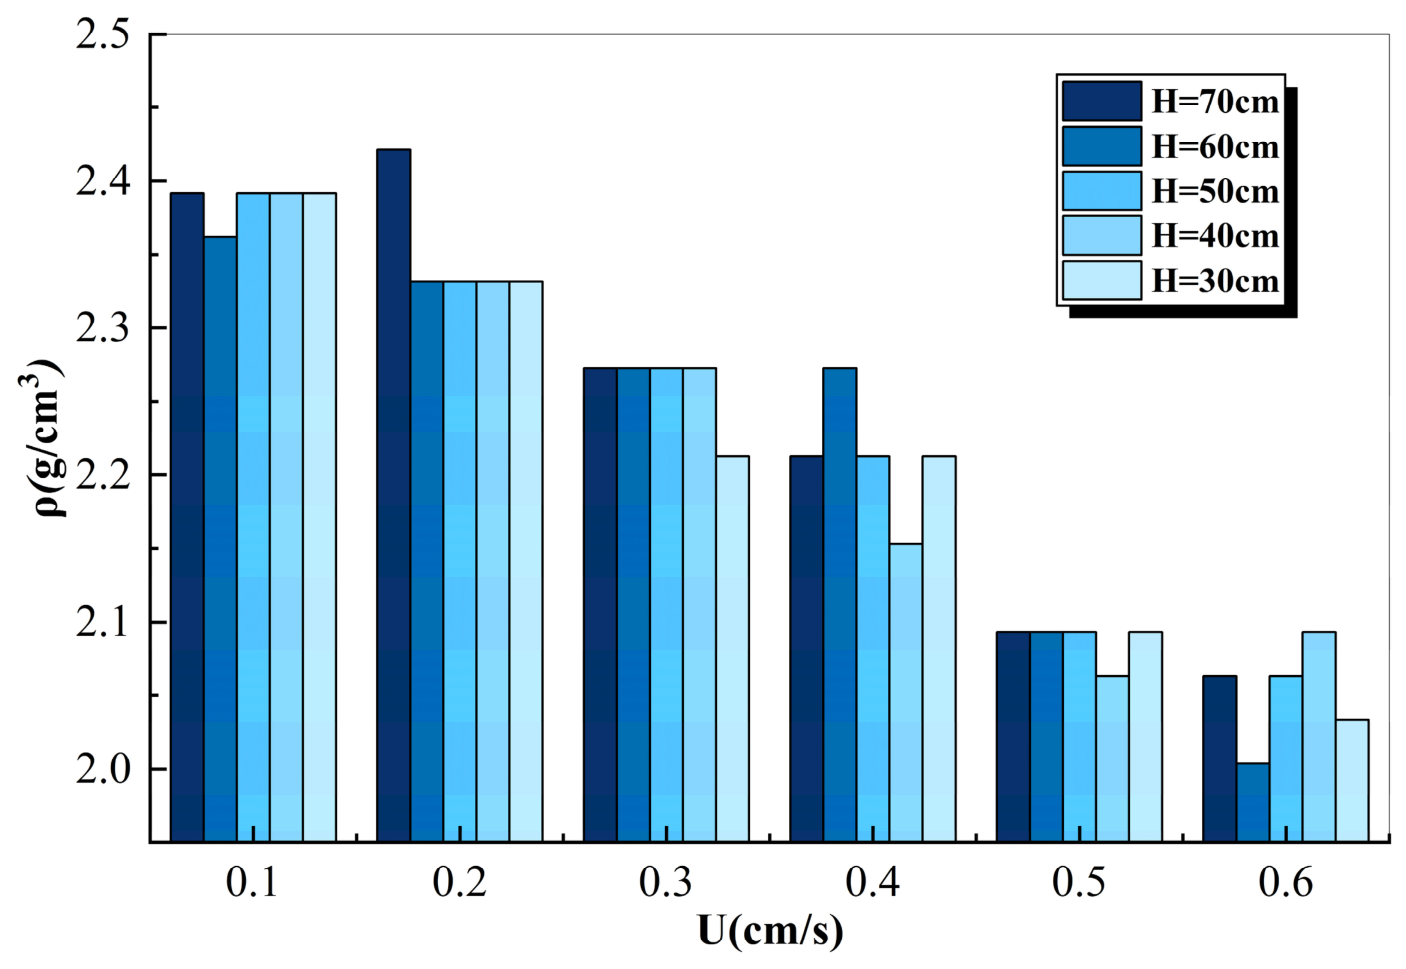
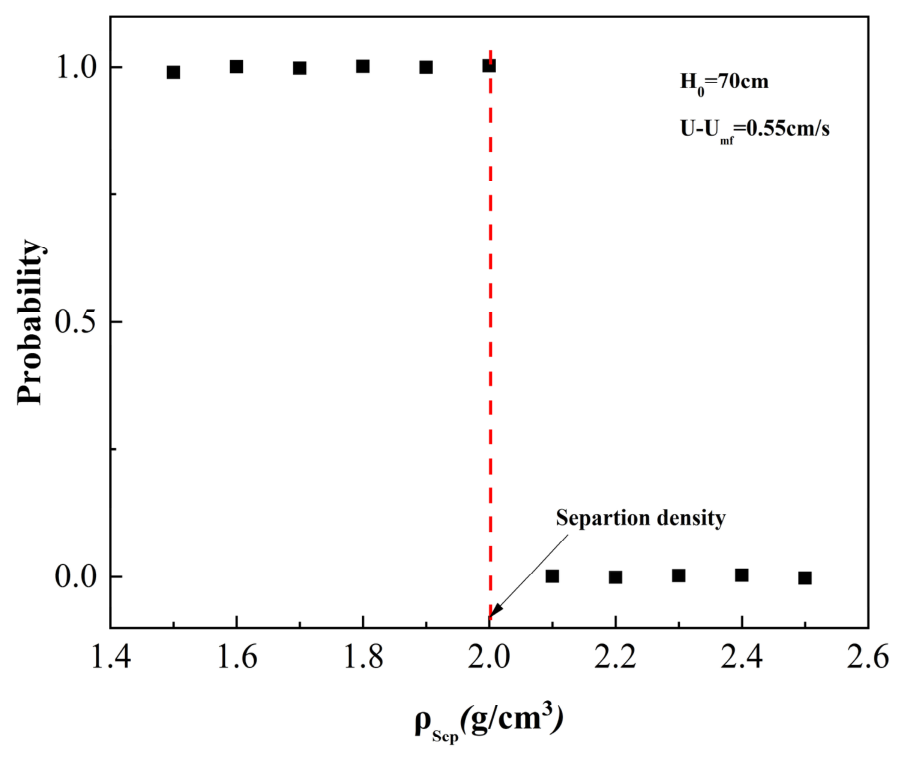
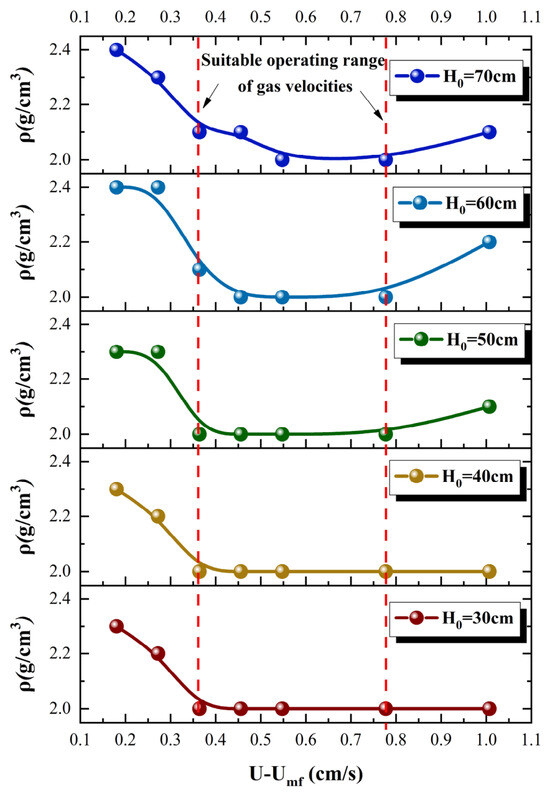
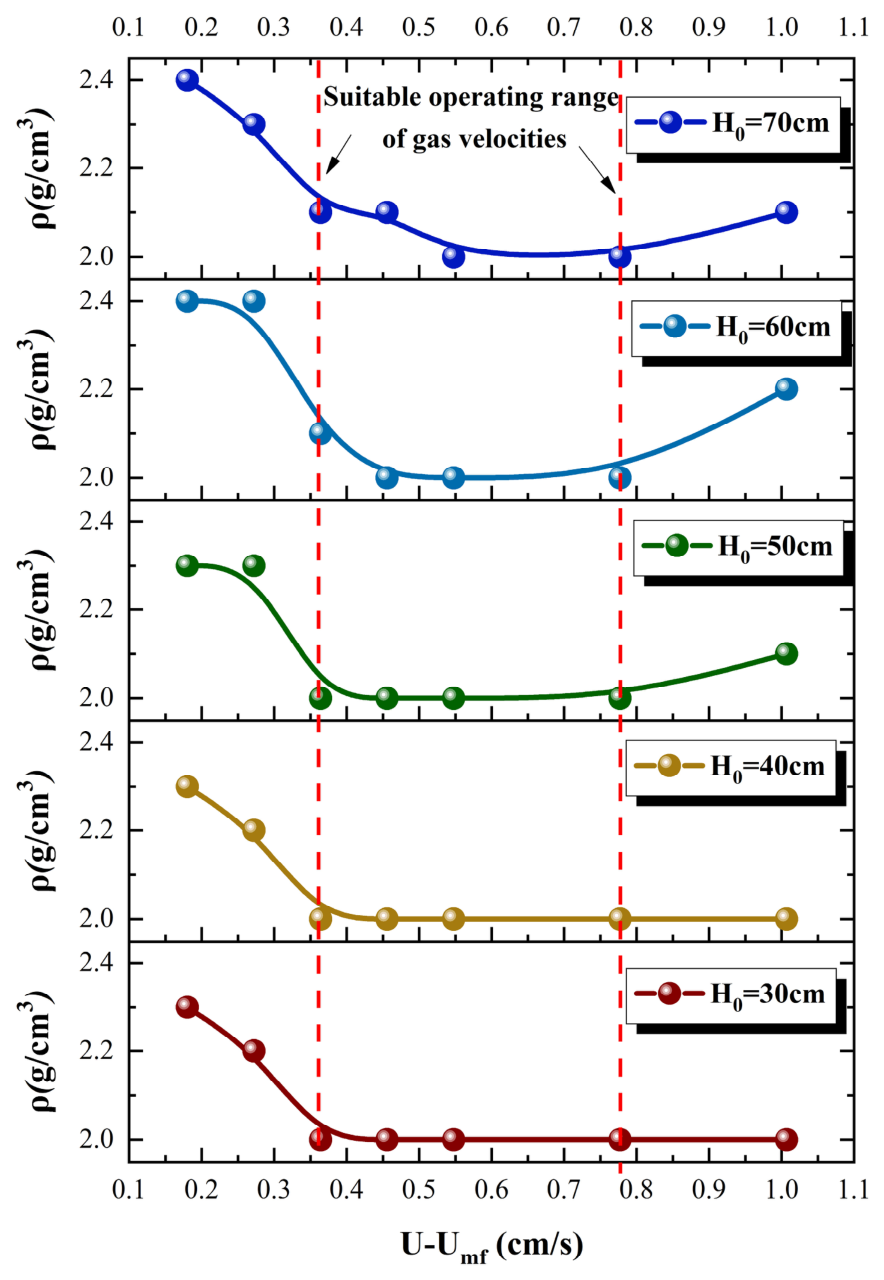
In each test, the highest density of a spherical simulated feed particle that did not fully settle was taken as the separation density under that condition. As shown in Figure 6, the effect of operating gas velocity was first examined over ΔU = 0.18–1.01 cm/s. As the gas velocity increased, the separation density first decreased and then rose slightly. At ΔU = 0.18 cm/s, the separation density was generally higher than 2.3 g/cm3. This occurred because the bed was not fully expanded at low gas velocity; the bed activity was weak, the bed density was higher, and the resistance acting on the spherical simulated feed particle increased. As shown in Figure 7, when ΔU was 0.36–0.78 cm/s, the separation density stayed mainly within 2.0–2.1 g/cm3. In this range, the dense phase expanded more fully, the bed was more active, and the density distribution was favorable for stable separation. When the gas velocity was further increased to ΔU = 1.01 cm/s, especially at H0 > 0.60 m, the separation density began to rise again. A likely reason is that the bubble fraction increased, causing part of the gas in the dense phase to enter the bubbles and reducing the effective expansion of the dense phase. Dense-medium particles carried upward by the bubble wakes may also have added resistance to the spherical simulated feed particles. For practical operation, the gas-velocity difference should therefore be kept at 0.36 cm/s < ΔU < 0.78 cm/s to maintain sufficient dense-phase expansion and stable separation.
Figure 6.
Schematic diagram for determining the separation density of spherical simulated feed particles. (The black squares represent the states of particles of different density fractions, either suspended in the bed or settled at the bottom).
Figure 7.
Effect of gas velocity on separation density.
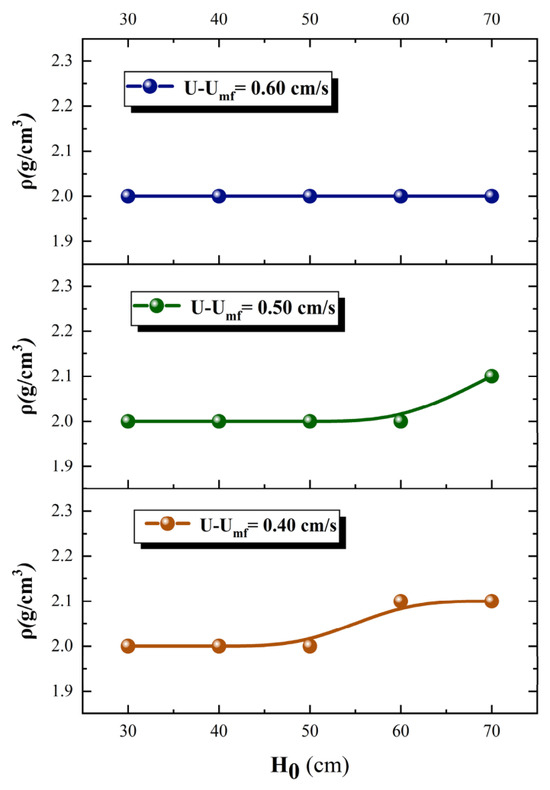
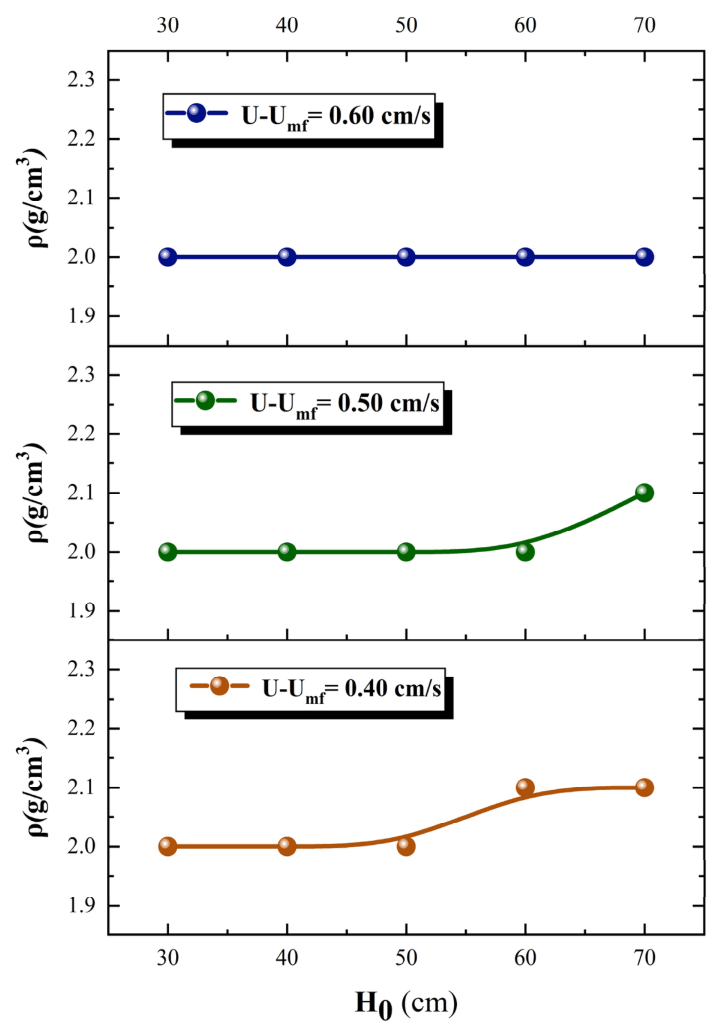
The effect of initial bed height was studied at ΔU = 0.46–0.78 cm/s, where the bed was already sufficiently expanded. The results in Figure 8 show that bed height had only a limited influence on separation density in the Geldart A dense-medium fluidized bed. The stable separation density remained mainly in the range of 2.0–2.1 g/cm3. This is because the expansion behavior of Geldart A particles is not strongly affected by the static bed height once full fluidization is reached [11]. Bubble size and motion remained relatively stable, and the overall bed density changed only slightly with bed height. This feature is favorable for increasing bed height and improving the processing capacity of gas–solid fluidized bed separators.
Figure 8.
Effect of bed height on separation density.
5. Error Analysis of Separation Density Correlation
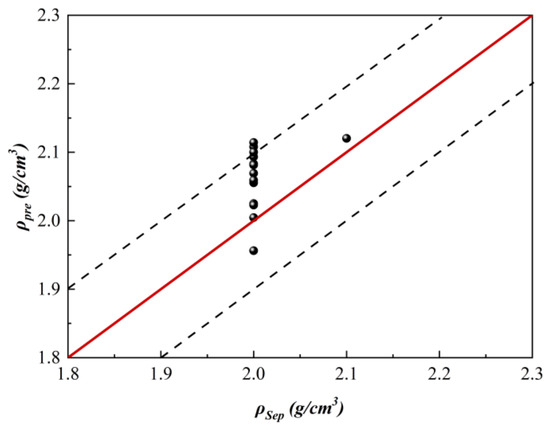
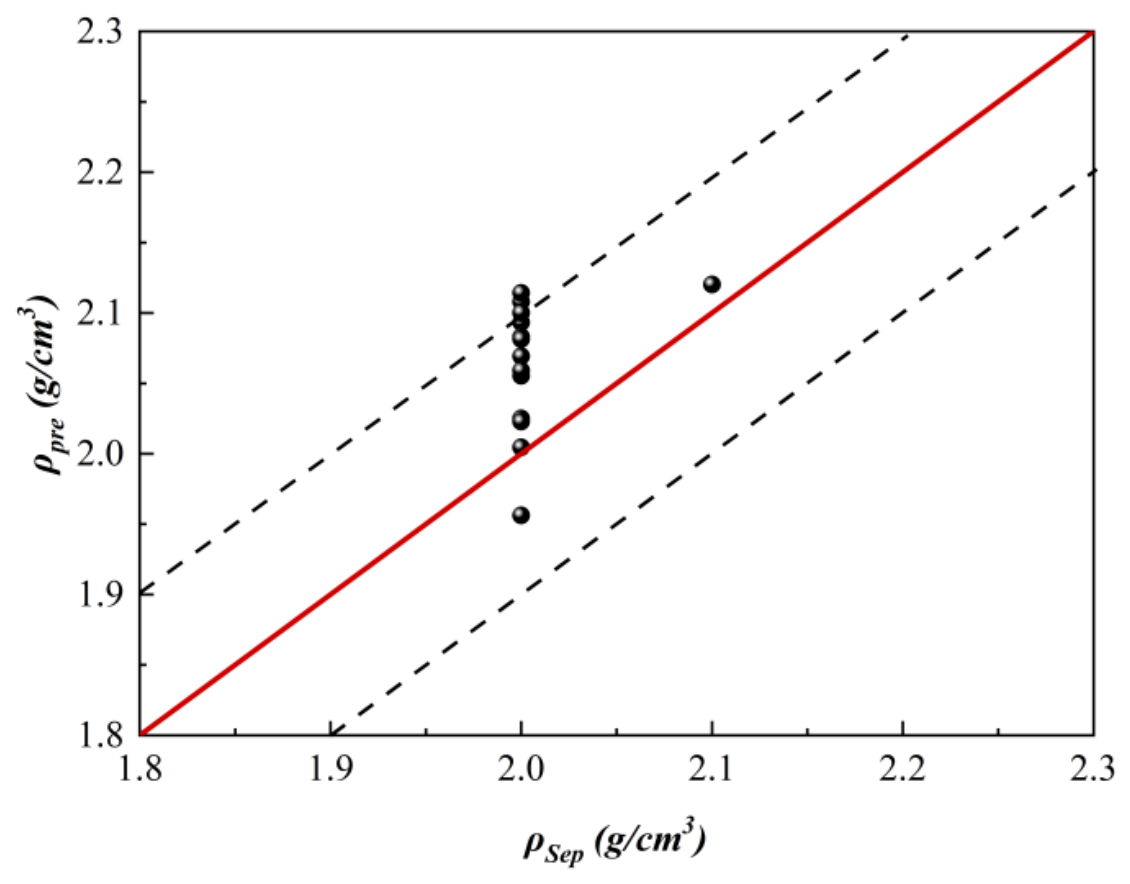
To evaluate the prediction model, the measured separation density was compared with the predicted density under ΔU = 0.46–0.78 cm/s and initial bed heights of 30–70 cm, as shown in Figure 9. Based on the paired measured and predicted values, the mean absolute error (MAE) was 0.0656 g/cm3 and the mean bias error (MBE) was 0.0594 g/m3. The positive MBE and the predominance of points above the 1:1 line indicate that the model slightly overestimates the separation density. This bias may arise from the model assumptions of spherical particles and a relatively uniform bed, together with the neglect of local voidage fluctuations, bubble-induced disturbances, intermittent particle–particle or particle–wall contact, and force-measurement uncertainty. Nevertheless, the prediction error remained within an acceptable range under the tested operating conditions.
Figure 9.
Comparison of measured separation density (horizontal axis) and predicted separation density (vertical axis). (Red line indicate is predicted density, black balls is separation density, and black dotted lines is error intervals.)
6. Conclusions
This study examined the separation density of a Geldart A dense-medium gas–solid fluidized bed. A theoretical model was established from the force balance of spherical separation particles, and the predicted separation behavior was compared with that of a Geldart B dense-medium system. Force measurements with spherical simulated feed particles were used to calculate separation density under different operating conditions, and separation tests were then conducted to verify the model. The results show that, within a suitable gas-velocity range, the Geldart A dense-medium bed can maintain a stable separation density close to the bed density, even under high-bed conditions. The comparison between measured and predicted values gave MAE = 0.0656 g/m3 and MBE = 0.0594 g/m3, indicating a slight overprediction. These findings provide a useful basis for density control and scale-up of gas–solid fluidized bed separators using Geldart A dense media. The validation is limited to spherical simulated feed particles under the tested low-Rep operating conditions; extension to irregular feed particles, higher gas velocities, or different bed geometries requires additional experimental validation.
Author Contributions
Conceptualization, X.F. and H.D.; methodology, S.C., X.F. and H.D.; validation, S.C., C.M., J.Z., M.S., D.Y. and K.J.; formal analysis, S.C. and H.D.; investigation, S.C., C.M., J.Z., M.S., D.Y. and K.J.; resources, C.M., M.S., D.Y. and K.J.; data curation, S.C., J.Z. and H.D.; writing—original draft preparation, S.C. and H.D.; writing—review and editing, X.F. and H.D.; visualization, S.C., J.Z. and H.D.; supervision, X.F.; project administration, X.F. and H.D.; funding acquisition, X.F. All authors have read and agreed to the published version of the manuscript.
Funding
This research was funded by the Research Project Supported by Shanxi Scholarship Council of China (2024-128), the Taiyuan University of Science and Technology Scientific Research Initial Funding (20242017), the Fundamental Research Program of Shanxi Province (202403021212137), the Award Fund for Outstanding Doctors in Shanxi Province (20242092).
Data Availability Statement
Dataset available on request from the authors.
Conflicts of Interest
Authors Shuyun Chen, Jun Zhang, and Dawei Yu were employed by the company State Power Investment Corporation Inner Mongolia Energy Co., Ltd. Authors Changchun Mu, Ming Shao, and Kunkun Jiang were employed by the company Dadi Engineering Development (Group) Co., Ltd. The remaining authors declare that the research was conducted in the absence of any commercial or financial relationships that could be construed as a potential conflict of interest.
References
- Luo, Z.F.; Chen, Q.R. Dry Beneficiation Technology of Coal with an Air Dense-Medium Fluidized Bed. Int. J. Miner. Process. 2001, 63, 167–175. [Google Scholar] [CrossRef] [Scilit]
- Geldart, D. Types of Gas Fluidization. Powder Technol. 1973, 7, 285–292. [Google Scholar] [CrossRef] [Scilit]
- Mohanta, S.; Rao, C.S.; Daram, A.B.; Chakraborty, S.; Meikap, B.C. Air Dense Medium Fluidized Bed for Dry Beneficiation of Coal: Technological Challenges for Future. Part. Sci. Technol. 2013, 31, 16–27. [Google Scholar] [CrossRef] [Scilit]
- Fan, X.; Zhou, C. Estimation of Bed Expansion and Separation Density of Gas-Solid Separation Fluidized Beds Using a Micron-Sized-Particle-Dense Medium. Separations 2021, 8, 242. [Google Scholar] [CrossRef] [Scilit]
- Liu, X.; Fan, X.; Zhao, Y.; Duan, C.; Zhou, C. Particles Movement Behavior and Apparent Density in Gas-Solid Fluidized Bed as Determined by an Electronic Dynamometer and Electrical Capacitance Tomography. Chem. Eng. J. 2022, 429, 132463. [Google Scholar] [CrossRef] [Scilit]
- Grace, J.R. Contacting Modes and Behaviour Classification of Gas-Solid and Other Two-Phase Suspensions. Can. J. Chem. Eng. 1986, 64, 353–363. [Google Scholar] [CrossRef] [Scilit]
- Richardson, J.F.; Zaki, W.N. Sedimentation and Fluidisation: Part I. Chem. Eng. Res. Des. 1997, 75, S82–S100. [Google Scholar] [CrossRef] [Scilit]
- Abrahamsen, A.R.; Geldart, D. Behaviour of Gas-Fluidized Beds of Fine Powders Part I. Homogeneous Expansion. Powder Technol. 1980, 26, 35–46. [Google Scholar] [CrossRef] [Scilit]
- Di Felice, R. The Voidage Function for Fluid-Particle Interaction Systems. Int. J. Multiph. Flow 1994, 20, 153–159. [Google Scholar] [CrossRef] [Scilit]
- Beetstra, R.; van der Hoef, M.A.; Kuipers, J.A.M. Drag Force of Intermediate Reynolds Number Flow Past Mono- and Bidisperse Arrays of Spheres. AIChE J. 2007, 53, 489–501. [Google Scholar] [CrossRef] [Scilit]
- Schiller, L.; Naumann, A. Über die grundlegenden Berechnungen bei der Schwerkraftaufbereitung. Z. Ver. Dtsch. Ing. 1933, 77, 318–320. [Google Scholar]
- Fu, Z.; Zhu, J.; Barghi, S.; Zhao, Y.; Luo, Z.; Duan, C. Dry Coal Beneficiation by the Semi-Industrial Air Dense Medium Fluidized Bed with Binary Mixtures of Magnetite and Fine Coal Particles. Fuel 2019, 243, 509–518. [Google Scholar] [CrossRef] [Scilit]

Disclaimer/Publisher’s Note: The statements, opinions and data contained in all publications are solely those of the individual author(s) and contributor(s) and not of MDPI and/or the editor(s). MDPI and/or the editor(s) disclaim responsibility for any injury to people or property resulting from any ideas, methods, instructions or products referred to in the content. |
© 2026 by the authors. Licensee MDPI, Basel, Switzerland. This article is an open access article distributed under the terms and conditions of the Creative Commons Attribution (CC BY) license.