Abstract
Metanephrine (MN) and normetanephrine (NMN) are critical biomarkers for neuroendocrine tumors (pheochromocytoma and paraganglioma). Following our previous development of a molecularly imprinted solid-phase extraction (MISPE) sorbent for urine analysis, this study evaluated MISPE coupled with HILIC-MS/MS for determining metanephrines in human plasma. Unlike conventional phases, the novel polymer selectively binds analytes as in situ-generated anions via quaternary alkylammonium groups in hydroxide form, ensuring accurate extraction from just 25 µL of plasma. Validated per U.S. FDA guidelines, the assay showed good intra- and interday precision (CV < 10.8%), accuracy (bias < −10.6%) and excellent linearity (R2 > 0.99) across pathological ranges (184.3–877.8 ng/L for MN; 174.8–923.0 ng/L for NMN), with low relative standard errors (<6.9%). Excellent selectivity was demonstrated in the presence of structurally close analogs (catecholamines, DOPA and its derivatives). Compared with commercial WCX, the sorbent yielded cleaner extracts, significantly reducing the phospholipid interference. Although lower limits of quantification (92.2 ng/L MN; 87.4 ng/L NMN) slightly exceeded healthy upper thresholds, the method has potential for use in specific clinical scenarios with pronounced biomarker elevations: diagnosis of pheochromocytoma/paraganglioma, monitoring post-treatment metanephrine decline, and tracking tumor-induced hypertensive crises in emergencies. This accessible protocol forms a solid foundation for advanced diagnostics.
1. Introduction
Phenylalanine and tyrosine are amino acids that are transformed by the adrenal medulla [1] into a group of organic bases collectively known as catecholamines (CAs), notably epinephrine (E), norepinephrine (NE), and dopamine (DA). These compounds are neurotransmitters [2] with important hormonal functions that regulate blood pressure, heart rate and blood glucose levels [3]. CAs are enzymatically metabolized [4] into several products: metanephrine (MN), normetanephrine (NMN), 3-methoxytyramine (3-MT), homovanillic acid (HVA), vanillylmandelic acid (VMA), etc. Abnormal levels of both CAs and their metabolites are known biomarkers for health issues such as depression, Alzheimer’s disease, Parkinson’s disease [5] and several neuroendocrine tumors (pheochromocytoma, paraganglioma, neuroblastoma) [6]. Therefore, determination of catecholamines and their metabolites is clinically important for the early detection of these ailments. Among catecholamine metabolites, metanephrine and normetanephrine (O-methylated derivatives of epinephrine and norepinephrine, respectively) are of particular interest, as determination of metanephrines (Ms) in plasma is considered to be the most sensitive and specific test (>98%) [7] for diagnosing the aforementioned neuroendocrine tumors compared with urinary or plasma CAs.
High-performance liquid chromatography coupled with tandem mass spectrometry (HPLC-MS/MS) is a widely used method for plasma and urine analysis [8]. But despite its advantages, determination of metanephrines in plasma remains difficult due to low analyte concentrations (ng/L) and insufficient selectivity of established sample treatment methods like solid-phase extraction (SPE) [9]. These issues become compounded if the patient is taking medication that possesses structural similarity and similar MRM transitions to Ms, which can lead to overestimation and false positives [10]. To solve this problem, molecularly imprinted polymers (MIPs) gained considerable attention in recent years. Unlike non-selective stationary phases (C18, weak-cation exchange, hydrophilic-lipophilic balance, etc.) that are based on non-specific retention mechanisms, MIPs contain selective cavities, whose size and spatial orientation of functional groups are compatible only with target molecules [11]. Combining the principles of SPE and MIP yields molecularly imprinted solid-phase extraction (MISPE), which is capable of highly selective analyte separation from interfering compounds even in complex matrices like urine or plasma.
In our previous work, we demonstrated an MIP sorbent capable of simultaneous separation of CAs, Ms and acidic catecholamine metabolites (CAMs, namely, homovanillic acid and vanillylmandelic acid) from plasma samples [12]. Despite promising results, the sorbent could only be used in dispersive SPE mode due to the small particle size and insufficient solvent flow for cartridge SPE, which lowered the sample throughput. In addition, MIP’s capacity toward Ms was smaller than that of CAs and CAMs. Finally, this proof-of-concept method was not validated for clinically relevant concentrations. More recently, we showed a novel MIP synthesis approach for simultaneous selective separation of CAs, Ms and CAMs, which solved all the aforementioned issues of the previous MIP and lead to the development and validation of a new MISPE–HPLC-MS/MS method for determination of the analytes in urine [13]. With this strategy, positively charged analytes are deprotonated and re-charged to anionic forms in situ through interaction with the sorbent’s anion exchange groups (quaternary alkylammonium groups in OH− form). This mechanism enables a completely different adsorption selectivity, leading to superior performance in terms of sensitivity for polar CAs (which elute early) in reversed-phase HPLC/MS compared with established SPE methods such as weak cation exchange (WCX) and hydrophilic–lipophilic balance (HLB).
Due to much lower endogenous levels of Ms in plasma (ng/L) compared with urine (µg/L) and higher matrix complexity, the aim of this study was to widen the scope of the novel MIP and adapt the previously developed MISPE–HPLC-MS/MS protocol for reliable determination of Ms in low-volume plasma samples (25 µL). The method was validated using certified matrix-matched calibrators and controls widely used in clinical practice for in vitro tests to diagnose neuroendocrine tumors. The performance of this method was also compared with a published procedure that utilized WCX SPE purification before analysis.
2. Materials and Methods
2.1. Materials
Ammonium formate (99%, HPLC grade), acetic acid (49–51% solution, v/v in water, HPLC grade), analytical standards of DL-metanephrine HCl (MN), DL-normetanephrine HCl (NMN), d3-metanephrine HCl (d3-MN) (100 µg/mL free base in methanol), d3-normetanephrine HCl (d3-NMN) (100 µg/mL free base in methanol) and ammonium bicarbonate were obtained from Sigma-Aldrich (St. Louis, MO, USA). Ammonium acetate (LC-MS grade) was purchased from Merck (Darmstadt, Germany). Acetonitrile (ACN) (LC-MS grade) and methanol (MeOH) (LC-MS grade) were supplied from Honeywell (Charlotte, NC, USA). Formic acid (LC-MS grade) was obtained from VWR Chemicals/Avantor (Radnor, PA, USA). Deionized water (Grade 1, <0.05 µS/cm) was prepared using the Adrona B30 (Adrona SIA, Riga, Latvia) purification system. Lyophilized plasma calibration standards (LOT 007) and quality controls (QC1-3) (LOT 009) from the CE-IVD kit “Catecholamines and metanephrines free in plasma by LC/MS” (Code LC97010) were obtained from Eureka Lab Division (Chiaravalle, Italy). Calibrators and QCs were reconstituted in D.I. water according to the manufacturer’s instructions, aliquoted into 100 µL portions and stored in brown glass vials at −20 °C. Deuterated analyte analogs (d3-MN and d3-NMN) were used as internal standards for MN and NMN, respectively. An internal standard (IS) working solution was prepared by combining d3-MN and d3-NMN factory solution aliquots and diluting each compound to 50 nM in D.I. water.
2.2. Synthesis of the MIP
The MIP sorbent was synthesized under precipitation polymerization conditions using N,N-methylenebisacrylamide (cross-linker) in the presence of two salts made from (4-vinylbenzyl) trimethylammonium cation (VBTMA) combined with either homovanillic alcohol anion or homoveratric acid anion, acting as functional monomers/templates. Sorbent synthesis and characterization are described in our previous study [13]. The brief synthesis procedure can be found in the Supplementary Materials. In total, four independent batches of the MIP material were used in this study.
2.3. Optimization of MISPE Procedure
To adopt the MISPE procedure for plasma, different solvents and mixtures were evaluated in the loading and washing steps of the MISPE. Screening experiments were conducted using the Level 5 calibration standard for pathological M concentrations (877.8 ng/L MN and 923.0 ng/L NMN) and Level 0 (blank) calibration standard spiked to reach Level 5 concentration after MISPE. Relative recovery values (n = 1) used for evaluation were obtained according to Equation (1):
where Sblank,post-spiked is the analyte response in post-extraction spiked Level 0 sample, SIS,blank denotes the internal standard (IS) response in post-extraction spiked Level 0 plasma sample, and SCal and SIS,Cal are the analyte and IS responses in the Level 5 plasma calibrator after MISPE. The optimized procedure was repeated on three separate days using different batches of the MIP to ensure reproducibility.
2.4. Optimized Sample Preparation Procedure
Empty plastic SPE cartridges (3 mL) with polyethylene frits were loaded with 60 mg of MIP (converted to OH− form) using wet packing under mild vacuum in an SPE manifold. The cartridge was conditioned with 1 mL of methanol. A plasma sample (25 µL) with 1 µL of IS working solution was treated using 100 µL of ice-cold methanol to precipitate proteins, vortexed for 1 min and then centrifuged at 14,000× g for 10 min to separate the supernatant. A methanol/water (95:5, v/v) mixture (400 µL) was added to the supernatant. Then, 500 µL of this sample solution was applied to the MISPE cartridge. The sample was passed slowly through the sorbent, then 1 mL of 15 mM ammonium bicarbonate in methanol/water (75:25, v/v) was added to wash the impurities away. The analytes were eluted using 2 portions of 250 µL of 25 mM ammonium formate in methanol with 2% formic acid (v/v). The eluate was collected, evaporated with a nitrogen blower at 40 °C and reconstituted with 50 µL of 0.1% formic acid (v/v) in acetonitrile/water (95:5, v/v). Reconstituted eluate (5 µL) was injected into an HPLC column for analysis.
2.5. Instrumentation and Analytical Procedure
Agilent 1290 Infinity II system (Agilent Technologies, Inc., Santa Clara, CA, USA) was used, which consisted of a G7104A flexible quaternary pump, G7167B multisampler, G7116B multicolumn thermostat combined with Agilent 6470 triple quadrupole mass spectrometer equipped with AJS electrospray ionization (ESI) source and built-in 6-port/2 position valve. Agilent MassHunter software (version B.09.00) was used for data acquisition and processing. A Waters (Millford, MA, USA) Acquity BEH Amide column (2.1 mm × 100 mm, 1.7 µm) was used for separation at 35 °C. Mobile phase A consisted of 100 mM ammonium acetate in acetonitrile/water (5:95, v/v), while mobile phase B was acetonitrile/water mixture 95:5 (v/v). Both phases contained 0.1% acetic acid (v/v) as an additive. Time segments at 0–1.2 min and 1.9–7 min were diverted to waste. The gradient elution program is shown in Table 1.

Table 1.
Gradient elution program.
The chromatograms were recorded in positive ESI, which was optimized using Agilent MassHunter Source Optimizer software (version B.09.00). The following source settings were used: 300 °C gas temperature, 9 L/min gas flow rate, 40 psi nebulizer pressure, 350 °C sheath gas temperature, 8 L/min sheath gas flow rate, and 2500 V ESI capillary voltage. Multiple reaction monitoring (MRM) transitions were optimized using Agilent MassHunter Optimizer software (version B.09.00). The cell acceleration voltage (CAV) and dwell time were 5 V and 25 ms, respectively. Table 2 lists the MRM settings used for MN/d3-MN and NMN/d3-NMN.
Table 2.
Multiple reaction monitoring (MRM) acquisition settings used for metanephrine, normetanephrine and their deuterated internal standards.
2.6. Method Validation
The method’s repeatability, intermediate precision, accuracy, calibration range, sensitivity (LOD, LLOQ), carry-over and selectivity were validated according to U.S. FDA guidelines [14]. Matrix-matched plasma calibration standards at 6 levels (including Level 0 as blank) and quality controls at Levels 1–3 (low, middle, high) from Eureka Lab Division were used for the validation.
2.6.1. Repeatability
Five replicates at each QC level were processed and analyzed in one run. The coefficient of variation (CV, %) was calculated. Acceptable CV values for each QC sample should be within 15%.
2.6.2. Intermediate Precision and Accuracy
Two replicates at each QC level were processed and analyzed on five separate days during the validation period (one month), with 10 measurements total for each QC level. To assess the intermediate precision, CV values were calculated. The accuracy was represented by bias (%) values expressed as the relative difference between calculated concentrations at each QC level and nominal values provided by Eureka. Acceptable CV values for each QC sample should be <15%. The bias should be within ±15% of the manufacturer-specified concentration for each QC level.
2.6.3. Calibration Range and Sensitivity
Five independent calibration curves, each consisting of five non-zero calibrator concentrations (Level 1–5), were analyzed across five separate analytical runs over a one-month validation period. The selected calibration range encompassed pathological levels. Calibration data were fitted using a weighted linear regression model with 1/x weighting factor. Regression analysis was performed to determine the model equation, coefficient of determination (R2), and relative standard error of regression (RSE, %). Individual calibration curves were accepted if R2 value was >0.99 and back-calculated concentrations were within ±15% of manufacturer’s specified values for all standards. Sensitivity was assessed using sequential dilution of the Level 1 calibrator until each analyte reached a signal-to-noise (S/N) ratio of ≥3 for LOD and ≥5 for LLOQ. To achieve the criteria for LOD and LLOQ, 3.5× and 2× dilution of the Level 1 calibrator was required, respectively. Sufficiently diluted LOD and LLOQ samples were analyzed in five replicates during the validation period of one month.
2.6.4. Selectivity and Carry-Over
Selectivity was assessed by analyzing blank plasma matrix samples (Level 0 calibration standard) in three replicates on five different days during the validation period of one month. Potential interference from common endogenous compounds (catecholamines and their metabolites) was evaluated by analyzing blank plasma extracts that were spiked post-extraction with a mixture of E, NE, DA, L-DOPA, methyldopa, and 3-OMD at high concentrations of 5.1, 3.7, 30.6, 200, 210, and 210 µg/L, respectively. To meet the selectivity requirements, the interferent response should be less than 20% of the LLOQ peak area for MN and NMN and less than 5% for the internal standard (IS). Peaks of interferents should not appear at analyte retention times. Carry-over was evaluated by injecting a processed blank plasma matrix sample (Level 0) immediately after the highest calibrator (Level 5, containing 877.8 ng/L MN and 923.0 ng/L NMN). Carry-over is not present if the analyte response in the blank sample is less than 20% of LLOQ analyte response and less than 5% of the IS response in the calibration standards.
2.7. Method Comparison
Three replicates (n = 3) of the Level 0 plasma calibrator (25 µL) were processed using the optimized MISPE procedure and WCX protocol (Waters Oasis WCX, 30 mg) published by Liu et al. [15]. All samples were spiked post-extraction at 877.8 ng/L MN and 923.0 ng/L NMN and then analyzed using the method described in Section 2.5. The matrix effect was calculated using Equation (2) as the signal suppression/enhancement relative to the analyte response in pure solvent:
where Sblank,post-spiked and Ssolv. are the analyte responses in the processed post-extraction spiked plasma and pure solvent, respectively. A negative ME value indicates ion suppression, while a positive value represents ion enhancement.
3. Results
3.1. Optimization of MISPE Conditions
A study of different solvent systems was conducted to find suitable candidates for MISPE loading and washing steps. The results for solvent screening are summarized in Supplementary Tables S1 and S2, respectively. The data show that deionized water and aqueous solutions of HCl or NaOH as loading media drastically decrease recoveries for both analytes. When water was partially or completely substituted for methanol in the loading solvents, higher recoveries were obtained (15.9–57.9% and 48.4–106.0% for MN and NMN, respectively). However, the presence of HCl or NaOH still decreased the sorption capacity. Therefore, the best-performing solvent system for loading was methanol/water 95:5 (v/v), yielding recoveries of 57.9% for MN and 106.0% for NMN.
Any substantial percentage of water (5–45%, v/v) in the methanol/water mixture gave unsatisfactory recoveries of both analytes during the washing step (30.2–43.6% for MN and 37–69.6% for NMN). However, when ammonium bicarbonate in different concentrations (2–50 mM) was present as a mildly basic additive, consistently higher recoveries were observed (48.1–85.5% for MN; 71.5–121.4% for NMN). Thus, the best solvent for the washing step was methanol/water (75:25, v/v) containing 15 mM NH4HCO3. To evaluate the inter-batch reproducibility and ruggedness of the optimized procedure, extraction experiments were performed on three separate days using three independently synthesized MIP batches. Under these conditions, the mean absolute recoveries (n = 3) were 71.9% (CV = 21%) for MN and 114% (CV = 6%) for NMN. Most importantly, these recovery values represent absolute extraction efficiencies without internal standard (IS) correction, as the IS was introduced post-extraction specifically to isolate the true extraction profiles from potential matrix-induced ionization effects and evaporation losses. The higher absolute variability observed for MN (CV = 21%) is primarily attributed to cumulative technical factors of multi-batch synthesis and manual column packing, including variations in slurry homogeneity and bed height. Nevertheless, this inter-batch variation is completely compensated for by the addition of the IS before extraction during validation runs. As can be seen in Section 3.2.1, the final method precision (CV) was successfully reduced to ≤15% for both analytes. Therefore, the proposed MISPE protocol is robust and fully suitable for bioanalytical applications.
3.2. Method Validation Results
3.2.1. Precision and Accuracy Results
Evaluations of the method precision and accuracy were performed using three levels of quality controls (QCs) on five separate days during a period of one month. All acceptance criteria for measured parameters were satisfied. Intra-day CVs (which represent the method’s repeatability) were 2.3–4.8% for MN and 4.0–8.6% for NMN. The inter-day CV measurements were 1.3–8.7% for MN and 6.5–10.8% for NMN. The calculated intra-day bias was in the range from −2.6 to 4.0% for MN and from −5.3 to −10.6% for NMN. Finally, the inter-day bias was in the range of −1.3 to 6.3% for MN and −1.7 to 4.1% for NMN. Detailed information is presented in Table 3.
Table 3.
Intra-day and inter-day CVs and bias obtained from MN and NMN measurements in plasma quality control samples.
3.2.2. Calibration Range and Sensitivity Results
The method’s calibration range was validated using five regression lines obtained on five separate days over a period of one month. The tested concentration ranges were 184.3–877.8 ng/L and 174.8–923.0 ng/L for MN and NMN, respectively. Calibration graphs were plotted with the response ratio of the analyte to its corresponding IS as the dependent variable (y-axis), while the calibrator analyte concentration was the independent variable (x-axis). Calibration curves for both compounds can be described using weighted (1/x) linear regression model with satisfactory R2 (>0.99), low RSE values (<6.9%) and good accuracy of back-calculated concentrations at all levels (95–111%, see Table 4).
Table 4.
Summary of MN and NMN calibration range parameters determined using matrix-matched plasma calibrators.
The method’s LODs (determined by serial dilution of the lowest calibrator to obtain S/N value of ≥3) were 52.2 ng/L for MN and 49.9 ng/L for NMN. The LLOQ values (S/N ratio of ≥5) were 92.2 ng/L for MN and 87.4 ng/L for NMN. The procedure was repeated on five different days during the validation period of one month to ensure reproducibility of the obtained values.
3.2.3. Selectivity and Carry-Over Results
The analysis of processed Level 0 calibration standard (blank) (n = 5) from Eureka Lab Division IVD calibration set showed no detectable interferences in the retention time windows of the analytes (see Figure 1), showing good selectivity of the method.
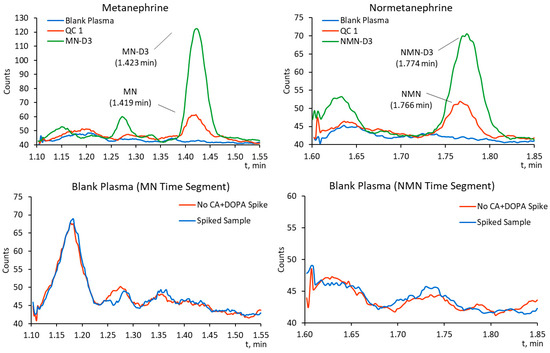
Figure 1.
MRM chromatograms of MN (m/z 180.0 → m/z 148.0) and NMN (m/z 166.0 → m/z 134.0) for processed Level 1 quality control (QC1) (top) and processed blank plasma spiked with high concentrations of CAs and DOPA analogs (bottom).
Chromatograms of processed Level 0 plasma standard (blank) analyzed right after injecting the highest-level calibration standard revealed no detectable analyte or IS response, proving the absence of carry-over.
3.3. Comparison of MISPE and Commercial WCX Performance
The MISPE method’s performance was compared with a published weak cation exchange protocol [15] by using commercially available WCX SPE cartridges (Waters Oasis WCX). Figure 2 shows MRM traces of both compounds, as well as the common phospholipid signal (monoalkyl glycerol phosphocholine derivatives) (m/z 184 → m/z 184) obtained in post-extraction spiked Level 0 plasma sample that was processed using MISPE and WCX.
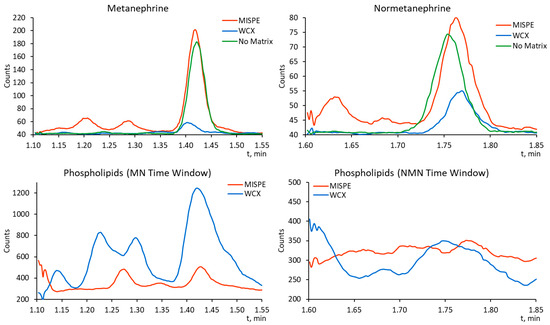
Figure 2.
MRM chromatograms of MN (m/z 180.0 → m/z 148.0) and NMN (m/z 166.0 → m/z 134.0) in post-spiked plasma samples after MISPE and WCX SPE, with standard solution as reference (top) and phospholipid (m/z 184 → m/z 184) MRM chromatograms for the same time intervals (bottom).
It is evident that both analytes have a higher response in the MISPE-processed matrix compared with the WCX-processed sample. In quantitative terms, both analytes experienced slight signal enhancement in the MISPE-processed plasma (4.1 ± 1.6% for MN and 12.1 ± 8.3%), while strong signal suppression was observed for the WCX-processed sample (−91.1 ± 6.9% for MN −53.6 ± 10.1% for NMN). Strong MN signal suppression is also made apparent by the significantly higher phospholipid signal observed in the same retention time window for the WCX-processed matrix.
4. Discussion
The MISPE sorbent was synthesized under precipitation polymerization conditions using N,N-methylenebisacrylamide as a cross-linker in the presence of two salts made from (4-vinylbenzyl) trimethylammonium cation (VBTMA) combined with either homovanillic alcohol anion or homoveratric acid anion, acting as functional monomers/templates (see Supplementary Materials). The use of the homovanillic alcohol anion introduced binding sites for CAs and Ms, while the latter salt served as a source for CAM binding sites. The unique quality of this approach is the replacement of anionic templates with OH− ions, thus turning the polymer into a selective anion-exchange sorbent capable of binding not only CAM anions but also Ms and CAs by possibly exploiting in situ deprotonation of the analyte’s remaining phenol group. To the best of our knowledge, there are no published methods that describe simultaneous separation of CAs, Ms and CAMs on anion-exchange sorbents (including MISPE), with the exception of a publication by Jandera et al. [16], which described weak retention of these compounds on Dowex L-X8 resin (10 µm, 0.45 cm × 316 cm). Considering the fact that our sorbent demonstrated good results with MISPE of CAs, Ms and CAMs in urine [13], it was decided to test its performance for separation of Ms from plasma, which is a much more complicated matrix in terms of both composition and analytical challenges.
High protein and phospholipid contents make plasma a problematic sample for quantitative analysis, even with hyphenated MS-based methods, due to pronounced matrix effects, ion suppression, clogging and interferences [17,18]. Keeping this in mind, protein precipitation using methanol was chosen as the pre-purification step to separate most of the proteins, leaving phospholipid removal from the supernatant for MISPE.
A suitable SPE solvent system promotes interaction with the sorbent binding sites, prevents analyte breakthrough caused by the presence of salts and removes matrix interferents, which is crucial for both the sample loading and washing steps. During the MISPE method optimization, methanol/water mixtures in different proportions with and without acidic and basic additives were used (see Tables S1 and S2 in Supplementary Materials). Among these systems, the highest analyte recoveries were observed with methanol/H2O (95:5, v/v) and with 15 mM ammonium hydrogen carbonate in methanol/water (75:25, v/v) as loading and washing solvents, respectively. The selected solvent systems can be characterized by their high polarity, strong solvation properties and propensity for H-bond formation, both with the sorbent and components commonly present in plasma. These solvents create competitive media, where only the most polar compounds from the plasma are able to interact with the sorbent’s functional groups on the surface, forcing breakthrough of non-polar, weakly polar and cationic compounds on the MISPE cartridge. As a result, a high-purity extract can be achieved during the elution step using 25 mM ammonium formate in methanol containing 2% formic acid (v/v), which protonates the analytes and disrupts their interactions with the sorbent.
As our imprinted sorbent is class-selective rather than specific for one target, the simultaneous isolation of compounds with similar structural features is possible. As was shown in our previous work with urine matrix, the sorbent exhibited selectivity toward CAs, Ms and CAMs even when the structurally similar DOPA and its derivatives were present in large excess [13]. However, within the context of this work, the presence of all these and related compounds in plasma may interfere with MN and NMN determination if an adequate HPLC-MS/MS method is not available. Therefore, to separate Ms from the analogs, we chose hydrophilic interaction liquid chromatography (HILIC) on the amide phase, which had become the most common approach for this task, while offering enhanced sensitivity in ESI-MS [19]. The use of the optimized mobile phase system containing ammonium acetate buffer offered good separation of Ms from interferences that appear in the same MRM transition chromatograms of MISPE-treated plasma extracts (see Figure 1). Moreover, the MIP-extracted Level 0 plasma calibration standard (blank) spiked with high concentration of CAs, DOPA and its derivatives did not show any detectable signals of these interferents in the MRM traces of MN and NMN (see Figure 1). In addition, stable and reproducible retention times for both analytes were achieved due to the presence of strong washing and fast regeneration steps in the gradient program. Moreover, the synergy between the MISPE and complementary amide HILIC in terms of purification and separation power ensured robust and downtime-free instrument operation during several months of method development and validation, which is a good prerequisite for clinical application.
To validate the reliability of the developed MISPE-based method, lyophilized human plasma calibration standards and quality controls from Eureka Lab Division were used, spanning clinically relevant pathological ranges. While the lower limit of quantification (LLOQ) slightly exceeded the upper cut-off threshold of healthy reference intervals of 88.7 ng/L (MN) and 86.1 ng/L (NMN) [20], achieving ultra-low sensitivity was not the primary objective of this study. Instead, this assay configuration remains highly relevant for identifying significant catecholamine-secreting tumors. Moreover, this clinical threshold was achieved using a minimal sample volume of just 25 µL, offering a distinct advantage when multiple concurrent analyses compete for limited patient plasma. Minimizing the sample volume also yields substantial economic benefits for clinical laboratories by drastically reducing the consumption of expensive commercial calibration kits and quality control standards, thus lowering operational costs. Validation results confirmed that this reduced sample volume did not compromise the linearity, precision, or accuracy across the evaluated concentration range, with all performance parameters strictly adhering to regulatory acceptance limits. Compared with the protocol utilizing commercial weak cation exchange (WCX) phase, which is the most widely used approach for metanephrine isolation from plasma [19], the MISPE sorbent yielded significantly cleaner extracts with minimal phospholipid interference and a substantially suppressed matrix effect. Ultimately, these results successfully demonstrated that the developed MISPE protocol is capable of reproducible, accurate, and selective MN and NMN extractions from a complex plasma matrix, achieving the primary goal of this work.
While the method performed in accordance with bioanalytical guidelines within the studied concentration range, the scope and certain limitations should be outlined. The slightly elevated LLOQ values currently prevent the proposed method from being utilized for the baseline screening of asymptomatic populations or for detecting marginal, sub-clinical elevations within normal physiological ranges. Furthermore, the lowest commercial IVD calibration standards (184.3 ng/L for MN and 174.8 ng/L for NMN) do not allow for reliable quantitation of mild elevations (<2× of the upper reference limit). However, reliable determination of such concentrations is still possible if different IVD calibration kits or purpose-made standards with concentration values closer to LLOQ are used.
Several strategies were tested in attempt to lower LLOQ during method development. A significant increase in plasma loading volume led to analyte breakthrough, likely caused by competitive binding and saturation of MIP cavities by matrix components. Evaporating the MISPE eluate further is unfeasible, as the current protocol concentrates the sample down to a minimal volume of 50 µL. Alternative MS parameters were exhaustively screened but yielded no significant signal-to-noise ratio improvements. Increasing the HPLC injection volume beyond the current limit compromised peak symmetry and chromatographic resolution. As this method was developed using standard LC-MS/MS equipment, the machine’s baseline noise floor effectively dictated the obtained LLOQ, which represents the hardware detection limits of the mass spectrometer rather than the performance limitations of MISPE. Because the MIP sorbent successfully provides clean, selective extracts free from matrix interferences, the LLOQ can likely be scaled down to healthy physiological ranges if the method is transferred to modern high-sensitivity mass spectrometers. Therefore, this work serves as an accessible and robust proof-of-concept with immediate scaling potential.
The presented MISPE–HILIC-MS/MS protocol demonstrates potential for reliable metanephrine quantification in situations where pathological biomarker levels are expected. Catecholamine-secreting tumors (e.g., paraganglioma) cause substantial elevation of plasma metanephrines, typically exceeding the upper reference limit 3- to 10-fold for paraganglioma (>1.68–7.18 nmol/L) [21] and 3- to more than 100-fold for pheochromocytoma (up to 173–383 nmol/L) [22]. The method can be potentially used to monitor treatment response in paraganglioma and pheochromocytoma patients and track the decline in MN and NMN levels from pathological levels down to method’s LLOQ, while also detecting significant post-operative spikes [23]. Finally, the method is potentially useful as a rapid tool for patients with severe hypertensive crises to differentiate between essential hypertension (normal or mildly elevated metanephrines) and tumor-induced hypertensive crises (massively elevated metanephrines) [24].
Certain limitations regarding analyte stability should also be outlined. While comprehensive, site-specific stability testing was not performed in this work, pre-analytical stability of plasma metanephrines was ensured by strictly following manufacturer’s instructions when handling certified commercial calibrators and quality controls. In addition, metanephrine stability in plasma under standard storage conditions is well documented [25]. Stability testing of the analytes in post-extracted plasma samples was not verified due to high risk of evaporation of the mostly organic extract (total volume of 50 µL after reconstitution). To prevent possible errors, immediate analysis of the reconstituted sample is highly recommended.
The method’s selectivity was verified by spiking a certified IVD blank plasma matrix (made from real plasma pools) with structurally similar analogs, including catecholamines, DOPA and its derivatives. While pooled commercial plasma might not fully capture biological variability and potential interferences of individual specimens, the obtained performance provides a solid, high-throughput foundation for advanced clinical diagnostics and rapid monitoring of metanephrine levels. Comprehensive long-term clinical trials with a large patient cohort are needed to map individual cross-reactivity and selectivity profiles. While this falls beyond the scope of the present study, it represents principal direction for future research.
5. Conclusions
The primary objective of this study was to evaluate a recently developed, anion-exchange-based MISPE material as an alternative analytical tool for isolating metanephrine and normetanephrine from human plasma. Validation using matrix-matched calibration standards and quality controls within pathological concentration ranges demonstrated that the novel sorbent efficiently purifies both target compounds. This enables precise and accurate determination using a minimal sample volume of just 25 µL. The powerful combination of MISPE and HILIC-MS/MS lead to high selectivity of the method, showing that structurally similar catecholamines, DOPA and its derivatives had no influence on the analyte signal even when present at much higher concentrations. Compared with a conventional weak cation exchange (WCX) SPE protocol, the developed MISPE method significantly suppressed matrix effects, yielded higher analyte signal intensities, and markedly reduced phospholipid interference within the metanephrine retention window. Although the method exhibits a higher lower limit of quantification (LLOQ, specifically 92.2 ng/L for metanephrine and 87.4 ng/L for normetanephrine), slightly exceeding the upper thresholds of healthy reference intervals, the assay offers potential use for detection of catecholamine-producing tumors, tracking of post-treatment biomarker levels and identification of tumor-induced hypertensive crises in emergency settings. While mapping individual biological variations and interferences requires extensive long-term clinical trials beyond the scope of this study, the obtained performance metrics confirm that the MISPE–HILIC-MS/MS approach provides a solid, high-throughput foundation for advanced diagnostics and future biomedical research.
Supplementary Materials
The following supporting information can be downloaded from https://www.mdpi.com/article/10.3390/separations13060182/s1: Table S1. Study of MISPE loading conditions (n = 1); Table S2. Study of MISPE washing conditions (n = 1).
Author Contributions
Conceptualization, A.P.; methodology, A.P.; validation, A.P. and A.Š.; formal analysis, A.P. and A.Š.; investigation, A.P. and A.Š.; resources, A.P.; writing—original draft preparation, A.P.; writing—review and editing, A.P. and A.Š.; visualization, A.Š.; supervision, A.P.; project administration, A.P.; funding acquisition, A.P. All authors have read and agreed to the published version of the manuscript.
Funding
This research was funded by the Fundamental and Applied Research Project (Latvian Council of Science) No. lzp-2022/1-0141.
Institutional Review Board Statement
The study was conducted in accordance with Declaration of Helsinki, and the protocol was approved by the Ethics Committee for Life Sciences and Medical Research of the University of Latvia (13-22/20) on 10 February 2026.
Informed Consent Statement
Informed consent for the use of commercially obtained lyophilized plasma was not required.
Data Availability Statement
The original contributions presented in this study are included in the article/Supplementary Material. Further inquiries can be directed to the corresponding author.
Conflicts of Interest
The authors declare no conflicts of interest.
Abbreviations
The following abbreviations are used in this manuscript:
| CAMs | Acidic metabolites of catecholamines |
| CAs | Catecholamines |
| CV | Coefficient of variation |
| DA | Dopamine |
| L-DOPA | Dihydroxy phenyl L-alanine |
| E | Epinephrine |
| FDA | Food and Drug Administration |
| HILIC | Hydrophilic interaction liquid chromatography |
| HPLC | High-performance liquid chromatography |
| IS | Internal standard |
| IVD | In vitro diagnostics |
| LOD | Limit of detection |
| LLOQ | Lower limit of quantification |
| Ms | Metanephrines |
| ME | Matrix effect |
| MIP | Molecularly imprinted polymer |
| MISPE | Molecularly imprinted solid-phase extraction |
| MN | Metanephrine |
| MRM | Multiple reaction monitoring |
| MS | Mass spectrometry |
| NE | Norepinephrine |
| NMN | Normetanephrine |
| 3-OMD | 3-O-Methyldopa |
| QC | Quality control |
| RSE | Relative standard error |
| SD | Standard deviation |
| SPE | Solid-phase extraction |
| WCX | Weak cation exchange |
References
- Choi, H.; Yim, J.; Yun, J.; Lee, J.; Kim, K.; Nam, M.; Nam, M.H.; Cho, Y.; Yun, S. Plasma-Free Metanephrine and Normetanephrine Quantification for Clinical Applications Validated by Combining Solid-Phase Extraction and HPLC-MS/MS. Molecules 2025, 30, 3847. [Google Scholar] [CrossRef] [PubMed]
- Dikunets, M.; Dudko, G.; Glagovsky, P.; Mamedov, I. Simultaneous Quantification of Plasma Catecholamines and Metanephrines by LC-MS/MS. J. Braz. Chem. Soc. 2020, 31, 1467–1474. [Google Scholar] [CrossRef]
- Tank, A.; Wong, D. Peripheral and central effects of circulating catecholamines. Compr. Physiol. 2015, 5, 1–15. [Google Scholar] [CrossRef]
- de Jong, W.; Graham, K.; van der Molen, J.; Links, T.; Morris, M.; Ross, H.; de Vries, E.; Kema, I. Plasma Free Metanephrine Measurement Using Automated Online Solid-Phase Extraction HPLC–Tandem Mass Spectrometry. Clin. Chem. 2007, 53, 1684–1693. [Google Scholar] [CrossRef] [PubMed]
- Li, X.; Li, S.; Kellermann, G. Pre-analytical and analytical validations and clinical applications of a miniaturized, simple and cost-effective solid phase extraction combined with LC-MS/MS for the simultaneous determination of catecholamines and metanephrines in spot urine samples. Talanta 2016, 159, 238–247. [Google Scholar] [CrossRef] [PubMed]
- Därr, R.; Kuhn, M.; Bode, C.; Bornstein, S.; Pacak, K.; Lenders, J.; Eisenhofer, G. Accuracy of recommended sampling and assay methods for the determination of plasma-free and urinary fractionated metanephrines in the diagnosis of pheochromocytoma and paraganglioma: A systematic review. Endocrine 2017, 56, 495–503. [Google Scholar] [CrossRef] [PubMed]
- Eisenhofer, G.; Siegert, G.; Kotzerke, J.; Bornstein, S.; Pacak, K. Current progress and future challenges in the biochemical diagnosis and treatment of pheochromocytomas and paragangliomas. Horm. Metab. Res. 2008, 40, 329–337. [Google Scholar] [CrossRef] [PubMed]
- Xiong, X.; Zhang, Y.; Zhao, R. Quantitative Measurement of Plasma Free Metanephrines by a Simple and Cost-Effective Microextraction Packed Sorbent with Porous Graphitic Carbon and Liquid Chromatography-Tandem Mass Spectrometry. J. Anal. Methods Chem. 2021, 2021, 8821276. [Google Scholar] [CrossRef] [PubMed]
- Shi, N.; Bu, X.; Zhang, M.; Wang, B.; Xu, X.; Shi, X.; Hussain, D.; Xu, X.; Chen, D. Current Sample Preparation Methodologies for Determination of Catecholamines and Their Metabolites. Molecules 2022, 27, 2702. [Google Scholar] [CrossRef] [PubMed]
- Emms, H.; Farah, G.; Shine, B.; Boot, C.; Toole, B.; McFadden, M.; Lam, L.; Ou, Z.; Woollard, G.; Madhavaram, H.; et al. Falsely elevated plasma metanephrine in patients taking midodrine. Ann. Clin. Biochem. 2018, 55, 509–515. [Google Scholar] [CrossRef] [PubMed]
- Chen, L.; Wang, X.; Lu, W.; Wu, X.; Li, J. Molecular imprinting: Perspectives and applications. Chem. Soc. Rev. 2016, 45, 2137–2211. [Google Scholar] [CrossRef] [PubMed]
- Podjava, A.; Šilaks, A. Synthesis and sorptive properties of molecularly imprinted polymer for simultaneous isolation of catecholamines and their metabolites from biological fluids. J. Liq. Chromatogr. Relat. Technol. 2021, 44, 181–188. [Google Scholar] [CrossRef]
- Šilaks, A.; Podjava, A.; Bernāte, L.; Grebnevs, V.; Maciej, A. Novel Strongly Basic Molecularly-Imprinted Solid-Phase Extraction Sorbent for Simultaneous Determination of Catecholamines and Their Metabolites in Urine. J. Sep. Sci. 2026, 49, e70467. [Google Scholar] [CrossRef] [PubMed]
- U.S. Food and Drug Administration. M10 Bioanalytical Method Validation and Study Sample Analysis: Guidance for Industry; U.S. Department of Health and Human Services: Washington, DC, USA, 2022.
- Liu, Z.; Liu, Q.; Deng, Y.; Zhao, H.; Zeng, J.; Zhang, T.; Zhang, J.; Wang, J.; Zhou, W.; Zhang, C. Quantitation of plasma metanephrines using isotope dilution liquid chromatography tandem mass spectrometry (ID-LC/MS/MS): A candidate reference measurement procedure and its application to evaluating routine ID-LC/MS/MS methods. Anal. Bioanal. Chem. 2021, 413, 7509–7520. [Google Scholar] [CrossRef] [PubMed]
- Jandera, P.; Churácek, J. Ion-exchange chromatography of nitrogen compounds. J. Chromatogr. A 1974, 98, 1–54. [Google Scholar] [CrossRef] [PubMed]
- Williams, M.; Olomukoro, A.; Emmons, R.; Godage, N.; Gionfriddo, E. Matrix effects demystified: Strategies for resolving challenges in analytical separations of complex samples. J. Sep. Sci. 2023, 46, e2300571. [Google Scholar] [CrossRef] [PubMed]
- Guo, X.; Lankmayr, E. Phospholipid-Based Matrix Effects in LC–MS Bioanalysis. Bioanalysis 2011, 3, 349–352. [Google Scholar] [CrossRef] [PubMed]
- Davies, S.; Davison, A. Liquid chromatography tandem mass spectrometry for plasma metadrenalines. Clin. Chim. Acta 2019, 495, 512–521. [Google Scholar] [CrossRef] [PubMed]
- Eisenhofer, G.; Lattke, P.; Herberg, M.; Siegert, G.; Qin, N.; Därr, R.; Hoyer, J.; Villringer, A.; Prejbisz, A.; Januszewicz, A.; et al. Reference intervals for plasma free metanephrines with an age adjustment for normetanephrine for optimized laboratory testing of phaeochromocytoma. Ann. Clin. Biochem. 2013, 50, 62–69. [Google Scholar] [CrossRef] [PubMed]
- Lin, Y.; Wang, M.; Cao, Y. Establishment of reference intervals for plasma metanephrines in seated position measured by LC-MS/MS and assessment of diagnostic performance in pheochromocytoma/paraganglioma. Ann. Clin. Biochem. 2023, 60, 160–168. [Google Scholar] [CrossRef] [PubMed]
- Lenders, J.W.; Pacak, K.; Walther, M.M.; Linehan, W.M.; Mannelli, M.; Friberg, P.; Keiser, H.R.; Goldstein, D.S.; Eisenhofer, G. Biochemical diagnosis of pheochromocytoma: Which test is best? JAMA 2002, 287, 1427–1434. [Google Scholar] [CrossRef] [PubMed]
- Plouin, P.F.; Amar, L.; Dekkers, O.M.; Fassnacht, M.; Gimenez-Roqueplo, A.P.; Lenders, J.W.; Lussey-Lepoutre, C.; Steichen, O. European Society of Endocrinology Clinical Practice Guideline for long-term follow-up of patients operated on for a phaeochromocytoma or a paraganglioma. Eur. J. Endocrinol. 2016, 174, G1–G10. [Google Scholar] [CrossRef] [PubMed]
- Buonacera, A.; Stancanelli, B.; Malatino, L. Endocrine Tumors Causing Arterial Hypertension: Pathophysiological Mechanisms and Clinical Implications. High Blood Press. Cardiovasc. Prev. 2017, 24, 217–229. [Google Scholar] [CrossRef] [PubMed]
- Wang, K.; Gao, X.; Zhang, W.; Sun, N.; Xie, L.; Cong, H.; Guo, Y.; Shi, X.; Zhou, Z. Study of stability and interference for catecholamines and metanephrines, 3-methoxytyramine: Key point of an accurate diagnosis for pheochromocytoma and paraganglioma. Scand. J. Clin. Lab. Investig. 2021, 81, 564–572. [Google Scholar] [CrossRef] [PubMed]


Disclaimer/Publisher’s Note: The statements, opinions and data contained in all publications are solely those of the individual author(s) and contributor(s) and not of MDPI and/or the editor(s). MDPI and/or the editor(s) disclaim responsibility for any injury to people or property resulting from any ideas, methods, instructions or products referred to in the content. |
© 2026 by the authors. Licensee MDPI, Basel, Switzerland. This article is an open access article distributed under the terms and conditions of the Creative Commons Attribution (CC BY) license.