


Abstract
Background: Intravenous gadolinium-based contrast agent (IV-GBCA)-based MRI has been widely used to study cerebrospinal fluid (CSF) circulation and clearance in the human brain. IV-GBCA can enter the CSF via the choroid plexus (CP) and parasagittal dura (PSD), but how these dynamics are coupled with cerebrovascular fluctuations is unclear. The goal of this study is to investigate the relationship between microvascular reactivity and CSF distribution in the human brain, which were measured with cerebrovascular reactivity (CVR) and IV-GBCA distribution in the CSF, respectively. Methods: CVR and IV-GBCA distribution in the CSF around the CP and PSD were measured in the same five healthy subjects (four males, one female; age 40 ± 16 years) during CO2 breathing using inflow-based vascular-space-occupancy (iVASO) MRI and dynamic susceptibility contrast in the CSF (cDSC) MRI, respectively. Results: Whole-brain arterial cerebral blood volume (CBVa) increases during CO2 breathing showed a strong negative correlation with GBCA concentration in CSF around the CP but a moderate positive (but not significant) correlation in CSF around the PSD. Conclusions: The finding of a differential relationship between CVR and IV-GBCA distribution in the CSF in different brain regions highlights the importance of accounting for microvascular function in neurofluids studies using IV-GBCA-based MRI.
1. Introduction
The interaction between cerebral blood flow (CBF) and cerebrospinal fluid (CSF) circulation plays a critical role in regulating how nutrients are supplied across different regions in the brain as well as how waste products are cleared from metabolically active regions of the brain [1,2]. Intravenously (IV) administered gadolinium-based contrast agents (GBCA) are widely used for tracking CSF circulation and clearance in the human brain [3]. Studies by Sun et al. [4] provided evidence in healthy subjects that IV-GBCA can pass the blood–CSF barrier (BCSFB) in the choroid plexus (CP) and enter the ventricular CSF approximately 20 s post-injection. Meanwhile, the parasagittal dura (PSD) is recognized as a key site for neurofluid communication, where IV-GBCA leaks from dural blood vessels that lack a blood–brain barrier (BBB) and enters the CSF space. Cerebral arterial pulsation is an important factor that determines the amount of IV-GBCAs transported from blood to CSF. Strong arterial pulsatility substantially influences the concentration and initial delivery of GBCAs across the BCSFB and drives GBCAs along perivascular spaces. The main factor that affects this process is the stiffness of the vessel wall and vascular compliance, which dampens the oscillation of blood vessel walls necessary to move fluid through the perivascular space. Cerebrovascular reactivity (CVR) reflects the ability of cerebral vessels to dilate and is closely related to vascular compliance, which is more sensitive than microvascular parameters measured at rest for detecting subtle cerebrovascular changes [5]. Consequently, an impaired CVR may lead to a systems-level constraint that blunts the propulsion of GBCAs into and along CSF distribution and clearance routes. Understanding this relationship between IV-GBCA distribution in the CSF and CVR is thus essential for proper interpretation of results in neurofluids studies using IV-GBCA enhanced MRI [6].
However, most current studies on delayed enhancement in the CSF and perivascular spaces often operate under the implicit assumption of a stable or uniform vascular state across subjects [2,7]. As reduced blood perfusion and compromised CVR directly affect the input and the mechanical propulsion of GBCAs, apparent measures of altered GBCA distribution in the CSF may partially or predominantly originate from changes in the delivery kinetics rather than in the underlying clearance pathways [1]. Therefore, without accounting for the regulatory role of the cerebrovasculature, it remains unclear whether the observed GBCA enhancement patterns in the CSF signify true neurofluid dysfunction or are mainly secondary manifestations of hemodynamic variability. To our knowledge, studies on the relationship between cerebrovascular changes and CSF distribution in the human brain remain scarce [8,9].
Carbon dioxide (CO2) offers a unique mechanism to systematically manipulate the physiological drivers of CSF circulation. CO2 is a potent vasodilator that acts directly on the smooth muscle cells of arterioles without significantly altering the cerebral metabolic rate of oxygen (CMRO2), making it a pure vascular stimulus. By inducing rapid and reversible shifts in cerebrovascular tone, hypercapnia and hypocapnia allow for CVR mapping in the human brain [5]. Under the constraints of the Monro–Kellie doctrine, these CO2-driven vascular fluctuations are directly coupled to CSF dynamics; for instance, respiratory-induced hypercapnic blocks have been shown to increase cerebral blood volume (CBV) and subsequently enhance caudad CSF movement [10]. This tight coupling makes CO2 breathing an ideal tool for investigating the interaction between microvascular and CSF dynamics, as it provides a calibrated input to perturb the arterial input function and vessel compliance [11].
This exploratory study is aimed at investigating the relationship between microvascular reactivity and CSF distribution in the human brain using CVR and IV-GBCA distribution in the CSF as indicators, respectively. We hypothesized that IV-GBCA distribution in the CSF may be modulated by CVR, as a change in CVR may influence the amount of IV-GBCA that enters the CSF circulation. CVR and IV-GBCA distribution in the CSF around the CP and PSD were recorded in the same subjects during hypercapnia induced by CO2 breathing. CVR was measured by changes in arterial CBV (CBVa) between room air (baseline) and CO2 breathing using inflow-based vascular-space-occupancy (iVASO) MRI [12]. Dynamic susceptibility contrast in the CSF (cDSC) MRI was adopted to measure IV-GBCA distribution in the CSF during CO2-breathing by employing a long echo time (TE) to suppress blood and parenchyma signals [4,13]. The correlation between CBVa changes and IV-GBCA concentration changes in the CSF during CO2-breathing was investigated.
2. Materials and Methods
The study is an exploratory, prospective MRI study with a cross-sectional design. Five healthy participants (four males, one female; age 40 ± 16 years) were recruited for this study. All participants provided written informed consent under a protocol approved by the Johns Hopkins Institutional Review Board (IRB00178297, from 31 July 2018). Exclusion criteria included any history or clinical signs of neurological diseases. CVR was assessed using a CO2 inhalation challenge. Participants underwent two sets of interleaved sessions: a baseline session breathing room air, and a hypercapnia session during which a fixed inspired gas mixture consisting of 5% CO2, 21% O2, and 74% N2 was administered. A step-paradigm design was used, allowing a stabilization period before acquiring CBVa and CSF dynamics data to ensure the physiological response had reached steady state [5].
The iVASO MRI method was developed to measure absolute CBVa values in a physiological unit (ml blood/100 mL brain tissue) [12,14]. In iVASO, CBVa is calculated from the difference signal between an arterial blood-nulled (using selective inversion) image and a second image without blood nulling. To account for the heterogeneity of vascular transit times, images are acquired at multiple post-inversion delay times (TI), from which absolute CBVa can be calculated. Extensive technical work has been performed to optimize iVASO MRI [12]. In mouse brains, CBVa values measured by iVASO MRI were validated with histological markers of microvasculature [15]. The cDSC MRI method was developed to track dynamic GBCA distribution in the CSF using a three-dimensional (3D) turbo-spin-echo (TSE) sequence with an extra-long echo time (TE) [13]. The extra-long TE is essential as it allows selective detection of CSF signals while effectively suppressing blood signals. This is especially important for intravenous GBCA MRI, in which GBCAs can be present in both blood and CSF. For instance, cDSC MRI has been applied to measure GBCA distribution in the CSF around highly vascularized regions such as the olfactory areas [16].
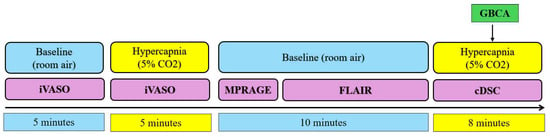
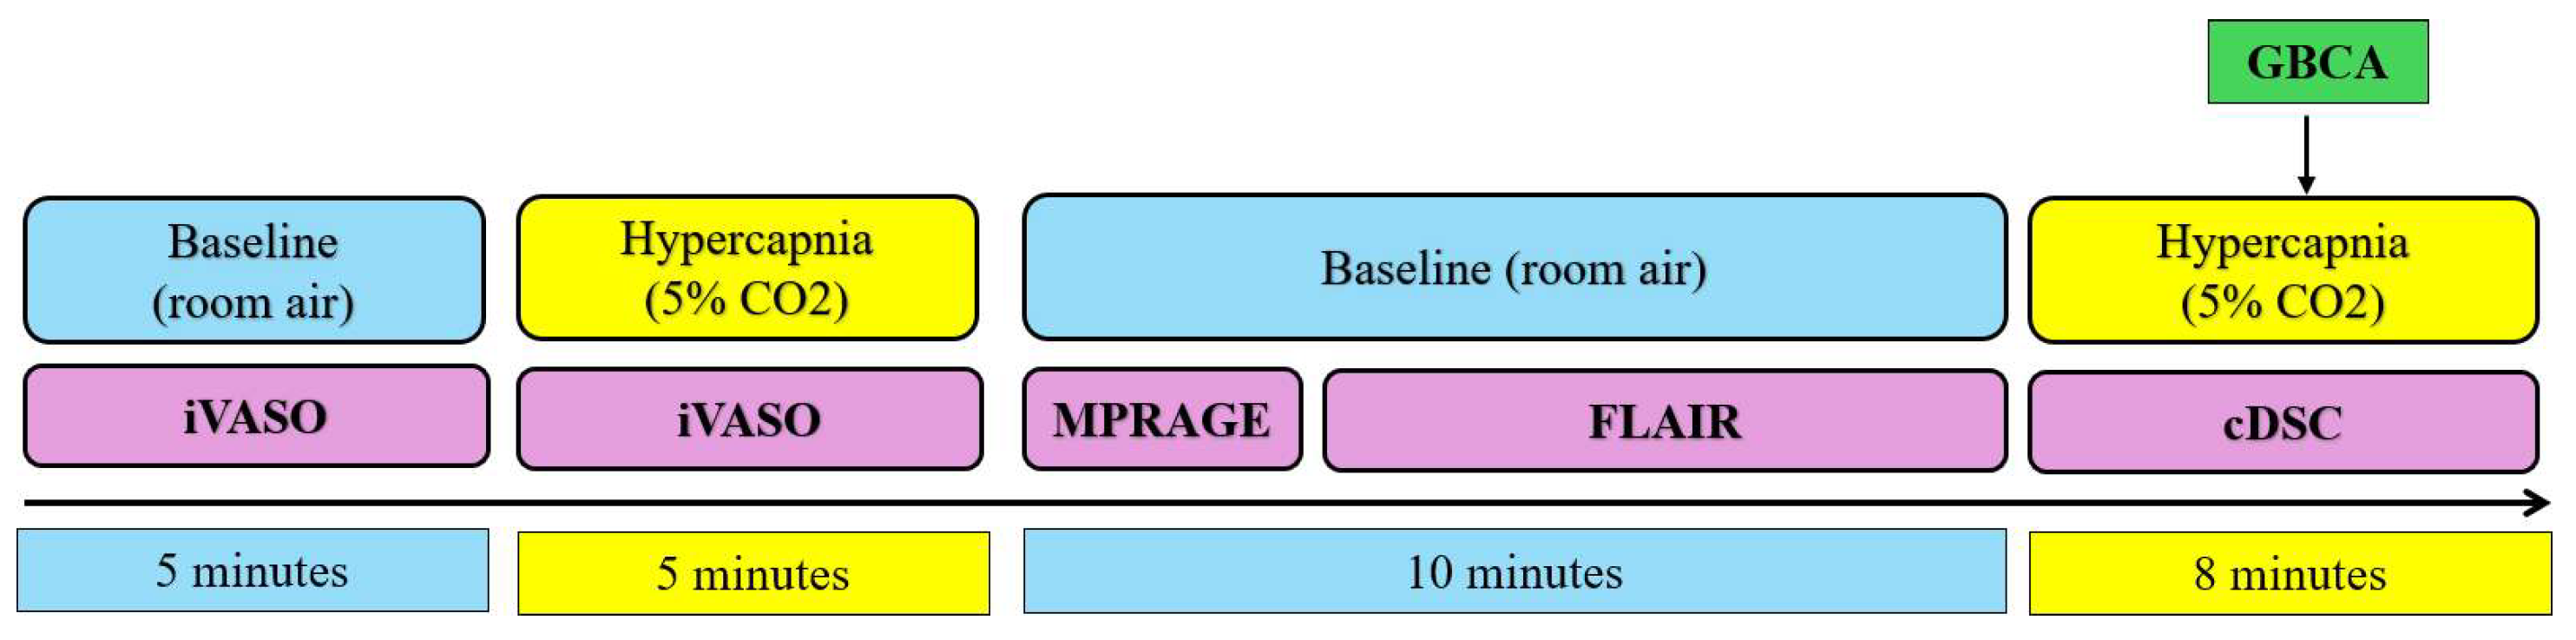
MRI scanning was performed on a 3T Philips Human MRI scanner (Philips Healthcare, Best, the Netherlands). Four MRI sessions were performed for each subject (Figure 1). During the first baseline and hypercapnia sessions, the same iVASO scans were performed:
Figure 1.
Summary of the paradigm for the study. Four MRI sessions were performed for each subject. The baseline sessions were performed during room air breathing, while the CO2 sessions were performed during hypercapnia induced by 5% CO2 breathing. GBCAs were administered during the second CO2 session. The cDSC MRI scan was continuously performed before (20 frames) and after (24 frames) GBCA administration.
- iVASO MRI with whole-brain coverage to measure CBVa: voxel = 3 × 3 × 6 mm3; 19 slices; flip angle (FA) = 20◦; repetition time (TR)/inversion time (TI) = 403/191, 600/277, 800/360, 1000/437, 1500/611, 2000/757, 2700/921, 3500/1059 ms [12]. The thickness of the flip-back slab was 126 mm. A reference scan (TR = 20,000 ms, other imaging parameters the same as iVASO scans) through the ventricle was acquired to determine the scaling factor M0 needed to calculate the absolute CBVa values from iVASO images. The total duration for this scan was 5 min.
Subsequently, the second baseline session was performed, which included the following scans:
- 2.
- A whole-brain 3D magnetization-prepared rapid acquisition gradient echo (MPRAGE) 125 scan (TR/TI/echo time (TE) = 8.1/3.7/749 ms, voxel = 1 mm isotropic, 150 slices) was performed for whole-brain anatomical reference. The duration of this scan was 1 min.
- 3.
- A whole-brain fluid-attenuated inversion recovery (FLAIR) scan (TR/TI/TE = 6000/2000/180 ms, voxel = 0.8 mm isotropic, 188 slices) was performed. The duration of this scan was 8 min and 36 s.
Finally, the second hypercapnia session was performed, during which the cDSC MRI scan was carried out:
- 4.
- Dynamic cDSC MRI during GBCA administration: TR/TE/echo spacing (ES) = 10,000/1312/3.2 ms, voxel = 0.8 mm isotropic, 188 slices. This scan was continuously performed before (20 frames) and after (24 frames) GBCA administration. Standard IV administration of ProHance (0.5 mmol/mL; Bracco S.p.A., Milan, Italy; dosage = 0.1 mmol/kg calibrated by body weight; injection rate = 5 mL/s) was performed during the MRI scans for each subject. The cDSC MRI scan is optimized with a long TE to suppress signals from parenchyma and blood, thereby isolating the signal from pure CSF with minimal partial-volume effects [13]. The sequence parameters were set for the T2-dominant cDSC MRI scan, described in the original cDSC MRI study [13], in which GBCA in the CSF induces a signal decrease.
Data Analysis
Image analysis was performed using the Statistical Parametric Mapping software package (SPM12, Wellcome Trust Centre for Neuroimaging, London, UK) and in-house scripts implemented in MATLAB (version R2024a: MathWorks, Natick, MA, USA). Both iVASO and cDSC images were co-registered to FLAIR anatomical images. Two regions of interest (ROIs) were manually delineated on FLAIR images for each subject using the ITK-SNAP software (version 4.2.2): the choroid plexus (CP) and parasagittal dura (PSD). The ROIs were drawn by the first author (J.V.) and validated by Y.S. [4] and Y.L. [17]. These two ROIs were selected as the CP is the main site where IV-GBCA enters the ventricular CSF across the BCSFB [4], and the PSD serves both as an entry site for IV-GBCA from dural vessels lacking a BBB and as an exit site for CSF drainage [18]. CBVa values were derived from the difference signals measured in iVASO MRI using the equations and software established in previous technical studies of iVASO MRI [12,14,19]. Briefly, the iVASO difference signals acquired at multiple TIs were fitted to a kinetic model with CBVa and arterial arrival time as free parameters, assuming literature values for the T1 of arterial blood at 3T. The fitted values were scaled by M0 obtained from the reference scan to yield absolute CBVa [12]. Prior to fitting, iVASO images were corrected for motion using SPM12. Whole-brain CBVa was calculated as the mean CBVa within a whole-brain tissue mask including gray and white matter.
To characterize the vascular response to the CO2 challenge, relative CBVa changes during room air and CO2 breathing were calculated as:
As end-tidal CO2 (EtCO2) was not recorded in this study, CVR was expressed as the relative CBVa change without normalization to the change in EtCO2. A fixed inspired gas mixture of 5% CO2 was used for all participants to provide a standardized hypercapnic stimulus [5].
GBCA concentration in the CSF was estimated from the relative signal change before and after GBCA administration measured in cDSC MRI, since the cDSC sequence was optimized so that the relative signal has a monotonic relationship with GBCA concentration in the CSF as shown in previous technical studies [13]. The theory was derived in our previous work and has been calibrated and validated experimentally by scanning phantom tubes made of water with various GBCA concentrations [13]. Quantitative GBCA concentration ([Gd]) in mmol/L was estimated from the relative cDSC signal changes (∆S/S) using the following equation derived in [13]:
where r2 is the relaxivity of GBCA in CSF (3.4 L/mmol/s) obtained from the literature [20].
Correlation analysis was performed between whole-brain CBVa changes (Equation (1)) and GBCA concentration within each ROI using linear regression with age as a covariate to test our hypothesis. The relative change, instead of absolute CBVa, was used as it reflects the CO2-induced vascular response (i.e., CVR) and normalizes inter-subject differences in baseline CBVa.
3. Results
3.1. Physiological Response to CO2 Challenge
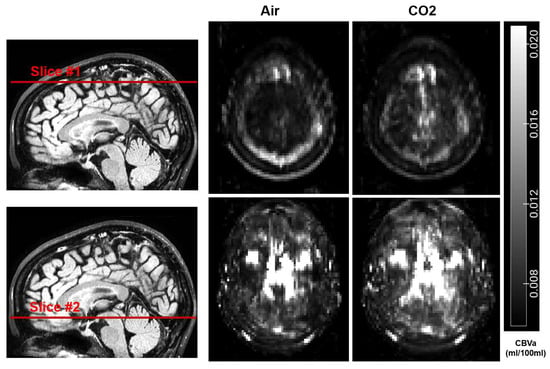
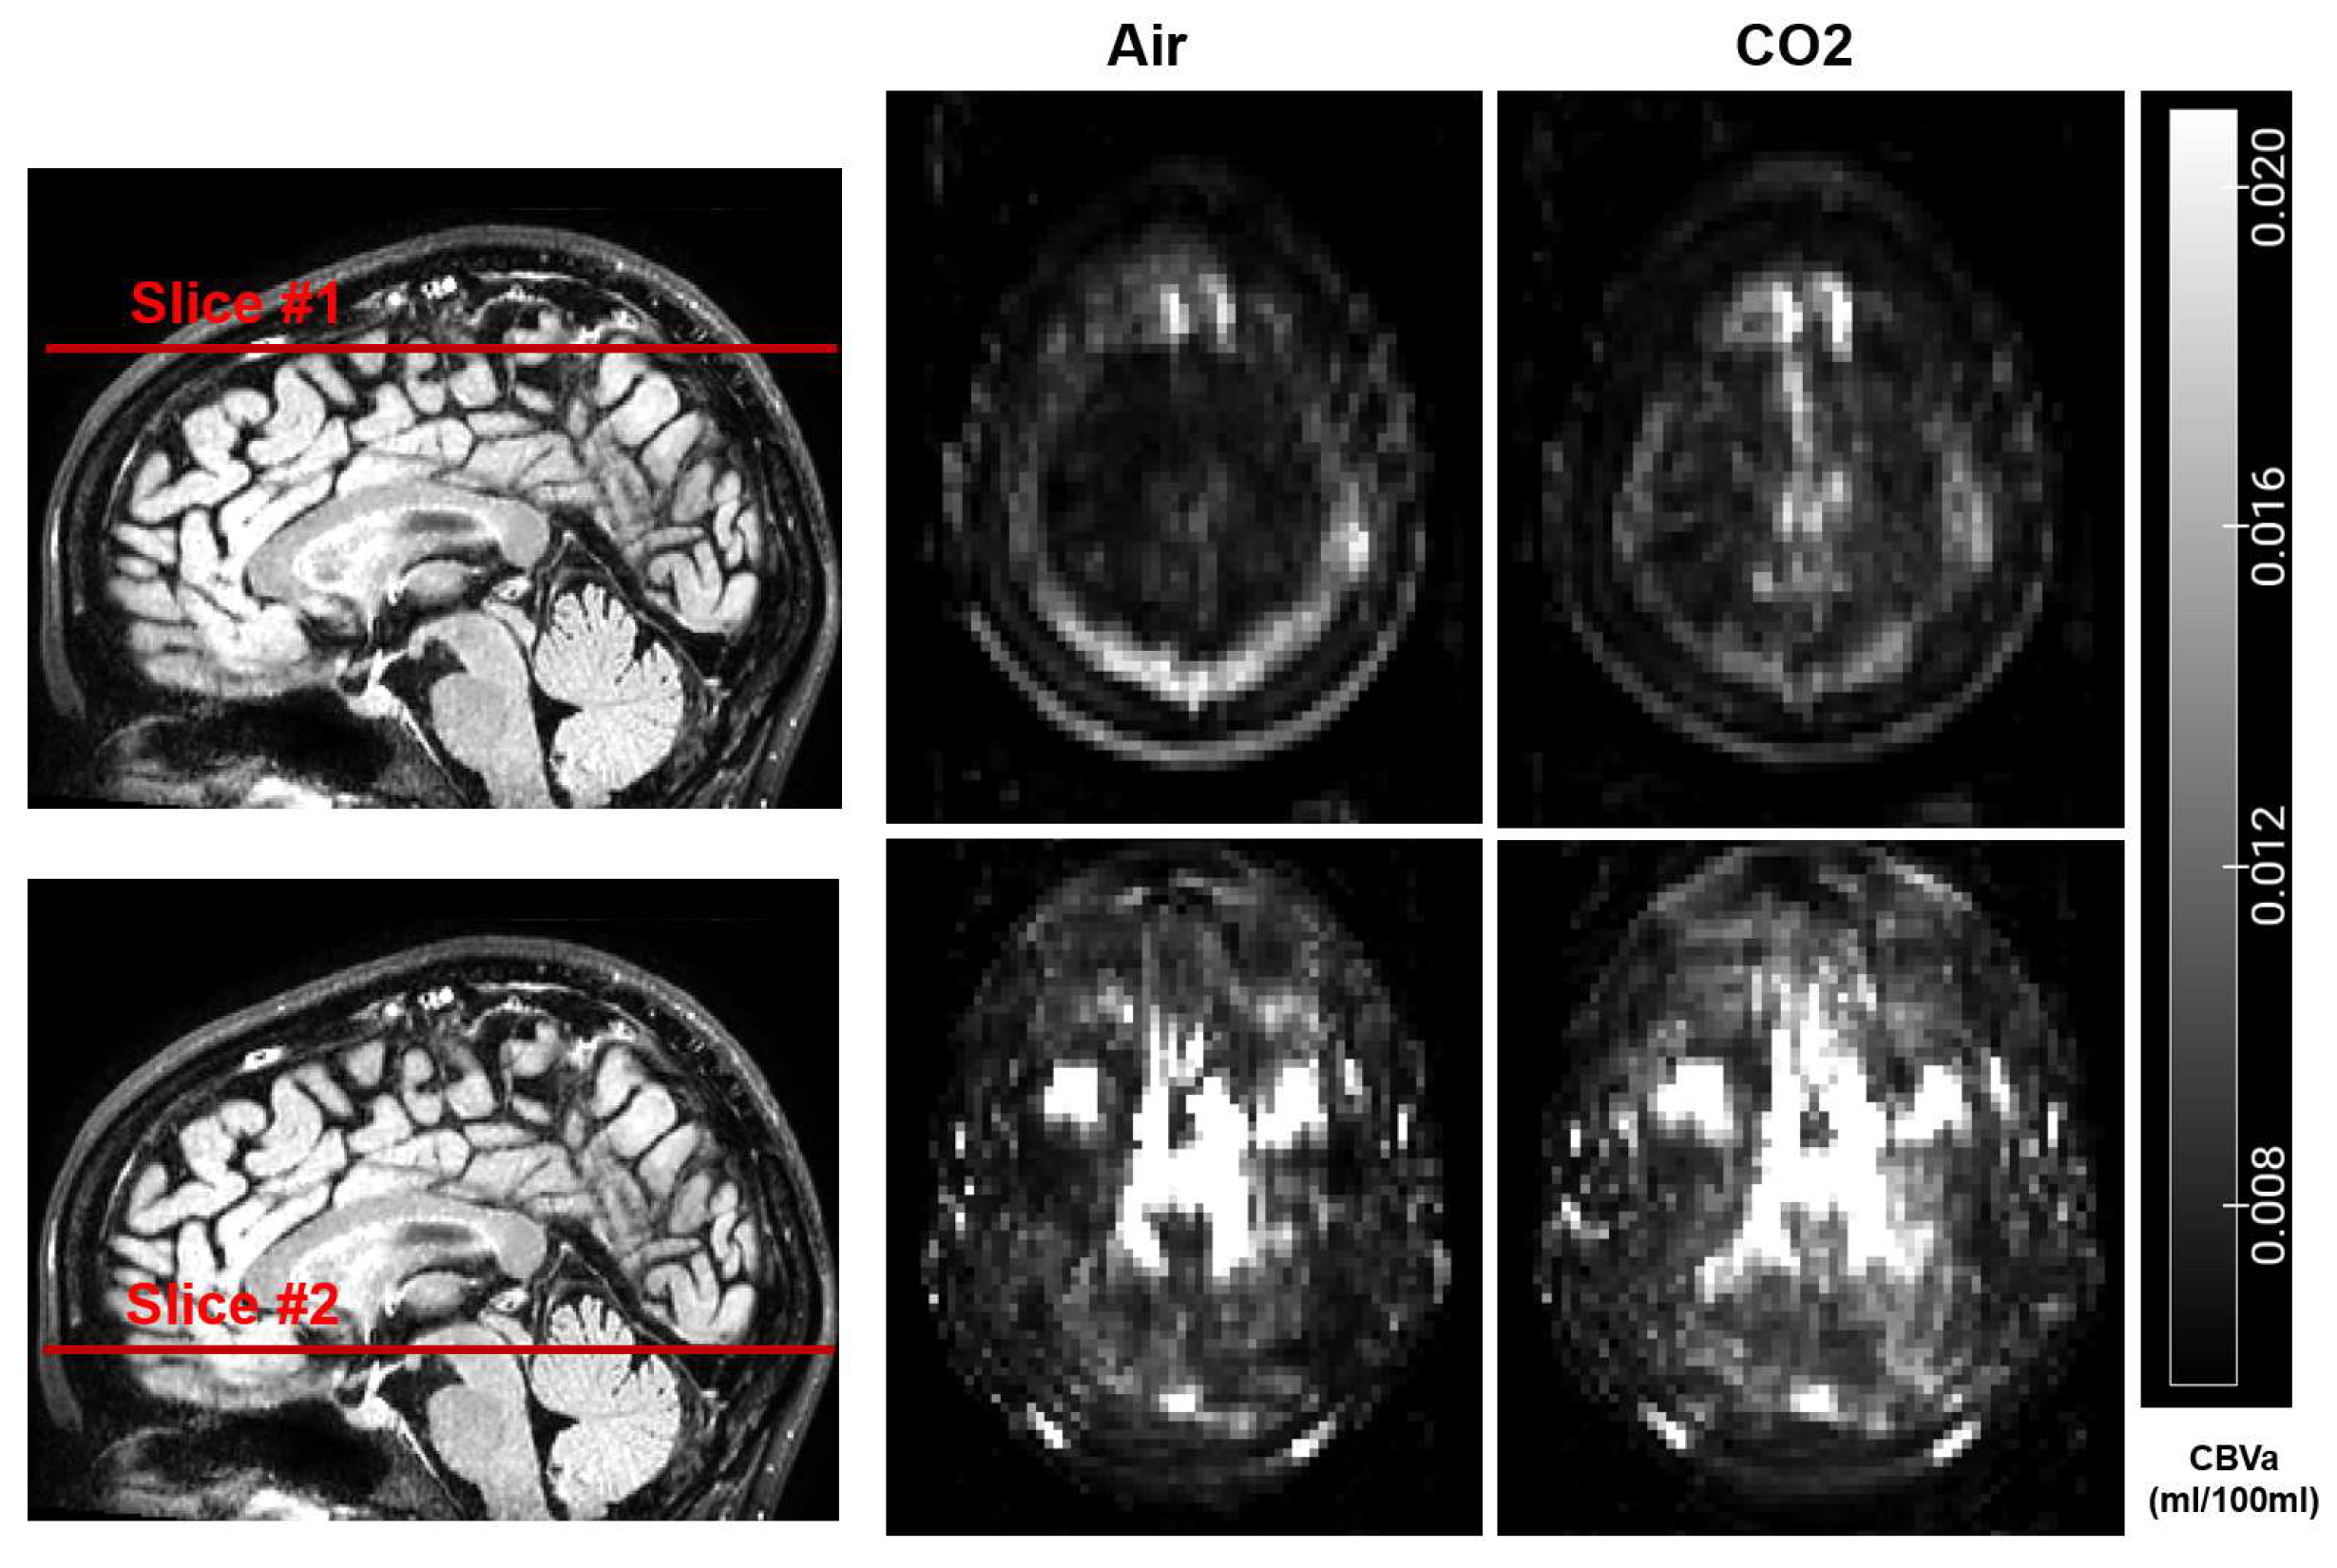
The 5% CO2 inhalation challenge induced a vasodilatory response in all participants. Whole-brain CBVa increased across all participants during the hypercapnia session compared to the room-air baseline session, although the amount of increase showed substantial inter-subject variation. Figure 2 shows representative CBVa maps from one participant during baseline and hypercapnia. Whole-brain CBVa values were calculated for each participant.
Figure 2.
Representative CBVa maps during baseline and hypercapnia from one participant. Two slices in axial view are displayed. The locations of the slices were indicated on the sagittal FLAIR images. The scale bar indicates the range of CBVa values.
3.2. Relationship Between Vascular Reactivity and IV-GBCA Distribution in the CSF
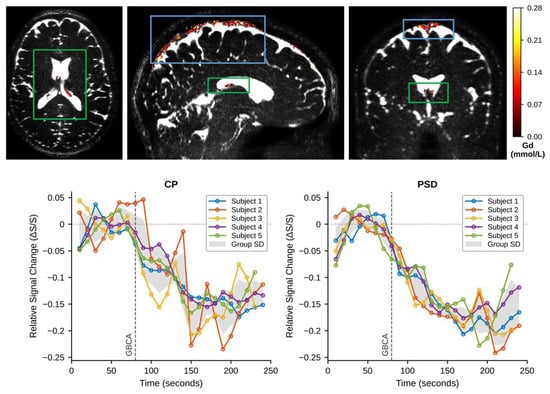
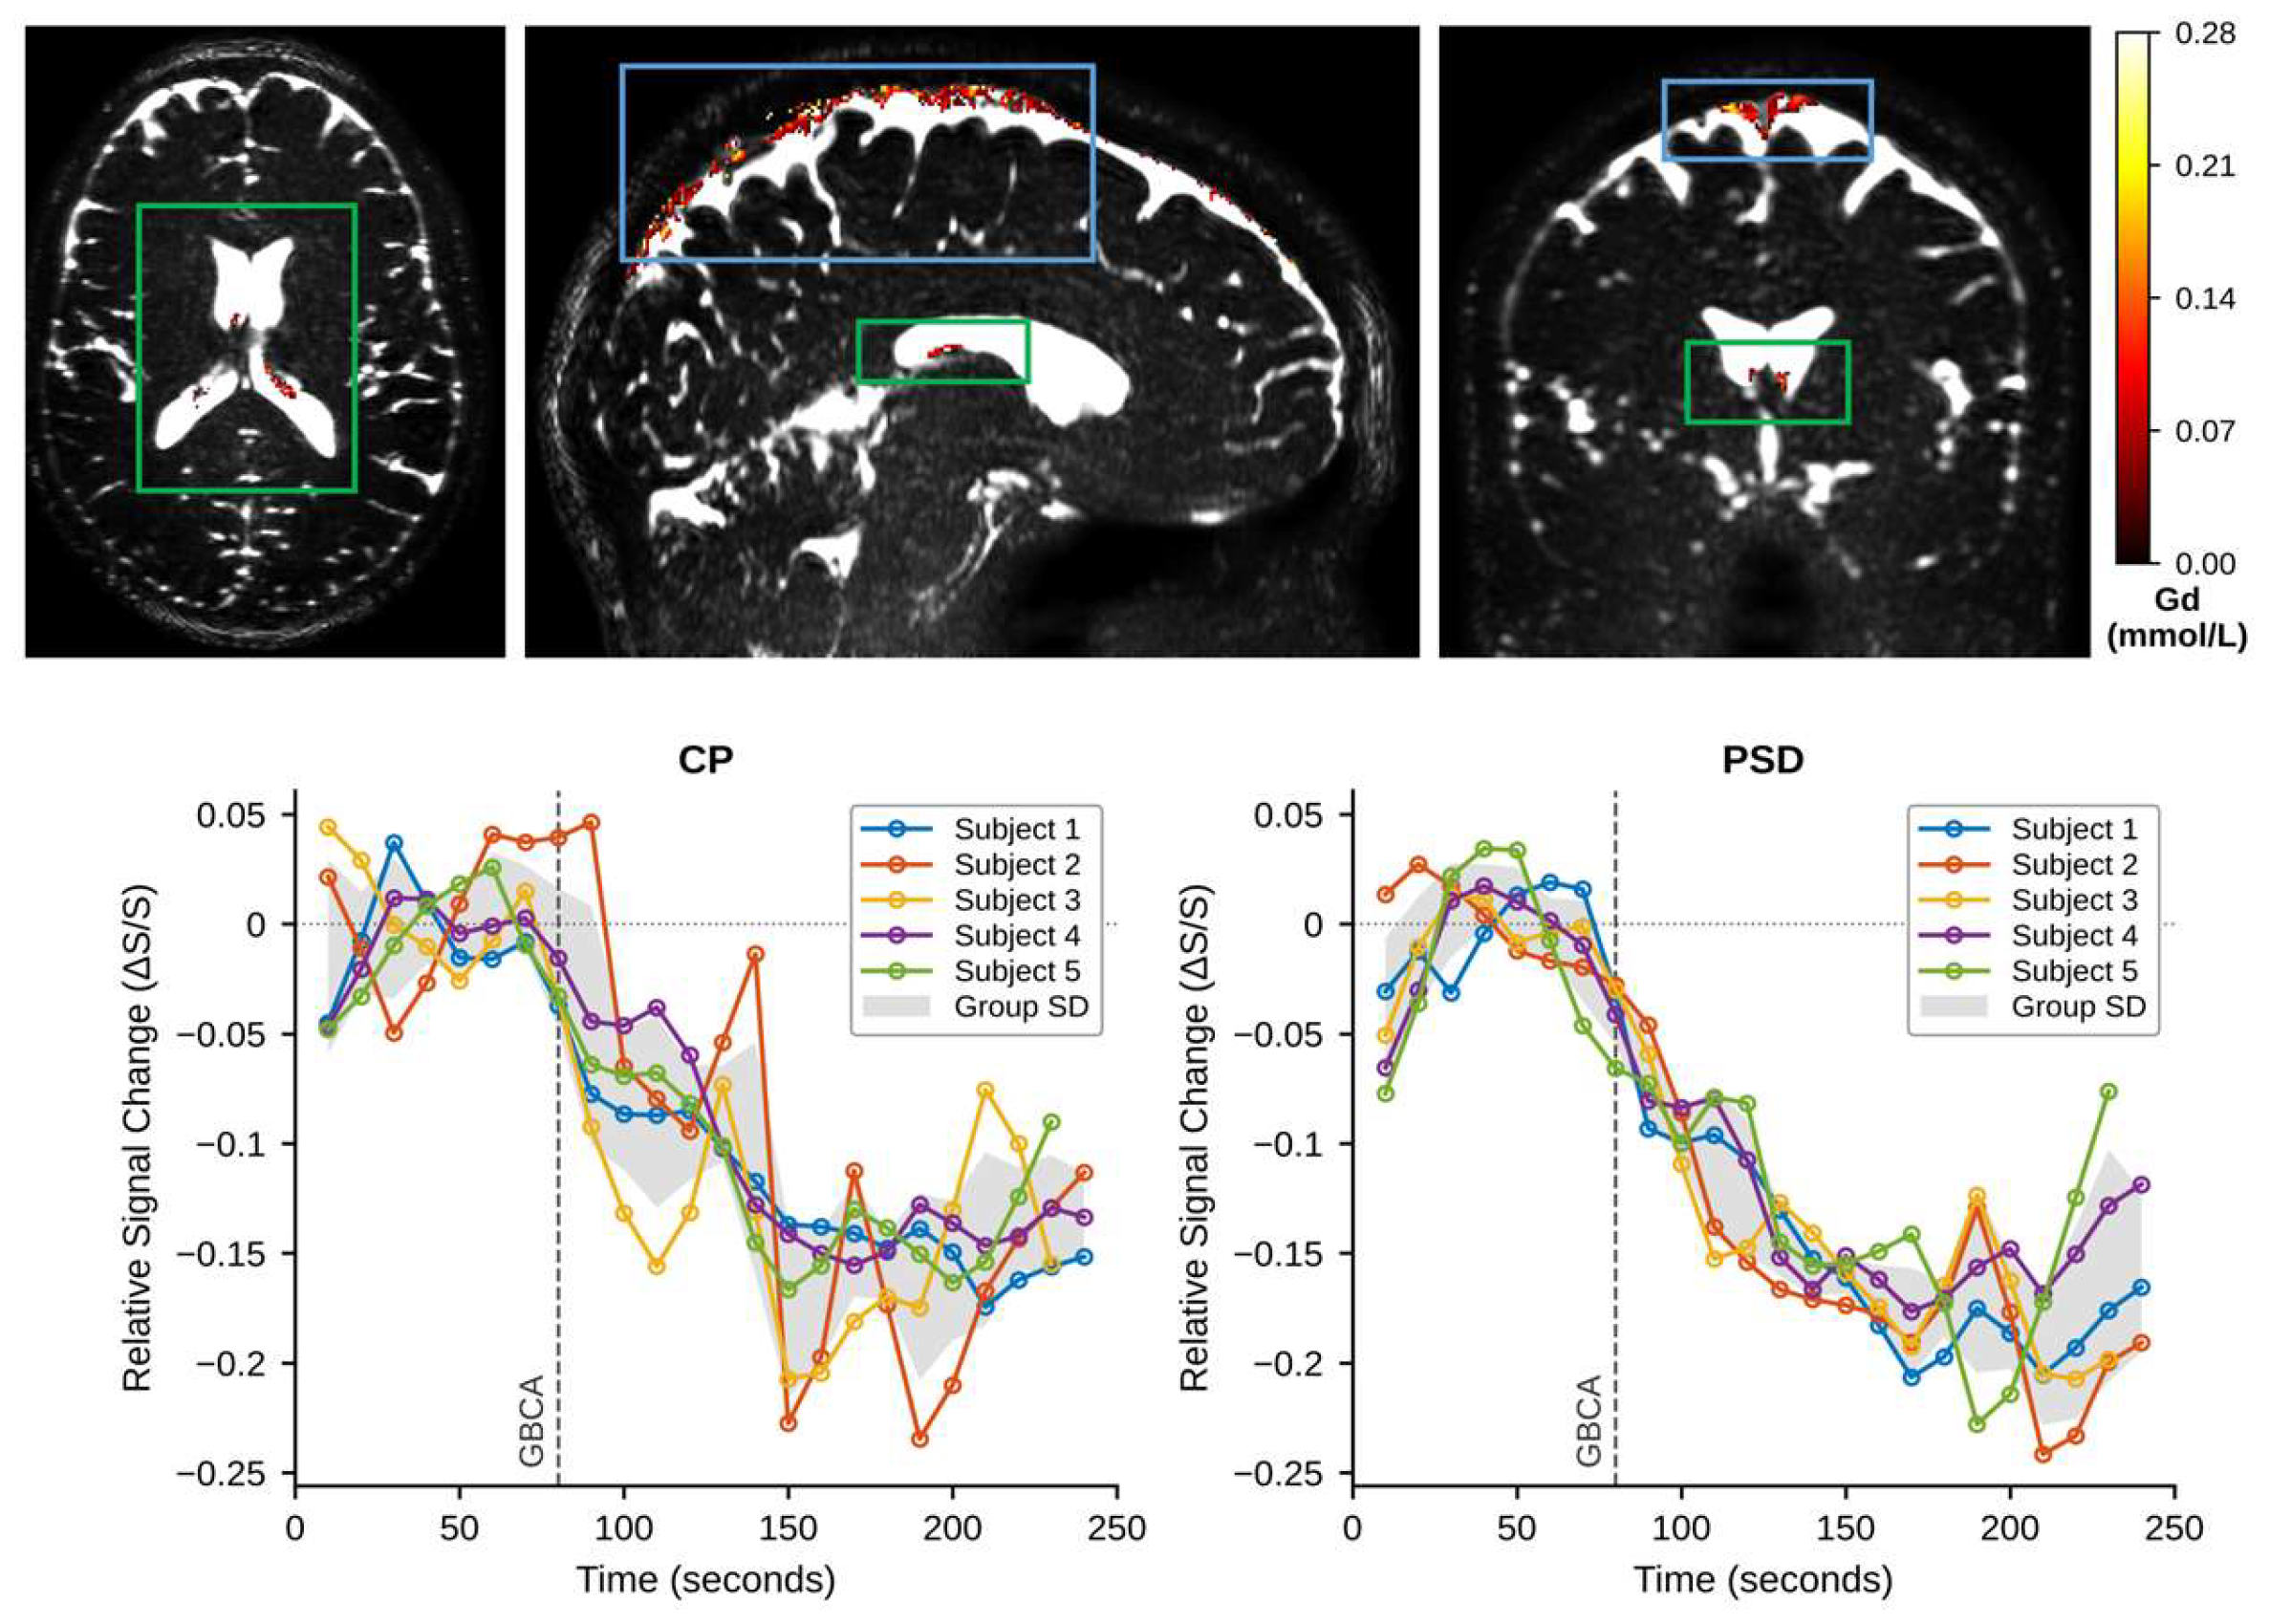
Figure 3 shows representative GBCA concentration maps in the choroid plexus (CP) and parasagittal dura (PSD) obtained from one participant during hypercapnia. GBCA concentration from each region was calculated for each participant. Quantitative results are summarized in Table 1.
Figure 3.
(Top) Representative GBCA concentration ([GBCA], in mmol/L) maps during hypercapnia from one participant (same participant as Figure 2). The manually segmented choroid plexus (CP) and parasagittal dura (PSD) regions are indicated by the green and blue boxes, respectively. The GBCA concentration values for each voxel in the region are overlaid on the cDSC MRI images. The scale bar indicates the range of GBCA concentration. (Bottom) Representative and individual relative signal change (∆S/S)–time curves of the cDSC MRI signal in the CSF around the CP (left) and in the PSD (right) from all participants (n = 5) during hypercapnia. The vertical dashed line indicates the time of GBCA injection. The shaded areas indicate the group standard deviation (SD).
Table 1.
Summary of quantitative results from all participants (n = 5).
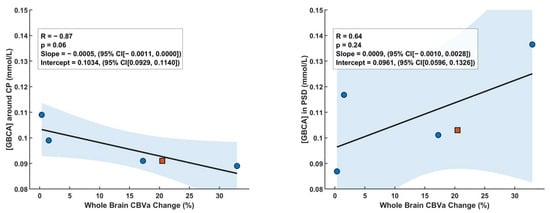
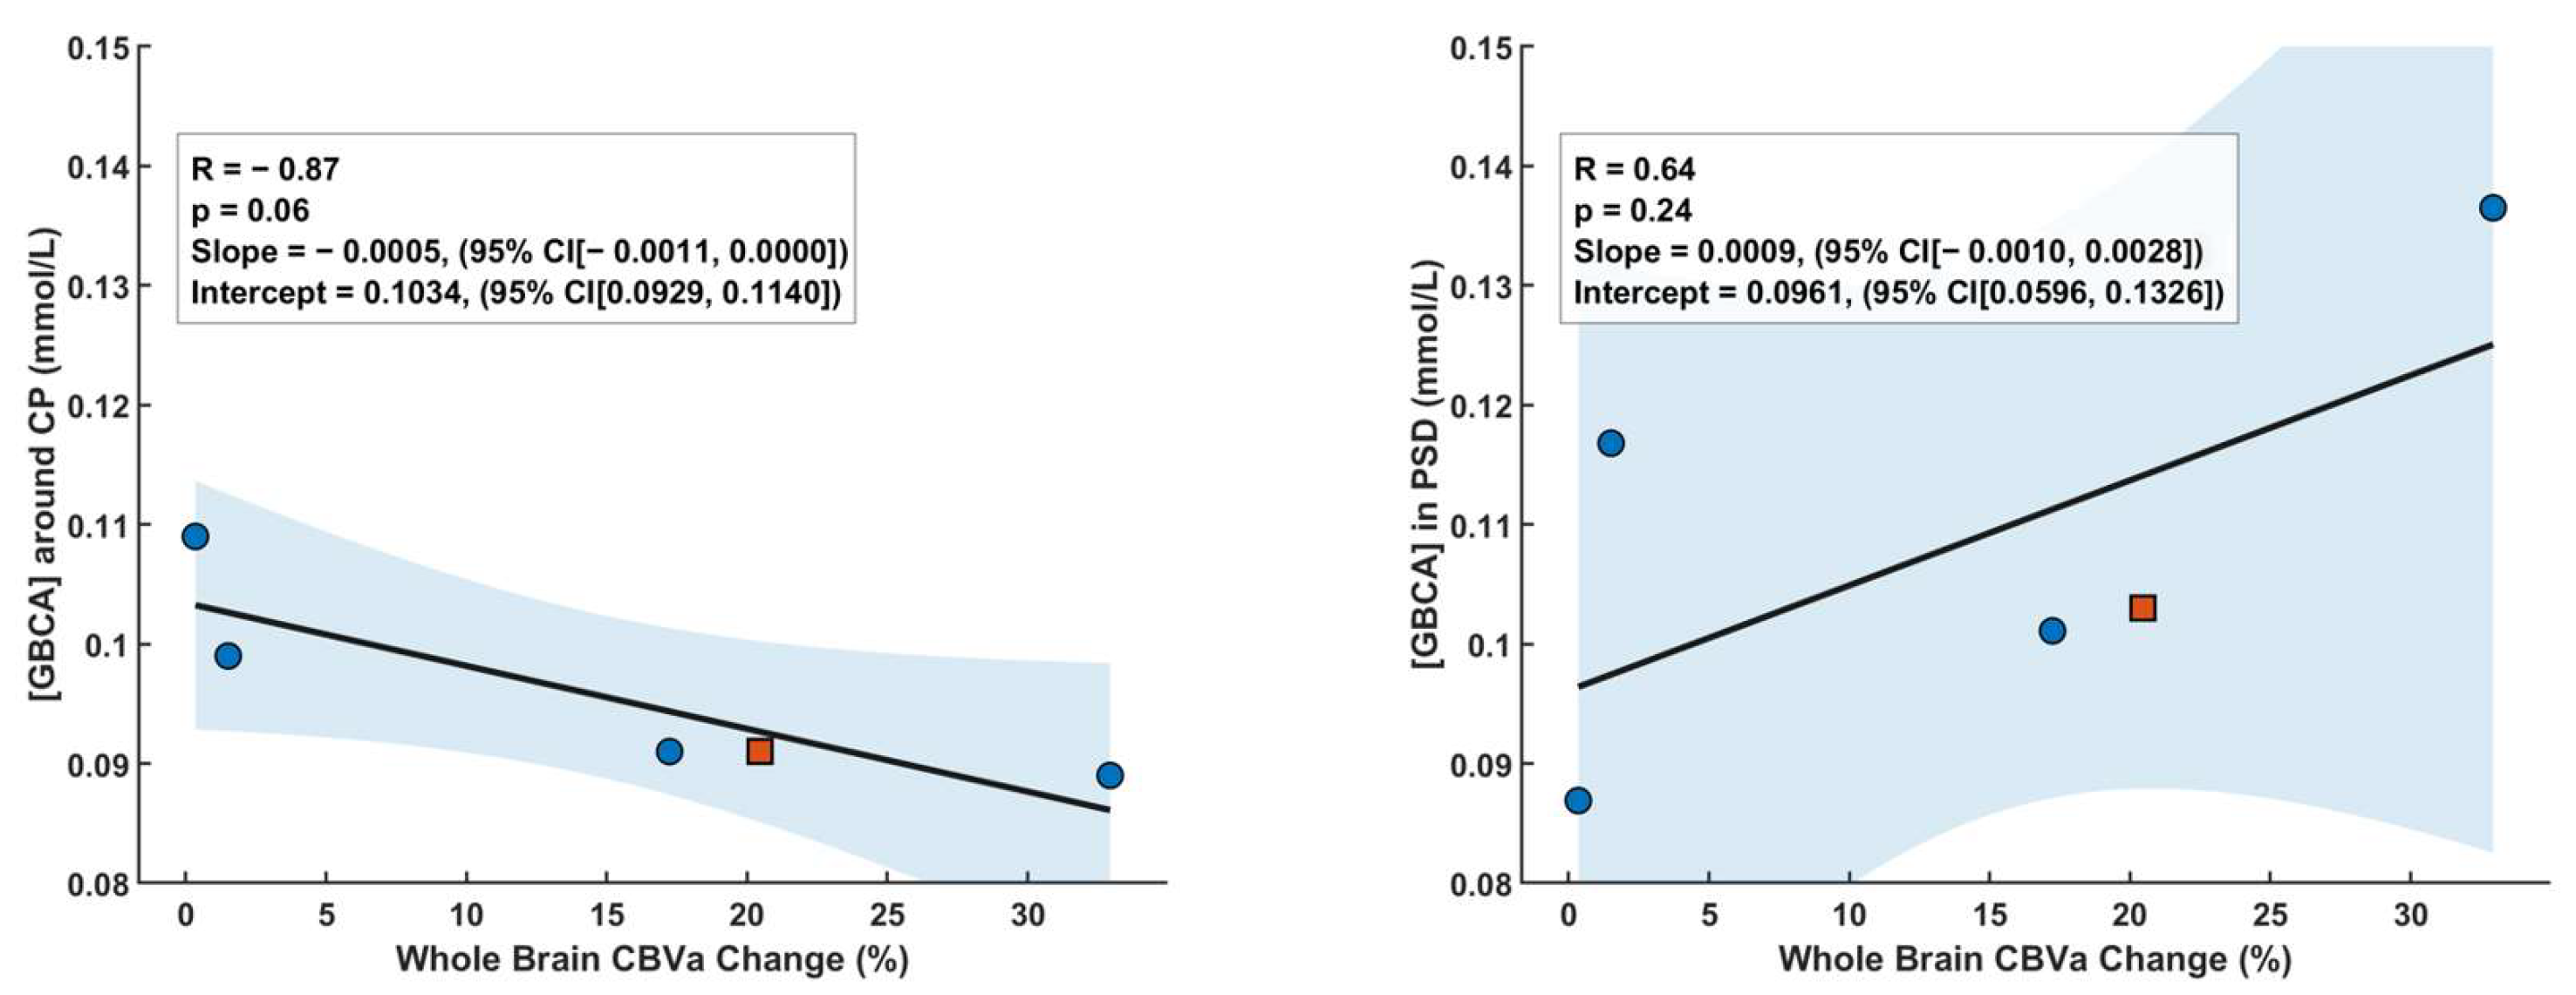
The relationship between vascular reactivity and IV-GBCA distribution in the CSF showed distinct, site-specific patterns at the two ROIs studied (Figure 4).
Figure 4.
Correlation analysis between relative whole-brain CBVa changes during CO2 breathing and the GBCA concentration immediately after IV injection during CO2 in the CSF around the choroid plexus (CP) and parasagittal dura (PSD). The shaded areas indicate the 95% confidence intervals (CI). The red squares indicate the participant shown in Figure 2 and Figure 3. [GBCA] around CP: GBCA concentration in the CSF around the CP in mmol/L; [GBCA] in PSD: GBCA concentration in the PSD in mmol/L.
- Choroid Plexus (CP): The GBCA concentration in the CSF around the CP measured immediately following intravenous administration during hypercapnia exhibited a strong negative correlation with the magnitude of the whole-brain CBVa increase (R = −0.86, p = 0.06, slope = −0.0005 (95% confidence interval: [−0.0011, 0.0000]), intercept = 0.1034 (95% confidence interval: [0.0929, 0.1140])).
- Parasagittal Dura (PSD): In contrast, the pattern was reversed at the PSD. In this region, a moderate positive correlation was observed between the CBVa increase and the GBCA concentration (R = 0.64, p = 0.24, slope = 0.0009 (95% confidence interval: [−0.0010, 0.0028]), intercept = 0.0961 (95% confidence interval: [0.0596, 0.1326])).
4. Discussion
In this exploratory study, we observed a differential association between CVR and IV-GBCA distribution in the CSF across two distinct brain regions. Specifically, participants with higher CVR, and thus greater CO2-driven arterial dilation, exhibited less accumulation of GBCA in the CSF surrounding the choroid plexus. On the other hand, in the regions around the parasagittal dura, higher CVR led to greater IV-GBCA accumulation in the CSF. This differential correlation trend observed at the choroid plexus and parasagittal dura suggests that the coupling between vascular dynamics and neurofluid transport may be spatially heterogeneous. Thus, it may be important to include cerebrovascular measures such as CBF or CBV in neurofluid studies using IV-GBCA-based methods. As IV-GBCAs enter the CSF circulation from the vascular route, changes in IV-GBCA distribution in the CSF may be influenced by the amount of IV-GBCAs delivered by the blood flow.
Interestingly, GBCA concentration in the CSF measured during hypercapnia showed opposite directional changes compared with room air between these two regions. We could not perform cDSC MRI during room air in the current study, as only one dose of GBCA can be administered in each participant. We therefore compared our hypercapnia results with GBCA concentration in the CSF reported in previous studies using the same cDSC MRI method in healthy participants. In the choroid plexus, GBCA concentration in the CSF measured during hypercapnia was substantially greater than that measured during room air (~0.02 mmol/L) [4]. In contrast, in the parasagittal dura, GBCA concentration in the CSF measured during hypercapnia was slightly smaller than that measured during room air (~0.16 mmol/L) [13].
The CBVa changes in response to 5% CO2 inhalation showed substantial inter-subject variation. Previous studies have investigated CBVa changes during hypercapnia induced by brief breath-hold, which is expected to induce a larger vascular response than 5% CO2 inhalation [21]. CBVa increased by approximately 50% in response to breath-hold in healthy subjects, which was greater than the CBVa increase in response to 5% CO2 inhalation in the current study.
The underlying mechanism for the differential correlation trends observed at the two sites is unclear and cannot be inferred directly from our data in this exploratory study. The choroid plexus is considered a primary site for CSF secretion and thus the starting point of CSF circulation according to classical CSF theories. In the parasagittal dura, CSF in the subarachnoid space is connected with perivascular spaces in the brain parenchyma. On the other hand, CSF in the parasagittal dura can drain via the meningeal lymphatic vessels into cervical lymph nodes [18]. Therefore, CP and PSD may represent entry and exit points of the tracer, essentially to and from the CSF circulation, which might contribute to the heterogeneity observed in the results. These physiological differences can contribute to the observed results, but further investigation is warranted to clarify the mechanisms.
It should also be noted that CBVa was measured in this study as an indicator of CVR, while vessel wall compliance, arterial pulsatility and CBF were not measured directly. These parameters, as well as CSF dynamics, can be modulated by other physiological factors such as respiration, vasomotion and blood pressure oscillations, which were not recorded in this study. As both iVASO and cDSC MRI acquire data over time scales much longer than the cardiac and respiratory cycles, the measured CBVa and GBCA concentration reflect time-averaged values over these fluctuations. Future studies combining CVR with direct measures of arterial pulsatility, CBF and physiological recordings would help to separate their contributions.
The scale of this exploratory study is limited by the small cohort size. This is mainly due to logistical challenges in performing these experiments with 5% CO2 inhalation and contrast-enhanced MRI in healthy participants. Thus, the findings should be treated with caution. In addition, participant characteristics such as age and sex can influence cerebral hemodynamics and CVR [22], and may also affect GBCA entry into the CSF. Given the small and heterogeneous cohort in this study, the effects of these factors could not be assessed and may have contributed to the inter-subject variation observed in CBVa changes. Considering typical tolerance to 5% CO2 inhalation in healthy subjects, the CVR and IV-GBCA MRI scans were performed in two separate hypercapnia sessions, which were separated by approximately 10 min. Based on previous studies, this time should allow the restoration of CBVa to baseline, and CBVa changes are highly reproducible in consecutive sessions with identical setup [5].
Additional technical limitations include that only whole-brain CBVa was quantified due to high noise levels in regional estimates, as the CP and PSD are small structures relative to the iVASO resolution. Whole-brain CBVa change was therefore used as a surrogate for the vascular response at these sites. As hypercapnia is a global vasodilatory stimulus that raises arterial CO2 throughout the cerebral circulation, whole-brain CBVa change reflects the overall vascular responsiveness of each participant, which is likely to be associated with the response in the vessels supplying the CP and PSD. Nevertheless, this may lead to an oversimplification that does not homogeneously translate to regional hemodynamics at the specific sites of interest. In addition, EtCO2 was not recorded, so intersubject differences in the EtCO2 response to 5% CO2 inhalation may have contributed to the variation in CBVa changes. Finally, delayed GBCA enhancement was not acquired because of logistical constraints. Therefore, the current results only capture IV-GBCA distribution in the CSF immediately after injection, but not CSF clearance of IV-GBCA. Subsequent studies with larger cohorts, improved regional CBVa quantification, and longitudinal designs to capture clearance dynamics are necessary to validate and extend these findings.
5. Conclusions
This exploratory study demonstrates that CO2-induced vascular reactivity exhibited a region-dependent relationship with CSF circulation and distribution. These findings emphasize the importance of incorporating cerebrovascular measurements into neurofluids studies that use IV-GBCA-based methods, particularly in the context of neurological diseases that may alter cerebrovascular integrity and function.
Author Contributions
Conceptualization, J.H. and H.L.; methodology, J.V., Y.S., Y.L., C.X., C.G., A.G.P., H.L. and J.H.; software, J.V., Y.S., Y.L., C.G. and J.H.; validation, J.V., Y.S. and J.H.; formal analysis, J.V., Y.S., Y.L., C.G. and J.H.; investigation, J.V., Y.S., Y.L., C.G. and J.H.; resources, J.H. and H.L.; data curation, J.V., Y.S., Y.L., C.G. and J.H.; writing—original draft preparation, J.V., Y.S. and J.H.; writing—review and editing, J.V., Y.S., Y.L., C.X., C.G., A.G.P., H.L. and J.H.; visualization, J.V., Y.S. and J.H.; supervision, J.H.; project administration, J.H.; funding acquisition, J.H. and H.L. All authors have read and agreed to the published version of the manuscript.
Funding
This study was supported by the National Institutes of Health through grants from the NINDS (1R01NS108452 and 1R01NS120879), the NIA (5R01AG064093, 1RF1AG082257, R01AG085299, R01AG071515, and R01AG091312), the NIBIB (P41 EB031771), the NICHD (U54 HD079123), and S10OD021648.
Institutional Review Board Statement
The study was conducted in accordance with the Declaration of Helsinki and approved by the Johns Hopkins Institutional Review Board (IRB00178297, approved on 31 July 2018).
Informed Consent Statement
Informed consent was obtained from all subjects involved in the study. All participants provided written informed consent.
Data Availability Statement
The datasets generated and/or analyzed during the current study are available from the corresponding author upon reasonable request. Data are not publicly available due to privacy and institutional restrictions.
Acknowledgments
The authors would like to thank Joseph S. Gillen, Terri Lee Brawner, Kathleen A. Kahl, and Ivana Kusevic for experimental assistance.
Conflicts of Interest
The authors declare no conflicts of interest.
Abbreviations
The following abbreviations are used in this manuscript:
| IV-GBCA | Intravenous gadolinium-based contrast agents |
| CSF | Cerebrospinal fluid |
| CP | Choroid plexus |
| PSD | Parasagittal dura |
| CVR | Cerebrovascular reactivity |
| CBVa | Arterial cerebral blood volume |
| cDSC | Dynamic susceptibility contrast in the CSF |
| iVASO | Inflow-based vascular-space-occupancy |
| BBB | Blood–brain barrier |
| BCSFB | Blood–CSF barrier |
| ROI | Regions of interest |
| TR | Repetition time |
| TI | Inversion time |
| TE | Echo time |
| MPRAGE | Magnetization prepared rapid gradient-echo |
| FLAIR | Fluid-attenuated inversion recovery |
| CO2 | Carbon dioxide |
| O2 | Oxygen |
| N2 | Nitrogen |
| TSE | Turbo Spin Echo |
References
- Wang, D.J.; Hua, J.; Cao, D.; Ho, M.-L. Neurofluids and the Glymphatic System: Anatomy, Physiology, and Imaging. Br. J. Radiol. 2023, 96, 20230016. [Google Scholar] [CrossRef] [Scilit]
- Yu, L.; Hu, X.; Li, H.; Zhao, Y. Perivascular Spaces, Glymphatic System and MR. Front. Neurol. 2022, 13, 844938. [Google Scholar] [CrossRef] [Scilit]
- van Osch, M.J.P.; Wåhlin, A.; Scheyhing, P.; Mossige, I.; Hirschler, L.; Eklund, A.; Mogensen, K.; Gomolka, R.; Radbruch, A.; Qvarlander, S.; et al. Human Brain Clearance Imaging: Pathways Taken by Magnetic Resonance Imaging Contrast Agents after Administration in Cerebrospinal Fluid and Blood. NMR Biomed. 2024, 37, e5159. [Google Scholar] [CrossRef] [Scilit]
- Sun, Y.; Cao, D.; Pillai, J.J.; Paez, A.; Li, Y.; Gu, C.; Pogson, J.M.; Knutsson, L.; Barker, P.B.; van Zijl, P.C.M.; et al. Rapid Imaging of Intravenous Gadolinium-Based Contrast Agent (GBCA) Entering Ventricular Cerebrospinal Fluid (CSF) Through the Choroid Plexus in Healthy Human Subjects. Fluids Barriers CNS 2024, 21, 72. [Google Scholar] [CrossRef] [Scilit]
- Liu, P.; De Vis, J.; Lu, H. Cerebrovascular Reactivity (CVR) MRI with CO2 Challenge: A Technical Review. NeuroImage 2019, 187, 104–115. [Google Scholar] [CrossRef] [Scilit]
- Ryman, S.G.; Vakhtin, A.A.; Mayer, A.R.; van der Horn, H.J.; Shaff, N.A.; Nitschke, S.R.; Julio, K.R.; Tarawneh, R.M.; Rosenberg, G.A.; Diaz, S.V.; et al. Abnormal Cerebrovascular Activity, Perfusion, and Glymphatic Clearance in Lewy Body Diseases. Mov. Disord. 2024, 39, 1258–1268. [Google Scholar] [CrossRef] [Scilit]
- Levendovszky, S.R.; Flores, J.; Peskind, E.R.; Václavu, L.; van Osch, M.J.P.; Iliff, J. Preliminary Cross-Sectional Investigations into the Human Glymphatic System Using Multiple Novel Non-Contrast MRI Methods. bioRxiv 2023. [Google Scholar] [CrossRef] [Scilit]
- Hua, J.; Sun, Y.; Li, Y.; Zhou, X.; Bian, Y.; Paez, A.; Meyer, B.; Rane Levendovszky, S. Technical Considerations for Using Intravenous Gadolinium-Based Contrast Agent (GBCA)-Based MRI Approaches to Study Cerebrospinal Fluid (CSF) Circulation and Clearance. NeuroImage 2025, 312, 121239. [Google Scholar] [CrossRef] [Scilit]
- Li, J.; Liu, X.; Bo, B.; Pei, M.; Zhang, K.; Tong, C.; Jing, M.; Zhang, S.; Li, Y.; Cang, J.; et al. Glymphatic Influx Is Negatively Correlated with Cerebral Blood Volume in Male Mice. Cell Rep. 2026, 45, 117182. [Google Scholar] [CrossRef] [Scilit]
- Nair, V.V.; Diorio, T.C.; Wen, Q.; Rayz, V.L.; Tong, Y. Using Respiratory Challenges to Modulate CSF Movement Across Different Physiological Pathways: An fMRI Study. Imaging Neurosci. 2024, 2, imag_a_00192. [Google Scholar] [CrossRef] [Scilit]
- Nair, V.V.; Wright, A.M.; Xu, T.; Foster, E.; Zhou, X.; Tong, Y.; Wen, Q. Effect of Brief Rest on Hemodynamics and CSF Oscillations Across Age. NeuroImage 2025, 321, 121531. [Google Scholar] [CrossRef] [Scilit]
- Gu, C.; Li, Y.; Cao, D.; Miao, X.; Paez, A.G.; Sun, Y.; Cai, J.; Li, W.; Li, X.; Pillai, J.J.; et al. On the Optimization of 3D Inflow-Based Vascular-Space-Occupancy (iVASO) MRI for the Quantification of Arterial Cerebral Blood Volume (CBVa). Magn. Reson. Med. 2024, 91, 1893–1907. [Google Scholar] [CrossRef] [Scilit]
- Cao, D.; Kang, N.; Pillai, J.J.; Miao, X.; Paez, A.; Xu, X.; Xu, J.; Li, X.; Qin, Q.; Van Zijl, P.C.M.; et al. Fast Whole Brain MR Imaging of Dynamic Susceptibility Contrast Changes in the Cerebrospinal Fluid (cDSC MRI). Magn. Reson. Med. 2020, 84, 3256–3270. [Google Scholar] [CrossRef] [Scilit]
- Hua, J.; Qin, Q.; Pekar, J.J.; van Zijl, P.C.M. Measurement of Absolute Arterial Cerebral Blood Volume in Human Brain without Using a Contrast Agent. NMR Biomed. 2011, 24, 1313–1325. [Google Scholar] [CrossRef] [Scilit]
- Liu, H.; Zhang, C.; Xu, J.; Jin, J.; Cheng, L.; Miao, X.; Wu, Q.; Wei, Z.; Liu, P.; Lu, H.; et al. Huntingtin Silencing Delays Onset and Slows Progression of Huntington’s Disease: A Biomarker Study. Brain 2021, 144, 3101–3113. [Google Scholar] [CrossRef] [Scilit]
- Zhou, X.; García Del Barrio Cervera, S.; Sun, Y.; Li, Y.; Li, W.; Pacheco-Luna, L.; Sair, H.I.; Paez, A.; Knutsson, L.; van Zijl, P.C.M.; et al. Imaging the Distribution and Drainage of Fluid in the Human Olfactory Regions Using Intravenous Gadolinium-Based Contrast Agents (GBCA)-Enhanced MRI. Fluids Barriers CNS 2025, 22, 101. [Google Scholar] [CrossRef] [Scilit]
- Li, Y.; Sun, Y.; Paez, A.; Xu, G.; Pillai, J.J.; Iliff, J.J.; Ganji, S.K.; Knutsson, L.; van Zijl, P.C.M.; Kamson, D.O.; et al. Dynamic MRI of Fluid and Solute Transportation across the Arachnoid Barrier in the Human Meninges. Radiology 2026, 318, e252393. [Google Scholar] [CrossRef] [Scilit]
- Ringstad, G.; Eide, P.K. Cerebrospinal Fluid Tracer Efflux to Parasagittal Dura in Humans. Nat. Commun. 2020, 11, 354. [Google Scholar] [CrossRef] [Scilit]
- Hua, J.; Liu, P.; Kim, T.; Donahue, M.; Rane, S.; Chen, J.J.; Qin, Q.; Kim, S.-G. MRI Techniques to Measure Arterial and Venous Cerebral Blood Volume. NeuroImage 2019, 187, 17–31. [Google Scholar] [CrossRef] [Scilit]
- Rohrer, M.; Bauer, H.; Mintorovitch, J.; Requardt, M.; Weinmann, H.-J. Comparison of Magnetic Properties of MRI Contrast Media Solutions at Different Magnetic Field Strengths. Investig. Radiol. 2005, 40, 715–724. [Google Scholar] [CrossRef] [Scilit]
- Hua, J.; Stevens, R.D.; Huang, A.J.; Pekar, J.J.; van Zijl, P.C.M. Physiological Origin for the BOLD Poststimulus Undershoot in Human Brain: Vascular Compliance versus Oxygen Metabolism. J. Cereb. Blood Flow Metab. 2011, 31, 1599–1611. [Google Scholar] [CrossRef] [Scilit]
- Lu, H.; Xu, F.; Rodrigue, K.M.; Kennedy, K.M.; Cheng, Y.; Flicker, B.; Hebrank, A.C.; Uh, J.; Park, D.C. Alterations in Cerebral Metabolic Rate and Blood Supply across the Adult Lifespan. Cereb. Cortex 2011, 31, 1426–1434. [Google Scholar] [CrossRef] [Scilit]

Disclaimer/Publisher’s Note: The statements, opinions and data contained in all publications are solely those of the individual author(s) and contributor(s) and not of MDPI and/or the editor(s). MDPI and/or the editor(s) disclaim responsibility for any injury to people or property resulting from any ideas, methods, instructions or products referred to in the content. |
© 2026 by the authors. Licensee MDPI, Basel, Switzerland. This article is an open access article distributed under the terms and conditions of the Creative Commons Attribution (CC BY) license.