


Summary
Sleep has traditionally been monitored by electrophysiological means such as electroencephalography. Nuclear medicine tracer methods such as SPECT and PET have previously been used to successfully assess changes in cerebral blood flow and metabolism occurring during sleep and provide little spatial resolution. These have only been able to document a short period of time. Functional Magnetic Resonance Imaging (fMRI) has established itself as the method of choice for non-invasive imaging of brain functions and can now also be performed with continuous EEG recording. Technical problems had to be resolved before fMRI could be applied to sleep successfully: indeed patient motion and scanner noise were major parts of these concerns. However, with optimisation of fMRI technology a few reports concerning the use of fMRI in sleep have surfaced recently. One approach has been to use a silent MR sequence (BURST) which provides robust fMRI data with a BOLD signal. We found occipital activation and frontal deactivation during REM sleep. Thus fMRI now seems to be applicable to sleep also which should provide sleep researchers with a new method for investigation in vivo of sleep physiology and pathology.The question of data evaluation still needs to be elucidated, however.
Introduction
Sleep is traditionally assessed and staged with electrophysiological recording techniques such as polysomnographic studies. Functional imaging of sleep has until now mostly been done with nuclear medicine tracer methods. At first cerebral blood flow and metabolism was measured with a Xenon technique which was purely planimetric and provided in non-tomographic maps of blood flow. Later tomographic tracer methods were developed which provided multiplanar axial slices, such as Single Photon Emission Computed Tomography (SPECT) or Positron Emission Tomography (PET).Animal studies have shown a 30% decrease in metabolic rate during stages 2 to 4 of sleep [1]. Also, the brain circulation and metabolic rate during sleep is well studied [2]. Functional imaging with magnetic resonance methods is a new development which has increasingly been applied to neuroscience research. At first fMRI studies were performed with exogenous contrast material but nowadays most fMRI studies rely on the BOLD method. Using strong stimuli, it was possible to demonstrate areas of cortical activity due to local changes in blood oxygenation levels [3,4]. While the PET and SPECT experiments have shown brain metabolism in sleep [5,6,7,8,9,10,11,12,13,14,15,16,17], sleep research has until now benefited relatively little from fMRI due to technological problems but these have now been partially resolved. The potential applications for these new research methods go well beyond gathering basic knowledge about cerebral functions underlying sleep physiology but may also be applicable to study sleep disorders (hypersomnia) as well as monitor and understand the mechanisms of sleep pharmaceuticals.
Xenon technique
Sakai et al. [5] found that during stage-1–2 sleep the fast flow values declined significantly, more in the brainstem-cerebellar (BSC) regions than in the hemispheric regions. During stage-3–4 sleep, fast flow values further declined diffusely in both hemispheric (–28%) and brainstem-cerebellar (–29%) regions. During awakening from stage-4 sleep to alpha-frequency wakefulness, BSC flow values increased more than hemispheric flow values. During REM sleep, regional fast flow values increased diffusely in both hemispheric (+41%) and brainstem-cerebellar (+47%) regions compared with wakefulness.There was a significant inverse correlation between the increase in endtidal partial pressure for carbon dioxide and the reduction in bihemispheric fast flow during sleep. Cerebral vasomotor responsiveness to carbon dioxide is decreased during both REM and non-REM sleep. Madsen et al. found a modest but significant decrease of 5% CMRO2 during stage-2 sleep [6]. They had previously found that during deep sleep (stages 3–4), CMRO2 was decreased by 25% and that during REM sleep CMRO2 was practically the same as in the awake state [7].
SPECT
Madsen et al. found that during REM sleep cerebral blood flow increased by 4% (p less than 0.01) in the associative visual area, while it decreased by 9% (p less than 0.01) in the inferior frontal cortex [8,9].
Positron emission tomography
Most positron emission tomography studies have been reviewed by Maquet [10].
Buchsbaum et al. [11] reported a series of subjects investigated with PET and found that in comparison to waking controls, subjects given Fluoro-Deoxy-Glucose (FDG) during non-rapid eye movement (NREM) sleep (primarily stages 2 and 3) showed about a 23% reduction in metabolic rate across the entire brain.This decrease was greater for the frontal than temporal or occipital lobes, and greater for basal ganglia and thalamus than cortex. Subjects in rapid eye movement (REM) sleep tended to have higher cortical metabolic rates than waking subjects. However, the cingulate gyrus was the only cortical structure to show a significant increase in glucose metabolic rate in REM sleep in comparison to waking. The basal ganglia (mainly the caudate and putamen) were relatively more active on the right in REM sleep and symmetrical in NREM sleep [11].
Using PET, Maquet et al. demonstrated a decrease in glucose consumption during slow-wave sleep over all brain regions, affecting the thalamic nuclei the most [12]. Furthermore, during slowwave sleep they found that regional cerebral blood flow decreased in slow-wave sleep in dorsal pons and mesencephalon, thalami, basal ganglia, basal forebrain/hypothalamus, orbitofrontal cortex, anterior cingulate cortex, precuneus and, on the right side, in a region that follows the medial aspect of the temporal lobe as well as in the orbitofrontal cortex [13]. In REM sleep they reported cerebral glucose utilisation to be close to that present in wakefulness [14]. Also they demonstrated that regional cerebral blood flow is positively correlated with REM sleep in pontine tegmentum, left thalamus, both amygdaloid complexes, anterior cingulate cortex and right parietal operculum. Negative correlations between regional cerebral blood flow and REM sleep are observed bilaterally, in a vast area of dorsolateral prefrontal cortex, in parietal cortex (supramarginal gyrus) as well as in posterior cingulate cortex and precuneus [15].
Braun et al. [16] found that REM sleep was associated with selective activation of extrastriate visual cortices, particularly within the ventral processing stream, and an unexpected attenuation of activity in the primary visual cortex; increases in regional cerebral blood flow in extrastriate areas were significantly correlated with decreases in the striate cortex. Extrastriate activity was also associated with concomitant activation of limbic and paralimbic regions, but with a marked reduction of activity in frontal association areas including lateral orbital and dorsolateral prefrontal cortices.
Kjaer et al. [17] found that during sleep there was a relative flow increase in the occipital lobes and a relative flow decrease in the bilateral cerebellum, the bilateral posterior parietal cortex, the right premotor cortex and the left thalamus. Hypnagogic experiences seemed not to be associated with any relative flow changes. The topography of the occipital activation during stage-1 sleep supports a hypothesis of this state being a state of imagery. The regional cerebral blood flow decreases in premotor cortex, thalamus and cerebellum could be indicative of a general decline in preparedness for goal directed action during stage-1 sleep. Stage-1 sleep seems more similar to other forms of altered awareness, for example, relaxation meditation, than to deeper sleep stages.
Functional magnetic resonance imaging of sleep
Functional magnetic resonance imaging is establishing itself as a reliable way to assess brain function non-invasively, mainly due to its sensibility
Figure 1.
BURST fMRI images acquired during REM sleep in a volunteer: the raw T2* image shows no activation, but the subtraction images on the left and right show hyperintensities corresponding to activity in the occipital regions bilaterally.
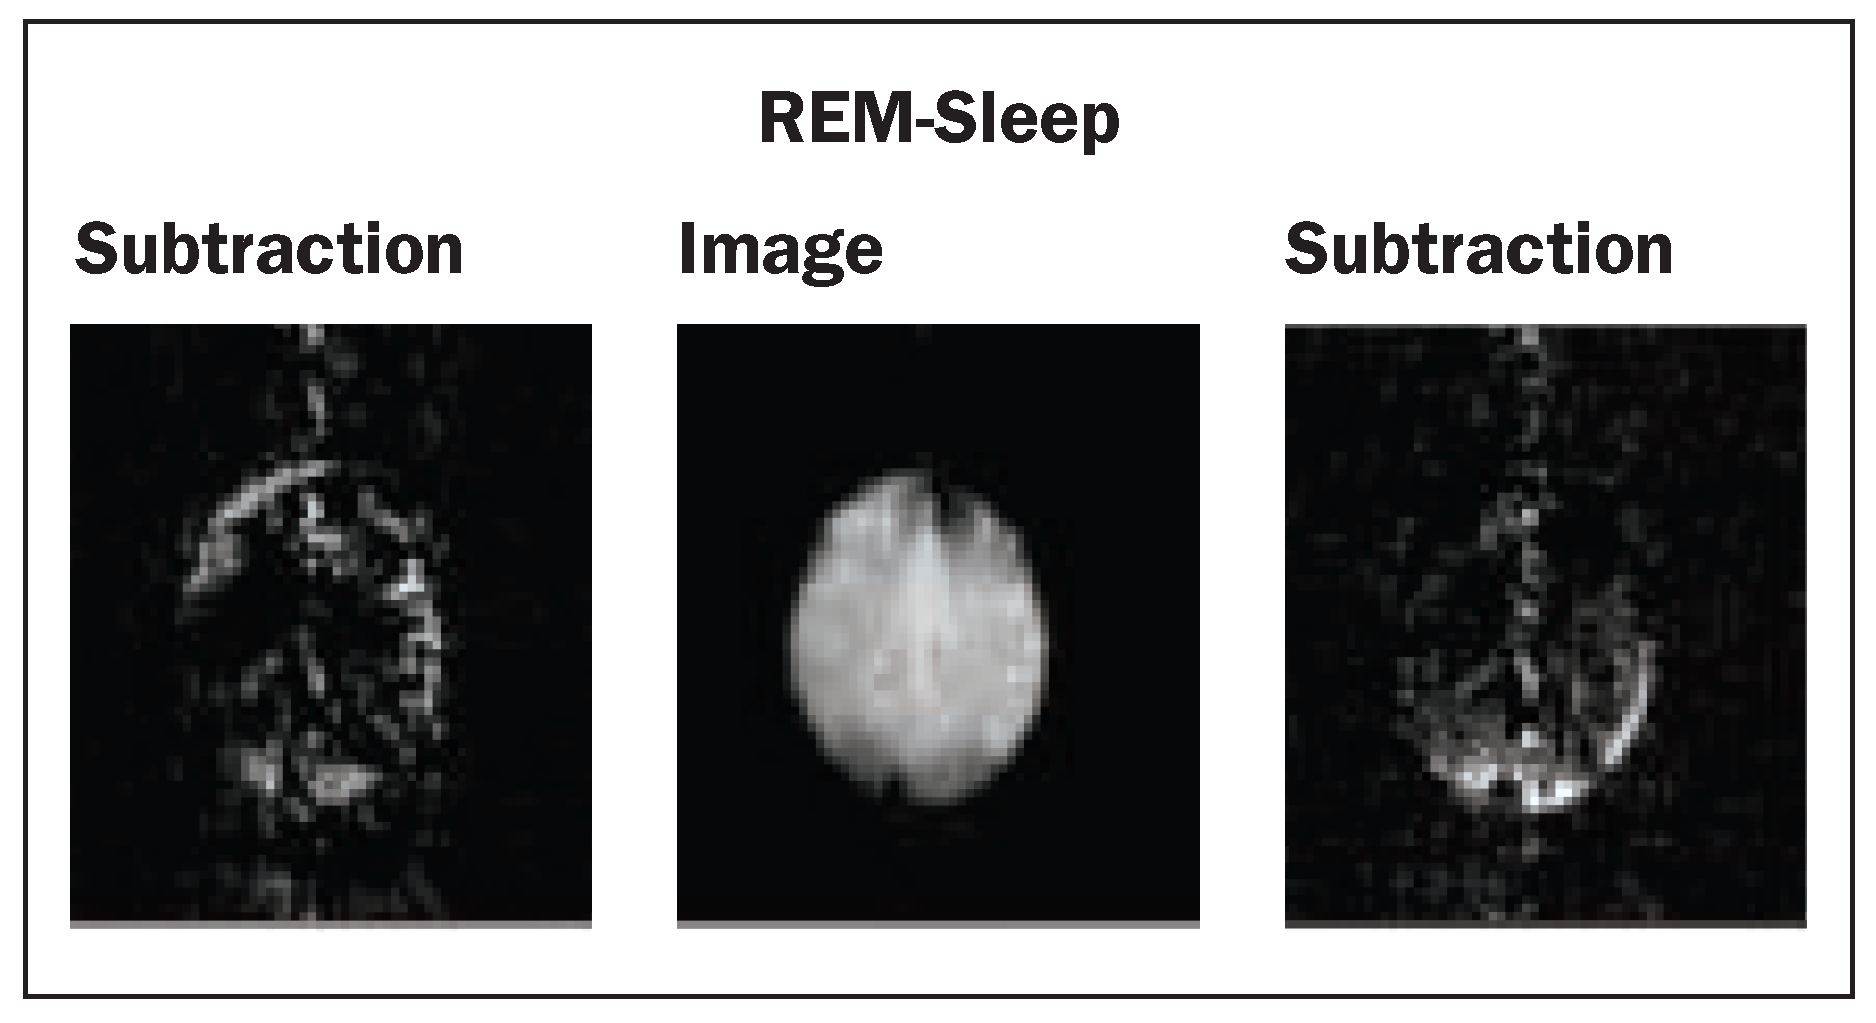
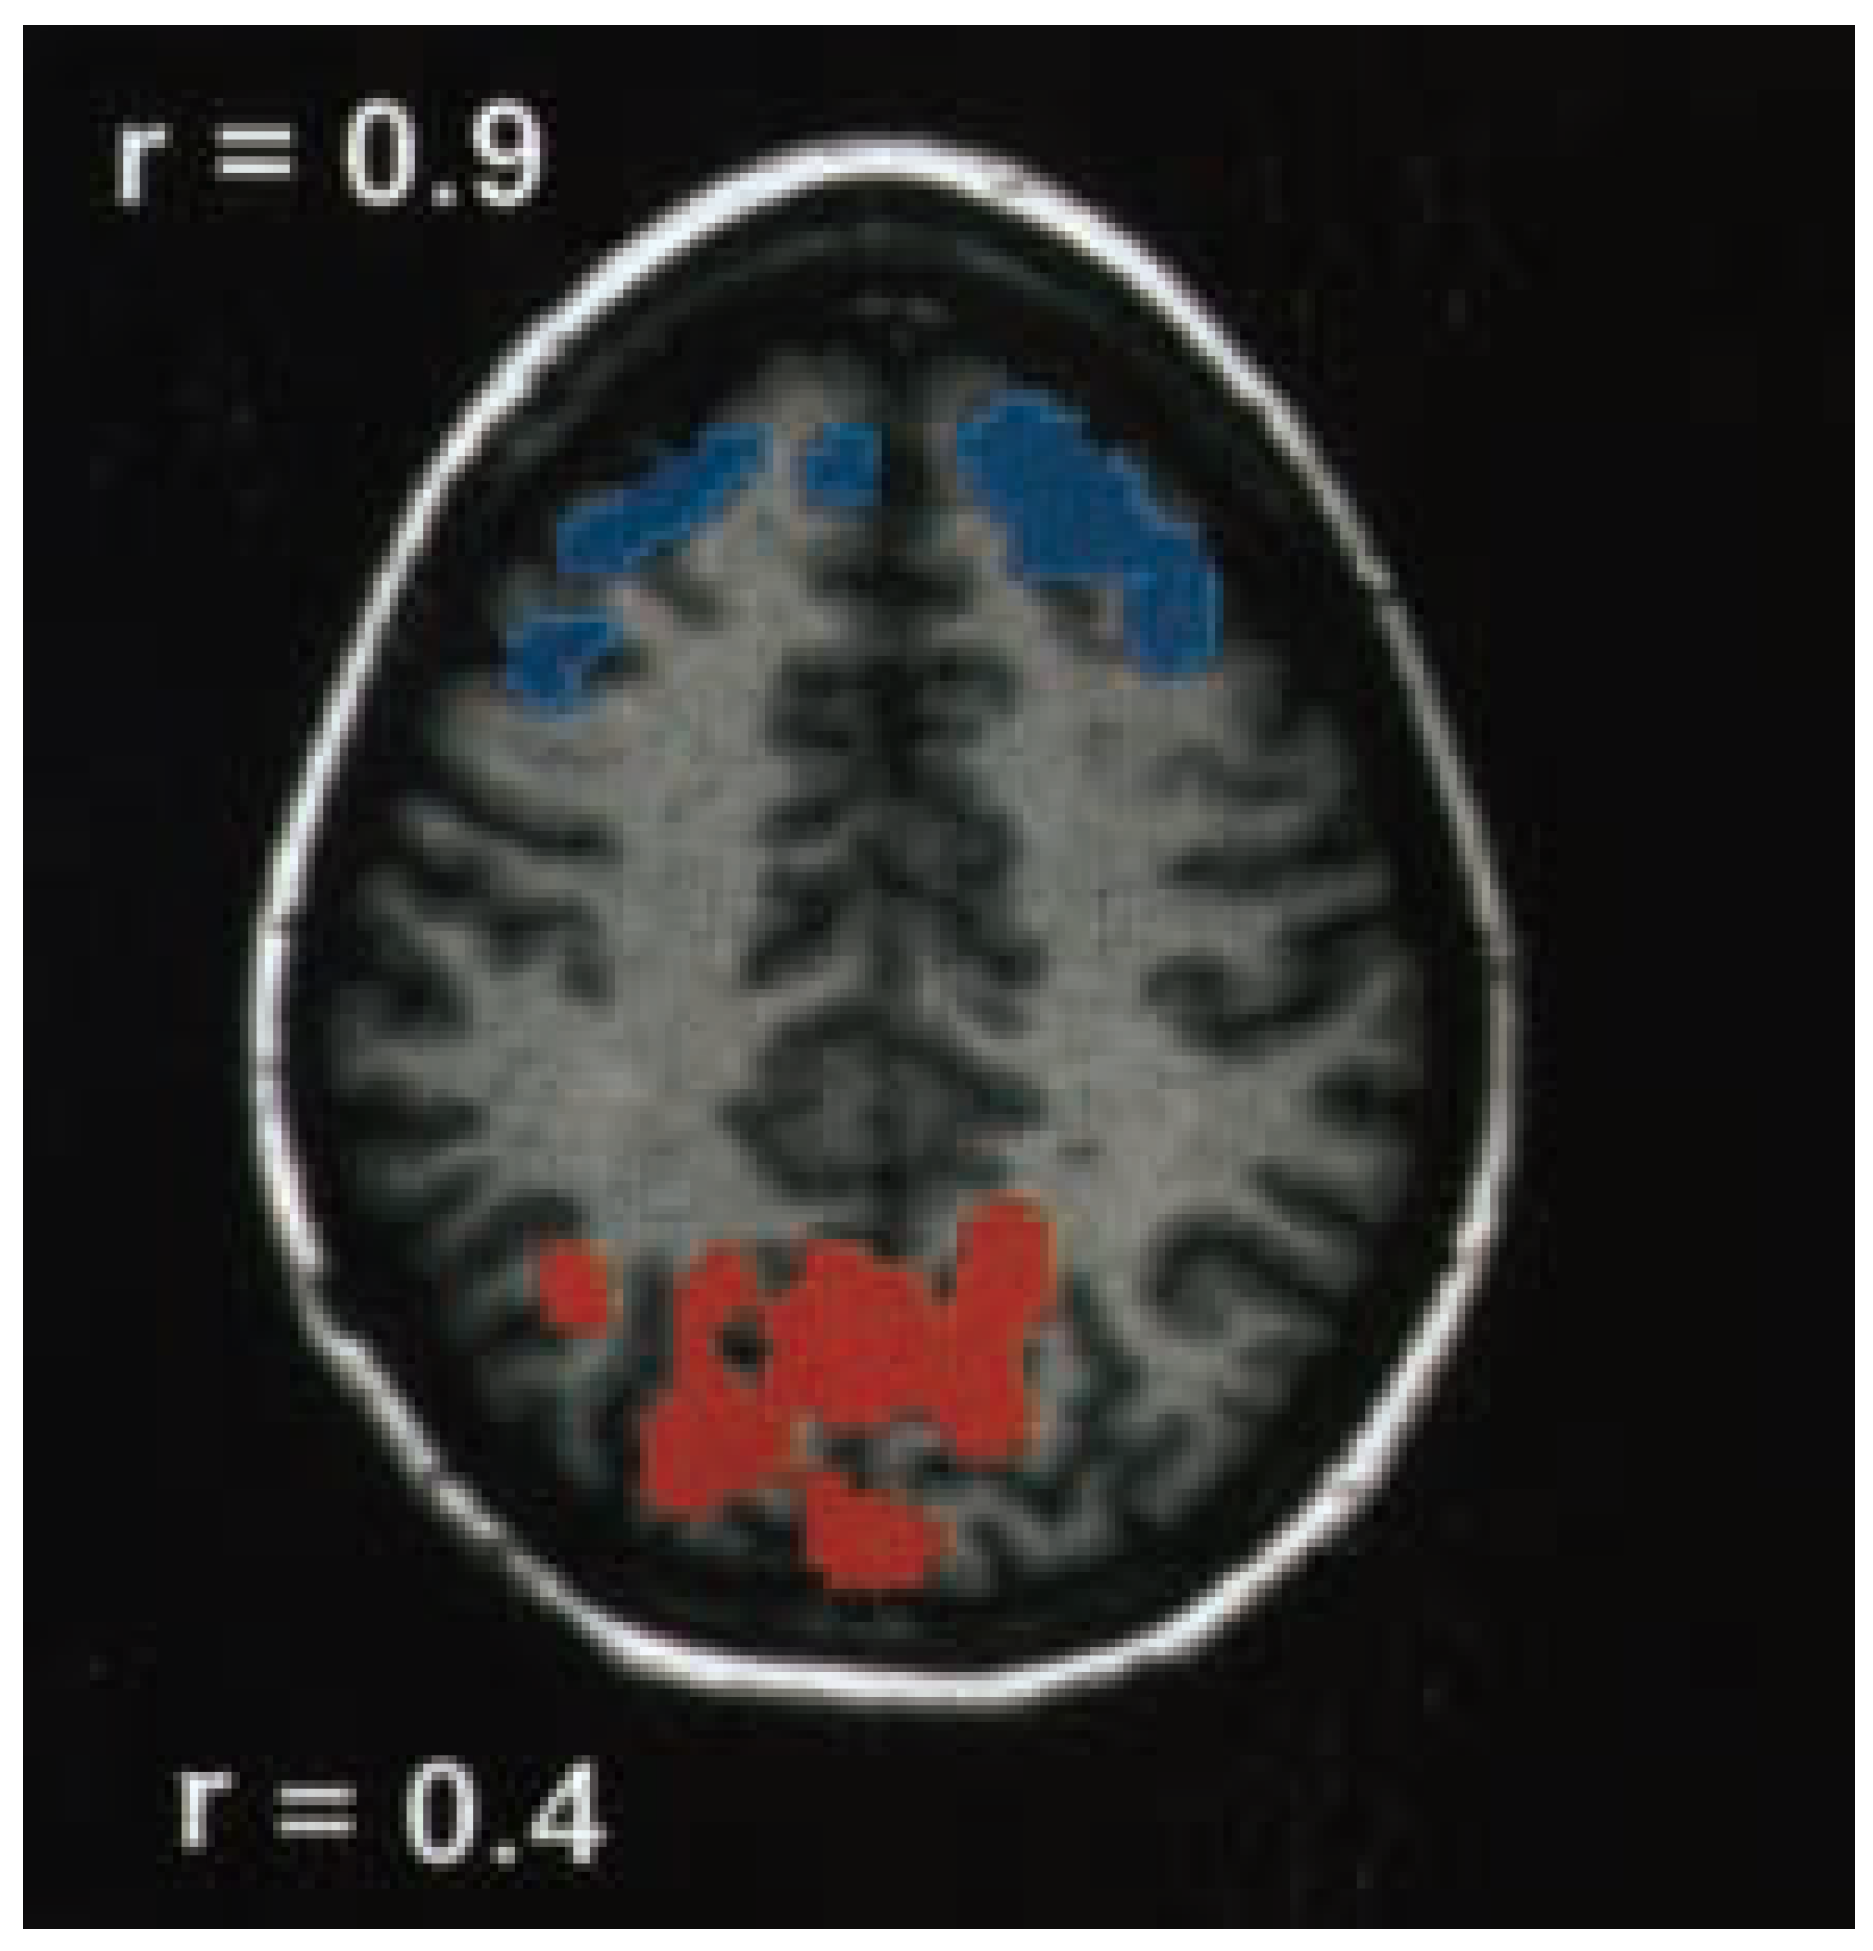
Figure 2.
Postprocessed BURST fMRI experiment (modified from Lövblad et al., [25]): there is activation in the occipital lobes seen in red and deactivation seen in blue in the frontal lobes.
to changes in blood oxygenation associated with activation: first experiments using BOLD contrast were applied to the visual cortex [3,4]. Functional MR imaging was able to enter the clinical arena due to the development of echo-planar imaging where images were obtainable in the fraction of a second [18]. This allowed to repeatedly scan the brain with sequences capable of detecting BOLD changes in the brain.
However, when one considers fMRI of sleep, many questions arise:
- –
- Is the MRI environment favourable to the onset of sleep?
- –
- Will the scanner noise disturb the sleeping volunteer?
- –
- Can the sleeping volunteer experience all stages of sleep?
- –
- Can one perform sleep scoring during the fMRI experiment?
- –
- Will movement artifacts be a great problem?
- –
- What way to postprocess the data?
In order to be able to determine sleep stages, one must acquire EEG-derived polysomnography during the examination. The technique of EEG recording in the MR scanner has been perfected by Ives et al. [19] and applied to imaging of epileptic seizures [20]. However, one main problem associated with functional imaging is the noise in the gantry of the scanner itself. Despite this, Sutton et al., after initially having performed successful polysomnography in the MR scanner [21], were able to demonstrate, during REM sleep, the presence of brain activation in V1 by fMRI performed with echo-planar technology [22]. Ives et al. further refined EEG-recording techniques needed for sleep recording in the MR scanner with 8-channel EEG [23] and this allowed Lövblad et al. to perform their initial study. In order to do so, they used a modified BURST (the scanner emits a burst of radio-frequency pulses) sequence where scanner noise was considerably reduced [24]. They were able to image sleep using this silent MR sequence that can record brain activation over many hours with simultaneous acquisition of an EEG [25]. This shows activation of occipital cortex and deactivation of frontal cortex during REM sleep (fig. 1 and 2), in agreement with previous studies using other techniques.Although much of the data must be disposed of, it is possible to record neuroimaging of sleep over a whole sleep cycle. Normal sleep can be induced in volunteers without sedative drugs in the MR environment. Postprocessing the data remains a challenge since sleep is composed of progressive changes over time and therefore the simple box design used for processing fMRI data may not be applied. More complex approaches such as fuzzy logic algorithms and principle component analysis may be of advantage in this situation.
Further fMRI studies of sleep have since been performed: with functional magnetic resonance imaging Dehaene et al. measured the brain activity evoked by normal and reversed speech in awake and sleeping 3-month-old infants. Left-lateralised brain regions similar to those of adults, including the superior temporal and angular gyri, were already active in infants. Additional activation in right prefrontal cortex was only seen in awake infants processing normal speech [26].
Born et al. [27] reported, with fMRI, a robust signal decrease during visual stimulation (a stroboscopic flash unit functioning at 8 Hz) in the rostromedial occipital cortex in slow-wave sleep. A similar relative decrease at the same location was found during visual stimulation and polysomnographically verified slow-wave sleep in a separate group of 6 subjects using H(2)(15)O PET measures of the regional cerebral blood flow. Czisch et al. additionally reported on reduced auditory activation and visual deactivation detected during sleep stages 1 and 2 [28].
Applications to sleep neurology
Meyer et al. [29] found that brainstem-cerebellar gray matter blood flow values in the awake state were reduced below normal (p less than 0.05) in both narcolepsy and sleep apnoea; in sleep apnoea, bihemispheric blood flow values were also reduced in the awake state. After sleep onset, blood flow paradoxically increased in narcolepsy, but decreased further in sleep apnoea. Maximal regional blood flow changes occurred in brainstem-cerebellar regions in both groups of patients. In patients with sleep apnoea, brainstem functional activity is low in the awake state but is critically reduced during sleep, culminating in apnoea-stimulated arousal followed by repetitive cycles as sleep recurs.
In fatal familial insomnia, Perani et al. found that PET could demonstrate areas of thalamic hypometabolism consistent with known neuropathological findings [30]. In narcolepsy, where previous work had suggested that dopaminergic mechanisms are involved in sleepiness and sleep attacks, Rinne et al., using PET, found no evidence for increased D2 receptor binding in narcolepsy at the level of the putamen and caudate but could not exclude other possible changes in the brain dopaminergic system [31].
Conclusions
Based on the results obtained by many research groups, there seems to be a pattern of varying cerebral activations during different sleep stages.These have mostly been studied by PET and SPECT. This has further been strengthened by a study performed by Braun et al. where they demonstrated functional categories of brain areas involved in specific sleep stages [32]: overall they found that functional dissociation between activity in higher order, heteromodal association cortices in the frontal and parietal lobes and unimodal sensory areas of the occipital and temporal lobes appeared to be characteristic of both slow-wave sleep and REM sleep. Slow-wave sleep was associated with selective deactivation of the heteromodal association areas, while activity in primary and secondary sensory cortices was preserved. REM sleep was characterised by selective activation of certain post-rolandic sensory cortices, while activity in the frontoparietal association cortices remained depressed. REM sleep seemed to be characterised by activation of widespread areas of the brain. Deactivation of the orbital, dorsolateral prefrontal and inferior parietal cortices constitutes the single feature common to both non-REM and REM sleep states and may be a defining characteristic of sleep. Braun et al. also found that the different stages of sleep could be distinguished by characteristic differences in the relationships between the basal ganglia, thalamic nuclei and neocortical regions of interest.
However, fMRI seems to be an extremely promising way of investigating sleep physiology, now that certain technical problems have been resolved. Indeed, the development of silent imaging as well as the capacity to image not only an instant but a whole or many full sleep cycles seem to destine fMRI of sleep to become more popular as an investigative method. Furthermore, our method does partly overcome the fact that most imaging modalities have only been able to provide part of the sleep cycle and have a rather unsatisfying temporal resolution [33]. Also together with more established methods of sleep mapping such as EEG we can now perform a multimodal mapping of sleep activity which will allow us to assess each method against the other in order to additionally gain more insight into the mechanisms underlying the signal itself [33,34].The preliminary results of groups such as our own show that sleep imaging is feasible in the MR environment and the data obtained do correspond to those found in previous animal and human experiments. As the BURST technique provides low-resolution data in a single-slice mode, it is an important step forward and there is no doubt that further improvements in MR technology will provide us with higher signal-to-noise ratios. There will, however, probably always be a special place for SPECT investigation of sleep metabolism, especially in cases where behavioural monitoring with video equipment is required over longer periods of time.
References
- Kennedy, C; Gillin, JC; Mendelson, W; Suda, S; Miyaoka, M; Ito, M; et al. Local cerebral glucose utilization in non-rapid eye movement sleep. Nature 1982, 297, 325–7. [Google Scholar] [CrossRef] [Scilit]
- Hermann, DM; Bassetti, CL. Cerebral circulation and sleep. Sleep Med Rev 2002, 6, 425–7. [Google Scholar] [CrossRef] [Scilit]
- Belliveau, JW; Kennedy, DN, Jr.; McKinstry, RC; Buchbinder, BR; Weisskoff, RM; Cohen, MS; et al. Functional mapping of the human visual cortex by magnetic resonance imaging. Science 1991, 254, 716–9. [Google Scholar] [CrossRef] [Scilit] [PubMed]
- Kwong, KK; Belliveau, JW; Chesler, DA; Goldberg, IE; Weisskoff, RM; Poncelet, BP; et al. Dynamic magnetic resonance imaging of human brain activity during primary sensory stimulation. Proc Natl Acad Sci U S A 1992, 89, 5675–9. [Google Scholar] [CrossRef] [Scilit] [PubMed]
- Sakai, F; Meyer, JS; Karacan, I; Derman, S; Yamamoto, M. Normal human sleep: regional cerebral hemodynamics. Ann Neurol 1980, 7, 471–8. [Google Scholar] [CrossRef] [Scilit]
- Madsen, PL; Schmidt, JF; Holm, S; Vorstrup, S; Lassen, NA; Wildschiodtz, G. Cerebral oxygen metabolism and cerebral blood flow in man during light sleep (stage 2). Brain Res 1991, 557, 217–20. [Google Scholar] [CrossRef] [Scilit]
- Madsen, PL; Schmidt, JF; Wildschiodtz, G; Friberg, L; Holm, S; Vorstrup, S; et al. Cerebral O2 metabolism and cerebral blood flow in humans during deep and rapid-eyemovement sleep. J Appl Physiol 1991, 70, 2597–601. [Google Scholar] [CrossRef] [Scilit]
- Madsen, PL; Holm, S; Vorstrup, S; Friberg, L; Lassen, NA; Wildschiodtz, G. Human regional cerebral blood flow during rapid-eye-movement sleep. J Cereb Blood Flow Metab 1991, 11, 502–7. [Google Scholar] [CrossRef] [Scilit]
- Madsen, PL; Vorstrup, S. Cerebral blood flow and metabolism during sleep. Cerebrovasc Brain Metab Rev 1991, 3, 281–96. [Google Scholar]
- Maquet, P. Positron emission tomography studies of sleep and sleep disorders. J Neurol 1997, 244 (4 Suppl 1), S23–8. [Google Scholar] [CrossRef] [Scilit]
- Buchsbaum, MS; Gillin, JC; Wu, J; Hazlett, E; Sicotte, N; Dupont, RM; et al. Regional cerebral glucose metabolic rate in human sleep assessed by positron emission tomography. Life Sci 1989, 45, 1349–56. [Google Scholar] [CrossRef] [Scilit] [PubMed]
- Maquet, P; Dive, D; Salmon, E; Sadzot, B; Franco, G; Poirrier, R; et al. Cerebral glucose utilization during stage 2 sleep in man. Brain Res 1992, 571, 149–53. [Google Scholar] [PubMed]
- Maquet, P; Degueldre, C; Delfiore, G; Aerts, J; Peters, JM; Luxen, A; et al. Functional neuroanatomy of human slow wave sleep. J Neurosci 1997, 17, 2807–12. [Google Scholar] [PubMed]
- Maquet, P; Dive, D; Salmon, E; Sadzot, B; Franco, G; Poirrier, R; et al. Cerebral glucose utilization during sleepwake cycle in man determined by positron emission tomography and [18F]2-fluoro-2-deoxy-D-glucose method. Brain Res 1990, 513, 136–43. [Google Scholar]
- Maquet, P; Peters, J; Aerts, J; Delfiore, G; Degueldre, C; Luxen, A; et al. Functional neuroanatomy of human rapid-eye-movement sleep and dreaming. Nature 1996, 383, 163–6. [Google Scholar]
- Braun, AR; Balkin, TJ; Wesensten, NJ; Gwadry, F; Carson, RE; Varga, M; et al. Dissociated pattern of activity in visual cortices and their projections during human rapid eye movement sleep. Science 1998, 279, 91–5. [Google Scholar] [CrossRef] [Scilit]
- Kjaer, TW; Law, I; Wiltschiotz, G; Paulson, OB; Madsen, PL. Regional cerebral blood flow during light sleep – a H(2)(15)O-PET study. J Sleep Res 2002, 11, 201–7. [Google Scholar]
- Mansfield, P. Multi-planar image formation using NMR spin echoes. J Phys C: Solid State Phys 1977, 10, L55–L58. [Google Scholar] [CrossRef] [Scilit]
- Ives, JR; Warach, S; Schmitt, F; Edelman, RR; Schomer, DL. Monitoring the patient’s EEG during echo planar MRI. Electroencephalogr Clin Neurophysiol 1993, 87, 417–20. [Google Scholar]
- Warach, S; Ives, JR; Schlaug, G; Patel, MR; Darby, DG; Thangaraj, V; et al. EEG-triggered echo-planar functional MRI in epilepsy. Neurology 1996, 47, 89–93. [Google Scholar]
- Sutton, JP; Holmes, J; Caplan, J; Rudnick, L; Kwong, KK; Breiter, HC; et al. Investigation of human sleep using simultaneous fMRI and polysomnography. Sleep 1995, 21, 271. [Google Scholar]
- Sutton, JP; Breiter, HC; Caplan, JB; Huang-Hellinger, FR; Kwong, KK; Hobson, JA; et al. Human brain activation during REM sleep detected by fMRI. Society for Neuroscience Abstracts 1996, 22, 690. [Google Scholar]
- Ives, JR; Thomas, R; Jakob, PM; Lövblad, KO; Matheson, J; Scammell, T; et al. Technqiue and methodology for recording/monitoring the subject’s sleep stage during quiet functional magnetic resonance imaging (fMRI). In APSS, Associated Professional Sleep Societies; Abstract Book, 1997; p. 306. [Google Scholar]
- Jakob, PM; Schlaug, G; Griswold, M; Lövblad, KO; Thomas, R; Ives, JR; et al. Functional burst imaging. Magn Reson Med 1998, 40, 614–21. [Google Scholar] [CrossRef] [Scilit] [PubMed]
- Lövblad, KO; Thomas, R; Jakob, PM; Scammell, T; Bassetti, C; Griswold, M; et al. Silent functional magnetic resonance imaging demonstrates focal activation in rapid eye movement sleep. Neurology 1999, 53, 2193–5. [Google Scholar] [CrossRef] [Scilit]
- Dehaene-Lambertz, G; Dehaene, S; Hertz-Pannier, L. Functional neuroimaging of speech perception in infants. Science 2002, 298, 2013–5. [Google Scholar] [CrossRef] [Scilit]
- Born, AP; Law, I; Lund, TE; Rostrup, E; Hanson, LG; Wildschiodtz, G; et al. Cortical deactivation induced by visual stimulation in human slow-wave sleep. Neuroimage 2002, 17, 1325–35. [Google Scholar] [CrossRef] [Scilit]
- Czisch, M; Wetter, TC; Kaufmann, C; Pollmacher, T; Holsboer, F; Auer, DP. Altered processing of acoustic stimuli during sleep: reduced auditory activation and visual deactivation detected by a combined fMRI/EEG study. Neuroimage 2002, 16, 251–8. [Google Scholar] [CrossRef] [Scilit]
- Meyer, JS; Sakai, F; Karacan, I; Derman, S; Yamamoto, M. Sleep apnea, narcolepsy, and dreaming: regional cerebral hemodynamics. Ann Neurol 1980, 7, 479–85. [Google Scholar] [CrossRef] [Scilit]
- Perani, D; Cortelli, P; Lucignani, G; Montagna, P; Tinuper, P; Gallassi, R; et al. [18F]FDG PET in fatal familial insomnia: the functional effects of thalamic lesions. Neurology 1993, 43, 2565–9. [Google Scholar] [CrossRef] [Scilit]
- Rinne, JO; Hublin, C; Partinen, M; Ruottinen, H; Ruotsalainen, U; Nagren, K; et al. Positron emission tomography study of human narcolepsy: no increase in striatal dopamine D2 receptors. Neurology 1995, 45, 1735–8. [Google Scholar] [CrossRef] [Scilit]
- Braun, AR; Balkin, TJ; Wesenten, NJ; Carson, RE; Varga, M; Baldwin, P; et al. Regional cerebral blood flow throughout the sleep-wake cycle. An H2(15)O PET study. Brain 1997, 120, 1173–97. [Google Scholar] [CrossRef] [Scilit]
- Logothetis, NK; Pauls, J; Augath, M; Trinath, T; Oeltermann, A. Neurophysiological investigation of the basis of the fMRI signal. Nature 2001, 412, 150–7. [Google Scholar] [CrossRef] [Scilit]
- Dierks, T; Jelic, V; Pascual-Marqui, RD; Wahlund, L; Julin, P; Linden, DE; et al. Spatial pattern of cerebral glucose metabolism (PET) correlates with localization of intracerebral EEG-generators in Alzheimer’s disease. Clin Neurophysiol 2000, 111, 1817–24. [Google Scholar] [CrossRef] [Scilit]
This is an open-access article distributed under the terms of the Creative Commons Attribution Non-Commercial No Derivatives (CC BY-NC-ND) 4.0 License.