


Abstract
Trait emotional intelligence (trait EI) is relevant to children’s emotional and social functioning, yet its psychometric organization and its position within the broader school context remain incompletely understood during middle childhood. The present research addressed these issues across two complementary studies with Italian primary school children. Study 1 (N = 668) examined the psychometric properties of the Trait Emotional Intelligence Questionnaire Child Short Form (TEIQue-CSF), including internal consistency, exploratory and confirmatory factor structure, measurement invariance, and percentile-based descriptive reference values. The general-plus-wording model improved fit relative to a one-factor model, but residual misfit and wording-related variance limit the interpretation of the total score. Measurement invariance was supported across sex. Exploratory analyses suggested partial metric invariance across grades; scalar invariance across grades was not established. Study 2 (N = 203), a secondary analysis of cross-sectional data, used network analysis to examine trait EI in relation to social intelligence, internalizing symptoms, academic performance, and classroom behavior. Trait EI showed high overall connectivity, with its strongest direct associations involving lower depressive symptoms and scholastic anxiety and higher Social Skills and Social Information Processing. Direct connections with academic performance were weak despite positive bivariate correlations. Additional factor-saturation indices supported a meaningful, although not dominant, general trait EI factor, while confirming substantial wording-related variance. Overall, the findings support use of the TEIQue-CSF total score as a broad summary index rather than as a strictly unidimensional measure, with additional caution required for comparisons across grades. In the cross-sectional network, trait EI was conditionally associated primarily with internalizing symptoms and self-reported social functioning.
1. Introduction
1.1. Trait Emotional Intelligence in Middle Childhood
Emotional intelligence (EI) has been widely investigated as a construct relevant to children’s emotional adjustment, social functioning, and school adaptation. Broadly, EI refers to individual differences in how people perceive, understand, regulate, and express emotions in themselves and in others. Different theoretical approaches have been proposed, including ability-based and trait-based models. Within the trait approach, emotional intelligence is conceptualized as a constellation of emotional self-perceptions and behavioral dispositions located at the lower levels of personality hierarchies (Petrides & Furnham, 2000). Unlike ability models, which focus on maximal performance in emotion-related tasks, trait emotional intelligence (trait EI) concerns typical emotional functioning and the way individuals perceive and experience their emotional world in everyday life.
Trait EI has been consistently associated with psychological adjustment and adaptive functioning across development. In school-age children, higher trait EI has been linked to more adaptive social functioning, better school adjustment, and lower vulnerability to emotional difficulties in studies specifically based on the trait EI framework and Trait Emotional Intelligence Questionnaire (TEIQue) measures (Andrei et al., 2015; Mavroveli et al., 2008; Mavroveli & Sánchez-Ruiz, 2011). A recent systematic review focused specifically on studies using the TEIQue in children similarly showed that trait EI is associated with multiple domains of functioning, including intra- and interpersonal relationships, school life, cognitive functioning, and creativity (Özal et al., 2024). More broadly, research on emotional intelligence using different theoretical and measurement approaches has also reported associations with academic achievement and classroom functioning, although these findings should not be interpreted as specific estimates for trait EI, the TEIQue-CSF, or primary school children (García-Sancho et al., 2014; MacCann et al., 2020). In Italian primary school children, higher trait EI has been associated with lower scholastic anxiety and depressive symptoms and with selected academic outcomes (Piombo et al., 2025).
Previous Italian research has provided evidence on trait emotional intelligence across different developmental stages and questionnaire versions. Russo et al. (2012) examined the psychometric properties of the Italian Trait Emotional Intelligence Questionnaire Child Form (TEIQue-CF) in children and preadolescents. In adolescents, Andrei et al. (2014) investigated the Adolescent Full Form and demonstrated incremental validity in predicting emotional maladjustment beyond demographic characteristics, cognitive ability, and the Big Five personality dimensions. Further Italian research examined associations with social status and scholastic achievement in children and early adolescents (Andrei et al., 2015), and with internalizing symptoms, social intelligence, and school-related outcomes in primary school children (Piombo et al., 2025, 2026). These findings provide a broader context for the present study but should not be treated as direct validation of the Child Short Form (TEIQue-CSF). Further examination of the TEIQue-CSF item-level structure, wording-related variance, measurement invariance, and interpretability of its global score in Italian primary school children is therefore warranted.
1.2. Psychometric Challenges in the Assessment of Trait EI
Middle childhood is also an important period from a measurement perspective. During these years, children become increasingly capable of reflecting on their emotional states and behavior, but linguistic comprehension, abstraction, metacognitive abilities, and response strategies are still developing (Keefer et al., 2013; Petrides, 2009; Saarni, 2000). Self-report measures can therefore provide meaningful information about children’s internal experiences while remaining particularly sensitive to the way questions are formulated. This issue is especially relevant for negatively or reverse-worded items, which may impose additional linguistic and cognitive demands and generate method-related covariance rather than substantive psychological differentiation (DiStefano & Motl, 2006; Marsh, 1986; van de Looij-Jansen et al., 2011).
Recent evidence from the child-adapted Tromsø Social Intelligence Scale (TSIS-kids), a child adaptation of the Tromsø Social Intelligence Scale, showed that several reverse-worded items formed a separate exploratory factor, which may reflect wording-related variance rather than an additional substantive dimension of social intelligence (Piombo et al., 2027). This finding highlights a broader methodological issue in the assessment of socioemotional constructs during childhood: apparent multidimensionality may partly reflect the cognitive demands of item wording rather than genuine differentiation of the underlying construct.
1.3. The TEIQue-CSF and the Interpretation of a Global Score
The Trait Emotional Intelligence Questionnaire Child Short Form (TEIQue-CSF; Mavroveli et al., 2008) was developed as a brief self-report measure designed to provide a global index of trait EI in children. Its short format makes it particularly suitable for school-based research, where administration time and children’s attention need to be considered. The Italian version has shown promising psychometric properties in children and preadolescents (Russo et al., 2012) and has subsequently been used in Italian primary school research (Piombo et al., 2025). More recent developmental evidence suggests that trait EI may retain a relatively global organization during middle childhood, with clearer differentiation emerging toward the later years of primary school (Mavroveli et al., 2026). These findings provide a relevant developmental framework for interpreting the TEIQue-CSF, but they do not exclude the possibility that item-level analyses may reveal residual multidimensionality or method-related variance that is less visible when aggregated scores are examined. The present study therefore complements this line of research by examining the item-level structure of the TEIQue-CSF and its measurement invariance across grade groups. Because these comparisons are cross-sectional, however, differences between Grade 4 and Grade 5 cannot be interpreted as evidence of within-child developmental change.
At the same time, the interpretability of a global score does not necessarily imply strict item-level unidimensionality. A measure may reflect a meaningful general construct while retaining residual covariance associated with specific item content, wording, or other methodological characteristics. This distinction is particularly relevant for short forms, in which a limited set of items is used to represent a broad domain of functioning. Accordingly, the psychometric evaluation of the TEIQue-CSF in primary school children requires consideration not only of internal consistency, but also of the extent to which its item structure supports a meaningful general trait EI dimension and of whether residual multidimensionality reflects substantive psychological components or method-related variance. Measurement invariance is similarly important when comparing scores across groups or developmental stages.
1.4. Trait EI and Social Intelligence in the School Context
Beyond its measurement properties, however, trait EI does not operate in isolation. Children’s emotional functioning develops within a broader system that also includes interpersonal competencies, internalizing experiences, behavior, and academic adaptation. One theoretically adjacent construct is social intelligence (SI), which refers to the understanding and management of interpersonal situations and includes the capacity to interpret socially relevant information, anticipate others’ behavior, adapt to interpersonal contexts, and respond effectively to social demands (Silvera et al., 2001). Although trait EI and SI partly overlap, they are conceptually distinct. Trait EI primarily concerns emotional self-perceptions and dispositional emotional functioning, whereas SI more specifically concerns how individuals understand and navigate interpersonal situations. Recent psychometric evidence with the TSIS-kids supports this distinction, showing positive but differentiated associations between trait EI and Social Information Processing, Social Skills, and Social Awareness rather than complete redundancy between the constructs (Piombo et al., 2027).
1.5. Internalizing Symptoms and Individual School Well-Being
Alongside emotional and social competencies, internalizing symptoms represent an important dimension of children’s psychological functioning during the primary school years. Anxiety and depressive symptoms are not confined to adolescence but may already emerge during middle childhood and become relevant for later adjustment. Epidemiological evidence indicates that a substantial proportion of mental disorders begin before adolescence, with anxiety- and fear-related disorders showing particularly early onset patterns (Solmi et al., 2022). Longitudinal research further suggests that elevated or increasing internalizing symptoms during childhood may be associated with greater vulnerability to depression and other adverse psychological outcomes in early adolescence (Papachristou & Flouri, 2020). Concerns regarding internalizing well-being have also become particularly salient in recent years. Meta-analytic evidence collected during the COVID-19 pandemic documented substantial levels of anxiety and depressive symptoms among children and adolescents, highlighting the need to consider emotional distress well before the transition to adolescence (Racine et al., 2021).
The school context is particularly relevant for understanding these difficulties because different aspects of children’s functioning vary in their external visibility. Academic achievement and classroom behavior are readily observable, and interpersonal functioning is at least partly expressed through everyday interactions with peers and teachers. Anxiety and depressive symptoms, by contrast, may remain less accessible to external observers. Recent cross-informant evidence in primary school children showed that scholastic anxiety may be underestimated by teachers, particularly among pupils perceived as well-behaved (Piombo et al., 2026). In this sense, apparently adequate classroom adaptation does not necessarily imply the absence of internal emotional distress. Individual school well-being should therefore be understood not simply in terms of academic performance or observable behavior, but as involving the broader configuration of emotional self-perceptions, internalizing experiences, social functioning, and school adaptation.
1.6. Toward an Integrated Network Perspective
This broader view raises a question that cannot be fully addressed by examining each domain separately. Trait EI, social intelligence, internalizing symptoms, behavior, and academic performance coexist within the same developmental and relational context, and their meaning may partly depend on how they relate to one another. A child may show adequate academic performance while experiencing internal distress or may report strong emotional self-perceptions that are more closely linked to interpersonal functioning than to school achievement.
Thus, rather than considering emotional, social, psychopathological, and academic variables only as separate predictors and outcomes, it may be useful to examine their organization within a common structural framework.
A network approach offers a complementary way to examine these domains simultaneously by representing psychological variables as nodes and their statistical relationships as edges within a common multivariate system (Borsboom et al., 2021). In partial correlation networks, edges represent conditional associations between pairs of variables after accounting for the other variables included in the network (Epskamp & Fried, 2018).
Accordingly, this approach lets us examine how trait EI relates to social intelligence, internalizing symptoms, classroom behavior, and academic performance when these domains are considered together. However, associations estimated from a cross-sectional psychological network should not be interpreted as evidence of causal relationships or temporal processes (Fried & Cramer, 2017). In the present study, the network therefore describes patterns of between-person conditional association between children’s scores; it does not establish causal relationships, reciprocal influences, or processes unfolding within individual children over time.
1.7. The Present Research
The present research addressed two questions concerning trait EI in Italian primary school children. The first concerned measurement: whether the TEIQue-CSF provides a reliable and interpretable global index of trait EI during middle childhood, and how its item-level structure is affected by residual multidimensionality and wording-related variance. The second concerned positioning: how trait EI is embedded within the broader organization of children’s emotional, social, internalizing, and school-related functioning. Together, the two studies were designed to move from the psychometric evaluation of the construct to an examination of its place within the broader developmental system in which it is expressed.
Study 1 examined the psychometric functioning of the Italian TEIQue-CSF in a large sample of primary school children. We evaluated internal consistency, item functioning, exploratory and confirmatory internal structure, measurement invariance across sex and grade, and percentile-based descriptive reference values. Based on previous developmental evidence, we expected the total score to show good internal consistency and evidence of a meaningful general trait EI dimension, while allowing for residual multidimensionality and wording-related variance at the item level.
Study 2 examined the position of trait EI within a broader network of emotional, social, internalizing, and school-related variables using data previously described in Piombo et al. (2025). Whereas the earlier study focused on bivariate associations and regression-based prediction, the present analysis addressed a different question by examining the conditional structure linking trait EI with Social Information Processing, Social Skills, Social Awareness, scholastic and environmental anxiety, depressive symptoms, academic performance, and classroom behavior. We expected trait EI to retain negative connections with internalizing symptoms and positive connections with social functioning when all variables were considered simultaneously. We further examined its overall connectivity and the extent to which specific variables contributed to linking emotional, social, and academic domains.
2. Materials and Methods
2.1. Study 1
2.1.1. Participants and Procedures
The initial sample comprised 669 Italian primary school children (354 girls and 315 boys), aged 7–12 years (M = 9.53, SD = 0.86). Participants were recruited through convenience sampling from four schools and 25 classes in Southern Italy across three consecutive school years (2023–2024, 2024–2025, and 2025–2026). Schools were selected based on their availability to collaborate. Classes were included based on availability and receipt of written parental consent for at least 75% of enrolled pupils. This percentage was a class-level inclusion criterion rather than the overall participation or response rate.
All participants were distinct individuals, and each child was assessed only once during the study period.
Participating schools informed parents or legal guardians through teacher-distributed communications and official school circulars. Eligibility required enrollment in a participating class and written informed consent from a parent or legal guardian. Children without parental consent did not participate and continued their regular classroom activities under teacher supervision.
One participant was excluded because more than 20% of the TEIQue-CSF item responses were missing, leaving a final analytic sample of 668 children. Of these, 43 attended Grade 3, 244 attended Grade 4, 362 attended Grade 5, and 19 attended Grade 6.
All participants were included in the overall psychometric analyses of Study 1. Between-grade measurement-invariance analyses were restricted to Grades 4 and 5, which were the only grade groups with sufficient sample sizes for meaningful comparison. No formal a priori sample-size or power calculation was conducted; sample size was determined by recruitment feasibility.
Questionnaires were administered collectively in paper-and-pencil format during regular school hours, with administration lasting approximately 25 min. Researchers provided oral instructions on questionnaire completion before administration. A teacher remained present throughout. Participation was voluntary, and children were informed that they could decline to participate or leave individual questions unanswered without any consequence. No financial or other incentives were provided to children, parents, teachers, or schools. Participation was voluntary, and children were informed that their responses were anonymous and confidential. Questionnaire responses were subsequently entered into an electronic database and checked for data-entry inconsistencies and out-of-range values before analysis. Data used for analysis contained no directly identifying information and were stored in electronic files accessible only to the research team.
The total number of pupils initially approached was not systematically recorded; consequently, an overall response rate could not be calculated, and potential nonresponse bias could not be quantified. Reporting was informed by the applicable recommendations for non-web-based survey studies discussed by Turk et al. (2018). The convenience sampling strategy and unavailable response-rate denominator limit the assessment of sample representativeness. The study was conducted in accordance with the Declaration of Helsinki and approved by the Bioethics Committee of the University of Bologna (Prot. n. 322763/2021; approval date: 28 December 2021).
2.1.2. Measures
Trait emotional intelligence was assessed using the Trait Emotional Intelligence Questionnaire Child Short Form (TEIQue-CSF; Mavroveli et al., 2008), in its Italian adaptation (Russo et al., 2012). The TEIQue-CSF is a 36-item self-report questionnaire rated on a 5-point Likert scale, from 1, strongly disagree, to 5, strongly agree. Example items include “It is easy for me to understand how I feel” and the reverse-worded item “I am not good at controlling my emotions”. It provides a global trait EI score, with higher scores indicating higher perceived emotional functioning. In the present study, reverse-worded items had already been recoded before analysis.
2.1.3. Statistical Analysis
Statistical analyses were conducted in RStudio version 2026.01.1+403. Before the main analyses, TEIQue CSF items were inspected for missing values, response range, and scoring consistency. Participants with more than 20% missing responses on the TEIQue CSF were excluded. For participants retained in the analytic sample, the total score was computed as the mean of the available valid item responses. In the confirmatory factor analyses, isolated missing item responses were handled using pairwise available information. Descriptive statistics, skewness, kurtosis, and visual inspection of the Q-Q plot were used to examine the distribution of the total score. Internal consistency was evaluated with Cronbach’s alpha and corrected item-total correlations. Ninety-five percent confidence intervals for reliability estimates were obtained using 5000 bootstrap resamples. Exploratory factor analysis was used as a preliminary inspection of the item structure. Prior to exploratory factor analysis, the factorability of the polychoric correlation matrix was evaluated using the Kaiser–Meyer–Olkin (KMO) measure of sampling adequacy and Bartlett’s test of sphericity. The matrix was also inspected for positive definiteness and excessively high inter-item correlations. Because the TEIQue-CSF uses a 5-point ordinal response scale, analyses were based on the polychoric correlation matrix. Factors were extracted using minimum residual estimation, with oblique rotation for multidimensional solutions. Parallel analysis and fit indices were inspected to evaluate whether the data mainly supported a global trait EI factor or showed relevant residual multidimensionality. These analyses were conducted with the psych package version 2.6.5 (Revelle, 2026).
Confirmatory factor analyses were conducted with lavaan (Rosseel, 2012) version 0.6-21. Items were treated as ordered categorical indicators, and models were estimated with WLSMV and theta parameterization. Latent factor variances were fixed to 1 for model identification (std.lv = TRUE).
A one-factor model was tested with all 36 items loading on a single global EI factor. Since preliminary item diagnostics indicated that TEIQUE12r was the weakest item, a second one-factor model excluding this item was also estimated. A further model included a general trait EI factor and an orthogonal wording factor defined by the originally reverse-worded items, with the covariance between the general and wording factors fixed to zero.
Model fit was evaluated using the comparative fit index (CFI), Tucker–Lewis index (TLI), root mean square error of approximation (RMSEA), and standardized root mean square residual (SRMR). Following commonly used guidelines, values of CFI and TLI approaching or exceeding 0.95, RMSEA values of 0.06 or lower, and SRMR values of 0.08 or lower were considered indicative of good fit (Hu & Bentler, 1999). These thresholds were treated as general interpretive guidelines rather than strict decision rules, and model fit was evaluated jointly across indices. In accordance with CFA reporting recommendations (Nye, 2023), model convergence and potential improper solutions were also examined, including negative variance estimates and standardized loadings exceeding 1 in absolute value. Local model fit was inspected using residual correlations and modification indices together with expected parameter changes.
For the retained general-plus-wording model, general-factor saturation was further evaluated using standardized factor loadings, omega total, omega hierarchical (ωH), explained common variance (ECV), and average variance extracted (AVE). Omega hierarchical was used to estimate the proportion of total-score variance attributable specifically to the general trait EI factor after accounting for wording-related variance, whereas ECV quantified the proportion of common variance attributable to the general factor. Omega total, omega hierarchical, and ECV were computed using the bifactorIndices() function from the R package BifactorIndicesCalculator (version 0.2.2). AVE for the general factor was calculated manually from the completely standardized solution obtained using lavaan::standardizedSolution(), as the sum of squared general-factor loadings divided by this sum plus the sum of standardized item residual variances. Because wording-factor variance was excluded from the denominator, this estimate should not be interpreted as the proportion of total item variance explained by the general factor.
Measurement invariance was tested on the retained measurement model across sex and grade. Sex invariance compared girls and boys, whereas grade invariance compared fourth- and fifth-grade children. Configural, metric, and scalar models were estimated sequentially. For ordinal indicators, scalar invariance was tested by constraining both factor loadings and thresholds. Changes in fit were evaluated using ΔCFI and ΔRMSEA, with values of ΔCFI ≤ 0.010 and ΔRMSEA ≤ 0.015 considered acceptable (Chen, 2007; Cheung & Rensvold, 2002). When full metric invariance across grades was not supported, a targeted partial-invariance analysis was conducted. General-factor loadings were constrained to equality across grades while wording-factor loadings were freely estimated, and lavTestScore was used to identify loading constraints contributing most strongly to model misfit. General-factor loadings were subsequently freed for reverse-worded items identified by these diagnostics, and nested WLSMV models were compared using the scaled chi-square difference test implemented in lavaan.
Finally, percentile-based descriptive reference values were computed for the TEIQue CSF total score. Percentiles were calculated for the total sample and, descriptively, by sex, age, and grade. The 15th and 85th percentiles were used to define three interpretive ranges, low, intermediate, and high trait EI. These ranges were treated as descriptive reference bands, not as clinical cutoffs.
2.2. Study 2
2.2.1. Participants and Procedures
Study 2 was conducted as a secondary exploratory analysis of data from a previously published cross-sectional study on trait EI, social intelligence, internalizing symptoms, and school outcomes in Italian primary school children (Piombo et al., 2025). The previous article examined correlations, logistic regression models predicting clinical levels of scholastic anxiety and depression, and hierarchical regression models predicting academic and behavioral outcomes. The present study reanalyzed the same dataset using network analysis to address a different, exploratory question concerning the conditional position of trait EI within the broader system of emotional, social, and academic variables. The 203 complete cases included in the present network analysis were also part of the larger sample examined in Study 1.
Accordingly, Study 2 should not be interpreted as an independent replication of the associations reported in the earlier publication.
The original sample included 228 children aged 8 to 11 years (115 girls; M age = 9.57, SD = 0.62), recruited from three Italian primary schools. Data were collected collectively in classrooms during regular school time and took approximately 60 min. Parents provided informed consent before participation. The study was approved by the Bioethics Committee of the last author’s institution (Prot. n. 322763/2021).
2.2.2. Measures
Trait EI was assessed with the TEIQue CSF (Mavroveli et al., 2008; Russo et al., 2012). The total score was computed as the mean of the 36 items. In this study, internal consistency was good (Cronbach’s alpha = 0.85), 95% CI [0.82, 0.88].
Social intelligence was assessed with a child-adapted version of the Tromsø Social Intelligence Scale described in Piombo et al. (2027). The scale comprises three seven-item dimensions: Social Information Processing, Social Skills, and Social Awareness. Items are rated on a 5-point response scale ranging from 1 = “does not describe me at all” to 5 = “describes me very well.” Reverse-worded items were recoded before score computation, so that higher scores consistently indicated higher social intelligence. Subscale scores were calculated by summing the seven corresponding items, yielding a theoretical range from 7 to 35 for each dimension. Internal consistency was acceptable for Social Information Processing, α = 0.74, 95% CI [0.68, 0.79], and Social Skills, α = 0.76, 95% CI [0.71, 0.80], and lower for Social Awareness, α = 0.60, 95% CI [0.52, 0.67].
Scholastic and Environmental Anxiety were assessed using the corresponding subscales of the Italian Anxiety Scale Questionnaire for Children (Busnelli et al., 1974), a 45-item self-report measure comprising 20 items assessing scholastic anxiety, 20 items assessing environmental anxiety, and five lie-scale items. Children responded to each anxiety item using three frequency categories, scored from 0 to 2, with higher summed scores indicating greater self-reported anxiety symptoms. Scores on each anxiety subscale could therefore range from 0 to 40. In the present sample, internal consistency was good for Scholastic Anxiety, α = 0.85, 95% CI [0.82, 0.88], and acceptable for Environmental Anxiety, α = 0.77, 95% CI [0.72, 0.81].
Depressive symptoms were assessed using the Italian version of the Children’s Depression Inventory (CDI; Camuffo et al., 1988; Kovacs, 1992), a 27-item self-report measure. Each item presents three statements reflecting increasing symptom severity and is scored from 0 to 2. The total score ranges from 0 to 54, with higher scores indicating greater self-reported depressive symptomatology. Internal consistency was good in the present sample (Cronbach’s α = 0.86), 95% CI [0.83, 0.88].
Academic performance in Italian, English, and Mathematics, as well as children’s classroom behavior, was rated by teachers. School outcomes were coded as 1 = basic, 2 = intermediate, and 3 = advanced.
2.2.3. Statistical Analyses
Discriminant validity among trait EI, the three social intelligence dimensions, and depression was evaluated using HTMT2. Following these results, the network included 11 composite variables: trait EI, Social Information Processing, Social Skills, Social Awareness, scholastic anxiety, environmental anxiety, depression, Italian, English, Mathematics, and behavior. Analyses were based on complete cases for these variables. Because academic and behavior ratings were ordinal, the network was estimated from Spearman correlations. A regularized Gaussian graphical model was estimated using EBICglasso with a tuning parameter of 0.50. Analyses were conducted with qgraph, bootnet, and networktools.
Node centrality was interpreted primarily using strength, defined as the sum of the absolute weights of all edges connected to a node. Expected influence, which retains the signs of edge weights, was reported descriptively. Higher scores indicated greater competence for trait EI and social intelligence but greater symptom severity for anxiety and depression. Consequently, positive connections with competencies and negative connections with symptoms contribute with opposite signs to expected influence. A small signed expected-influence estimate should therefore not be interpreted as weak overall connectivity or as evidence of limited substantive relevance. Bridge expected influence was computed after assigning nodes to four a priori communities: trait EI, internalizing symptoms, social functioning, and academic outcomes. Trait EI constituted a separate single-node community. The internalizing community included scholastic anxiety, environmental anxiety, and depression. The social functioning community included the three social intelligence dimensions. The academic outcomes community included Italian, English, Mathematics, and behavior.
Because all connections involving trait EI crossed community boundaries, its one-step bridge expected influence was identical by construction to its expected influence and did not provide independent evidence of a bridging role. Bridge expected influence was also treated descriptively because of its sensitivity to variable coding and community assignment.
Edge-weight accuracy was examined using nonparametric bootstrap procedures, and centrality stability was examined using case-dropping bootstrap procedures. Each procedure used 1000 bootstrap samples.
3. Results
3.1. Study 1
3.1.1. Preliminary Analyses
Data screening was conducted before the main psychometric analyses. After excluding one participant who exceeded the prespecified 20% missing-item threshold, the final analytic sample included 668 children.
The TEIQue-CSF total score was computed as the mean of the 36 already recoded items. The mean total score was 3.52 (SD = 0.53). Internal consistency was good, Cronbach’s alpha = 0.86, 95% bootstrap CI [0.84, 0.87]. Item total diagnostics indicated that most items contributed positively to the total score. TEIQUE12r showed the weakest performance, with a negative corrected item total correlation. Other items with relatively low item total correlations were TEIQUE21r, TEIQUE27r, and TEIQUE30r. Item-level descriptive statistics are reported in Supplementary Table S1.
3.1.2. Exploratory Factor Analysis
Exploratory factor analysis was conducted as a preliminary inspection of the item-level structure (see Table 1). Prior to factor extraction, the data were found to be suitable for exploratory factor analysis. The overall Kaiser–Meyer–Olkin measure indicated good sampling adequacy (KMO = 0.87), with item-level MSA values ranging from 0.53 to 0.93. Bartlett’s test of sphericity was statistically significant, χ2(630) = 8706.94, p < 0.001. The polychoric correlation matrix was positive definite (minimum eigenvalue = 0.229), and the largest absolute inter-item correlation was 0.677, indicating no evidence of problematic multicollinearity. Analyses were based on the polychoric correlation matrix. The results suggested the presence of a general factor, but a strict one-factor solution did not fully reproduce the item covariance structure. The one-factor solution accounted for 19.9% of the variance. More complex solutions explained progressively more variance, reaching 39.5% in the five-factor solution. Fit indices showed the same pattern, with RMSR decreasing from 0.079 in the one-factor solution to 0.027 in the five-factor solution, and RMSEA decreasing from 0.103 to 0.061.
Table 1.
Exploratory Factor Analysis Fit Indices for One- to Five-Factor Solutions.
3.1.3. Confirmatory Factor Analyses
Confirmatory factor analyses were subsequently conducted to examine the internal structure of the TEIQue-CSF (see Table 2). All models converged successfully, and no negative variance estimates or standardized factor loadings exceeding 1 in absolute value were observed. The one-factor model including all 36 items showed inadequate fit, CFI = 0.783, TLI = 0.770, RMSEA = 0.118, 90% CI [0.116, 0.121], and SRMR = 0.111. Removing TEIQUE12r did not improve model fit, CFI = 0.783, TLI = 0.770, RMSEA = 0.122, 90% CI [0.119, 0.124], and SRMR = 0.114. Thus, although TEIQUE12r showed weak item-level performance, its removal did not account for the broader misfit of the one-factor model.
Table 2.
Confirmatory Factor Analysis Model Fit Comparison.
The model including a general trait EI factor and an orthogonal wording factor for the originally reverse-worded items showed substantially improved fit relative to the one-factor model, CFI = 0.921, TLI = 0.914, RMSEA = 0.072, 90% CI [0.069, 0.075], and SRMR = 0.070. However, supplementary scaled and robust fit indices were less favorable, indicating that the improvement in relative fit should not be interpreted as evidence of uniformly good absolute fit. The corresponding 35-item model excluding TEIQUE12r yielded very similar fit, CFI = 0.922, TLI = 0.915, RMSEA = 0.074, 90% CI [0.071, 0.077], and SRMR = 0.071. Because removal of TEIQUE12r produced no meaningful improvement in model fit, the 36-item general-plus-wording model was retained for subsequent analyses.
Standardized factor loadings further clarified the relative contribution of the general and wording factors. Loadings on the general trait EI factor ranged from −0.081 to 0.671 (see Supplementary Table S3). Positively worded items showed consistently moderate general-factor loadings (M = 0.562, range = 0.437–0.671), whereas the 16 originally reverse-worded items showed substantially weaker loadings on the general factor (M = 0.168, range = −0.081–0.299). All reverse-worded items had general-factor loadings below 0.30. Conversely, the reverse-worded items showed stronger loadings on the wording factor (M = 0.464, range = −0.009–0.664). At the factor level, omega total was 0.888 and omega hierarchical was 0.666. The general factor accounted for 64.7% of the common variance (ECV = 0.647), whereas AVE for the general factor was 0.218. These indices indicate a meaningful general trait EI component alongside substantial wording-related variance.
Finally, consistent with recommendations to examine local as well as global model fit (Nye, 2023), residual correlations and modification indices were also inspected. These diagnostics indicated some localized residual dependencies between item pairs, but no post hoc correlated residuals were added because such modifications were not specified a priori or supported by a sufficiently strong theoretical rationale.
3.1.4. Measurement Invariance
Measurement invariance was examined using the retained 36-item general-plus-wording model (see Table 3). Before testing measurement invariance, the retained 36-item general-plus-wording model was estimated separately within each sex and grade subgroup. All subgroup models converged successfully. Fit was generally more favorable among girls and Grade 4 children, whereas some indices were less favorable among boys and Grade 5 children (see Supplementary Table S6). These subgroup-specific results were considered when interpreting the subsequent measurement invariance analyses. Across sex, the configural model showed a reasonably fitting baseline model, although not all of the more stringent absolute-fit guidelines were met, CFI = 0.923, TLI = 0.916, RMSEA = 0.074, and SRMR = 0.080. Constraining factor loadings to equality produced only small changes in fit, ΔCFI = −0.007, ΔRMSEA = 0.002, and ΔSRMR = 0.003. The subsequent scalar model also showed negligible changes relative to the metric model, ΔCFI = 0.004, ΔRMSEA = −0.004, and ΔSRMR = −0.002. Given that invariance was evaluated primarily from changes in fit across nested models rather than from any single absolute-fit cutoff, these results supported scalar invariance across sex.
Table 3.
Measurement Invariance of the Retained General-Plus-Wording Model Across Sex and Grade.
Across grades, the configural model similarly provided a reasonably fitting baseline, although it did not satisfy all of the more stringent absolute-fit guidelines, CFI = 0.921, TLI = 0.914, RMSEA = 0.078, and SRMR = 0.083. However, constraining factor loadings to equality resulted in a marked decrease in CFI, ΔCFI = −0.035, together with increases in RMSEA, ΔRMSEA = 0.014, and SRMR, ΔSRMR = 0.013. The subsequent scalar model yielded CFI = 0.897, TLI = 0.898, RMSEA = 0.085, and SRMR = 0.090; however, because metric invariance was not supported, full scalar invariance across grade could not be established. Overall, the results supported configural but not full metric invariance across Grade 4 and Grade 5. Allowing wording-factor loadings to vary across grades did not restore metric invariance (CFI = 0.889, RMSEA = 0.091; scaled Δχ2(34) = 150.63, p < 0.001). Score-test diagnostics showed that misfit was concentrated primarily in reverse-worded items; freeing the general-factor loadings of seven such items yielded a partial metric model (CFI = 0.913, RMSEA = 0.081; ΔCFI = −0.008, ΔRMSEA = 0.003; scaled Δχ2(27) = 51.83, p = 0.003). The freed loadings concerned TEIQUE03r, TEIQUE06r, TEIQUE24r, TEIQUE27r, TEIQUE29r, TEIQUE33r, and TEIQUE34r. All seven items were originally reverse-worded and showed weaker general-factor loadings in Grade 4 than in Grade 5.
Although absolute model fit remained imperfect (RMSEA = 0.081) and the scaled chi-square difference test remained significant, the small changes in CFI and RMSEA relative to the configural model met the prespecified change-in-fit criteria, providing exploratory support for partial metric invariance.
3.1.5. Percentile-Based Descriptive Reference Values and Interpretive Bands
Percentile-based descriptive reference values were derived for the TEIQue-CSF total score (see Table 4). Analyses were based on 668 children with sufficient item-level data to compute the global score. The mean total score was 3.52 (SD = 0.53), with a median of 3.50 and observed scores ranging from 1.67 to 5.00. The distribution was approximately symmetric, with skewness = 0.09 and kurtosis = −0.26. The 15th and 85th percentiles were 2.97 and 4.08, respectively. For descriptive purposes, these thresholds were used to identify three score ranges within the present sample: scores at or below 2.97, scores above 2.97 and below 4.08, and scores at or above 4.08. Based on these thresholds, 108 children (16.2%) fell within the low range, 458 (68.6%) within the intermediate range, and 102 (15.2%) within the high range. Sex-specific percentiles were broadly comparable, whereas age- and grade-specific values were retained as descriptive references and should be interpreted cautiously, particularly in light of the partial metric invariance observed across grades. Because the sample was recruited from primary schools in Southern Italy and consisted predominantly of children attending Grades 4 and 5, these percentile values should be regarded as sample-specific descriptive references rather than normative values for the broader primary-school population. They are not intended to serve as diagnostic cutoffs, validated screening thresholds, or criteria for identifying or selecting individual pupils.
Table 4.
Selected Percentile-Based Descriptive Reference Values and Interpretive Bands for the TEIQue-CSF Total Score.
3.2. Study 2
3.2.1. Descriptive Statistics and Correlations
The network analysis was based on 203 participants with complete data across the variables included in the network. Missingness was low for questionnaire-based measures (2.63%) and somewhat higher for teacher-reported academic and behavioral outcomes (8.77–9.21%). Spearman correlations are reported in Table 5, while descriptive statistics for all variables are provided in Supplementary Table S7.
Table 5.
Spearman Correlations Among Study 2 Variables.
In the complete-case sample, trait EI had a mean of 3.59 (SD = 0.50), scholastic anxiety a mean of 16.32 (SD = 6.00), environmental anxiety a mean of 15.78 (SD = 6.36), and depressive symptoms a mean of 8.56 (SD = 5.86).
Trait EI was negatively correlated with scholastic anxiety, ρ = −0.41, environmental anxiety, ρ = −0.24, and depressive symptoms, ρ = −0.57. Positive correlations emerged with Social Information Processing, ρ = 0.37, Social Skills, ρ = 0.51, and Social Awareness, ρ = 0.31. HTMT2 values between trait EI and Social Information Processing, Social Skills, Social Awareness, and depression were 0.488, 0.631, 0.551, and 0.746, respectively, supporting discriminant validity. These point estimates were consistent with discriminant validity for the four comparisons involving trait EI, but do not establish complete construct separation.”
Associations with Italian, English, and Mathematics achievement were positive but smaller, ranging from ρ = 0.20 to 0.22, whereas the correlation with classroom behavior was weak, ρ = 0.10.
3.2.2. Network Structure
The estimated network retained 27 nonzero edges out of 55 possible unique edges (see Table 6 and Figure 1). The strongest regularized partial correlation was observed between Italian and Mathematics, weight = 0.507. Other relatively strong positive connections were observed between environmental and scholastic anxiety, weight = 0.347, between Social Skills and trait EI, weight = 0.299, between English and Italian, weight = 0.298, and between English and Mathematics, weight = 0.291.
Table 6.
Nonzero Regularized Partial Correlations in the Estimated Network.
Figure 1.
Network of Trait Emotional Intelligence, Internalizing Symptoms, Social Functioning, and Academic Outcomes. Note. Blue edges indicate positive regularized partial correlations, and red edges indicate negative regularized partial correlations. Edge thickness is proportional to edge magnitude. Node colors identify the four domains: trait EI, internalizing symptoms, social functioning, and academic outcomes.
Trait EI showed its strongest negative conditional association with depressive symptoms, weight = −0.363. It was also directly connected with higher Social Skills, weight = 0.299, higher Social Information Processing, weight = 0.195, and lower scholastic anxiety, weight = −0.154.
Its connection with Social Awareness was comparatively small, weight = 0.046, whereas no direct edge was retained between trait EI and environmental anxiety. Direct connections between trait EI and academic outcomes were also weak or absent, with weights of 0.020 for Italian, 0.021 for English, 0.001 for Mathematics, and 0 for classroom behavior. Within the internalizing domain, environmental anxiety was directly connected with scholastic anxiety, weight = 0.347, whereas its connection with depression was comparatively small, weight = 0.027. Academic outcomes formed a relatively cohesive portion of the network, particularly through the connections among Italian, English, and Mathematics.
3.2.3. Centrality, Bridge Expected Influence, and Stability
Trait EI showed the highest observed strength estimate in the network, strength = 1.098 (see Table 7 and Figure 2). Other nodes with relatively high strength included Mathematics (0.956), Italian (0.925), scholastic anxiety (0.729), English (0.719), depression (0.642), and Social Skills (0.616). In contrast to its high strength, trait EI showed a comparatively small, expected influence value, 0.064. Because expected influence is sensitive to variable coding direction, substantive interpretation focused on strength; expected influence values are reported descriptively in Table 7 and Figure 2. Academic variables showed comparatively high positive expected influence, particularly Italian (0.925), Mathematics (0.891), and English (0.676).
Table 7.
Raw Centrality Indices for the Estimated Network.
Figure 2.
Centrality Indices for the Estimated Network. Note. The figure shows standardized centrality values (z-scores) for strength and expected influence. Strength reflects the overall magnitude of node connectivity, whereas expected influence retains the sign of edge weights.
Bridge expected influence was examined across the four prespecified domains (see Table 8 and Figure 3). Because bridge expected influence is a signed index and is therefore sensitive to the coding direction of the variables, these values were treated descriptively rather than as indicators of overall node importance. This caution was particularly relevant for trait EI, which constituted a separate single-node community. Social Information Processing showed the highest positive 1-step bridge expected influence (0.313), followed by Social Skills (0.222). In contrast, depression (−0.474) and scholastic anxiety (−0.241) showed the strongest negative bridge expected influence values. Environmental anxiety and Social Awareness showed comparatively small signed bridge indices.
Table 8.
Bridge Expected Influence by Node and Community.
Figure 3.
Bridge Expected Influence (1-Step) Across Study 2 Variables. Note. Positive values indicate stronger positive cross-community connections, whereas negative values indicate stronger negative cross-community connections. Trait EI was treated as a separate community from internalizing symptoms, social functioning, and academic outcomes.
3.2.4. Accuracy and Stability Checks
Bootstrap analyses supported a cautious interpretation of the estimated network. Edge-weight estimates were generally close to their bootstrap means, although smaller edges were associated with wider confidence intervals. Centrality stability was adequate, with correlation stability coefficients of 0.596 for strength and 0.670 for expected influence. Pairwise centrality difference tests further indicated that not all differences between node centrality estimates were statistically distinguishable. Centrality results were therefore interpreted in terms of broad patterns of connectivity rather than strict rankings of individual nodes.
4. General Discussion
The present research addressed two complementary questions concerning trait emotional intelligence in middle and late childhood. Study 1 focused on the psychometric structure of the Italian TEIQue-CSF, examining whether a global trait EI score remains meaningful despite the developmental and methodological complexities associated with self-report assessment in children. Study 2 extended this perspective by examining the position of trait EI within a broader network of social functioning, internalizing symptoms, and school-related outcomes. Taken together, the findings suggest that trait EI can be meaningfully assessed as a global dimension during primary school, while also occupying a particularly relevant position within the broader organization of children’s socioemotional functioning.
A first important issue concerns the developmental structure of trait EI. In adults, trait EI is conceptualized as a broad personality domain comprising 15 facets organized around four factors, Well-being, Self-control, Emotionality, and Sociability, together with a global trait EI score (Petrides, 2009). The structure appears less differentiated during childhood. Earlier work with child versions of the TEIQue has suggested that emotional self-perceptions may be organized more globally during primary school, with clearer differentiation emerging progressively with age (Mavroveli et al., 2008, 2026). In this regard, Mavroveli et al. (2026) found a predominantly unifactorial organization in younger primary-school children and a more differentiated two-component structure toward the end of primary school, suggesting that the internal organization of trait EI may become progressively articulated across development.
The findings of Study 1 are broadly consistent with this developmental interpretation. The exploratory analyses indicated that the TEIQue-CSF item structure was not strictly unidimensional, as progressively more complex solutions improved model fit and the five-factor solution captured substantially more item variance than the one-factor solution. At the same time, however, the extracted structure did not provide a sufficiently clear or theoretically coherent basis for interpreting five distinct substantive dimensions. Rather than contradicting the use of a global score, these findings suggest that trait EI in childhood may contain residual multidimensionality while still retaining an important common core. Confirmatory analyses further supported this interpretation: a strict one-factor model did not adequately reproduce the item covariance structure, whereas a model combining a general trait EI factor with an orthogonal wording factor provided a markedly better representation of the data. The improved fit of the general-plus-wording model is compatible with a general trait EI component alongside wording-related covariance. The additional factor-saturation indices further clarified this pattern. Omega hierarchical (ωH = 0.666) and ECV (0.647) indicated that the general factor accounted for a substantial proportion of total-score and common variance, respectively, although it did not dominate the item structure. Consistently, AVE was relatively low (0.218), and general-factor loadings were markedly weaker for reverse-worded than for positively worded items. These indices further characterize the retained model but do not compensate for its residual misfit. Taken together, the findings support a cautious interpretation of the conventional TEIQue-CSF total score as a broad composite rather than as a strictly unidimensional measure.
An important part of this residual complexity concerned the reverse-worded items. Several negatively worded items showed comparatively weak relations with the global score, and the fit of the measurement model improved substantially when common variance among originally reverse-worded items was explicitly modeled. This finding is particularly relevant in developmental assessment. Reverse-worded items may require children to perform additional linguistic and cognitive operations before providing a response, including detecting negation, reversing the meaning of the statement, and mapping that interpretation onto the response scale. Such demands may generate systematic response variance that is unrelated to the psychological construct of interest (Marsh, 1986; DiStefano & Motl, 2006; Suárez-Álvarez et al., 2018). Similar wording-related effects have recently been observed in the assessment of social intelligence in primary-school children using the TSIS-kids (Piombo et al., 2027). The present findings therefore reinforce the view that apparent multidimensionality in childhood self-report measures should not automatically be interpreted as substantive differentiation of the underlying construct. Part of that structure may instead reflect the way children process differently worded items.
The conventional TEIQue-CSF total score may be retained as a broad descriptive composite, although its interpretation should remain cautious given the residual multidimensionality and wording-related variance. However, the magnitude of ωH, ECV, and AVE indicates that this score should not be interpreted as reflecting a purely unidimensional construct. Rather, the total score appears to capture meaningful general trait EI variance while also containing a substantial contribution from wording-related method variance. Accordingly, the wording factor should not be interpreted or scored as a substantive psychological dimension, but its influence should be considered when interpreting the global score. At the same time, partial metric invariance across grades was supported after freeing seven reverse-worded items, suggesting that grade-related non-invariance was concentrated primarily in wording-sensitive items.
Two hypotheses warrant further investigation. One concerns the possible differentiation of emotional self-perceptions during late childhood, as suggested by developmental research on trait EI (Mavroveli et al., 2008, 2026). The other concerns grade-related differences in how children interpret and respond to reverse-worded items. The concentration of non-invariant general-factor loadings among reverse-worded items is compatible with the latter hypothesis, but item comprehension was not directly assessed, and allowing wording-factor loadings to vary across grades was insufficient to restore full metric invariance. The present findings therefore cannot distinguish developmental differentiation of the construct from differences in wording-related response processes or other sources of non-invariance. Moreover, the cross-sectional comparison does not establish within-child developmental change, and the exploratory partial-invariance model requires independent validation. Longitudinal studies incorporating direct assessments of item comprehension would help distinguish these explanations. The percentile-based values from Study 1 should consequently be treated as sample-specific descriptive references rather than clinical norms. Age- and grade-specific comparisons require particular caution, especially because scalar invariance across grades was not established.
Study 2 addressed a different but complementary question: once trait EI is measured as a global dimension, where does it sit within the broader organization of children’s functioning at school? The network findings suggest that trait EI occupies a highly connected position in this system. Its strength was the highest observed in the network, indicating that trait EI maintained substantial direct connections with several domains even after the remaining variables were considered simultaneously. Accordingly, the interpretation of node centrality was based primarily on strength rather than expected influence.
This pattern is conceptually informative. Rather than being associated with only one specific aspect of school functioning, trait EI appears to sit at the intersection between adaptive interpersonal functioning and psychological distress.
The strongest negative connection involving trait EI was with depressive symptoms, while a further negative edge emerged with scholastic anxiety. These findings extend the results previously obtained with the same sample using conventional regression approaches, in which higher trait EI was associated with lower scholastic anxiety and depression and with a lower likelihood of reaching clinically relevant levels of internalizing symptoms (Piombo et al., 2025). Importantly, the network analysis shows these associations remain when social intelligence, other internalizing symptoms, academic performance, and classroom behavior are considered simultaneously. Trait EI may therefore represent an important correlate of emotional adjustment during primary school. Previous research has similarly linked higher trait EI with more adaptive psychosocial functioning and fewer emotional and behavioral difficulties in children and adolescents (Piqueras et al., 2019; Riolo et al., 2025).
Nevertheless, because the present network is cross-sectional, trait EI should not be interpreted as a demonstrated causal protective factor, as emphasized in methodological works on psychological networks (Fried & Cramer, 2017; Borsboom et al., 2021).
Rather, its position is consistent with the possibility that children who perceive themselves as better able to understand, express, and regulate emotions also report fewer internalizing symptoms. Longitudinal research will be required to determine whether these emotional self-perceptions prospectively reduce risk or whether internalizing symptoms themselves progressively undermine children’s perceived emotional competence.
The connections between trait EI and social intelligence provide a second important aspect of this pattern. Trait EI was directly connected with Social Skills and Social Information Processing, whereas its association with Social Awareness was considerably weaker. This distinction is theoretically meaningful. Emotional functioning is expressed not only internally but also in relationships, where emotions must be recognized, communicated, regulated, and coordinated with others’ behavior. The relatively strong connection with Social Skills may therefore reflect the behavioral expression of emotional self-efficacy in interpersonal contexts, consistent with previous evidence linking trait EI in childhood with adaptive interpersonal and social functioning (Mavroveli & Sánchez-Ruiz, 2011; Özal et al., 2024).
Similarly, the connection with Social Information Processing suggests that emotional self-perceptions are related to children’s capacity to understand interpersonal situations and interpret socially relevant information. Earlier research has shown that children with higher trait EI tend to be perceived as more cooperative and prosocial and as less disruptive or aggressive by peers and teachers (Petrides et al., 2006; Mavroveli et al., 2009; Mavroveli & Sánchez-Ruiz, 2011). The present findings extend this literature by showing that emotional and social functioning remain interconnected even when internalizing and academic variables are simultaneously represented within the same network.
A particularly interesting finding concerns academic performance. At the bivariate level, the associations reproduced those previously reported for this dataset (Piombo et al., 2025) and were broadly consistent with the wider literature (MacCann et al., 2020). The estimated conditional associations with academic ratings were small. This pattern does not establish whether the bivariate associations reflect mediation, shared determinants, measurement differences, or estimation choices.
Within the present network, Social Information Processing appeared particularly relevant to this distinction. It retained a connection with trait EI while also showing small direct associations with language-related academic outcomes. Given the limited magnitude of these edges, this pattern should be interpreted cautiously and primarily as a hypothesis for future research. In addition, Social Information Processing reflects children’s self-perceived social functioning rather than an objective measure of social competence. Future studies should examine whether perceived social information processing contributes to the association between emotional functioning and school outcomes using longitudinal and multi-informant designs.
The academic variables themselves formed a strongly interconnected cluster, particularly across Italian, English, and Mathematics, while their connections with the socioemotional part of the network were comparatively limited. This pattern may indicate that academic performance represents a partially distinct domain of school functioning. It may also partly reflect the nature of the measures used in the present study. Academic achievement and behavior were based on teacher ratings and therefore represent externally observed indicators, whereas trait EI, social intelligence, anxiety, and depressive symptoms were primarily based on children’s self-reports. The relative separation of these nodes may consequently reflect both substantive differences between socioemotional and academic functioning and method-related differences between self-perceived and externally evaluated outcomes. This issue is particularly relevant given previous evidence showing that children’s internal emotional experiences may not always be readily identified by teachers, especially when overt classroom behavior remains appropriate (Piombo et al., 2026).
Together, the studies describe measurement complexities of the TEIQue-CSF and its cross-sectional associations with selected domains of school functioning.
Trait EI appears to function as a broad emotional self-perception construct that is sufficiently coherent to be represented through a global score during primary school, although its item-level organization remains influenced by developmental differentiation and wording-related method effects. In the broader school context, this global dimension appears more closely tied to children’s internalizing and interpersonal functioning than to academic performance. This broader pattern is consistent with previous research using child TEIQue measures, which has linked trait EI with multiple domains of intra- and interpersonal adjustment and school functioning (Özal et al., 2024). In this sense, the importance of trait EI in childhood may lie less in a direct contribution to scholastic achievement and more in its relationship with how children experience, regulate, and express emotions and how they participate in interpersonal relationships within the school environment.
The observed associations motivate prospective and intervention research on emotional self-perceptions and school well-being; the present analyses do not establish which variables should be targeted to improve outcomes.
Within this cautious framework, the findings may nonetheless inform how future school-based programs are conceived and evaluated.
Programs designed to strengthen emotional awareness, expression, regulation, and interpersonal competence may contribute to children’s broader psychological adjustment, as suggested by evidence from school-based social and emotional learning interventions and psycho-educational programs targeting emotional competence in primary school children (Taylor et al., 2017; La Grutta et al., 2022), although intervention and longitudinal studies are needed before causal conclusions can be drawn. From this perspective, the school setting is particularly important because it represents one of the main developmental contexts in which emotional, social, and academic processes continuously interact.
Limitations and Future Directions
Several limitations that are directly related to the design and analytical procedures of the present research should be acknowledged. First, in Study 1, exploratory and confirmatory analyses were conducted on the same sample. Although the exploratory factor analysis was intended as a preliminary examination of the item structure and the confirmatory analyses compared theoretically informed models, the absence of an independent validation sample limits the strength of the evidence regarding the replicability of the retained structure. Future studies should therefore cross-validate the general-plus-wording model in independent samples. In addition, no test–retest data were available, preventing an assessment of the temporal stability of TEIQue-CSF scores.
Second, Study 2 was based on cross-sectional data and on complete cases across all variables included in the network. The resulting network therefore represents between-person conditional associations and does not permit conclusions regarding causal direction or intraindividual processes. Moreover, restricting the analysis to complete cases reduced the analytic sample from 228 to 203 participants and may have introduced some degree of selection if missingness was not completely random.
Third, the reliability of the variables included in the Study 2 network was not uniform, with internal consistency coefficients ranging from approximately 0.60 to 0.86. In particular, lower reliability for some social intelligence dimensions may have attenuated their estimated associations with other nodes and should be considered when interpreting differences in connectivity across variables.
Fourth, the samples were recruited from primary schools in Southern Italy and were not nationally representative. Study 1 also included relatively few children outside Grades 4 and 5, limiting the precision of age- and grade-specific descriptive reference values. In addition, only limited sociodemographic information was available for participating children and their families. Variables such as parental education, socioeconomic status, family composition, and other contextual characteristics were not systematically considered. The percentile-based values provided in Study 1 should therefore be interpreted as sample-specific descriptive references rather than population norms and should not be used as diagnostic, screening, or selection thresholds.
Finally, although partial metric invariance was supported across grades, seven reverse-worded items showed non-invariant general-factor loadings. Comparisons between Grade 4 and Grade 5 should therefore remain cautious. The cross-sectional design does not allow developmental change to be inferred. Longitudinal research following the same children across middle childhood and adolescence is required to determine whether the structure of trait EI becomes progressively differentiated over time.
The concentration of non-invariant loadings among reverse-worded items is compatible with grade-related differences in response processes, but item comprehension was not assessed directly. The partial-invariance model was selected post hoc and requires cross-validation; partial scalar invariance was not established.
Other methodological issues should be regarded as possible sources of influence rather than demonstrated limitations. Children were nested within classes and schools, and observations from pupils sharing the same educational environment may therefore have been partially dependent. Because the present analyses did not explicitly model this hierarchical structure, future research should examine whether classroom- or school-level clustering affects estimates of trait EI structure or its associations with other variables.
In Study 2, some network nodes may also capture partially overlapping aspects of socioemotional functioning. Such conceptual overlap can influence the magnitude and interpretation of regularized partial correlations and may contribute to the observed network structure (Epskamp & Fried, 2018; Borsboom et al., 2021). In addition, academic performance and classroom behavior were represented by three-level teacher ratings. Although Spearman correlations were used to accommodate their ordinal nature, alternative estimation approaches specifically designed for ordinal or mixed data could produce somewhat different network estimates. Replication using alternative network specifications and more fine-grained or objective indicators of academic functioning would therefore be informative.
Future research should address these limitations through independent cross-validation samples, longitudinal designs, and multi-informant assessments. Longitudinal studies would be particularly valuable for testing the temporal stability of the TEIQue-CSF, examining whether wording-related effects change with age, and determining whether the organization of trait EI becomes progressively more differentiated across development. In addition, longitudinal network approaches could clarify the temporal relationships among trait EI, internalizing symptoms, self-perceived social functioning, and school outcomes. Larger and more geographically and sociodemographically heterogeneous samples, together with multilevel and alternative network estimation approaches, would further allow the robustness and generalizability of the present findings to be evaluated.
5. Conclusions
The present research provides further evidence on the relevance of trait EI during middle and late childhood. From a psychometric perspective, Study 1 supported a meaningful general trait EI dimension alongside substantial wording-related variance. These findings support retaining the TEIQue-CSF total score as a broad summary index rather than interpreting it as a strictly unidimensional measure. The partial metric invariance observed across grades further indicates that between-grade comparisons should be made cautiously.
From a functional perspective, trait EI emerged as a highly connected component of children’s socioemotional functioning within the school context. Its strongest and most meaningful connections involved internalizing symptoms and social functioning, whereas associations with academic performance became weak when the broader network was considered. This distinction suggests that the role of trait EI in primary school may be more closely related to emotional adjustment and interpersonal functioning than to a direct influence on scholastic achievement.
Overall, the two studies suggest that the assessment of trait EI in childhood is most informative when both its developmental structure and its position within the broader socioemotional context are considered. Trait EI appears to represent a meaningful global dimension of children’s emotional self-perceptions and, at the same time, an important component of the network linking emotional distress, social functioning, and school adaptation.
Supplementary Materials
The following supporting information can be downloaded at: https://www.mdpi.com/article/10.3390/ejihpe16110180/s1, Table S1. Item Descriptive Statistics and Corrected Item-Total Correlations. Table S2. Pattern Matrix for the Five-Factor Exploratory Factor Analysis Solution. Table S3. Unstandardized and Standardized Factor Loadings for the Retained General-Plus-Wording CFA Model. Table S4. Scaled and Robust Fit Indices for the Confirmatory Factor Analysis Models. Table S5. Selected TEIQue-CSF Percentile by Age. Table S6. Subgroup-Specific Fit of the Retained 36-Item General-Plus-Wording CFA Model. Table S7. Descriptive Statistics for Variables Included in Study 2.
Author Contributions
Conceptualization, M.A.P., F.A. and S.L.G.; methodology, M.A.P. and F.A.; software, M.A.P.; validation, M.A.P.; formal analysis, M.A.P.; investigation, M.A.P., F.A. and S.L.G.; resources, E.T., M.S.E., C.N. and S.L.G.; data curation, M.A.P.; writing, original draft preparation, M.A.P.; writing—review and editing, M.A.P., G.M. and S.L.G.; visualization, M.A.P.; supervision, E.T., M.S.E., C.N. and G.M.; project administration, E.T., M.S.E., G.M., F.A. and S.L.G. All authors have read and agreed to the published version of the manuscript.
Funding
This research received no external funding.
Institutional Review Board Statement
The study was conducted in accordance with the Declaration of Helsinki and was approved by the Bioethics Committee of the University of Bologna (protocol code 322763/2021, and date of approval: 28 December 2021).
Informed Consent Statement
Written informed consent was obtained from the parents or legal guardians of all minors involved in the study.
Data Availability Statement
The data presented in this study are available on reasonable request from the corresponding author. The data are not publicly available due to privacy and ethical considerations related to the protection of minors participating in the research.
Acknowledgments
The authors gratefully acknowledge the school principals, teachers, parents, and children who participated in the studies and contributed to the successful completion of this research.
Conflicts of Interest
The authors declare no conflicts of interest.
References
- Andrei, F., Mancini, G., Mazzoni, E., Russo, P. M., & Baldaro, B. (2015). Social status and its link with personality dimensions, trait emotional intelligence, and scholastic achievement in children and early adolescents. Learning and Individual Differences, 42, 97–105. [Google Scholar] [CrossRef] [Scilit]
- Andrei, F., Mancini, G., Trombini, E., Baldaro, B., & Russo, P. M. (2014). Testing the incremental validity of trait emotional intelligence: Evidence from an Italian sample of adolescents. Personality and Individual Differences, 64, 24–29. [Google Scholar] [CrossRef] [Scilit]
- Borsboom, D., Deserno, M. K., Rhemtulla, M., Epskamp, S., Fried, E. I., McNally, R. J., Robinaugh, D. J., Perugini, M., Dalege, J., Costantini, G., Isvoranu, A.-M., Wysocki, A. C., van Borkulo, C. D., van Bork, R., & Waldorp, L. J. (2021). Network analysis of multivariate data in psychological science. Nature Reviews Methods Primers, 1, 58. [Google Scholar] [CrossRef] [Scilit]
- Busnelli, C., Dall’Aglio, E., & Faina, P. (1974). Questionario scala d’ansia per l’età evolutiva: Manuale di istruzioni. Organizzazioni Speciali. [Google Scholar]
- Camuffo, M., Cerutti, R., Lucarelli, L., & Mayer, R. (1988). C.D.I. Children’s Depression Inventory: Questionario di autovalutazione di M. Kovacs. Manuale. Organizzazioni Speciali. [Google Scholar]
- Chen, F. F. (2007). Sensitivity of goodness of fit indexes to lack of measurement invariance. Structural Equation Modeling: A Multidisciplinary Journal, 14(3), 464–504. [Google Scholar] [CrossRef] [Scilit]
- Cheung, G. W., & Rensvold, R. B. (2002). Evaluating goodness-of-fit indexes for testing measurement invariance. Structural Equation Modeling: A Multidisciplinary Journal, 9(2), 233–255. [Google Scholar] [CrossRef] [Scilit] [PubMed]
- DiStefano, C., & Motl, R. W. (2006). Further investigating method effects associated with negatively worded items on self-report surveys. Structural Equation Modeling: A Multidisciplinary Journal, 13(3), 440–464. [Google Scholar] [CrossRef] [Scilit] [PubMed]
- Epskamp, S., & Fried, E. I. (2018). A tutorial on regularized partial correlation networks. Psychological Methods, 23(4), 617–634. [Google Scholar] [CrossRef] [Scilit] [PubMed]
- Fried, E. I., & Cramer, A. O. J. (2017). Moving forward: Challenges and directions for psychopathological network theory and methodology. Perspectives on Psychological Science, 12(6), 999–1020. [Google Scholar] [CrossRef] [Scilit] [PubMed]
- García-Sancho, E., Salguero, J. M., & Fernández-Berrocal, P. (2014). Relationship between emotional intelligence and aggression: A systematic review. Aggression and Violent Behavior, 19(5), 584–591. [Google Scholar] [CrossRef] [Scilit]
- Hu, L.-t., & Bentler, P. M. (1999). Cutoff criteria for fit indexes in covariance structure analysis: Conventional criteria versus new alternatives. Structural Equation Modeling: A Multidisciplinary Journal, 6(1), 1–55. [Google Scholar] [CrossRef] [Scilit]
- Keefer, K. V., Holden, R. R., & Parker, J. D. A. (2013). Longitudinal assessment of trait emotional intelligence: Measurement invariance and construct continuity from late childhood to adolescence. Psychological Assessment, 25(4), 1255–1272. [Google Scholar] [CrossRef] [Scilit] [PubMed]
- Kovacs, M. (1992). Children’s Depression Inventory manual. Multi-Health Systems. [Google Scholar]
- La Grutta, S., Epifanio, M. S., Piombo, M. A., Alfano, P., Maltese, A., Marcantonio, S., Ingoglia, S., Alesi, M., Lo Baido, R., Mancini, G., & Andrei, F. (2022). Emotional competence in primary school children: Examining the effect of a psycho-educational group intervention: A pilot prospective study. International Journal of Environmental Research and Public Health, 19, 7628. [Google Scholar] [CrossRef] [Scilit] [PubMed]
- MacCann, C., Jiang, Y., Brown, L. E. R., Double, K. S., Bucich, M., & Minbashian, A. (2020). Emotional intelligence predicts academic performance: A meta-analysis. Psychological Bulletin, 146(2), 150–186. [Google Scholar] [CrossRef] [Scilit] [PubMed]
- Marsh, H. W. (1986). Negative item bias in ratings scales for preadolescent children: A cognitive-developmental phenomenon. Developmental Psychology, 22(1), 37–49. [Google Scholar] [CrossRef]
- Mavroveli, S., Petrides, K. V., Sangareau, Y., & Furnham, A. (2009). Exploring the relationships between trait emotional intelligence and objective socio-emotional outcomes in childhood. British Journal of Educational Psychology, 79(2), 259–272. [Google Scholar] [CrossRef] [Scilit] [PubMed]
- Mavroveli, S., Petrides, K. V., & Sánchez-Ruiz, M.-J. (2026). Trait emotional intelligence in childhood: Factorial structure of the TEIQue–Child Form (CF) and Child Short Form (CSF). Behavioral Sciences, 16(4), 501. [Google Scholar] [CrossRef] [Scilit] [PubMed]
- Mavroveli, S., Petrides, K. V., Shove, C., & Whitehead, A. (2008). Investigation of the construct of trait emotional intelligence in children. European Child & Adolescent Psychiatry, 17(8), 516–526. [Google Scholar] [CrossRef] [Scilit] [PubMed]
- Mavroveli, S., & Sánchez-Ruiz, M.-J. (2011). Trait emotional intelligence influences on academic achievement and school behaviour. British Journal of Educational Psychology, 81(1), 112–134. [Google Scholar] [CrossRef] [Scilit] [PubMed]
- Nye, C. D. (2023). Reviewer resources: Confirmatory factor analysis. Organizational Research Methods, 26(4), 608–628. [Google Scholar] [CrossRef] [Scilit]
- Özal, Z., Ambrosini, F., Biolcati, R., Trombini, E., Mavroveli, S., & Mancini, G. (2024). Exploring emotional intelligence in children using the Trait Emotional Intelligence Questionnaire: A systematic review. BMC Psychology, 12, 604. [Google Scholar] [CrossRef] [Scilit] [PubMed]
- Papachristou, E., & Flouri, E. (2020). Distinct developmental trajectories of internalising and externalising symptoms in childhood: Links with mental health and risky behaviours in early adolescence. Journal of Affective Disorders, 276, 1052–1060. [Google Scholar] [CrossRef] [Scilit] [PubMed]
- Petrides, K. V. (2009). Psychometric properties of the Trait Emotional Intelligence Questionnaire (TEIQue). In C. Stough, D. H. Saklofske, & J. D. A. Parker (Eds.), Assessing emotional intelligence: Theory, research, and applications (pp. 85–101). Springer. [Google Scholar] [CrossRef] [Scilit]
- Petrides, K. V., & Furnham, A. (2000). On the dimensional structure of emotional intelligence. Personality and Individual Differences, 29(2), 313–320. [Google Scholar] [CrossRef] [Scilit]
- Petrides, K. V., Sangareau, Y., Furnham, A., & Frederickson, N. (2006). Trait emotional intelligence and children’s peer relations at school. Social Development, 15(3), 537–547. [Google Scholar] [CrossRef] [Scilit]
- Piombo, M. A., La Grutta, S., Epifanio, M. S., Mancini, G., Trombini, E., & Andrei, F. (2027). Psychometric evaluation of a child adaptation of the Tromsø Social Intelligence Scale in an Italian primary school sample. Personality and Individual Differences, 264, 114080. [Google Scholar] [CrossRef] [Scilit]
- Piombo, M. A., La Grutta, S., Epifanio, M. S., Trombini, E., & Andrei, F. (2026). Differences between children’s self-reports and teacher ratings of emotional intelligence and anxiety: A cross-informant study. Acta Psychologica, 264, 106483. [Google Scholar] [CrossRef] [Scilit] [PubMed]
- Piombo, M. A., Trombini, E., Epifanio, M. S., La Grutta, S., & Andrei, F. (2025). Emotional and social intelligences as predictors of scholastic anxiety, depression, and academic results in primary school children. Psychological Reports. Advance online publication. [Google Scholar] [CrossRef] [Scilit] [PubMed]
- Piqueras, J. A., Mateu-Martínez, O., Cejudo, J., & Pérez-González, J.-C. (2019). Pathways into psychosocial adjustment in children: Modeling the effects of trait emotional intelligence, social-emotional problems, and gender. Frontiers in Psychology, 10, 507. [Google Scholar] [CrossRef] [Scilit] [PubMed]
- Racine, N., McArthur, B. A., Cooke, J. E., Eirich, R., Zhu, J., & Madigan, S. (2021). Global prevalence of depressive and anxiety symptoms in children and adolescents during COVID-19: A meta-analysis. JAMA Pediatrics, 175(11), 1142–1150. [Google Scholar] [CrossRef] [Scilit] [PubMed]
- Revelle, W. (2026). psych: Procedures for psychological, psychometric, and personality research (R package version 2.6.5). Northwestern University. [Google Scholar]
- Riolo, M., Piombo, M. A., Spicuzza, V., Novara, C., La Grutta, S., & Epifanio, M. S. (2025). The relationship between emotional intelligence and the risk of eating disorders among adolescents: The mediating role of motivation for the use of social media and moderation of perceived social support. Behavioral Sciences, 15(4), 434. [Google Scholar] [CrossRef] [Scilit] [PubMed]
- Rosseel, Y. (2012). lavaan: An R package for structural equation modeling. Journal of Statistical Software, 48(2), 1–36. [Google Scholar] [CrossRef] [Scilit]
- Russo, P. M., Mancini, G., Trombini, E., Baldaro, B., Mavroveli, S., & Petrides, K. V. (2012). Trait emotional intelligence and the Big Five: A study on Italian children and preadolescents. Journal of Psychoeducational Assessment, 30(3), 274–283. [Google Scholar] [CrossRef] [Scilit]
- Saarni, C. (2000). Emotional competence: A developmental perspective. In R. Bar-On, & J. D. A. Parker (Eds.), The handbook of emotional intelligence: Theory, development, assessment, and application at home, school, and in the workplace (pp. 68–91). Jossey-Bass. [Google Scholar]
- Silvera, D. H., Martinussen, M., & Dahl, T. I. (2001). The Tromsø Social Intelligence Scale, a self-report measure of social intelligence. Scandinavian Journal of Psychology, 42(4), 313–319. [Google Scholar] [CrossRef] [Scilit] [PubMed]
- Solmi, M., Radua, J., Olivola, M., Croce, E., Soardo, L., Salazar de Pablo, G., Shin, J. I., Kirkbride, J. B., Jones, P., Kim, J. H., Kim, J. Y., Carvalho, A. F., Seeman, M. V., Correll, C. U., & Fusar-Poli, P. (2022). Age at onset of mental disorders worldwide: Large-scale meta-analysis of 192 epidemiological studies. Molecular Psychiatry, 27(1), 281–295. [Google Scholar] [CrossRef] [Scilit] [PubMed]
- Suárez-Álvarez, J., Pedrosa, I., Lozano, L. M., García-Cueto, E., Cuesta, M., & Muñiz, J. (2018). Using reversed items in Likert scales: A questionable practice. Psicothema, 30(2), 149–158. [Google Scholar] [CrossRef] [Scilit] [PubMed]
- Taylor, R. D., Oberle, E., Durlak, J. A., & Weissberg, R. P. (2017). Promoting positive youth development through school-based social and emotional learning interventions: A meta-analysis of follow-up effects. Child Development, 88(4), 1156–1171. [Google Scholar] [CrossRef] [Scilit] [PubMed]
- Turk, T., Elhady, M. T., Rashed, S., Abdelkhalek, M., Nasef, S. A., Khallaf, A. M., Mohammed, A. T., Attia, A. W., Adhikari, P., Amin, M. A., Hirayama, K., & Huy, N. T. (2018). Quality of reporting web-based and non-web-based survey studies: What authors, reviewers and consumers should consider. PLoS ONE, 13(6), e0194239. [Google Scholar] [CrossRef] [Scilit] [PubMed]
- van de Looij-Jansen, P. M., Goedhart, A. W., de Wilde, E. J., & Treffers, P. D. A. (2011). Confirmatory factor analysis and factorial invariance analysis of the adolescent self-report Strengths and Difficulties Questionnaire: How important are method effects and minor factors? British Journal of Clinical Psychology, 50(2), 127–144. [Google Scholar] [CrossRef] [Scilit] [PubMed]
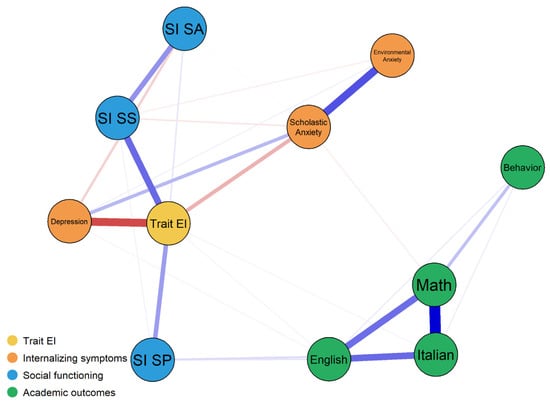
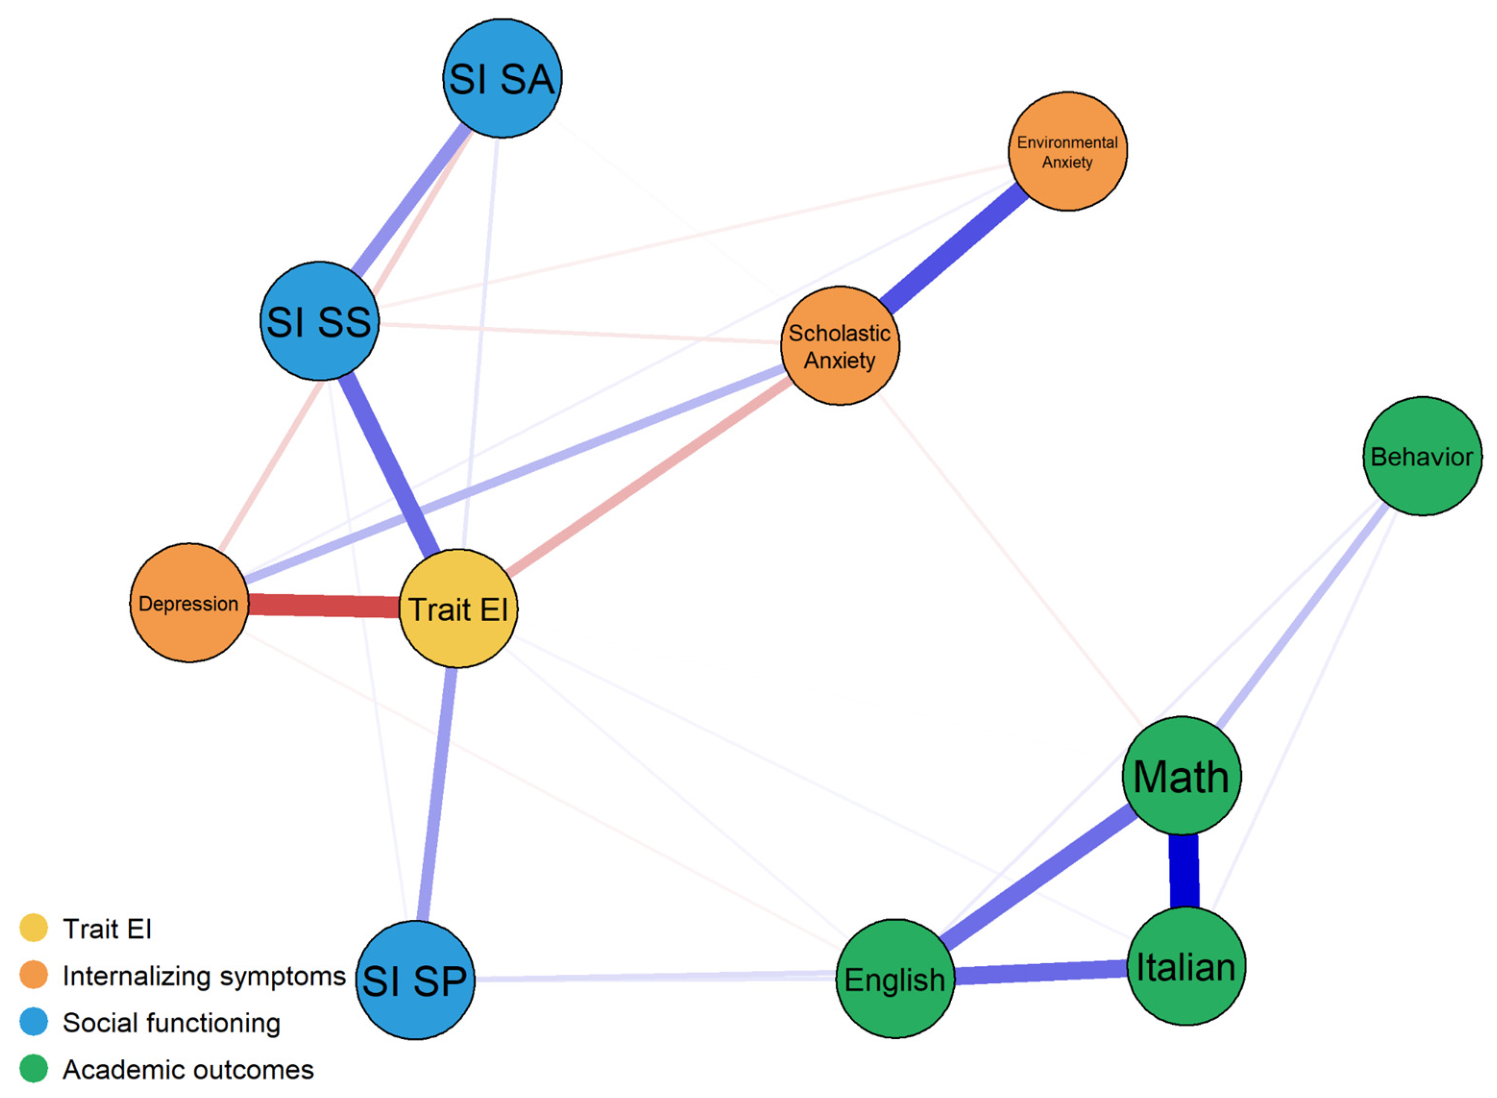
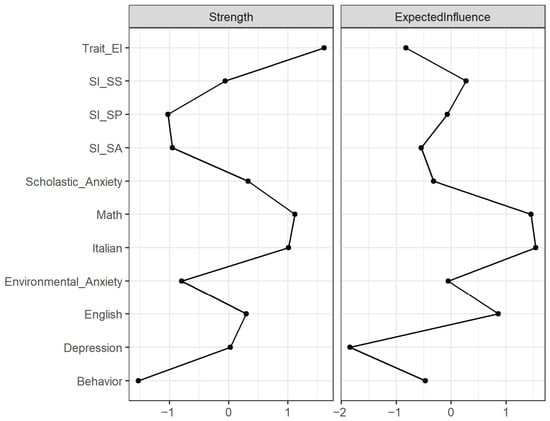
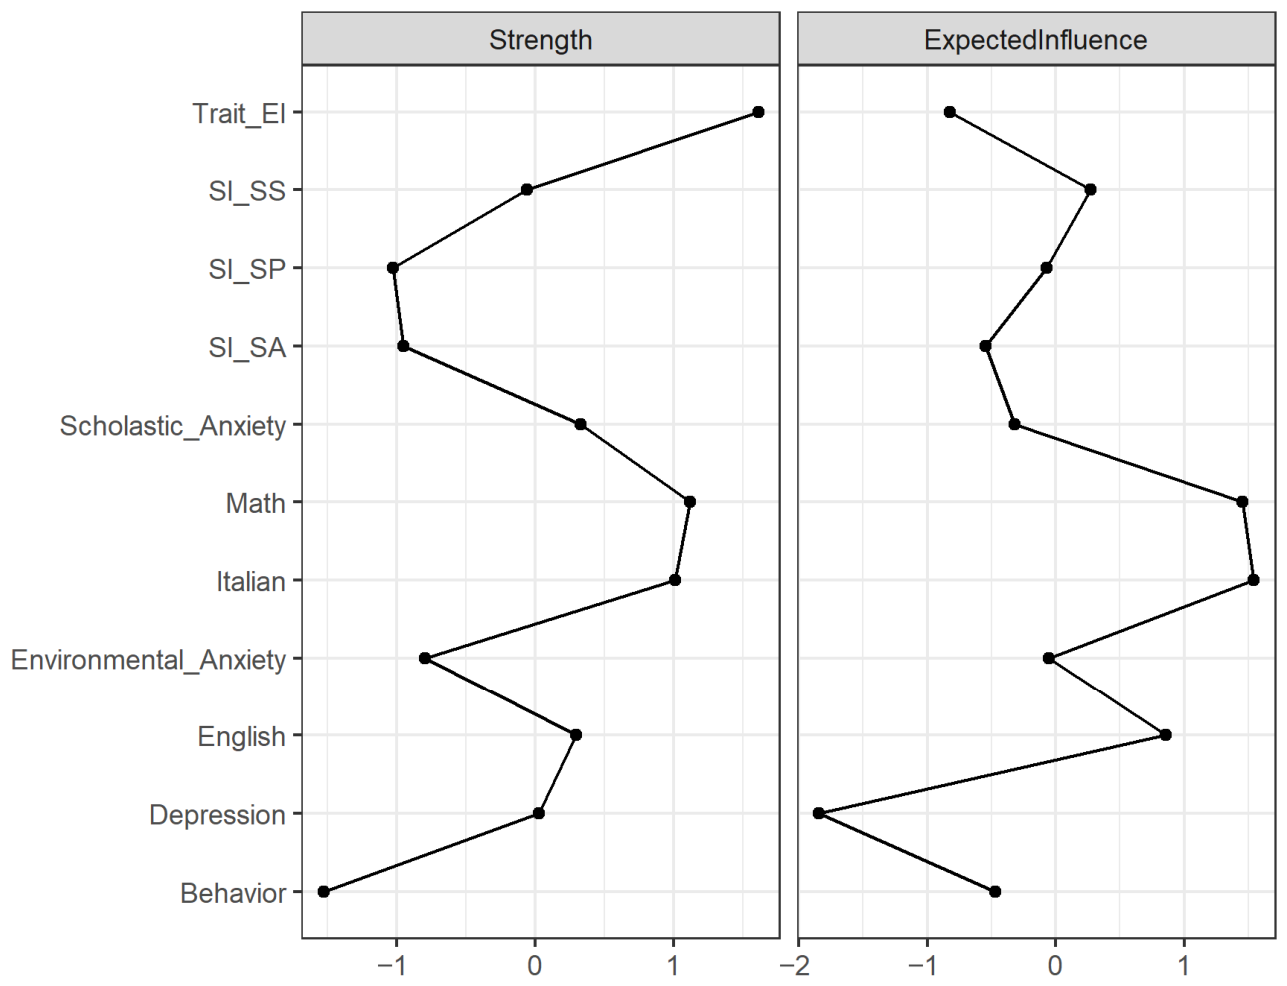
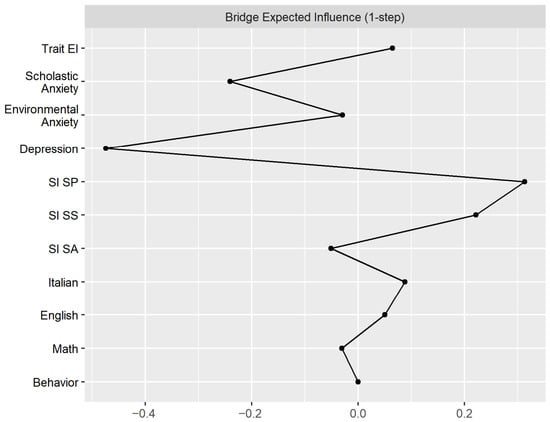
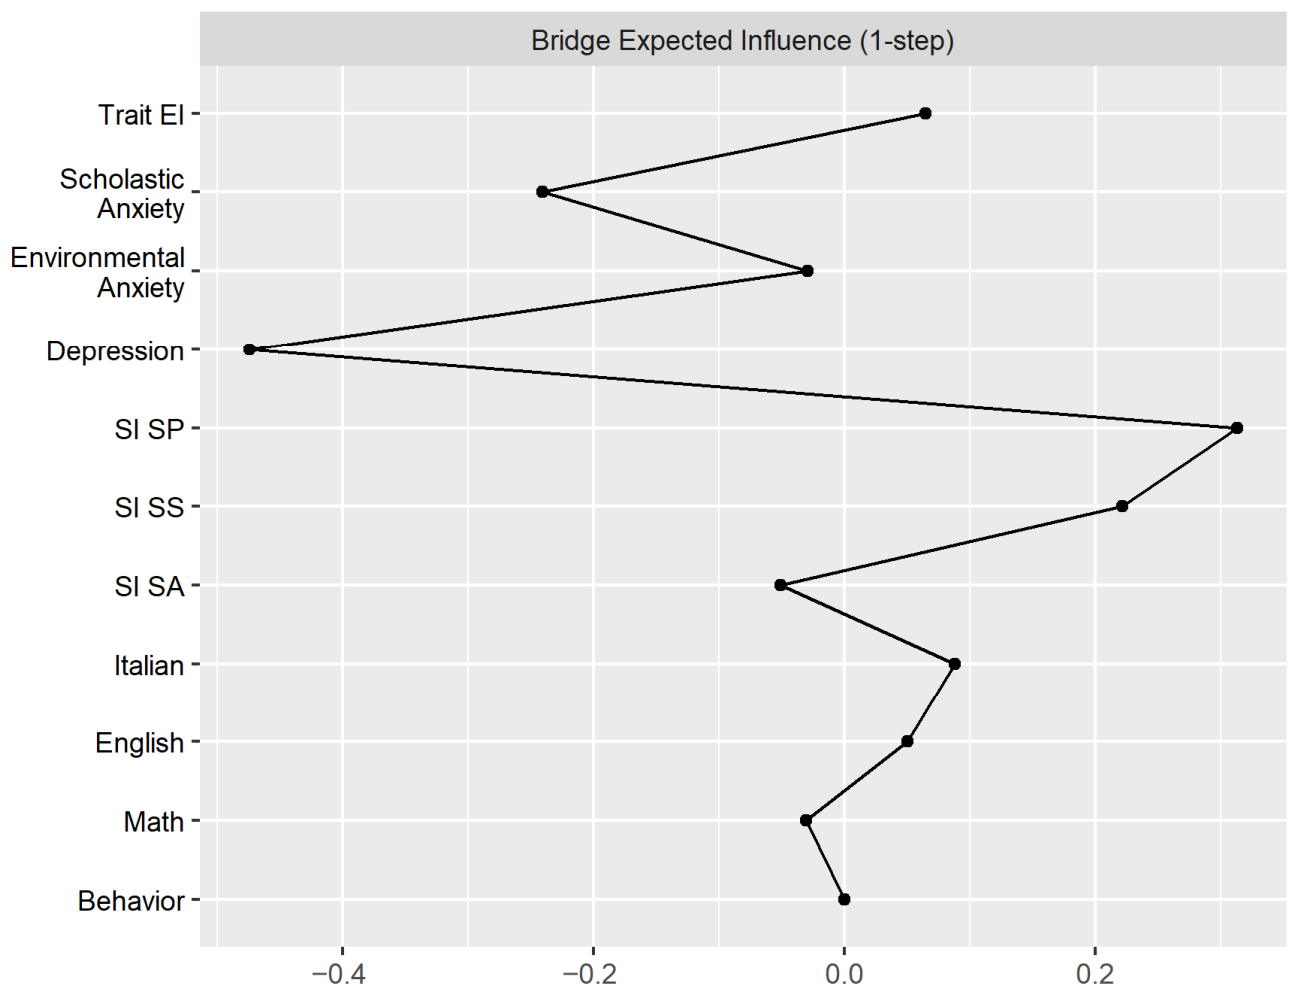

Disclaimer/Publisher’s Note: The statements, opinions and data contained in all publications are solely those of the individual author(s) and contributor(s) and not of MDPI and/or the editor(s). MDPI and/or the editor(s) disclaim responsibility for any injury to people or property resulting from any ideas, methods, instructions or products referred to in the content. |
© 2026 by the authors. Published by MDPI on behalf of the Spanish Scientific Society for Research and Training in Health Sciences. Licensee MDPI, Basel, Switzerland. This article is an open access article distributed under the terms and conditions of the Creative Commons Attribution (CC BY) license.