


Abstract
Tight oil reservoirs are characterized by poor petrophysical properties. After hydraulic fracturing, the low flowback rate of fracturing fluid readily leads to the formation of a water invasion zone in the near-wellbore region, which severely restricts the performance of Carbon dioxide (CO2) huff-n-puff. To clarify the damage mechanism of the water invasion zone on CO2 huff-n-puff in tight oil reservoirs and determine the key regulatory parameters, tight cores with a relative water invasion zone length Δδ = 0.3 were adopted as the research subject. Five groups of injection–soaking–production time combinations were designed, and single-factor analysis was implemented using the control variable method. Integrated with numerical simulation and nuclear magnetic resonance (NMR) testing, the influence of the water invasion zone, pore crude oil mobilization characteristics, and parameter regulation effects were systematically explored. The results demonstrate that the water invasion zone occupies effective pore throats to form a continuous water-phase barrier, hindering CO2 seepage and mass transfer. After four huff-n-puff cycles, the cumulative recovery factor of the water-invaded model is 4.13 percentage points lower than that of the water-free model. After four huff-n-puff cycles, the cumulative recovery factor of the water-invaded model is 4.13 percentage points lower than that of the water-free model. The NMR T2 spectra of cores with and without water invasion exhibit remarkable discrepancies: the water-free core presents a unimodal structure, while the water-invaded core features a distinctive bimodal structure, with obvious staged characteristics in crude oil mobilization. The recovery factor declines nonlinearly and sharply with the increase of Δδ, verifying that the water invasion zone length is the dominant controlling factor. The regulation effects of injection, soaking, and production time differ significantly: injection time serves as the pivotal parameter for enhancing oil recovery. Prolonging injection time can strengthen displacement intensity and dismantle the water-phase barrier, thereby elevating the recovery factor, whereas soaking time and production time have no significant improvement effect. The results can provide valuable references for the parameter optimization of CO2 huff-n-puff in water-invaded tight oil reservoirs.
1. Introduction
Tight oil reservoirs feature well-developed micro-nano pore throats and ultra-low permeability. Following conventional horizontal well multi-stage fracturing [1,2,3], such reservoirs are predominantly developed via formation elastic energy, which depletes rapidly during the elastic development stage, leaving substantial volumes of crude oil trapped in matrix pores and resulting in generally low ultimate recovery factors [4]. Taking typical domestic tight oil blocks as an example, the ultimate recovery factor of elastic development merely ranges from 8% to 12%, indicating severely insufficient resource mobilization [5]. As a core technology for energy supplementation and efficiency enhancement in tight oil reservoirs, CO2 huff-n-puff replenishes formation energy through the cyclic process of gas injection, soaking, and production, and has emerged as a research hotspot in recent years. Domestic and foreign scholars have conducted numerous laboratory experiments and numerical simulation studies on CO2 huff-n-puff in tight oil reservoirs [6,7,8], and the results confirm that CO2 huff-n-puff outperforms huff-n-puff with nitrogen, methane, and other gases. The core mechanism lies in that CO2 can induce crude oil swelling and viscosity reduction, improve fluidity, and achieve near-miscible displacement with crude oil at relatively low pressures, effectively mobilizing remaining oil bound by capillary forces [9,10,11].
After volumetric fracturing of horizontal wells in tight oil reservoirs, the low flowback rate of fracturing fluid leads to massive fluid retention in the near-wellbore zone, forming a water invasion zone that becomes a critical factor restricting the performance of CO2 huff-n-puff. The water invasion zone occupies the effective pore throats of the reservoir, creating a water-phase barrier that impedes CO2 seepage and mass transfer as well as crude oil displacement, drastically reducing development benefits—a problem that has become increasingly prominent in field development. At present, studies on CO2 huff-n-puff in tight oil reservoirs mainly focus on parameter optimization and development mechanisms under water-free conditions [12,13,14]. Liu et al. found that increasing the number of huff-n-puff cycles and soaking time can improve the crude oil mobilization degree in low-permeability matrix, while enhancing fracture density and reducing matrix crude oil size are optimal development methods for strengthening matrix mobilization in such reservoirs [15]. Song et al. clarified the permeability–stress sensitivity relationship of matrix and fractures through physical experiments with variable conductivity of hydraulic fractures, and optimized the optimal values of key parameters for CO2 huff-n-puff in different tight oil reservoirs via numerical simulation, providing an important reference for the research and field application of post-fracturing CO2 huff-n-puff technology in tight oil reservoirs [16]. Wang et al. carried out simulation experiments on CO2 dissolution, swelling and huff-n-puff in oil and water phases under different water saturations, and deeply analyzed the influence mechanism of water saturation on the development performance of CO2 huff-n-puff in glutenitic tight oil reservoirs [17].
Although the above studies have provided valuable insights into the development mechanism of CO2 huff-n-puff, research under water invasion conditions remains inadequate. First, existing studies mostly focus on water saturation effects or conventional parameter optimization, while the influence of the water invasion zone length on CO2 huff-n-puff performance has not been systematically quantified. In particular, the relationship between invasion-zone extent and recovery loss, as well as its dominant control on flow resistance and mass transfer, remains unclear. Second, although injection time, soaking time, and production time are the core operational variables of CO2 huff-n-puff, their respective roles in regulating and alleviating water invasion damage have not been clearly distinguished. It is still unclear which time parameter plays a leading role in overcoming the water-phase barrier and improving crude oil mobilization under water-invaded conditions.
Taking the Chang 7 tight oil reservoir in the Ordos Basin as the research carrier, this paper systematically conducts comparative experiments on multi-cycle CO2 huff-n-puff with and without water invasion zones by integrating core physical simulation, NMR imaging technology, and CMG-GEM numerical simulation, and explores the influence of different water invasion zone lengths on the recovery factor. The research results can provide theoretical support for parameter optimization of CO2 huff-n-puff development in water-invaded tight oil reservoirs and possess important engineering guiding value for improving the development benefits of similar reservoirs.
2. Experimental Design and Methodology
2.1. Physical Simulation
2.1.1. CO2 Huff-n-Puff Experiments for Crude Oil Displacement Under Water Invasion-Free Conditions
- Experimental materials
The oil sample used in the experiments was taken from surface degassed crude oil of the Chang 7 tight oil reservoir in the Xi 233 Block of the Yanchang Formation, Ordos Basin. Its density and viscosity under ambient temperature and pressure were 0.84 g/cm3 and 1.59 mPa·s, respectively. The compositional data of the crude oil are listed in Table 1. The core samples utilized were artificially compacted cores, with a porosity of 0.1 and a permeability of 0.1 mD.
Table 1.
Compositions of crude oil.
- 2.
- Experimental apparatus
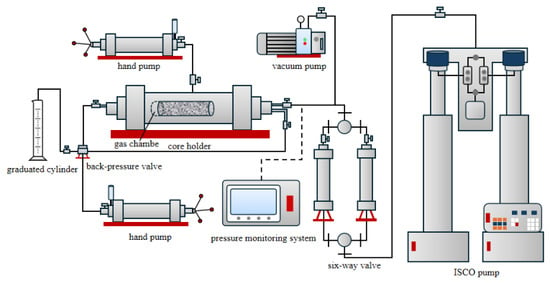
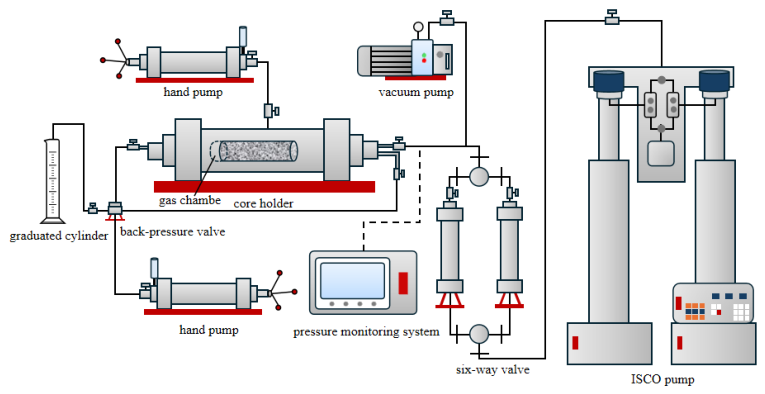
The experimental setup mainly consists of a huff-n-puff system and a NMR system (Niumag Analytical Instrument Corporation, Suzhou, China, with a magnetic field strength of 0.22 T and a resonance frequency of 12 MHz). The NMR system has a magnetic field strength of 0.3 ± 0.05 T and a central frequency of 12 MHz, which was used to measure T2 spectra and NMR images during the experiments. The gas huff-n-puff system mainly includes an ISCO pump, a vacuum pump, a hand pump, a core holder, intermediate containers, and a thermostat chamber.
Offline NMR scanning was adopted in this work, mainly because online scanning requires a relatively long relaxation time, making small pores undetectable. Offline scanning allows the mass change of the core to be measured gravimetrically after each cycle, providing supplementary verification for the experimental method and results.
- 3.
- Experimental procedure
This experiment investigates the effect of CO2 huff-n-puff on crude oil mobilization characteristics in core pores under water invasion-free conditions, and the experimental flow is illustrated in Figure 1.
Figure 1.
Schematic of the CO2 huff-n-puff experimental setup.
The detailed experimental procedures are as follows:
① Preliminary: preparation: In accordance with the Petroleum and Natural Gas Industry Standard of the People’s Republic of China SY/T 5336-2006 “Practices for Core Analysis” [18], the core was cleaned and dried in an oven at 100 °C to constant weight to remove internal impurities and residual fluids. Porosity and permeability tests were then conducted on the cleaned and dried core sample.
② Core saturation: The core was placed into the vacuum tank of the saturation apparatus and evacuated for 24 h. Crude oil was injected into the tank, and the pressure was boosted to 20 MPa to achieve full saturation. The saturated core was weighed and scanned via NMR.
③ Core aging: The core was loaded into the core holder and placed in a thermostat chamber to reach the target temperature, followed by aging for 24 h. A confining pressure of 5 MPa was applied, and the entire displacement system was evacuated using a vacuum pump prior to displacement saturation. During displacement, the back pressure was gradually increased to 8 MPa, and the confining pressure was maintained 5 MPa higher than the inlet pressure throughout the process. When the displacement volume reached 3 pore volumes (PV), the upstream and downstream valves were closed. The gas flooding experiment was initiated once the system pressure stabilized.
④ CO2 injection: The temperature of the thermostat chamber was adjusted to 75 °C, and the confining pressure was slowly increased to 8 MPa using a hand pump. The upstream valve was slowly opened, and CO2 was injected at a constant pressure of 15 MPa. After the system pressure was basically stable, the injection valve and pump were closed, and the core was soaked for 4 h.
⑤ Production stage: After the soaking period, the initial back pressure was set to 7 MPa, and the inlet valve was slowly opened to produce crude oil. When the system pressure dropped to 0, and no crude oil was produced at the outlet, this huff-n-puff cycle was completed. The core was then taken out and weighed.
⑥ NMR testing: T2 spectrum and NMR imaging tests were performed on the core after this cycle to obtain the NMR T2 spectrum curve and imaging results of a single CO2 huff-n-puff cycle.
⑦ Multi-cycle experiments: Experimental steps ④ to ⑥ were repeated, and a total of 4 CO2 huff-n-puff cycles were conducted.
Due to the strong heterogeneity of tight cores and the non-steady-state nature of the online NMR-monitored CO2 huff-n-puff process, strict parallel repetition was difficult to achieve in this study. Different core samples may exhibit significant differences in pore structure, permeability, and fluid occurrence characteristics, making it difficult to obtain fully equivalent parallel samples. In addition, after one complete huff-n-puff experiment, the fluid distribution and seepage state inside the core are irreversibly altered; therefore, the same core cannot be reused for repeated testing without introducing the influence of the previous experiment.
To improve the reliability of the experimental results, all tests were carried out following consistent procedures and under unified operating conditions. The core preparation process, water invasion zone establishment method, injection–soaking–production procedure, NMR acquisition parameters, and data-processing methods were kept consistent throughout the study. Moreover, the experimental results were analyzed together with numerical simulation results to strengthen the reliability of the identified development trends and mechanism interpretation. It should, therefore, be noted that this study emphasizes mechanism identification and comparative analysis of parameter effects under controlled conditions rather than statistical repeatability based on strict parallel repetitions.
2.1.2. CO2 Huff-n-Puff Experiments for Crude Oil Displacement Under Water Invasion Zone Conditions
- Experimental materials
The oil sample used in this experiment was identical to the degassed crude oil sample described in Section 2.1.1, with detailed crude oil compositions listed in Table 1. The core sample had previously been subjected to CO2 huff-n-puff experiments under water invasion-free conditions in Section 2.1.1; it was cleaned with petroleum ether and dried prior to reuse. In the imbibition oil displacement experiment, a 7 wt% MnCl2 solution was employed to simulate the water invasion zone, ensuring that all hydrogen signals detected by NMR originated solely from the experimental oil sample.
It should be noted that the MnCl2 solution is a simplified substitute rather than a fully equivalent representation of the actual retained fracturing fluid. Compared with field fracturing-fluid retention, differences may exist in viscosity, salinity, additive composition, and fluid–rock interaction behavior. Therefore, this study mainly focuses on revealing the physical damage mechanism of water-phase occupation and water blocking on CO2 huff-n-puff performance under controlled conditions.
- 2.
- Experimental apparatus
The huff-n-puff experimental setup was consistent with the one-dimensional core huff-n-puff apparatus detailed in Section 2.1.1, and the huff-n-puff experimental procedures in this work were the same as those in Section 2.1.1. Prior to the huff-n-puff tests, an imbibition experiment was performed on oil-saturated cores to construct the water invasion zone within the core sample.
- 3.
- Imbibition Experiments on Oil-Saturated Cores
This experiment aimed to prepare oil-saturated cores with a water invasion zone to investigate the mobilization characteristics of pore crude oil during CO2 huff-n-puff under water-invaded conditions. The core was cleaned and dried at 100 °C in accordance with the petroleum industry standard SY/T 5336-2006. After vacuum evacuation for 24 h and crude oil saturation at 20 MPa, the core was weighed and tested via NMR. The core was loaded into the core holder and aged for 24 h at the target temperature. A confining pressure of 5 MPa was applied, and the system was evacuated before displacement saturation; the back pressure was controlled at 8 MPa, with the confining pressure maintained 5 MPa higher than the injection pressure throughout. The core was removed after 3 pore volumes (PV) of displacement. The lateral surface of the core was sealed with high-temperature resistant waterproof tape, leaving 2–3 cm of the end faces exposed. The core was then immersed in a 7 wt% MnCl2 solution for 12 h of imbibition at a constant pressure of 8 MPa to construct the water invasion zone. After removing the tape, the core was weighed and subjected to NMR imaging and T2 spectrum tests.
- 4.
- CO2 Huff-n-Puff Experiments on Cores with Water Invasion Zone
This experiment investigated the effect of CO2 huff-n-puff on crude oil mobilization characteristics in core pores in the presence of a water invasion zone. The detailed experimental procedures are as follows:
① CO2 injection: The thermostat chamber temperature was adjusted to 75 °C, and the confining pressure was slowly increased to 10 MPa using a hand pump. The upstream valve was slowly opened, and CO2 was injected at a constant pressure of 8 MPa. Once the system pressure was basically stable, the injection valve and pump were closed, and the core was soaked for 4 h.
② Production stage: After the soaking period, the initial back pressure was set to 7 MPa, and the inlet valve was slowly opened to produce crude oil. This huff-n-puff cycle was completed when the system pressure dropped to 0 and no crude oil was produced at the outlet; the core was then removed and weighed.
③ NMR imaging and T2 spectrum tests: The core was tested for T2 spectrum and NMR imaging after this cycle to obtain the NMR imaging and T2 spectrum curves of one CO2 huff-n-puff cycle.
④ Multi-cycle experiments: Experimental steps ① to ③ were repeated, and a total of 4 CO2 huff-n-puff cycles were conducted.
2.2. Numerical Simulation Model Design
2.2.1. Numerical Simulation Model Design
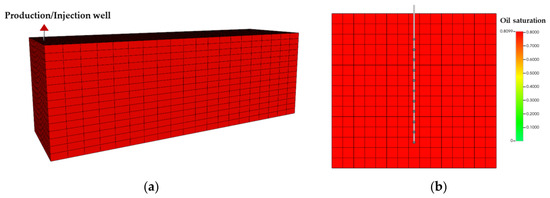
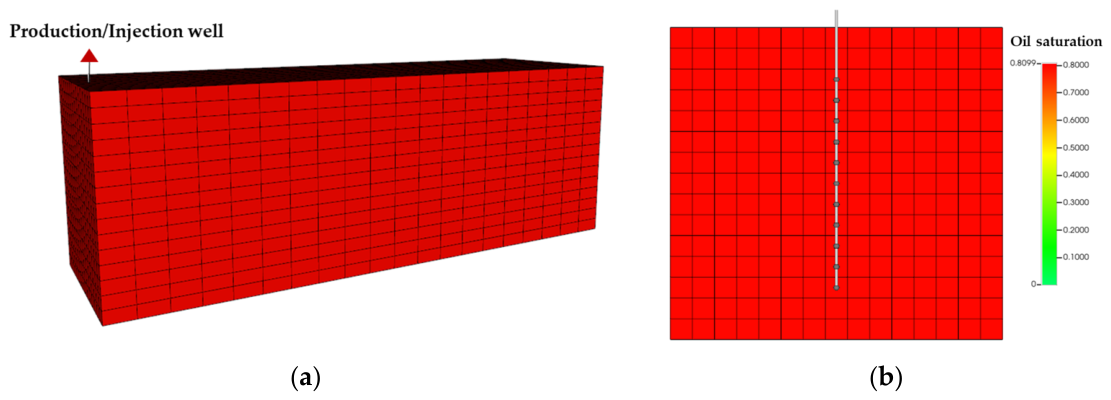
A compositional reservoir numerical simulation tool, CMG-GEM, was employed to construct a mechanistic model (Figure 2) for CO2 huff-n-puff development in tight oil reservoirs so as to characterize the diffusion behavior of CO2 within the reservoir and the displacement and mobilization process of crude oil in matrix pores. The basic reservoir physical properties used in the model, including porosity, permeability, and fluid properties, were consistent with those of the core samples applied in the physical experiments in Section 2.1, ensuring that the simulation conditions matched the experimental scenarios.
Figure 2.
(a) Grid model of CO2 huff-n-puff; (b) schematic of perforation location.
The numerical model in this study is constructed based on core-scale parameters and adopts a homogeneous porous medium assumption. The water invasion zone is represented as a region with modified fluid distribution and reduced effective permeability and is assumed to be uniformly distributed. Therefore, pore-scale connectivity heterogeneity and the spatial non-uniformity of water invasion are not explicitly considered in the present model.
It should be noted that in actual tight cores, pore connectivity is often highly heterogeneous, and the water invasion zone may exhibit significant spatial variability, leading to preferential flow paths and localized blocking effects. As a result, the simulation results in this study mainly reflect the average behavior of the system and may not fully capture local heterogeneity effects. However, this simplification allows for a clearer analysis of the dominant mechanisms and the sensitivity of recovery performance to operational parameters.
A Cartesian grid system was applied to establish a cuboid numerical simulation grid model for a fractured matrix corresponding to a unit-area fracture. The model dimensions were 15 cm × 4.5 cm × 4.5 cm, with a grid count of 22 × 17 × 17. The injection and production well was the same vertical well, extending along the K-direction from grid coordinates (2, 9, 16) to (2, 9, 4). Perforations were distributed along the K-direction from grid coordinates (2, 9, 14) to (2, 9, 4), totaling 10 perforation clusters. Porosity, permeability, and oil saturation in the reservoir model were set to be uniformly distributed. According to the physical properties of the Chang 7 tight reservoir, matrix porosity was set to 0.1 and matrix permeability to 0.0001 μm2. Referring to actual reservoir conditions, the temperature was set to 75 °C, the reservoir depth to 2400 m, and the initial formation pressure to 10 MPa. In addition, the CO2 injection pressure was controlled at 15 MPa, and the BHP during production was maintained at 8 MPa. The relevant parameters are listed in Table 2.
Table 2.
Basic parameters of the numerical model.
2.2.2. Models with Different Water Invasion Zones
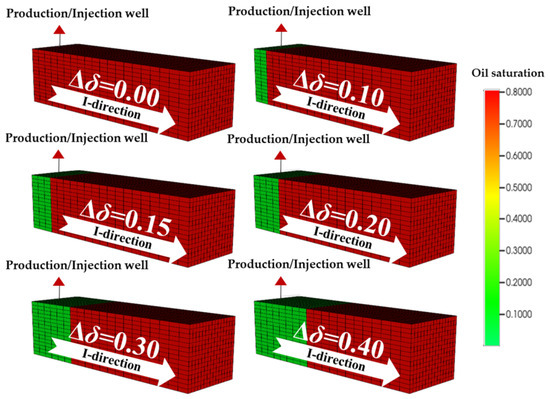
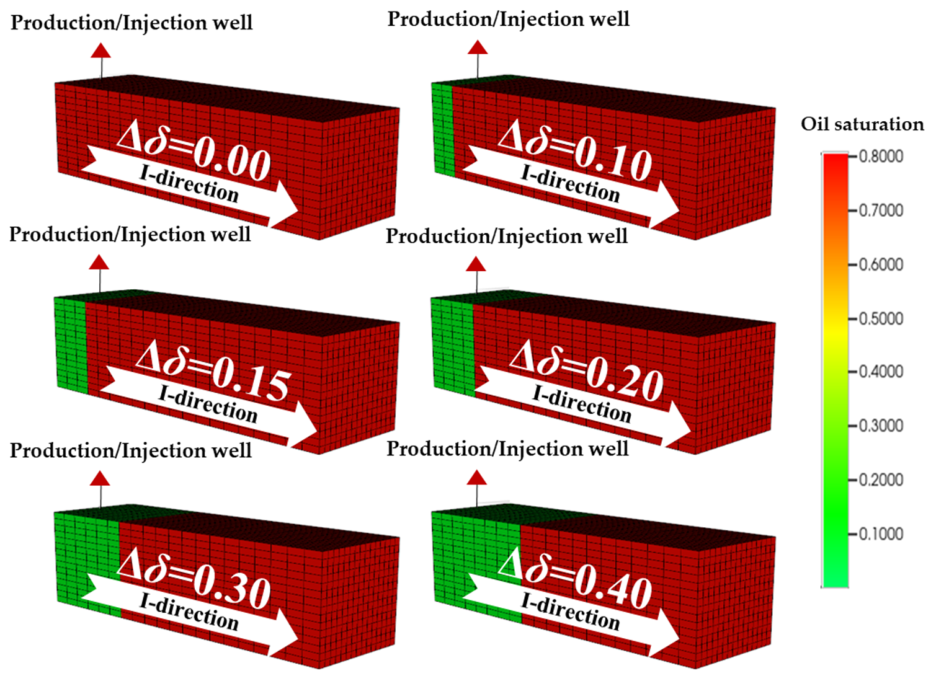
The length of the water invasion zone, formed by fracturing fluid retained in pores via imbibition after hydraulic fracturing, exhibits heterogeneity. Accordingly, the grid of the basic reservoir model for this numerical simulation was partitioned into two zones: the near-wellbore region covered by the water invasion zone was designated as Zone S1, and the oil-bearing region as Zone S2. Initially, the water saturation of Zone S1 was set above 90%, while that of Zone S2 was controlled at 10%. The length of the water invasion zone was characterized by the grid length of Zone S1 along the I-direction. Based on the model assumptions, the relative length of the water invasion Δδ in varied pores was defined as:
denotes the total grid length of Zone S1 along the I-direction, m; denotes the total grid length of Zone S2 along the I-direction, m.
As illustrated in Figure 3, the total of Zone S1 along the I-direction was set to 0 cm, 1.5 cm, 2.25 cm, 3.0 cm, 4.5 cm, and 6.0 cm sequentially in this study. Accordingly, a series of numerical simulation models was constructed, including the model with no water invasion zone in the matrix pores and the models with a relative water invasion zone Δδ of 0.1, 0.15, 0.2, 0.3, and 0.4.
Figure 3.
Schematic diagram of the relative length of the water invasion zone.
3. Results
3.1. Effect of Water Invasion Zone on Remaining Oil Distribution and Recovery Factor During CO2 Huff-n-Puff
- Variation in Remaining Oil Distribution
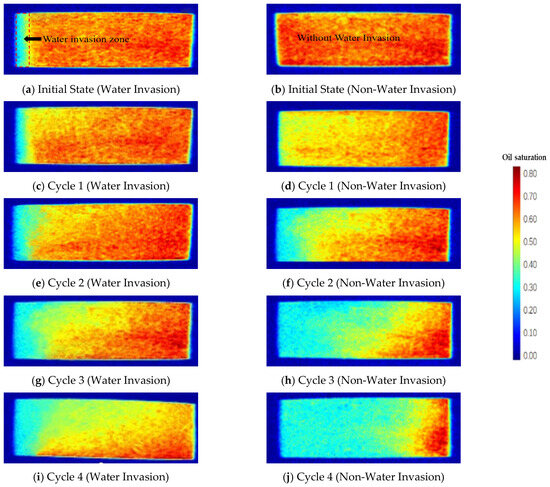
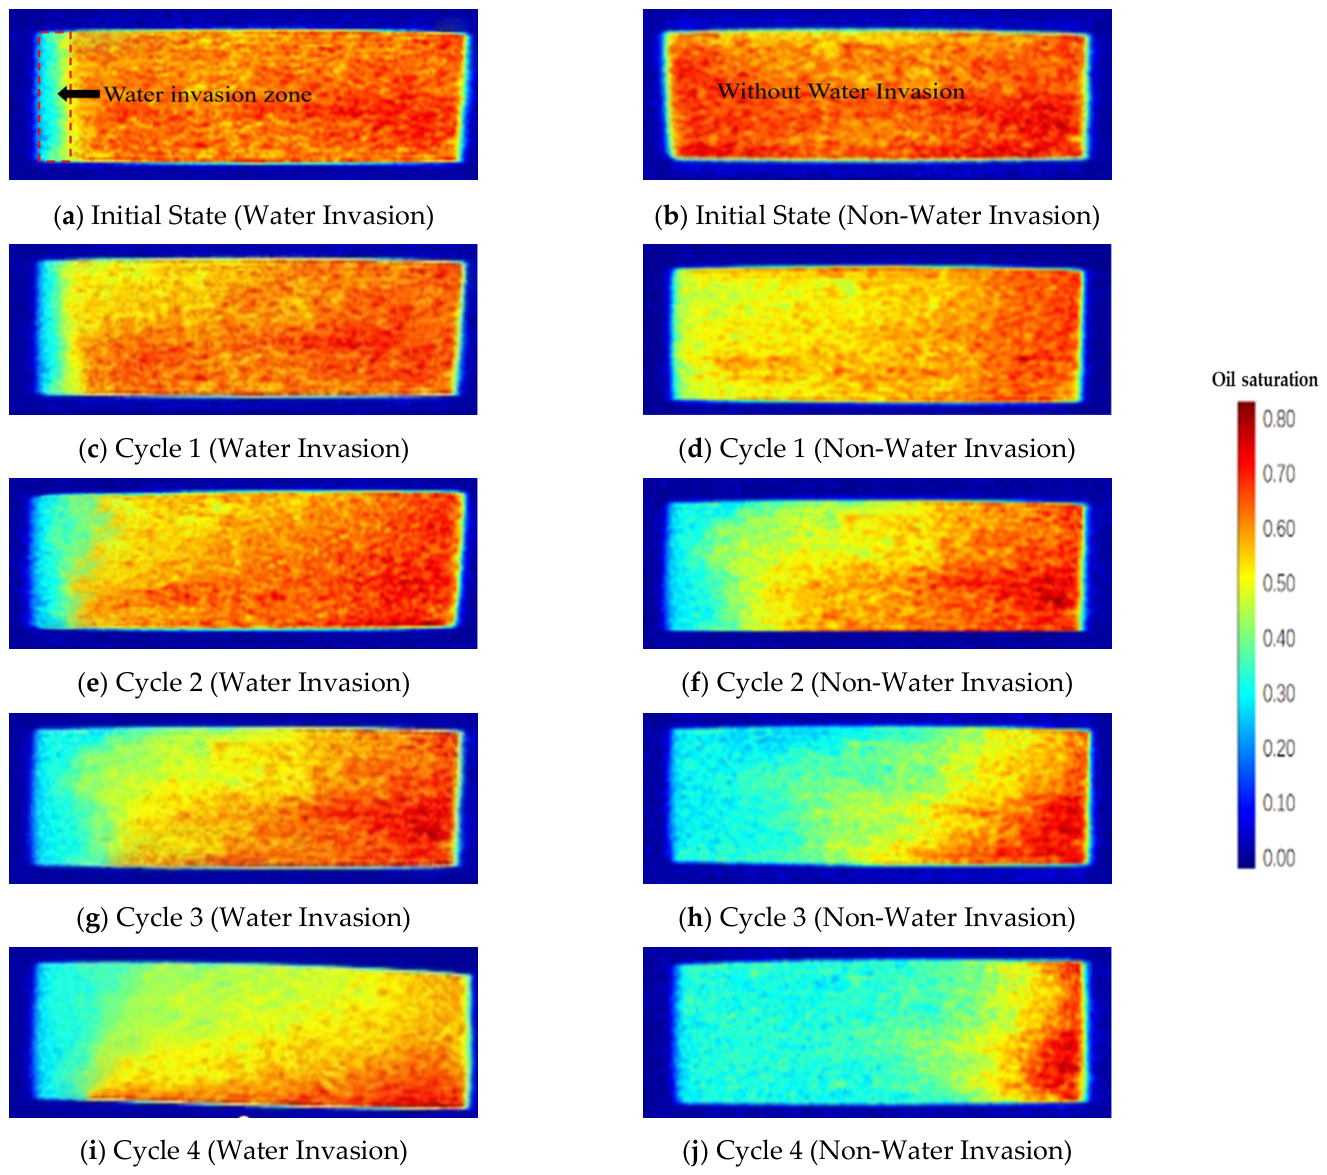
To investigate the intuitive impact of the water invasion zone on crude oil mobilization during CO2 huff-n-puff, core visualization characterization methods were adopted to compare and analyze the spatiotemporal evolution characteristics of the remaining oil content in cores with and without a water invasion zone at different CO2 huff-n-puff cycles. The results are displayed in Figure 4.
Figure 4.
Remaining oil distribution: with and without water invasion zone at different huff-n-puff cycles.
For the core without a water invasion zone, the remaining oil content decreases significantly with the increase of huff-n-puff cycles. The high remaining oil region (marked in red) inside the core continuously shrinks toward the distal end, while the low remaining oil region (marked in light tone) expands continuously. It is analyzed that without external interference, CO2 can freely percolate and diffuse toward the distal end along the matrix micropores and microfractures of the core. Multiple rounds of huff-n-puff further improve the contact efficiency between CO2 and crude oil, creating favorable conditions for crude oil production, and the remaining oil can be continuously and effectively mobilized.
For the core with a water invasion zone, the high remaining oil red region always occupies most of the core space at the same huff-n-puff cycle, and the expansion of the light-tone region is slow; the decline rate of remaining oil content is much lower than that of the core without a water invasion zone. Even after multiple rounds of huff-n-puff, the high remaining oil region shows no obvious shrinkage, and the remaining oil content remains at a high level. This is because the water invasion zone occupies the effective pore-fracture space of the reservoir and forms a continuous aqueous-phase barrier, which poses a significant physical barrier to the contact and mass transfer between CO2 and crude oil, restricts the diffusion range of CO2, and only allows local contact between CO2 and crude oil. As a result, the crude oil mobilization degree is greatly limited, and the remaining oil content in the core is eventually much higher than that of the core without a water invasion zone at the same cycle.
- 2.
- Variation in Recovery Factor
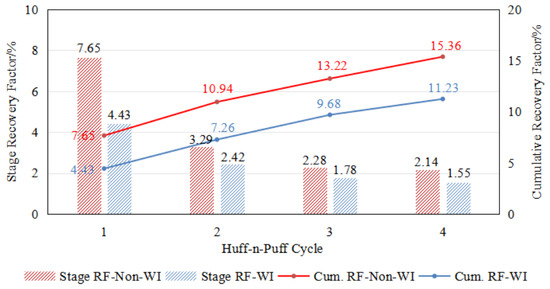
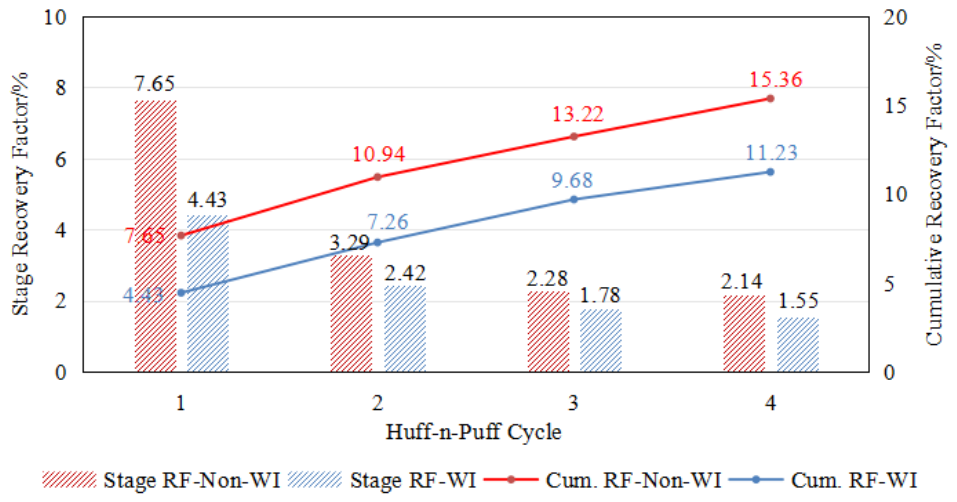
NMR T2 spectrum technology was employed to accurately and quantitatively characterize the remaining oil content inside the cores before and after different CO2 huff-n-puff cycles. Figure 5 shows the incremental recovery and cumulative recovery factors of crude oil in each cycle, which were calculated. As depicted in the histogram comparison of incremental recovery factor, the incremental recovery factor of the model without a water invasion zone is significantly higher than that of the model with a water invasion zone in all huff-n-puff cycles from the first to the fourth round. Specifically, the incremental recovery factor of the model without a water invasion zone is 7.65% in the first round, while that of the model with a water invasion zone is only 4.43%; the values are 3.29% and 2.42% for the second round, 2.28% and 1.78% for the third round, and 2.14% and 1.55% for the fourth round, respectively. This directly reflects the continuous hindering effect of the water invasion zone on single-cycle crude oil production.
Figure 5.
Incremental and cumulative recovery factors of cores with and without a water invasion zone.
The continuous inhibition can be attributed to the fact that the aqueous-phase barrier formed by the water invasion zone occupies the effective pore-throat space of the reservoir, which persistently restricts the seepage and diffusion range of CO2 in a single cycle, and continuously reduces the contact and mass transfer efficiency between CO2 and crude oil, thereby suppressing crude oil production in each huff-n-puff cycle.
From the perspective of the curve variation of cumulative recovery factor, the cumulative recovery factor of the model without a water invasion zone is always at a higher level, and the gap between the two models continues to widen with the increase of huff-n-puff cycles. At the end of the four-cycle huff-n-puff operation, the cumulative recovery factor of the model without a water invasion zone reaches 15.36%, while that of the model with a water invasion zone is merely 11.23%. The above results indicate that the water invasion zone exerts a significant and persistent blocking effect on crude oil production, resulting in an obvious reduction in the ultimate recovery factor of CO2 huff-n-puff development.
The barrier effect of the water invasion zone is continuously superimposed during multiple huff-n-puff cycles, which not only restricts crude oil production in each single cycle, but also delays the mobilization process of CO2 toward the remaining oil in the deep reservoir. Consequently, the crude oil production efficiency of the model with a water invasion zone is consistently lower than that of the model without a water invasion zone, and the recovery factor gap between the two models keeps expanding as the huff-n-puff cycles proceed.
3.2. Effect of Water Invasion Zone on Pore-Scale Remaining Oil Distribution
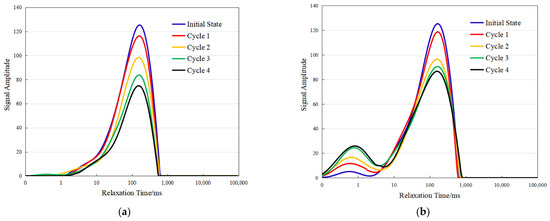
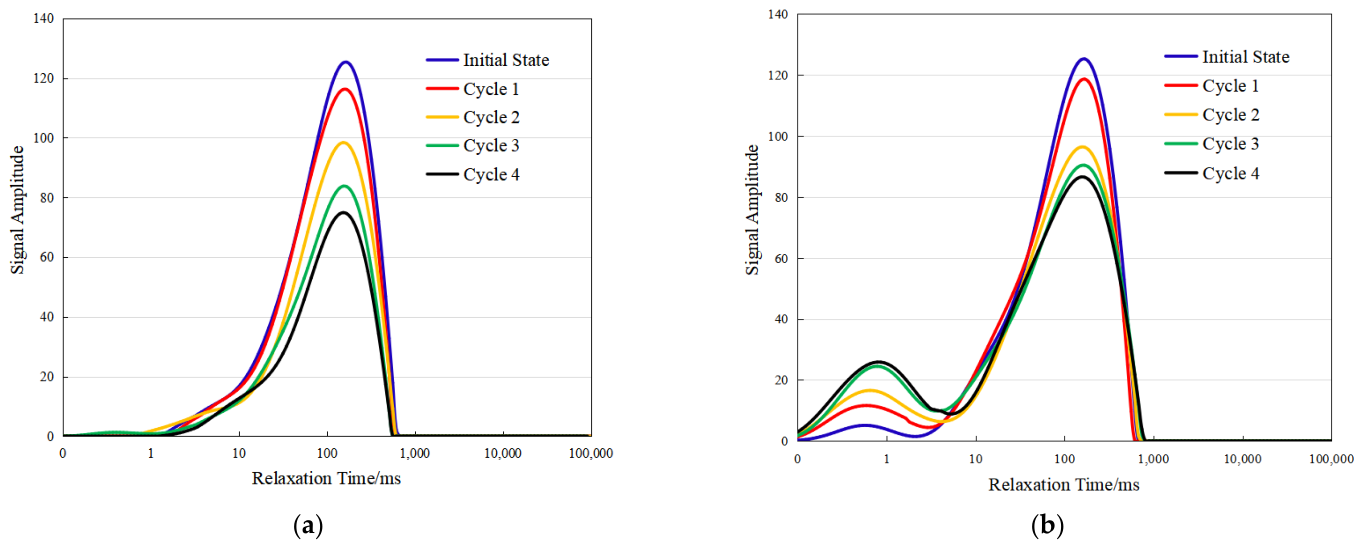
Figure 6 shows the T2 spectra of tight oil-saturated cores with and without water invasion at different CO2 huff-n-puff cycles under 75 °C and 15 MPa. The core without water invasion shows a single peak in the initial oil-bearing T2 spectrum, whereas the core with water invasion exhibits double peaks. The peak at 102–103 ms is consistent with that of the non-water-invaded core, and the peak at 0.1–1 ms corresponds to the characteristic signal of water invasion. This indicates that crude oil mainly occurs in large pores, and water invasion causes part of the crude oil to migrate from large pores to small pores, significantly enhancing the oil signal in small pores.
Figure 6.
T2 spectrum distribution curves at different huff-n-puff cycles. T2 spectrum distribution curves at different huff-n-puff cycles. (a) T2 spectrum without water invasion; (b) T2 spectrum with water invasion.
For the core without water invasion, the remaining oil T2 spectra maintain a single peak in all cycles. With increasing huff-n-puff cycles, the spectral amplitude decreases obviously in the first three cycles and slows down in the fourth cycle. Crude oil is mainly produced from large pores, while the recovery degree in small pores is relatively low, suggesting that CO2 huff-n-puff effectively recovers large-pore crude oil mainly in the first three cycles.
For the core with water invasion, the remaining oil T2 spectra retain double peaks throughout all cycles. In the first cycle, the large-pore signal decreases slightly while the small-pore signal increases sharply. In the second cycle, the large-pore signal shows the largest decline, and the small-pore signal rises slightly. In the third cycle, the decline of the large-pore signal weakens, and the increase in the small-pore signal reaches its maximum. In the fourth cycle, both large- and small-pore signals remain basically stable.
Table 3 shows that the area ratio of the left and right peaks in the water invasion core sample changed significantly under different huff-n-puff cycles. With increasing huff-n-puff cycles, the area ratio of the left peak increased from 1.63% to 19.74%, while the area ratio of the right peak decreased from 98.37% to 80.26%, indicating that the remaining oil’s occurrence gradually shifted from the medium to large pore throats to the confined space of small-pore throats. This suggests that during CO2 huff-n-puff, movable oil in medium to large pore throats is preferentially utilized, while the crude oil in small-pore throats is difficult to fully displace due to the water-phase barrier of the water-transgressed zone. Consequently, the remaining oil in the later stages mainly accumulates in the more confined pore-throat spaces, thus exhibiting a clear staged utilization characteristic.
Table 3.
The area ratio of the left and right peaks of cores with water invasion zones.
From the perspective of the pore mobilization mechanism, the aqueous barrier formed by water invasion prevents CO2 from contacting crude oil in the first cycle, so only a small amount of large-pore crude oil is produced, while part of the crude oil migrates to small pores under pressure. In the second cycle, the water-blocking zone is dispersed, allowing CO2 to effectively act on large pores and significantly improve their recovery degree. In the third cycle, little easily recoverable crude oil remains in large pores, and more pressure is used to displace the water-blocked pore throats, pushing crude oil into small pores. In the fourth cycle, the recoverable pores and crude oil approach the limit, and no obvious changes occur in either large- or small-pore signals.
By comparing the production characteristics of cores with and without water invasion, the production volumes are similar in the first and second cycles; in the third cycle, the core without water invasion still produces steadily, while the production of the water-invaded core is obviously lower; in the fourth cycle, both cores show low production. After four cycles of CO2 huff-n-puff, the cumulative production of the core without water invasion is higher, indicating that the water invasion zone significantly inhibits the development performance of CO2 huff-n-puff.
3.3. Effect of Different Water Invasion Zone Lengths on CO2 Huff-n-Puff Development Performance: (a) Without Water Invasion Zone; (b) with Water Invasion Zone
- Qualitative Analysis of Oil Saturation Field
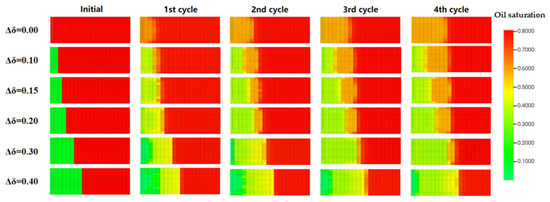
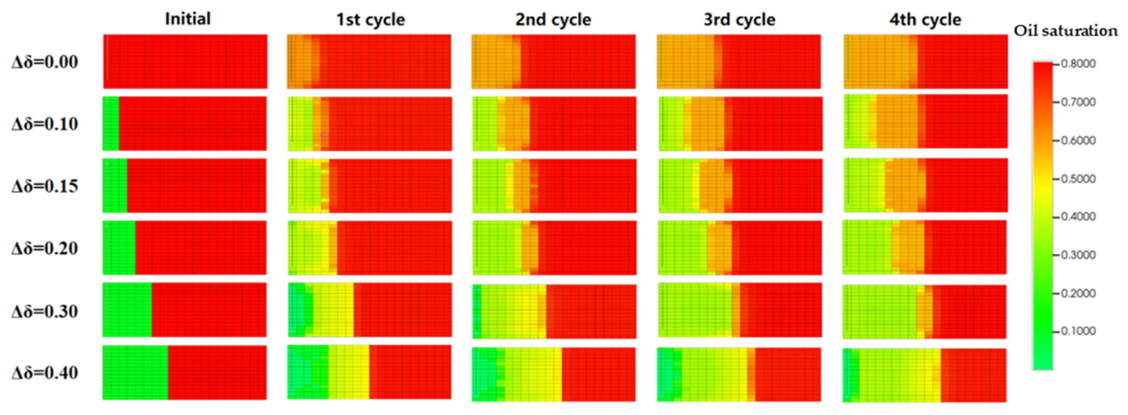
On the basis of clarifying the overall impact of the presence or absence of a water invasion zone, this study further focuses on the differential regulatory effect of water invasion zone length. Relying on the oil saturation field maps, the crude oil mobilization characteristics under different water invasion zone lengths are intuitively revealed, and the relevant results are shown in Figure 7.
Figure 7.
Oil saturation field distributions for models with different water invasion zone lengths at various huff-n-puff cycles.
When the relative length of the water invasion zone is 0 (i.e., no water invasion zone), the crude oil in the pores is continuously produced with the increase of huff-n-puff cycles. The oil saturation decreases gradually from the pore end to the near-wellbore end, and the crude oil mobilization area expands continuously, which directly reflects that the crude oil mobilization degree increases steadily with the rise of cycles. When an imbibed water shield exists in the system (i.e., when a water invasion zone occurs), the overall oil saturation still presents a distribution pattern of decreasing from the pore end to the near-wellbore end. However, with the increase of huff-n-puff cycles, the dimensionless effective area of crude oil mobilization (the area between the displacement front and the water invasion front) in each cycle is smaller than that without a water invasion zone, and the corresponding recovery factor is also lower.
The experimental results further indicate that the longer the relative length of the water invasion zone, the shorter the dimensionless effective distance of CO2, and the corresponding effective crude oil mobilization area shrinks accordingly, eventually resulting in a significant reduction in the crude oil recovery factor. It can be seen from the distribution characteristics of the oil saturation field in Figure 7 that as the relative length of the water invasion zone gradually increases, the dimensionless effective range of CO2 in the core continuously contracts, the oil saturation in the near-wellbore region decreases accordingly, and the high oil saturation area is continuously compressed into a narrow space on the right side of the core, showing an obvious decreasing trend in spatial sweep efficiency.
Compared with the short water invasion zone condition, CO2 is difficult to break through the aqueous-phase barrier and migrate to the deep core under the long water invasion zone, and the advancing distance of the displacement front is greatly limited. When the relative length of the water invasion zone reaches 0.4, even after four rounds of huff-n-puff, CO2 can only act within a very small range at the near-wellbore end of the core. The left side of the core is still in a low oil saturation state in a large area, and the deep high oil saturation area is only concentrated at the far-right end of the core, which cannot be effectively swept and mobilized.
This distribution characteristic fully confirms that there is a significant negative correlation between the water invasion zone length and CO2 utilization efficiency. A longer water invasion zone greatly shortens the effective action distance of CO2 and compresses the sweep volume, thereby severely inhibiting the crude oil mobilization effect and the overall recovery factor.
The results of this study indicate that the recovery factor decreases nonlinearly with increasing Δδ within the range of 0–0.4. It should be noted that this range corresponds to the typical scale of near-wellbore invasion under the present experimental conditions. For larger Δδ values, the water-phase barrier is expected to become more continuous and dominant, which may further inhibit CO2 transport. However, the reduction in recovery factor may gradually approach a plateau, indicating a diminishing sensitivity to further increases in Δδ.
Conversely, when Δδ is very small and approaches zero, the influence of water invasion becomes negligible, and the system’s behavior tends toward that of a water-free condition. Therefore, the nonlinear effect of Δδ is most pronounced within an intermediate range. The conclusions of this study are thus mainly applicable within the investigated range, and caution should be taken when extrapolating the results to larger-scale or more complex heterogeneous reservoirs.
- 2.
- Quantitative Analysis of Recovery Factor Curves
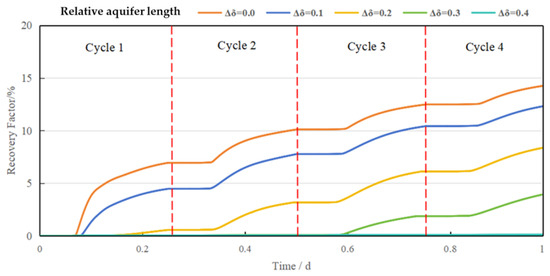
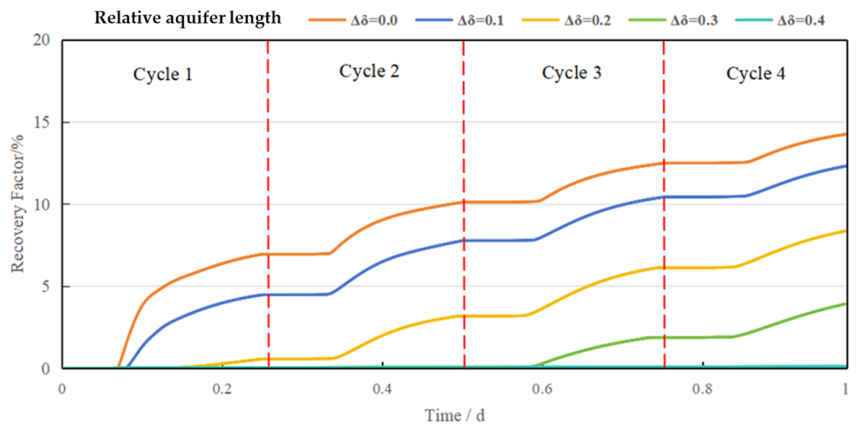
To quantify the impact of water invasion zone length, the recovery factor curves under different water invasion zone lengths were further analyzed, and the relevant results are displayed in Figure 8.
Figure 8.
Recovery factors of models with different water invasion zone lengths at each huff-n-puff cycle.
After four rounds of CO2 huff-n-puff, the ultimate recovery factors corresponding to different relative lengths of water invasion zone are as follows: 14.3896% for the case without water invasion (Δδ = 0), 12.4669% for Δδ = 0.1, 8.3757% for Δδ = 0.2, 3.6724% for Δδ = 0.3, and 0.1172% for Δδ = 0.4. The crude oil recovery factor exhibits a significant, nonlinear, sharp decline trend with the increase in water invasion zone length. Specifically, the recovery factor decreases by approximately 3.56 percentage points on average for every 0.1 increment in Δδ. Notably, when Δδ increases from 0.3 to 0.4, the recovery factor plunges from 3.6724% to 0.1172%, with a drastic reduction rate as high as 99.2%. This indicates that the inhibitory effect of the water invasion zone on the recovery factor amplifies exponentially once the length reaches a certain threshold. From the perspective of curve evolution characteristics, the longer the water invasion zone, the slower the growth rate of recovery factor with the increase in huff-n-puff cycles, which further corroborates the persistent inhibitory effect of the water invasion zone on the development performance of CO2 huff-n-puff.
According to the comprehensive qualitative and quantitative characterization results, the water invasion zone continuously occupies the effective pore-throat channels of the reservoir by expanding the spatial coverage of the aqueous-phase barrier, which significantly increases the seepage and diffusion resistance of CO2, thereby weakening the contact and mass transfer efficiency between CO2 and crude oil. Under the condition without a water invasion zone, CO2 can diffuse freely in the core, and the crude oil mobilization degree increases steadily with the rise of huff-n-puff cycles. When the water invasion zone exists, the oil saturation in the water-invaded region decreases rapidly, forming a stable seepage barrier that makes it difficult for the deep crude oil to be effectively swept and mobilized. The length of the water invasion zone is a key parameter that controls the performance of CO2 huff-n-puff. The longer its length, the greater the difficulty for CO2 to break through the aqueous-phase barrier, the shorter the dimensionless effective distance, the smaller the effective mobilization area, and the stronger the inhibitory effect on crude oil production, ultimately resulting in a significant reduction in the CO2 huff-n-puff recovery factor of tight cores.
3.4. Effect of Different Injection-Production Parameters on CO2 Huff-n-Puff Development Performance
In this study, the CO2 huff-n-puff model of a tight core with a water invasion zone parameter of Δδ = 0.3 was selected as the research object. Combined with field development practices and previous relevant research findings, five groups of time parameter combinations for gas injection, soaking, and production were constructed for comparative analysis, following the engineering design principle that the duration of gas injection and soaking is close, while the production duration is generally longer.
To accurately analyze the independent regulatory effects of injection duration, soaking duration, and production duration on the recovery factor of the model, the control variable method was adopted to carry out single-factor impact analysis. By fixing two types of time parameters and only changing a single time parameter, the action law of each time parameter was explored, respectively. Table 4 lists the numerical simulation cases designed for sensitivity analysis of the CO2 huff-n-puff process. A control variable method was adopted based on the mechanistic simulation model. First, a baseline case was defined with an injection duration of 1 h, soaking duration of 0.5 h, and production duration of 4 h. Then, one operational parameter was varied while the other two were fixed in order to evaluate its individual effect on the recovery factor. Specifically, production duration varied from 2 to 10 h, soaking duration from 0.5 to 2.5 h, and injection duration from 0.5 to 2.5 h. The selected ranges were centered around the baseline case and were intended to cover representative short, moderate, and relatively long operation times, thereby allowing systematic analysis of the sensitivity of recovery performance to each parameter while maintaining computational efficiency and physical relevance.
Table 4.
Design of different injection-soaking-production schemes.
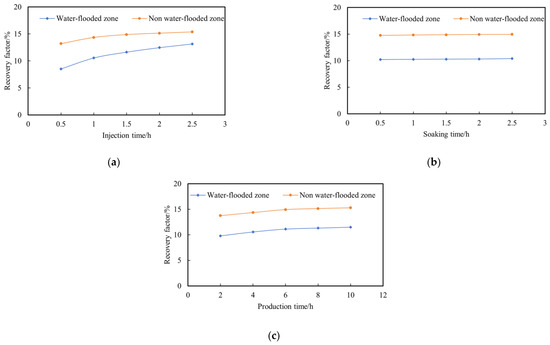
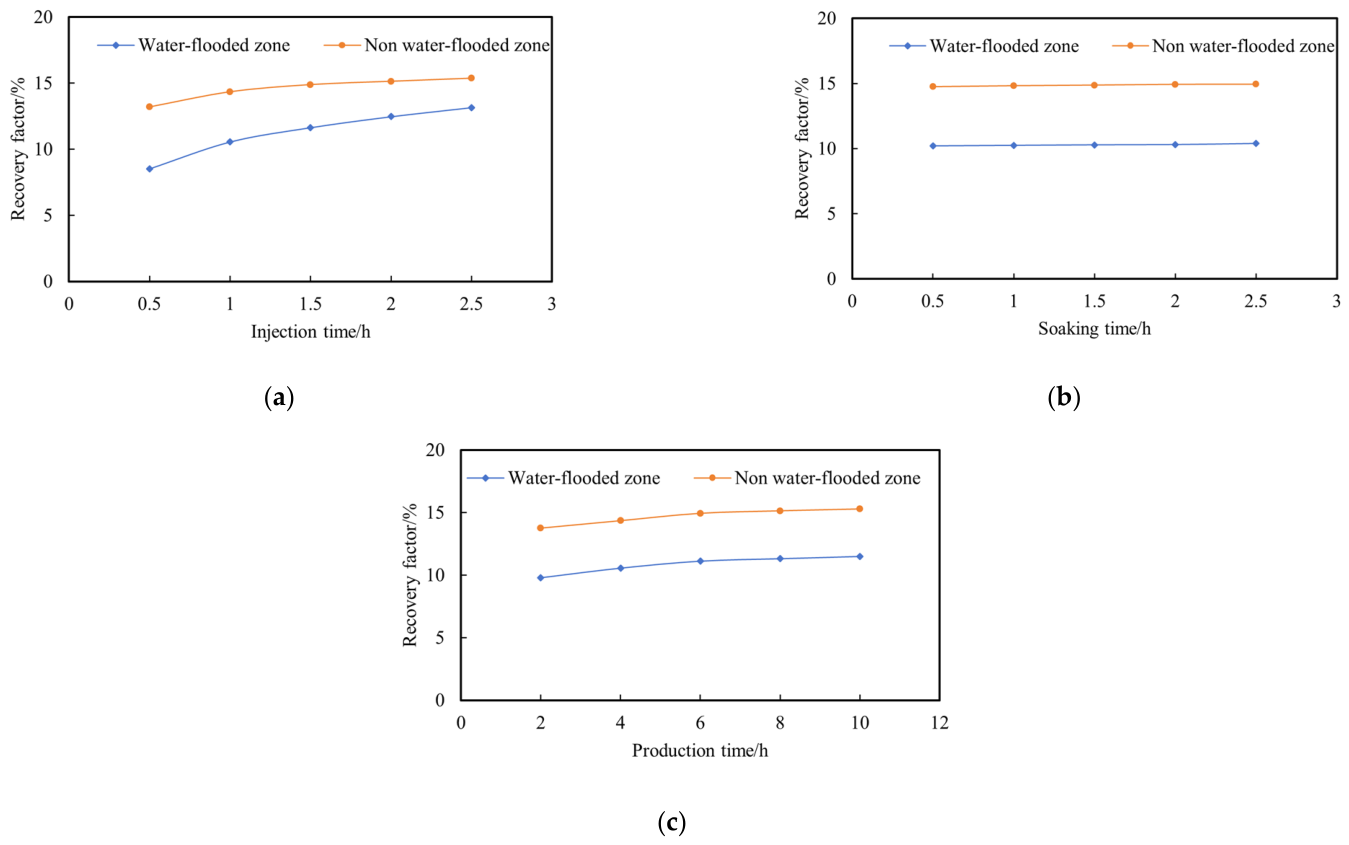
The experimental results are shown in Figure 9. By comparing the evolution laws of the recovery factor for models with and without a water invasion zone under different injection–soaking–production time parameter combinations, the regulatory characteristics and action differences of gas injection time, soaking time and production time on the CO2 huff-n-puff development performance of tight oil reservoirs under water invasion damage can be clarified, providing a quantitative basis for analyzing the regulatory mechanism of each time parameter on the blocking effect of the water invasion zone.
Figure 9.
Recovery factors under different injection, soaking and production durations. (a) Recovery factor under different injection durations; (b) Recovery factor under different soaking durations; (c) Recovery factor under different production durations.
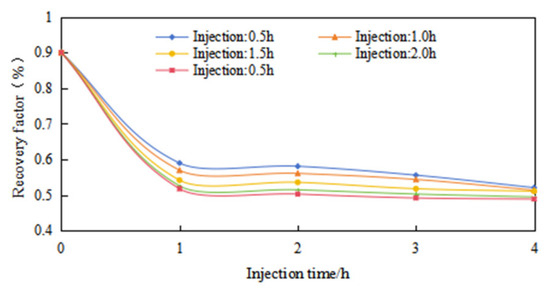
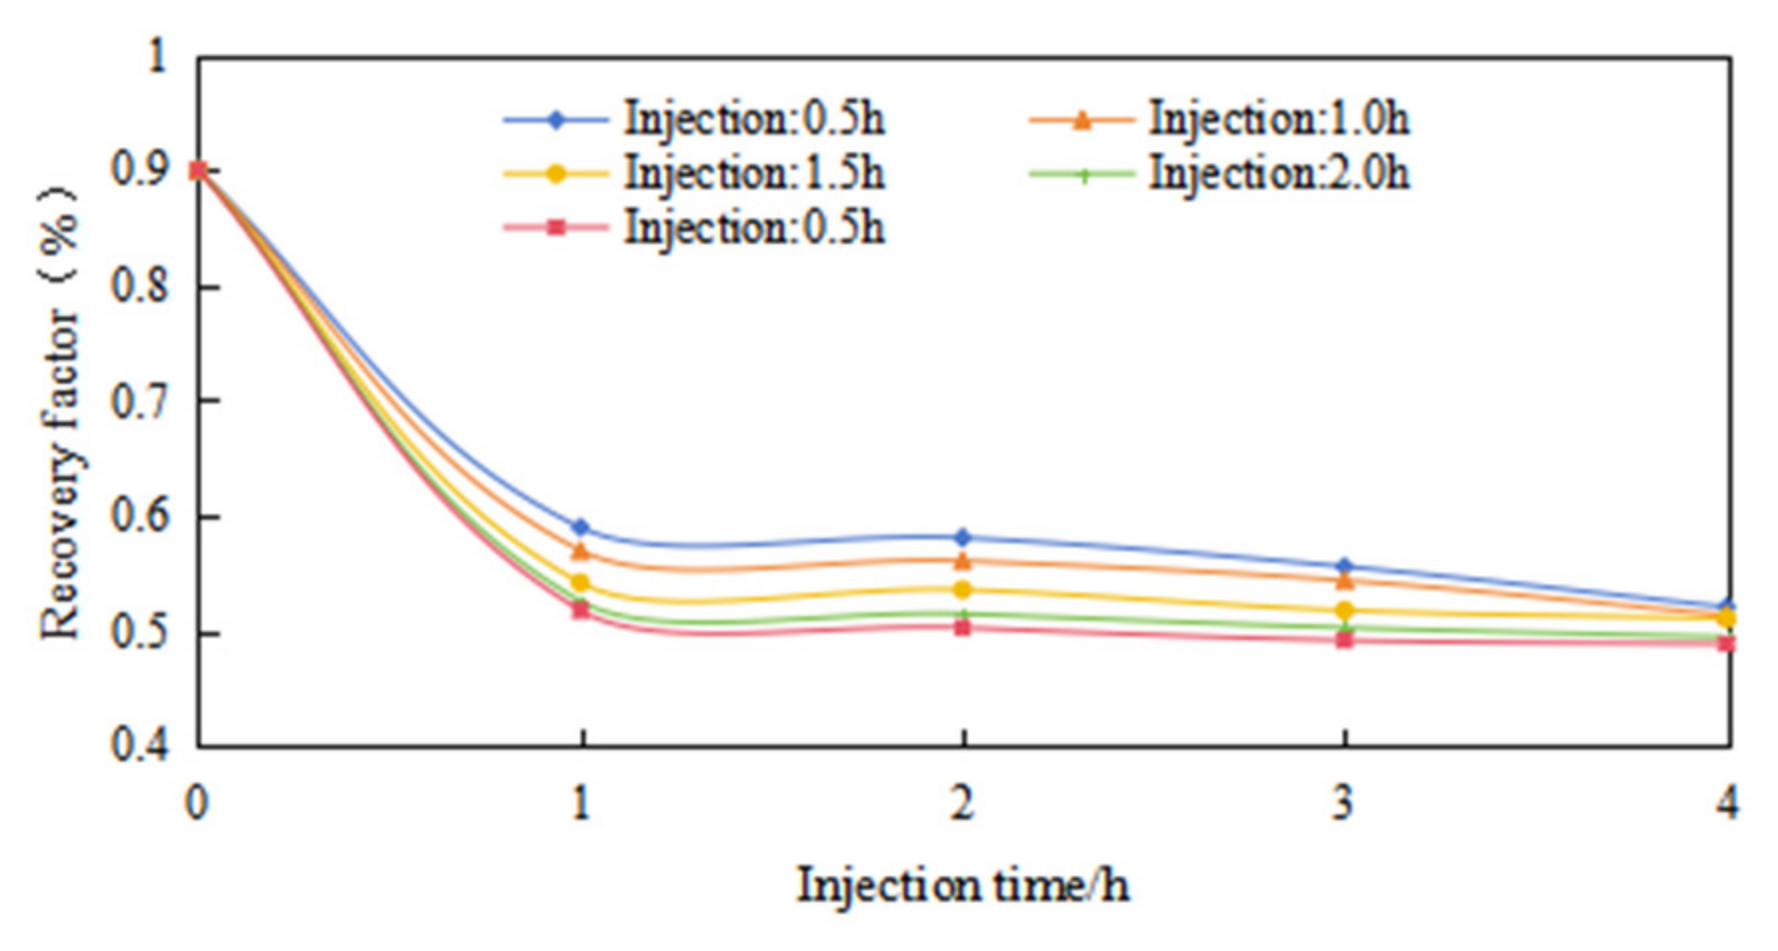
There is a significant difference in the enhancement effect of injection time on the recovery factor between models with and without a water invasion zone. When the injection time is gradually extended from 0.5 h to 2.5 h, the recovery factor of the model without a water invasion zone increases from 12.91% to 15.37%, with an amplitude of 2.46 percentage points. In contrast, the recovery factor of the model with a water invasion zone rises from 8.51% to 13.16%, with an increase of 4.65 percentage points, which is considerably higher than that of the non-water-invaded model. The evolution data of near-wellbore water saturation provide quantitative support for the above law (Figure 10): the initial water saturation is 0.9. After four cycles of huff-n-puff, the water saturation only drops to 0.455 under the 0.5 h injection time condition, while it can be reduced to 0.429 under the 2.5 h injection time condition. Moreover, the water saturation under long injection time conditions is obviously lower than that under short injection time conditions in each cycle. It can be seen that prolonging the injection time has a more significant improvement effect on the recovery factor of the model with a water invasion zone. This indicates that increasing the injection time can effectively reduce the water saturation of the water invasion zone, break the hindering effect of the water invasion zone on CO2 huff-n-puff, and weaken the blocking effect of the aqueous-phase barrier.
Figure 10.
Different cycles—water saturation variations.
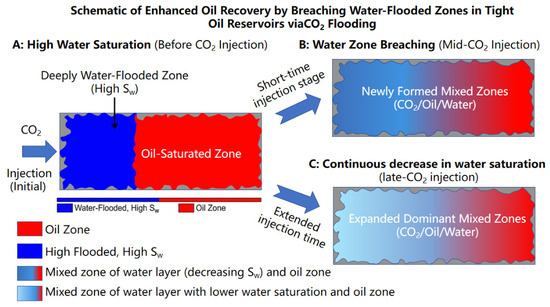
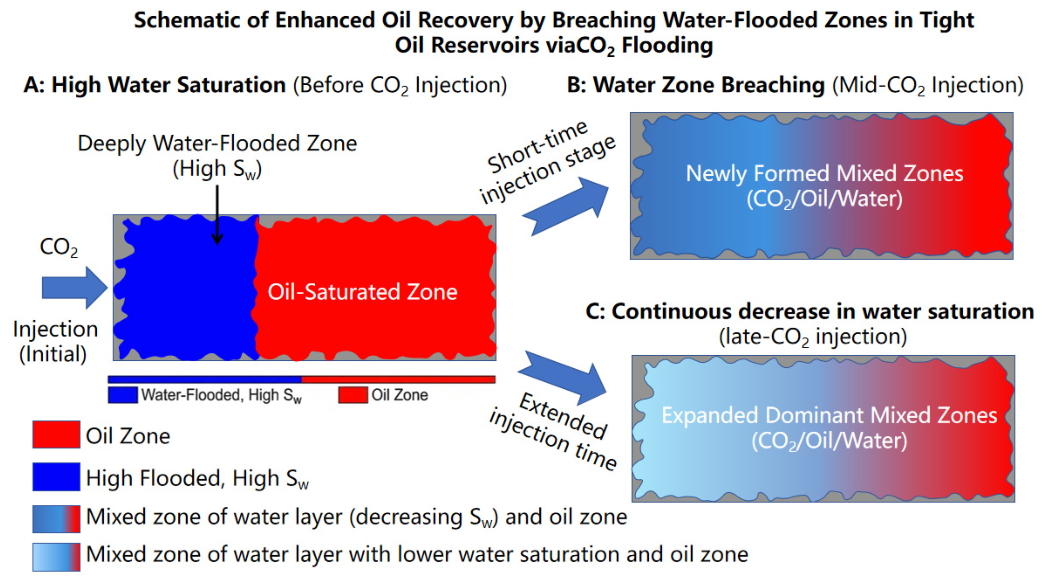
Figure 11 shows the schematic of the CO2 flooding mechanism for weakening water blocking. The essential obstruction of the water invasion zone to CO2 huff-n-puff stems from the continuous aqueous-phase barrier formed by high water saturation. This barrier occupies the effective pore throats of the reservoir, increases the seepage resistance of CO2, and restricts the diffusion and mass transfer of CO2 to the oil-layer region. Prolonging the injection time can strengthen the displacement effect of CO2 in the water invasion zone, promoting the continuous advancement of CO2 toward the deep part of the water invasion zone and the oil layer. On the one hand, it expands the effective sweep range of the water invasion zone; on the other hand, under the condition that the water content of the water invasion zone is basically constant, the overall water saturation of the water invasion zone is directly reduced through the expansion of the sweep range. This process gradually disintegrates the blocking effect of the aqueous-phase barrier, releases the pore-throat space occupied by the water phase, reduces the seepage resistance of CO2, enables more CO2 to break through the water invasion zone and contact with crude oil, and ultimately achieves a significant improvement in the recovery factor.
Figure 11.
Schematic of the CO2 flooding mechanism for weakening water blocking.
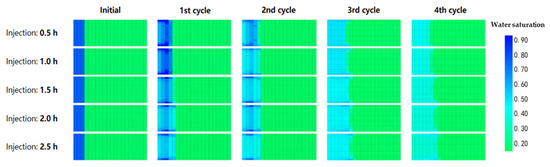
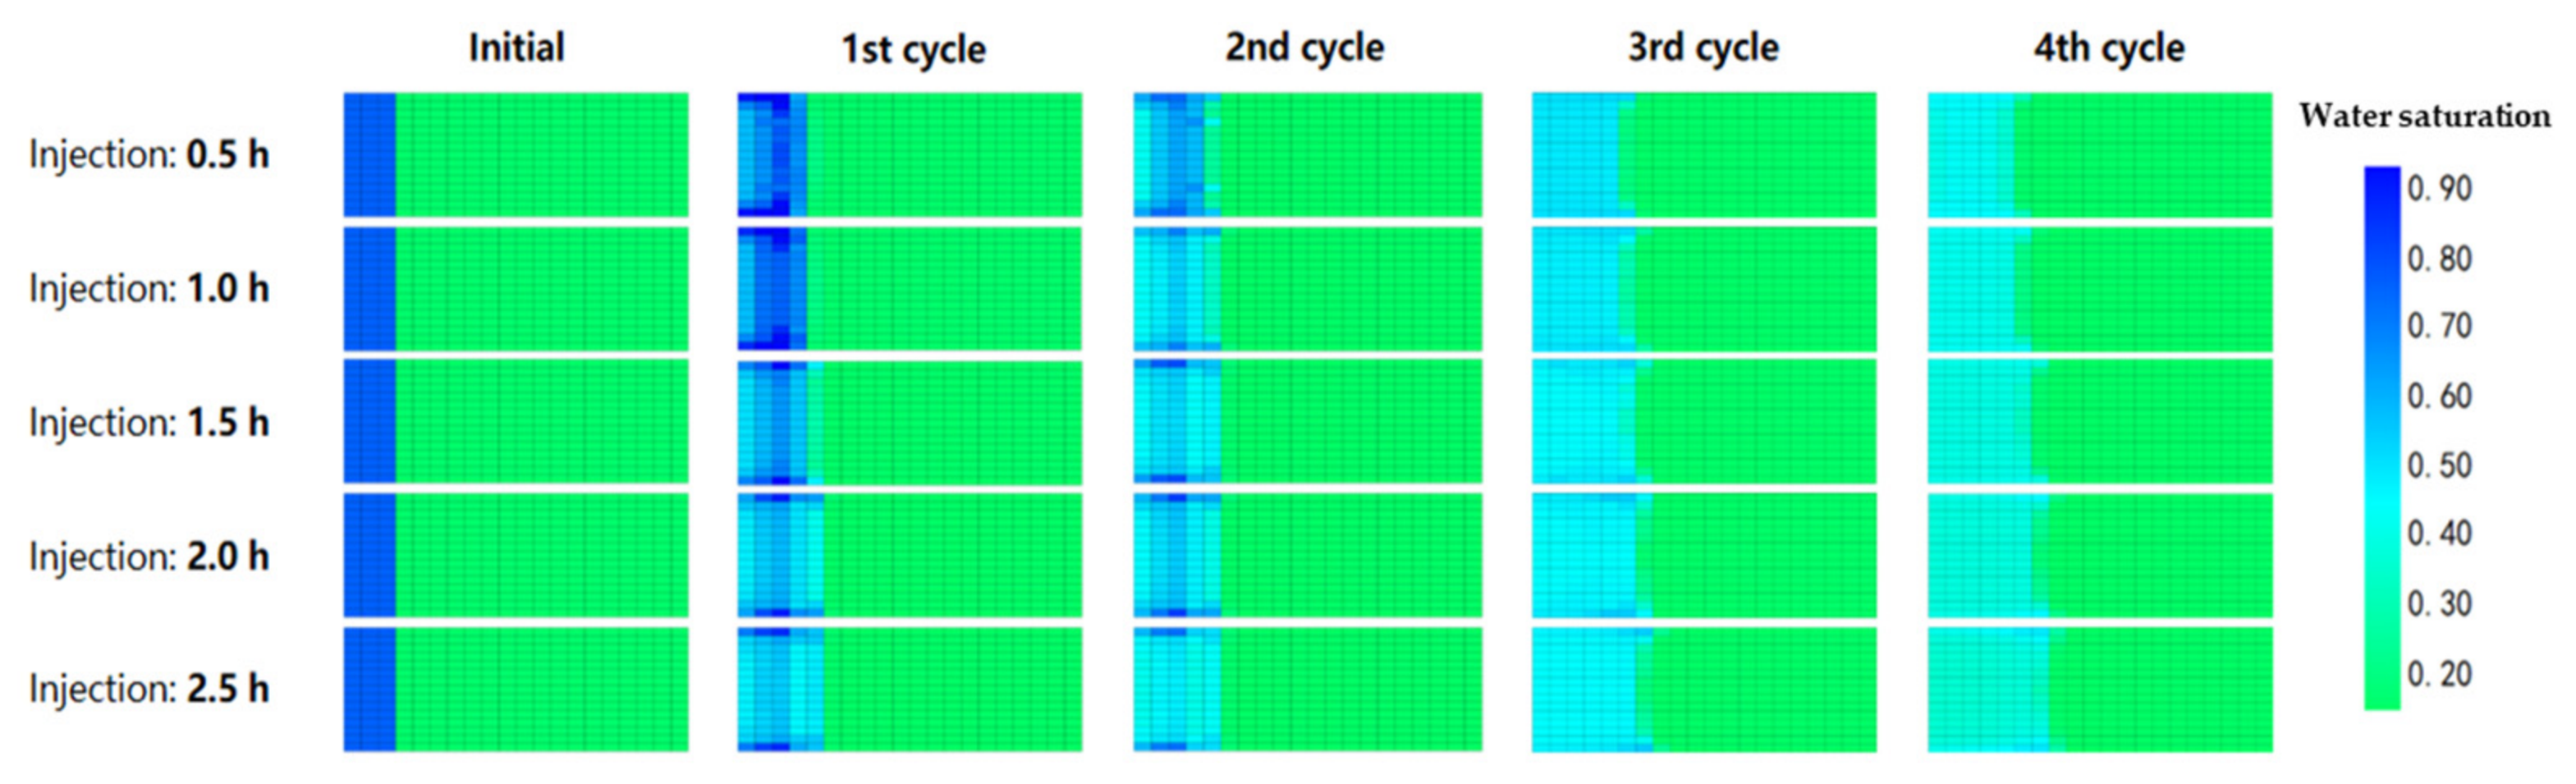
It can be clearly observed from the water saturation field distribution under different injection times (Figure 12) that with the increase in injection time, the water saturation of the water invasion zone decreases continuously, and the swept area of the water invasion zone increases significantly. Under the short injection time condition of 0.5 h, many medium water saturation areas still remain in the water invasion zone, and the blocking effect of the aqueous-phase barrier is strong. Under the long injection time condition of 2.5 h, the water invasion zone basically presents a wide range of low water saturation characteristics, and the aqueous-phase hindrance is greatly weakened. This evolutionary characteristic indicates that prolonging the injection time can expand the swept range of the water invasion zone. With a fixed water content in the water invasion zone, the expansion of the swept area will directly reduce its water saturation. Prolonging the injection time can increase the injection volume and displacement intensity of CO2 in the water invasion zone, promoting the diffusion of CO2 toward the deep part of the water invasion zone and the oil layer, thereby expanding the effective swept area of the water invasion zone. The expansion of the swept range directly reduces the water saturation of the water invasion zone, thereby weakening the blocking effect of the aqueous-phase barrier on CO2 flow, making it easier for CO2 to break through the water invasion zone and contact with crude oil for mass transfer, and ultimately achieving a significant improvement in the recovery factor.
Figure 12.
Water saturation field maps at each cycle under different injection durations.
For the CO2 huff-n-puff model in water-invaded tight oil reservoirs, increasing the injection time serves as a key regulatory measure to weaken the blocking effect of the water invasion zone and improve crude oil recovery. Its essence is to enhance the CO2 displacement effect, expand the sweep range of the water invasion zone, and reduce its water saturation, thereby elevating the crude oil recovery factor.
From an engineering perspective, the extension of injection duration can enhance CO2 penetration and improve the contact efficiency between injected gas and crude oil, which is particularly beneficial in tight reservoirs with strong water-blocking effects. However, the applicability of this strategy depends on reservoir conditions such as permeability, thickness, and well spacing. Under limited pressure support or large well spacing, prolonged injection may be necessary to achieve sufficient sweep.
It should also be noted that excessively long injection durations may lead to diminishing recovery improvement and increased operational costs. Therefore, the optimization of injection time should balance recovery enhancement and economic efficiency. The findings of this study provide a qualitative basis for parameter optimization, while specific operational schemes should be determined in combination with field conditions.
The present study focuses on fluid flow and mass transfer mechanisms during CO2 huff-n-puff under water-invaded conditions. Processes such as colloid migration and permeability degradation induced by plastic deformation under cyclic loading are not explicitly considered in the current experimental and numerical framework. These effects may further influence pore structure evolution and flow capacity in real reservoirs, especially over long-term production [19]. Therefore, the results of this study mainly reflect the dominant fluid-driven mechanisms, and the potential coupling with solid migration and geomechanical effects should be further investigated in future work.
4. Conclusions
(1) The water invasion zone can significantly inhibit the CO2 huff-n-puff performance in tight oil reservoirs by blocking the seepage and diffusion of CO2, as well as the contact mass transfer between CO2 and crude oil, resulting in a decline in remaining oil recovery efficiency. This barrier effect is continuously superimposed during multiple huff-n-puff cycles. The remaining oil reduction amplitude, periodic recovery factor, and cumulative recovery factor of the model with water invasion are significantly lower than those of the model without water invasion in each cycle. After four cycles, the cumulative recovery factor of the model with water invasion is 11.23%, which is 4.13 percentage points lower than that of the model without water invasion.
(2) There are significant differences in the NMR T2 spectrum characteristics and pore crude oil mobilization laws of CO2 huff-n-puff in tight cores under conditions with and without a water invasion zone. For cores without a water invasion zone, the T2 spectrum presents a single-peak structure, and crude oil mobilization is concentrated in large pores, mainly occurring in the first three cycles. For cores with a water invasion zone, the T2 spectrum shows a unique double-peak structure, and crude oil mobilization exhibits staged characteristics: the mobilization of large pores is restricted while crude oil in small pores migrates in the first cycle; the mobilization of large pores peaks in the second cycle; the signal amplitude of crude oil in small pores increases significantly in the third cycle; and the mobilization of crude oil in both large and small pores approaches the limit in the fourth cycle.
(3) The CO2 huff-n-puff recovery factor of tight oil reservoirs shows a nonlinear and sharp decay with the increase of the relative length of the water invasion zone, which is the key controlling factor affecting the development performance. When Δδ increases from 0 to 0.4, the recovery factor after four cycles plunges from 14.3896% to 0.1172%, with a reduction rate of 99.2%. The recovery factor decreases by an average of 3.56 percentage points for every 0.1 increment in Δδ, and the decay rate of the recovery factor increases exponentially when Δδ exceeds 0.3. The essential mechanism is that the expansion of the water invasion zone length enlarges the coverage of the aqueous-phase barrier, leading to a sharp decline in the contact mass transfer efficiency between CO2 and crude oil.
(4) The injection, soaking, and production time parameters exhibit distinctly different regulatory effects on the CO2 huff-n-puff performance of tight oil reservoirs under water invasion damage. Among them, injection time is the key parameter that weakens the barrier effect of the water invasion zone and improves the recovery factor, while the soaking and production times have no obvious improvement effect. Control variable analysis shows that prolonging the injection time leads to a significantly higher increase in the recovery factor of the model with water invasion than that without water invasion and significantly reduces the near-wellbore water saturation. Extending the injection time can strengthen the CO2 displacement intensity and expand the sweep range of the water invasion zone, effectively reducing its water saturation under the condition of basically constant water content in the water invasion zone, weakening the blocking effect of the aqueous-phase barrier, and improving the seepage and mass transfer conditions of CO2, thereby significantly enhancing the crude oil recovery factor of CO2 huff-n-puff in water-invaded tight oil reservoirs.
Author Contributions
Conceptualization, F.Z.; software, C.W.; validation, S.X.; writing—original draft preparation, D.T.; writing—review and editing, S.H. All authors have read and agreed to the published version of the manuscript.
Funding
This research was funded by the National Natural Science Foundation of China (NO. 52174039).
Data Availability Statement
The datasets used or analyzed during the current study are available from the corresponding author on reasonable request.
Conflicts of Interest
The authors declare that they have no known competing financial interests or personal relationships that could have appeared to influence the work reported in this paper.
References
- Liu, J.; He, K.; Liu, S.; Meng, S.; Zhang, D.; Sun, W. Water blockage occurrence and evolution dynamics in tight oil reservoirs in post-hydraulic fracturing. J. China Univ. Pet. (Nat. Sci. Ed.) 2025, 49, 152161. [Google Scholar] [CrossRef]
- Jia, C.; Zheng, M.; Zhang, Y. Unconventional hydrocarbon resources in China and the prospect exploration and development. Pet. Explor. Dev. 2012, 39, 129136. [Google Scholar] [CrossRef] [Scilit]
- Xu, F.; Xu, Y.; Chen, D.; Li, J.; Wang, Y.; Shao, Z. An analytical method for continuously monitored pressure data in fractured horizontal wells in tight oil reservoirs. Well Test. 2025, 34, 5662. [Google Scholar] [CrossRef]
- Li, G.; Zhu, R. Progress, challenges and key issues of unconventional oil and gas development of CNPC. China Pet. Explor. 2020, 25, 113. [Google Scholar] [CrossRef]
- Liu, Y.; Liu, C.; Liu, X. Research status and prospects of mechanisms and technologies for enhanced oil recovery by CO2 injection in tight oil reservoirs. Acta Pet. Sin. 2026, 47, 198216. [Google Scholar] [CrossRef]
- Yang, Y.; Zhang, Y.; Teng, X.; Li, Y.; Ci, J.; Wang, J. Numerical simulation study on CO2 huff-n-puff for enhanced oil recovery in tight oil reservoirs. Petrochem. Ind. Technol. 2025, 32, 171173. [Google Scholar] [CrossRef]
- Zhang, D.; Dai, C.; Chen, S.; Xue, L.; Liu, Y. Intelligent history matching of CO2 huff-n-puff in tight oil reservoirs considering multi-scale fracture characterization. Pet. Geol. Recover. Eff. 2022, 29, 160167. [Google Scholar] [CrossRef]
- Duan, L.; Ma, N.; Li, D. Study on development methods of CO2 huff and puff for multi-stage fracture horizontal well in tight oil reservoirs. Energy Environ. Prot. 2018, 4, 7780. [Google Scholar] [CrossRef]
- Yang, Z.; Zhou, W. Experimental Study on Micro-production of Multi-type Gas Flooding in Tight Reservoirs. Contemp. Chem. Ind. 2025, 54, 1067. [Google Scholar] [CrossRef]
- Chen, X.; Fan, Y. Study on CO2 huff and puff technology in tight reservoir. Petrochem. Ind. Appl. 2021, 40, 812. [Google Scholar] [CrossRef]
- Lan, J.; Tang, F.; Xie, D.; Liang, X.; Mao, J.; Wang, G. Study on Enhanced Oil Recovery by CO2 Flooding in Tight Oil Reservoirs. Contemp. Chem. Ind. 2023, 52, 9971001. [Google Scholar] [CrossRef]
- Wang, D.; Liu, F.; Jia, N.; Li, G.; Song, K.; Hu, Z.; Shi, Y. Pore-scale modeling of two-phase fluid flow in fracturing-shutin-flowback process of tight oil reservoirs. J. China Univ. Pet. (Nat. Sci. Ed.) 2025, 49, 101111. [Google Scholar] [CrossRef]
- Deng, C.; Zhao, Y.; Su, M.; Cai, Y. Low Damage Recyclable Clean Fracturing Fluid System Suitable for Tight Reservoir. Oilf. Chem. 2022, 39, 595–601. [Google Scholar] [CrossRef]
- Si, Z.; Li, A.; Guo, H.; Zhang, H.; Fu, S. Experimental study on the innuencing fIactors offracturing nuid nowback rate in tight reserVoir. Pet. Geol. Recover. Eff. 2017, 24, 122126. [Google Scholar] [CrossRef]
- Liu, K.; Zhang, C. Characteristics of CO2 huff-and-puff producing matrix shale oil effected by fractures. Pet. Geol. Oilf. Dev. Daqing 2024, 43, 152159. [Google Scholar] [CrossRef]
- Song, B.; Li, J.; Sun, Y.; Zhang, W.; Liu, P. Numerical Simulation Study on Parameters Optimization of CO2 Huff-n-puffin Tight Reservoir. Spec. Oil Gas. Reserv. 2023, 30, 113121. [Google Scholar] [CrossRef]
- Wang, Y.; Zhang, Y.; Zhang, J.; Shi, L.; Fan, X.; Wang, R. Effect of Water Saturation on CO2 Huff-n-Puff in tight Reservoirs. Spec. Oil Gas. Reserv. 2023, 30, 128133. [Google Scholar] [CrossRef]
- National Energy Administration. Practices for Core Analysis: SY/T 5336-2006 ; Petroleum Industry Press: Beijing, China, 2006.
- Kozhevnikov, E.; Turbakov, M.; Riabokon, E.; Gladkikh, E.; Guzev, M.; Panteleeva, A.; Ivanov, Z. Rock permeability evolution during cyclic loading and colloid migration after saturation and drying. Adv. Geo-Energy Res. 2024, 11, 208219. [Google Scholar] [CrossRef] [Scilit]

Disclaimer/Publisher’s Note: The statements, opinions and data contained in all publications are solely those of the individual author(s) and contributor(s) and not of MDPI and/or the editor(s). MDPI and/or the editor(s) disclaim responsibility for any injury to people or property resulting from any ideas, methods, instructions or products referred to in the content. |
© 2026 by the authors. Licensee MDPI, Basel, Switzerland. This article is an open access article distributed under the terms and conditions of the Creative Commons Attribution (CC BY) license.