Article

Mass-Integrated PVC Production with Direct Recycling: An Environmental Evaluation Based on WAR Method

by
Linda Mychell Puello-Castellón
,
Rolando Manuel Guardo-Ruiz
and
Ángel Darío González-Delgado
*
Nanomaterials and Computer Aided Process Engineering Research Group (NIPAC), Chemical Engineering Department, Universidad de Cartagena, Cartagena 130015, Bolivar, Colombia
*
Author to whom correspondence should be addressed.
Processes 2026, 14(9), 1350; https://doi.org/10.3390/pr14091350
Submission received: 1 March 2026 / Revised: 7 April 2026 / Accepted: 18 April 2026 / Published: 23 April 2026
(This article belongs to the Section Environmental and Green Processes)

Abstract

Over the past decades, global plastic demand has steadily increased due to the favorable physicochemical properties of these materials, including low weight, durability, versatility, and low production cost. Among synthetic polymers, polyvinyl chloride (PVC) is one of the most widely produced, accounting for approximately 10% of global polymer production. Suspension polymerization is commonly used for its manufacture because of its high productivity and suitable operational control; however, this process is associated with considerable energy consumption and emissions with potential environmental impacts. In this work, the Waste Reduction (WAR) Algorithm was applied to evaluate the environmental performance of a PVC production process with mass integration and direct water recycling. The Potential Environmental Impact (PEI) was quantified under four scenarios, considering both generation and output rates, as well as different fuel sources. The results showed that the environmental performance of the system strongly depends on the selected system boundaries and on the incorporation of energy-related effects. Under the gate-to-gate scope considered, some scenarios exhibited negative net PEI generation values, indicating that the PEI associated with the outlet streams was lower than that of the inlet streams within the modeled system. However, when energy consumption was included, it became the main contributor to total PEI, reaching 2560 and 3070 PEI/day in Cases 3 and 4, respectively. The toxicological assessment showed that ATP was the only category with positive PEI generation, while natural gas presented the lowest potential environmental impact among the energy sources evaluated. Overall, the process showed comparatively favorable environmental performance within the assumptions and methodological boundaries of the WAR analysis.

1. Introduction

Plastics have been positioned as a fundamental material for the development worldwide. The influence is based on the different characteristics of this kind of materials such as durability, versatility and low cost of production [1]. Reflecting their importance nowadays, a report by PlasticsEurope states that approximately 400 million tons of plastics were produced in 2022 [2].
Polyvinyl chloride (PVC) is one of the most widely used plastics, representing approximately 10% of global production [2]. PVC is commonly employed due to its durability and favorable chemical, electrical, and mechanical properties, as well as its low production cost [3]. Global PVC production reached 35 million tons in 2015 and is projected to grow at an annual rate exceeding 3% during the period 2022–2027 [4]. Furthermore, global PVC production capacity is expected to increase by more than 12% between 2024 and 2030 in response to rising worldwide demand [5].
Vinyl chloride (VCM) is the monomer used in PVC production; VCM is classified as a carcinogenic compound and has been associated with functional disorders such as cirrhosis [6]. To avoid the problems associated with VCM, PVC production includes sections for recovering unreacted VCM in order to optimize the production rate, based on the amount of raw material used and the product obtained, and to avoid wasting VCM.
Modern PVC manufacturing continues to rely on suspension polymerization, a process that, despite its efficiency, produces considerable volumes of wastewater. This effluent represents both an environmental concern and a major operational cost due to the large demand for fresh water. To address this issue, contemporary PVC plants have incorporated water-recycling systems that markedly reduce freshwater consumption and wastewater discharge [7]. However, recycling both VCM and water adds an environmental dimension that cannot be ignored, since quantifying the impacts associated with their circulation allows a clearer understanding of the process’s sustainability profile [8].
Environmental assessments serve as essential tools for identifying how a process may alter ecological balance or exceed regulatory thresholds designed to protect natural systems. Within the chemical industry, these evaluations help pinpoint opportunities to reduce impacts, support decision-making, and measure the benefits derived from transforming raw materials into useful products [9].
Among the various methodologies developed for environmental analysis, the Waste Reduction (WAR) Algorithm stands out for its ability to characterize the potential impacts associated with chemical manufacturing [9]. Previous studies such as the work by Díaz-Pérez et al. [10] have used WAR to evaluate PVC production, focusing mainly on toxicological effects and other categories defined by the algorithm. Nonetheless, the specific role of direct water recycling as an enhancement strategy has not yet been examined with WAR.
In this context, the present study aims to evaluate the environmental implications of an industrial suspension PVC process that incorporates direct water recycling. The WAR algorithm is applied to quantify impacts across several categories, considering mass flows, energy requirements, and the behavior of the process streams. Through this analysis, the study seeks to identify improvement opportunities that strengthen sustainability and reduce the environmental footprint of PVC manufacturing.

2. Materials and Methods

2.1. Process Description

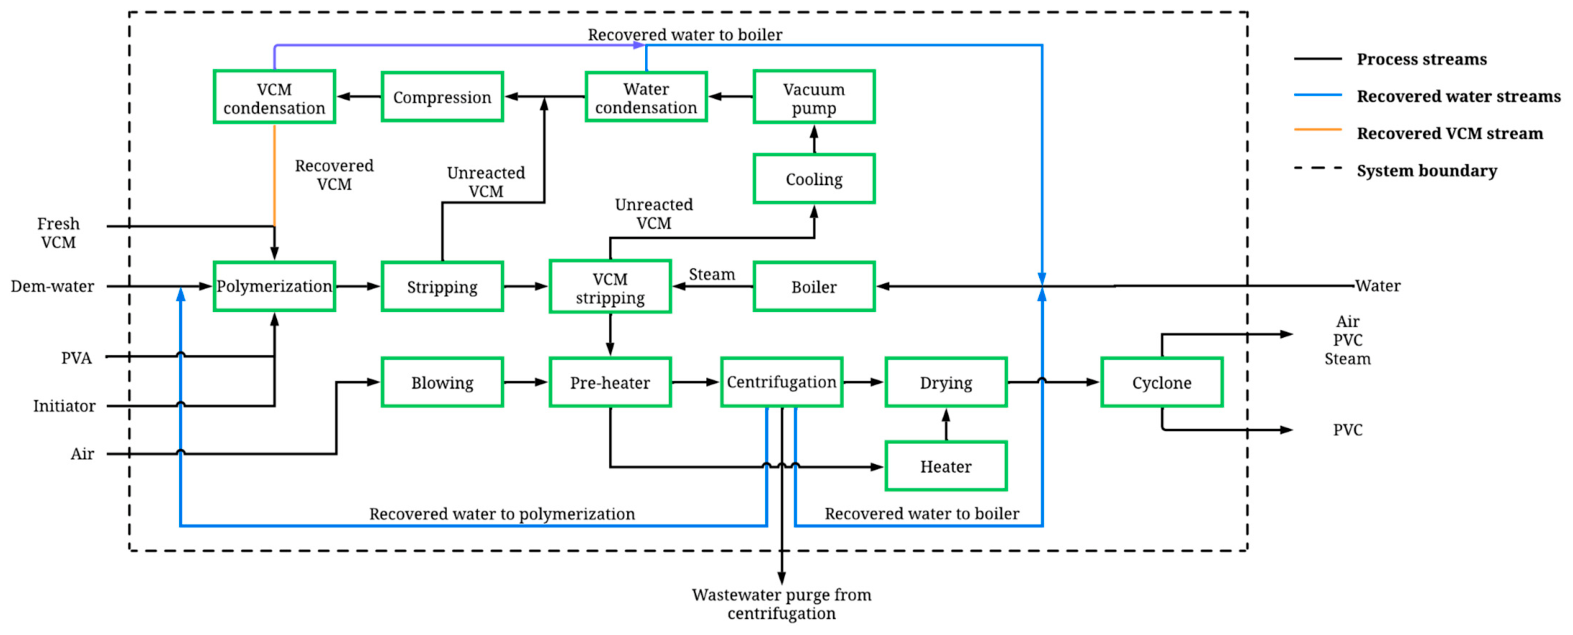
Figure 1 presents the main stages of the mass-integrated PVC production process with direct water recycling, which relies on suspension polymerization. In this technique, monomer droplets react in the presence of an initiator to generate polymer chains, while a stabilizer helps control the reaction by moderating the rate of polymer formation. The polymerization is carried out at 70.0 °C and 10.0 bar.
The first stage focuses on polymer formation using vinyl chloride monomer (VCM) as the primary raw material, which is fed into several parallel batch reactors. Inside each reactor, VCM is mixed with polyvinyl alcohol (20%) as the stabilizer and Luperox 610 (20%) as the initiator, with water acting as the continuous phase. A total of 1152 t/day of VCM is supplied to the system, highlighting its chemical and economic relevance [11]. To improve monomer efficiency, the feed stream to the reactors combines fresh and recycled VCM at 32.0 °C and 4.9 bar. Both the stabilizer and initiator are introduced at 32.0 °C and 10.0 bar, while the water—prepared by blending fresh and recycled sources—enters at 85.0 °C and 3.4 bar. The reactors discharge a heterogeneous slurry containing liquid PVC, unreacted monomer, water, and initiator.
The second stage begins when this slurry is transferred to a degassing unit operating at 70 °C and 1.77 bar. Steam for this step is generated in a boiler fed with fresh water and delivered at 225 °C and 13.73 bar. The pressure reduction in the gasifier promotes the release of unreacted VCM from the liquid phase, producing two separate outlet streams: a VCM-rich vapor stream and a liquid stream containing PVC. This separation initiates monomer recovery as well as polymer drying.
The vapor stream is routed to a recovery section consisting of condensers and compressors, where VCM is liquefied. During this operation, water is removed from the monomer, allowing it to be purified and recycled to the earlier stages of the process. The separated wastewater is returned to the gasification section and used as boiler feedwater. At the same time, the liquid PVC stream leaving the gasifier—still containing excess water, stabilizer, and initiator—passes through a preliminary cooling unit. There, heat is transferred to an air stream supplied by a blower, lowering the polymer temperature to 74 °C while the air exits at 91 °C.
The cooled suspension continues to a centrifuge operating at 1800 rpm, where roughly 75% of the water, along with the stabilizer and initiator, is removed. The recovered water, with a purity of 99.6%, is reused as feed for both the polymerization reactors and the boiler, ensuring stable operation and consistent reaction conditions. The remaining wet PVC paste is then directed to a drying unit operating at 250 °C, which uses the preheated air from the previous exchanger. This step produces particulate PVC that still contains small amounts of moisture, stabilizer, initiator, and trapped air [7].
In the final separation step, the product enters a cyclone operating at 1.01 bar. Here, granular PVC with a residual moisture content of only 0.01% is isolated from lighter volatile components such as water vapor, initiator, PVA, and air, which leave through the top outlet. The overall polymer output from the process is 1150.28 t/day. For clarity, the main unit operations and corresponding key process conditions are summarized in Table 1.

2.2. Environmental Assessment Using WAR Algorithm

The environmental burdens estimated through this approach are inherently determined by the characteristics of industrial processing operations, since they express the rate at which such processes may exert effects on the environment [9]. This method evaluates the environmental implications arising from large-scale effluent streams and energy requirements within chemical production systems. Its implementation demands detailed mass and energy balance calculations, which are commonly obtained through process simulation procedures [12]. Unlike other assessment frameworks, including simplified life cycle assessment methodologies, this approach does not permit direct methodological replication under equivalent conditions [13]. Within the WAR framework, environmental impacts are systematically categorized into two principal groups: toxicological impacts and atmospheric impacts. In the present study, only PVC, PVA, and the initiator (Luperox 610) were explicitly defined by specifying their molecular weight, as these compounds are not included in the WAR database. All other components were selected from the WAR database, which automatically provides the required physicochemical and toxicity properties.

2.2.1. Toxicological Impacts in WAR Algorithm

Toxicological impacts are subdivided into four specific categories. The first category corresponds to the Human Toxicity Potential by Ingestion (HTPI), which quantifies the toxic effect associated with a given chemical substance. This indicator is determined exclusively for compounds existing in solid or liquid phases under standard conditions (273 K and 1 atm) [14], as defined by Equation (1):
H T P I = 1 L D 50
The L D 50 parameter refers to the quantity of a chemical that results in the mortality of 50% of a rat population when administered orally. This value is expressed in milligrams of substance per kilogram of animal body mass.
The second indicator corresponds to the Human Toxicity Potential from Exposure via inhalation or skin contact (HTPE). Its evaluation is based on threshold limit values (TLV), which represent time-weighted average exposure levels over an 8 h work shift [9]. These limits, available in regulatory sources such as OSHA, ACGIH, and NIOSH, define acceptable concentrations of hazardous chemicals that may affect human health through respiratory or dermal routes. Generally, TLVs are reported in mg × m−3 for chemicals in their gaseous form under standard temperature (273 K) and atmospheric pressure. The HTPE is calculated according to Equation (2):
H T P E = 1 T L V
The third toxicological indicator is the Aquatic Toxicity Potential (ATP), which is assessed through the LC50 value. This parameter reflects the concentration of a chemical capable of causing 50% mortality in a population of Pimephales promelas (fathead minnow) during a 96 h exposure period [14]. This fish species is widely used as a reference organism in aquatic toxicity studies due to its relevance for environmental assessments and the extensive toxicological information available for it. The ATP is determined using Equation (3):
A T P = 1 L C 50
The fourth toxicological category is the Terrestrial Toxicity Potential (TTP). Its estimation is based on the LC50 parameter, as indicated in Equation (4), and utilizes the same reference values employed for the HTPI indicator.
T T P = 1 L D 50

2.2.2. Atmospheric Impacts in WAR Algorithm

Atmospheric impact categories are structured into four distinct indicators, two of which address global-scale effects, while the remaining two are associated with localized environmental impacts. The primary global indicator is the Global Warming Potential (GWP), which evaluates the capacity of a unit mass of a chemical substance to absorb infrared radiation throughout its atmospheric residence time, in comparison with carbon dioxide (CO2), adopted as the reference compound over an equivalent time horizon [9]. The GWP is calculated according to Equation (5):
G W P = 0 t a i c i t d t 0 t a C O 2 c C O 2 t d t m i
In these expressions, a i and a C O 2 denote the radiative heat absorption capacity per unit mass of a given greenhouse gas ( i ) and carbon dioxide (CO2), respectively. Likewise, c i and c C O 2 represent the atmospheric concentrations of the greenhouse gas ( i ) and CO2 over the selected assessment period. The parameter ttt corresponds to the time horizon, expressed in years, considered for the GWP evaluation, whereas m i indicates the emitted mass of the gas, expressed in kilograms [9].
The second global indicator is the Ozone Depletion Potential (ODP), which measures the relative contribution of chemical species to stratospheric ozone depletion. This parameter is determined by comparing the reaction rate between a specified mass of the substance and ozone—leading to the formation of molecular oxygen—with the reaction rate of an equivalent mass of trichlorofluoromethane (CFC-11) under identical conditions [14] (see Equation (6)).
O D P = δ O 3 i δ O 3 F C K W 11 m i
Within this framework, δ O 3 i represents the global ozone depletion attributable to a unit mass of gas ( i ), whereas δ O 3 F C K W 11 corresponds to the ozone depletion associated with a unit mass of CFC-11. The parameter m i denotes the mass of the emitted gas, expressed in kilograms.
The third atmospheric impact category is the Photochemical Oxidation Potential (PCOP). This indicator is determined by comparing the reaction rate between a unit mass of the evaluated chemical and hydroxyl radicals (OH) with the reaction rate of an equivalent mass of ethylene under comparable conditions [9]. The PCOP assessment mainly addresses hydrocarbons with low and intermediate molecular weights and is calculated in accordance with Equation (7):
P C O P = a i b i ( t ) a c 2 H 4 b c 2 H 4 ( t ) m i
In these expressions, a i and a C 2 H 4 denote the variation in ozone concentration attributable to the emission of a volatile organic compound ( i ) and ethylene, respectively. Similarly, b i ( t ) and b C 2 H 4 ( t ) represent the cumulative emissions of the volatile organic compound ( i ) and ethylene up to the specified time horizon ( t ). The parameter m i corresponds to the mass of the emitted volatile organic compound, expressed in kilograms.
The fourth atmospheric impact category is the Acidification Potential (AP), also referred to as acid rain potential. This indicator is determined by comparing the rate of H+ release in the atmosphere due to a given chemical with the corresponding rate caused by SO2 emissions [14] (see Equation (8)).
A P = V i M i V S O 2 M S O 2 m i
In this context, V i and V S O 2 represent the acidification contributions of component (i) and SO2, respectively. The symbols M i and M S O 2 denote the unit masses of components ( i ) and SO2, while m i refers to the mass of component ( i ) emitted in kilograms.
In accordance with the WAR methodology, the environmental performance indicators considered in this study are the total PEI generation rate (TGR), the PEI generation rate per unit product (specific generation rate, TPGS), the total PEI output rate (TOR), and the PEI output rate per unit product (specific output rate, TPLS).
Within the WAR methodology, the parameter ψ k represents the specific potential environmental impact associated with component k, expressed in units of PEI per unit mass (PEI/kg). This parameter does not constitute an independent variable; rather, it is derived from the set of impact category indicators defined in Equations (1)–(8), which are based on physicochemical and toxicological properties such as LD50, LC50, TLV, as well as parameters required for the estimation of atmospheric impacts.
In this context, the aforementioned properties are used to determine the characterization factors associated with each component in the toxicological (HTPI, HTPE, ATP, TTP) and atmospheric (GWP, ODP, PCOP, AP) impact categories. Each of these indicators quantifies the potential contribution of a substance to a specific environmental impact category. Subsequently, the WAR algorithm integrates these contributions through an internal aggregation procedure, yielding a single composite parameter ψ k that represents the overall environmental burden of the component across all impact categories considered.
Therefore, ψ k constitutes the key link between the impact indicators defined in Equations (1)–(8) and the potential environmental impact balance equations (Equations (9)–(12)), in which it is combined with the mass flow rates and composition fractions of each process stream to determine the rates of PEI generation and emission within the system.
For compounds included in the WAR-GUI® database, the required physicochemical and toxicological properties, as well as the corresponding characterization factors, are internally provided by the software based on literature sources. In the case of compounds not included in the database, such as PVC, PVA, and Luperox 610, the only parameter explicitly defined by the user was the molecular weight. Based on this input, the WARGUI® v1.0 software estimates the remaining required properties through internal correlations and embedded models, following the framework established in the original WAR methodology [14,15].
Consequently, although part of the estimation procedure is performed internally by the software, the overall calculation sequence follows a well-defined methodological structure in which the input properties enable the determination of category-specific impact indicators, whose subsequent aggregation leads to the ψ k parameter, which is ultimately used in the global PEI balance calculations of the process.
Equations (9) and (10) represent the total PEI output rate and the PEI output rate normalized by product mass, respectively, whereas Equations (11) and (12) correspond to the total net PEI generation rate and its specific value per unit mass of product. In these expressions, i c p o u t and i ( c p ) i n represent the PEI rates associated with the outlet and inlet material streams of the system, respectively, while i ( e p ) o u t and i ( e p ) i n correspond to the PEI rates associated with energy generation. The variables i c p w e and i ( e p ) w e indicate the PEI discharged as waste energy from chemical and energy-generation processes, respectively. The variables M j i n and M j o u t denote the mass flow rates of inlet and outlet streams j , respectively, expressed in kg/h; X k is the mass fraction of component k in stream j   (dimensionless); ψ k is the specific potential environmental impact of component k , expressed in PEI/kg, and P P is the product mass flow rate, expressed in kg/h. In this way, the PEI of each stream is determined from its mass flow rate, stream composition, and the value of ψ k , while the energy terms incorporate the impact associated with emissions derived from the generation of the energy required by the process [15,16].
i ( t ) o u t = i c p o u t + i ( e p ) o u t + i ( c p ) w e + i ( e p ) w e = j c p M j o u t k c p X k j ψ k + j e p g M j o u t k e p g X k j ψ k
i ( t ) o u t = i c p o u t + i ( e p ) o u t + i ( c p ) w e + i ( e p ) w e Σ P P P = j c p M j o u t k c p X k j ψ k + j e p g M j o u t k e p g X k j ψ k Σ P P P
i ( t ) g e n = i c p o u t + i ( c p ) i n + i ( e p ) o u t + i ( e p ) i n + i c p w e + i ( e p ) w e = j c p M j o u t k c p X k j ψ k + j e p g M j o u t k e p g X k j ψ k + j e p g M j o u t k e p g X k j ψ k
i ( t ) g e n = i c p o u t + i ( e p ) i n + i ( e p ) o u t + i ( e p ) i n + i c p w e + i ( e p ) w e Σ P P P = j c p M j o u t k c p X k j ψ k + j e p g M j o u t k e p g X k j ψ k + j e p g M j o u t k e p g X k j ψ k Σ P P P

2.3. Implementation of Computer-Aided Process Engineering to Environmental Assessment

The environmental evaluation of the water-integrated PVC production process with direct water recycling was conducted using WAR-GUI®, a software tool that implements the WAR algorithm and incorporates the chemical properties of each compound in the system. The software was run on a workstation equipped with a 10-core Intel processor (1.30 GHz), Intel Iris Xe Graphics with 128 MB, 24 GB of RAM, and a 512 GB solid-state drive.
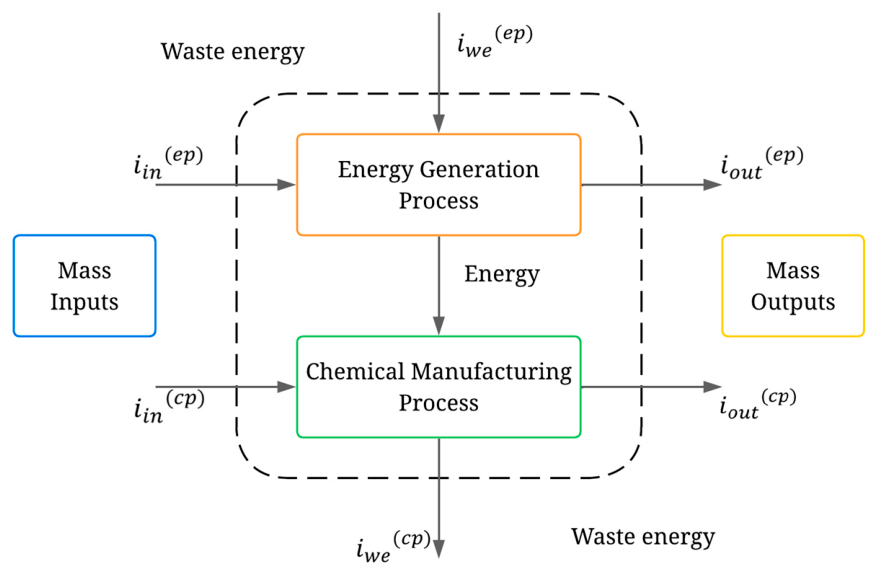
To assess the atmospheric and toxicological impact categories, stream data—including chemical composition and relevant properties of each compound—was applied to Equations (1)–(8). Furthermore, Equations (9)–(12), derived from the PEI balance depicted in Figure 2, were used to calculate the overall environmental impact by accounting for the material flows entering and leaving the process, as well as the associated energy consumption [9].
Bar charts were developed to display both the total estimated impacts and the contributions from each individual impact category across four different scenarios. Case 1, used as the baseline, reflects only the impacts associated with waste streams and excludes the influence of energy use and product flows. Case 2 incorporates the effects of waste streams and product flows but still does not account for energy-related impacts. Case 3 evaluates the contribution of waste streams together with energy consumption, whereas Case 4 includes the combined effects of waste streams, product flows, and energy use. All four cases were represented in the overall impact graph, while the analysis for Case 4 focused specifically on atmospheric and toxicological categories.
To deepen the assessment, the impacts associated with energy flows and energy sources were quantified by category using Case 3, allowing a more detailed evaluation of the process’s environmental performance with explicit consideration of energy consumption. Additionally, the PEI output rate per day was calculated for the major sections of the process, considering only the contributions from waste streams and energy inputs. To clearly define the WAR system boundaries, the product and waste streams are summarized in Table 2, whose flowrates and compositions remain constant across all cases, while their inclusion in the WAR analysis varies depending on the evaluated case.
It is important to emphasize that the present WAR assessment was developed under a gate-to-gate approach, restricted to the PVC production stage considered in this study. Accordingly, the analysis includes only the material and energy streams crossing the system boundaries defined for the polymerization plant, without incorporating upstream environmental burdens associated with raw material production, particularly the production of vinyl chloride monomer (VCM). Under this methodological scope, negative values may appear in the net PEI generation rate when the PEI associated with the outlet streams is lower than that corresponding to the inlet streams within the modeled system. However, these values should be interpreted exclusively as an internal result of the WAR balance under the selected boundaries, and not as an absolute environmental credit or as evidence of a net environmental benefit for the entire PVC production chain.

3. Results and Discussion

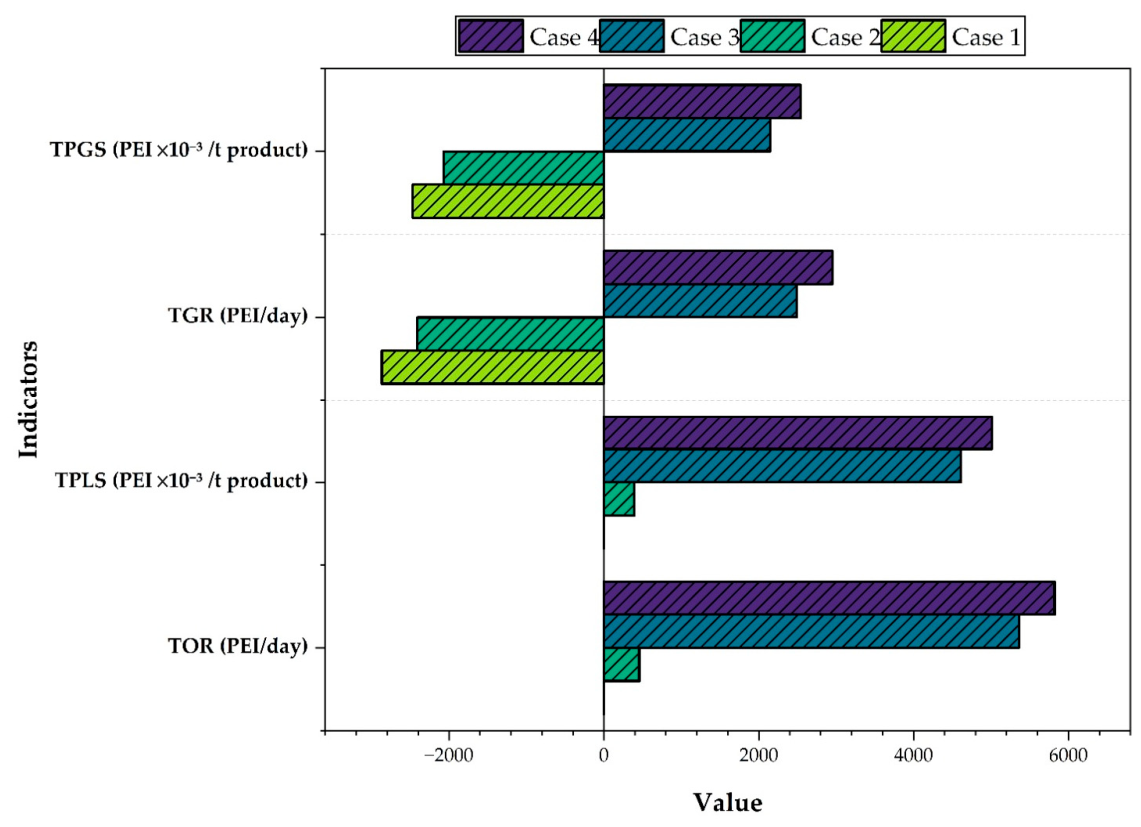
Figure 3 presents the results obtained for the total PEI output rate and the total PEI generated per ton of PVC per day. The highest impact values correspond to Cases 3 and 4, with 5730 PEI/day and 6230 PEI/day, respectively, followed by Case 2 with 505 PEI/day. These results indicate that the presence of PVC in the product stream significantly contributes to the output PEI. Additionally, the marked increase observed in Cases 3 and 4 demonstrates that energy consumption plays a major role in elevating the emission rate of environmental impacts compared to contributions from waste and product streams, as widely reported in environmental assessments where energy use is identified as a dominant contributor to process-related impacts [17]. Similar findings have been reported in previous studies such as Aguilar et al. [9], emphasizing the relevance of energy-related impacts in PVC production. In contrast, Case 1 exhibits the lowest PEI output, with a value of 2.46 PEI/day, attributed to the absence of hazardous waste discharges—particularly VCM—since these compounds are internally recovered and recirculated within the process.
In Cases 1 and 2, the net PEI generation rate showed negative values of −3660 and −2660 PEI/day, respectively. Within the WAR methodological framework, this result indicates that, for the adopted system boundaries and considering the streams included in those scenarios, the PEI associated with the outlet streams is lower than that corresponding to the inlet streams [18]. This behavior is mainly associated with differences in the specific characterization factors assigned by the WAR methodology to inlet and outlet components within the selected gate-to-gate system boundaries. Therefore, the negative values reflect the internal balance structure of the model and should not be interpreted as an absolute environmental benefit of converting VCM into PVC over the full production chain.
However, these negative values should not be interpreted as an absolute environmental benefit of the overall PVC production chain. Their meaning is restricted to the internal PEI balance of the gate-to-gate system modeled in this work, which does not incorporate the environmental burdens associated with prior VCM production. When energy consumption is incorporated, as in Cases 3 and 4, the net PEI generation rate becomes positive, reaching 2560 and 3070 PEI/day, respectively, due to the additional contribution of emissions related to energy generation.
The PEI output and net generation values normalized per ton of product were comparatively low in all analyzed scenarios. Regarding the output indicator, all cases showed positive values, with Cases 1 and 2 presenting the lowest magnitudes, at 0.002 and 0.39 PEI/t, respectively. This result indicates that, per unit of PVC produced, the potential environmental burden transferred outside the process boundaries remains limited under the assumptions of the WAR analysis.
With respect to the net generation indicator, Cases 1 and 2 showed negative values of −2.47 and −2.08 PEI/t of product, whereas Cases 3 and 4 reached 2.00 and 2.39 PEI/t, respectively. As previously stated, negative values should be understood as the result of the internal PEI balance of the modeled system, and not as an environmental credit that can be extrapolated to the entire production chain. The change in sign observed in Cases 3 and 4 confirms the dominant influence of emissions associated with energy consumption on the overall environmental performance of the process.
Several environmental assessments available in the literature have examined processes for other polymers, such as the polypropylene (PP) production process evaluated by Jiménez-Varón [19]. For comparative purposes, global impact indicators were considered, including the daily PEI output and the PEI generated per ton of product. While PVC exhibits an impact value of 2.39 PEI/t, the PP process presents significantly higher values, reaching approximately 1200 PEI/t. This substantial difference is largely attributed to the lower production capacity of the PP system—approximately half of that of the PVC process—as well as the release of propane as a by-product, which contributes markedly to the generation of PEI. However, these results remain counterintuitive, given that the energy consumption in PP manufacturing is nearly 50% lower than that reported for PVC production.
Another similar study corresponds to polyethylene (PE), carried out by Velásquez-Barrios [20]. Compared to suspension PVC, this process presents a higher emission rate, with PEI values reaching up to 15,600,000 PEI/day, exorbitantly higher than the 6230 PEI/day output of the PVC production process with direct recycle. This result is primarily due to the low conversion achieved in PE production, reaching only about 20%. As a consequence, the process generates relatively smaller flows compared to PVC production, which attains conversion rates above 80%. In addition, the studied PVC process recycles 99% of unconverted VCM, whereas in PE production no recycle of unreacted monomer is implemented, a factor known to increase environmental burdens due to higher raw material losses and emissions [21]. Energy consumption is also higher, as PE production operates at temperatures as high as 130 °C. By contrast, in PP production the highest operating temperature is 80 °C, which is three times lower than the maximum working temperature of 250 °C in PVC production. These findings suggest that suspension PVC production integrated with direct recycle demonstrates acceptable performance compared to other polymers, since it implements the recycle of unconverted material, achieves high conversion rates, incorporates wastewater recycling, and enables energy integration.
These findings suggest that the suspension PVC production process with direct recycling exhibits comparatively favorable performance within the conditions and methodological boundaries considered in this study. However, comparisons with other polymer production systems should be interpreted with caution due to differences in process scale, conversion, recycle structure, energy demand, and assessment scope.
Table 3 shows the individual analysis of each stage of the process integrated with direct recycle, considering the contribution of waste. This analysis was conducted to determine the waste flows generated at each stage. Results indicate that only two out of the five stages present a significant output PEI: 4.51 PEI/day in the PVC drying stage and 1.83 PEI/day in the direct recycle stage. Studies such as Aguilar et al. [9] demonstrate that the drying stage is the largest contributor, with 6.5 PEI/day, a value relatively higher than that obtained for the integrated process, even with the inclusion of a new stage, which is consistent with the fact that drying operations are typically among the most energy-intensive stages in polymer processing [22].
The contribution of the first stage is linked to the cyclone’s waste stream, as it contains high levels of environmentally impactful substances such as PVC, PVA, and the initiator. Similarly, the contribution of the direct recycle stage is associated with the centrifuge outlet stream. Within the integrated process, only a few waste streams are generated compared to non-integrated cases, as wastewater streams are recycled back into the system as feed inputs. In the other three stages, no waste streams are observed—only intermediate flows that cannot be assessed using the WAR algorithm. It should also be noted that the daily PEI rate changes when energy consumption is considered.
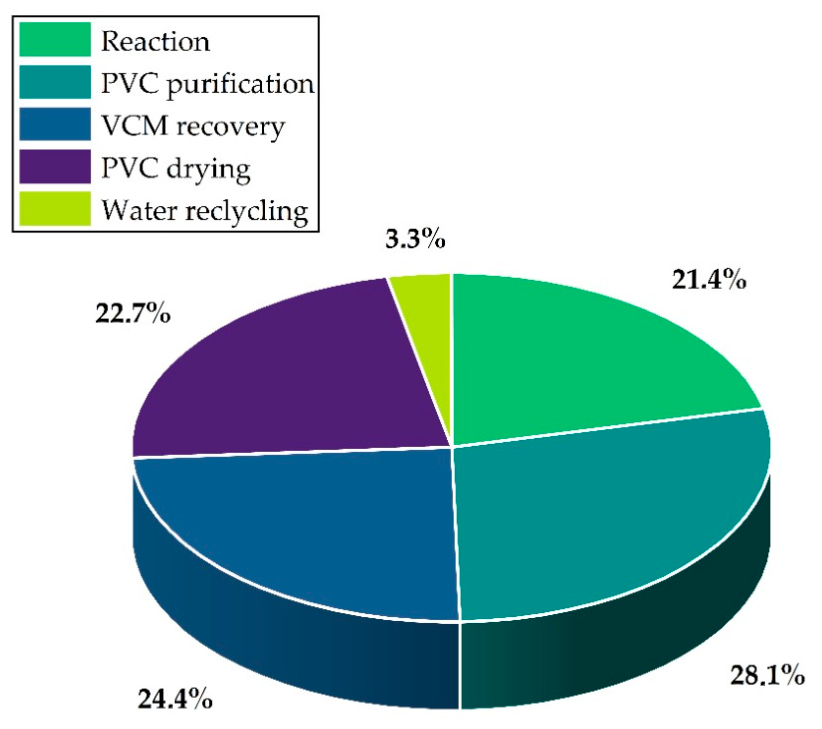
Figure 4 shows the contribution of each stage of the process integrated with direct recycle, taking energy consumption into account. The stage with the highest contribution is PVC purification, with 28.1%. This is attributed to its higher energy demand, as it involves the highest process temperature of 250 °C, reflecting the strong dependence of environmental performance on thermal energy requirements in chemical processes [23]. It is followed by VCM recovery with 24.4%, and then by the drying stage, which contributes 22.7%—a lower value compared to that reported by Aguilar-Vasquez et al. [9], who found 26.7% for a non-integrated case. This difference is explained by the prior energy integration of the process under study, which reduced the need for external heating services, despite the fact that this stage operates at the second-highest temperature in the process (225 °C). Finally, the reaction and water recycle stages, with 21.4% and 3.3%, respectively, show lower contributions since there is no direct energy consumption for heating purposes; instead, energy is used as work and for cooling.

3.1. Toxicological Impacts in the Integrated Suspension PVC Production Process with Direct Recycle

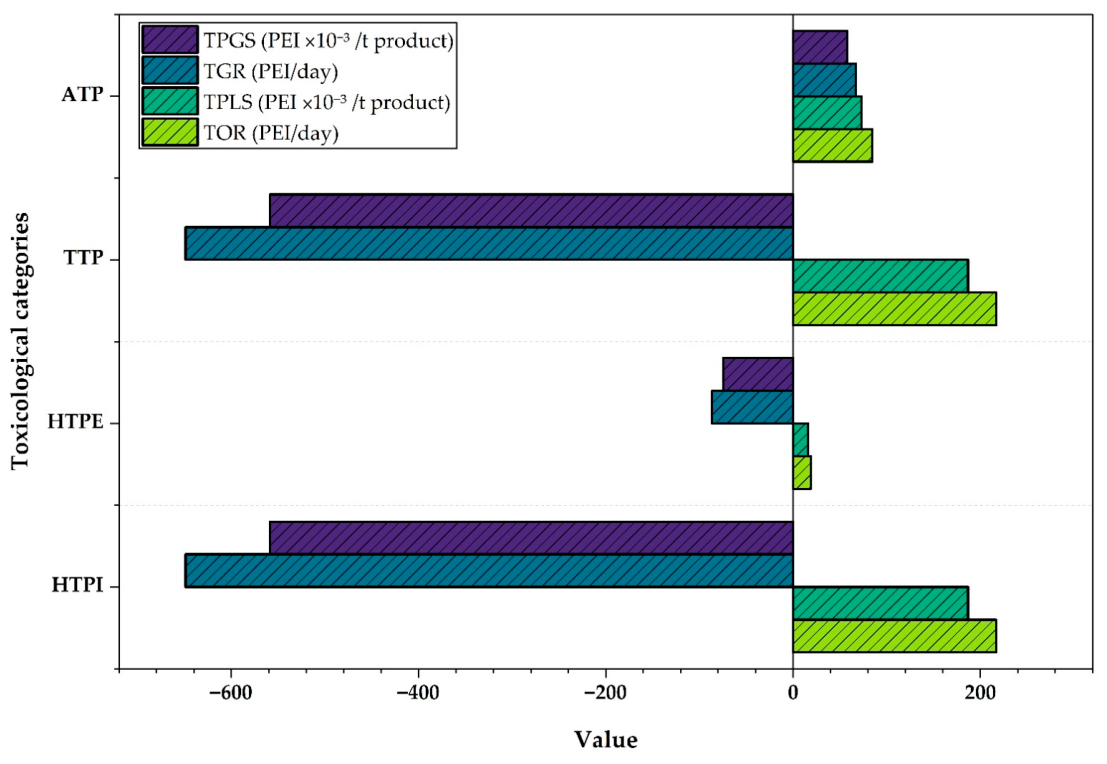
Figure 5 presents the toxicological impact rates associated with the integrated PVC production process with direct water recycling. The analysis includes the categories of terrestrial toxicity potential (TTP), aquatic toxicity potential (ATP), human toxicity potential by ingestion (HTPI), and human toxicity potential by exposure (HTPE). For the net PEI generation rate, the TTP, HTPE, and HTPI categories exhibited negative contributions of −717, −95.80, and −717 PEI/day, respectively. In the context of the WAR balance, these results indicate that, for these categories and within the system boundaries considered, the specific PEI associated with the outlet streams is lower than that corresponding to the inlet streams.
This behavior is mainly related to the lower specific toxicological characterization of PVC relative to VCM within the WAR framework. Nevertheless, these values should be interpreted strictly as results of the internal balance of the gate-to-gate system and not as evidence of a net environmental benefit for the complete production chain. In contrast, the ATP category showed a positive value of 71.20 PEI/day, indicating that this category remains sensitive to the presence of compounds released or retained in process streams, as well as to emissions associated with energy supply.
It is important to highlight that the ATP category presented a positive value of 71.20 PEI/day. This result may be associated with the composition of the outlet streams considered in the WAR balance and with the contribution of emissions derived from energy supply. Moreover, compounds such as PVA and the initiator contribute to this category when present in waste and product streams. Additionally, emissions of substances used to meet energy requirements also contribute to the increase in this category, particularly low-molecular-weight compounds such as VOCs that are absorbed into water bodies [24].
On the other hand, all output impact rates were positive. The TTP and HTPI categories presented values of 240 PEI/day, which is directly related to the magnitude of the product flow, close to 1150 t/day, compared with the much lower flow rates of other substances present in waste streams, such as the initiator and PVA. In this sense, the contribution of the product to the PEI output becomes relevant within the WAR balance due to its high mass flow rate, even though its specific impact is lower than that of other more toxic substances. Although VCM presents more severe toxicity values, its almost complete recirculation within the process significantly limits its contribution to the outlet streams. Consequently, the interpretation of these categories must be carried out by jointly considering both the specific hazard of each substance and its effective outlet flow rate from the system.
With respect to the PEI generated per ton of product, negative values were observed in all categories except ATP. These results again reflect the internal balance of the system under the gate-to-gate scope considered and the combined influence of product streams, waste streams, and energy consumption. In contrast, the output rates per ton of product showed only positive values for ATP, HTPE, HTPI, and TTP. Overall, these results indicate that the interpretation of the toxicological behavior of the process must be based on the complete balance among composition, outlet flow, and energy consumption, avoiding any direct association between a negative generation value and an absolute environmental benefit of the system.

3.2. Impacts Associated with the Energy Source Used in the Suspension PVC Production Process with Direct Recycle of Wastewater

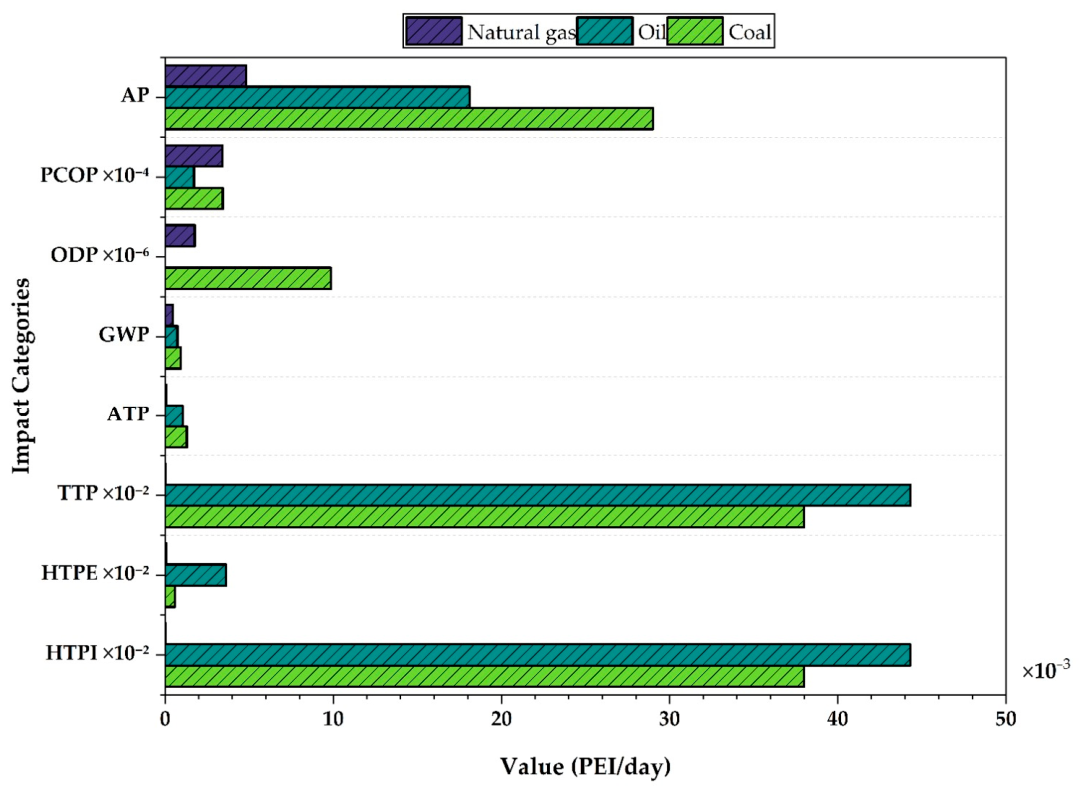
Figure 6 shows the PEI associated with toxicological and atmospheric impact categories based on the type of fuel used to supply the process energy demand. This evaluation focused exclusively on Case 4, which incorporates the effects of energy consumption, waste generation, and product flows. Among the categories, acidification potential (AP) exhibited the highest values, ranging from 5140 to 31,000 PEI/day. This behavior is attributed to the formation of acid compounds in the atmosphere, driven by NOx and SOx emissions, which react with water vapor and promote acid deposition [25]. As expected, coal resulted in the most unfavorable environmental performance. Its contribution to AP is approximately six times greater than that of natural gas and nearly double that of liquid fuels, due to the substantially higher contents of sulfur-, nitrogen-, and volatile-based compounds present in coal relative to lighter fuels [26].
The PEI/day rates for the toxicological categories reveal a substantial contribution from energy consumption. Notably, the aquatic toxicity potential (ATP) category exhibits the highest impact, primarily due to the emission of persistent volatile organic compounds (VOCs), including benzene and polycyclic aromatic hydrocarbons, which accumulate in water bodies. The other toxicological categories—HTPI, HTPE, and TTP—show lower overall impacts; however, they are indirectly affected by ATP through the presence of particulate matter and volatile compounds such as naphthalene. Overall, natural gas demonstrates the most favorable performance and is therefore identified as the preferred energy source to meet the process’s operational requirements. It is important to note that the total energy demand of the process was assumed to remain constant across all cases. The comparison among coal, oil, and natural gas was conducted by modifying only the energy source within the WAR algorithm, without recalculating the process energy requirements. Therefore, the observed differences in PEI values are exclusively attributed to the emission factors associated with each fuel.

3.3. Atmospheric Impacts of the Integrated Suspension PVC Production Process with Direct Recycle

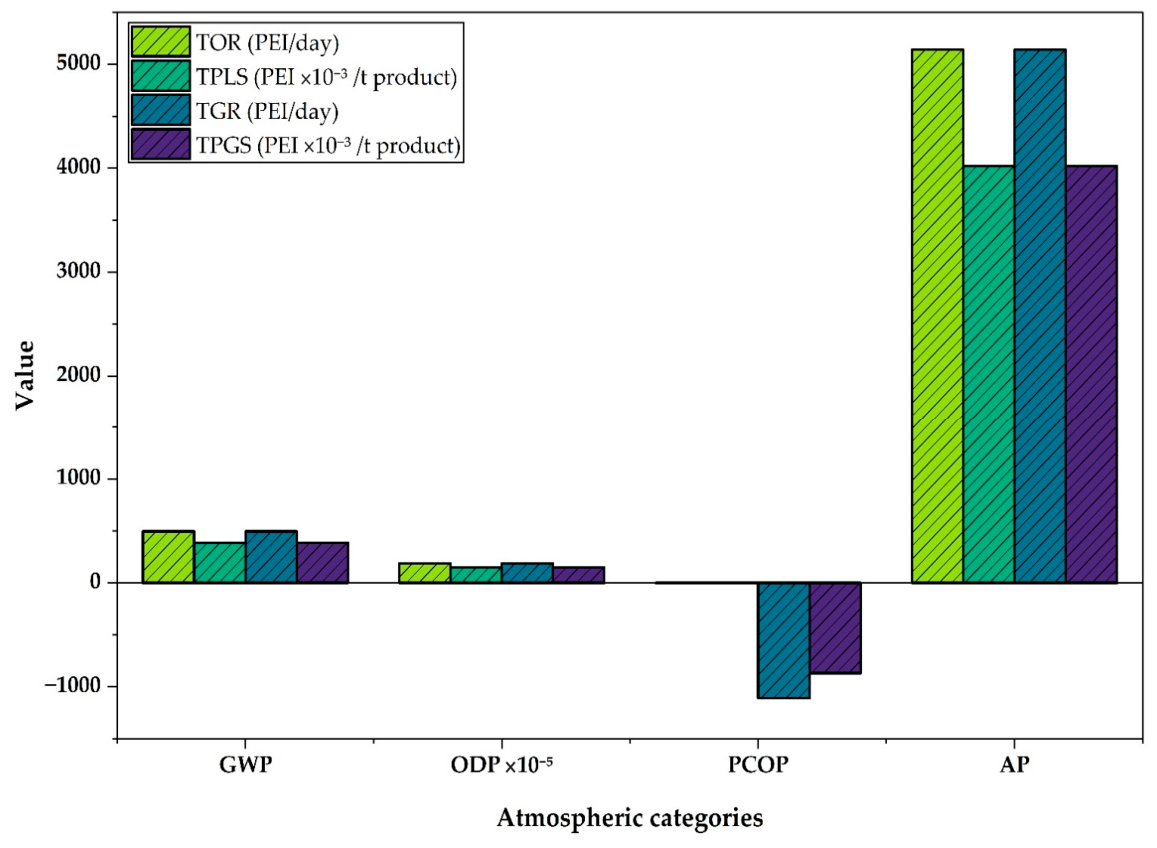
Figure 7 summarizes the atmospheric impact categories, which include global indicators such as Global Warming Potential (GWP) and Ozone Depletion Potential (ODP), along with local effects represented by Photochemical Oxidation Potential (PCOP) and Acidification Potential (AP). Among these categories, GWP and AP show the highest values for both the generated and output PEI, standing out clearly when compared with the remaining toxicological and atmospheric indicators. This trend is mainly associated with the release of vapor-phase compounds generated by the process’s energy demand.
The AP category is strongly influenced by emissions of gases such as VOCs and NOx, with natural gas contributing 5140 PEI/t for both generated and output values. In the case of GWP, the contribution reaches 496 PEI/t, largely driven by COx emissions formed during fossil-fuel combustion. Natural gas was used as the reference fuel in this study, consistent with the operating conditions typically adopted in industrial PVC production [27,28].
For the ODP and PCOP categories, the output PEI values are 0.002 and 0.37 PEI/day, respectively, while the generated PEI values are 0.000001 and −0.87 PEI/day. The low impact in these categories is explained by the predominance of solids and liquids in the process streams, as there are no significant gaseous emissions in the residues or products. The only gas leaving the system is a waste stream consisting of air and PVC, which primarily contributes to toxicological rather than atmospheric impacts. Although unreacted VCM could potentially affect the PCOP category, it is fully recirculated within the process, preventing substantial output contributions. Consequently, the observed impacts are mainly linked to low-molecular-weight compounds, such as VOCs and methane, originating from energy consumption. Additionally, the PEI per ton of product demonstrates that the process exerts minimal environmental impact per unit of PVC produced, with values remaining below 1 PEI/t. This favorable outcome is largely due to the high production capacity of the process, which allows polymer generation with reduced environmental burden.
In general terms, the atmospheric results confirm that energy consumption is the main factor responsible for the positive PEI generation in the integrated PVC production process. This finding is consistent with the interpretation adopted throughout the study: although some categories associated with material streams may present negative net generation terms within the gate-to-gate balance of the WAR algorithm, the incorporation of emissions derived from energy supply leads to a positive overall PEI generation. Consequently, utility demand emerges as one of the most influential factors in the environmental performance of the process.

4. Conclusions

To evaluate the environmental performance of the integrated suspension PVC production process with direct water recycling, the WAR algorithm was applied under different scenarios associated with waste streams, product streams, and energy consumption. The results showed that the environmental behavior of the system depends significantly on both the adopted system boundaries and the inclusion of emissions associated with energy generation.
Under the gate-to-gate approach adopted in this study, some scenarios presented negative net PEI generation values, indicating that the PEI associated with the outlet streams was lower than that corresponding to the inlet streams within the modeled system. Nevertheless, these results must be interpreted exclusively as outcomes of the internal WAR balance under the selected boundaries, rather than as absolute environmental benefits for the complete PVC production chain.
When energy consumption was incorporated, the process exhibited positive net PEI generation, reaching 2560 and 3070 PEI/day for Cases 3 and 4, respectively. This confirms that energy demand constitutes one of the main contributors to the total environmental burden of the system. Among the toxicological categories, ATP was the only one that maintained a positive net contribution, whereas among the atmospheric categories, AP and GWP showed the highest contributions, mainly due to emissions derived from fuel use.
The comparison among energy sources showed that natural gas presented the lowest PEI values in relation to coal and liquid fuels, which positions it as the most favorable alternative among those evaluated under the assumptions of the WAR algorithm. Additionally, the analysis by process section indicated that the stages with the greatest environmental relevance correspond to those with the highest energy consumption, particularly those associated with purification, VCM recovery, and drying.
Overall, the integrated process with direct recycling showed comparatively favorable environmental performance within the assumptions and methodological boundaries considered. However, comparisons with other polymer production systems must be interpreted with caution due to differences in scale, conversion, recycle structure, energy requirements, and assessment scope. As future work, it is recommended to complement this gate-to-gate analysis with broader methodologies, such as life cycle assessment, in order to incorporate upstream environmental burdens, especially those associated with the production of raw materials such as VCM.


Author Contributions

Conceptualization, Á.D.G.-D.; methodology, Á.D.G.-D.; software, R.M.G.-R. and L.M.P.-C.; validation, Á.D.G.-D.; formal analysis, R.M.G.-R. and L.M.P.-C.; investigation, Á.D.G.-D., R.M.G.-R. and L.M.P.-C.; resources, Á.D.G.-D.; data curation, R.M.G.-R. and L.M.P.-C.; writing—original draft preparation, R.M.G.-R. and L.M.P.-C.; writing—review and editing, Á.D.G.-D.; visualization, R.M.G.-R. and L.M.P.-C.; supervision, Á.D.G.-D.; project administration, Á.D.G.-D.; funding acquisition, Á.D.G.-D. All authors have read and agreed to the published version of the manuscript.

Funding

This research received support from the Universidad de Cartagena through the project “Optimization of the Industrial-Scale PVC Production Process via Sustainability Assessment and Computer-Aided Mass Integration,” authorized under Commitment Act No. 049 of 2024.

Institutional Review Board Statement

Not applicable.

Data Availability Statement

The data underlying this study can be obtained from the corresponding author, Á.D.G.-D., upon reasonable request.

Acknowledgments

The authors express their gratitude to the Universidad de Cartagena for providing financial support for this research. Angel Darío González-Delgado thanks Luis Angel González-Fontalvo for providing inspiration and motivation to conclude this research during these 10 months.

Conflicts of Interest

The authors declare no conflicts of interest.

Abbreviations

VCMVinyl Monochloride
PVCPolyvinyl Chloride
WARWaste Reduction Algorithm
OSHAOccupational Safety and Health Administration
ACGIHAmerican Conference of Governmental Industrial Hygienists
NIOSHNational Institute for Occupational Safety and Health
PEIPotential Environmental Impact
PVAPolyvinyl Alcohol
ATPAquatic Toxicity Potential
TTPTerrestrial Toxicity Potential
HTPIHuman Toxicity Potential-Ingestion
HTPEHuman Toxicity Potential-Exposure
APAcidification potential
GWPGlobal Warming Potential
PEPolyethylene
PPPolypropylene
PCOPPhotochemical Oxidation Potential
ODPOzone Depletion Potential
TGRTotal Generation Rate of PEI (PEI/day)
TORTotal Output Rate of PEI (PEI/day)
TPGSSpecific PEI Generation Rate
TPLSSpecific PEI Output Rate
VOCVolatile Organic Compounds

References

  1. De-la-Torre, G.E.; Dioses-Salinas, D.C.; Pizarro-Ortega, C.I.; Santillán, L. New plastic formations in the Anthropocene. Sci. Total Environ. 2021, 754, 14221–14226. [Google Scholar] [CrossRef] [Scilit]
  2. PlasticsEurope. Plastics—The Fast Facts 2023. Available online: https://plasticseurope.org/knowledge-hub/plastics-the-fast-facts-2023/ (accessed on 22 August 2025).
  3. Geyer, R.; Jambeck, J.R.; Law, K.L. Production, use, and fate of all plastics ever made. Sci. Adv. 2017, 3, e1700782. [Google Scholar] [CrossRef] [Scilit]
  4. Technologia Tworzyw Sztucznych Michał Łagocki. Polichlorek Winylu. Available online: http://tts-polska.com/tts-polska2/informacje/polichlorek-winylu.html (accessed on 23 August 2025).
  5. GlobalData. Polyvinyl Chloride Market Analysis. Available online: https://www.globaldata.com/store/report/polyvinyl-chloride-market-analysis/ (accessed on 22 August 2025).
  6. Omar, M.Y.; Faramawy, U.A.; El-Nadry, M. Quantitative human health risk assessment of Vinyl Chloride Monomer (VCM) from petrochemical industries. Res. Sq. 2023. [Google Scholar] [CrossRef] [Scilit]
  7. Guardo-Ruiz, R.M.; Puello-Castellón, L.M.; Ortega-Toro, R.; Aguilar-Vásquez, E.A.; González-Delgado, Á.D. Enhancing Technical Performance of PVC Production: A WEP-Based Energy and Water Assessment. Polymers 2025, 17, 1561. [Google Scholar] [CrossRef] [Scilit]
  8. Moreno-Sader, K.A.; Martínez-Consuegra, J.; González-Delgado, Á.D. An integrated biorefinery approach via material recycle/reuse networks for the extraction of value-added components from shrimp: Computer-aided simulation and environmental assessment. Food Bioprod. Process. 2021, 127, 443–453. [Google Scholar] [CrossRef] [Scilit]
  9. González-Delgado, Á.D.; Ramos-Olmos, M.; Aguilar-Vásquez, E. Environmental Impacts Assessment in Suspension PVC Production Process Using Computer-Aided Process Engineering. Polymers 2023, 15, 2902. [Google Scholar] [CrossRef] [Scilit] [PubMed]
  10. Diaz Perez, J.M.; Mendivil-Arrieta, A.; Gonzalez-Delgado, A.D. Environmental Evaluation via Waste Reduction Algorithm (WAR) of an Energy-Integrated Suspension PVC Production Process. Chem. Eng. Trans. 2025, 117, 373–378. [Google Scholar] [CrossRef]
  11. Guardo-Ruiz, R.M.; Puello-Castellón, L.M.; González-Delgado, Á.D. Advancing Sustainable PVC Polymerization: Direct Water Recycling, Circularity, and Inherent Safety Optimization. Sustainability 2025, 17, 7508. [Google Scholar] [CrossRef] [Scilit]
  12. Carvajal, J.C.; Gómez, Á.; Cardona, C.A. Comparison of lignin extraction processes: Economic and environmental assessment. Bioresour. Technol. 2016, 214, 468–476. [Google Scholar] [CrossRef] [Scilit]
  13. Herrera-Aristizábal, R.; Salgado-Dueñas, J.; Peralta-Ruiz, Y.; Gonzalez-Delgado, A. Environmental Evaluation of a Palm-based biorefinery under North-Colombian Conditions. Chem. Eng. Trans. 2017, 57, 193–198. [Google Scholar] [CrossRef] [Scilit]
  14. Young, D.M.; Cabezas, H. Designing sustainable processes with simulation: The waste reduction (WAR) algorithm. Comput. Chem. Eng. 1999, 23, 1477–1491. [Google Scholar] [CrossRef] [Scilit]
  15. Cabezas, H.; Bare, J.C.; Mallick, S.K. Pollution prevention with chemical process simulators: The generalized waste reduction (WAR) algorithm—Full version. Comput. Chem. Eng. 1999, 23, 623–634. [Google Scholar] [CrossRef] [Scilit]
  16. Moreno-Sader, K.; Meramo-Hurtado, S.; González-Delgado, A. Computer-aided environmental and exergy analysis as decision-making tools for selecting bio-oil feedstocks. Renew. Sustain. Energy Rev. 2019, 112, 42–57. [Google Scholar] [CrossRef] [Scilit]
  17. Azapagic, A. Life Cycle Assessment and Its Application to Process Selection, Design and Optimisation. Chem. Eng. J. 1999, 73, 1–21. [Google Scholar] [CrossRef] [Scilit]
  18. Allen, D.T.; Shonnard, D.R. Green Engineering: Environmentally Conscious Design of Chemical Processes; Prentice Hall: Upper Saddle River, NJ, USA, 2002. [Google Scholar]
  19. Jimenez-Varón, C.F.; Soto, R.T. Design of a Production Plant of LDPE in Colombia. Vector Manizales 2015, 10, 122. [Google Scholar]
  20. Velásquez-Barrios, A.; Rueda-Duran, C.; Marín-Valencia, P.; Mogollón-Rincón, E.; Alvarez-Giraldo, J.; Cardona-Cabarcas, R.; Giraldo-Osorio, Ó.H.; Cardona-Alzate, C.A. Analysis of the environmental impact using the waste reduction algorithm in polypropylene production by applying grade transitions strategies in Colombia. Environ. Sci. Pollut. Res. 2019, 26, 35533–35542. [Google Scholar] [CrossRef] [Scilit]
  21. Shen, L.; Worrell, E.; Patel, M.K. Present and Future Development in Plastics from Biomass. Biofuels Bioprod. Bioref. 2010, 4, 25–40. [Google Scholar] [CrossRef] [Scilit]
  22. Mujumdar, A.S. Handbook of Industrial Drying, 4th ed.; CRC Press: Boca Raton, FL, USA, 2014. [Google Scholar]
  23. Dunn, J.B. Life Cycle Assessment of Energy Systems. In Encyclopedia of Sustainability Science and Technology; Springer: New York, NY, USA, 2012. [Google Scholar]
  24. Jin, X.; Wu, Y.; Santhamoorthy, M.; Le, T.T.N.; Le, V.T.; Yuan, Y.; Xia, C. Volatile organic compounds in water matrices: Recent progress, challenges, and perspective. Chemosphere 2022, 308, 136182. [Google Scholar] [CrossRef] [Scilit]
  25. Hunter, K.A.; Liss, P.S.; Surapipith, V.; Dentener, F.; Duce, R.; Kanakidou, M.; Kubilay, N.; Mahowald, N.; Okin, G.; Sarin, M.; et al. Impacts of anthropogenic SOx, NOx and NH3 on acidification of coastal waters and shipping lanes. Geophys. Res. Lett. 2011, 38, L13602. [Google Scholar] [CrossRef] [Scilit]
  26. Schobert, H. Composition, Properties, and Classification of Coals; Cambridge University Press: Cambridge, UK, 2013; pp. 295–322. [Google Scholar] [CrossRef] [Scilit]
  27. Kim, J.; Yu, J.; Song, J.; Lee, D.; Yu, M.; Hwang, I.; Kim, J.; Kim, J. Emission Characteristics of PM (PMtotal, PM10, PM2.5), NOx, CO and VOCs Emitted from LNG-fired Gas Turbine and Small Domestic Boiler. Asian J. Atmos. Environ. 2021, 15, 2021129. [Google Scholar] [CrossRef] [Scilit]
  28. Alsabri, A.; Al-Ghamdi, S.G. Carbon footprint and embodied energy of PVC, PE, and PP piping: Perspective on environmental performance. Energy Rep. 2020, 6, 364–370. [Google Scholar] [CrossRef] [Scilit]
Figure 1. Flow diagram of the mass-integrated PVC suspension polymerization process. Blue lines indicate the recovered water streams, while the orange line corresponds to the recovered VCM stream. “Dem-water” refers to demineralized water used within the process, VCM and PVA denote vinyl chloride monomer and polyvinyl alcohol, respectively.
Processes 14 01350 g001
Figure 2. Balance of PEI of chemical processes considering energy consumption.
Processes 14 01350 g002
Figure 3. Total output PEI and generated PEI in the suspension PVC production process with direct recycle integration.
Processes 14 01350 g003
Figure 4. Contribution to the PEI output rate via energy consumption by section of the suspension PVC production process integrated with direct recycle.
Processes 14 01350 g004
Figure 5. Toxicological impacts of the integrated process with direct recycle, including energy consumption, waste flows, and products.
Processes 14 01350 g005
Figure 6. PEI output rate based on the comparison of energy use in the process primarily integrated with direct recycling.
Processes 14 01350 g006
Figure 7. Atmospheric impacts of the PVC production process integrated with direct recycling.
Processes 14 01350 g007
Table 1. Summary of main unit operations and key process conditions for the mass-integrated PVC production process.
Unit OperationEquipmentT (°C)P (Bar)Main Inlet StreamsMain Outlet Streams
PolymerizationBatch Reactor70.010.0VCM, water, PVA, Luperox 610PVC slurry
Degassing UnitDegassing Unit70.01.77PVC slurry, steamVCM-rich vapor stream, liquid PVC stream
Solid–liquid separationCentrifuge65.01.01Cooled PVC suspensionWet PVC paste, recovered water
DryingDryer250.01.01Wet PVC paste, hot airDried PVC particles, exhaust air
Gas–solid separationCyclone70.01.01Dried PVC streamFinal PVC product, light volatiles
Table 2. Specification of product and waste streams for WAR-based assessment in a suspension PVC production process with direct water recycling.
Stream NameClassificationMain Components
PVC productProductPVC
Cyclone overheadWasteAir, water
Wastewater purgeWasteWater, PVA, PVC
Table 3. Contribution of each stage to the total PEI production rate.
StagePEI Production Rate (PEI/Day)Contribution (%)
PVC Polymerization00%
PVC Purification00%
VCM Recovery00%
Drying4.5171%
Direct Recycle1.8429%
Total6.35100%
Disclaimer/Publisher’s Note: The statements, opinions and data contained in all publications are solely those of the individual author(s) and contributor(s) and not of MDPI and/or the editor(s). MDPI and/or the editor(s) disclaim responsibility for any injury to people or property resulting from any ideas, methods, instructions or products referred to in the content.