


Abstract
Light hydrocarbons in shale oil readily volatilize during conventional coring, surface handling, storage, and laboratory preparation. The resulting evaporative loss causes systematic underestimation of Rock-Eval S1 peak (free hydrocarbons measured by programmed pyrolysis), which can bias oil-bearing evaluation, sweet-spot delineation, and resource assessment. Here we investigate Chang 73 lacustrine shale oil in the Ordos Basin (China) using frozen cores recovered by pressure-retained coring from four wells. Time-series Rock-Eval pyrolysis and thermal desorption–gas chromatography (TD–GC) were used to quantify the magnitude, temporal evolution, and practical equilibrium time of light-hydrocarbon loss and to establish a practical restoration model. S1 decreases with storage time and exhibits a clear two-stage behavior. Shale shows a rapid-loss stage during 0–90 days, followed by a practical equilibrium stage after 90 days (S1 change less than 5%). Sandstone interbeds lose light hydrocarbons faster and more completely, reaching practical equilibrium after 60 days. TD–GC indicates that the lost fraction is dominated by n-alkane components lighter than C13, with gaseous hydrocarbons showing the greatest depletion; medium and heavy fractions decrease modestly. Loss is coupled with progressive desorption from kerogen and clays, leading to enrichment of heavier components in the residual free hydrocarbons and a shift of the modal carbon number toward higher values. At the shale equilibrium time, total organic carbon (TOC) and vitrinite reflectance (Ro) jointly control the restoration factor K. We propose a two-parameter restoration model: K = (0.4024·ln (TOC) + 0.821)·(0.652·Ro + 0.4292). Applying the model to more than 50 conventionally cored wells reveals that the Qingyang–Zhengning area in the southwestern basin is the principal enrichment zone of original free hydrocarbons, followed by the Jiyuan area in the north and the Huachi area in the central basin, whereas the eastern basin is relatively depleted. The workflow provides a robust and transferable approach for correcting S1 and improving shale-oil evaluation in lacustrine systems.
1. Introduction
Shale oil has become a major target for global petroleum exploration and reserve replacement [1,2]. In China, lacustrine shale-oil systems are strongly heterogeneous, and variations in depositional facies, organic richness, maturity, and storage conditions produce pronounced differences in oiliness both laterally and vertically [3]. Reliable evaluation of oil-bearing properties is therefore essential for estimating movable hydrocarbons, predicting sweet spots, and reducing development risk.
Rock-Eval S1 is widely used to quantify free hydrocarbons and is commonly interpreted as the most readily producible fraction of retained oil [4]. Its content affects estimated ultimate recovery (EUR) at the well scale [5,6,7]. Because S1 is dominated by volatile light hydrocarbons [8,9,10], it is highly sensitive to depressurization and temperature change. During conventional coring and subsequent handling, light hydrocarbons can exsolve and escape from pores and fractures. Additional volatilization also occurs during sample storage and preparation (cutting, crushing, and loading) [11]. Consequently, laboratory-measured S1 can be substantially lower than the true in situ value, leading to systematic underestimation of enrichment and potentially misleading decisions in prospect ranking and well placement.
Several approaches have been proposed to restore lost light hydrocarbons, including corrections based on light-hydrocarbon indices, biomarker proxies, and isotope fractionation [12,13,14,15,16,17]. These methods rely on relatively non-volatile parameters associated with light fractions and are only semi-quantitative. Their accuracy is constrained by geological complexity and cannot replace direct measurements. Pressure-retained coring and frozen-core handling enable more faithful capture of initial free hydrocarbons, providing an opportunity to directly quantify loss trajectories and constrain correction factors. Zhu et al. suggested a light hydrocarbon loss rate of approximately 50% by comparing S1 values between fresh and stored samples [18]. Similarly, Jarvie et al. reported that the S1 value of fresh samples can be five times higher than that of long-term stored ones [19]. Other studies have documented losses of up to 38% during core storage [20], indicated that conventional pyrolysis may yield only half the original free hydrocarbons [21], and calculated restoration factors ranging from 1.33 to 2.89 based on sample degradation over time [22]. However, such special coring is costly and is rarely available for the large number of conventionally cored wells needed for basin-scale evaluation. In addition, prior correction models for Chinese lacustrine shale oil commonly emphasize maturity effects, while the role of organic abundance is seldom quantified explicitly.
To address these gaps, we use pressure-retained frozen cores from the Chang 73 submember of the Triassic Yanchang Formation in the Ordos Basin to: (i) quantify time-series changes in S1 and hydrocarbon composition during storage, (ii) clarify the time-dependent loss behavior and practical equilibrium time of light-hydrocarbon loss for different lithologies, (iii) integrate key geological controls to establish a quantitative restoration model, and (iv) apply the model to correct S1 from conventionally cored wells, thereby improving oiliness evaluation, sweet-spot prediction, and resource assessment. Compared with previously published correction methods, the present approach provides two main improvements: it directly constrains storage-time loss trajectories using pressure-retained frozen cores, and it establishes a two-parameter restoration model that explicitly incorporates both TOC and Ro.
2. Geological Setting
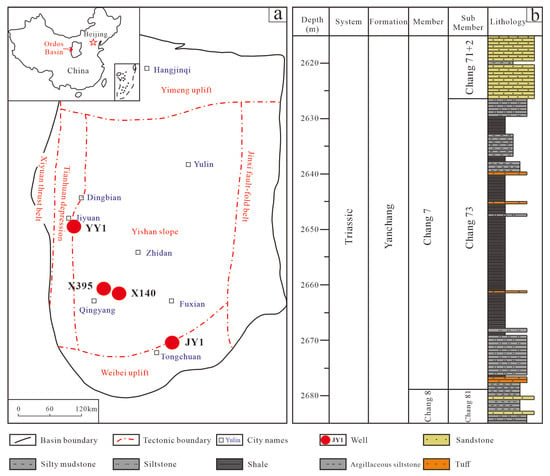
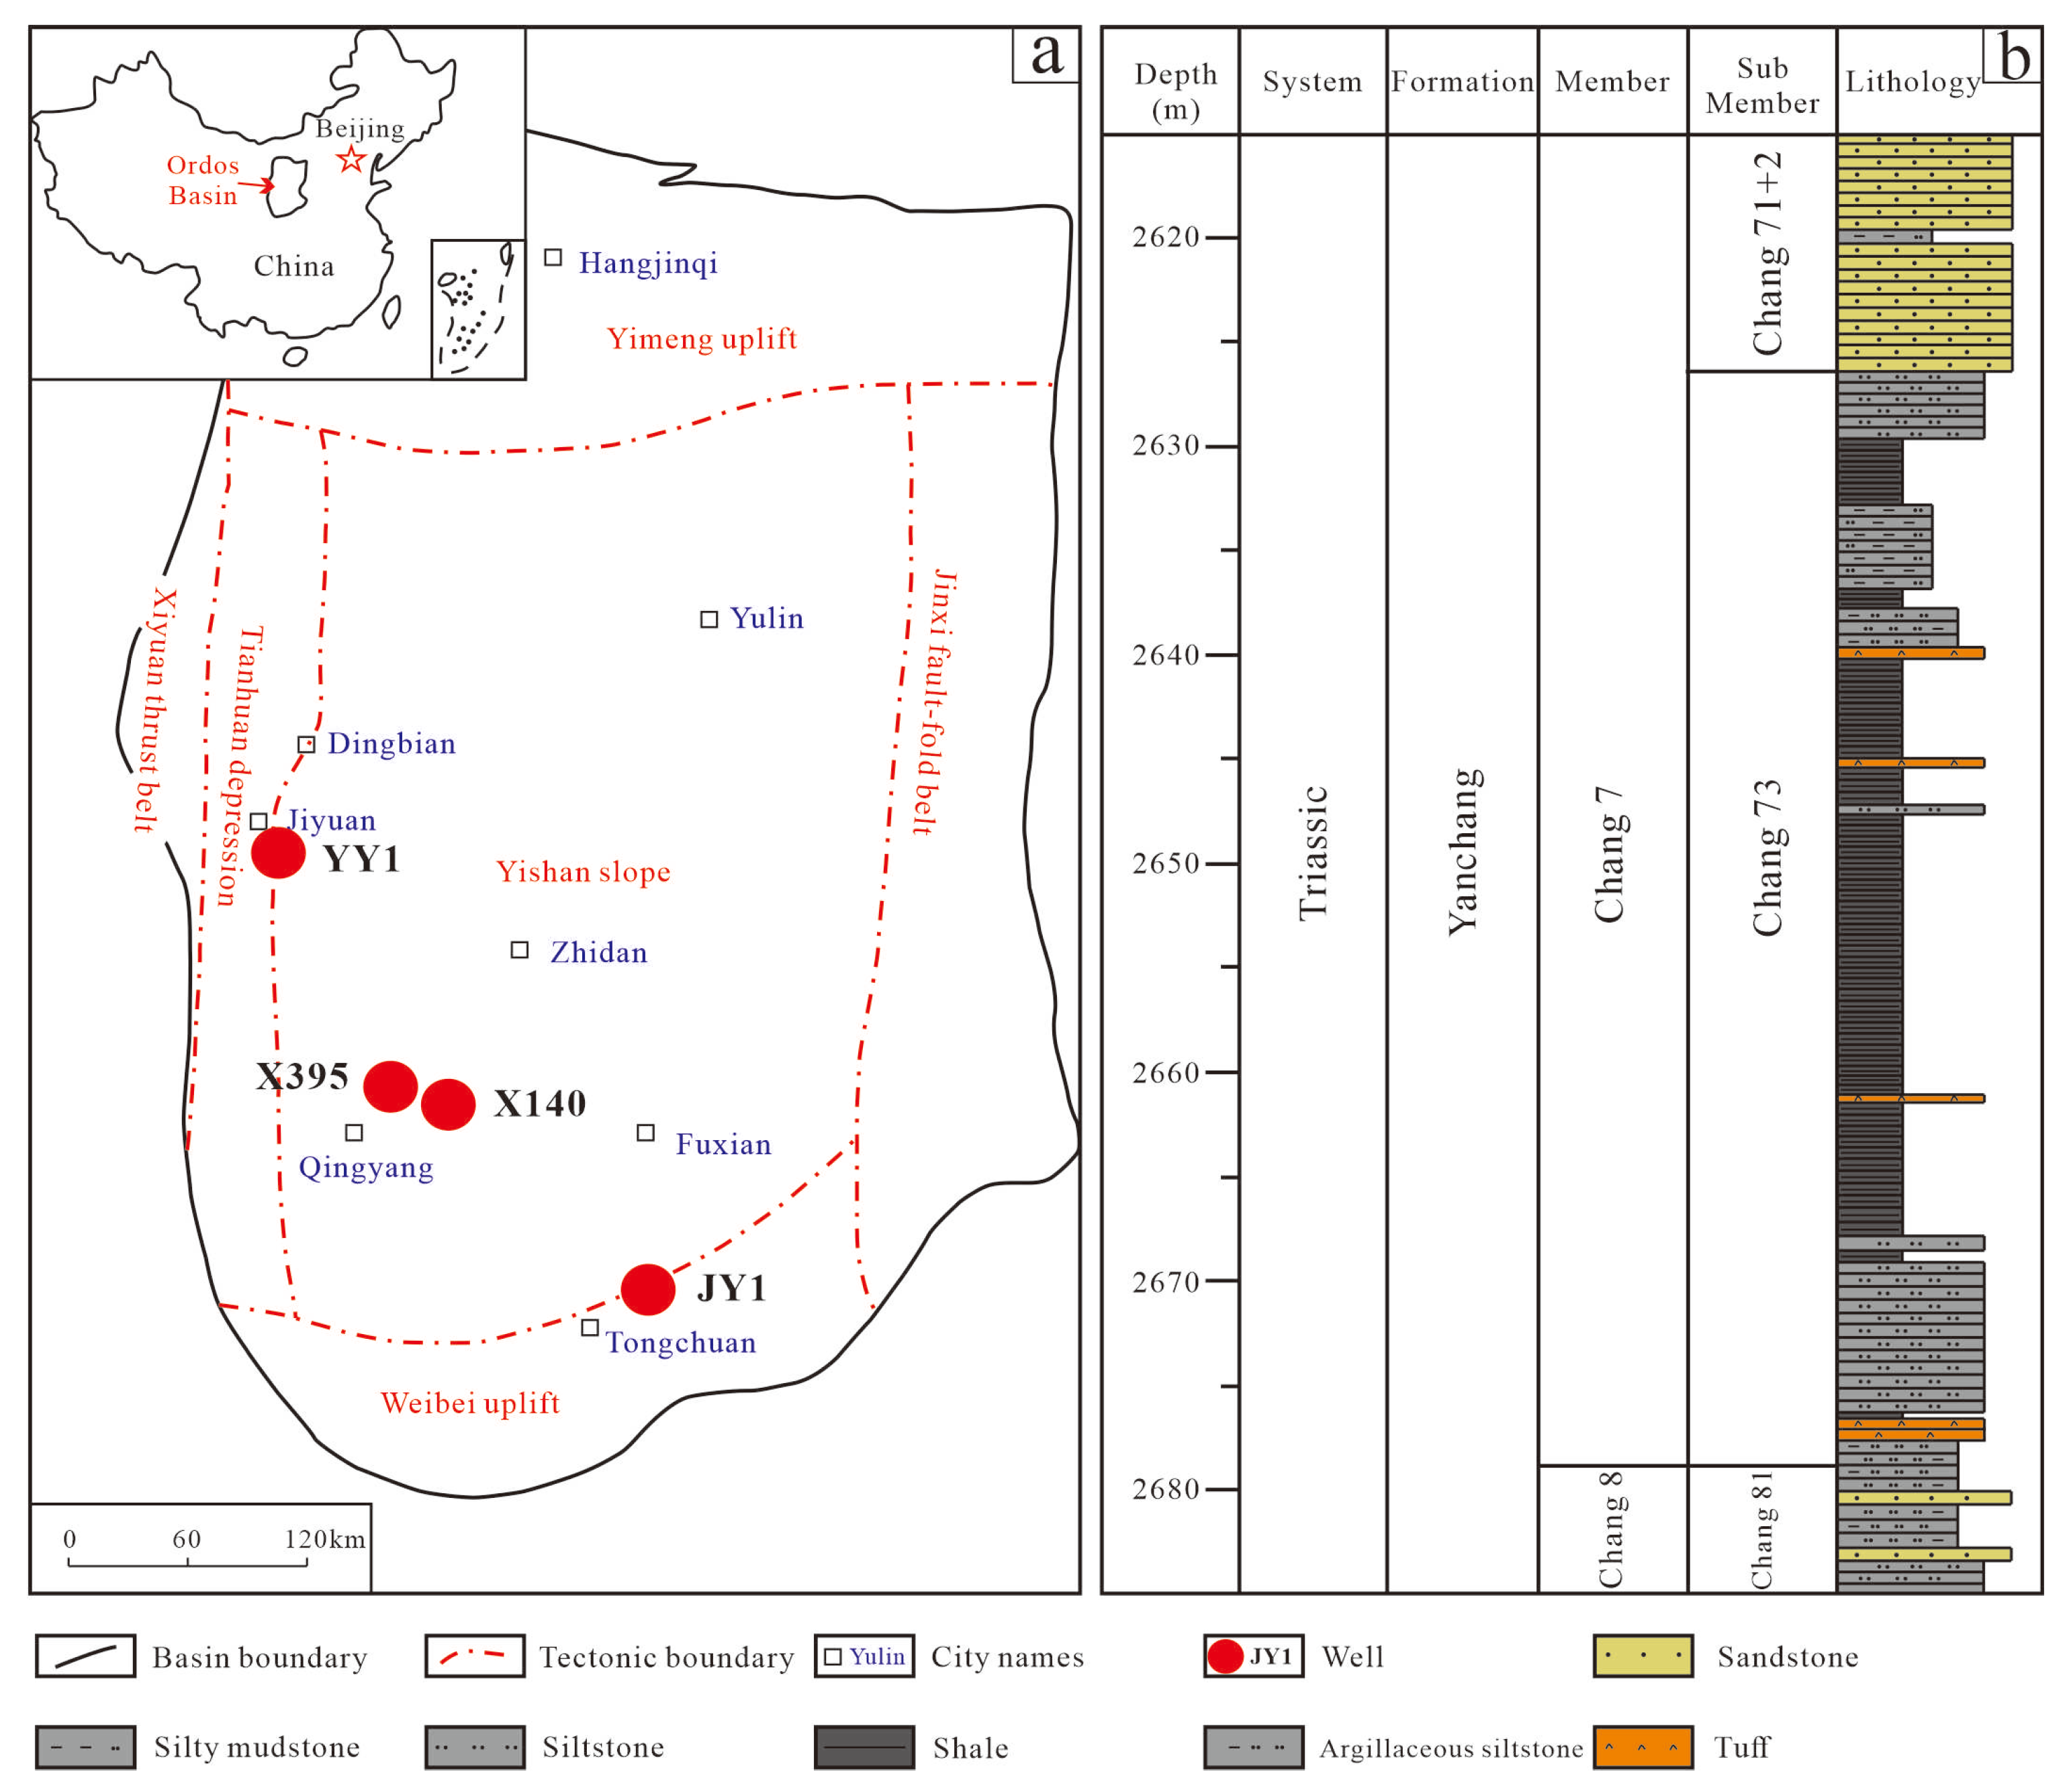
The Ordos Basin is in north-central China on the North China Craton and covers 3.7 × 10⁵ km2. It is a multi-cycle, intracratonic sedimentary basin [23,24,25,26]. Six first-order structural units can be recognized (Figure 1a): the Yimeng Uplift to the north; the western thrust belt and the Tianhuan Depression to the west; the Weibei Uplift to the south; the Jinxi Flexural Fold Belt to the east; and the central basin depocenter represented by the Yishan Slope [27,28]. The basin was a stable marine cratonic basin during the Paleozoic and was transformed into an inland basin during the Mesozoic under the influence of the Indosinian tectonic event [29,30,31]. During the Triassic, a fluvial–deltaic–lacustrine clastic system accumulated, forming the Yanchang Formation [32,33]. Based on oiliness and marker beds, the Yanchang Formation is subdivided from bottom to top into ten members (Chang 1–Chang 10) [34]. The Chang 7 member is a lacustrine unit characterized by widespread organic-rich shales, representing the principal Mesozoic source rock of the basin and a key target for shale-oil exploration and development [35,36]. The Chang 7 member is further divided into three submembers (Chang 71, Chang 72, and Chang 73). The Chang 73 submember was deposited during the maximum lake expansion, with a thickness of 15–55 m; gravity-flow sand bodies occur in the upper and lower parts, whereas the middle interval comprises organic-rich shale, dark mudstone, thin-bedded siltstone, and tuff (Figure 1b).
Figure 1.
Structural units of the Ordos Basin, showing (a) the locations of Well YY1, X395, X140, and JY1 in the Ordos Basin and (b) the stratigraphic column of Well YY1.
Chang 73 shale is characterized by large thickness, wide distribution, and high organic abundance. TOC typically ranges from 2% to 25% (average 6%), and kerogen is dominated by Type I–II1. Thermal maturity (Ro) ranges from 0.6% to 1.2%. Saturated hydrocarbons and aromatics constitute 86% of the shale oil composition, with the carbon number of saturates predominantly ranging from C8 to C25 [10]. The high content of light components makes it an ideal interval for investigating light hydrocarbon loss characteristics and establishing quantitative restoration methods.
3. Materials and Methods
For this study, 30 fresh samples were selected from wells YY1, X395, X140, and JY1 in the Ordos Basin, comprising 23 black shale and grey-black mudstone samples and 7 sandstone samples. All four wells were cored using pressure-retained coring to minimize loss from the reservoir to the wellhead. Upon retrieval, the core barrels were continuously frozen in liquid nitrogen for more than 4 h. After the cores were fully frozen, representative samples were selected and immediately stored in liquid-nitrogen containers for transport and storage to minimize loss. Representative fresh core samples were cylindrical, with a diameter of approximately 8 cm and a length of approximately 2 cm. In the laboratory, each core was cut into six subsamples. One subsample was crushed under low-temperature, sealed conditions to minimize hydrocarbon loss during preparation; the resulting powder was analyzed by Rock-Eval pyrolysis and thermal desorption–gas chromatography (TD–GC). The remaining five subsamples were stored in core boxes under ambient laboratory conditions (24 °C, 1 atm; relative humidity approximately 45%) with natural ventilation and analyzed after 7, 30, 60, 90, and 180 days, respectively. TOC and Ro were also determined.
TOC was measured using a LECO CS230 carbon–sulfur analyzer (LECO Corporation, St. Joseph, MI, USA). Frozen samples were crushed under low-temperature sealed conditions to obtain 200-mesh powders. Powders were treated with HCl (1.5 mol/L, corresponding to 5 wt%; Sinopharm Chemical Reagent Co., Ltd., Shanghai, China) for 24 h to remove carbonate minerals, rinsed repeatedly with deionized water to remove residual acid, dried at 80 °C for 24 h, and then combusted at 1350 °C to determine TOC.
Rock-Eval 6 pyrolysis (Vinci Technologies, Nanterre, France) was used to quantify retained hydrocarbons. Samples were crushed to 200-mesh under low-temperature sealed conditions, and 100 mg powder was loaded into the instrument. The temperature program held at 300 °C for 1 min to obtain the S1 peak (free hydrocarbons), followed by heating from 300 to 600 °C at 25 °C/min to generate the S2 peak (kerogen-cracking hydrocarbons). TD–GC analyses were performed using an MSSV thermal desorption–GC system (GEOS4 GmbH, Freiberg, Germany). The injector temperature was 300 °C. Helium was used as carrier gas at 1 mL/min. Approximately 100 mg powder was placed in the injector. The GC oven was programmed from 35 °C (hold 20 min) to 300 °C at 4 °C/min (hold 30 min). Compounds were identified by comparing retention times with previously published reference data for shale-oil pyrolysis/TD–GC analyses [20,22]. In this study, the resolved TD–GC peaks discussed below are interpreted mainly in terms of the n-alkane series; therefore, the TD–GC results are used to track relative changes in n-alkane distribution during storage rather than to quantify the loss of total hydrocarbons or all light-oil compound classes.
Thermal maturity was assessed by Ro measurements using a DM4500P polarizing microscope (Leica Microsystems GmbH, Wetzlar, Germany) and a QDI302 microspectrophotometer (Craic Technologies Inc., San Dimas, CA, USA). Samples were crushed to 20–40 mesh, mixed with epoxy resin, and cured at 60 °C for 12–16 h. Polished blocks were prepared and calibrated using reflectance standards. Ro was calculated from the ratio of reflected to incident light intensity for vitrinite macerals.
4. Results
4.1. Basic Geochemical Characteristics
Table 1 summarizes the general information and geochemical parameters of frozen core samples from the four pressure-retained wells. Samples from Well JY1 include black shale, dark-gray mudstone, and light-gray fine sandstone. Shale/mudstone have Ro of 0.65%, TOC of 4.37–16.51%, and initial S1 of 2.47–9.22 mg HC/g rock. Fine sandstone has very low TOC (0.59–0.70%) but high initial S1 (6.82–8.24 mg HC/g rock). Well X140 includes black shale, dark-gray mudstone, and gray siltstone, with shale/mudstone Ro of 0.80%, TOC of 4.13–27.96%, and initial S1 of 3.05–17.38 mg HC/g rock; siltstone TOC is 0.64–3.14% and initial S1 is 2.86–21.71 mg HC/g rock. Well YY1 comprises black shale, dark-gray mudstone, and gray siltstone, with shale/mudstone Ro of 0.85%, TOC of 2.06–17.93%, and initial S1 of 1.53–6.64 mg HC/g rock; siltstone TOC is 1.12–1.28% and initial S1 is 3.19–5.28 mg HC/g rock. Well X395 includes black shale and dark-gray mudstone only (Ro~0.90%, TOC 2.32–22.50%), with initial S1 of 6.40–28.10 mg HC/g rock. To facilitate direct comparison between initial and equilibrium conditions, Table 1 also includes the S1 value at the practical equilibrium point for each sample. For shale and mudstone, this corresponds to the 90-day value, whereas for sandstone it corresponds to the 60-day value.
Table 1.
Basic geochemical information of samples in this study.
4.2. Time-Dependent Evolution of Rock-Eval S1
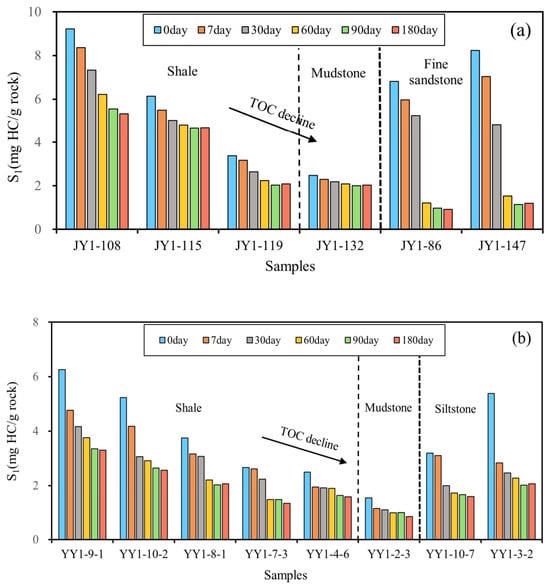
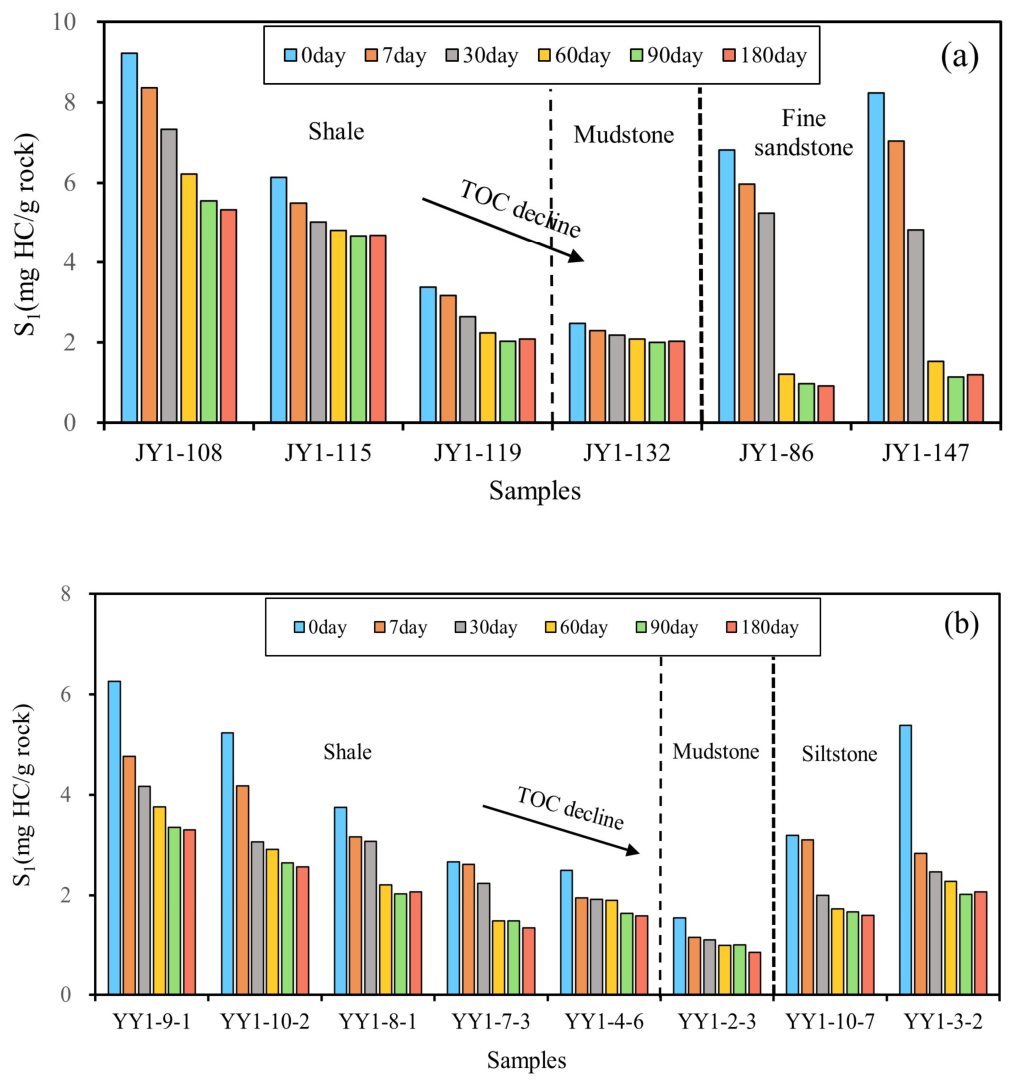
Figure 2 shows the evolution of S1 from day 0 to day 180 for samples from Wells JY1 and YY1. Shale and mudstone initially exhibit relatively high S1, positively correlated with TOC. In Well JY1, initial S1 is 2.30–9.22 mg HC/g rock and decreases to 2.03–5.32 mg HC/g rock after 180 days (Figure 2a). In Well YY1, initial S1 is 1.53–6.26 mg HC/g rock and decreases to 0.84–3.30 mg HC/g rock after 180 days (Figure 2b). Siltstone/fine-sandstone samples have high initial S1 due to hydrocarbon migration from adjacent shale intervals. For example, fine sandstone from Well JY1 decreases from 6.82–8.24 to 0.92–1.19 mg HC/g rock after 180 days, and siltstone from Well YY1 decreases from 3.19–5.38 to 1.58–2.06 mg HC/g rock. Because the magnitude and trajectory of loss differ between shale/mudstone and sandstone, we treat these lithologies separately below.
Figure 2.
Variation of S1 content in core samples with storage time: (a) for samples from Well JY1 and (b) for samples from Well YY1.
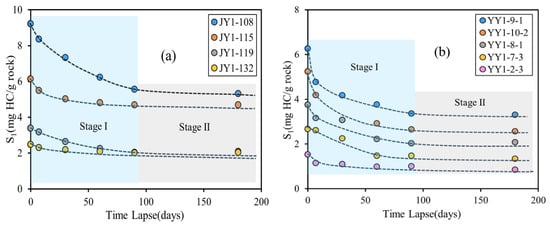
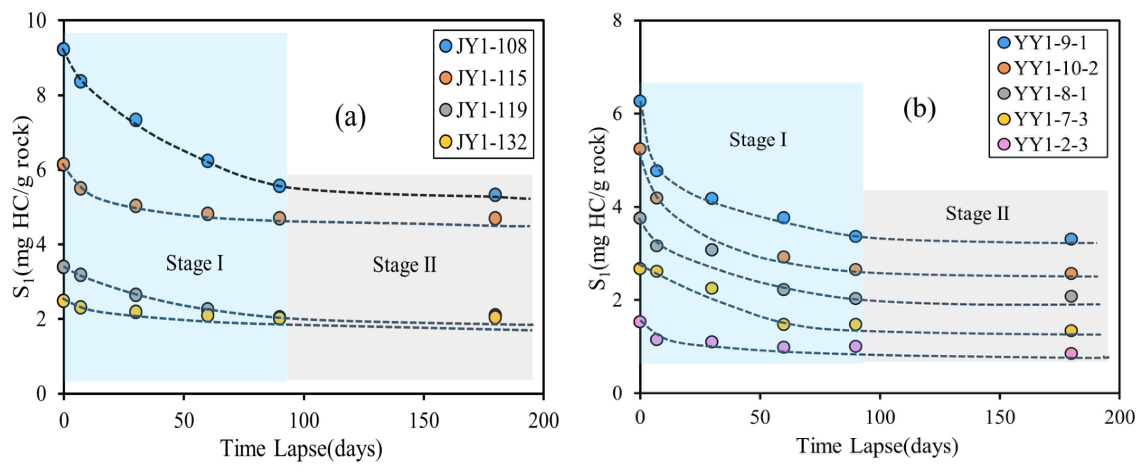
With increasing storage time, shale/mudstone S1 generally decreases gradually (Figure 3). Light-hydrocarbon loss is rapid in the initial 0–7 days: 6.24–10.41% of the initial S1 in Well JY1 and 15.79–25.52% in Well YY1. During subsequent periods, the loss rate progressively slows; by 90 days it becomes very small. At 90 days, cumulative loss reaches 18.68–39.94% for Well JY1 (Figure 3a) and 34.95–49.51% for Well YY1 (Figure 3b). From 90 to 180 days, S1 is essentially stable, with changes <5%, indicating negligible additional loss. Therefore, light-hydrocarbon loss in shale/mudstone can be divided into two stages. Stage I (0–90 days) is a rapid-loss stage, during which pressure and temperature changes cause extensive exsolution and escape from pores and fractures; this stage accounts for 95% of the total loss and largely corresponds to movable hydrocarbons. Stage II (after 90 days) is a practical-equilibrium stage: the most mobile light hydrocarbons have been depleted, and the remaining light fractions, stabilized by adsorption to kerogen and clay minerals, exhibit minimal further loss.
Figure 3.
Variation of S1 content with storage time for shale and mudstone samples: (a) from well JY1 and (b) from well YY1. Dashed lines are visual guides connecting measured data points and do not represent model fits.
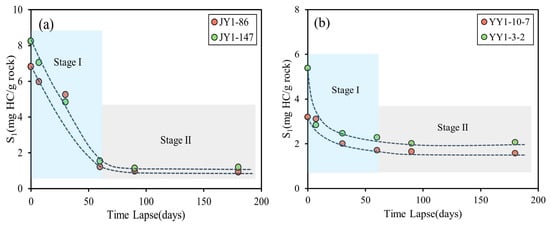
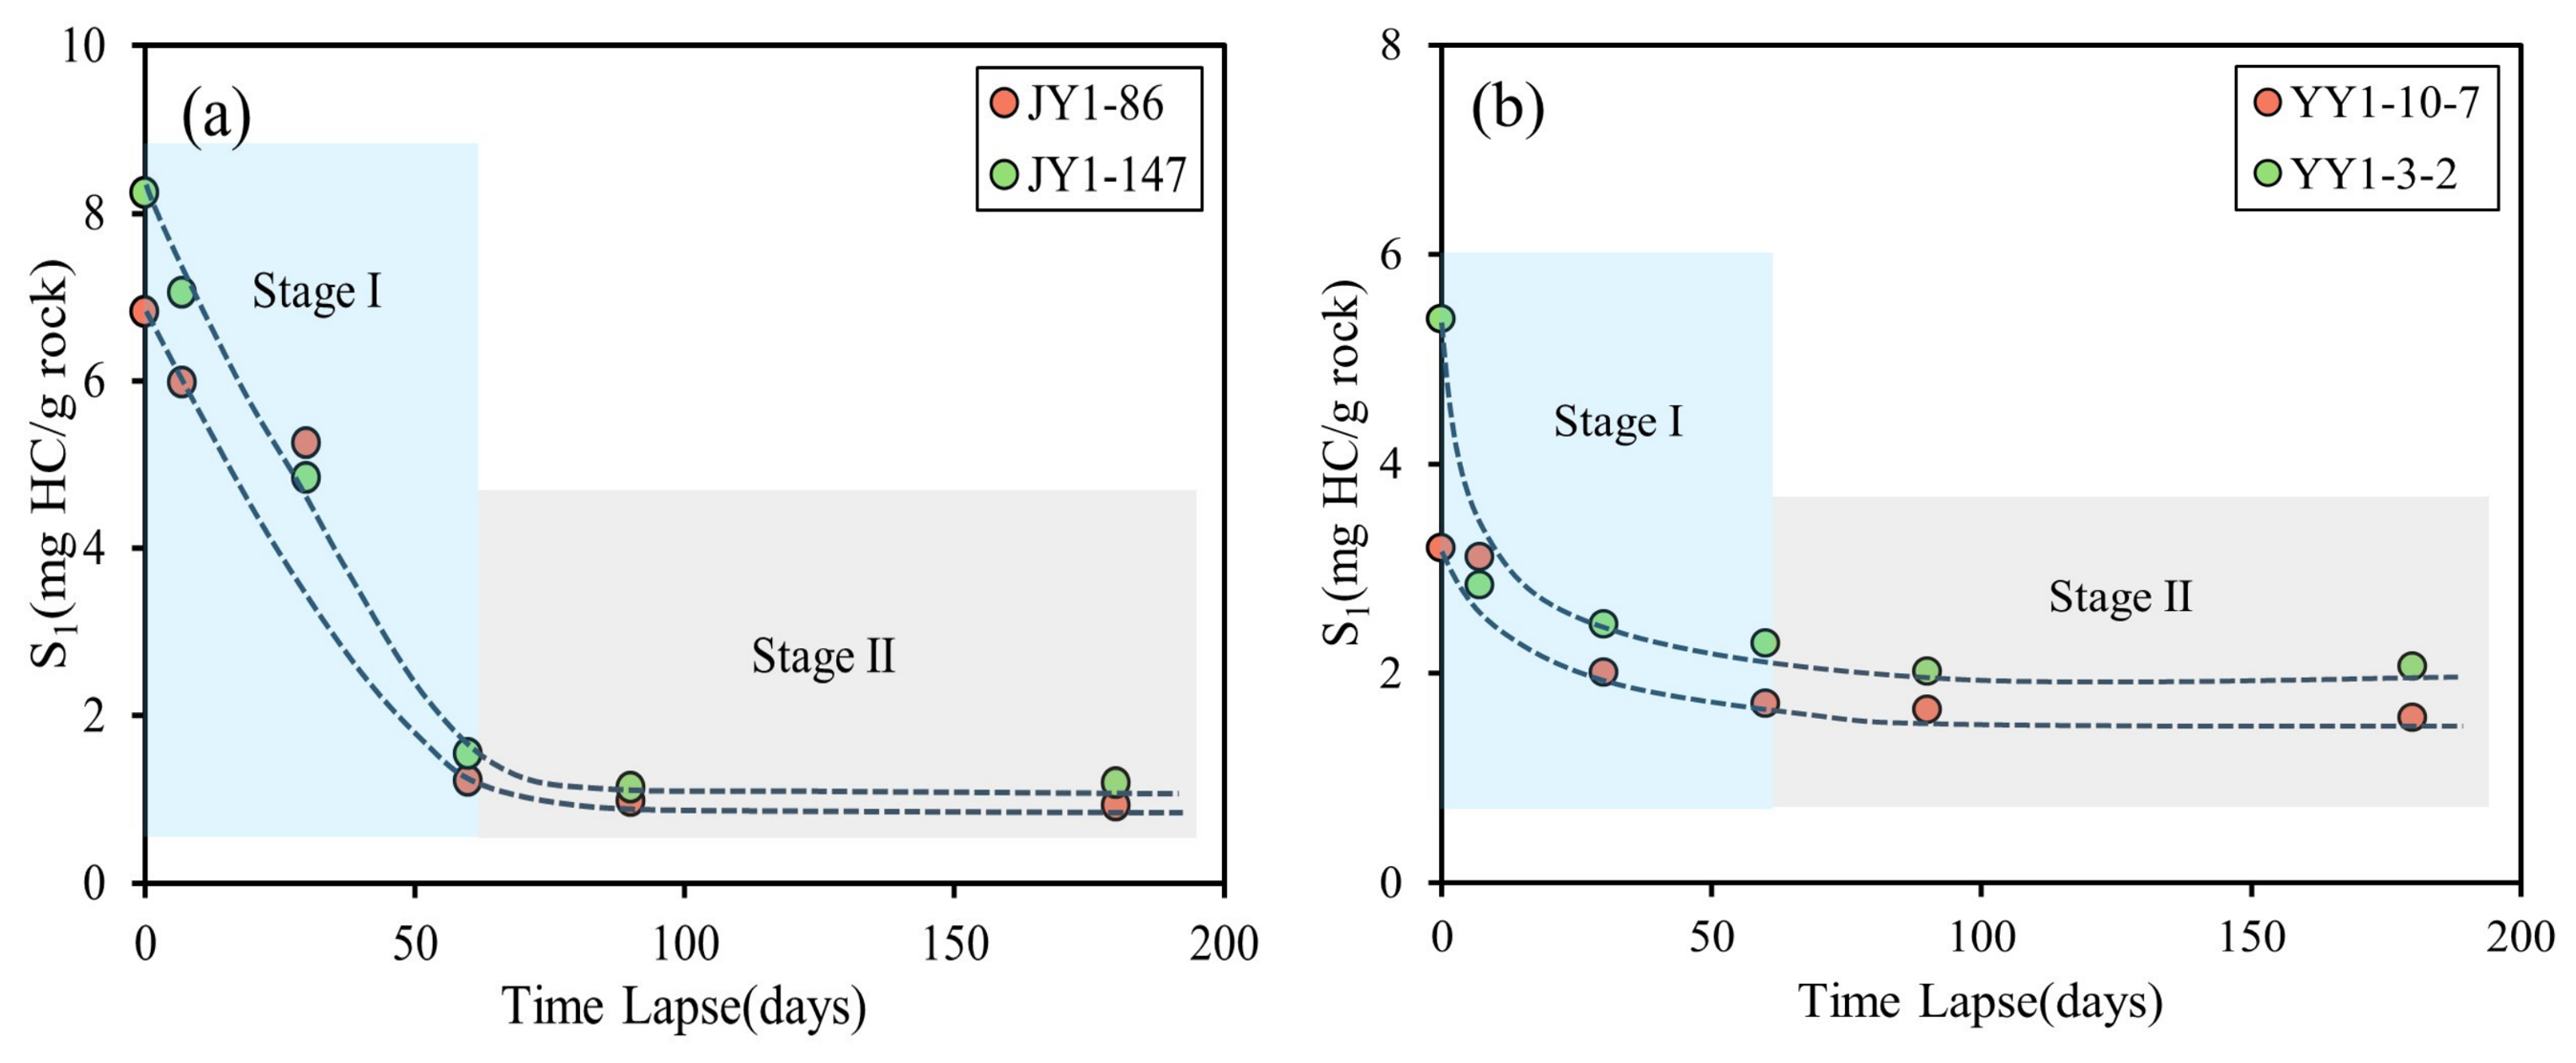
Sandstone S1 declines rapidly with time (Figure 4). Similar to shale/mudstone, sandstone loss can be divided into two stages. Stage I (0–60 days) is characterized by rapid loss because sandstone has higher porosity and permeability than shale, facilitating escape of light hydrocarbons; fine sandstone loses more than siltstone. After 60 days, S1 loss reaches 81.42–82.25% in fine sandstone from Well JY1 (Figure 4a) and 46.39–57.64% in siltstone from Well YY1 (Figure 4b). Stage II (60–180 days) is a stabilization stage with S1 changes <5%, indicating near-complete depletion of the light fraction. Relative to shale, sandstone shows both higher loss rates and larger cumulative loss, and reaches equilibrium earlier. Minor fluctuations, including slight rebounds in S1 in a few samples after 90 days, may reflect delayed desorption and redistribution of previously adsorbed hydrocarbons as the more mobile light components are progressively depleted. However, because these changes are generally <5%, they do not affect the definition of the practical equilibrium time.
Figure 4.
Variation of S1 content with storage time for sandstone samples: (a) fine sandstone from well JY1 and (b) siltstone from well YY1. Dashed lines are visual guides connecting measured data points and do not represent model fits.
4.3. TD–GC Evidence Changes in N-Alkane Distributions During Storage
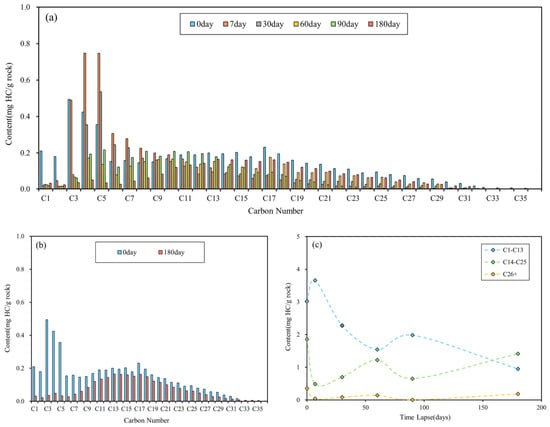
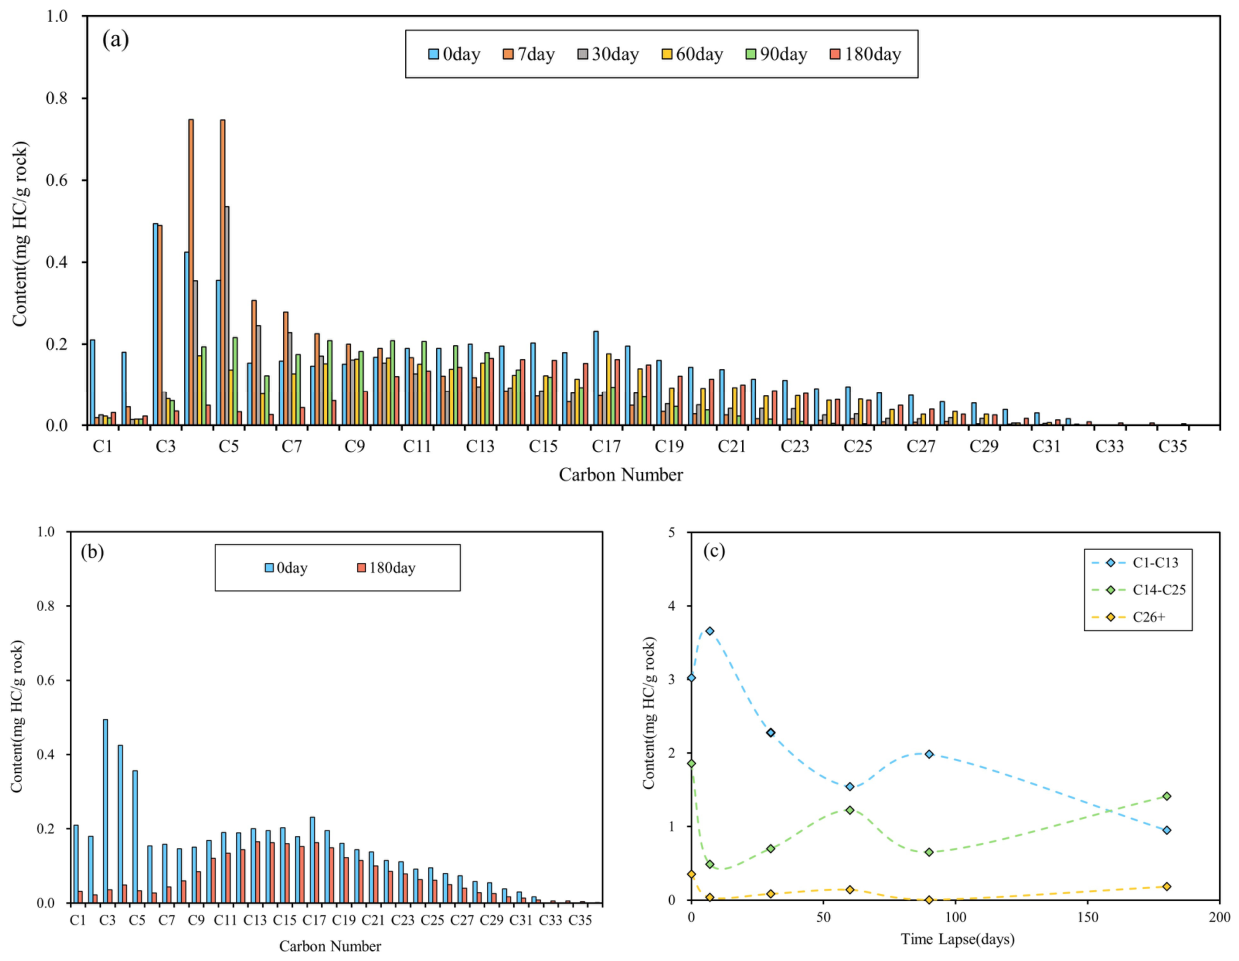
Figure 5a presents the TD–GC-resolved n-alkane distributions of a representative shale sample (YY1–10–2) at different exposure times. In this study, the TD–GC results are used to evaluate storage-related changes in the n-alkane series rather than the loss of total hydrocarbons. According to previously published compositional data for shale oil [10], the compositional fractions of shale oil include gaseous hydrocarbons (C1–C4), light hydrocarbons (C5–C13), medium hydrocarbons (C14–C25), heavy hydrocarbons (C26+), resins, and asphaltenes [10]; notably, gaseous hydrocarbons are considered a subset of the light hydrocarbons. In the fresh sample, light hydrocarbons dominate 57.77% of saturates, including gaseous hydrocarbons at 25.01%. Medium hydrocarbons account for 35.51%, and heavy hydrocarbons for 6.71%. With increasing storage time, total free hydrocarbons decrease, while a slight increase in some heavy components is observed. Comparing the fresh sample with the sample stored for 180 days (Figure 5b) shows that light hydrocarbons decline from 3.02 to 0.95 mg HC/g rock (a loss of 68.6%); gaseous hydrocarbons exhibit the strongest loss (89.4%). Medium hydrocarbons decrease by 24.0%, and heavy hydrocarbons decrease by 48.0%. Fraction trends (Figure 5c) show rapid loss of light hydrocarbons during the first 60 days, followed by a slower decline. Turning points where light-hydrocarbon abundance temporarily increases are observed, likely reflecting desorption of hydrocarbons previously adsorbed to kerogen and clay minerals after pore space is vacated by volatilization. This desorption–loss cycle may persist during storage until equilibrium is reached. Medium and heavy hydrocarbons show similar but lagged dynamics due to their larger molecular size and lower escape efficiency. Overall, all fractions decrease with time, and the modal carbon number of the remaining free hydrocarbons shifts to higher values, reflecting compositional “heaviness” during storage.
Figure 5.
Compositional changes of n-alkane in shale with storage time: (a) evolution over 0–180 days, (b) initial vs. final comparison, and (c) fraction trends (light, medium, heavy).
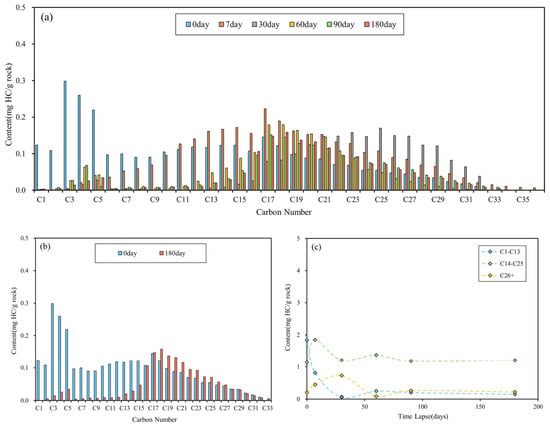
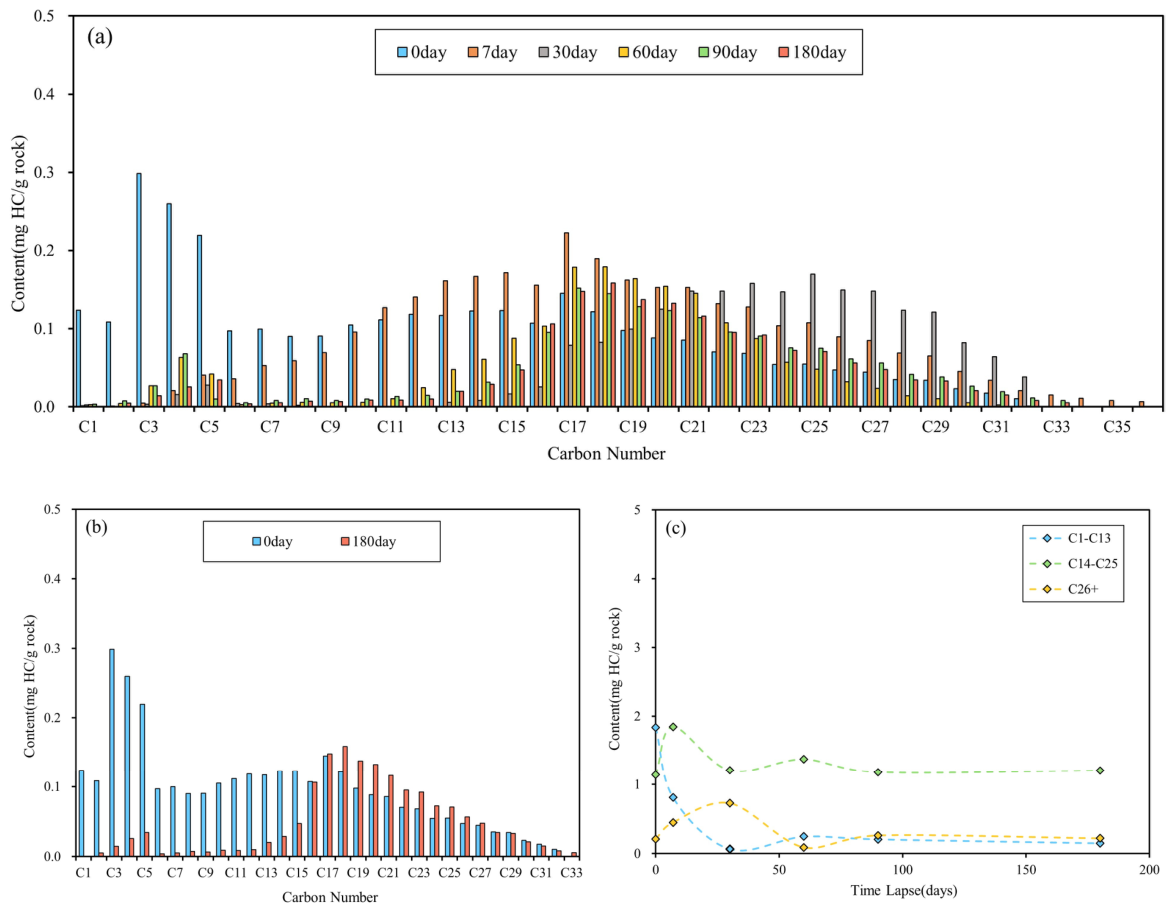
Figure 6a shows the TD–GC-resolved n-alkane distributions of a siltstone sample (YY1–10–7). The fresh siltstone exhibits a similar fraction distribution to shale: light hydrocarbons 57.64%, medium 35.72%, and heavy 6.64%, but with a lower total abundance. Siltstone free hydrocarbons decrease rapidly, especially the light fraction, while minor medium-to-heavy components exhibit a rise-then-fall pattern. Comparison between fresh and 180-day samples (Figure 6b) indicates that hydrocarbons lighter than C15 are most severely depleted, with losses exceeding 90%. In contrast, some C16+ medium and heavy components show slight increases, likely because loss of light hydrocarbons reduces clay-mineral adsorption capacity for medium-to-heavy compounds. Fraction trends (Figure 6c) show that light hydrocarbons drop rapidly within 0–30 days and are nearly exhausted by day 30; subsequent desorption causes a transient rebound followed by further loss, leaving only trace light fractions at the end. Medium and heavy fractions display a dynamic loss–desorption response, with the heavy-fraction turning point lagging that of the medium fraction, and their overall abundances change only slightly. Thus, the dominant loss in siltstone is the light fraction, while medium and heavy losses are limited. The modal carbon number shifts toward heavier values with storage time. It should be noted that the TD–GC results presented here mainly constrain changes in the n-alkane series during storage. Other hydrocarbon classes such as iso-alkanes and cycloalkanes are not comprehensively resolved by this interpretation framework. Therefore, the TD–GC data are used here as compositional evidence for preferential loss of low-carbon-number n-alkanes and for carbon-number shifts in residual hydrocarbons, rather than as a one-to-one quantitative proxy for total hydrocarbon loss.
Figure 6.
Compositional changes of n-alkane in siltstone with storage time: (a) evolution over 0–180 days, (b) initial vs. final comparison, and (c) fraction trends (light, medium, heavy).
5. Discussion
5.1. Equilibrium Time for Light-Hydrocarbon Loss
Both time-series S1 and TD–GC results indicate a progressive decrease in loss rate from rapid to slow. In principle, if storage time is sufficiently long, free hydrocarbons will continue to be lost and S1 will decrease. When the loss rate becomes very small and both S1 and composition change minimally, the system can be considered to have reached a loss equilibrium. Identifying the equilibrium time is essential for evaluating loss magnitude, restoring original hydrocarbons, and estimating original resources.
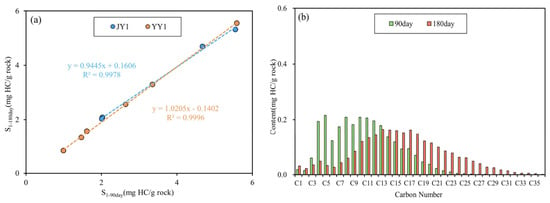
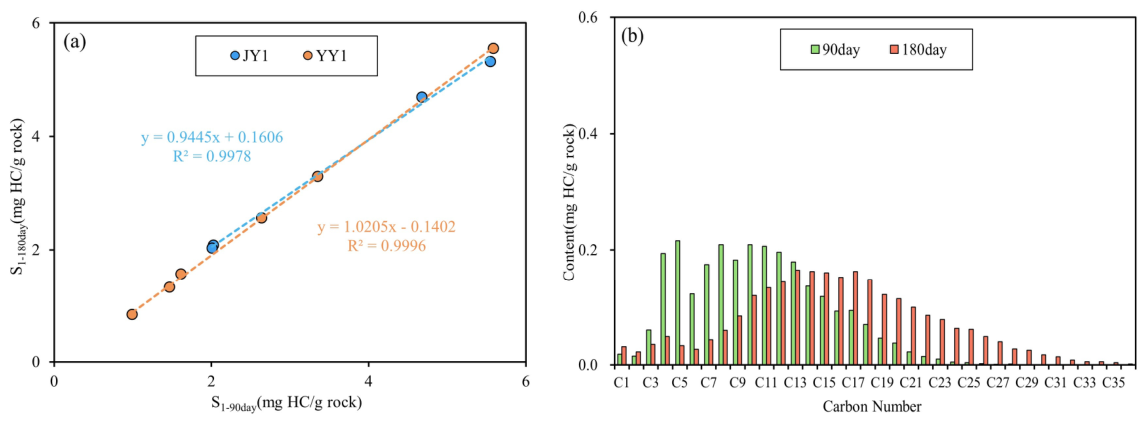
For shale/mudstone, the two-stage behavior suggests 90 days as the boundary. We therefore compared S1 at 90 and 180 days (Figure 7a) and found they are similar (1–5% difference), indicating near-stability of S1 after 90 days. TD–GC comparisons between 90 and 180 days (Figure 7b) show continued, albeit limited, loss of some C3–C12 components, whereas some medium and heavy components increase. Such heavy-component enrichment during prolonged slow loss has also been reported previously [20,22]. This behavior can be explained by a fixed pore/fracture storage capacity: once light hydrocarbons escape, pore pressure decreases and previously adsorbed hydrocarbons (including light, medium, and heavy) can desorb. Because shale S1 changes by <5% after 90 days, this late-stage enrichment has a limited effect on the bulk S1 restoration factor, but it may bias composition-based oil quality or mobility interpretations for conventionally stored shales. Accordingly, we define 90 days as the practical equilibrium time for shale, which can be used for correcting S1.
Figure 7.
Changes of S1 and n-alkane in shale from 90 to 180 days: (a) relationship of S1 content from wells JY1 and YY1, and (b) changes of n-alkane from well YY1.
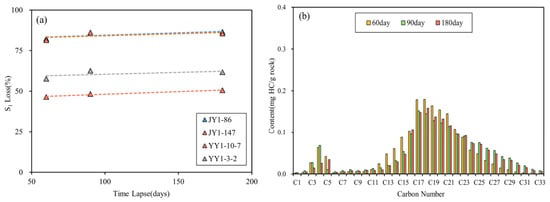
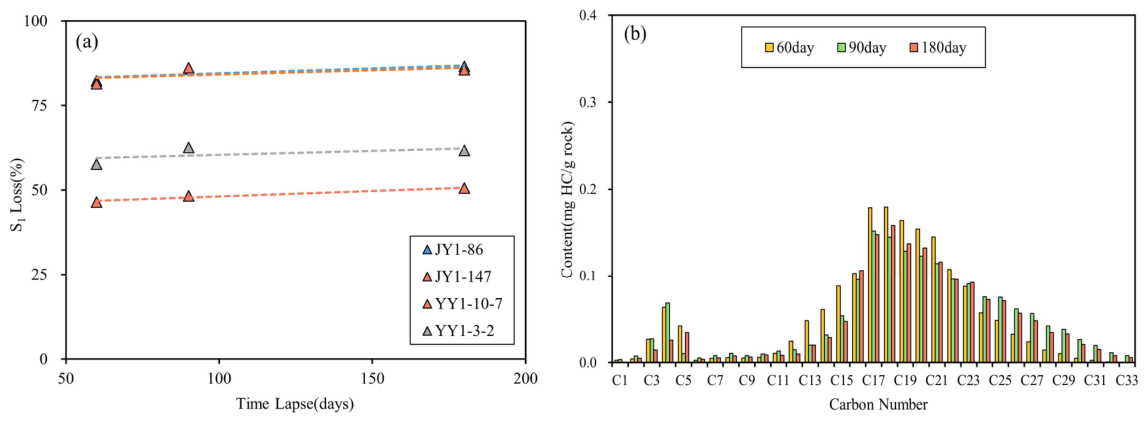
For sandstone, the key transition occurs at 60 days (Figure 4). Loss is extremely rapid within the first 60 days, whereas during 60–180 days S1 loss stabilizes, with loss rates of 3–5% (Figure 8a). TD–GC comparisons at 60, 90, and 180 days (Figure 8b) indicate that the n-alkane distribution changes only slightly during this period. Therefore, 60 days is defined as the practical equilibrium time for sandstone. Comparing S1 at this equilibrium point with the initial value provides a basis for restoring free hydrocarbons in sandstone interbeds within the shale interval.
Figure 8.
Changes of S1 and n-alkane in sandstone from 60 to 180 days: (a) S1 content variation from wells JY1 and YY1, and (b) changes of n-alkane from well YY1.
5.2. Factors Controlling Light-Hydrocarbon Loss in Shale
Hydrocarbon loss is continuous and complex, and the capacity of different cores to retain light hydrocarbons varies. Organic abundance, thermal maturity, porosity, and permeability can all influence loss. Because loss behavior in sandstone is relatively straightforward, this section focuses on shale.
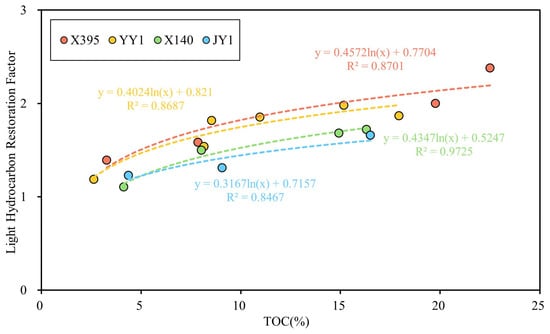
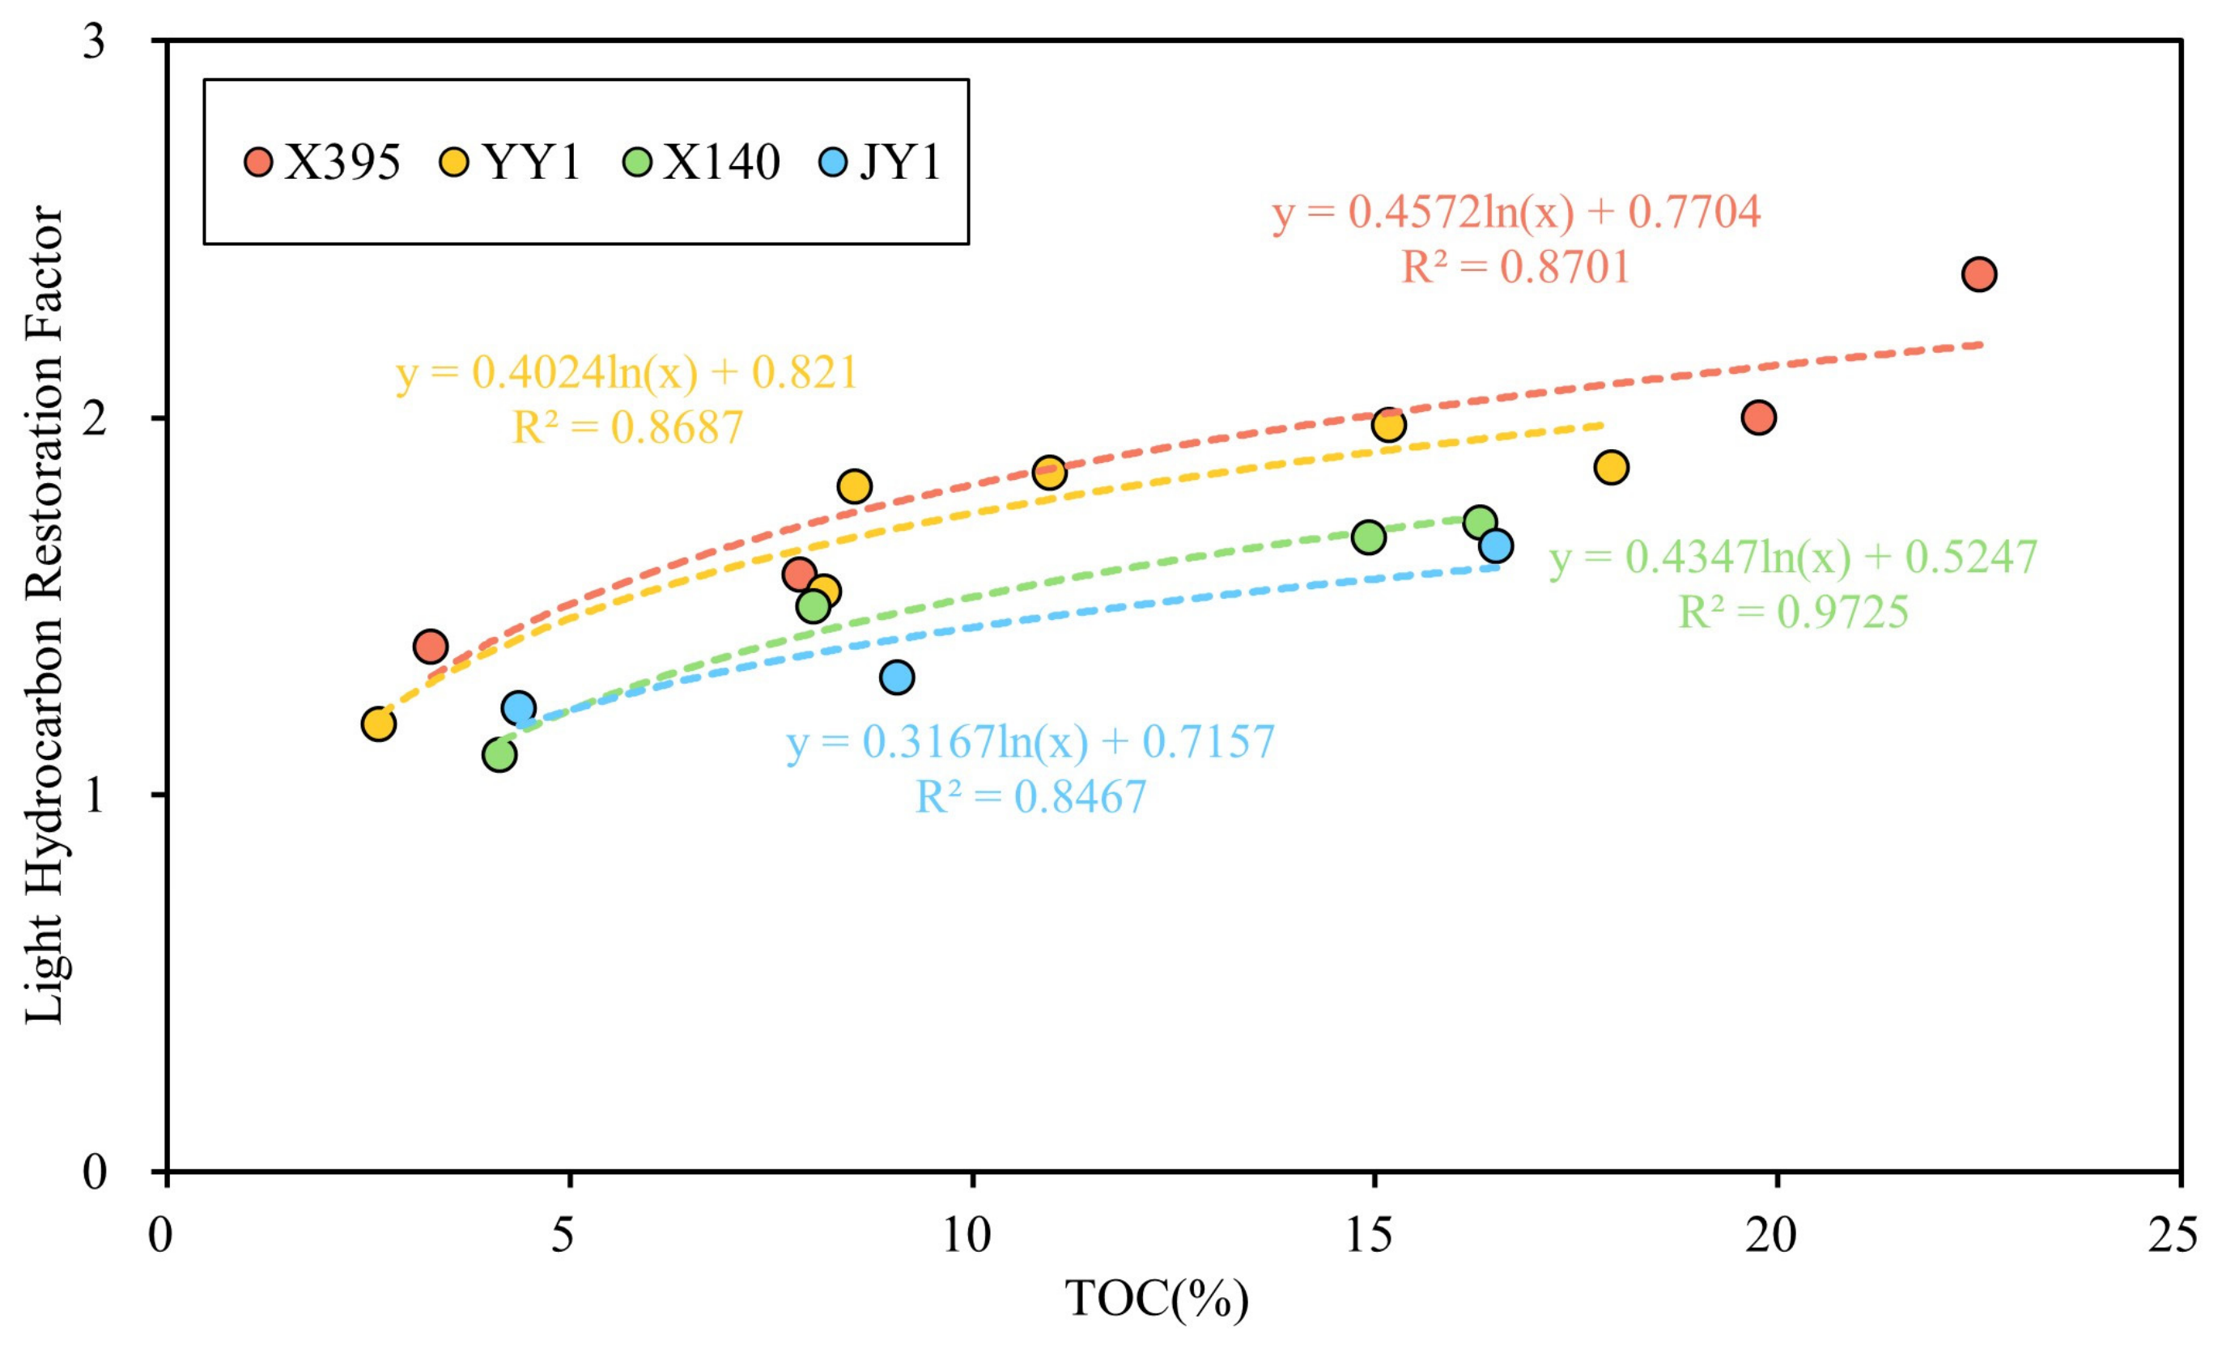
TOC is fundamental to the original hydrocarbon content and is therefore a primary factor affecting the absolute amount of light-hydrocarbon loss. Some studies suggest a negative correlation between S1 loss and TOC because high-TOC shales can adsorb hydrocarbons more strongly, reducing loss [37]. In contrast, our data shows a positive relationship between TOC and the restoration factor when evaluated at the shale equilibrium time of 90 days. We define the original free-hydrocarbon content of the fresh sample as S1* and the S1 measured after 90 days as the final S1 (representing conventional core measurements), and define the restoration factor as K = S1*/S1. For shale samples within the same well, K correlates positively with TOC (Figure 9). Mudstones with TOC < 6% typically have S1* values 1.1–1.4 times the long-stored values, whereas shales with TOC > 6% commonly require corrections >1.5, and at very high TOC, S1* can exceed 2 times the measured values. Higher TOC implies higher original hydrocarbon generation and retention (higher S1*). Over long storage, a large initial inventory can decline toward a lower stable level, yielding a larger absolute loss and thus a larger restoration factor. Consistent with this, high-TOC samples still retain relatively high S1 after 90 days (often >4 mg HC/g rock), much higher than low-TOC mudstones (Figure 3).
Figure 9.
Relationship between the light hydrocarbon restoration factor and TOC in shale.
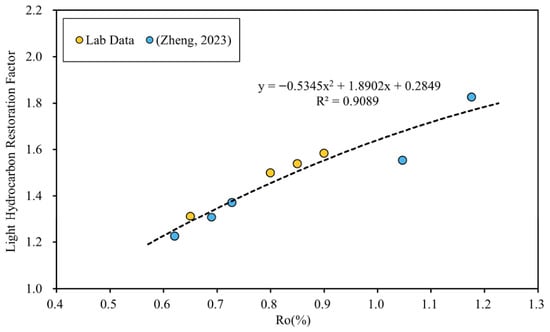
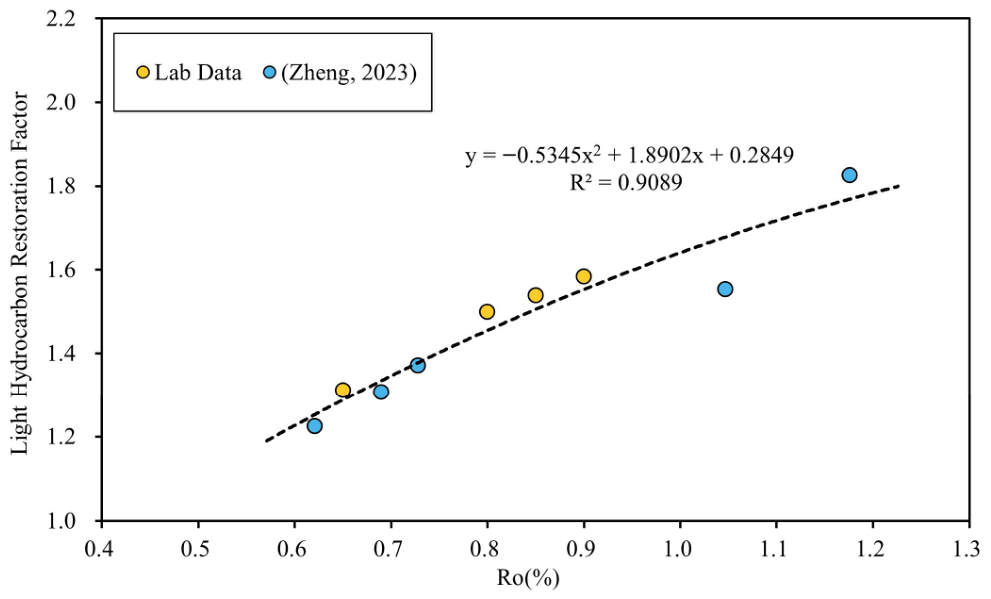
Thermal maturity (Ro) controls hydrocarbon generation and composition. As maturity increases, light-hydrocarbon generation increases, and the larger light fraction is more susceptible to loss; maturity is therefore another key control on loss magnitude. Previous work has established that higher maturity leads to larger losses and larger correction factors [15,17,22]. Our four wells span Ro values of 0.65%, 0.80%, 0.85%, and 0.90%. To minimize TOC effects, we selected four samples with similar TOC (8–9%) across these maturity levels and supplemented the dataset with published results to better cover the maturity range [38]. The restoration factor K increases with Ro (Figure 10). At low maturity (Ro < 0.7%), S1* is typically ~1.2–1.3 times the long-stored S1, indicating relatively limited loss. Within the main oil window (0.7% < Ro < 0.9%), S1* is ~1.4–1.6 times the measured value—this is the dominant maturity range of Chang 73 shale. At higher maturity (Ro > 0.9%), losses are greater and S1* can reach ~1.6–2 times the measured value. Therefore, S1 measured on conventionally cored and stored samples must be corrected, particularly at higher maturity, to accurately estimate original free hydrocarbons and resources.
Figure 10.
Relationship between the light hydrocarbon restoration factor and Ro in shale [38].
Porosity and permeability also influence shale light-hydrocarbon loss. In general, better pore-throat connectivity may facilitate diffusion and escape through pores and fractures when pressure and temperature conditions change. Although porosity and permeability were not measured in the present study, the contrast between sandstone and shale is consistent with this interpretation. Therefore, the role of pore-throat connectivity is inferred from lithologic contrast rather than directly demonstrated by petrophysical measurements in the present dataset.
5.3. Development of a Quantitative Restoration Model
Based on time-series S1 and TD–GC results, we established the loss process, identified practical equilibrium times, and quantified the roles of TOC and Ro. We then developed a restoration model for Chang 73 shale to correct S1 measured from conventionally cored wells.
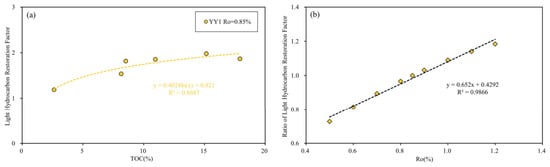
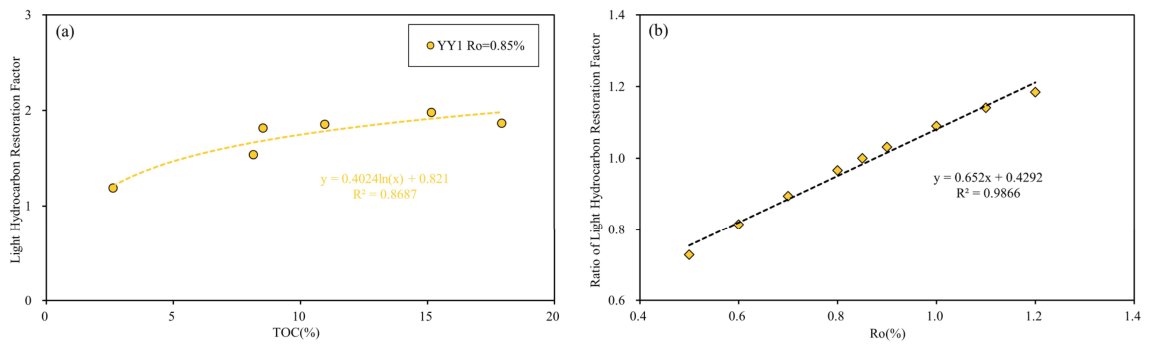
Existing restoration approaches for Chinese lacustrine shales typically consider only maturity and do not quantify TOC effects. Using our experimental data, we propose a two-parameter model integrating TOC and Ro. We define S1* as the initial free-hydrocarbon content of fresh shale and S1 as the value after 90 days, and define K = S1*/S1. First, to quantify the TOC effect, we used samples from Well YY1 (Ro = 0.85%) to establish the relationship between TOC and K1 (Figure 11a):
K1 = S1*/S1 = 0.4024·ln (TOC) + 0.821
Figure 11.
A quantitative light hydrocarbon restoration model: (a) relationship between the restoration factor and TOC at Ro = 0.85%, and (b) relationship between the restoration factor ratio β and Ro.
Second, we established the relationship between Ro and the restoration factor K2 (Figure 10) as:
K2 = S1*/S1 = −0.5345·Ro2 + 1.8902·Ro + 0.2849
Using Equation (2), we calculated restoration factors at different maturity levels. Taking Ro of 0.85% as the reference, we computed the ratio β between the restoration factor at any Ro and the restoration factor at Ro = 0.85% (Figure 11b), which can be fitted as:
β = 0.652·Ro + 0.4292
Combining Equations (1)–(3), the final two-parameter restoration model for shale is:
K = S1*/S1 = (0.4024·ln (TOC) + 0.821)·(0.652·Ro + 0.4292)
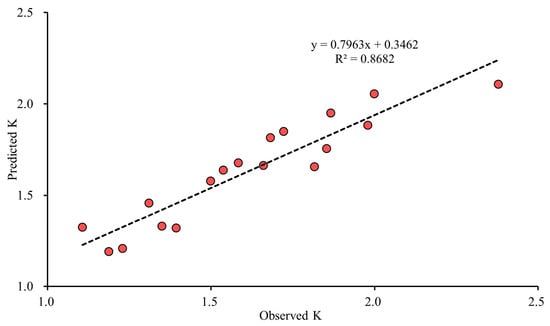
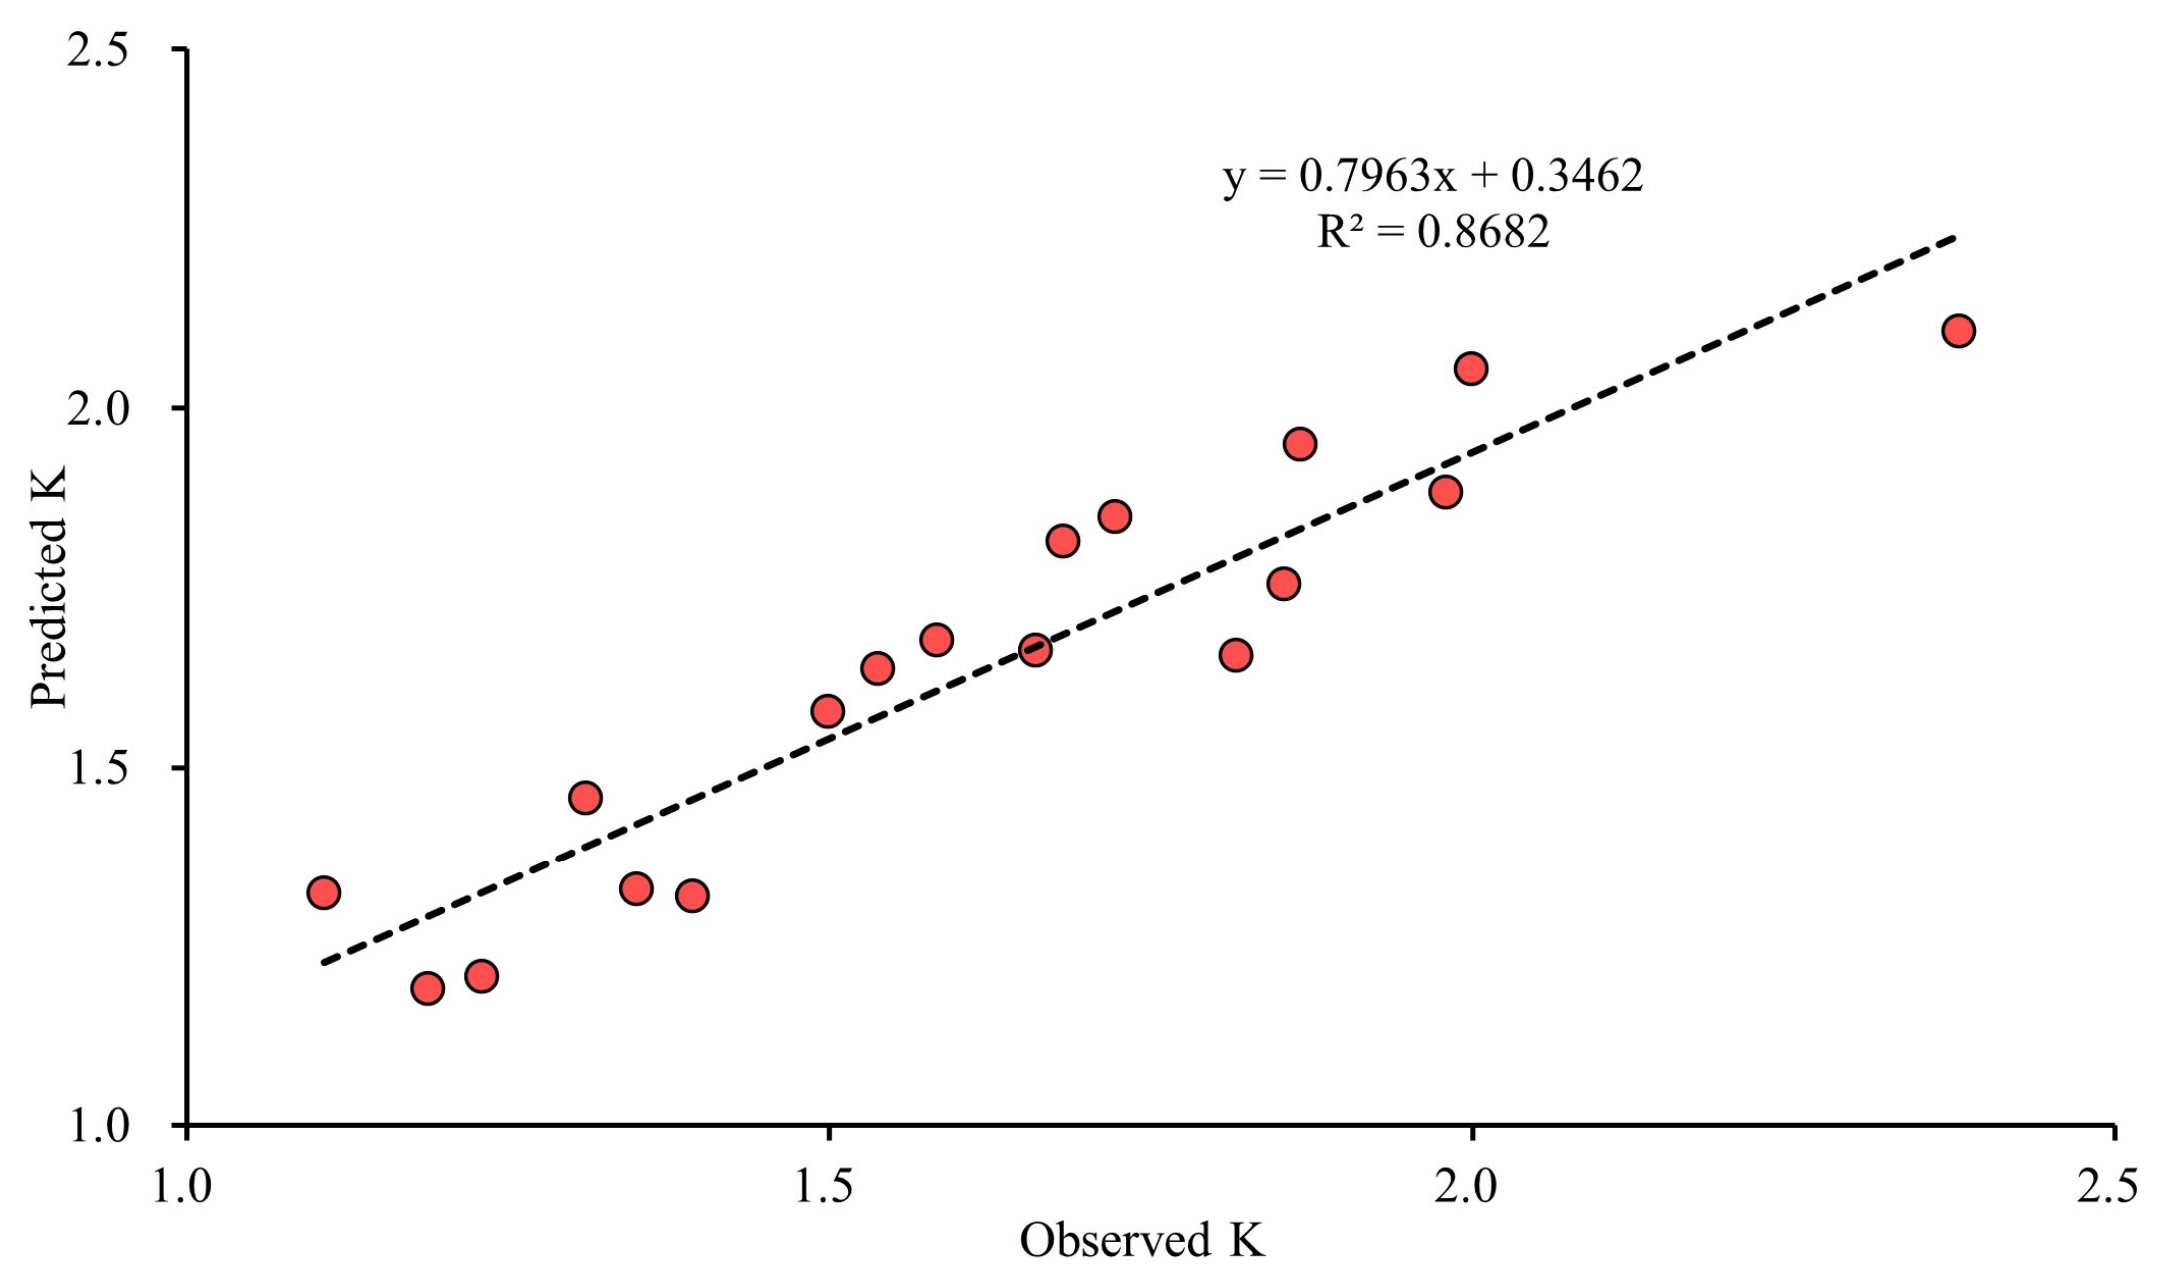
To examine the internal consistency of the shale restoration model, we applied Equation (4) back to the pressure-retained shale samples used for calibration and compared the predicted K values with the observed K values calculated from the ratio of initial S1 to S1 at the practical equilibrium time (90 days). As shown in Figure 12, the predicted and observed K values show a good positive correlation (R2 = 0.8682), indicating that the TOC–Ro model captures the first-order variation of the restoration factor within the present dataset. Because the model was calibrated from these samples, this comparison should be regarded as an internal self-consistency check rather than an independent external validation.
Figure 12.
Internal self-consistency check of the shale restoration model. Relationship between observed K (S1*/S1–90day) and predicted K calculated from Equation (4) for the pressure-retained shale samples.
For sandstone interbeds within Chang 73, loss may be related mainly to lithology-dependent pore-throat connectivity, whereas the effects of TOC and maturity appear less important than in shale. However, because the sandstone dataset is small (n = 7 in total) and porosity/permeability were not measured, we provide empirical restoration factors based on the ratio of initial S1* to S1 at the sandstone equilibrium time (60 days). The restoration factor is 5.51 for fine sandstone (Kf) and 2.11 for siltstone (Ks). Equations (5)–(6) should be regarded only as provisional empirical reference factors for the present dataset, rather than generally applicable restoration equations for Chang 73 sandstone interbeds.
Kf = S1*/S1 = 5.51,
Ks = S1*/S1 = 2.11,
Thus, with measurements of TOC and Ro, Equation (4) can be used to compute shale restoration factors for conventionally cored Chang 73 samples. Combined with Equations (5) and (6) for sandstone lithologies, S1 can be corrected to approximate the true in situ free-hydrocarbon content. But the uncertainty of the sandstone correction is higher than that of the shale restoration model in Equation (4), and its application should be interpreted with caution.
5.4. Model Application and Geological Implications
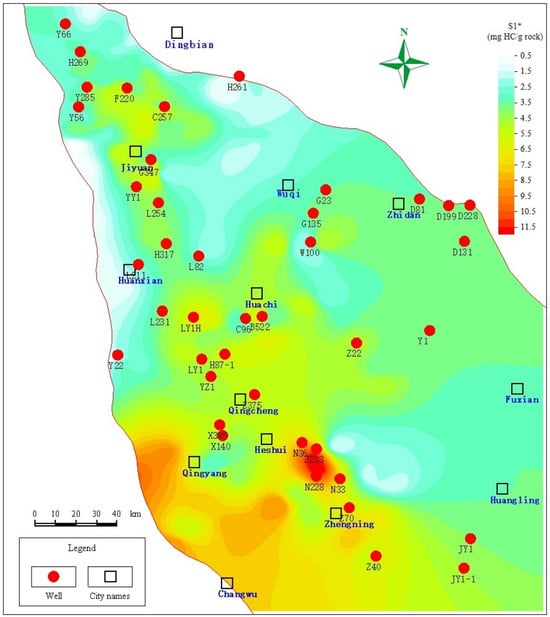
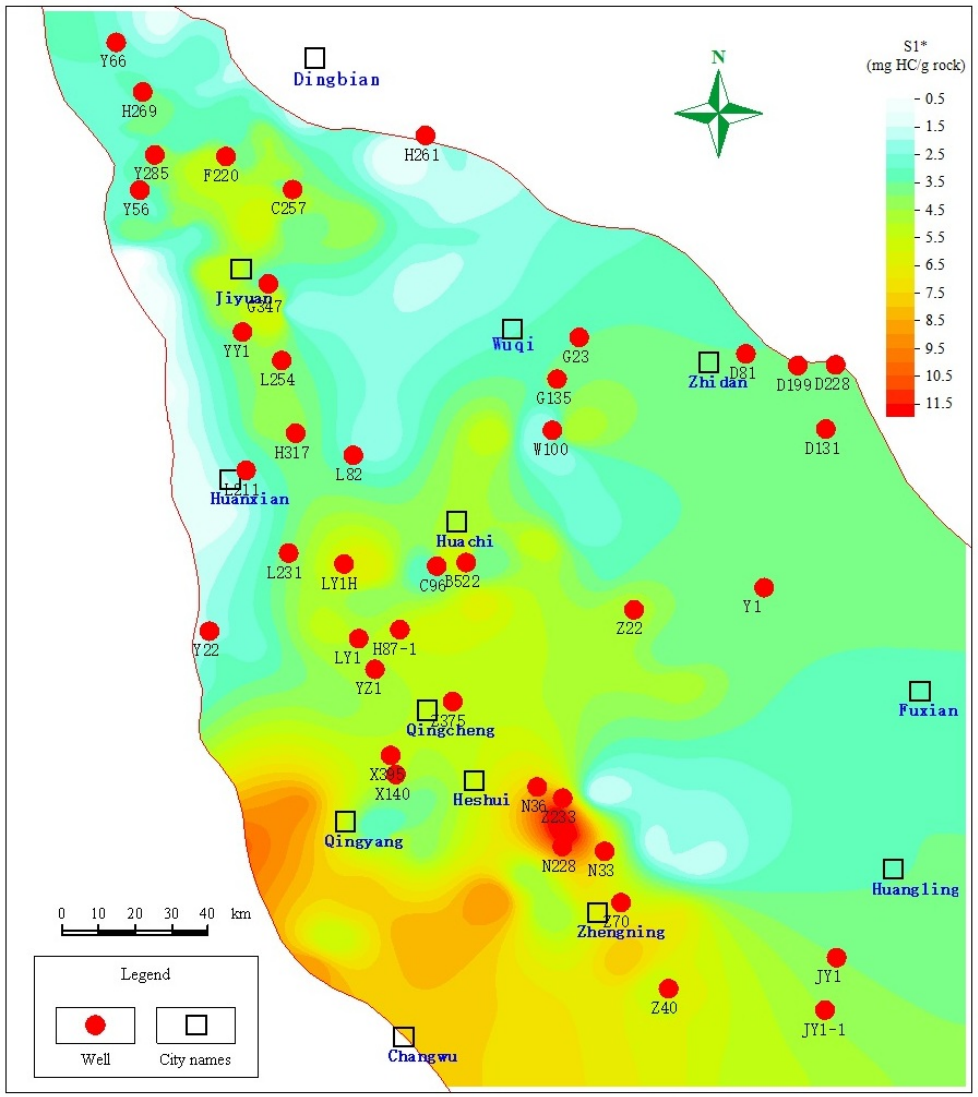
We applied the restoration model to correct S1 from conventionally cored wells across the Ordos Basin. Core samples from more than 50 wells were compiled with lithologic descriptions, TOC, and Rock-Eval data. Thermal maturity was estimated using the Jarvie conversion (Reqv = 0.018·Tmax − 7.16) [12], which converts Tmax to equivalent Ro, and the results were calibrated against existing maturity data. For each well, the shale restoration factor K was calculated from TOC and Ro using Equation (4), and sandstone restoration factors were selected according to lithology. Corrected original free-hydrocarbon contents (S1*) were then obtained for each sample, and the mean S1* for each well was mapped to produce a basin-scale distribution of original free hydrocarbons in Chang 73 (Figure 13). The highest values occur in the southwestern basin (Qingyang–Zhengning), where S1* commonly exceeds 6 mg HC/g rock and local maxima exceed 10 mg HC/g rock. Elevated values also occur in the Jiyuan area in the north and the Huachi area in the central basin (3.5–5.5 mg HC/g rock). The eastern basin is relatively depleted, mostly <3.5 mg HC/g rock. The corrected values better approximate in situ conditions and provide an improved basis for regional oiliness evaluation.
Figure 13.
Distribution of the original free hydrocarbon content in the Chang 73 submember, Ordos Basin.
Beyond providing a practical correction tool, the restoration model also has clear application significance for shale-oil evaluation in the Chang 73 submember. The use of pressure-retained coring and frozen-core handling provides a more reliable basis for estimating the original free-hydrocarbon content, and the time-series analyses help constrain storage-time loss behavior and practical equilibrium times for different lithologies. On this basis, the TOC–Ro model offers a quantitative way to correct S1 from conventionally cored wells and thus reduces reliance on expensive special coring in large-scale evaluation. The corrected S1* values, which better approximate in situ conditions, provide an improved basis for vertical identification of sweet intervals, areal delineation of enrichment zones, and exploration target selection. Although established for Chang 73 lacustrine shale in the Ordos Basin, the present workflow should be regarded primarily as a formation-specific calibration framework and may serve as a reference for similar studies in other lacustrine shale-oil systems.
5.5. Comparison with Previous Correction Methods
Previous studies have proposed different methods for correcting hydrocarbon loss from shale cores, but the conclusions are not entirely consistent because the methodological basis and correction target differ among studies. Chen et al. evaluated the evaporative loss of S1 in source rocks from the Lucaogou Formation of the Jimusaer Depression, Junggar Basin, using a mass-balance method [37]. Their results showed that the S1-loss first decreases and then increases with increasing maturity, and that the absolute S1-loss increases with increasing TOC, although the relative S1-loss/TOC remains similar at comparable maturity levels. By contrast, Shao et al. established a light-hydrocarbon recovery coefficient for Qingshankou Formation shale in the Songliao Basin based on the difference in S1 between fresh cryopreserved samples and the same samples after 50 days of exposure [39]. Their results showed that the light-hydrocarbon recovery coefficient increased markedly with increasing thermal maturity, with calculated K values ranging from 1.07 to 3.6. A similar maturity-related trend was also reported by Feng et al. [40]. Based on the comparison between pressure-retained cores and conventional cores from the Qing 1 member shale in the Gulong Sag, Songliao Basin, they established a light-hydrocarbon restoration model and suggested that the pyrolysis S1 restoration coefficient is positively correlated with maturity. In the high-maturity stage (Ro > 1.3%), the light-hydrocarbon compensation amount is 1.5–2.5 times the measured S1 of conventional cores, and the S1 restoration coefficient reaches 2.5–3.5.
Compared with the above studies, the main feature of the present study is that the restoration model is directly constrained by time-series measurements on pressure-retained frozen cores from the Chang 73 shale. This makes it possible to characterize the storage-time evolution of S1, define practical equilibrium times for different lithologies, and establish a TOC–Ro restoration model based on directly observed loss behavior. At the same time, the present model should be interpreted within its geological and experimental scope. The positive relationship between the restoration factor and Ro identified here is consistent with the maturity trend reported by Shao et al. and Feng et al., but differs from the non-monotonic maturity trend reported by Chen et al. This difference suggests that the effect of maturity on hydrocarbon loss may depend on the correction method, the geological setting, and the correction target considered in each study. Accordingly, the TOC–Ro model established in this study is best regarded as an empirical restoration model calibrated for Chang 73 lacustrine shale under the present sampling, storage, and analytical conditions, rather than as a universal correction equation for all shale-oil systems. A comparison of representative methods is summarized in Table 2.
Table 2.
Comparison of representative light-hydrocarbon correction/restoration methods.
6. Conclusions
Using time-series Rock-Eval pyrolysis and TD–GC analyses of pressure-retained frozen cores from four wells in the Chang 73 submember, we constrain the magnitude, time-dependent loss behavior, and controls of light-hydrocarbon evaporative loss and propose a practical restoration approach for conventionally cored samples.
- Light-hydrocarbon loss follows a two-stage pattern. Shale/mudstone undergoes rapid loss during 0–90 days and reaches a practical dynamic equilibrium after 90 days (S1 change < 5%). Sandstone interbeds lose light hydrocarbons more rapidly and reach practical equilibrium after 60 days.
- Loss is dominated by light components, especially gaseous hydrocarbons, whereas medium and heavy fractions decrease modestly. Loss is coupled with progressive desorption from kerogen and clay minerals, producing compositional “heaviness” of the residual free hydrocarbons and shifting the modal carbon number toward higher values.
- At shale equilibrium, TOC and Ro jointly control the restoration factor K. Higher TOC samples tend to require larger corrections because they contain larger initial inventories of volatile hydrocarbons, while increasing Ro enhances generation of light fractions and exacerbates loss. Within the dominant maturity window of Chang 73, S1* is typically 1.4–1.6 times the conventionally measured S1.
- A two-parameter restoration model is proposed for Chang 73 shale oil: K = (0.4024·ln (TOC) + 0.821)·(0.652·Ro + 0.4292), with empirical factors for siltstone and fine sandstone interbeds. Application to more than 50 wells identifies Qingyang–Zhengning area as the primary enrichment zone of original free hydrocarbons, followed by Jiyuan area and Huachi area, whereas the eastern basin is relatively depleted. The workflow improves S1 correction and provides a transferable basis for oil-bearing evaluation and sweet-spot prediction in lacustrine shale-oil systems.
Author Contributions
Methodology, Z.S., X.Z. and C.B.; Investigation, Z.S., C.B. and J.D.; Resources, X.Z., Y.Z., W.L. and F.H.; Validation, Z.S., X.Z., C.B. and Y.L.; Data Curation, Z.S. and C.B.; Writing—Original Draft, Z.S.; Writing—Review and Editing, Z.S., X.Z., C.B., W.L. and M.G.; Visualization, Z.S. and C.B.; Supervision, X.Z., Y.Z. and F.H.; Project Administration, X.Z., C.B. and W.L.; Funding Acquisition, X.Z. All authors have read and agreed to the published version of the manuscript.
Funding
This research was funded by the Joint Fund Project of the National Natural Science Foundation of China (Grant No. U22B6004); the Scientific Research and Technology Development Project of the PetroChina Research Institute of Petroleum Exploration and Development (Grant No. 2022yjcq03); and the Key Core Technology Research Project of the PetroChina Changqing Oilfield Company (Grant No. KJZX2023-01).
Data Availability Statement
The original contributions presented in this study are included in the article. Further inquiries can be directed to the corresponding authors.
Acknowledgments
The authors would like to sincerely thank the laboratory staff of Suzhou Guande Energy Technology Company Limited for their valuable assistance in experimental analysis. We also extend our special gratitude to Wenzhi Zhao for his guidance and help during the summarization of the findings.
Conflicts of Interest
Xinping Zhou and Yan Zhang were employed by the Research Institute of Exploration and Development, PetroChina Changqing Oilfield Company. Fang Hou was employed by the Exploration Department, PetroChina Changqing Oilfield Company. The remaining authors declare that the research was conducted in the absence of any commercial or financial relationships that could be construed as potential conflicts of interest.
References
- Bai, G.P.; Qiu, H.H.; Deng, Z.Z.; Wang, W.Y.; Chen, J. Distribution and main controls for shale oil resources in USA. Pet. Geol. Exp. 2020, 42, 524–532. [Google Scholar] [CrossRef]
- Jin, Z.J.; Wang, G.P.; Liu, G.X.; Gao, B.; Liu, Q.Y.; Wang, H.L.; Liang, X.P.; Wang, R.Y. Research progress and key scientific issues of continental shale oil in China. Acta Pet. Sin. 2021, 42, 821–835. [Google Scholar] [CrossRef]
- Jin, Z.J.; Zhu, R.K.; Liang, X.P.; Shen, Y.Q. Several issues worthy of attention in current lacustrine shale oil exploration and development. Pet. Explor. Dev. 2021, 48, 1276–1287. [Google Scholar] [CrossRef] [Scilit]
- Song, G.Q.; Zhang, L.Y.; Lu, S.F.; Xu, X.Y.; Zhu, R.F.; Wang, M.; Li, Z. Resource evaluation method for shale oil and its application. Earth Sci. Front. 2013, 20, 221–228. [Google Scholar]
- Zhao, W.Z.; Bian, C.S.; Pu, X.G.; Liu, S.J.; Guan, M.; Liu, W.; Li, Y.X.; Dong, J. Enrichment and flow characteristics of shale oil in typical salinized lake basins in China and its significance for “sweet spot” evaluation. J. China Univ. Pet. Ed. Nat. Sci. 2023, 47, 25–37. [Google Scholar] [CrossRef]
- Zhao, W.Z.; Bian, C.S.; Li, Y.X.; Zhang, J.Y.; He, K.; Liu, W.; Zhang, B.; Lei, Z.D.; Liu, C.; Zhang, J.Y.; et al. Enrichment factors of movable hydrocarbons in lacustrine shale oil and exploration potential of shale oil in Gulong Sag, Songliao Basin, NE China. Pet. Explor. Dev. 2023, 50, 455–467. [Google Scholar] [CrossRef] [Scilit]
- Zhao, W.Z.; Bian, C.S.; Li, Y.X.; Liu, W.; Qin, B.; Pu, X.G.; Jiang, J.L.; Liu, S.J.; Guan, M.; Dong, J.; et al. “Component flow” conditions and its effects on enhancing production of continental medium-to-high maturity shale oil. Pet. Explor. Dev. 2024, 51, 720–730. [Google Scholar] [CrossRef] [Scilit]
- Hunt, J.M.; Huc, A.Y.; Whelan, J.K. Generation of light hydrocarbons in sedimentary rocks. Nature 1980, 288, 688–690. [Google Scholar] [CrossRef] [Scilit]
- Cooles, G.P.; Mackenzie, A.S.; Quigley, T.M. Calculation of petroleum masses generated and expelled from source rocks. Org. Geochem. 1986, 10, 235–245. [Google Scholar] [CrossRef] [Scilit]
- Engel, M.H.; Imbus, S.W.; Zumberge, J.E. Organic geochemical correlation of Oklahoma crude oils using R- and Q-mode factor analysis. Org. Geochem. 1988, 12, 157–170. [Google Scholar] [CrossRef] [Scilit]
- Guan, M.; Liu, X.P.; Jin, Z.J.; Lai, J.; Liu, J.; Sun, B.; Liu, T.; Hua, Z.X.; Xu, W.; Shu, H.L.; et al. Quantitative characterization of various oil contents and spatial distribution in lacustrine shales: Insight from petroleum compositional characteristics derived from programed pyrolysis. Mar. Pet. Geol. 2022, 138, 105522. [Google Scholar] [CrossRef] [Scilit]
- Jarvie, D.M.; Hill, R.J.; Ruble, T.E.; Pollastro, R.M. Unconventional shale-gas systems: The Mississippian Barnett Shale of north-central Texas as one model for thermogenic shale-gas assessment. AAPG Bull. 2007, 91, 475–499. [Google Scholar] [CrossRef] [Scilit]
- Obermajer, M.; Osadetz, K.G.; Fowler, M.G.; Snowdon, L.R. Light hydrocarbon (gasoline range) parameter refinement of biomarker-based oil-oil correlation studies: An example from Williston Basin. Org. Geochem. 2000, 31, 959–976. [Google Scholar] [CrossRef] [Scilit]
- Chen, Z.H.; Jiang, C.Q.; Lavoie, D.; Reyes, J. Model-assisted Rock-Eval data interpretation for source rock evaluation: Examples from producing and potential shale gas resource plays. Int. J. Coal Geol. 2016, 165, 290–302. [Google Scholar] [CrossRef] [Scilit]
- Xue, H.T.; Tian, S.S.; Wang, W.M.; Zhang, W.H.; Du, T.T.; Mu, G.D. Correction of oil content—One key parameter in shale oil resource assessment. Oil Gas Geol. 2016, 37, 15–22. [Google Scholar] [CrossRef]
- Li, J.B.; Lu, S.F.; Chen, G.H.; Shan, J.F.; Hu, Y.J.; Mao, J.L.; Xue, H.T.; Wang, M. Correction of light and heavy hydrocarbon loss for residual hydrocarbon S1 and its significance to assessing resource potential of E2s4(2) member in Damintun Sag, Bohai Bay Basin. Oil Gas Geol. 2016, 32, 538–545. [Google Scholar] [CrossRef]
- Guo, Q.L.; Wang, J.; Chen, X.M.; Chen, N.S.; Wu, X.Z.; Liu, Z.X.X. Discussion on evaluation method of total oil and movable oil in-place. Oil Gas Geol. 2021, 42, 1451–1463. [Google Scholar] [CrossRef]
- Zhu, R.F.; Zhang, L.Y.; Li, J.Y.; Liu, Q.; Li, Z.; Wang, R.; Zhang, L. Quantitative evaluation of residual liquid hydrocarbons in shale. Acta Pet. Sin. 2015, 36, 13–18. [Google Scholar] [CrossRef]
- Jarvie, D.M. Shale resource systems for oil and gas: Part 2—Shale-oil resource systems. In Shale Reservoirs—Giant Resources for the 21st Century; Breyer, J.A., Ed.; AAPG Memoir; AAPG: Tulsa, OK, USA, 2012; Volume 97, pp. 89–119. [Google Scholar] [CrossRef] [Scilit]
- Jiang, C.Q.; Chen, Z.H.; Mort, A.; Milovic, M.; Robinson, R.; Stewart, R.; Lavoie, D. Hydrocarbon evaporative loss from shale core samples as revealed by Rock-Eval and thermal desorption–gas chromatography analysis: Its geochemical and geological implications. Mar. Pet. Geol. 2016, 70, 294–303. [Google Scholar] [CrossRef] [Scilit]
- Dou, Y.; Han, W.Z.; Wang, W.D.; Dong, J.C.; Wang, N.; Li, H.D.; Meng, R. Assessment of movable resources of lacustrine shale oil based on mass oil content: A case study of the 2nd member of Kongdian formation in Cangdong Sag of the Bohai Bay Basin. J. Shenzhen Univ. Sci. Eng. 2024, 41, 33–41. [Google Scholar] [CrossRef] [Scilit]
- Qian, M.H.; Li, M.W.; Jiang, Q.G.; Li, Z.M.; Tao, G.L.; Bao, Y.J. Evaluation of evaporative loss of hydrocarbon in shale samples and its geological implications. Pet. Geol. Exp. 2022, 44, 497–504. [Google Scholar] [CrossRef]
- Wang, M.; Guo, Z.Q.; Jiao, C.X.; Lu, S.F.; Li, J.B.; Xue, H.T.; Li, J.J.; Li, J.Q.; Chen, G.H. Exploration progress and geochemical features of lacustrine shale oils in China. J. Pet. Sci. Eng. 2019, 178, 975–986. [Google Scholar] [CrossRef] [Scilit]
- Yang, M.H.; Liu, C.Y.; Zheng, M.L.; Lan, C.L.; Tang, X. Sequence framework of two different kinds of margins and their response to tectonic activity during the Middle–Late Triassic, Ordos Basin. Sci. China Ser. D Earth Sci. 2007, 50, 203–216. [Google Scholar] [CrossRef] [Scilit]
- Lin, M.R.; Xi, K.L.; Cao, Y.C.; Zhu, R.K.; Niu, X.B.; Xin, H.G.; Ma, W.J. Cyclicity related to solar activity in lacustrine organic-rich shales and their significance to shale-oil reservoir formation. Geosci. Front. 2023, 14, 101586. [Google Scholar] [CrossRef] [Scilit]
- Yang, H.; Dou, W.T.; Liu, X.Y.; Zhang, C.L. Analysis on Sedimentary Facies of Member 7 in Yanchang Formation of Triassic in Ordos Basin. Acta Sedimentol. Sin. 2010, 28, 254–263. [Google Scholar] [CrossRef]
- Lu, J.C.; Li, Y.H.; Wei, X.Y.; Wei, J.S. Research on the Depositional Environment and Resources Potential of the Oil Shale in the Chang 7 Member, Triassic Yanchang Formation in the Ordos Basin. J. Jilin Univ. Earth Sci. Ed. 2006, 39, 928–932. [Google Scholar] [CrossRef]
- Zou, C.N.; Pan, S.Q.; Horsfield, B.; Yang, Z.; Hao, S.Y.; Liu, E.T.; Zhang, L.F. Oil retention and intrasource migration in the organic-rich lacustrine Chang 7 shale of the Upper Triassic Yanchang Formation, Ordos Basin, Central China. AAPG Bull. 2019, 103, 2627–2663. [Google Scholar] [CrossRef] [Scilit]
- Zhang, G.W.; Dong, Y.P.; Yao, A.P. The Crustal Compositions, Structures and Tectonic Evolution of the Qinling Orogenic Belt. Geol. Shaanxi 1997, 15, 1–14. [Google Scholar]
- Li, S.X.; Deng, X.Q.; Pang, J.L.; Lv, J.W.; Liu, X. Relationship Between Petroleum Accumulation of Mesozoic and Tectonic Movement in Ordos Basin. Acta Sedimentol. Sin. 2010, 28, 798–807. [Google Scholar] [CrossRef]
- Fu, J.H.; Dong, G.D.; Zhou, X.P.; Hui, X.; Dan, W.D.; Fan, L.Y.; Wang, Y.G.; Zhang, H.T.; Gu, Y.H.; Zhou, G.X. Research progress of petroleum geology and exploration technology in Ordos Basin. China Pet. Explor. 2021, 26, 19–40. [Google Scholar] [CrossRef]
- Zhang, W.Z.; Yang, H.; Xie, L.Q.; Xie, G.W. Discovery of Micro- and Nannofossils in High Grade Hydrocarbon Source Rocks of the Triassic Yanchang Formation Chang 7 Member in Ordos Basin and Its Scientific Significance. Acta Palaeontol. Sin. 2011, 50, 109–117. [Google Scholar] [CrossRef]
- Zhao, Z.Y.; Guo, Y.R.; Wang, Y.; Lin, D.J. Study Progress in Tectonic Evolution and Paleogeography of Ordos Basin. Spec. Oil Gas Reserv. 2012, 19, 15–20. [Google Scholar] [CrossRef]
- Fu, J.H.; Li, S.X.; Niu, X.B.; Deng, X.Q.; Zhou, X.P. Geological characteristics and exploration of shale oil in Chang 7 Member of Triassic Yanchang Formation, Ordos Basin, NW China. Pet. Explor. Dev. 2020, 47, 870–883. [Google Scholar] [CrossRef] [Scilit]
- Yang, H.; Zhang, W.Z. Leading effect of the Seventh Member high-quality source rock of Yanchang Formation in Ordos Basin during the enrichment of low-penetrating oil-gas accumulation: Geology and geochemistry. Geochimica 2005, 34, 147–154. [Google Scholar] [CrossRef]
- Yang, H.; Niu, X.B.; Xu, L.M.; Feng, S.B.; You, Y.; Liang, X.W.; Wang, F.; Zhang, D.D. Exploration potential of shale oil in Chang7 Member, Upper Triassic Yanchang Formation, Ordos Basin, NW China. Pet. Explor. Dev. 2016, 43, 560–569. [Google Scholar] [CrossRef] [Scilit]
- Chen, J.Q.; Pang, X.Q.; Pang, H.; Chen, Z.H.; Jiang, C.Q. Hydrocarbon evaporative loss evaluation of lacustrine shale oil based on mass balance method: Permian Lucaogou Formation in Jimusaer Depression, Junggar Basin. Mar. Pet. Geol. 2018, 91, 422–431. [Google Scholar] [CrossRef] [Scilit]
- Zheng, R.H. Formation Conditions and Enrichment Models of Shale Oil in the Chang-7 Oil Layer of Ordos Basin. Doctoral Dissertation, China University of Petroleum, Beijing, China, 2023. [Google Scholar]
- Shao, X.D.; Song, Y.; Jiang, L.; Ma, X.Z.; Jiang, Z.X. Graded evaluation and controls on in situ oil content within lacustrine shale of the upper cretaceous qingshankou formation, songliao basin, China. Energy Fuels 2024, 38, 12925–12937. [Google Scholar] [CrossRef] [Scilit]
- Feng, Z.H.; Huo, Q.L.; Zeng, H.S.; Zhang, X.C.; Fan, Q.H.; Wang, Y.S. Geochemical characteristics of Gulong shale in Songliao Basin and evaluation methods for oil and gas resources. Pet. Geol. Oilfield Dev. Daqing 2025, 44, 1–10. [Google Scholar] [CrossRef]

Disclaimer/Publisher’s Note: The statements, opinions and data contained in all publications are solely those of the individual author(s) and contributor(s) and not of MDPI and/or the editor(s). MDPI and/or the editor(s) disclaim responsibility for any injury to people or property resulting from any ideas, methods, instructions or products referred to in the content. |
© 2026 by the authors. Licensee MDPI, Basel, Switzerland. This article is an open access article distributed under the terms and conditions of the Creative Commons Attribution (CC BY) license.