


Abstract
Natural gas reservoirs characterized by high heterogeneity and containing bottom-bound water often face the problem of water intrusion, making it difficult to recover the recoverable gas. This paper addresses the issue of enhanced gas recovery in water-flooded reservoirs and, through high-temperature, high-pressure long-core displacement experiments, investigates the displacement effects of different reservoir properties and injection media (dry gas, N2, CO2) under simulated water-flooding conditions. The experiment utilized two sets of sandstone cores—one with moderate permeability (304.8 mD) and one with high permeability (1004.6 mD). Three cores from each set were spliced together to form a 0.9 m long core, simulating the gas injection and displacement process following water infiltration. The results indicate that while water intrusion occurs more rapidly in high-permeability reservoirs, gas injection yields better recovery results than in medium-permeability reservoirs. Among the three injection media, dry gas demonstrated the best displacement efficiency, followed by N2, with CO2 performing the worst. CO2 tends to react with highly mineralized formation water under high-temperature and high-pressure conditions, forming precipitates and causing energy to be absorbed by the water, which reduces displacement efficiency. It is recommended that dry gas injection be used for enhanced recovery in the moderate-permeability reservoirs of the Y gas field, while N2 injection may be considered for the high-permeability reservoirs to balance effectiveness and cost. The research results provide experimental support for subsequent gas injection to enhance gas recovery in this gas field.
1. Introduction
As natural gas consumption in China continues to rise year by year, natural gas—as an efficient, clean, and low-carbon energy source—has gradually become an integral part of the future energy mix. However, most of the currently proven natural gas reservoirs exhibit geological characteristics such as high heterogeneity, the presence of bottom water, and complex gas–water interactions [1,2,3], often leading to issues such as water intrusion and difficulties in extracting recoverable gas. Once water intrudes into gas-bearing zones, it occupies the pores and flow pathways originally occupied by gas. This directly leads to a sharp decline in gas permeability. For gas to flow toward the wellbore, it must take a “detour,” resulting in a more tortuous path and greater resistance. Ultimately, large volumes of gas become “surrounded” or “isolated” by water, forming sealed gas pockets that can no longer flow toward the wellbore [4]. This situation traps mobile gas within matrix pores, low-permeability rock blocks, and flow channels, creating water-sealed gas that is difficult to recover, thereby reducing the production capacity of the gas well [5]. Due to water’s potentially superior mobility compared to gas in certain conditions, or because of reservoir heterogeneity, bottom-hole water may form “water surges” or “water cones,” rapidly penetrating to the bottom of the production well. As water intrusion intensifies, the insufficient gas flow velocity within the reservoir fails to carry the liquid away from the wellbore, ultimately leading to well flooding and the formation of water-locked gas in the near-wellbore zone [6]. Therefore, breaking the water lock and recovering more mobile gas are key challenges that must be addressed to improve natural gas reservoir recovery rates and economic efficiency. Gas injection for enhanced recovery is the primary method for resolving this issue.
Lü Jianjiang and Tang Hai et al. [7] conducted gas–water phase permeation experiments to simulate changes in water saturation during gas production. They identified the relationship between the water lock effect and water saturation and proposed a new method for studying the water lock effect in low-permeability gas reservoirs using phase permeation curves. In the 1990s, Van der Burgt et al. [8,9] proposed the CO2 Stable Long-term Storage Combined with Enhanced Natural Gas Recovery (CSEGR) technology, aimed at achieving stable CO2 storage in underground reservoirs while simultaneously increasing natural gas recovery rates. Turtata [10] conducted laboratory-scale physical modeling experiments on reservoir rock samples using pure CO2, N2, and mixed gas drives with varying ratios to enhance recovery. The results showed that when CO2 breakthrough occurred, the recovery rate of the rock samples reached 73–87%, and the mixed gas drive performed better than pure CO2 or N2 drives. Shi Yunqing and Jia Ying et al. [11], based on an analysis of the mixing characteristics of CO2 and natural gas, conducted long-core displacement experiments using CO2 to displace natural gas in tight reservoirs. The experimental results showed that CO2 increased natural gas recovery by 12%, and supercritical CO2 flooding can effectively improve recovery rates in tight gas reservoirs. Nitrogen displacement experiments on core samples from the Dina 2 gas reservoir [12] showed that when nitrogen breakthrough occurred, the methane recovery rate increased by 6.4 percentage points. As nitrogen injection continued, the recovery rate reached 74.4%, indicating that nitrogen injection following water flooding in sandstone reservoirs can significantly reduce residual gas saturation, thereby achieving the objective of increasing recovery rates in the flooded zone. To address issues such as low formation pressure and formation water intrusion encountered during the mid-to-late stages of development at the Shebei Gas Field in the Qaidam Basin, Chai Xiaoying, Cao Zhenglin, Guo Hui, and others [13] conducted a study on the technical feasibility of using nitrogen injection to enhance gas reservoir recovery. The results of the study indicate that the mechanisms by which nitrogen injection enhances recovery primarily involve three aspects: pressure and energy replenishment (increasing formation pressure to replenish reservoir energy), displacement, and diffusion. Gao Shusheng, Liu Huaxun and Ye Liyou et al. [14] designed a simulation experimental procedure for water-injection development in gas reservoirs. By simulating different types of gas reservoirs, they conducted experiments on water-injection displacement, water–gas exchange, and the evaluation of EOR effects under various water-injection methods, thereby demonstrating the key influencing factors and feasibility of water-injection EOR in gas reservoirs. The Duck Lake-1 gas field in the United States was developed in 1954 [15,16]. By 1970, reservoir pressure had continuously declined at a rate of 2 MPa/year to 6.3 MPa. After water injection began, the pressure decline slowed significantly; by 1979, it had gradually dropped to 4 MPa. Post-injection, the pressure decline slowed markedly, with a rate of only 0.23 MPa/year; however, gas production also decreased significantly, highlighting the importance of coordinated gas–water development in water-producing reservoirs [17,18]. Li Li-xia, Wang Jian-feng and Yuan Yun-fu et al. [19] summarized and analyzed the displacement mechanisms of commonly used injection media such as N2, CO2, and CH4. Their research concluded that when N2 is injected, it causes a rapid rise in reservoir pressure but also leads to rapid gas breakthrough due to excessive fluid mobility; when CO2 is injected, it enables the lower parts of the reservoir to be effectively utilized, significantly promoting condensate production; and injection of CH4 results in a wide sweep area and a moderate gas breakthrough time, effectively suppressing bottom water. Li Dengwei and Jiao Jian et al. [20] conducted experiments on N2 displacement of natural gas and water using a homogeneous pore model from a microscopic experimental perspective. The experimental results suggest that N2 injection can effectively improve the recovery efficiency of water-bearing gas reservoirs. Li Dengwei and Zhang Lihui et al. [21] conducted a sensitivity analysis of three-phase displacement involving N2, natural gas, and water based on actual reservoir parameters. The results indicate that injecting N2 at the end of the plateau production phase can effectively slow the advance of the water front; N2 injection can replenish formation energy, maintain high-pressure production, and extend the water-free production period of the gas reservoir; there is a significant difference in recovery rates between continuous gas injection and injection at the end of the plateau phase, so early gas injection is recommended. Regarding research on gas injection to improve natural gas recovery in water-flooded reservoirs, particularly physical experiments on the impact of different reservoirs and injection media on recovery efficiency, studies by domestic and international scholars remain insufficient. The Y gas reservoir currently has a gas recovery rate of 48.5%. It is generally water-flooded, with strong water energy, resulting in poor effectiveness and short duration of conventional production measures. Therefore, in this study, three low-permeability and three high-permeability rock cores were selected and spliced together to form a 0.9 m long sandstone core. After simulating water intrusion by injecting formation water until the gas recovery rate reached 49%, high-temperature, high-pressure displacement experiments were conducted using dry gas, N2, and CO2 on the long core. These results provide recommendations and references for the future development of the Y gas field.
2. Overview of the Y Gas Field
2.1. Location of the Y Gas Field
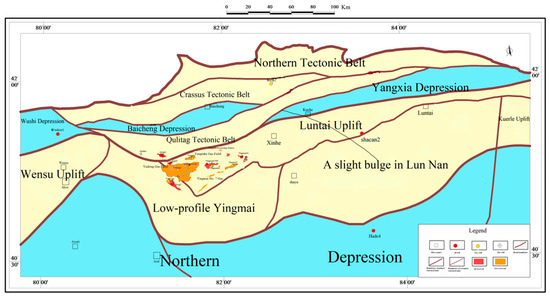
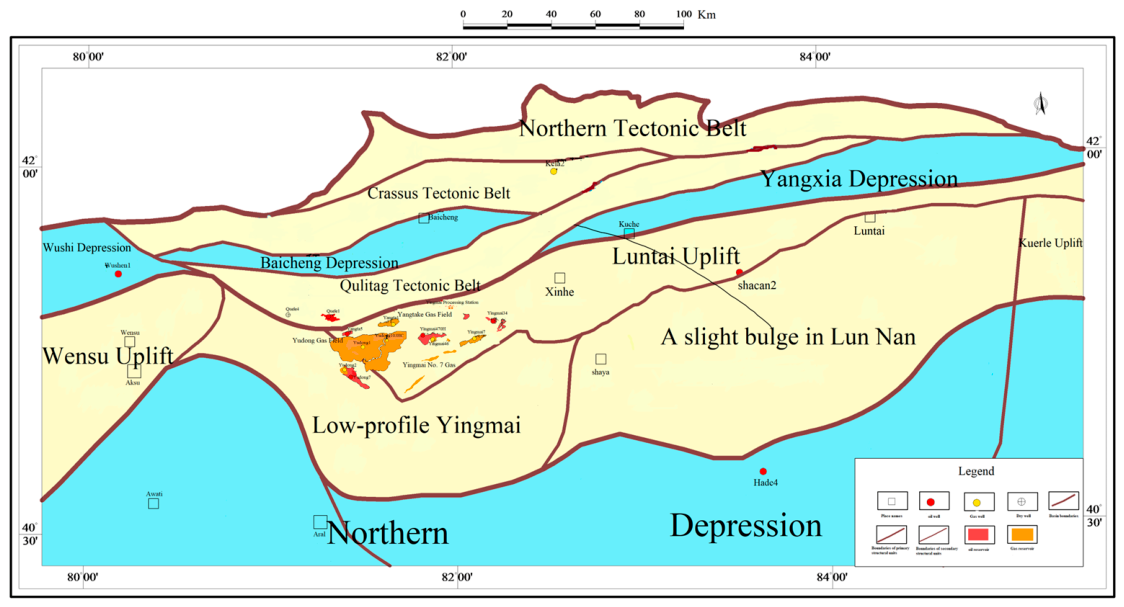
Location: China, western end of the Luntai Low Rise in the Tabei Uplift; eastern part of the Yingmai No. 7 Fault Zone. As shown in Figure 1.
Figure 1.
Map of the structural location of the Y gas field block.
2.2. Reservoir Characteristics of the Y Gas Field
In the current development of the Y Gas Field, drilling has encountered, from top to bottom, the Quaternary, Neogene, Paleogene, and Cretaceous formations, with the target zones being the basal sandstone of the Paleogene and the Bashkikich Formation of the Cretaceous.
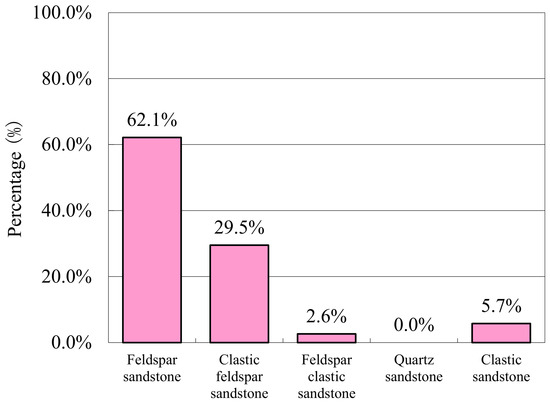
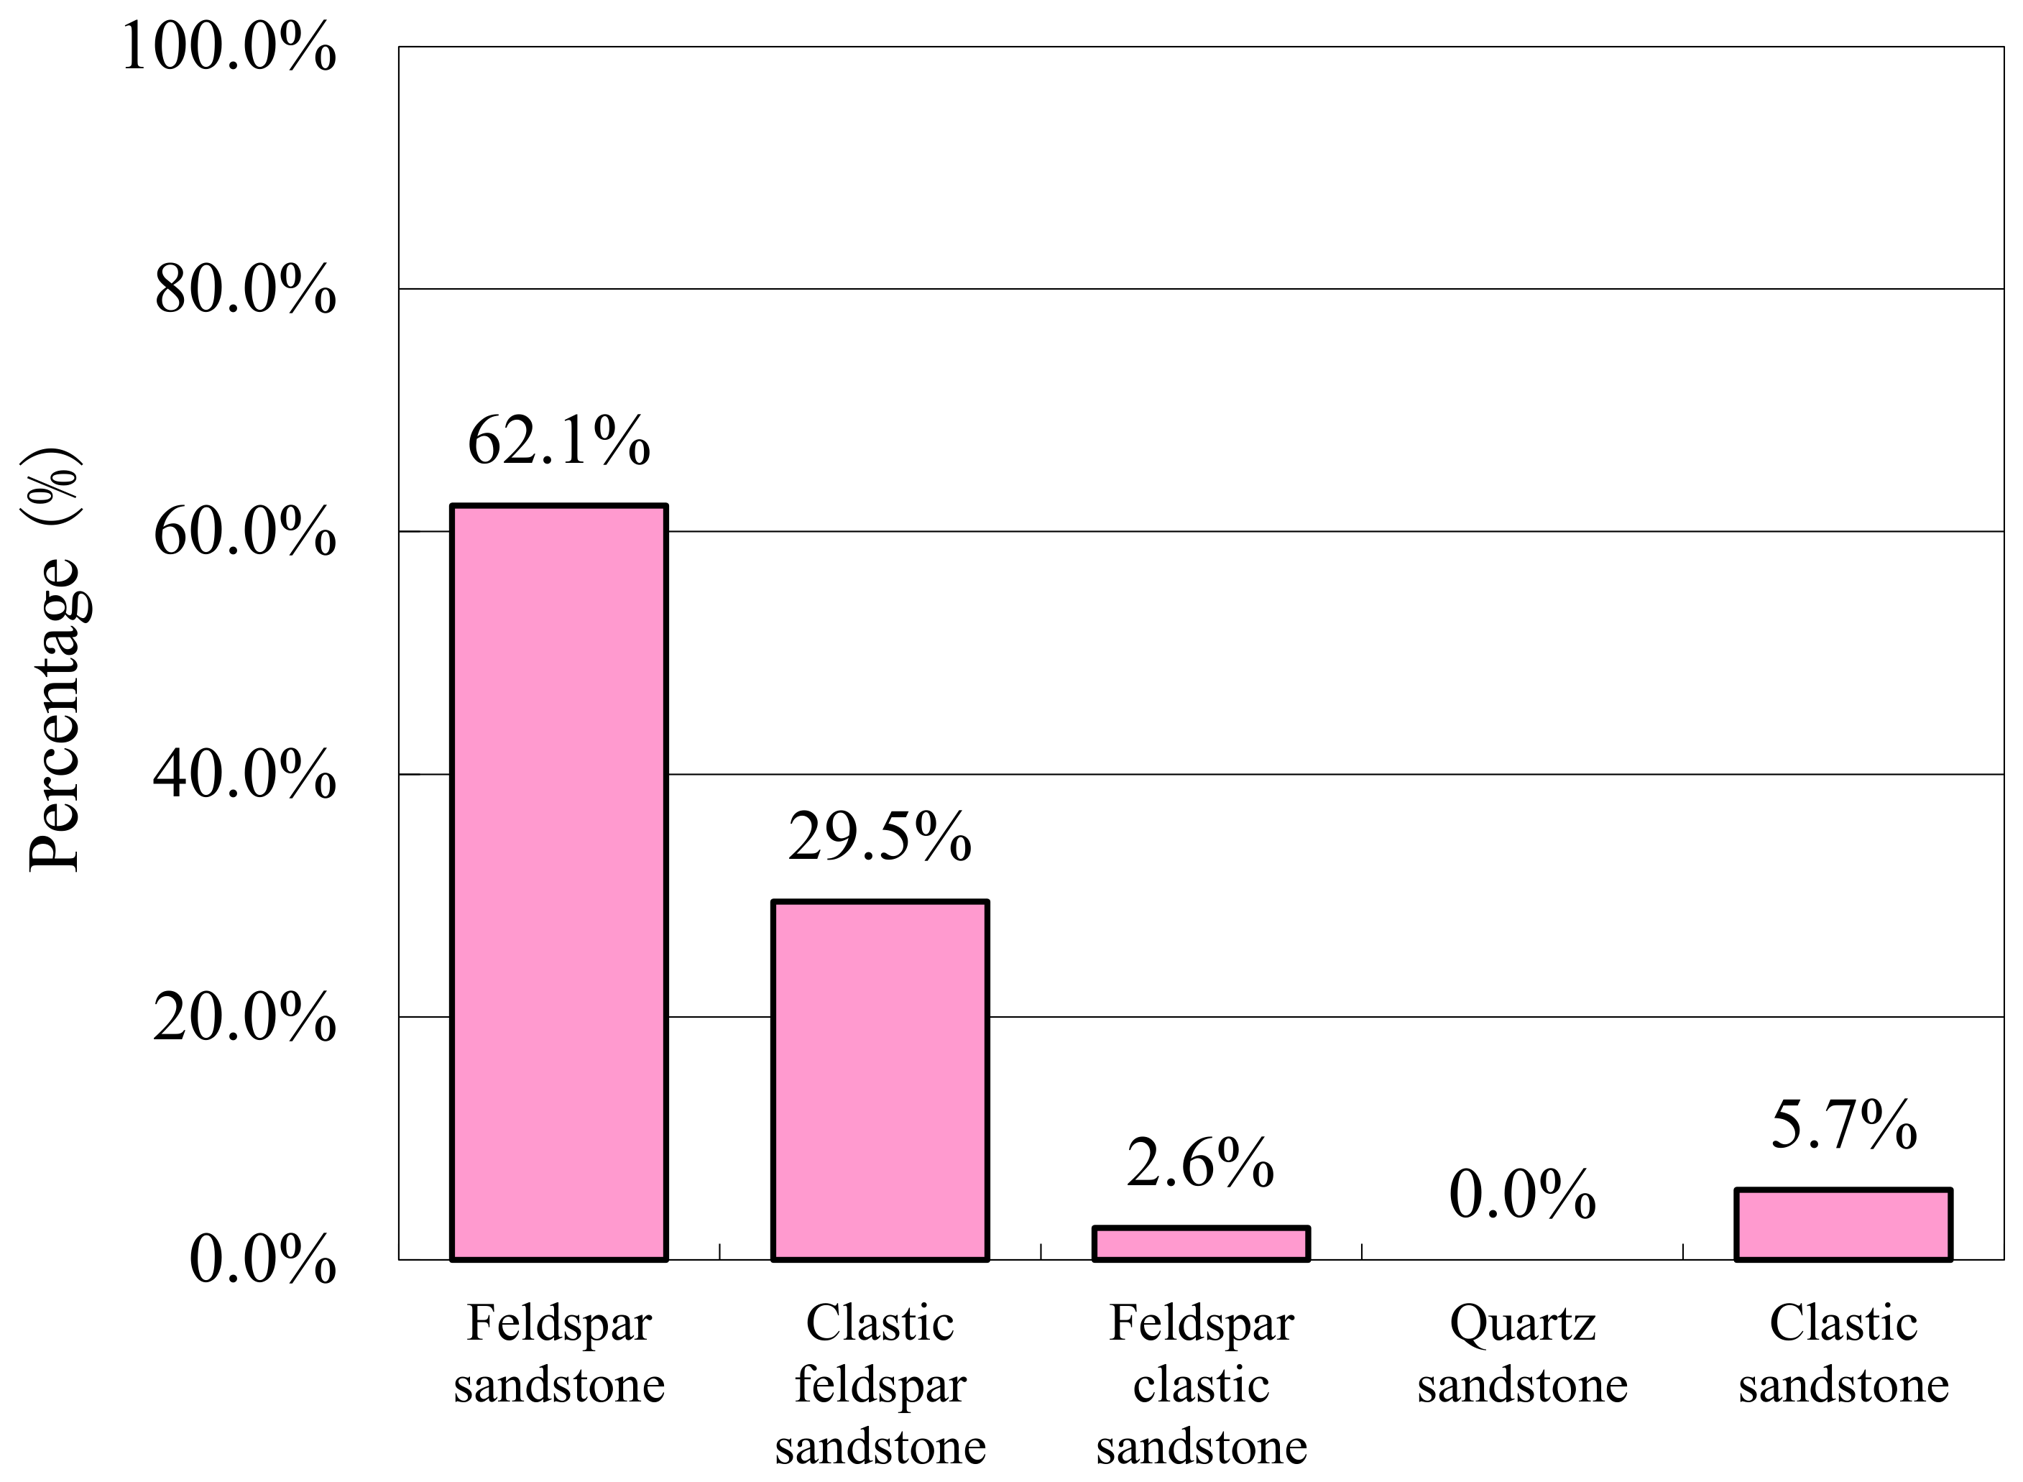
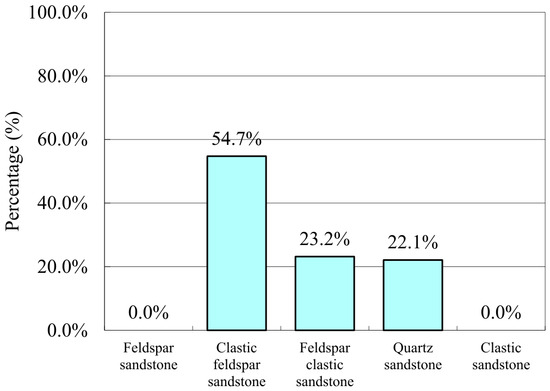
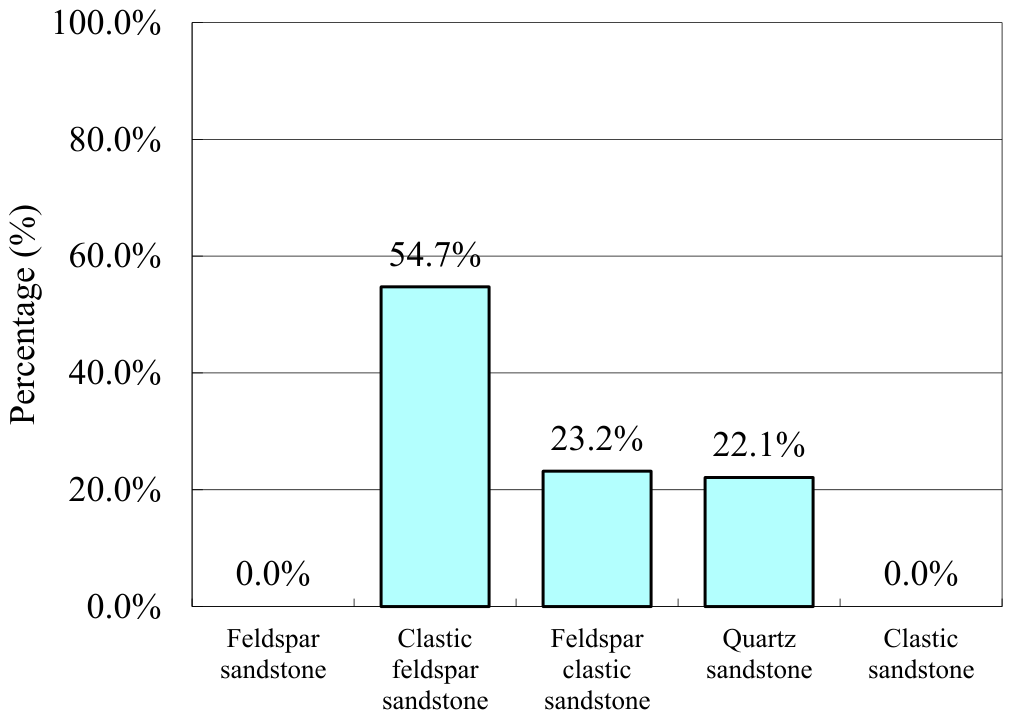
The lithology of the Cretaceous reservoirs is dominated by feldspar sandstone, with intergranular pores being the primary pore type. The average porosity of the reservoirs is 19.29%, and the permeability is 310.57 mD. Based on these properties, the reservoirs are classified as medium-porosity, medium-permeability reservoirs. The lithological classification of the Cretaceous Formation is shown in Figure 2, and the porosity characteristics of the Cretaceous Formation reservoirs are shown in Table 1.
Figure 2.
Histogram of Cretaceous lithology distribution.
Table 1.
Porosity characteristics of the Cretaceous sandstone formation reservoir.
The Paleogene and Neogene strata consist primarily of clastic feldspar sandstone. The reservoir’s pore type is predominantly intergranular, with an average porosity of 21.26% and an average permeability of 1497.91 mD, classifying it as a medium-porosity, high-permeability reservoir. The lithological classification of the Paleogene-Neogene series is shown in Figure 3, and the porosity characteristics of the Paleogene-Neogene reservoir are shown in Table 2.
Figure 3.
Histogram of lithological distribution in the Paleogene and Neogene.
Table 2.
Porosity characteristics of the Paleozoic and Cenozoic sandstone reservoir intervals.
3. Preparation and Procedures for Long-Core Experiments
3.1. Experimental Samples
Experimental gases: pure N2, CO2, and dry gas.
Experimental water: formation water blended according to the actual conditions of the Y reservoir, with a salinity of 200,866 mg/L.
Experimental cores: Three medium-permeability and three high-permeability cores were spliced together to form a set of long-core samples. The physical properties are shown in Table 3 below:
Table 3.
Core physical properties.
3.2. Experimental Equipment
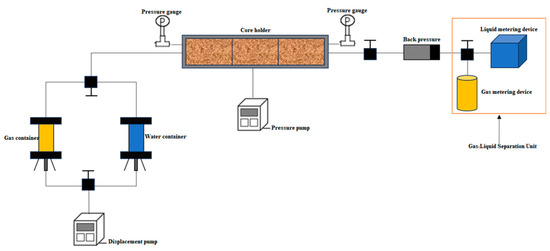
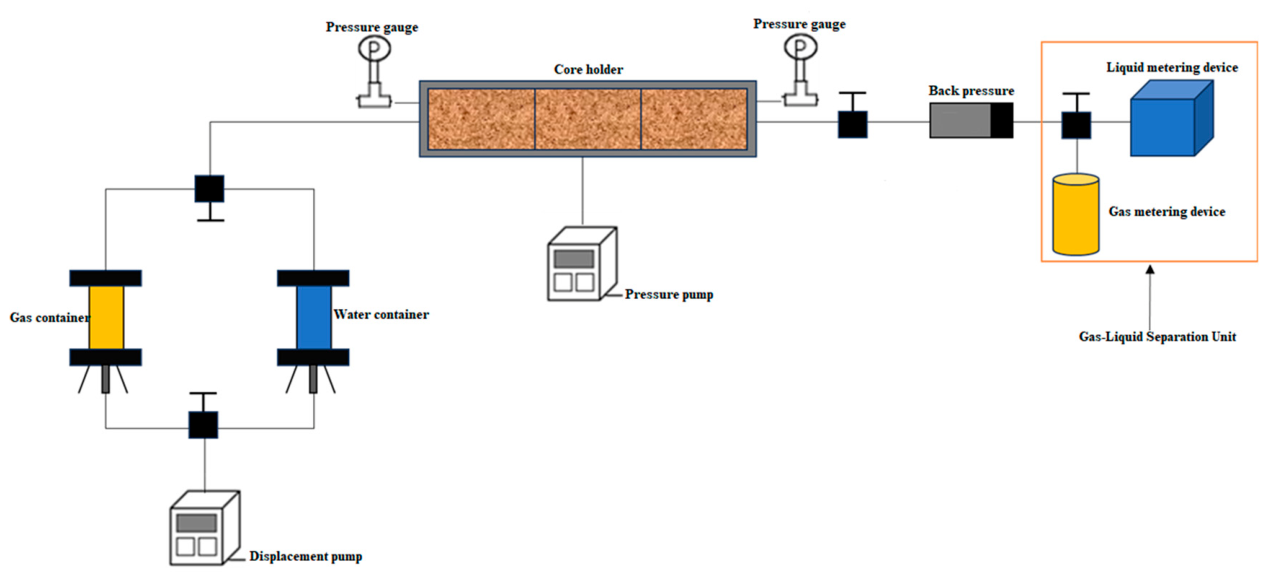
Injection system: constant-pressure, constant-flow pump; confining pressure pump; two intermediate vessels (for water and gas samples, respectively); long-core holder: consisting of an outer cylinder, rubber sleeve, and axial connector; production system: backpressure pump, gas–liquid metering device, gas chromatograph, etc. The experiments were conducted in a temperature-controlled chamber. The experiment controls system pressure using a packer pump and a displacement pump, regulates the production pressure differential using a backpressure pump, and collects and meters the fluid produced at the outlet using a gas–liquid separator. The experimental flowchart is shown in Figure 4.
Figure 4.
Experimental flowchart.
3.3. Experimental Procedure
The experiment was conducted at a temperature of 110 °C and a system pressure of 50 MPa.
(1) The experimental cores were cleaned, dried, evacuated, and weighed. They were then spliced into a long core and loaded into the core holder, and the apparatus was connected according to the flowchart.
(2) Set the confining pressure to 55 MPa, the displacement pressure to 50 MPa, and the back pressure to 49.98 MPa. Pump formation water into the formation at a displacement pressure differential of 0.02 MPa to saturate it until a stable flow is observed at the outlet for 30 min. Then, increase the back pressure to 50.5 MPa to complete saturation, stop pumping, and record the volume of formation water injected.
(3) Close the inlet cylinder control valve and open the gas cylinder control valve, maintaining a displacement pressure of 50 MPa, a backpressure of 49.98 MPa, and a pressure differential of 0.02 MPa to displace the confined water with dry gas, simulating the reservoir formation process. Once no liquid is produced at the gas–liquid separator at the outlet and gas production has been stable for 30 min, increase the back pressure to 50.5 MPa. After the system pressure stabilizes, close the gas cylinder valve to stop injection. Record the injection volume, liquid production, and gas production for this process, and calculate the saturation of the core’s bound water.
(4) Close the gas cylinder control valve and replace it with a water cylinder. Set the displacement pump pressure to 50 MPa and inject formation water at a pressure differential of 0.25 MPa to simulate the water flooding process. Record the injection volume during this process, measure the gas and liquid output at the outlet, and calculate the recovery rate.
(5) When the recovery rate reaches 49%, record the injection rate at this point and calculate the core’s water saturation. Continue displacement at a constant pressure differential of 0.25 MPa until no gas is produced at the outlet and the liquid flow rate stabilizes. Increase the backpressure and stop the experiment. Calculate the final recovery rate for formation water displacement.
(6) Repeat experimental steps (1) through (4). When the recovery rate reaches 49%, record the injection rate at that moment, calculate the water saturation of the core at that time, increase the back pressure, close the water cylinder control valve, open the gas cylinder (N2, CO2, dry gas) control valves, and continue displacement at a constant pressure difference of 0.25 MPa. Collect gas samples from the outlet. After injecting 1 PV of gas, increase the back pressure and stop the experiment.
(7) Analyze the collected gas samples using a gas chromatograph and calculate the final recovery rates for displacement by different gas media.
4. Analysis of Experimental Results
4.1. Analysis of Formation Water Displacement Results
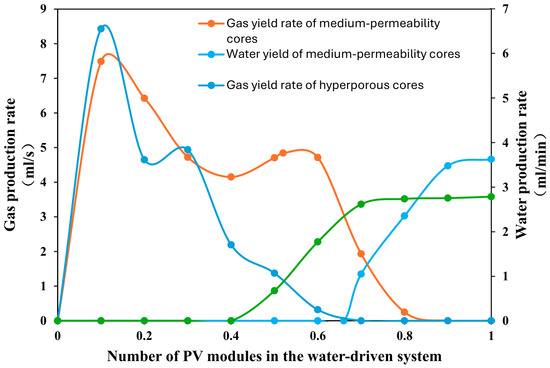
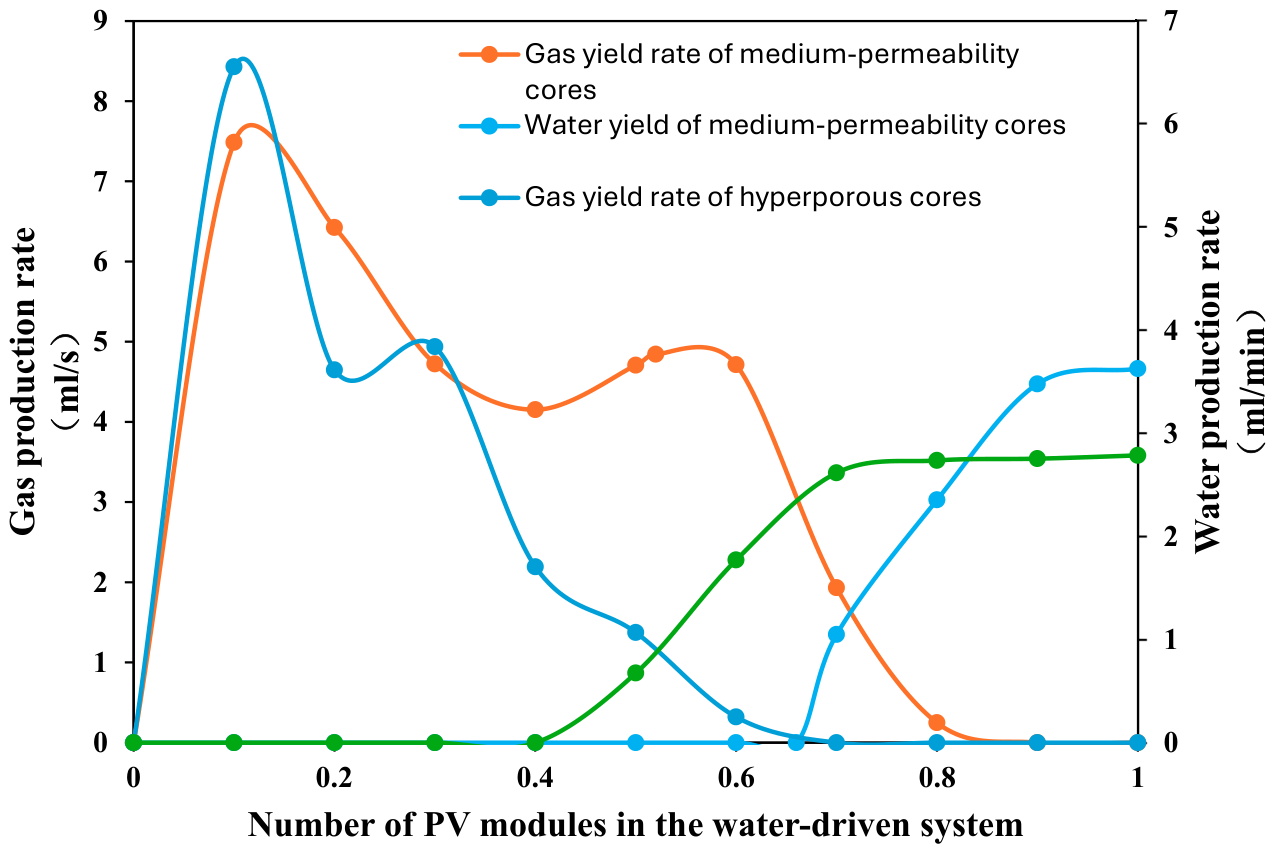
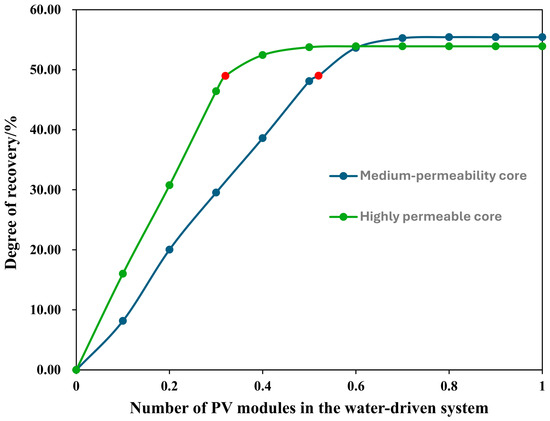
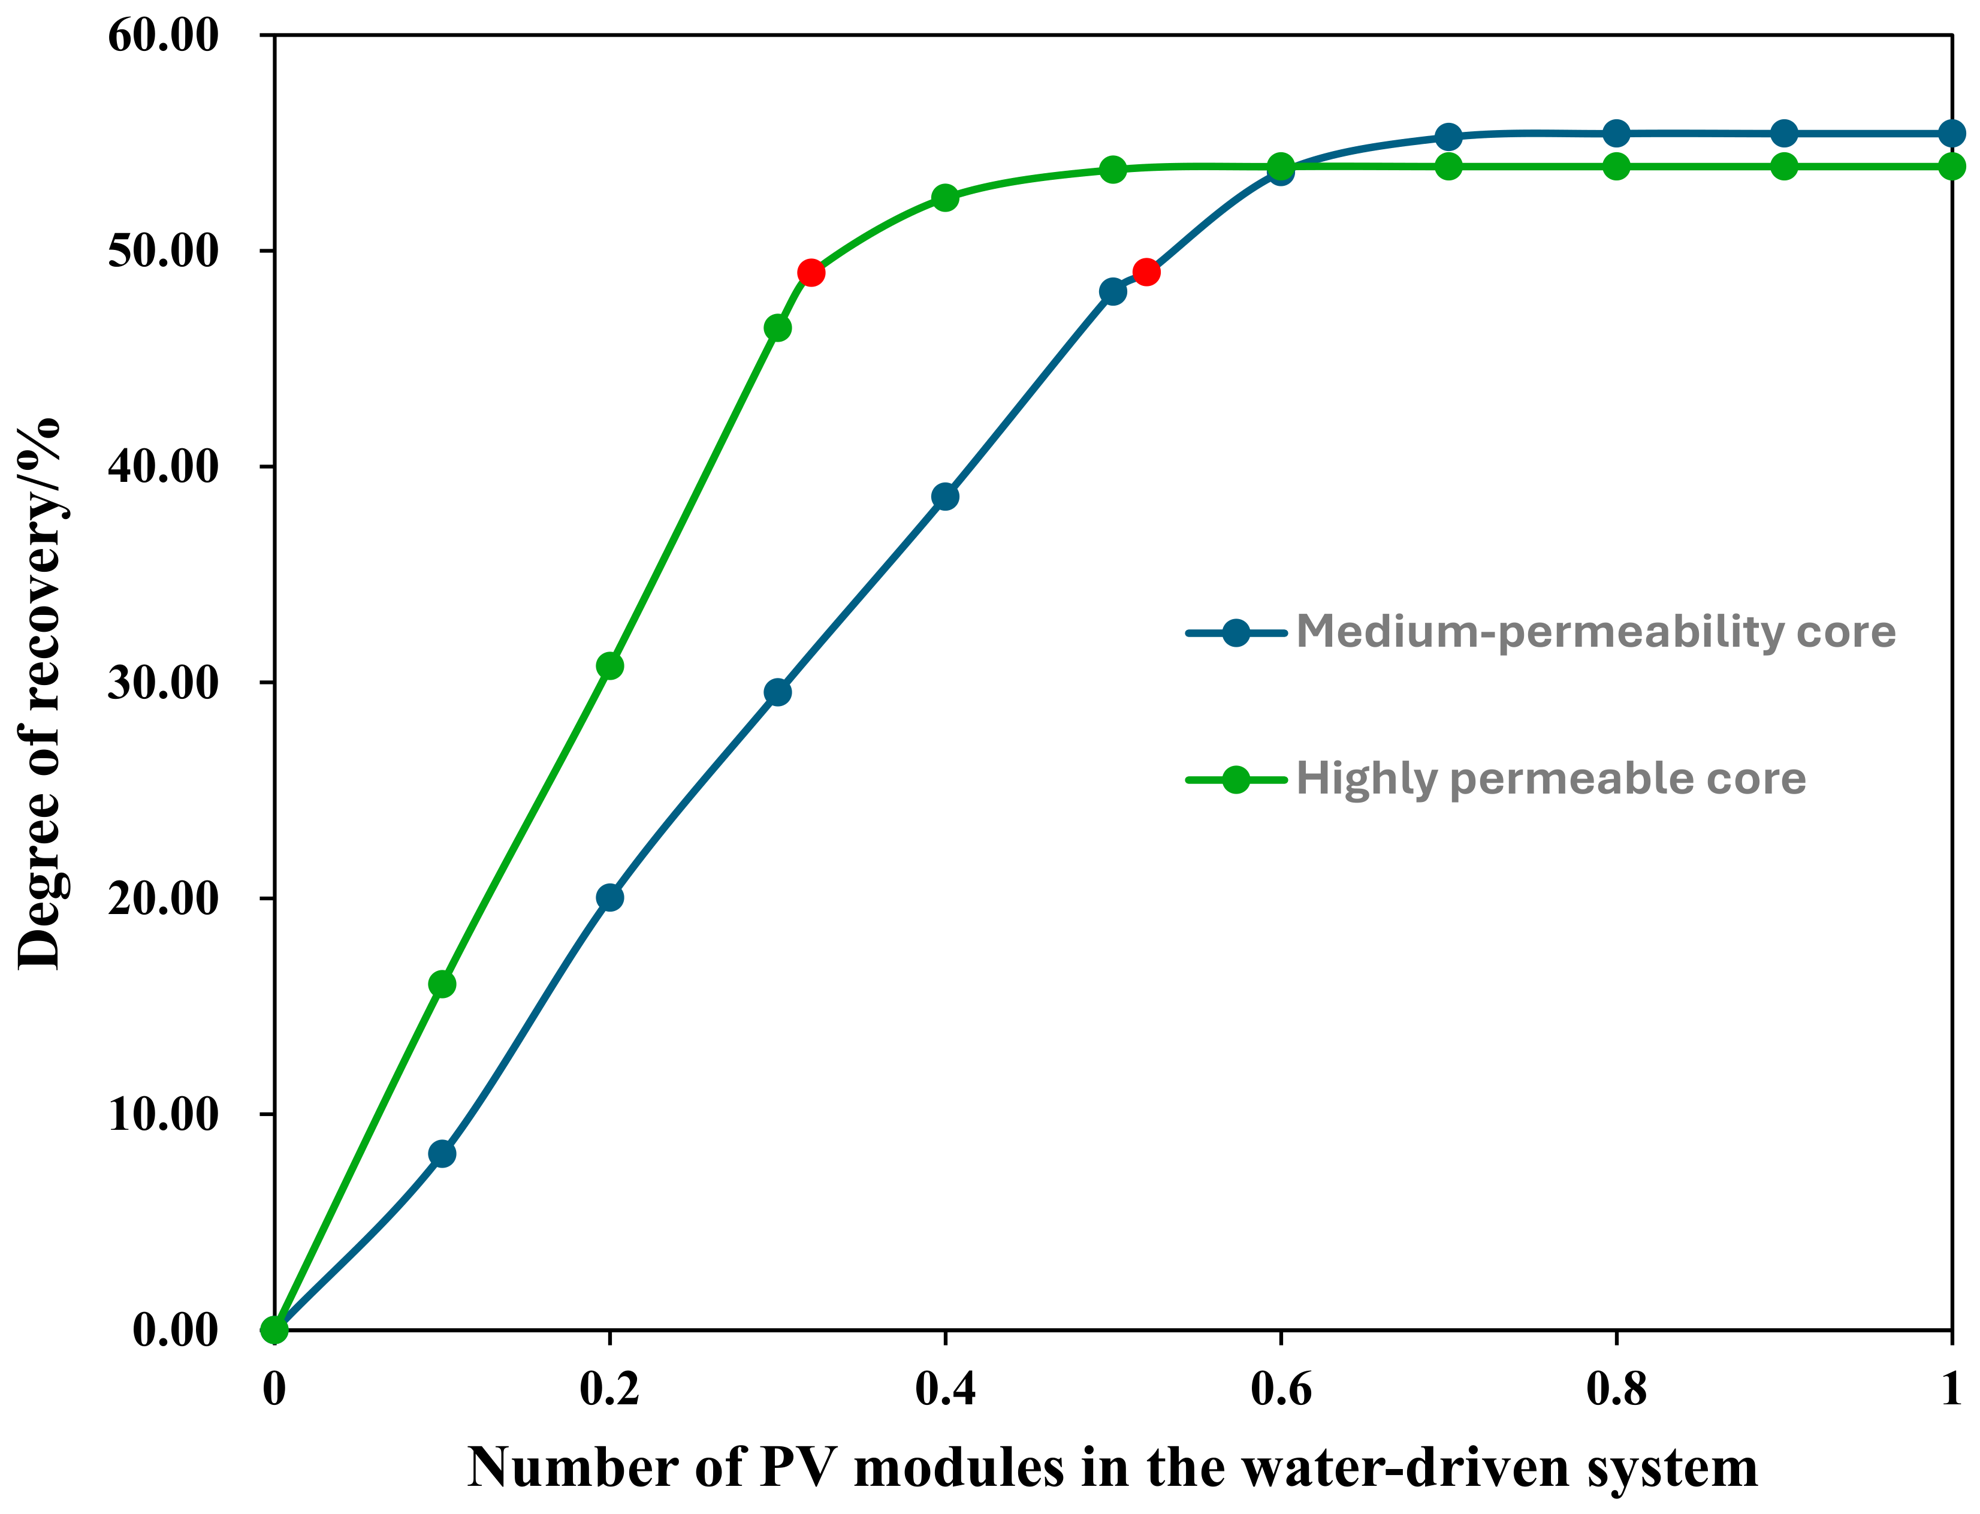
After establishing confined water in the two sets of experimental cores, formation water was injected at a constant pressure of 0.25 MPa for displacement. As shown in Figure 5, gas in the large pores of the core was displaced first, causing the gas production rate to reach a peak before gradually decreasing. As water displacement progressed, gas in the small pores was also displaced, causing the gas production rate to rise briefly; after water production began, the gas production rate gradually decreased. Injecting formation water simulates the flooding process of a gas reservoir. The high-permeability core exhibits rapid water ingress and higher gas production than the medium-permeability core. When 0.32 PV of formation water was injected, the recovery rate reached 49%, whereas the medium-permeability core did not reach this level until 0.53 PV was injected; as formation water continues to be injected, the system receives a replenishment of water energy, allowing for the recovery of some recoverable gas. Once water appears at the outlet end, gas production decreases to zero. As shown in Figure 6, water appears earlier in the high-permeability core, yet its final recovery rate is lower than that of the medium-permeability core. The final recovery rate for the medium-permeability core is 55.42%, while that for the high-permeability core is 53.91%. The red dots in the figure represent the number of water-flooding pressure cycles (PV) at a recovery rate of 49%. At this point, the low-permeability core has undergone 0.52 PV of water flooding, while the high-permeability core has undergone 0.32 PV.
Figure 5.
Relationship between water drive volume factor and stage production rate.
Figure 6.
Relationship between water drive volume factor and recovery rate.
4.2. Analysis of Gas-Flooding Results for Different Reservoir Cores
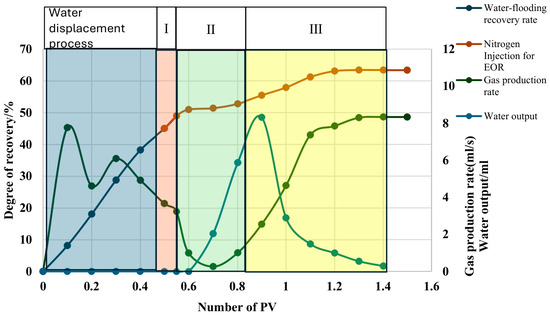
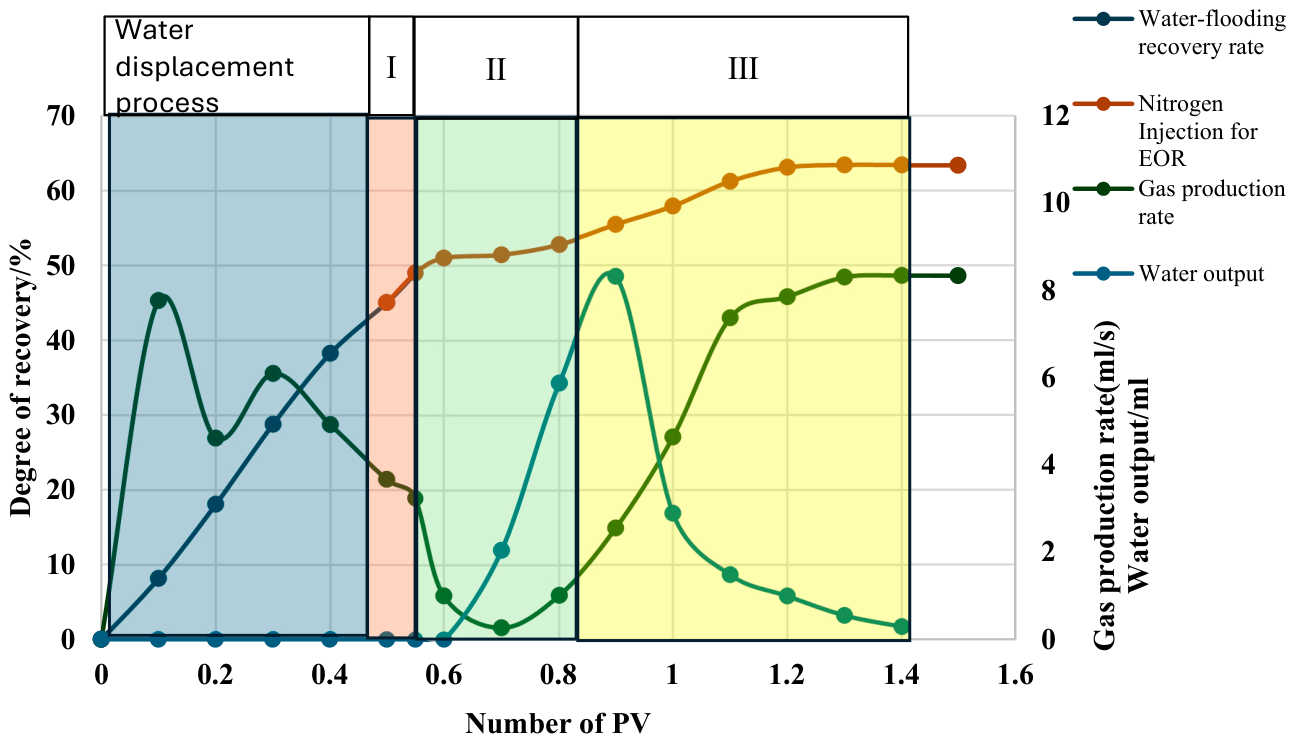
Taking the N2 injection drive experiment on a medium-permeability core as an example, as shown in Figure 7 during the water drive phase, formation water was injected to simulate water intrusion and gas production in a gas reservoir. The water injection was stopped when the recovery rate reached 49%, and gas injection displacement began. At this point, no water was observed at the outlet. The post-injection behavior was divided into three stages. Stage one was the pure gas production phase, during which gas injection provided energy to displace and recover a portion of the mobile gas; stage two is the gas–water co-production stage, during which water appears at the outlet. Water production increases, and gas bubbles are produced along with the water. The gas production rate decreases, but the gas production volume increases with the number of injection PVs; stage 3: as dry gas continues to be injected, water production rapidly decreases, while gas production and gas production rate increase rapidly. This is because the gas breaks through the water lock, forming gas-dominated pathways within the rock mass that connect to the remaining gas in the rock mass, thereby liberating some of the gas trapped by the water seal and achieving enhanced recovery.
Figure 7.
Relationship between the volume factor of dry gas flooding in permeable rock cores and various production parameters.
4.2.1. Analysis of Dry Gas Injection Results
For the medium-permeability core, water appeared at the outlet after injecting 0.15 PV of dry gas; the water lock was breached after injecting 0.5 PV, with a final recovery rate of 64.89%. For the high-permeability core, water appeared at the outlet after injecting 0.13 PV of dry gas; water production decreased after 0.5 PV, and the water lock was breached, with a final recovery rate of 65.96%. Figure 8 compares the enhanced recovery effects of dry gas injection in different reservoirs.
Figure 8.
Comparison of dry gas flooding performance in different reservoirs.
4.2.2. Analysis of N2 Injection Results
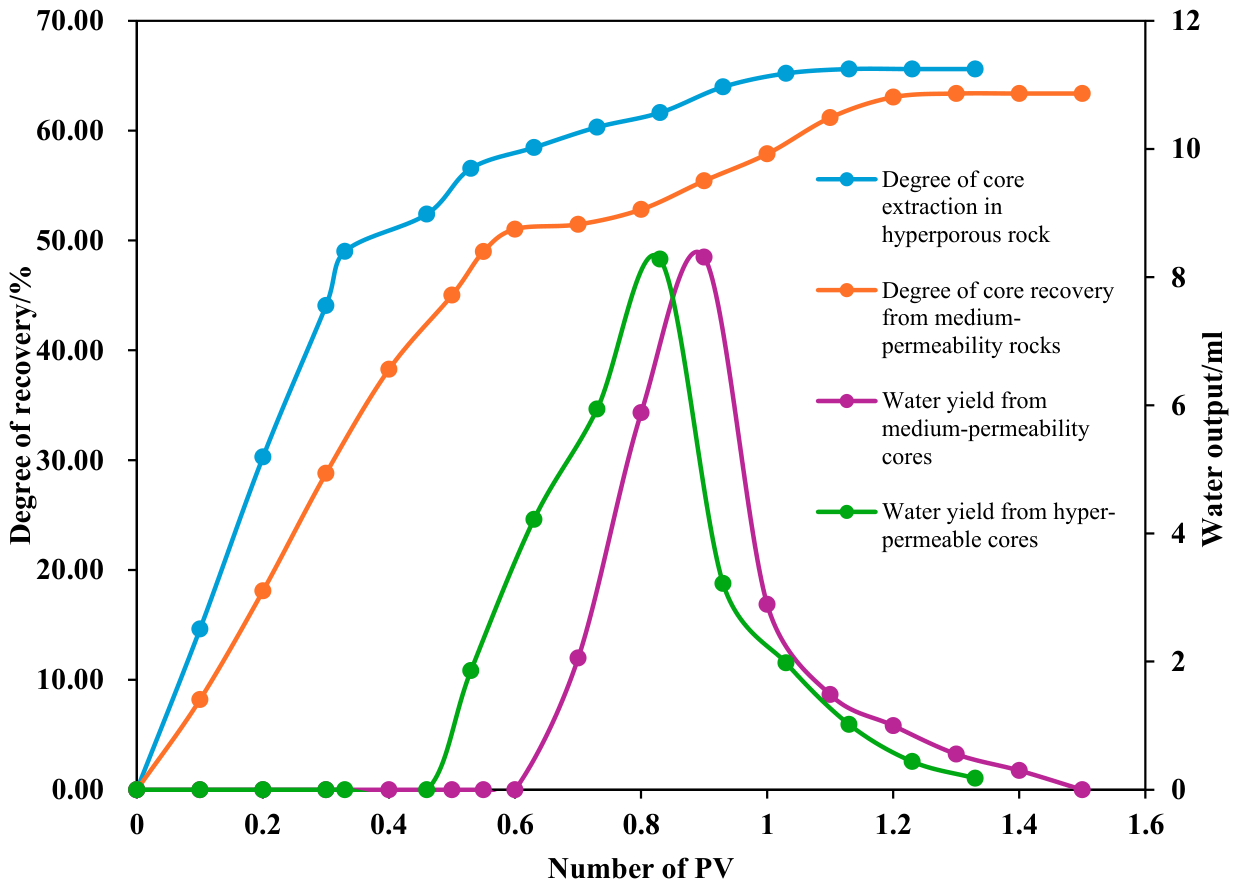
For the medium-permeability core, water was observed at the outlet after injecting 0.2 PV of N2; the water lock was breached after injecting 0.4 PV of N2, with a final recovery rate of 63.38%. For the high-permeability core, water was observed at the outlet after injecting 0.13 PV of N2; water production decreased after injecting 0.5 PV, and the water lock was breached, with a final recovery rate of 65.61%. Figure 9 compares the enhanced recovery effects of N2 injection in different reservoirs.
Figure 9.
Comparison of N2 flooding performance in different reservoirs.
4.2.3. Analysis of CO2 Injection Results
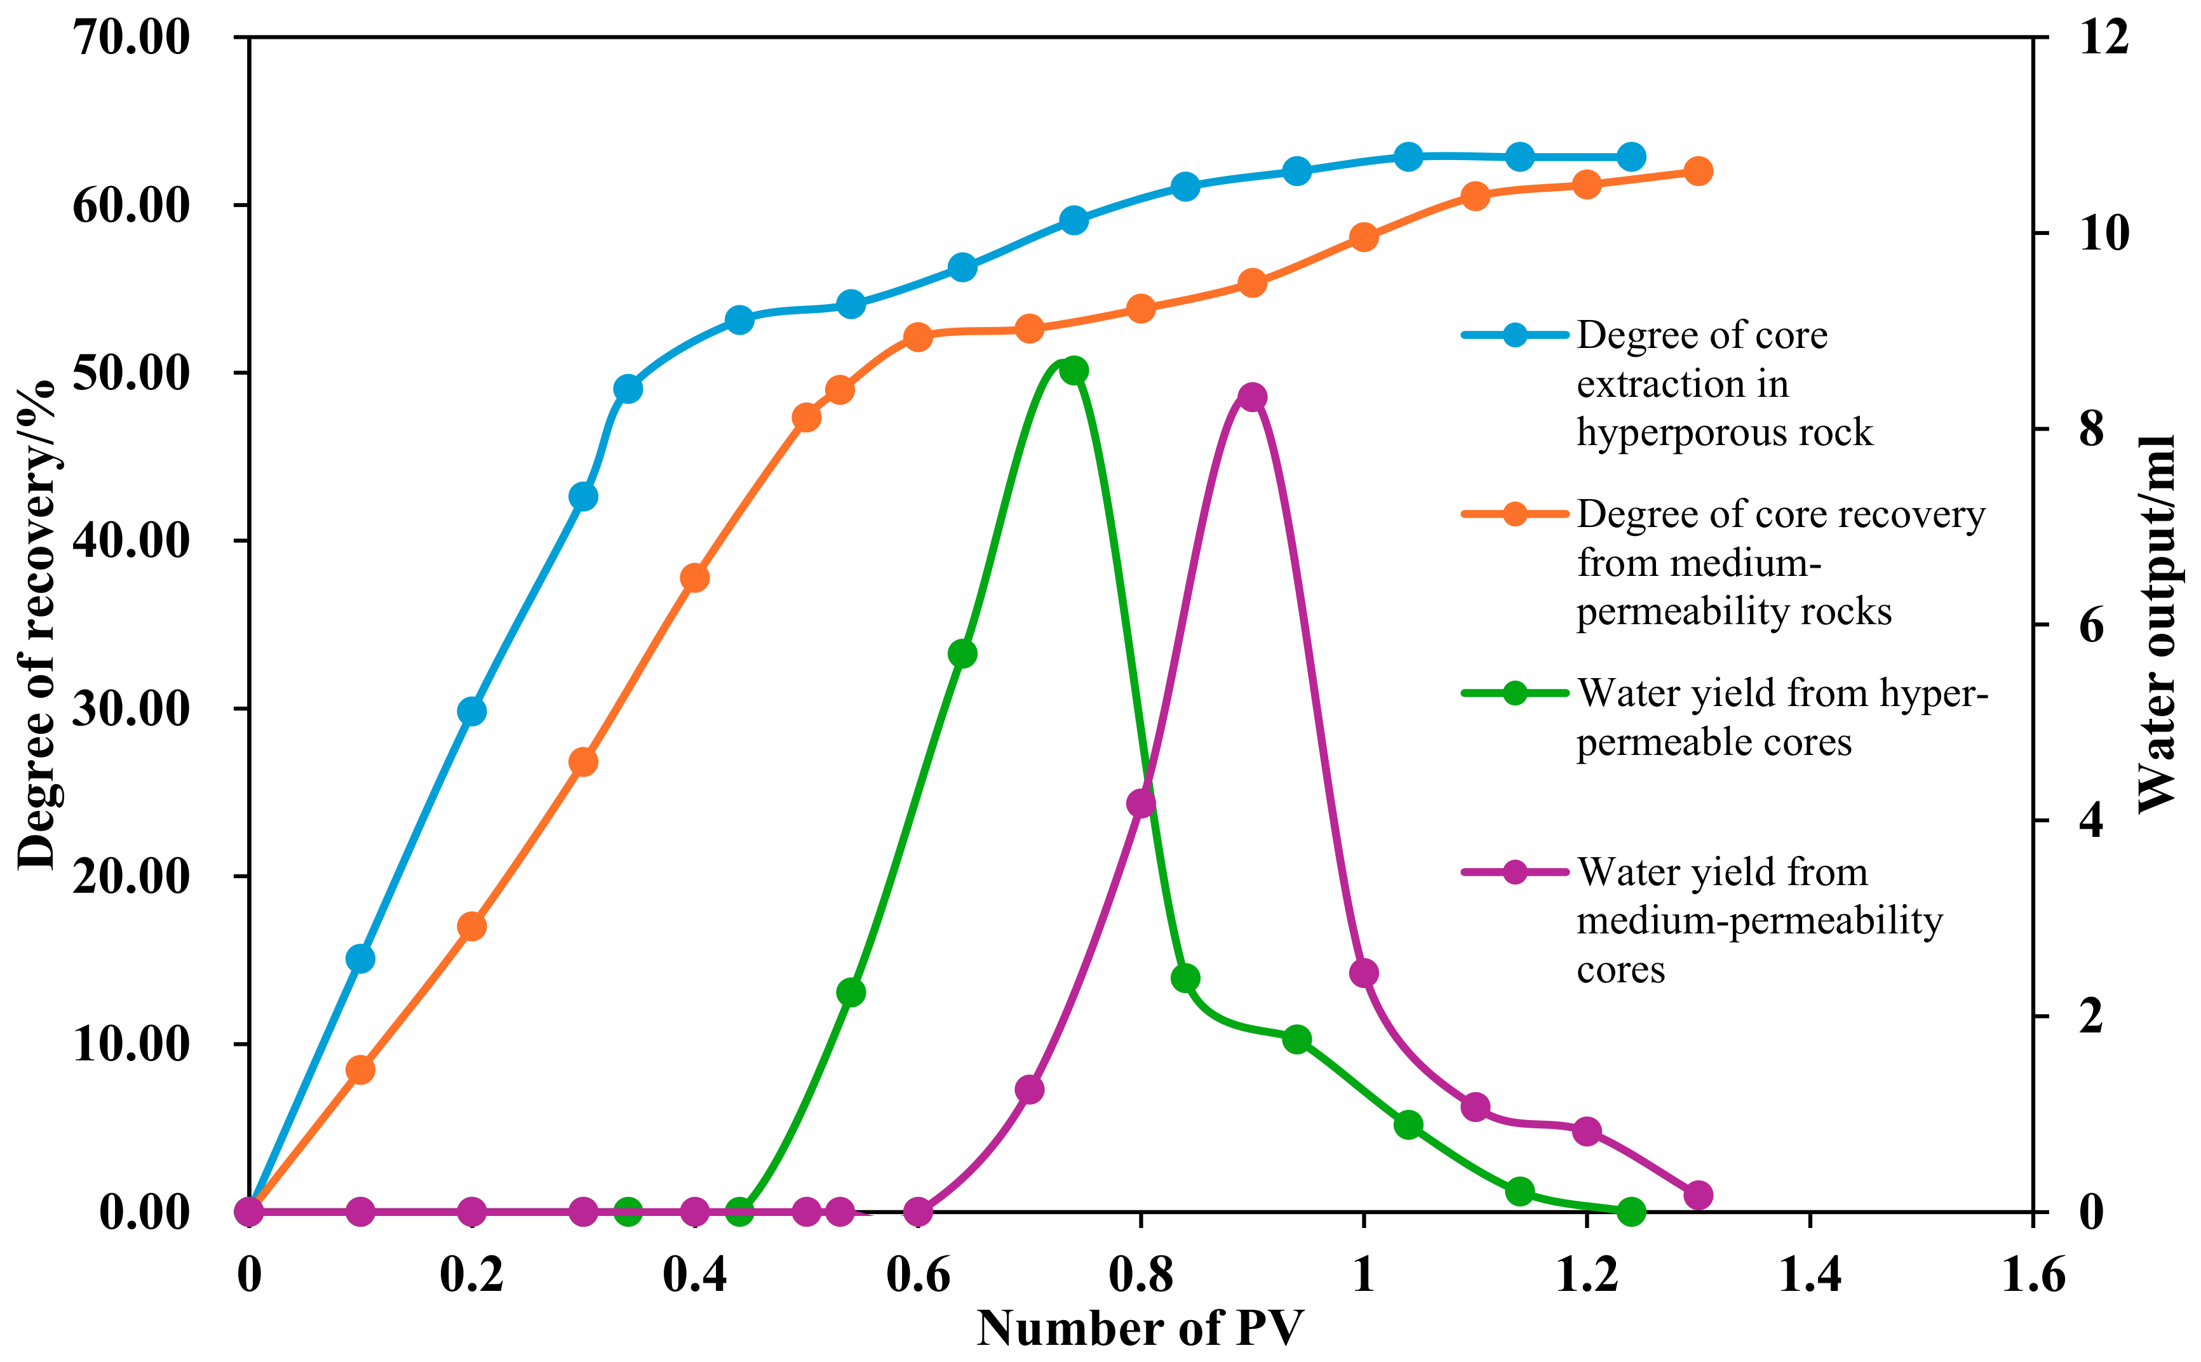
For the medium-permeability core, water was observed at the outlet after injecting 0.2 PV of CO2; the water lock was breached after injecting 0.4 PV of CO2, with a final recovery rate of 62.01%. For the high-permeability core, water was observed at the outlet after injecting 0.2 PV of CO2; water production decreased after injecting 0.4 PV, and the water lock was breached, with a final recovery rate of 62.86%. Figure 10 compares the enhanced recovery effects of CO2 injection in different reservoirs.
Figure 10.
Comparison of CO2 flooding effectiveness in different reservoirs.
As can be seen from the above results, regardless of the injection medium used, enhanced recovery performance is better in high-permeability cores than in low-permeability cores. This is because high-permeability cores have better physical properties; during the simulated flooding process, water advances more rapidly, and there is a greater amount of residual mobile gas and water-sealed gas within the core. The large pore throat structure of high-permeability reservoirs provides smooth migration pathways for gas, resulting in strong injection capacity and rapid pressure transmission, thereby achieving more efficient gas injection. Gravitational segregation is pronounced in high-permeability reservoirs, which facilitates the formation of a stable gas-top drive. The macroscopic swept volume is large; during the gas injection drive process, the gas breaks through the water lock, resulting in a longer gas–water co-production phase, higher gas production volumes, and better recovery efficiency.
4.3. Analysis of Displacement Results for Different Injection Media in the Same Reservoir
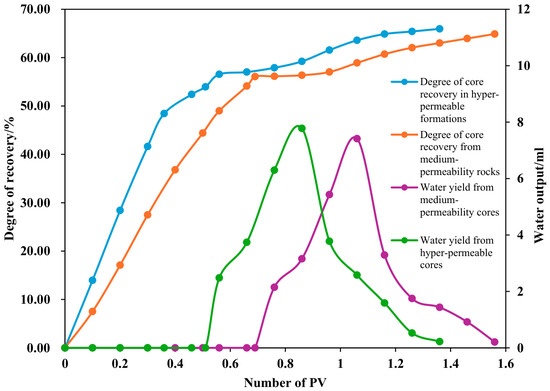
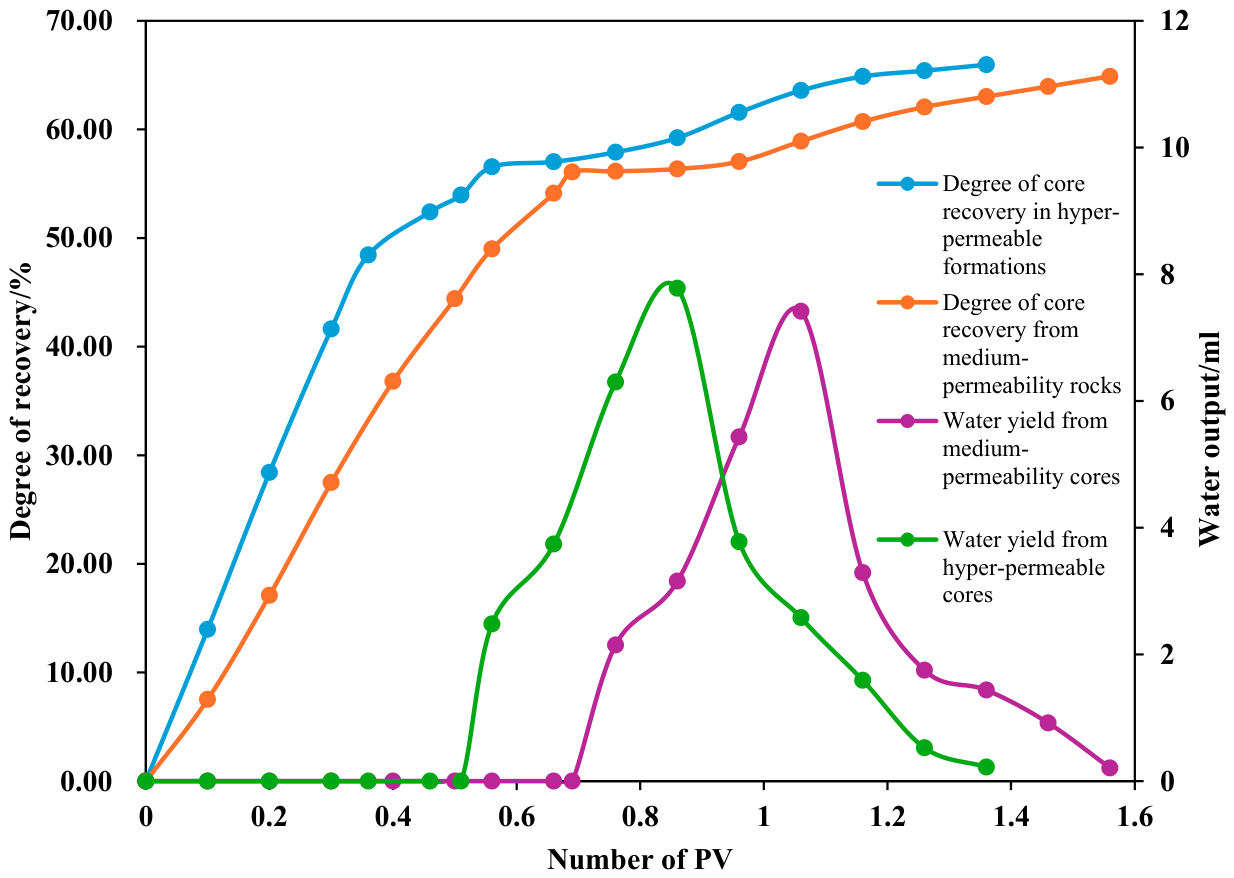
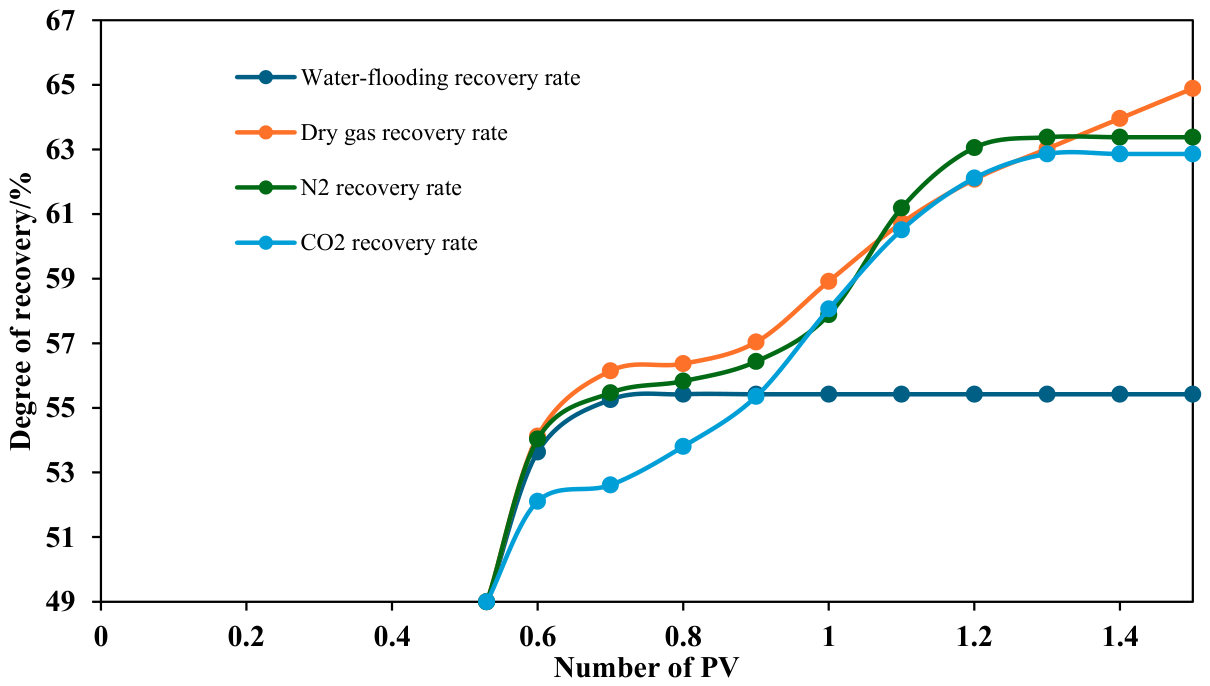
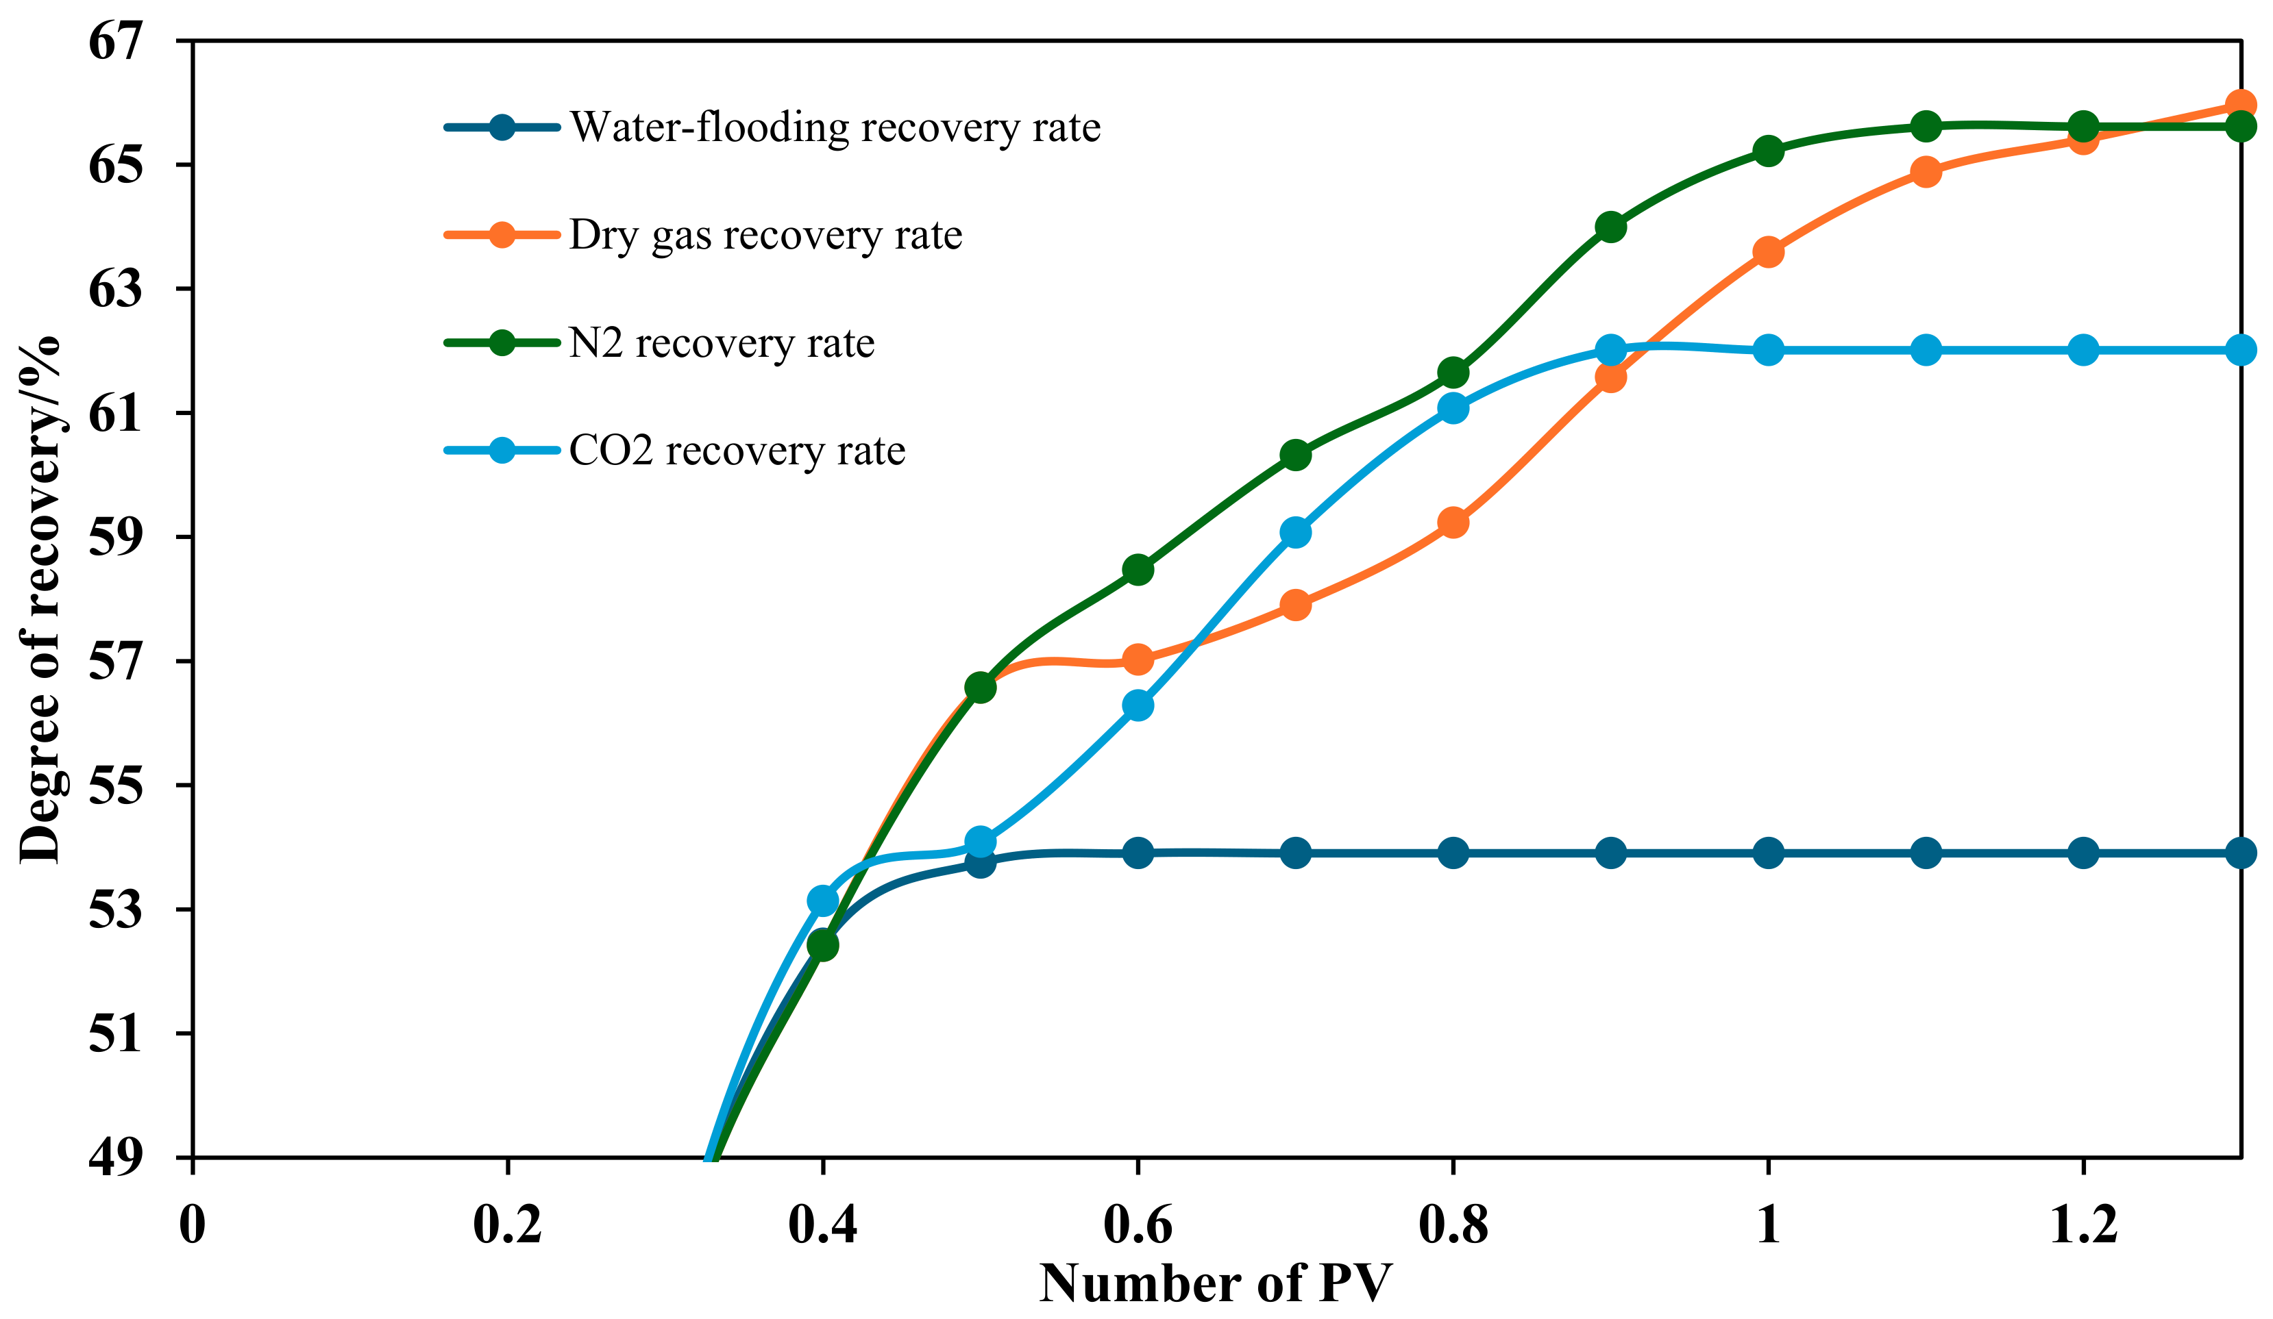
Whether in medium-permeability or high-permeability reservoirs, the enhanced recovery effectiveness of different injection media follows the order: dry gas > N2 > CO2. This is because dry gas shares the same primary components as the reservoir gas; upon entering the rock core, it mixes well with the fluid within the core, effectively reducing residual gas saturation and facilitating communication with the water-sealed gas; N2 has significantly weaker miscibility than dry gas and CO2, operating primarily as a non-miscible displacement agent. It relies mainly on pressure and propulsion effects, resulting in poor “cleaning” of water-sealed zones. Furthermore, due to its low viscosity, N2 is highly prone to gas migration and over-saturation, leading to early breakthrough and a short gas–water co-production period; CO2 exhibits the greatest potential for miscible flooding. Under experimental conditions, it exists in a supercritical state, with a density and viscosity higher than those of N2 and dry gas but significantly lower than water, resulting in better flow control and more uniform sweep; however, CO2 dissolution losses during the experiment caused most of the injected energy to be absorbed by the aqueous phase rather than effectively driving the gas phase, resulting in the poorest macroscopic enhanced recovery performance. Furthermore, given the extremely high mineralization of the formation water, CO2 in the supercritical state may react with the formation water to form carbonate rock precipitates that cause blockages, leading to a decrease in core porosity and permeability [22] and resulting in poorer displacement efficiency compared to dry gas and N2. Figure 11 and Figure 12 show comparison charts of recovery efficiency for different injection media in medium-permeability and high-permeability cores, respectively.
Figure 11.
Comparison of enhanced recovery results for different injection media in permeable rock cores.
Figure 12.
Comparison of enhanced recovery results using different injection fluids in hyperporous cores.
5. Discussion of Results
Through high-temperature, high-pressure long-core displacement experiments, this study systematically compared the enhanced oil recovery (EOR) effects of injecting dry gas, N2, and CO2 into both medium-permeability and high-permeability reservoirs under water-flooded conditions. The experimental results not only revealed the differences in the effects of various injection media but also provided several important contrasts with previous studies, thereby deepening our understanding of the mechanisms underlying gas injection for enhanced recovery in water-flooded reservoirs. The main contributions and innovations of this study compared to previous work are reflected in the following aspects:
5.1. In Terms of Experiments
It fills the experimental gap in the systematic comparison of the three media under water-flooded conditions. Existing studies have mostly focused on a single injection medium or conventional reservoir conditions, lacking a cross-comparison in a water-flooded context. This study adopted a unified experimental procedure to complete a systematic evaluation of dry gas, N2, and CO2 on the same platform.
5.2. The Unique Properties of CO2
It reveals the mechanism behind the “failure” of CO2 flooding in high-salinity water-flooded environments. Previous conclusions regarding the advantages of CO2 flooding were largely based on conventional conditions. This study clearly identifies energy losses and precipitation-induced blockage resulting from the reaction between high-salinity formation water and supercritical CO2, providing experimental evidence to help similar gas reservoirs avoid the negative effects of CO2 flooding.
5.3. Development Guidelines
A differentiated gas injection strategy based on reservoir properties was proposed. The study found that gas injection is more effective in high-permeability reservoirs than in medium-permeability reservoirs, and that the difference in performance between N2 and dry gas in high-permeability reservoirs is minimal. Based on these findings, the engineering recommendation of “injecting dry gas into medium-permeability reservoirs and N2 into high-permeability reservoirs” was proposed, offering direct guidance for economic benefits.
6. Conclusions
6.1. Summary and Reflections
(1) Characteristics such as high permeability and inherent microscopic heterogeneity in highly permeable reservoirs cause water, under the influence of pressure differentials, to preferentially enter and rapidly occupy high-permeability channels, forming dominant flow paths. Once these dominant channels are established, the advancing water flow bypasses most of the hydrocarbons and breaks through directly to the outlet, leaving a large volume of hydrocarbons trapped by the water and unable to be recovered. Consequently, water displacement in highly permeable reservoirs occurs earlier, progresses faster, and results in a lower ultimate recovery rate compared to moderately permeable reservoirs.
(2) The gas injection recovery performance of all three injection media is better in highly permeable reservoirs than in moderately permeable reservoirs, for the following reasons: high permeability and large pore channels make it easier for injected gas to overcome capillary resistance, enter the pore spaces occupied by water, and form continuous gas flow channels to displace water and residual gas from the pores; high-permeability reservoirs exhibit rapid pressure propagation, allowing injected gas to form a stable displacement front more quickly. Furthermore, after flooding, a significant number of large pores remain unoccupied by water, leaving more residual mobile gas and water-sealed gas. During gas injection, gas easily enters these spaces and expands the swept volume.
(3) Regarding the recovery efficiency of different injection media, the order is dry gas > N2 > CO2. Injection of dry gas and CO2 constitutes multiphase flooding, and their displacement capacity should theoretically be stronger than that of N2 in non-multiphase flooding. However, due to the unique properties of CO2 under high-temperature and high-pressure conditions, its displacement energy is absorbed by the water. Furthermore, the formation water has a very high mineralization degree, making it prone to react with CO2 to form carbonate rock precipitates that block the pores, resulting in the poorest displacement efficiency for CO2.
(4) Based on the experimental results, if a reliable gas source is available, dry gas injection for enhanced recovery is most effective for the low-permeability sections of the Y gas reservoir. For the high-permeability sections, the ultimate recovery rate for dry gas injection was 65.96%, while that for N2 injection was 65.61%. The difference between the two is not significant, and the performance curves for N2 injection and production almost all lie above those for dry gas injection and production. Considering economic costs, N2 injection and production can be adopted for the highly permeable reservoirs. The Y gas reservoir has been completely flooded; measures such as gas injection and production should be implemented as soon as possible.
6.2. Limitations and Recommendations
(5) Under laboratory conditions, this study is still subject to limitations such as core-scale constraints, as well as the use of single-variable temperature–pressure conditions and fluid properties. It is recommended that pilot gas injection tests be conducted in a typical well cluster within the Y gas field (with priority given to N2 injection in high-permeability zones and dry gas injection in medium-permeability zones). This would allow the laboratory results of this study to be validated using field data, and on this basis, injection and production parameters could be optimized to provide a practical foundation for widespread implementation.
Author Contributions
Writing—original draft, J.H.; Writing—review and editing, J.H., D.L., J.C., M.H. and H.L.; Project administration, D.L. All authors have read and agreed to the published version of the manuscript.
Funding
This research was funded by Research Project of the Hubei Provincial Department of Education (B2020032).
Data Availability Statement
The original contributions presented in this study are included in the article. Further inquiries can be directed to the corresponding author.
Conflicts of Interest
The authors declare that they have no known competing financial interests or personal relationships that could have appeared to influence the work reported in this paper.
References
- Zhang, Z.; Zheng, J. Advances in Exploration and Development Technologies for Low-Permeability Oil and Gas Resources. Adv. Earth Sci. 2009, 24, 854–864. [Google Scholar]
- Wang, G.; Wang, F.; Zhao, B.; Sun, G.; Meng, Q.; Wang, Y.; Liang, J.; Fang, Y. Exploration and Development Situation and Development Strategy of Daqing Oilfield Company. China Pet. Explor. 2021, 26, 55–73. [Google Scholar]
- Fu, J.; Dong, G.; Zhou, X.; Hui, X.; Dan, W.; Fan, L.; Wang, Y.; Zhang, H.; Gu, Y.; Zhou, G. Advances in Oil and Gas Geology Research and Exploration Technology in the Ordos Basin. China Pet. Explor. 2021, 26, 19–40. [Google Scholar]
- Liu, J. Study on Injection-Unsealing Methods and Influencing Factors for Strongly Heterogeneous Water-Sealed Gas Reservoirs. Master’s Thesis, China University of Petroleum, Beijing, China, 2024. [Google Scholar]
- Li, S.; Pan, Y.; Sun, L. Reflections and Recommendations on Improving the Efficiency and Level of Development in Complex Gas Fields. Nat. Gas Ind. 2011, 31, 76–80+129. [Google Scholar]
- Guan, L.; Shi, Y.; Li, J.; Liu, J.; Xu, X.; Tu, J. Numerical Simulation of Water Invasion Mechanisms and Research on Enhanced Oil Recovery in Water-Flooded Sandstone Gas Reservoirs. In Proceedings of the 32nd National Natural Gas Academic Conference (2020); Natural Gas Professional Committee, China Petroleum Society, Ed.; Qinghai Oilfield Exploration and Development Research Institute: Dunhuang, China, 2020; pp. 922–930. [Google Scholar]
- Lü, J.; Tang, H.; Lü, D.; Huang, X.; Yu, B. A New Method for Studying the Water Lock Effect in Hypo-saline Reservoirs Using Phase Permeability Curves. Nat. Gas Explor. Dev. 2008, 3, 49–52+86. [Google Scholar]
- Van der Burgt, M.J.; Cantle, J.; Boutkan, V.K. Carbon dioxide disposal from coal-based IGCCs into depleted gas fields. Energy Convers. Manag. 1992, 33, 603–610. [Google Scholar] [CrossRef] [Scilit]
- Blok, K.; Williams, R.H.; Katofsky, R.E.; Hendriks, C.A. Hydrogen production from natural gas, sequestration of recovered CO2 in depleted gas wells, and enhanced natural gas recovery. Energy 1997, 22, 161–168. [Google Scholar] [CrossRef] [Scilit]
- Turtata, A.T.; Sim, S.S.K.; Singhal, A.K.; Hawkins, B.F. Basic investigations on enhanced gas recovery by gas-gas displacement. J. Can. Pet. Technol. 2008, 47, 39–44. [Google Scholar] [CrossRef] [Scilit]
- Shi, Y.; Jia, Y.; Pan, W.; Yan, J. Displacement Mechanism of Hypersupercritical CO2 Injection in Low-Permeability Tight Gas Reservoirs. Pet. Nat. Gas Geol. 2017, 38, 610–616. [Google Scholar]
- Wei, C.; Yang, F.L.; Nie, H.F.; Ren, X.N.; Dai, L.; Wang, F.R. Study on the Development Mechanism of Gas Injection Enhancement in Fractured Water-bearing Reservoirs. In Proceedings of the 34th National Natural Gas Academic Annual Conference—Gas Reservoir Development, Suzhou, China, 20–21 September 2024. [Google Scholar]
- Chai, X.; Cao, Z.; Guo, H.; Cheng, L.; Gao, S.; Ye, L.; Wang, G. Technology for Enhancing Recovery in the Shebei Gas Field of the Qaidam Basin through Nitrogen Injection. Nat. Gas Explor. Dev. 2026, 49, 188–200. [Google Scholar]
- Gao, S.; Liu, H.; Ye, L.; Zhu, W.; An, L.; An, W. Experimental Study on Water Injection for Enhanced Gas Recovery. Nat. Gas Geosci. 2025, 36, 1419–1429. [Google Scholar]
- Rambaran, K.D.; Chin Chee Fat, S.T.; Layne, L.E. Exploiting Water Injection Techniques for Increasing Gas Recovery in Conventional Gas Reservoirs. In Proceedings of the SPE Trinidad and Tobago Section Energy Resources Conference, Port of Spain, Trinidad and Tobago; SPE: Richardson, TX, USA, 2018; p. SPE-191206-MS. [Google Scholar]
- Matthews, J.D.; Hawes, R.I.; Hawkyard, I.R.; Fishlock, T.P. Feasibility studies of waterflooding gas-condensate reservoirs. J. Pet. Technol. 1988, 40, 1049–1056. [Google Scholar] [CrossRef] [Scilit]
- Hu, Y.; Chen, Y.L.; Li, T. The formation, development, and theoretical connotations of the “overall water control of gas reservoirs” technology in gas field development. Nat. Gas Ind. 2022, 42, 10–20. [Google Scholar]
- Gao, S.S.; Zhang, J.Z.; Liu, H.X.; Ye, L.; Zhu, W.; Xiong, W. Water-gas ratio characteristics and development concepts for water-producing gas reservoirs. Heliyon 2023, 9, e19201. [Google Scholar] [CrossRef] [Scilit] [PubMed]
- Liang, L.; Wang, J.; Yuan, Y.; Deng, P.; Peng, X.; Wu, Z. Study on the Optimization of Injection Media for Gas Injection to Enhance Recovery in the Yakla Condensate Gas Field. J. Chongqing Univ. Sci. Technol. Nat. Sci. Ed. 2023, 25, 14–21. [Google Scholar]
- Li, D.; Jiao, J.; Jiang, Z. Micro-scale experimental study on the development of gas-water reservoirs at N2 injection. Inn. Mong. Petrochem. Ind. 2012, 38, 1–3. [Google Scholar]
- Li, D.; Zhang, L.; Yi, J.; Jiao, J.; Jiang, Z. A Study on Sensitivity Factors in the Development of Water-Gas Reservoirs in the N2 Block. Block Oil Gas Fields 2012, 19, 343–345+385. [Google Scholar]
- Zhang, Y.X.; Yan, H.; Wei, Y.; Cao, Z.; Guo, J.; Luo, Y.; Qin, N.; Wang, M.; Wang, C.; Zheng, G.; et al. The Influence of CO2-Water–Rock Reaction on the Permeability of Different Reservoirs. In Proceedings of the International Field Exploration and Development Conference 2024, 1st ed.; Lin, J., Ed.; Springer: Singapore, 2025; Chapter 44. [Google Scholar]

Disclaimer/Publisher’s Note: The statements, opinions and data contained in all publications are solely those of the individual author(s) and contributor(s) and not of MDPI and/or the editor(s). MDPI and/or the editor(s) disclaim responsibility for any injury to people or property resulting from any ideas, methods, instructions or products referred to in the content. |
© 2026 by the authors. Licensee MDPI, Basel, Switzerland. This article is an open access article distributed under the terms and conditions of the Creative Commons Attribution (CC BY) license.