


Abstract
Vacuum drying is a promising alternative to conventional dehydration for heat-sensitive vegetables, although process temperature can significantly affect both drying behavior and product quality. In this study, vacuum drying of cauliflower florets (Brassica oleracea) was evaluated at 40, 50, 60, 70, and 80 °C under 10 kPa, using freeze-drying as a reference. Desorption isotherms were determined at 50 and 70 °C and fitted to common models, where the GAB model provided excellent fits (R2 = 0.9999 and 0.9997, respectively). The drying kinetics were successfully described by four thin-layer models, with the Midilli–Kucuk and Weibull models performing best overall. Color was significantly affected, with total color differences (ΔE) ranging from 15.9 to 20.6 and higher browning indices at elevated temperatures. Bioactive compounds (total phenols, flavonoids, and glucosinolates) and antioxidant potential (by DPPH and ORAC assays) were quantified to assess changes in functional quality across treatments. Bioactive compounds showed the highest values at the highest temperatures (60–80 °C). The DPPH assay remained stable between 50 and 80 °C, but ORAC assay decreased with increasing temperature, suggesting that vacuum drying at 60–70 °C offers the best balance between overall bioactive retention and functionality for producing cauliflower powder.
1. Introduction
The Brassicaceae family, commonly known as cruciferous vegetables, comprises approximately 375 genera and over 3200 species, including Brassica oleracea, the species from which several widely consumed vegetables such as broccoli and cauliflower are derived [1]. Cauliflower (Brassica oleraceae L. var. botrytis Linnaeus) is rich in bioactive compounds, including vitamins, phenols, glucosinolates, and phytosterols, which have beneficial health effects [2]. This vegetable is cultivated worldwide and serves multiple purposes, vegetable and as an ingredient, valued for its distinctive nutritional and sensory properties [3]. Its chemical components include vitamins B1, B2, B3, B5, B6, folic acid, C, E, and K, as well as fatty acids such as ω-3, minerals such as potassium, phosphorus, magnesium, manganese, and iron, although these vary between cultivars [4].
Some of the bioactive compounds in cauliflower, such as glucosinolates, carotenoids, and phenolic compounds, which confer its functional properties, are unstable when exposed to various factors, including light, enzymatic degradation, and heat, due to their sensitivity to high temperatures [5]. In addition, storage conditions also affect its quality, since temperatures above 5 °C can accelerate browning, while refrigeration at 4 °C extends shelf life only up to two weeks, which represents a limitation for export processes [6]. In this context, cauliflower dehydration emerges as an effective alternative to reduce moisture content, thereby extending shelf life, decreasing packaging, storage, handling, and transportation costs, and increasing product availability beyond seasonal production, while also enabling the development of a wider range of value-added products [7].
Conventional drying methods, such as hot air drying, are energy-inefficient and may cause a loss of product quality due to the degradation of bioactive compounds [8]. In contrast, vacuum drying is based on moisture evaporation under reduced pressure, making it particularly suitable for heat-sensitive and oxidation-prone raw materials, as it significantly reduces oxidative reactions [9,10]. In addition, it is relatively simple and can be performed at a lower cost compared to spray drying and freeze-drying, which makes it especially attractive for small- and medium-sized industries. Previous studies, such as that of Neoh et al. [11], have shown that vacuum drying better preserves phenolic compounds and flavonoids compared to freeze-drying and solar drying. Moreover, operating under reduced pressure allows moisture to evaporate at lower temperatures, increasing drying rates, while promoting structural changes such as matrix expansion that enhance heat and mass transfer [12]. As a result, vacuum drying offers clear advantages over convective air drying, including higher dehydration rates, lower operating temperatures, and an oxygen-deficient environment that reduces oxidation reactions, minimizes color deterioration, and helps preserve the nutritional and functional quality of the product [13]. However, despite these advantages, processing temperature remains a critical parameter, as it directly influences the retention of bioactive compounds and the overall nutritional quality of the raw material, making its optimization essential [14].
Therefore, the objective of this study was to evaluate the effect of vacuum drying at five different temperatures (40, 50, 60, 70, 80 °C) on drying kinetics, physicochemical parameters, and the content of bioactive compounds in cauliflower florets (Brassica oleracea var. botrytis), establishing the best process conditions by comparison with freeze-drying as the reference method. Additionally, this study aimed to identify process conditions that maximize the retention of nutritionally relevant phytochemicals.
Although previous studies have evaluated the effect of convective hot-air drying on the quality of cauliflower [15,16], the application of vacuum drying over a wide temperature range (40–80 °C), simultaneously addressing drying kinetics, sorption isotherms, physicochemical parameters, and a comprehensive profile of bioactive compounds—including phenolic compounds, flavonoids, glucosinolates, and antioxidant capacity assessed through complementary assays—has not been previously reported for this vegetable matrix. Furthermore, most studies on cauliflower drying have focused on convective methods or on the evaluation of quality attributes in isolation, without integrating mathematical modeling of drying kinetics with functional characterization of the product. In this context, the present study addresses this gap through a comprehensive evaluation of vacuum drying of cauliflower florets under reduced pressure (10 kPa), using freeze-drying as a reference method, to identify optimal process conditions for obtaining a cauliflower powder with improved nutritional and functional properties, with potential for industrial-scale application. Finally, this approach aims to provide the food industry with a technologically viable alternative for producing cauliflower powder with enhanced nutritional and functional properties.
2. Materials and Methods
2.1. Sample Preparation for Drying Process
Cauliflower florets (Brassica oleracea L. var. botrytis) were obtained from Hortinorte Ltd. (Pan de Azúcar, Coquimbo, Chile). Prior to drying, the florets were blanched by immersion in boiling distilled water (~98–100 °C, under atmospheric pressure) for 45 s, followed by rapid cooling in an ice-water bath for 1 min to halt the thermal treatment. Excess surface moisture was subsequently removed using a vegetable centrifuge, and the samples were gently blotted with absorbent paper to eliminate remaining water.
2.2. Drying Procedure
The blanched cauliflower florets were dried in a vacuum oven (Memmert VO 400, Schwabach, Germany) connected to a vacuum pump (Büchi V-100, Flawil, Switzerland). For each experiment, 240 g of florets were evenly distributed in a single layer on the oven thermoshelves. These shelves are specifically designed for the equipment and are connected via flange sockets on the rear panel, enabling direct conductive heat transfer through electronic contact with the heating system. Drying temperatures were set at 40, 50, 60, 70, and 80 °C, while the vacuum pressure was maintained at 10 kPa.
For comparison, an additional batch of blanched cauliflower samples was freeze-dried using a vacuum freeze dryer (AdVantage Plus, Gardiner, NY, USA) until a final moisture content below 10% (wet basis) was reached. The freeze-dried samples were used as the control for subsequent chemical and antioxidant analyses. During freeze-drying, the condenser temperature was set at −60 °C and the chamber pressure was maintained at 0.027 kPa.
The dehydrated florets were ground using a manual mill (IKA A-11 basic; Wilmington, NC, USA) to obtain a powder with a particle size of 500 μm. The ground material was then sieved using a 35-mesh sieve (U.S. Standard Sieve Series, Dual Manufacturing Co., Chicago, IL, USA) to ensure uniform particle size (≤500 μm), packaged in polyethylene bags, and stored at 5 °C.
2.3. Modeling of Desorption Isotherm
Desorption isotherms were determined for fresh cauliflower florets samples (initial moisture content: 93.7% wet basis) at 50 °C and 70 °C using the gravimetric method as described by Tao et al. [17]. Saturated salt solutions of LiCl, CH3COOK, MgCl2, K2CO3, Mg(NO3)2, NaNO3, KI, NaCl, KCl, KNO3, and K2SO4 were prepared to generate water activities in the range of 0.11 to 0.97. The saline solutions, together with 1 g of the cauliflower sample set in small Petri dishes, were placed inside different airtight glass containers. To inhibit microbial growth, thymol was added only in cases where the relative humidity exceeded 70% in the containers. The containers were then placed in an oven (Memmert UF 110, Schwabach, Germany) at temperatures of 50 °C or 70 °C. The weight loss of the sample was determined weekly using an analytical balance (±0.0001 g; HR200, A&D Company, Tokyo, Japan) until a constant weight was reached. The water content of the samples was then determined in triplicate using the AOAC method (934.06) [18]. The equilibrium moisture content (Xwe) was then adjusted as a function of water activity (aw) using the models of GAB, Iglesias & Chirife, and Peleg (Table 1).
Table 1.
Estimated model parameters and statistical results applied to the experimental sorption data of cauliflower.
2.4. Determination of Drying Kinetics and Mathematical Modeling
During vacuum drying, drying kinetics were determined by periodically recording the sample mass. Measurements were taken every 15 min during the first hour of drying and every 30 min thereafter. For each sampling, approximately 30 g of cauliflower florets were placed in perforated baskets (14 cm × 8 cm), and their mass was measured using a digital balance SP402 (Ohaus Corporation, Parsippany, NJ, USA) until a constant weight was reached. All drying experiments were performed in triplicate for each temperature evaluated. The moisture ratio (MR, dimensionless) was calculated using Equation (1).
where Xwt (g water/g dry matter (d.m.)) is the moisture content at time t, Xwe (g water/g d.m.) is the equilibrium moisture contents (Xwe) that were obtained from the sorption isotherm, and Xw0 (g water/g d.m.) is the initial moisture content.
In addition, four distinct mathematical models (Weibull, Verma, Two-term, and Midilli–Kucuk) were applied to fit the drying kinetics of cauliflower during the vacuum drying process, as commonly reported in drying studies of food materials [19].
The mathematical expressions of these models are presented in Table 2. The goodness of fit was evaluated using the coefficient of determination (R2), root mean square error (RMSE), and chi-square (χ2). Higher R2 values and lower RMSE and χ2 values indicate better model performance.
Table 2.
Comparison of curve fitting criteria for different mathematical models applied to the vacuum-dried cauliflower under different temperatures.
2.5. Determination of Physicochemical Parameters
2.5.1. Proximate Composition and Water Activity
Moisture, ash, lipid, crude protein, and crude fiber contents were determined following standardized methodologies from the Association of Official Analytical Chemists (AOAC) [18]. In addition, the dried samples were evenly distributed on the sample dish of a water activity meter (AQUALAB 4TE, Decagon Devices, Pullman, WA, USA) and allowed to equilibrate at 25 °C before measurement. Three independent measurements were performed for each treatment to ensure reproducibility.
2.5.2. Color Analysis
Color measurements were performed using a portable colorimeter (MiniScan™ XE Plus, HunterLab, Reston, VA, USA) operating with a 45°/0° geometry and a pulsed xenon lamp. The instrument was calibrated using black and white standard tiles prior to measurements. Color parameters were expressed in the CIE L*a*b* color space under a D65 illuminant and a 10° standard observer. Samples were placed in Petri dishes forming a uniform layer (~1 cm thick) to completely cover the measurement port. Six measurements were taken at different positions.
The total color difference (ΔE) was calculated using the freeze-dried samples (L0*, a0*, b0*) as a reference, according to Equation (2). In addition, hue angle (h°), and the chroma (C) were estimated using Equations (3) and (4), respectively:
Based on the L*, a* and b* coordinates, the browning index (BI) was also calculated using Equation (5). The value of x in Equation (5) was determined using Equation (6).
Whiteness index (WI) was also calculated using Equation (7).
This index shows the tendency of the samples to be light (white), and the closer its value is to 100, the lighter the samples are.
2.6. Determination of Antioxidant Properties
2.6.1. Preparation of Extracts
Approximately 4.0 g of dried sample was extracted with 15 mL of 80% methanol (v/v) under continuous shaking at 25 °C for 1 h. The mixture was then centrifuged at 4193× g and 4 °C for 20 min, and the supernatant was collected. The extraction procedure was repeated twice on the remaining residue, and the resulting supernatants were pooled. The combined extract was filtered and concentrated to dryness under reduced pressure using a rotary evaporator (Büchi P-6, Flawil, Switzerland) at 41 °C. The dried extracts were finally reconstituted in 5 mL of 80% (v/v) methanol and stored at −20 °C until further analysis.
2.6.2. Total Phenolic Content (TPC) and Total Flavonoid Content (TFC)
Total phenolic content (TPC) was measured using a Folin–Ciocalteu colorimetric procedure adapted to a microplate format with sodium carbonate, while total flavonoid content (TFC) was measured using the NaNO2–AlCl3–NaOH colorimetric method. In both assays, reagent concentrations and incubation times followed the protocol previously described by Pasten et al. [20]. Absorbance was measured at 750 and 415 nm for TPC and TFC, respectively. Results were expressed as mg gallic acid equivalents (GAE) and mg quercetin equivalents (QE) per g of dry sample. All determinations were performed in triplicate.
2.6.3. Total Glucosinolate Content (TGC)
Total glucosinolate content (TGC) was determined using the tetrachloropalladate II (Na2PdCl4) colorimetric method. The Na2PdCl4 reagent was prepared as described by Mawlong et al. [21], and the assay procedure followed Mejias et al. [22]. Briefly, 60 µL of extract was mixed with 1800 µL of 2 mM Na2PdCl4 solution and incubated at room temperature for 30 min. The absorbance of the resulting complex was measured at 450 nm. Results were expressed as µmol sinigrin equivalents per g of dry sample (µmol SE/g d.m.) using a sinigrin calibration curve. All determinations were performed in triplicate.
2.6.4. Determination of Antioxidant Capacity Measured Using DPPH Radical Scavenging Assay
A microplate reader (Perkin-Elmer Victor™ χ3, Turku, Finland) was used to evaluate the antioxidant capacity of the test extracts using the DPPH radical scavenging assay [23]. A 120 μM DPPH solution (180 μL), prepared in 80% methanol, was mixed with 20 μL of each test extract in transparent 96-well microplates, resulting in a final reaction volume of 200 μL. The reaction mixtures were incubated at room temperature in the dark for 30 min, after which the absorbance was measured at 515 nm using the microplate reader. The results were expressed as µmol Trolox equivalent (TE) per gram of dry sample (µmol TE/g d.m.) using a calibration curve with Trolox (1–500 µM). The determinations were performed in triplicate.
2.6.5. Determination of Antioxidant Activity Measured Using ORAC (Oxygen Radical Absorbance Capacity) Assay
Antioxidant activity was determined using the oxygen radical absorbance capacity (ORAC) assay according to Zhang et al. [24]. The reaction was carried out in 75 mM phosphate buffer (pH 7.4) with a final volume of 275 µL using the microplate reader. Briefly, 40 µL of extract and 200 µL of fluorescein solution (final concentration 100 nM) were transferred to a black 96-well microplate. The mixture was pre-incubated at 37 °C for 20 min. The reaction was initiated by rapidly adding 35 µL of AAPH solution (final concentration 0.36 M) to the mixture. The microplate was immediately placed in the reader to record the fluorescence decay for 240 min at 60 s intervals (λex = 485 nm, λem = 535 nm), with automatic shaking before each reading. Antioxidant activity was expressed as µmol Trolox equivalents per g of dry sample (µmol TE/g d.m.), calculated by linear regression of the area under the fluorescence decay curve against Trolox standard solutions. All determinations were performed in triplicate.
2.7. Statistical Analysis
Statistical analyses were performed using Statgraphics Centurion 18 (version 18.1.12; Statgraphics Technologies, Inc., The Plains, VA, USA). Results are expressed as mean ± standard deviation (SD, n = 3). Data normality and homogeneity of variances were evaluated using the Shapiro–Wilk and Levene’s tests, respectively, prior to analysis of variance (ANOVA). Significant differences among means were determined by one-way ANOVA followed by Fisher’s least significant difference (LSD) test. Differences were considered statistically significant at p < 0.05.
3. Results and Discussion
3.1. Modeling of Sorption Isotherms
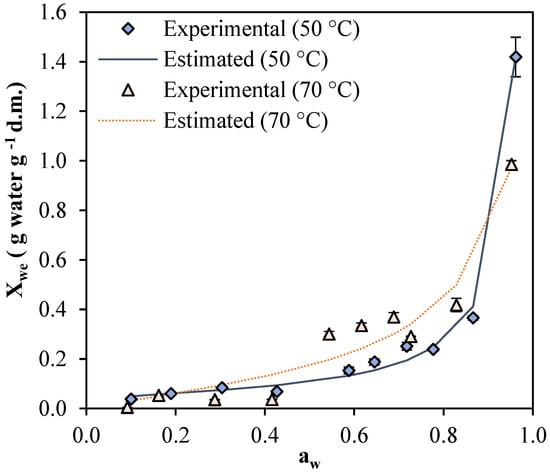
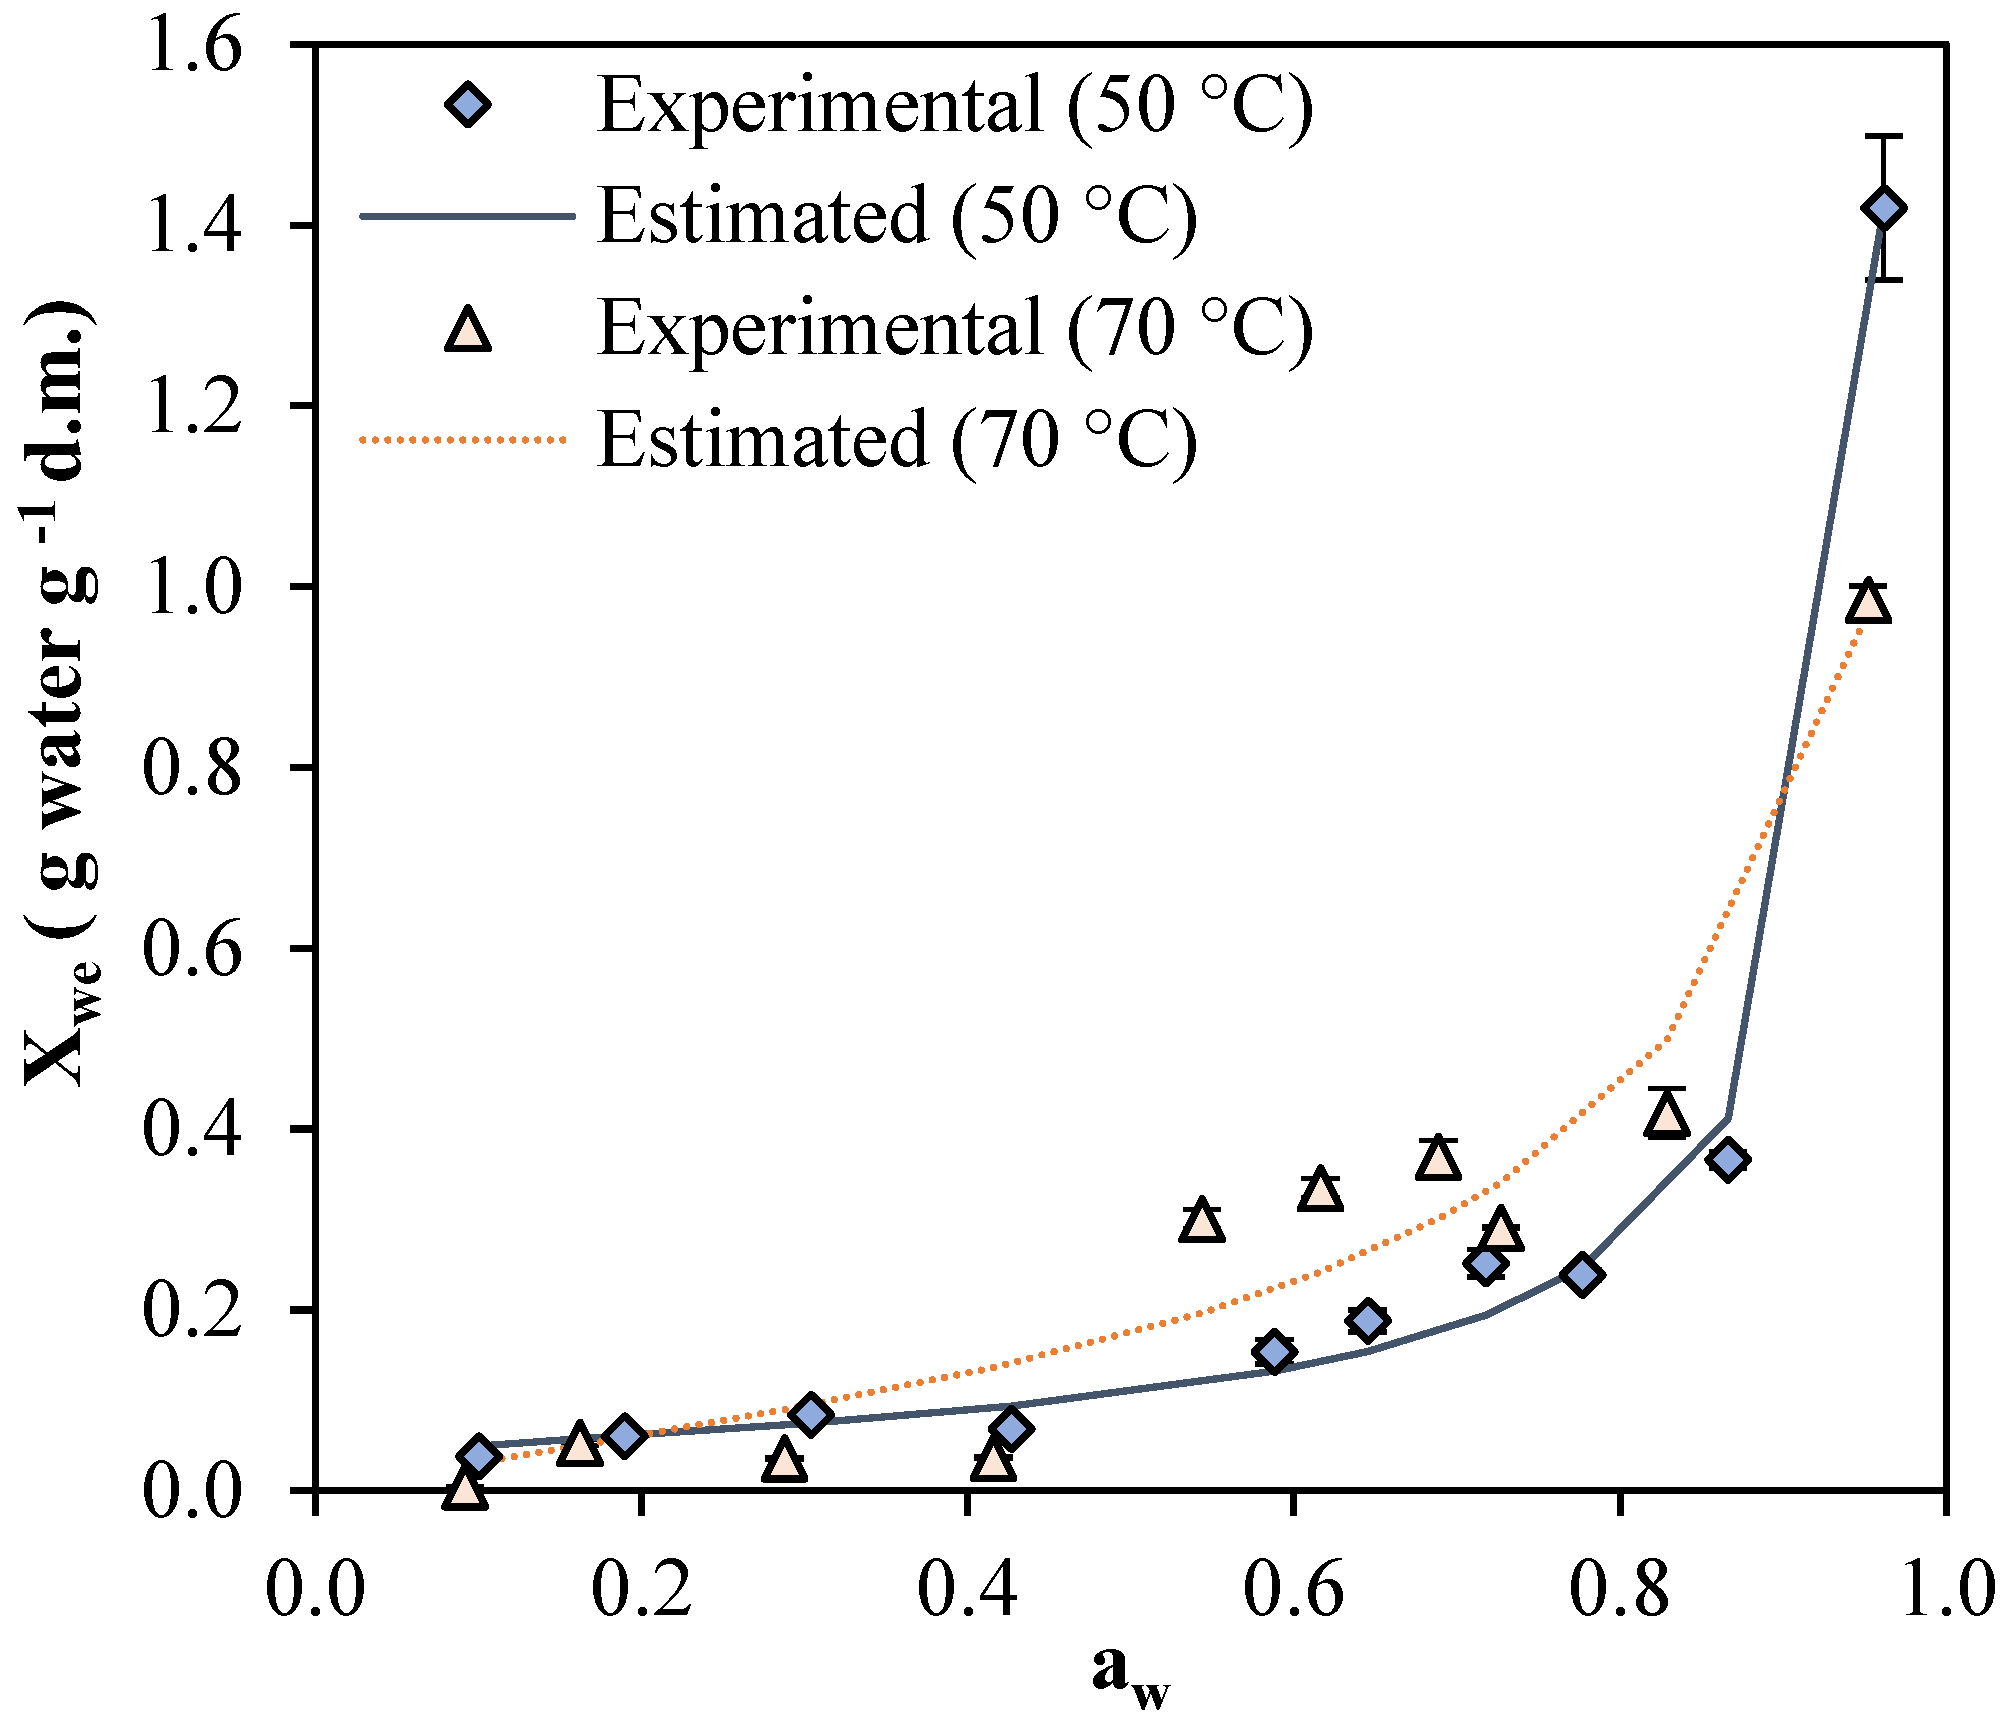
Figure 1 shows the experimental desorption isotherms for dehydrated cauliflower florets evaluated at 50 and 70 °C, together with the fit of Guggenheim-Anderson-de Boer (GAB) model. The isotherms obtained showed a sigmoid behavior characteristic of type II according to the IUPAC classification [25], typical of non-porous or macroporous materials. Similar type II behavior and a marked temperature dependence have been widely reported for dehydrated plant matrices, supporting the use of sorption isotherms as a key tool for predicting stability and packaging requirements [26]. This sigmoidal isotherm comprises three distinct regions: a region of low water activity where monolayer adsorption predominates, an intermediate region of multilayer adsorption, and a region of highwater activity where capillary condensation occurs.
Figure 1.
Experimental water sorption isotherm and GAB model fitting for cauliflower at 50 and 70 °C.
A clear influence of temperature on sorption behavior was observed. In the intermediate range (aw of 0.55–0.85, approximately), the experimental equilibrium moisture values at 70 °C were consistently higher than those at 50 °C, while near saturation (aw close to 1), a very abrupt rise is observed, particularly marked at 50 °C (with greater variability at the last point). This is relevant because it indicates that small variations in aw in the high range can be translated into significant increases in equilibrium moisture, with direct implications for stability and packaging barrier requirements.
The temperature effect may be explained by structural and physicochemical changes that reduce the availability or strength of active sorption sites, such as increased molecular mobility and modifications in water–matrix interactions, leading to lower hygroscopic affinity at higher temperatures, a trend frequently observed in dehydrated plant materials. In this context, studies evaluating desorption isotherms at comparable temperatures have also reported that equilibrium moisture content decreases with increasing temperature at a given aw, and the GAB model provides an appropriate description of the experimental data across typical storage-relevant aw ranges [27].
Table 1 shows the results of the regression analysis of the equations used to model experimental data of sorption isotherms at 50, and 70 °C. The results were fitted to GAB, Iglesias & Chirife, and Peleg models. The goodness of fit was evaluated using the root mean square error (RMSE), the chi-square test (χ2), and the coefficient of determination (R2). The three tested models were generally adequate for predicting the desorption isotherms of cauliflower florets, where the GAB model obtained the best fit to the experimental data at both evaluated temperatures. At 50 °C, the GAB and Iglesias & Chirife models showed very good fits, practically equivalent (0.9948 and 0.9947, respectively) and low errors (RMSE: 0.0280–0.0283), indicating the same high degree of prediction reliability with the equations in terms of their coefficients of fit. In contrast, the Peleg model showed a lower fit at 50 °C (R2 = 0.9249; RMSE = 0.1068; χ2 = 0.1142), suggesting limitations in capturing the curvature of the isotherm at this temperature. At 70 °C, Peleg presented the best statistical fit (R2 = 0.9605; RMSE = 0.0553; χ2 = 0.0305), while GAB showed slightly lower values (R2 = 0.9395; RMSE = 0.0684; χ2 = 0.0468). Although, GAB was selected as the main model due to its consistency across temperatures, its parsimony (three parameters), and the physical-thermodynamic interpretability of its parameters, which facilitates discussion of strongly bound water and product stability during storage. Even though the GAB model generally provided a good fit for describing the sorption isotherms within the evaluated temperature range, it was observed that at 70 °C the Peleg model exhibited slightly better statistical indices (R2 = 0.9605; RMSE = 0.0553; χ2 = 0.0305) compared to the GAB model (R2 = 0.9395; RMSE = 0.0684; χ2 = 0.0468). This difference can be attributed to the greater flexibility of the Peleg model, which employs four empirical parameters and is therefore better able to capture the pronounced curvature and abrupt increase in equilibrium moisture content observed near saturation at 70 °C, compared to a three-parameter model. However, despite this marginal statistical advantage, the GAB model was selected as the primary model for three fundamental reasons. Firstly, it showed consistent and reliable fits at both evaluated temperatures, making it a more robust option for comparative analysis. Second, its three parameters (Xm, C, and K) have well-established physicochemical and thermodynamic significance: Xm represents the moisture content of the monolayer, directly linked to product stability; C is the Guggenheim constant, related to the enthalpy of water adsorption; and K reflects water interactions in the multilayers [15,28]. In contrast, the parameters of the Peleg model lack directly of a physical interpretation, which limits their usefulness for discussing water–matrix interactions and implications for product shelf life. This selection criterion is consistent with reports by other authors working with dehydrated plant matrices, who have prioritized the GAB model for its interpretability and parsimony, even when alternative models show marginal statistical improvements [26,27].
Regarding the parameters, the GAB model showed significant changes with temperature. The monolayer moisture (Xm) increased from 0.0556 (50 °C) to 0.1388 (70 °C), while the constant C decreased sharply and K decreased slightly (from 0.9991 to 0.9087). Monolayer moisture content (Xm) is often associated with the amount of water strongly absorbed at specific sites on the food surface and has been linked to food stability in low-moisture products [28]. That is, the higher the Xm, the higher the degradation reaction rates and the lower the food stability. This increase in Xm at higher temperatures indicates weakened interactions between water molecules and active sorption sites, along with changes in multilayer adsorption behavior. The C parameter (Guggenheim constant) is usually related to the enthalpy of moisture adsorption, while the K parameter describes the interactions between the molecules and the adsorbent, representing a correction value for the properties of the multilayer with respect to the liquid, and is equivalent to the time (days) required for the sample to absorb water according to its equilibrium capacity [15].
3.2. Drying Kinetics and Mathematical Modeling
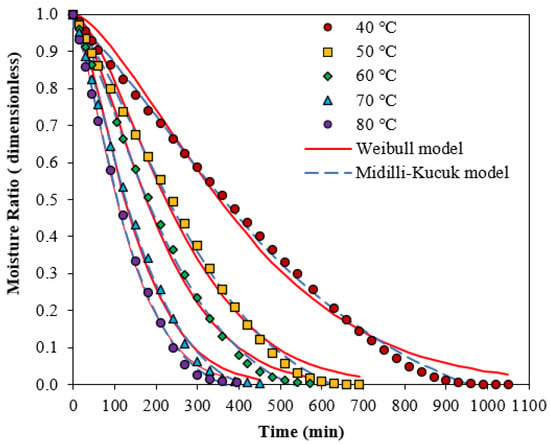
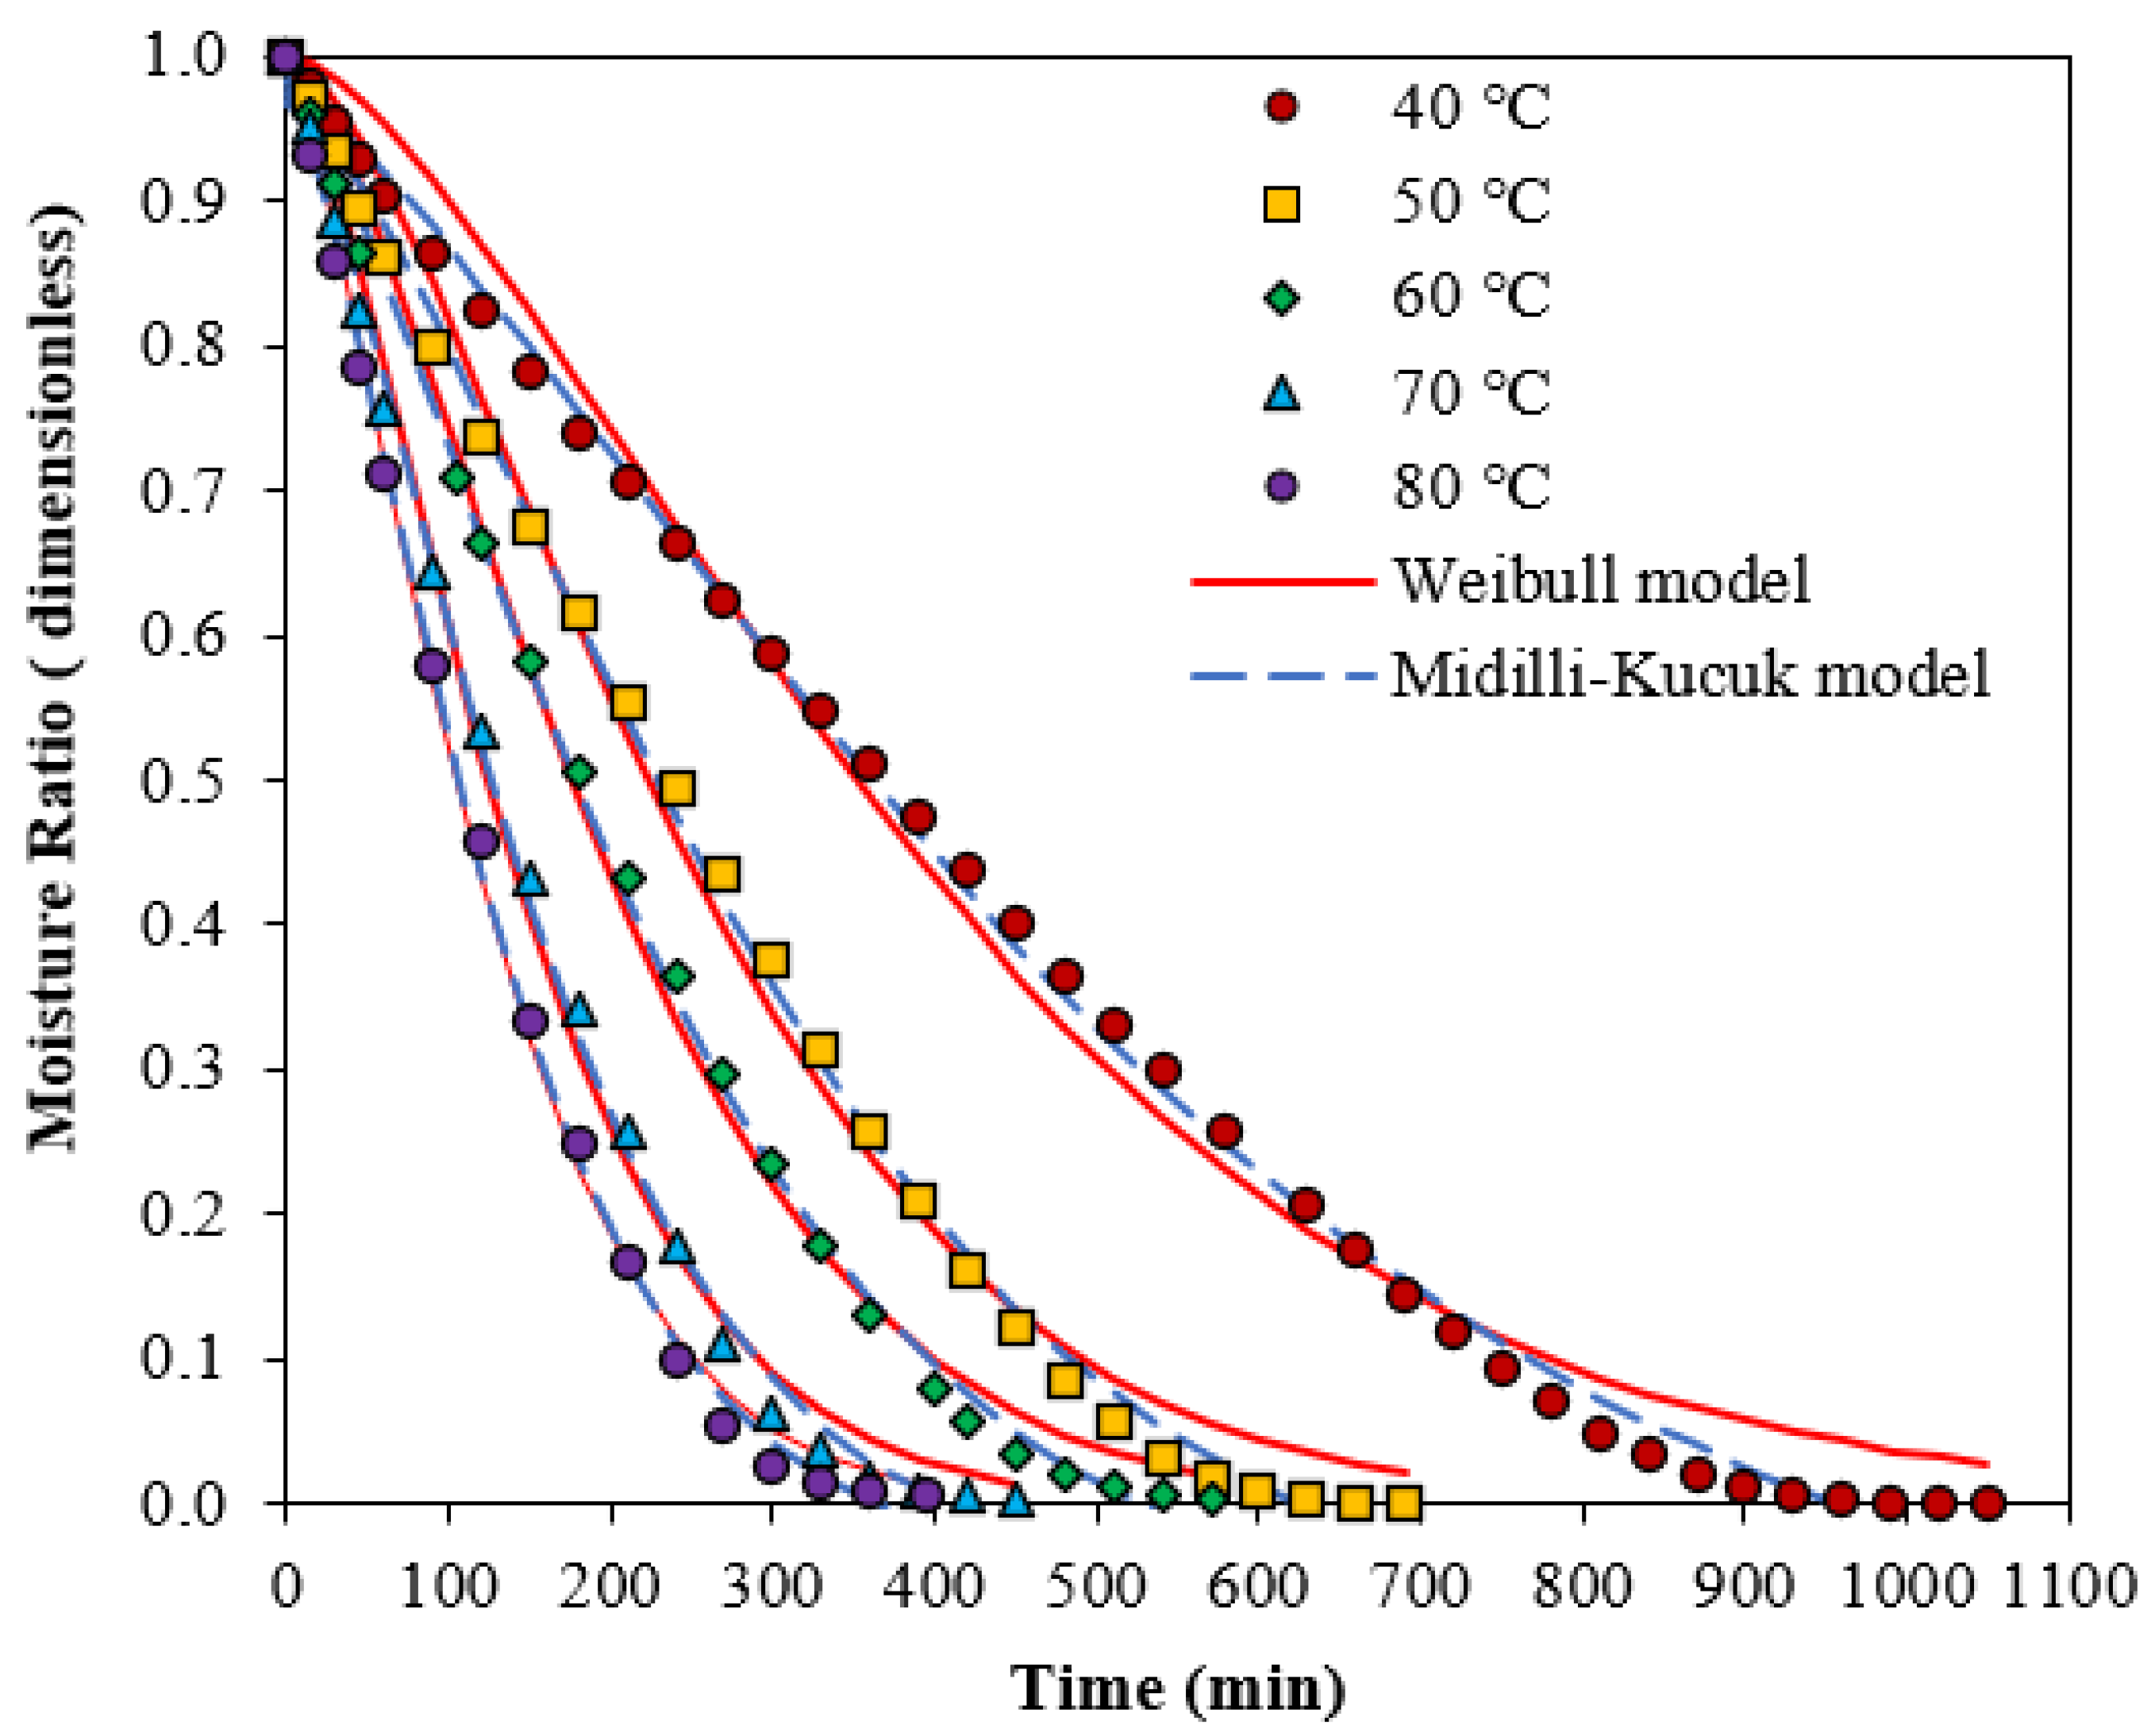
Figure 2 shows the experimental vacuum drying curves for the five working temperatures (40, 50, 60, 70, and 80 °C). All curves show a clear exponential trend, and as the vacuum drying temperature increases, the MR (moisture ratio) decreases rapidly, indicating that the drying time decreases as the temperature of vacuum drying increases. The drying times required to reach the final moisture content of the samples were 1020, 690, 570, 440, and 420 min at a vacuum temperature of 40, 50, 60, 70, and 80 °C, respectively.
Figure 2.
Comparison of experimental MR with estimated MR forecasted by the Weibull and Midilli–Kucuk models to the vacuum-dried cauliflower under different temperatures.
The effect of temperature on the drying behavior of cauliflower has been investigated in several studies [16,29]. Similarly, only the presence of the rate decline period was observed, which explains the use of the empirical models presented in Table 2. Four mathematical models were used to fit the experimental data on drying kinetics at different working temperatures. As shown in Figure 2, the Weibull and Midilli–Kucuk models were the best fits. Table 2 shows the parameter values and statistical tests performed for each model. The Midilli–Kucuk model provided the best fit at all temperatures, with R2 values above 0.9978 and the lowest errors (RMSE = 0.0117–0.0165; χ2 = 0.0002–0.0003). The Weibull model also showed a good fit (R2 = 0.9913–0.9976; RMSE = 0.0173–0.0318; χ2 = 0.0003–0.0011), but consistently lower than Midilli–Kucuk. The Verma and Two term models showed a poorer fit, with lower R2 and higher RMSE, making them less suitable for describing vacuum drying of cauliflower in the range studied.
Evaluating the shape and scale parameters of the Weibull distribution, the shape parameter (α) did not show a slight decrease, suggesting changes in the shape of the drying curve, which would indicate that the drying curve assumes a sigmoidal shape [30]. From a physical standpoint, values of α > 1 suggest that internal resistance to moisture transfer governs the process, consistent with the observed rate decay and with diffusion-controlled moisture movement within the cauliflower tissue, where structural changes such as increased porosity or cell wall rupture can alter water diffusion pathways [31]. The scale parameter (β) decreased markedly as the vacuum temperature increased (from 448.64 min to 136.15 min), which is consistent with a reduction in the characteristic time of the process and, therefore, with faster kinetics at higher temperatures. Since β is inversely related to the drying rate, its gradual decrease reflects the intensification of heat and mass transfer driven by the increase in water vapor pressure and a more pronounced moisture gradient between the material and its surroundings [16]. In practice, operating at 80 °C rather than 40 °C reduces the total process time by approximately 70%, with direct implications for energy efficiency and yield in industrial-scale operations. This behavior is consistent with that described by López et al. [32] for the vacuum drying of Chilean murta berries, where β also decreased progressively as the temperature increased. In the Midilli–Kucuk model, the constant (k) increased with temperature (from 1.66 × 10⁻⁴ to 1.12 × 10⁻³), reflecting the intensification of mass transfer.
This behavior is associated with an increase in water vapor pressure and a greater moisture gradient between the interior of the material and the surrounding environment, which promotes water diffusion during drying [16]. In this context, the kinetic constant k can be interpreted as a lumped parameter associated with the effective moisture transfer rate within the material. Its increase with temperature reflects enhanced molecular mobility and reduced internal resistance to mass transfer. The temperature dependence of k followed an Arrhenius-type relationship, yielding an activation energy of approximately 44 kJ/mol, which is consistent with values reported for moisture diffusion in plant-based matrices [11,32]. On the other hand, the exponent (n) decreased slightly, suggesting that the dominant drying mechanism remained constant across the entire range evaluated, likely governed by internal diffusion, with possible minor contributions from structural changes in the plant tissue, such as cell collapse or increased porosity [31]. As for the term (b) remained negative and of small magnitude, indicating a minor linear correction without affecting the model’s ability to capture the curvature of the process. Taken together, these results confirm that increasing the vacuum drying temperature accelerates moisture removal, not only shortening the total drying time but also intensifying the driving forces of mass transport within the material. Taken together, these results support the selection of Weibull and Midilli–Kucuk as the most appropriate models for describing and predicting the vacuum drying kinetics of cauliflower under the conditions evaluated.
3.3. Effect on Physicochemical Properties
Table 3 shows the mean values and standard deviations of the proximate composition analysis and water activity of cauliflower florets subjected to vacuum drying at different temperatures (40, 50, 60, 70, and 80 °C) as compared to freeze-drying (FD) process. The proximate composition values are like those described in the literature [3,20]. The results showed that drying temperature significantly affected (p < 0.05) most physicochemical parameters evaluated, highlighting the importance of selecting appropriate process conditions to preserve the nutritional quality of the final product. The moisture content showed statistically significant differences between the treatments evaluated. Freeze-dried cauliflower had the lowest moisture content (7.09 ± 0.19 g/100 g), while the samples subjected to vacuum drying at 40, 50, and 60 °C exhibited the highest values (13.82 ± 0.22, 13.52 ± 0.51, and 13.36 ± 0.18 g/100 g, respectively), with no significant differences among the five treatments. As the drying temperature increased to 70 and 80 °C, the moisture content decreased progressively, showing significant differences with the other samples.
Table 3.
Moisture content, water activity and proximate composition analysis of vacuum-dried cauliflower at different temperatures.
Similarly, water activity (aw) differed significantly among all treatments (p < 0.05), ranging from 0.2092 to 0.4684, and showed a progressive decline as the drying temperature increased. This trend reflects the well-established direct relationship between moisture content and water activity in food systems, where aw represents the fraction of free, unbound water available for chemical, enzymatic, and microbiological reactions [33]. In terms of microbiological stability, the aw values obtained in all treatments (aw < 0.47) fall within a range characteristic of dehydrated foods with high stability, as these values are below the minimum required for the growth (aw < 0.60) of most spoilage and pathogenic microorganisms. Therefore, under appropriate storage conditions, these samples present a low risk of microbial growth [34].
Fat content showed significant variations (p < 0.05) among treatments. The vacuum-dried sample at 60 °C obtained the highest fat content (2.67 ± 0.03 g/100 g d.m.), followed by freeze-dried cauliflower (2.30 ± 0.07 g/100 g d.m.) and the samples dried at 40 and 80 °C. The lowest content was observed at 70 °C. These fluctuations may be related to fat oxidation processes that occur during heat treatment, as well as to the formation of fat-protein or fat-carbohydrate complexes that affect the extractability of fats using the Soxhlet method [35]. Additionally, intermediate temperatures could favor the release of fats structurally bound to cell membranes, increasing their availability for extraction.
The analysis of ash content revealed no significant differences (p > 0.05) among most treatments, with values ranging from 9.59 ± 0.88 g/100 g d.m. (FD) to 10.85 ± 0.47 g/100 g d.m. (70 °C). This behavior was expected, since ash is the inorganic residue of the matrix and is thermostable, degrading only slightly at the drying temperatures used. Consistent with this, Khaled et al. [36] reported that the increase in ash content after drying is mainly explained by the low vaporization capacity of minerals, which is not affected by heating, and by the concentration effect associated with water removal during the process. The consistency in ash content across treatments indicates that the cauliflower mineral profile remains relatively stable regardless of the dehydration method, which is favorable from a nutritional perspective.
The crude protein content showed statistically significant differences among treatments (p < 0.05). The highest values were obtained in samples vacuum-dried at 70 °C (27.82 ± 0.80 g/100 g d.m.) and 40 °C (26.97 ± 1.27 g/100 g d.m.), while the lowest content was recorded at 80 °C (17.23 ± 0.49 g/100 g d.m.). The pronounced decrease in protein content at 80 °C can be attributed to denaturation or changes in solubility during drying [37]. Treatments at moderate temperatures (40–70 °C) allowed protein levels comparable to or higher than freeze-drying to be retained, suggesting that vacuum drying under these conditions can adequately preserve the protein nutritional value of the product.
The variation in crude fiber content in the vacuum-dehydrated samples ranged from 7.28 ± 0.72 g/100 g d.m. (80 °C) and 12.76 ± 0.44 g/100 g d.m. (60 °C). This slight variation can be explained by the low heat sensitivity of the structural components of dietary fiber (cellulose, hemicellulose, and lignin), especially when process temperatures are kept below their thermal decomposition points, which generally exceed 170 °C [38].
The results of the proximate analysis and water activity demonstrate that vacuum drying temperature is a critical factor in determining the physicochemical quality of the final product. Although freeze-drying achieved the lowest moisture and aw, vacuum drying at 60–70 °C was found to be a favorable process condition, as it preserved higher protein levels while maintaining aw values compatible with microbiological stability. In contrast, temperatures > 70 °C further reduce moisture but also markedly decrease protein content, limiting their applicability for preserving nutritional value.
3.4. Effect on Color Parameters
Table 4 shows the colorimetric parameters (L*, a*, b*, ΔE, h°, and C*), as well as the browning index (BI) and whiteness index (WI) of cauliflower florets subjected to vacuum drying at different temperatures (40, 50, 60, 70, and 80 °C) compared to freeze drying (FD). Color is a determining quality attribute for consumer acceptance, and, at the same time, a sensitive indicator of chemical and microstructural changes induced by thermal processing. In this study, drying temperature had a significant effect on all colorimetric parameters evaluated, highlighting that precise temperature adjustment is crucial for maintaining color stability and reducing visual alterations associated with drying.
Table 4.
Color parameters, browning index (BI) and whitening index (WI) evaluation of vacuum-dried cauliflower at different temperatures.
The L* parameter, which quantifies product brightness or lightness on a scale from 0 (black) to 100 (white), exhibited statistically significant differences (p < 0.05) across all treatments. In the case of vacuum drying treatments, the samples treated at 50 °C had the highest brightness (78.51 ± 0.46), followed by the samples dried at 60 °C and 40 °C, while temperatures of 70 and 80 °C resulted in the lowest values (74.69 ± 0.44 and 75.48 ± 0.31, respectively). The progressive decline in brightness with increasing drying temperature is attributed to intensified non-enzymatic browning reactions, particularly the Maillard reaction and sugar caramelization, which are known to generate dark-colored compounds during thermal processing [39,40].
At elevated temperatures, amino groups from amino acids and proteins react with reducing sugars, producing high molecular weight melanoidins that impart brown coloration and diminish surface brightness [39]. This reduction in L* aligns with previous findings in cauliflower, which indicate that browning increases proportionally with the intensity of heat treatment [29]. Freeze-drying removes water through sublimation under low temperature and pressure, preventing heat-induced damage and browning, and preserving the original color of plant tissue, as evidenced by its higher L* values. However, this method is associated with substantially higher energy consumption and operating costs compared to vacuum drying [41].
The a* parameter, which measures the shift from green (negative values) to red (positive values), varied significantly between treatments (p < 0.05). The freeze-dried sample had the lowest value (−1.86 ± 0.05), showing a greenish color typical of fresh plant tissue. In comparison, vacuum-dried samples tended to have higher, positive values, especially at 80 °C (2.45 ± 0.20) and 70 °C (2.13 ± 0.22). At 50 °C and 60 °C, the values stayed near zero. Higher a* values at elevated temperatures suggest the formation of brown-reddish pigments, which are linked to advanced Maillard reaction products and the breakdown of chlorophylls. When heated, chlorophylls lose their central magnesium atom and turn into pheophytins, causing a brownish-green color that becomes brown as degradation continues [42].
The b* parameter, which represents the transition from blue (negative values) to yellow (positive values), showed significant differences (p < 0.05) between all treatments. Vacuum-dried samples showed significant increases compared to the freeze-dried sample, reaching maximum value at 80 °C (25.96 ± 0.26). This significant increase in b* indicates an accentuation of yellow tones during drying, which is characteristic of non-enzymatic browning processes and oxidation of phenolic compounds [43].
The total color difference (ΔE), calculated with respect to the freeze-dried sample as the reference and quantifying the overall magnitude of the perceived color change, is presented in Table 4. ΔE values varied significantly (p < 0.05) among vacuum drying treatments, ranging from 15.92 to 20.55. According to the criteria established in the literature, ΔE values greater than 3 are clearly perceptible to the human eye, while values less than 1 are imperceptible [44]. In the present study, all vacuum drying treatments produced substantially perceptible color changes, indicating a significant alteration in the visual appearance of the product. The lowest ΔE value was obtained at 60 °C, indicating that this temperature presented the least color change. Prolonged drying times increase cumulative thermal exposure, promoting extensive browning reactions. At higher temperatures, the increased thermal intensity further accelerates Maillard reactions and pigment degradation. These results are consistent with previous studies on dehydrated vegetables, where both exposure time and temperature have been shown to be determining factors in browning [20,39,45].
The hue angle (h°), expressed in degrees, describes the dominant color (0° red, 90° yellow, 180° green, and 270° blue). In this study, h* ranged from 84.62° (80 °C) to 98.97° (FD), with intermediate values for the other treatments. The h* values of the vacuum-dried samples remained close to 90°, indicating a dominant yellow hue. Although significant differences were observed (p < 0.05), the variation was narrow, suggesting subtle and potentially imperceptible changes in hue. In contrast, chroma (C*), associated with color saturation or intensity, showed marked differences (p < 0.05). The freeze-dried cauliflower sample had the lowest value (11.91 ± 0.12), showing a more desaturated color, while the vacuum-dried samples exhibited substantially higher values (Table 4), indicating more intense colors. This increase in C may be related to darkening (lower L*) due to the concentration and formation of chromophores during browning, which intensify the saturation of the resulting hue. Consequently, the combination of high C* and reduced L* is consistent with the generation of more intense brown hues as thermal processing increases.
The browning index (BI) allowed us to summarize the color changes associated with non-enzymatic browning during drying, reflecting the accumulation of brown pigments mainly linked to the Maillard reaction, along with contributions from caramelization and oxidation of phenolic compounds [40,46]. The BI showed significant differences between treatments (p < 0.05) (Table 4), with the freeze-dried sample showing the lowest values, while in vacuum drying, an increase in BI was observed with temperature, reaching maximum values at 70–80 °C. This trend is consistent with the intensification of thermally dependent reactions and their acceleration as the process progresses, especially at low water activity towards the end of drying [40].
The whiteness index (WI), used to evaluate the degree of darkening in naturally light matrices, also showed significant differences between treatments (p < 0.05) (Table 4). The freeze-dried sample had the highest WI, while vacuum drying showed a progressive decrease in WI with increasing temperature, with minimums at 70–80 °C. The reduction in WI is mainly associated with a decrease in L* and an increase in yellow tones (b*), consistent with the progression of browning and the formation of yellowish-brown chromophores [40].
Overall, BI and WI showed opposite and complementary trends, confirming that more severe drying conditions promote browning and loss of whiteness. The simultaneous evaluation of both indices facilitates a more integrated interpretation of color deterioration and provides a useful criterion for optimizing drying conditions.
In terms of product acceptability, the results clearly show that vacuum drying produces more noticeable color changes than freeze-drying. For example, the ΔE values obtained in all vacuum drying treatments far exceed the ΔE > 3 threshold, beyond which color differences are clearly perceptible to the human eye [44]. However, the practical relevance of these differences must be interpreted considering the product’s intended end use. When cauliflower powder is incorporated as a functional ingredient in food formulations, such as soups, sauces, baked goods, or nutritional supplements, the color of the powder in its dry state is not necessarily the decisive quality attribute for the end consumer, since the appearance of the finished product depends on multiple ingredients [39]. In this context, the treatment at 60 °C, which exhibited the lowest ΔE (15.92) and the most moderate browning index (BI = 33.38), represents the vacuum drying condition with the least relative visual deterioration and is therefore the most recommended when the color of the powder is a priority attribute. Likewise, in applications where stricter color acceptability is required, complementary strategies such as optimized blanching, antioxidant pretreatment, or modified atmospheres during drying could help reduce browning without compromising process efficiency [29,39,45].
Comprehensive colorimetric analysis showed that vacuum drying temperature is the main factor controlling color deterioration in cauliflower florets, with 50–60 °C recommended as the most suitable range for balancing visual quality and process efficiency, while higher temperatures intensify browning. Although freeze-drying preserves color better, its higher costs justify optimizing vacuum drying through strategies such as pretreatments and/or online color monitoring, also considering its relationship with other quality attributes (bioactive compounds and antioxidant potential).
3.5. Effect on Phenols, Flavonoids and Glucosinolates
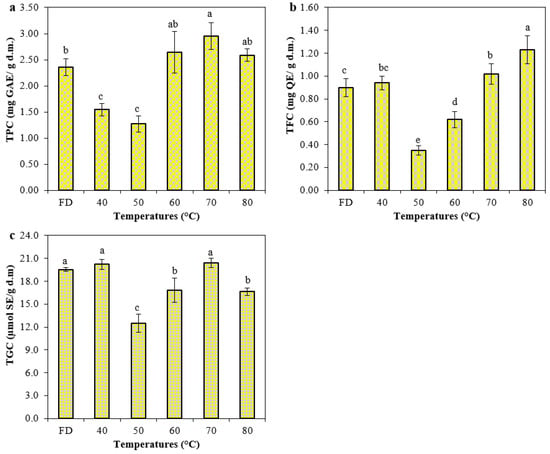
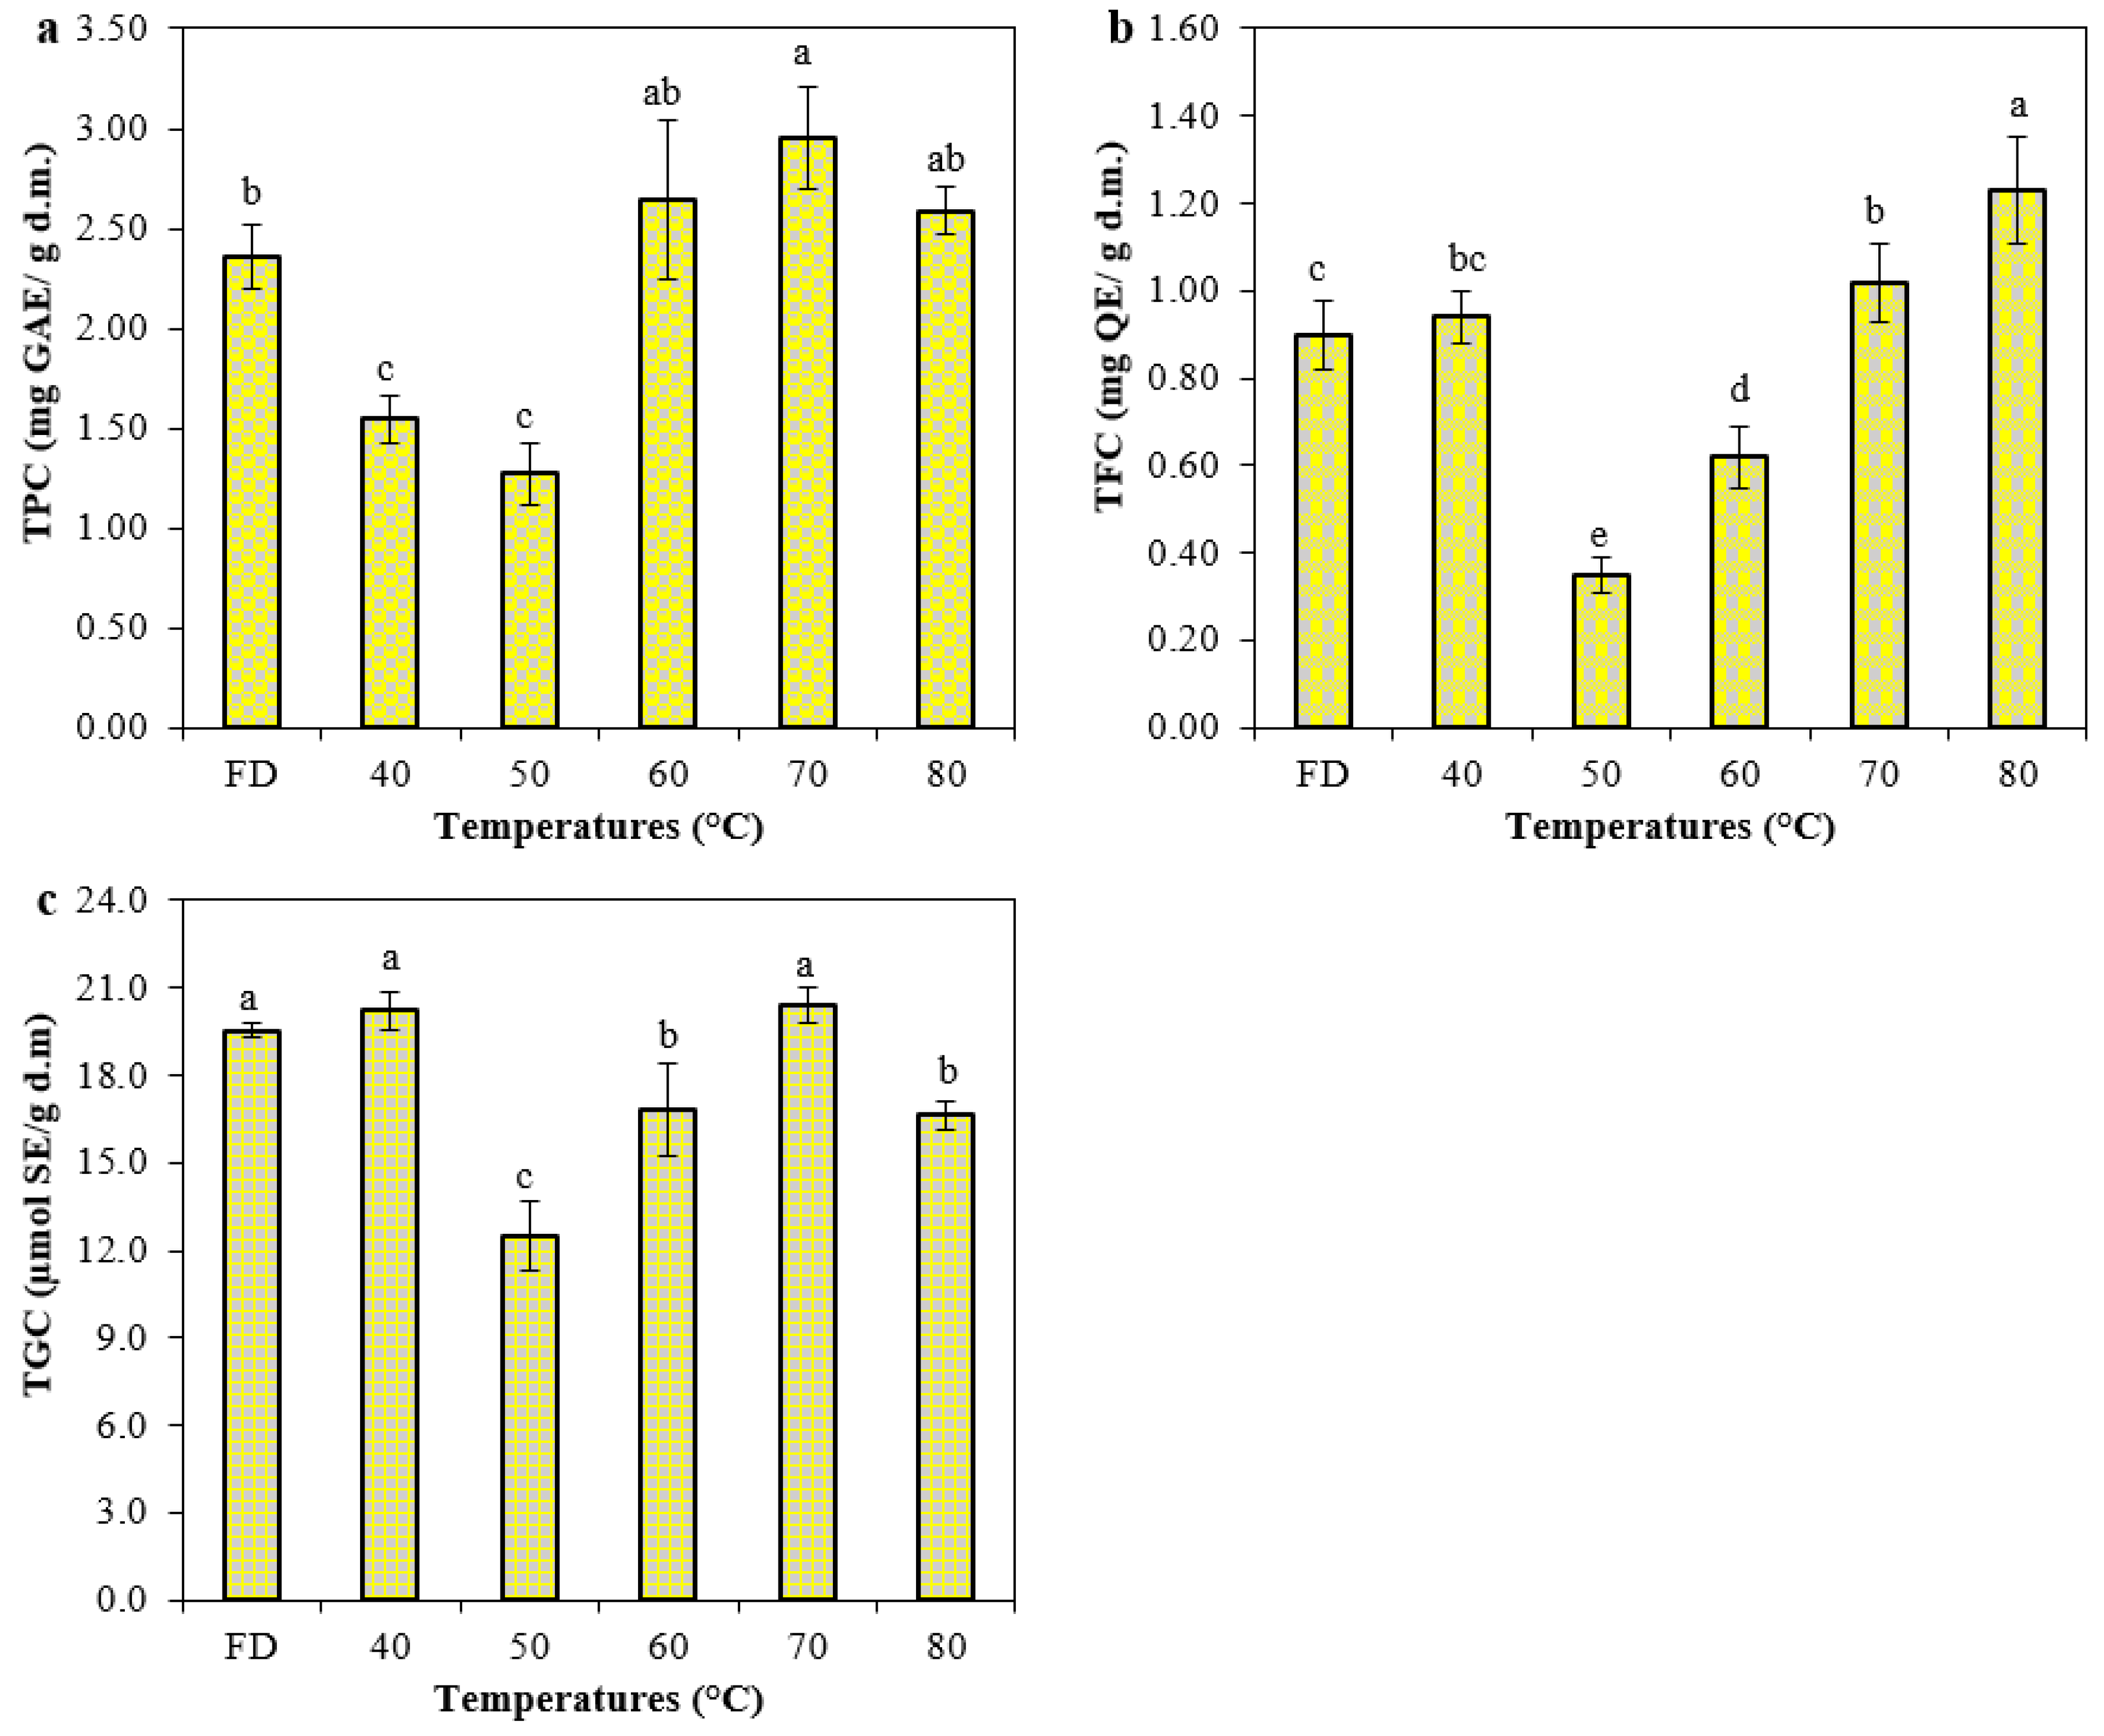
The analysis of bioactive compounds in cauliflower florets dehydrated by vacuum drying at different temperatures (40, 50, 60, 70, and 80 °C) and freeze-drying are presented in Figure 3, showing significant differences (p < 0.05) in the retention of total phenolic content (TPC), total flavonoid content (TFC), and total glucosinolate content (TGC). The results obtained for these three groups of secondary metabolites are important, as their preservation is essential for maintaining the functional properties and nutritional value of the dehydrated product.
Figure 3.
Bioactive compounds obtained from vacuum-dried cauliflower under different temperatures: (a) Total Phenolic Content (TPC); (b) Total Flavonoid Content (TFC) and (c) Total Glucosinolates Content (TGC). The bars represent the mean values, while the error bars depict the standard deviation. On the bars, different letters denote a significant difference at a 95% confidence level (p < 0.05), while identical letters indicate no significant difference. Standard deviation was calculated on three replicates. GAE: Gallic acid equivalent; QE: Quercetin equivalent; SE: Sinigrin equivalent.
It is important to note that the blanching treatment applied prior to drying may have significantly influenced the initial composition of the bioactive compounds. Heat treatments, such as blanching, are known to inactivate key enzymes, including polyphenol oxidase (PPO) and myrosinase, thereby reducing enzymatic degradation of phenolic compounds and glucosinolates [47,48]. However, blanching process can also promote the leaching and thermal degradation of water-soluble and heat-labile compounds, leading to partial losses prior to the drying process [46,49]. In this regard, recent studies have reported that blanching with hot water, especially for prolonged periods, can significantly reduce the content of total phenolic compounds due to thermal degradation and the leaching of polyphenolic compounds into the aqueous medium. Likewise, the softening of cell walls during this process may promote the release and diffusion of these compounds [50]. Consequently, the variations observed in phenolic compounds, flavonoids, and glucosinolates cannot be attributed exclusively to the drying process, but rather to the combined effect of blanching and drying [47,48,49]. However, since all samples were subjected to the same blanching conditions, the comparative analysis among the drying treatments remains valid.
Phenolic compounds, which include phenolic acids, flavonoids, and tannins, constitute one of the most important groups of secondary metabolites in cruciferous vegetables, contributing significantly to their antioxidant capacity and health-promoting properties [51]. As shown in Figure 3a, TPC exhibited a drying-temperature-dependent trend, with statistically significant differences among the treatments.
The highest TPC was recorded in samples vacuum-dehydrated at 70 °C, reaching 2.95 mg GAE/g d.m., whereas significantly lower values were observed in samples processed at 40 °C. The differences observed between treatments suggest that the drying temperature has a pronounced effect on the retention and/or release of phenolic compounds in the cauliflower plant matrix. The low TPC observed in samples dried at 40 °C can be attributed to the prolonged thermal exposure required to reach equilibrium moisture content at this temperature. During this extended period, the enzyme polyphenol oxidase (PPO), responsible for the enzymatic oxidation of phenolic compounds, remains stable and metabolically active, catalyzing the conversion of phenols into quinones and other oxidation products of lower biological activity [49]. In contrast, high drying temperatures (70 and 80 °C) promoted greater TPC retention. This behavior can be explained by several mechanisms, one of which is that high temperatures cause rapid inactivation of PPO [47], another is that intense heating induces structural changes in the cell matrix, facilitating the release of phenolic compounds bound to structural polysaccharides [52] and/or that the increase in temperature significantly shortens the drying time, reducing the total thermal exposure of the product and, therefore, the cumulative deterioration associated with the process [53].
Flavonoids are a specific subgroup of phenolic compounds characterized by a basic diphenylpropane (C6-C3-C6) structure [54]. Figure 3b shows the total flavonoid content (TFC) in cauliflower florets subjected to different dehydration treatments, with samples dehydrated under vacuum at 80 °C having the significantly highest value (1.23 mg QE/m d.m.).
This higher retention of flavonoids at elevated drying temperatures can be attributed, in part, to the fact that high temperatures markedly reduce drying time, minimizing total thermal degradation and, therefore, the cumulative degradation of heat-sensitive compounds [53]. Furthermore, in addition to reducing degradation, heating can induce microstructural changes in the plant matrix (e.g., cell wall disruption) that favor the release of bound flavonoids and/or the transformation of less extractable fractions into forms more available for extraction [55].
Glucosinolates are secondary metabolites characteristic of cruciferous plants [56] whose content and stability during processing depend on both enzymatic transformations and thermal degradation [57]. The TGC results are presented in Figure 3c, showing a trend comparable to that observed for TPC and TFC, with a significant decrease in glucosinolate content at 50 °C and greater retention at 40 °C and 70 °C, with values of 20.42 and 20.21 µmol SE/g d.m., respectively. The high retention at 70 °C can be attributed mainly to two concurrent factors: (i) faster inactivation of myrosinase and (ii) a marked decrease in drying time, which reduces the time window for glucosinolate hydrolysis/transformation during the process [57]. In the case of 40 °C, the high retention is consistent with lower thermal severity (less direct thermal degradation of glucosinolates); however, this result should be interpreted considering that, in Brassica, changes in glucosinolates and their products may be non-linear or irregular due to the complexity of conversion pathways during dehydration [58]. Conversely, the low TGC at 50 °C suggests an unfavorable scenario in which the temperature may not ensure complete and early inactivation of myrosinase, while the process maintains relatively long times, favoring losses due to hydrolysis and bioconversion pathways during drying [57,58]. Finally, freeze-drying showed appreciable retention, consistent with the use of low temperatures and pressure, conditions commonly associated with better preservation of bioactive compounds in Brassica matrices [49].
3.6. Effect on Antioxidant Potential
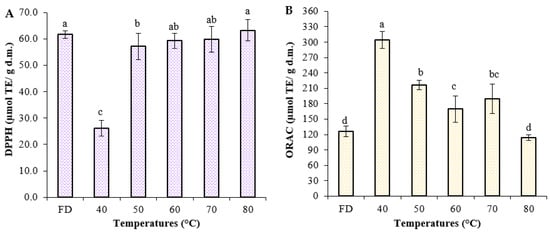
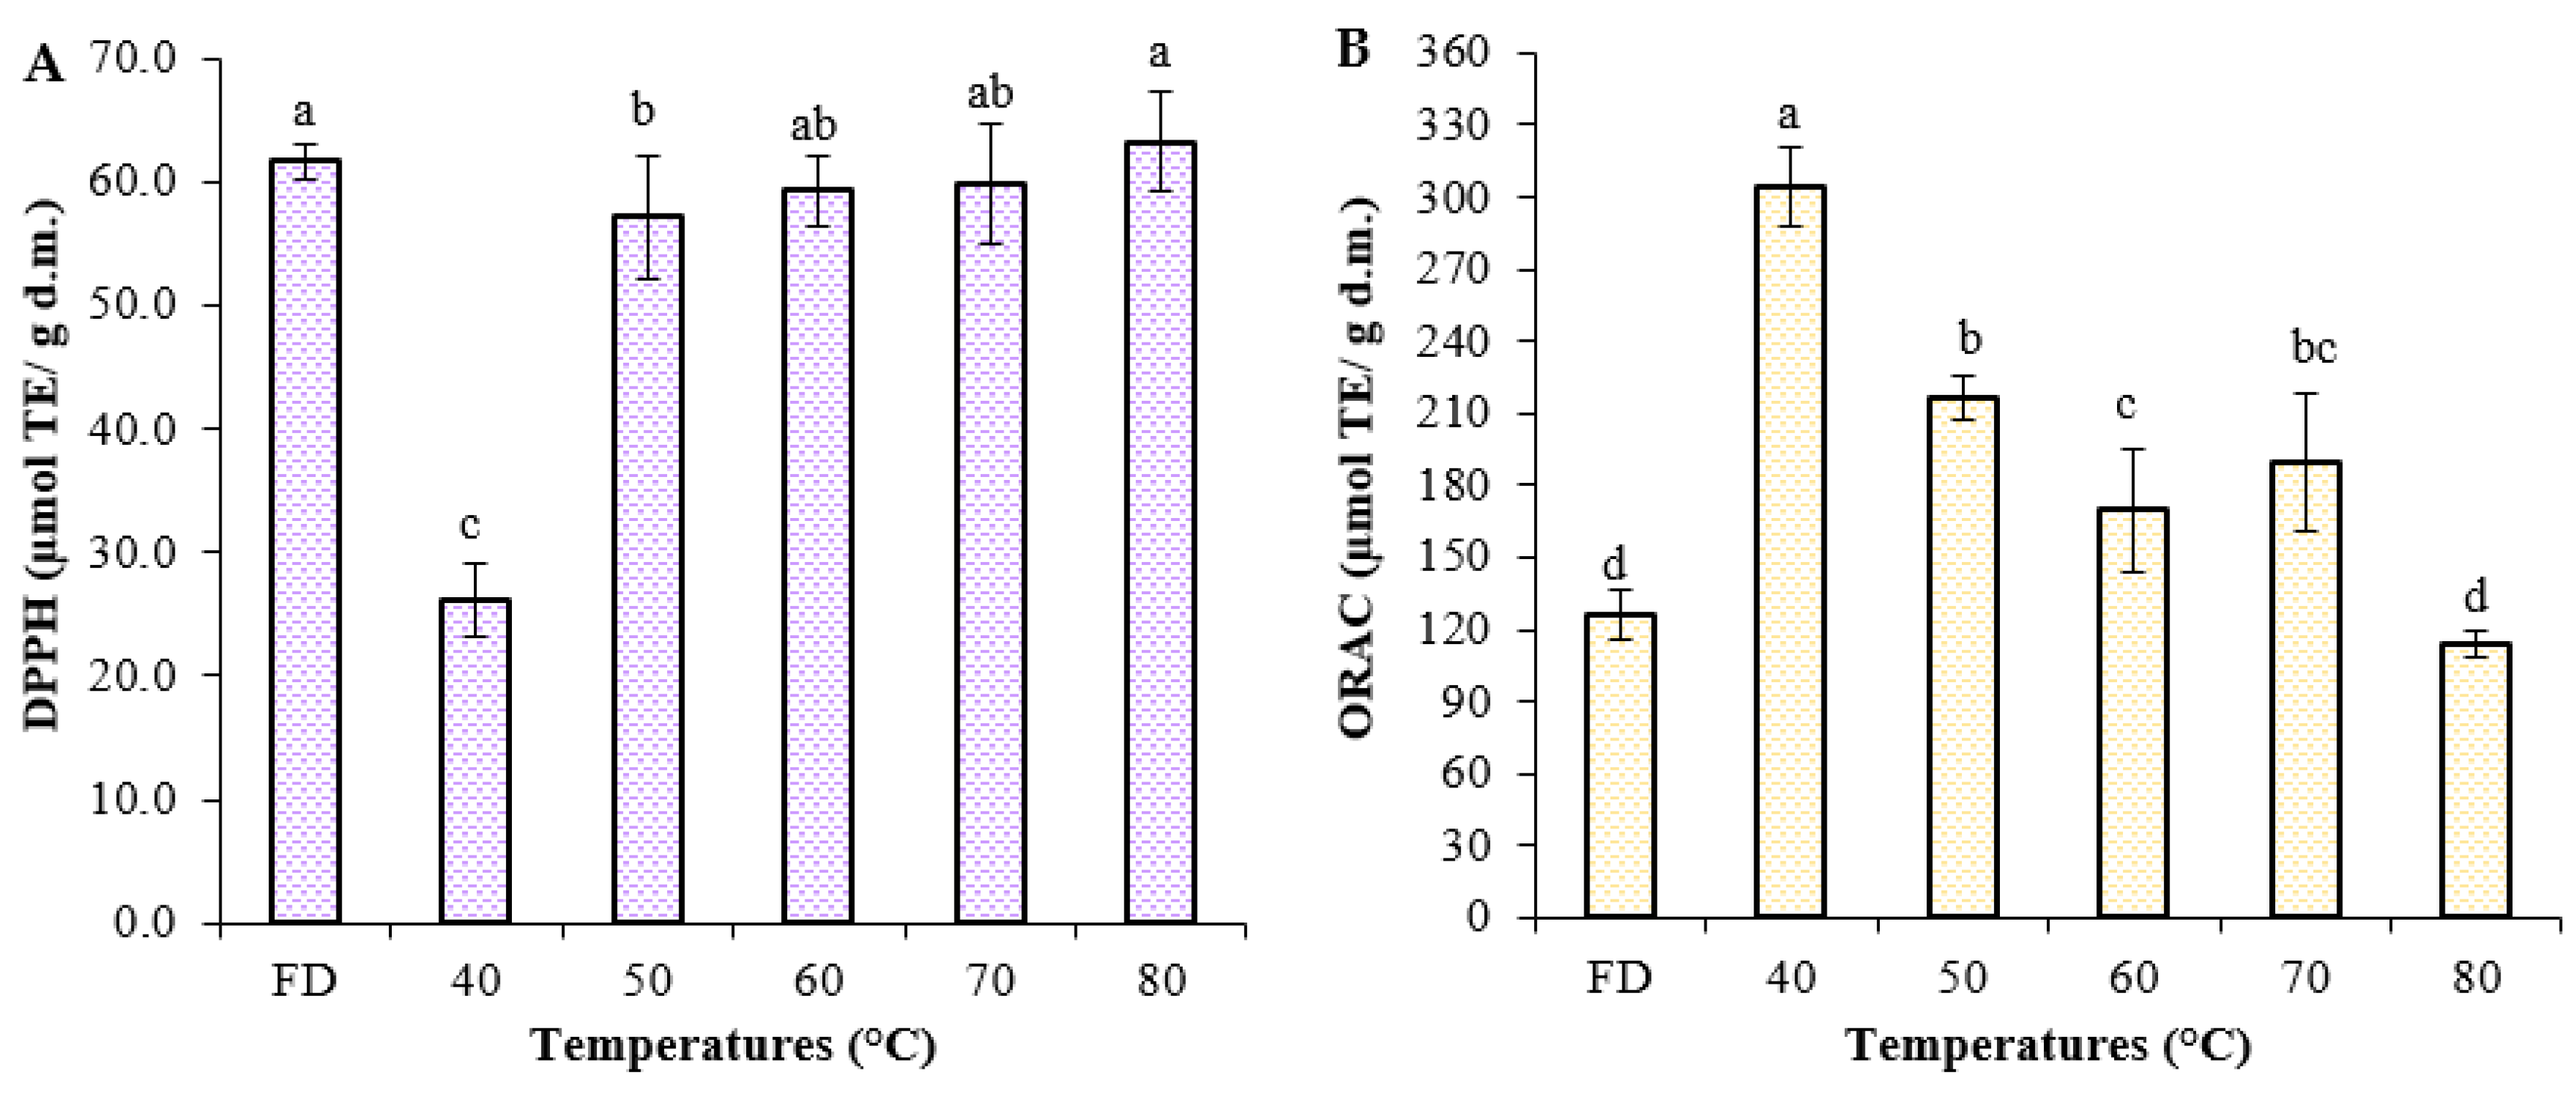
The antioxidant potential of foods is a fundamental parameter for evaluating their functional potential and health-promoting effects. This property depends on multiple interrelated factors, including the composition and concentration of present antioxidants, processing conditions (temperature, oxygen pressure, exposure time, etc.), and synergistic or antagonistic interactions between different food components such as proteins, lipids, and water [59]. In the present study, the antioxidant potential of cauliflower florets dehydrated by vacuum drying at different temperatures (40, 50, 60, 70, and 80 °C) and freeze-drying was evaluated using two complementary assays, the DPPH assay to measure free radical scavenging capacity, and the ORAC assay to determine antioxidant activity against reactive oxygen species. The results are presented in Figure 4.
Figure 4.
Antioxidant potential obtained from vacuum-dried cauliflower under different temperatures: (A) 2,2-diphenyl-1-picryl-hydrazyl (DPPH) and (B) Oxygen Radical Absorbance Capacity (ORAC) assays. The bars represent the mean values, while the error bars depict the standard deviation. On the bars, different letters denote a significant difference at a 95% confidence level (p < 0.05), while identical letters indicate no significant difference. Standard deviation was calculated on three replicates. TE: Trolox equivalent.
The results obtained using the DPPH assay, presented in Figure 4A, revealed that most vacuum-dehydrated samples showed no statistically significant differences in antioxidant capacity, except for the sample dried at 40 °C. During this test, free radicals are neutralized by antioxidant molecules, and the ability of the extracts to eliminate DPPH radicals is measured [60]. The sample vacuum-dried at 40 °C exhibited the lowest antioxidant capacity (26.19 µmol TE/g d.m.), which can be attributed to the fact that long drying times prolong the product’s permanence in water activity ranges where molecular mobility still exists, and the activity of oxidative enzymes can persist, favoring oxidative reactions (enzymatic and non-enzymatic). Consequently, oxidative damage can accumulate and contribute to lower retention of antioxidant compounds and/or a decrease in antioxidant capacity as measured by DPPH [61].
On the other hand, the oxygen radical absorbance capacity (ORAC) values of the treated samples are shown in Figure 4B. In contrast to DPPH, the ORAC values showed a decreasing trend with increasing vacuum-drying temperature, with a maximum at 40 °C and a minimum at 80 °C (Figure 4B). This opposite trend between ORAC and DPPH is explained by the fact that the two tests measure different things. The ORAC test primarily quantifies the chain-breaking capacity against peroxyl radicals via a hydrogen atom transfer (HAT) mechanism, whereas DPPH predominantly serves as an electron transfer (ET) test with a synthetic radical whose reactivity depends on steric accessibility and environmental conditions. Consequently, drying may favor the formation/transformation of compounds with greater reducing capacity (as reflected in DPPH) and, simultaneously, decrease antioxidants that are more effective against peroxyl radicals (as reflected in ORAC), leading to divergent responses between the two methods [62]. Zheng et al. [63] explains that some antioxidants can act effectively by one mechanism but not the other, depending on their chemical structure. Therefore, the difference in antioxidant potential between the two tests also reflects a difference in the types of compounds generated under each condition, since ET and HAT can involve different types of antioxidant compounds depending on their structural properties.
In this context, these mechanistic differences take on particular significance when considering the impact of processing conditions on the antioxidant profile of the samples. Vacuum drying at high temperatures (70–80 °C) promotes greater extraction or release of phenols and flavonoids—compounds that are more effective in the ET mechanism—while simultaneously favoring the thermal degradation of heat-labile antioxidants that contribute significantly to the HAT mechanism, primarily ascorbic acid and carotenoids [53,63]. Although these compounds were not directly quantified in the present study, this interpretation remains inferential and is supported by evidence reported in the literature.
In fact, the optimal temperature for the retention of ascorbic acid in vegetables is generally between 40 and 60 °C; above this temperature, its oxidation and irreversible hydrolysis accelerate [53]. Similarly, carotenoids have relatively low degradation activation energies, making them susceptible to thermolysis and isomerization during drying at temperatures above 60 °C [64]. Consequently, the increase in TPC and TFC observed at higher temperatures does not necessarily translate into greater overall antioxidant activity as measured by ORAC, given that the compounds primarily quantified by this assay (ascorbic acid and carotenoids) are compromised under more severe thermal conditions. This behavior underscores the importance of using complementary methods to evaluate the antioxidant potential of dehydrated plant matrices, since no single assay comprehensively captures the complexity of the interactions between the different groups of bioactive compounds and the antioxidant mechanisms involved [59,62].
The integrated analysis of DPPH/ORAC with TPC, TFC, and TGC shows that antioxidant potential is not always linearly related to the total concentration of bioactive compounds, due to differential contributions from compounds and the specific nature of each assay [18]. In Figure 3, TPC and TFC showed the highest values at 70 and 80 °C, which can be attributed to greater release of phenolic compounds and a lower activity of oxidative enzymes under more severe conditions [18]. However, these same samples presented the lowest antioxidant potential as measured by the ORAC assay, suggesting a preferential loss of thermolabile antioxidants with a high contribution to the neutralization of reactive oxygen species, such as ascorbic acid and carotenoids, which significantly compromised the overall protective capacity against reactive oxygen species [18,58]. However, it should be noted that neither ascorbic acid nor carotenoids were directly measured in this study; therefore, this explanation remains inferential and is based on their well-documented thermal sensitivity, as discussed above.
4. Conclusions
Vacuum drying of cauliflower florets showed exponential moisture decay, reducing the process time from 15 h (40 °C) to 7 h (80 °C). An increase in temperature decreased moisture and water activity, but intensified color deterioration and reduced protein content. The retention of bioactive compounds was temperature-dependent, with phenolic compounds (TPC and TFC) showing the highest values at the highest temperatures, while glucosinolates were better preserved at 60–70 °C. Additionally, DPPH-based antioxidant capacity remained stable between 50 and 80 °C, whereas ORAC values decreased progressively with increasing temperature. Overall, under the conditions of the present study, 60–70 °C was identified as the most suitable window for balancing drying efficiency and functional quality in the production of cauliflower powder, and the validated models are useful tools for process optimization and scaling. This recommendation is based on a systematic evaluation of the positive and negative effects observed across the range of the temperatures studied. On the one hand, the results indicate that the 60–70 °C range offers the best balance between process efficiency and product quality. This temperature range allows for adequate reduction in moisture and water activity. It promotes enzyme inactivation and preserves bioactive compounds, while also requiring a shorter drying time. In contrast, higher temperatures intensify browning and degrade antioxidants and proteins. In addition, lower temperatures preserve heat-labile compounds but require prolonged times, which negatively affect oxidative stability. Future works should assess whether the higher retention achieved at 60–70 °C results in improved biological functionality by measuring bioaccessibility and bioactivities after simulated gastrointestinal digestion and/or cell-based assays, with particular attention paid to glucosinolate hydrolysis and isothiocyanate formation.
Author Contributions
Supervision, Validation, E.U.; Writing—review and editing, J.L.; Conceptualization, Project administration, Resources, Funding acquisition, A.V.-G.; Investigation, Formal Analysis, N.M.; Formal Analysis, P.H.; Investigation, Data curation, A.P. All authors have read and agreed to the published version of the manuscript.
Funding
This research was supported by the National Agency of Research and Development, ANID-Chile, through funds provided to the Project FONDECYT 1210124.
Data Availability Statement
The datasets generated for this study are available on request to the corresponding author.
Acknowledgments
Antonio Vega-Galvez acknowledges the financial support of DIDULS/ULS through the funding No. ADI2553852.
Conflicts of Interest
The authors declare that they have no known competing financial interests or personal relationships that could have appeared to influence the work reported in this paper.
References
- Ishida, M.; Hara, M.; Fukino, N.; Kakizaki, T.; Morimitsu, Y. Glucosinolate Metabolism, Functionality and Breeding for the Improvement of Brassicaceae Vegetables. Breed. Sci. 2014, 64, 48–59. [Google Scholar] [CrossRef] [Scilit] [PubMed]
- Nartea, A.; Fanesi, B.; Pacetti, D.; Lenti, L.; Fiorini, D.; Lucci, P.; Frega, N.G.; Falcone, P.M. Cauliflower By-Products as Functional Ingredient in Bakery Foods: Fortification of Pizza with Glucosinolates, Carotenoids and Phytosterols. Curr. Res. Food Sci. 2023, 6, 100437. [Google Scholar] [CrossRef] [Scilit] [PubMed]
- Ahmed, F.A.; Ali, R.F.M. Bioactive Compounds and Antioxidant Activity of Fresh and Processed White Cauliflower. Biomed. Res. Int. 2013, 2013, 367819. [Google Scholar] [CrossRef] [Scilit]
- Kapusta-Duch, J.; Szelag-Sikora, A.; Sikora, J.; Niemiec, M.; Gródek-Szostak, Z.; Kuboń, M.; Leszczyńska, T.; Borczak, B. Health-Promoting Properties of Fresh and Processed Purple Cauliflower. Sustainability 2019, 11, 4008. [Google Scholar] [CrossRef] [Scilit]
- Quintin, D.; Garcia-Gomez, P.; Ayuso, M.; Sanmartin, A.M. Active Biocompounds to Improve Food Nutritional Value. Trends Food Sci. Technol. 2019, 84, 19–21. [Google Scholar] [CrossRef] [Scilit]
- Mohi Alden, K.; Omid, M.; Rajabipour, A.; Tajeddin, B.; Soltani Firouz, M. Quality and Shelf-Life Prediction of Cauliflower under Modified Atmosphere Packaging by Using Artificial Neural Networks and Image Processing. Comput. Electron. Agric. 2019, 163, 104861. [Google Scholar] [CrossRef] [Scilit]
- Moses, J.A.; Norton, T.; Alagusundaram, K.; Tiwari, B.K. Novel Drying Techniques for the Food Industry. Food Eng. Rev. 2014, 6, 43–55. [Google Scholar] [CrossRef] [Scilit]
- Belwal, T.; Cravotto, C.; Prieto, M.A.; Venskutonis, P.R.; Daglia, M.; Devkota, H.P.; Baldi, A.; Ezzat, S.M.; Gómez-Gómez, L.; Salama, M.M.; et al. Effects of Different Drying Techniques on the Quality and Bioactive Compounds of Plant-Based Products: A Critical Review on Current Trends. Dry. Technol. 2022, 40, 1539–1561. [Google Scholar] [CrossRef] [Scilit]
- Lee, J.H.; Kim, H.J. Vacuum Drying Kinetics of Asian White Radish (Raphanus sativus L.) Slices. LWT-Food Sci. Technol. 2009, 42, 180–186. [Google Scholar] [CrossRef] [Scilit]
- Mella, C.; Vega-Gálvez, A.; Uribe, E.; Pasten, A.; Mejias, N.; Quispe-Fuentes, I. Impact of Vacuum Drying on Drying Characteristics and Functional Properties of Beetroot (Beta vulgaris). Appl. Food Res. 2022, 2, 100120. [Google Scholar] [CrossRef] [Scilit]
- Neoh, Y.Y.; Matanjun, P.; Lee, J.S. Comparative Study of Drying Methods on Chemical Constituents of Malaysian Red Seaweed. Dry. Technol. 2016, 34, 1745–1751. [Google Scholar] [CrossRef] [Scilit]
- Xu, P.; Peng, X.; Yuan, T.; Yang, J.; Li, X.; Zhang, H.; Zhang, Y.; Zhang, Z.; Jia, X. Effect of Vacuum Drying on Drying Kinetics and Quality of the Aqueous Extracts of Callicarpa nudiflora Hook. et Arn. LWT 2021, 152, 112305. [Google Scholar] [CrossRef] [Scilit]
- Wu, L.; Orikasa, T.; Ogawa, Y.; Tagawa, A. Vacuum Drying Characteristics of Eggplants. J. Food Eng. 2007, 83, 422–429. [Google Scholar] [CrossRef] [Scilit]
- Wang, S.; Bi, Y.; Zhou, Z.; Peng, W.; Tian, W.; Wang, H.; Fang, X. Effects of Pulsed Vacuum Drying Temperature on Drying Kinetics, Physicochemical Properties and Microstructure of Bee Pollen. LWT-Food Sci. Technol. 2022, 169, 113966. [Google Scholar] [CrossRef] [Scilit]
- Paternina Contreras, A.; Salcedo Mendoza, J.; Contreras Lozano, K.; García Paternina, M. Characterization and Desorption Isotherm Modeling of Cassava bagasse (Manihot esculenta Crantz). Starch-Stärke 2017, 69, 1600020. [Google Scholar] [CrossRef] [Scilit]
- Sahin, M.; Doymaz, İ. Estimation of Cauliflower Mass Transfer Parameters during Convective Drying. Heat. Mass. Transf. 2017, 53, 507–517. [Google Scholar] [CrossRef] [Scilit]
- Tao, Y.; Wu, Y.; Yang, J.; Jiang, N.; Wang, Q.; Chu, D.T.; Han, Y.; Zhou, J. Thermodynamic Sorption Properties, Water Plasticizing Effect and Particle Characteristics of Blueberry Powders Produced from Juices, Fruits and Pomaces. Powder Technol. 2018, 323, 208–218. [Google Scholar] [CrossRef] [Scilit]
- AOAC. Official Methods of Analysis, 17th ed.; Association of Official Analytical Chemists: Rockville, MD, USA, 2000. [Google Scholar]
- Uribe, E.; Vega-Gálvez, A.; Vásquez, V.; Lemus-Mondaca, R.; Callejas, L.; Pastén, A. Hot-air drying characteristics and energetic requirement of the edible brown seaweed Durvillaea antarctica. J. Food Process Preserv. 2017, 41, e13313. [Google Scholar] [CrossRef] [Scilit]
- Pasten, A.; Vega-Galvez, A.; Uribe, E.; Carvajal, M.; Mejías, N.; Araya, M.; Goñi, M.G. A Comparison of the Effects of Low-Temperature Vacuum Drying and Other Methods on Cauliflower’s Nutritional–Functional Properties. Processes 2024, 12, 1629. [Google Scholar] [CrossRef] [Scilit]
- Mawlong, I.; Sujith Kumar, M.S.; Gurung, B.; Singh, K.H.; Singh, D. A Simple Spectrophotometric Method for Estimating Total Glucosinolates in Mustard De-Oiled Cake. Int. J. Food Prop. 2017, 20, 3274–3281. [Google Scholar] [CrossRef] [Scilit]
- Mejias, N.; Vega-Galvez, A.; Pasten, A.; Uribe, E.; Andrés, A.; Muñoz-Pina, S.; Khvostenko, K.; García-Segovia, P. Evaluating the Microstructure and Bioaccessibility of Bioactive Compounds and Antioxidant Activity After the Dehydration of Red Cabbage. Foods 2025, 14, 1932. [Google Scholar] [CrossRef] [Scilit]
- Grajeda-Iglesias, C.; Salas, E.; Barouh, N.; Baréa, B.; Panya, A.; Figueroa-Espinoza, M.C. Antioxidant Activity of Protocatechuates Evaluated by DPPH, ORAC, and CAT Methods. Food Chem. 2016, 194, 749–757. [Google Scholar] [CrossRef] [Scilit]
- Zhang, L.; Li, J.; Hogan, S.; Chung, H.; Welbaum, G.E.; Zhou, K. Inhibitory Effect of Raspberries on Starch Digestive Enzyme and Their Antioxidant Properties and Phenolic Composition. Food Chem. 2010, 119, 592–599. [Google Scholar] [CrossRef] [Scilit]
- Thommes, M.; Kaneko, K.; Neimark, A.V.; Olivier, J.P.; Rodriguez-Reinoso, F.; Rouquerol, J.; Sing, K.S.W. Physisorption of Gases, with Special Reference to the Evaluation of Surface Area and Pore Size Distribution (IUPAC Technical Report). Pure Appl. Chem. 2015, 87, 1051–1069. [Google Scholar] [CrossRef] [Scilit]
- Sobowale, S.S.; Oke, M.O.; Odunmbaku, L.A.; Adebo, O.A. Equilibrium Sorption Isotherms of Moringa oleifera Leaves at Different Temperatures. Afr. J. Sci. Innov. Dev. 2017, 9, 61–68. [Google Scholar] [CrossRef] [Scilit]
- Jmai, S.; Slimane, B.; Guiza, N.; Messaoudi, S.; Mohamed, S.E. Experimental and Modeling of Tomato Slices Sorption Isotherms and Thin Layer Drying Kinetics for a Solar Drying Plant Design. J. Chem. Chem. Eng. 2023, 42, 2587–2603. [Google Scholar]
- Sadeghi, M.; Mehryar, E.; Razavi, J.; Mireei, S.A. Moisture Sorption Isotherm and Glass Transition Temperature of Date Powder in Terms of Various Model Systems. J. Food Process Eng. 2016, 39, 61–68. [Google Scholar] [CrossRef] [Scilit]
- Gupta, M.K.; Sehgal, V.K.; Arora, S. Optimization of Drying Process Parameters for Cauliflower Drying. J. Food Sci. Technol. 2013, 50, 62–69. [Google Scholar] [CrossRef] [Scilit]
- López, J.; Uribe, E.; Vega-Gálvez, A.; Miranda, M.; Vergara, J.; Gonzalez, E.; Di Scala, K. Effect of Air Temperature on Drying Kinetics, Vitamin c, Antioxidant Activity, Total Phenolic Content, Non-Enzymatic Browning and Firmness of Blueberries Variety Óneil. Food Bioproc. Technol. 2010, 3, 772–777. [Google Scholar] [CrossRef] [Scilit]
- Corzo, O.; Bracho, N.; Pereira, A.; Vásquez, A. Weibull distribution for modeling air drying of coroba slices. LWT—Food Sci. Technol. 2008, 41, 2023–2028. [Google Scholar] [CrossRef] [Scilit]
- López, J.; Vega-Gálvez, A.; Rodríguez, A.; Uribe, E.; Díaz, P. Vacuum Drying of Chilean Murta (Ugni molinae Turcz) Berries: Effect of Temperature on Kinetic Parameters and Assessment of Energy Consumption. J. Food Process. Preserv. 2017, 41, e13162. [Google Scholar] [CrossRef] [Scilit]
- van Boekel, M.A.J.S. Moisture Content and Water Activity Relations in Honey: A Bayesian Multilevel Meta-Analysis. J. Food Compos. Anal. 2023, 123, 105595. [Google Scholar] [CrossRef] [Scilit]
- Lima, V.; Pinto, C.A.; Saraiva, J.A. The Dependence of Microbial Inactivation by Emergent Nonthermal Processing Technologies on pH and Water Activity. Innov. Food Sci. Emerg. Technol. 2023, 89, 103460. [Google Scholar] [CrossRef] [Scilit]
- Hewavitharana, G.G.; Perera, D.N.; Navaratne, S.B.; Wickramasinghe, I. Extraction Methods of Fat from Food Samples and Preparation of Fatty Acid Methyl Esters for Gas Chromatography: A Review. Arab. J. Chem. 2020, 13, 6865–6875. [Google Scholar] [CrossRef] [Scilit]
- Khaled, B.M.; Das, A.K.; Alam, S.M.S.; Saqib, N.; Rana, M.S.; Sweet, S.R.; Naznin, T.; Hossain, M.P.; Sardar, S.; Hossain, Z.; et al. Effect of Different Drying Techniques on the Physicochemical and Nutritional Properties of Moringa oleifera Leaves Powder and Their Application in Bakery Product. Appl. Food Res. 2024, 4, 100599. [Google Scholar] [CrossRef] [Scilit]
- Pramudita, D.; Humjaa, S.; Tsotsas, E. Droplet Drying and Whey Protein Denaturation in Pulsed Gas Flow—A Modeling Study. J. Food Eng. 2022, 321, 110959. [Google Scholar] [CrossRef] [Scilit]
- Apaydın Varol, E.; Mutlu, Ü. TGA-FTIR Analysis of Biomass Samples Based on the Thermal Decomposition Behavior of Hemicellulose, Cellulose, and Lignin. Energies 2023, 16, 3674. [Google Scholar] [CrossRef] [Scilit]
- Alamu, A.E.; Ade-Omowaye, B.I.O.; Akinwande, B.A.; Dudu, O.E.; Obori, F.O. Pigments and Colour Characteristics: Influence of Drying Methods on Nigerian Pepper (Capsicum frutescences). J. Agric. Food Res. 2023, 14, 100760. [Google Scholar] [CrossRef] [Scilit]
- El Hosry, L.; Elias, V.; Chamoun, V.; Halawi, M.; Cayot, P.; Nehme, A.; Bou-Maroun, E. Maillard Reaction: Mechanism, Influencing Parameters, Advantages, Disadvantages, and Food Industrial Applications: A Review. Foods 2025, 14, 1881. [Google Scholar] [CrossRef] [Scilit]
- Ratti, C. Hot Air and Freeze-Drying of High-Value Foods: A Review. J. Food Eng. 2001, 49, 311319. [Google Scholar] [CrossRef] [Scilit]
- Östbring, K.; Sjöholm, I.; Rayner, M.; Erlanson-Albertsson, C. Effects of Storage Conditions on Degradation of Chlorophyll and Emulsifying Capacity of Thylakoid Powders Produced by Different Drying Methods. Foods 2020, 9, 669. [Google Scholar] [CrossRef] [Scilit] [PubMed]
- Hu, Y.; Zeng, X.; Jiang, K.; Luo, Y.; Quan, Z.; Li, J.; Ma, Y.; Guo, X.; Zhou, D.; Zhu, B. Effect of Non-Enzymatic Browning on Oysters during Hot Air Drying Process: Color and Chemical Changes and Insights into Mechanisms. Food Chem. 2024, 454, 139758. [Google Scholar] [CrossRef] [Scilit] [PubMed]
- Managa, M.G.; Sultanbawa, Y.; Sivakumar, D. Effects of Different Drying Methods on Untargeted Phenolic Metabolites, and Antioxidant Activity in Chinese Cabbage (Brassica rapa L. Subsp. Chinensis) and Nightshade (Solanum retroflexum Dun.). Molecules 2020, 25, 1326. [Google Scholar] [CrossRef] [Scilit]
- Swain, S.; Samuel, D.V.K.; Bal, L.M.; Kar, A. Thermal Kinetics of Colour Degradation of Yellow Sweet Pepper (Capsicum annum L.) Undergoing Microwave Assisted Convective Drying. Int. J. Food Prop. 2014, 17, 1946–1964. [Google Scholar] [CrossRef] [Scilit]
- Nourzad, S.; Naghdi Badi, H.; Kalateh Jari, S.; Mehrafarin, A.; Saeidi-Sar, S. Investigation of the Qualitative and Appearance Characteristics of Eryngium caeruleum L. Based on Colorimetric and Browning Indices in Storage Conditions. Food Sci. Nutr. 2024, 12, 6690–6698. [Google Scholar] [CrossRef] [Scilit]
- Li, R.; Shang, H.; Wu, H.; Wang, M.; Duan, M.; Yang, J. Thermal Inactivation Kinetics and Effects of Drying Methods on the Phenolic Profile and Antioxidant Activities of Chicory (Cichorium intybus L.) Leaves. Sci. Rep. 2018, 8, 9529. [Google Scholar] [CrossRef] [Scilit]
- Ferreira, S.S.; Monteiro, F.; Passos, C.P.; Silva, A.M.S.; Wessel, D.F.; Coimbra, M.A.; Cardoso, S.M. Blanching Impact on Pigments, Glucosinolates, and Phenolics of Dehydrated Broccoli by-Products. Food Res. Int. 2020, 132, 109055. [Google Scholar] [CrossRef] [Scilit]
- Tan, S.; Wang, Z.; Xiang, Y.; Deng, T.; Zhao, X.; Shi, S.; Zheng, Q.; Gao, X.; Li, W. The Effects of Drying Methods on Chemical Profiles and Antioxidant Activities of Two Cultivars of Psidium guajava Fruits. LWT-Food Sci. Technol. 2020, 118, 108723. [Google Scholar] [CrossRef] [Scilit]
- Nchangwe, C.C.; Kassim, N.; Makule1, E. Effect of blanching conditions and solar drying on selected nutritional, anti-nutritional and bioactive components of formulated avocado seed powder. Afr. J. Food Agric. Nutr. 2024, 24, 26608–26622. [Google Scholar] [CrossRef] [Scilit]
- Soengas, P.; Velasco, P.; Fernández, J.C.; Cartea, M.E. New Vegetable Brassica Foods: A Promising Source of Bioactive Compounds. Foods 2021, 10, 2911. [Google Scholar] [CrossRef] [Scilit]
- Kim, M.Y.; Yoon, N.; Lee, Y.J.; Woo, K.S.; Kim, H.Y.; Lee, J.; Jeong, H.S. Influence of Thermal Processing on Free and Bound Forms of Phenolics and Antioxidant Capacity of Rice Hull (Oryza sativa L.). Prev. Nutr. Food Sci. 2020, 25, 310–318. [Google Scholar] [CrossRef] [Scilit] [PubMed]
- ElGamal, R.; Song, C.; Rayan, A.M.; Liu, C.; Al-Rejaie, S.; ElMasry, G. Thermal Degradation of Bioactive Compounds during Drying Process of Horticultural and Agronomic Products: A Comprehensive Overview. Agronomy 2023, 13, 1580. [Google Scholar] [CrossRef] [Scilit]
- Chen, S.; Wang, X.; Cheng, Y.; Gao, H.; Chen, X. A Review of Classification, Biosynthesis, Biological Activities and Potential Applications of Flavonoids. Molecules 2023, 28, 4982. [Google Scholar] [CrossRef] [Scilit] [PubMed]
- Gao, Y.; Xia, W.; Shao, P.; Wu, W.; Chen, H.; Fang, X.; Mu, H.; Xiao, J.; Gao, H. Impact of Thermal Processing on Dietary Flavonoids. Curr. Opin. Food Sci. 2022, 48, 100915. [Google Scholar] [CrossRef] [Scilit]
- Wu, X.; Huang, H.; Childs, H.; Wu, Y.; Yu, L.; Pehrsson, P.R. Glucosinolates in Brassiza Vegetables: Characterization and Factors That Influence Distribution, Content, and Intake. Annu. Rev. Food Sci. Technol. 2021, 12, 485–511. [Google Scholar] [CrossRef] [Scilit]
- Vega-Galvez, A.; Uribe, E.; Pasten, A.; Camus, J.; Gomez-Perez, L.S.; Mejias, N.; Vidal, R.L.; Grunenwald, F.; Aguilera, L.E.; Valenzuela-Barra, G. Comprehensive Evaluation of the Bioactive Composition and Neuroprotective and Antimicrobial Properties of Vacuum-Dried Broccoli (Brassica oleracea var. italica) Powder and Its Antioxidants. Molecules 2023, 28, 766. [Google Scholar] [CrossRef] [Scilit]
- Tao, Y.; Han, M.; Gao, X.; Han, Y.; Show, P.L.; Liu, C.; Ye, X.; Xie, G. Applications of Water Blanching, Surface Contacting Ultrasound-Assisted Air Drying, and Their Combination for Dehydration of White Cabbage: Drying Mechanism, Bioactive Profile, Color and Rehydration Property. Ultrason. Sonochem. 2019, 53, 192–201. [Google Scholar] [CrossRef] [Scilit]
- Toydemir, G.; Gultekin Subasi, B.; Hall, R.D.; Beekwilder, J.; Boyacioglu, D.; Capanoglu, E. Effect of Food Processing on Antioxidants, Their Bioavailability and Potential Relevance to Human Health. Food Chem. X 2022, 14, 100334. [Google Scholar] [CrossRef] [Scilit]
- Krishnan, K.R.; Rayaguru, K.; Nayak, P.K. Ultra-Sonicated Vacuum Drying’s Effect on Antioxidant Activity, TPC, TFC and Color of Elephant Apple Slices: Drying of Elephant Apple. Food Biosci. 2020, 36, 100629. [Google Scholar] [CrossRef] [Scilit]
- Korbel, E.; Attal, E.-H.; Grabulos, J.; Lluberas, E.; Durand, N.; Morel, G.; Goli, T.; Brat, P. Impact of Temperature and Water Activity on Enzymatic and Non-Enzymatic Reactions in Reconstituted Dried Mango Model System. Eur. Food Res. Technol. 2013, 237, 39–46. [Google Scholar] [CrossRef] [Scilit]
- Huang, D.; Boxin, O.U.; Prior, R.L. The Chemistry behind Antioxidant Capacity Assays. J. Agric. Food Chem. 2005, 53, 1841–1856. [Google Scholar] [CrossRef] [Scilit]
- Zheng, L.; Lin, L.; Su, G.; Zhao, Q.; Zhao, M. Pitfalls of Using 1,1-Diphenyl-2-Picrylhydrazyl (DPPH) Assay to Assess the Radical Scavenging Activity of Peptides: Its Susceptibility to Interference and Low Reactivity towards Peptides. Food Res. Int. 2015, 76, 359–365. [Google Scholar] [CrossRef] [Scilit]
- Moura, J.d.S.; Sousa, R.P.e.; Martins, L.H.d.S.; Costa, C.E.F.d.; Chisté, R.C.; Lopes, A.S. Thermal Degradation of Carotenoids from Jambu Leaves (Acmella oleracea) during Convective Drying. Foods 2023, 12, 1452. [Google Scholar] [CrossRef] [Scilit]

Disclaimer/Publisher’s Note: The statements, opinions and data contained in all publications are solely those of the individual author(s) and contributor(s) and not of MDPI and/or the editor(s). MDPI and/or the editor(s) disclaim responsibility for any injury to people or property resulting from any ideas, methods, instructions or products referred to in the content. |
© 2026 by the authors. Licensee MDPI, Basel, Switzerland. This article is an open access article distributed under the terms and conditions of the Creative Commons Attribution (CC BY) license.