


Abstract
High-alkali coal can cause slagging and fouling and impact the operational lifespan of the boilers. Traditional single-indicator methods often yield inconsistent results when evaluating the slagging risk of high-alkali coal. In this study, six coal samples were selected and systematically analyzed for their slagging characteristics using scanning electron microscopy (SEM), X-ray fluorescence (XRF), X-ray diffraction (XRD), and ash morphology analysis. Furthermore, a comprehensive evaluation model was constructed by integrating the technique for order preference by similarity to ideal solution (TOPSIS) with the entropy weight method. Additionally, based on images of ash morphology, the fractal dimension (D) was introduced as a quantitative indicator to predict slagging tendency through crack characteristics. The results show that TF, ZD, and KB samples, which are rich in alkaline oxides (CaO, Fe2O3, Na2O, K2O), form low-melting-point eutectic silicates during combustion, resulting in significant melting and agglomeration with wide cracks between aggregates, indicating a strong slagging tendency. Their fractal dimensions (D) range from 1.81 to 1.92. In contrast, HM and WQ samples, dominated by SiO2 and Al2O3, form high-melting-point mullite and quartz, showing loose ash morphology with uniformly distributed cracks and a weak slagging tendency, with D values of 1.68 and 1.75, respectively. A significant negative correlation was observed between D and the E-TOPSIS model (y = 3.54 − 1.72x). Therefore, fractal analysis allows for rapid assessment of slagging risk without the need for complex chemical testing. This study provides valuable insights for predicting the slagging tendency of high-alkali coal during combustion.
1. Introduction
Coal remains the dominant energy source in China’s energy mix and is expected to maintain a central role in the country’s power generation for the coming decades [1]. Among China’s major coal-producing regions, some areas are increasingly acknowledged as a strategic hub for the development of both fossil fuels and renewable energy [2,3]. Owing to their unique depositional environment and geological evolution, coal from these regions is typically enriched with alkali and alkaline earth metals, particularly sodium and calcium [4]. The high concentrations of these elements substantially increase the risk of slagging during combustion, which negatively impacts heat transfer in boilers, accelerates fouling, and causes unplanned shutdowns, thereby compromising the stable and large-scale utilization of high-alkali coal resources [5,6,7].
Slagging is controlled by complex interactions among ash chemistry, mineral transformations, and combustion dynamics [8]. Coals from various regions exhibit notable compositional differences; for instance, the ash of Zhundong coal contains up to 6% Na2O and more than 20% CaO (relative to ash mass), whereas the ash of Hami coal contains more than 70% of refractory oxides such as SiO2 and Al2O3 (relative to ash mass). This variability complicates the prediction of slagging behavior [9,10,11]. Notably, the reliability of traditional methods for slagging risk prediction is often questionable, with empirical studies reporting predictive accuracies below 50% in certain cases [12]. For instance, several studies have reported that the ash fusion temperature (AFT) of many Zhundong coals exceeds 1350 °C, which suggests weak slagging and coking tendencies. However, this contradicts practical observations, as these high-AFT coals exhibit severe deposition issues [13]. Zhu et al. [14] reported that seven of the eight indices failed to accurately predict the slagging and fouling behavior of Zhundong coal in China, with only the alkali–acid ratio (RB/A) yielding accurate results. Yang et al. [15] also demonstrated the limited accuracy of slagging indices for Zhundong coal. Their results indicate that the silica ratio (G) and the composite alkali–acid ratio (RZ) are the most reliable indicators, whereas the iron/calcium ratio (RFe/Ca) and the silicon/alumina ratio (RS/A) are the least accurate indicators. These limitations underscore the need for a more comprehensive and robust evaluation approach.
Recent studies have explored artificial neural networks (ANN) and machine learning methods for predicting coal slagging behavior, demonstrating improved accuracy over traditional indices [16]. These methods often require extensive datasets and lack interpretability regarding morphological features, which motivates the complementary use of image-based fractal analysis in the present study. Fractal theory has become a powerful tool for quantifying complex structures that exhibit irregularity and self-similarity [17,18,19]. In coal science, it has been successfully used to characterize pore networks and surface textures [20,21,22,23]. The fractal dimension (D) is a scale-invariant parameter of structural complexity that offers more comprehensive morphological insights than conventional chemical analysis. In the context of ash slag formation, the highly porous and uneven surfaces formed through the melting and recrystallization of minerals at high temperatures are well suited for fractal analysis. For microstructural characterization, scanning electron microscopy (SEM) provides high-resolution surface morphology images that capture the intricate fracture networks and agglomerated structures formed during ash melting. For fractal dimension calculation, optical photographs of ash slag are employed, as they clearly capture the macroscopic fracture networks and surface features that are directly indicative of slagging severity. The box-counting method, a widely used fractal analysis technique, is particularly suitable for binary images because it quantifies structural complexity through a simple and robust algorithm, allowing for objective comparison of fracture network characteristics across different coal ash samples.
The technique for order preference by similarity to ideal solution (TOPSIS) is a multi-criteria decision analysis method that ranks alternatives based on their closeness to the ideal solution [24]. Each alternative’s performance is compared with the ideal solution to obtain a relative closeness value, which is then used to determine the optimal choice. Weight determination is a key step in TOPSIS. EW calculates attribute weights based on data diversity, quantifying the uncertainty and information content of indicators without relying on subjective judgment, making it widely applicable [25].
The present study aims to establish a comprehensive evaluation framework for assessing the slagging characteristics of high-alkali coal. The slagging tendency of each coal sample was comprehensively analyzed using scanning electron microscopy (SEM) with energy-dispersive spectroscopy (EDS), X-ray fluorescence (XRF), X-ray diffraction (XRD), and ash morphology analysis. The entropy weight (EW) method was employed to determine the weights of eight individual slagging risk indicators (B/A, S/A, S, F/C, Rs, RFu, DT, and ST), which were then integrated using the technique for order preference by similarity to ideal solution (TOPSIS) to establish a new slagging evaluation model, referred to as E-TOPSIS. Based on ash morphology image analysis, the fracture features of ash slag were extracted, and the corresponding fractal dimension values were calculated to quantitatively assess the slagging tendency. The results indicated that the fractal dimension method showed strong correlation with the E-TOPSIS model, enabling rapid assessment of slagging risk without the need for complex chemical testing. The findings provide a reference and guidance for assessing the slagging tendency of high-alkali coal.
2. Experimental Section
2.1. Sample Preparation
The six coal samples were collected from major mining regions in Xinjiang, China, including Yili (YL), Hami (HM), Urumqi (WQ), Turpan (TF), Zhundong (ZD), and Kubai (KB). These samples were selected to represent the typical compositional range of high-alkali coals encountered in practice, with varying contents of alkaline and acidic oxides, allowing the proposed methodology to be tested across a spectrum of slagging behaviors. Before testing, all samples were naturally air-dried, finely ground to a particle size of less than 0.1 mm, and stored in sealed containers. The proximate analysis, ultimate analysis, and measurement of the higher heating value (Qgr,d) of the raw coals were performed using a proximate analyzer (5E-MAG6700, Changsha Kaiyuan Instruments Co., Ltd., Changsha, China), an elemental analyzer (Vario EL III, Elementar Analysensysteme GmbH, Hanau, Germany), and an automatic calorimeter (SDC715, Hunan Sundy Science and Technology Co., Ltd., Changsha, China), respectively. The coal properties are summarized in Table 1.
Table 1.
Proximate and ultimate analysis, and heating value.
Ash samples were prepared in a muffle furnace as follows. A sample of 2 g was first heated at 250 °C for 30 min, followed by heating to 450 °C at a rate of 10 °C/min with a holding time of more than 3 h. After air cooling, the samples were weighed and reheated at 450 °C until the weight difference between consecutive measurements was less than 0.001 g.
High-temperature ash residue samples were prepared in a tubular furnace as follows. Slagging tests were performed at 1100 °C with an airflow rate of 1.0 dm3/min using the raw coal samples. Each sample was placed in an alumina crucible and combusted for 2 h. After combustion, two sets of parallel samples were subjected to different treatments: one set was naturally cooled, after which the ash was ground to a fineness of below 200 mesh and sealed for further analysis; the other set was used for image acquisition under standardized optical conditions. To minimize the matrix effects, a dynamic weighing method based on the predicted ash yield was employed to maintain a consistent slag mass of (0.40 ± 0.01) g across all samples.
2.2. Ash Analyses
The elemental composition and specific composition of the ash samples were determined through XRF (BRUKER S8 TIGER, Bruker AXS GmbH, Karlsruhe, Germany). Each sample was measured three times, and the results are expressed as the mean value. Ash fusion characteristics, including deformation temperature (DT), softening temperature (ST), hemispherical temperature (HT), and flow temperature (FT), were measured using an automatic ash fusion analyzer (TJHR-6000, Hebi Tianjian Electronic Technology Co., Ltd., Hebi, China).
The microstructural features and slagging morphology were analyzed using SEM-EDS (ZEISS Gemini SEM 300 and Sigma 300, Carl Zeiss AG, Jena, Germany), with images captured at a magnification of 10,000× and a resolution of 5 μm. XRD (Bruker D2 Phaser, Bruker AXS GmbH, Karlsruhe, Germany) was used to identify the main crystalline compounds of the samples over a 2θ range of 10° to 80° with a step size of 0.02°.
2.3. Construction of Evaluation Model
In assessing slagging tendency, a range of empirical indices have been advanced, such as the acid ratio (B/A), silicon/alumina ratio (S/A), slag viscosity index (S), iron/calcium ratio (F/C), sulfur index (Rs), fouling index (RFu), deformation temperature (DT), and softening temperature (ST). These indices are commonly employed in engineering contexts [26,27,28,29,30]. However, each single index reflects only a limited aspect of slagging tendency, and the predictive results often vary when applied to coals with complex compositions and significant regional differences. Therefore, single-index methods exhibit certain biases and limitations in evaluating slagging risk.
To address these limitations, a comprehensive evaluation framework was developed by integrating multiple slagging-related parameters using the E-TOPSIS approach. The E-TOPSIS approach employs the EW method for weight determination and the TOPSIS method for index synthesis, representing an improvement relative to conventional single-index methods. In the selection of indices, various slagging evaluation indices and their combinations were calculated and tested. After continuous screening, eight typical slagging indices were selected to build the model: B/A, S/A, S, F/C, Rs, RFu, DT, ST. The mathematical expression of the slagging index and the rules for determining the slagging degree are presented in Table 2.
Table 2.
Slagging, fouling, abrasion, and corrosion tendencies based on ash composition.
2.3.1. Determination of the Index Weights
The EW method was employed to determine the weights of the evaluation indices in the model. It effectively captures data uncertainty and reduces subjective bias [31]. By calculating the information entropy of each index, the method quantifies the variability of indices into objective weights, enabling comprehensive evaluation and decision-making. The specific computational steps are as follows [32].
In step 1, the initial decision matrix is constructed:
where X is the initial decision matrix, m is the number of samples, and n is the number of evaluation criteria.
In step 2, the initial decision matrix is normalized. To eliminate the effects of differing dimensions among the evaluation indices, the initial decision matrix was normalized. For cost-type indicators (where lower values are preferred), normalization was performed using Equation (2); for benefit-type indicators (where higher values are preferred), Equation (3) was used. The resulting normalized decision matrix is shown in Equation (4).
where xij is the value of the j-th criterion for the i-th sample and yij is the corresponding normalized value; here, i = 1, 2, 3, … m, j = 1, 2, 3, … n; and Y is the normalized decision matrix.
In step 3, entropy is calculated as follows:
where ej is the entropy of the j-th criterion, is the entropy coefficient, and Pij is the proportion of the value of i-th sample in the j-th criterion.
In step 4, the weight of each criterion is calculated as follows:
where wj is the weight of each factor.
2.3.2. TOPSIS Method
The TOPSIS method is widely used for multicriteria decision-making [33]. The core idea of this method is to identify alternatives that are closest to the positive ideal solution and farthest from the negative ideal solution. In this study, benefit-type indicators (DT, ST, S) are those for which higher values indicate lower slagging risk, while cost-type indicators (B/A, S/A, F/C, Rs, RFu) are those for which higher values indicate higher slagging risk, based on standard coal ash chemistry principles (Table 2). The positive ideal solution maximizes benefit criteria and minimizes cost criteria, whereas the negative ideal solution maximizes cost criteria and minimizes benefit criteria. The detailed procedure is as follows.
In step 1, the normalized decision matrix is constructed as shown in Equations (1)–(4).
In step 2, the weights obtained in the previous step are applied to the normalized decision matrix, expressed as follows:
where Z is the weighted decision matrix.
In step 3, the positive and negative ideal solutions are defined. Z+ represents the optimal case (positive ideal result) and Z− represents the worst case (negative ideal result). These are calculated as shown in Equations (10) and (11).
In step 4, the Euclidean distances between each alternative and both the positive and negative ideal solutions are calculated.
In step 5, the relative proximity (Ci) between the evaluation object and the ideal solution is determined, with larger Ci values indicating greater proximity.
2.4. Calculation Method of Fractal Dimension
During combustion experiments using a crucible, coal ashes with different slagging tendencies exhibited distinct behaviors. For coal with a high slagging tendency, the ash typically appeared in blocky, molten or aggregated forms, with irregular edges and a tendency to adhere and form clumps. In contrast, for coal with a low slagging tendency, the ash was relatively loose, with uniformly distributed particles, more regular shapes, and little tendency to stick together. Based on these observed characteristics, fractal theory was employed to quantitatively characterize the surface morphology of coal ash, revealing the slagging tendencies of different coals.
With the evolution of fractal theory, several well-established fractal calculation methods have been proposed. Among them, the box-counting method, as a more intuitive and user-friendly calculation method, was applied in this study to characterize slagging tendency. The calculation process of the box-counting method used the collected surface images as experimental samples. During the calculation, the images were segmented using boxes, and the number of fracture boxes was counted to obtain the relationship between S and N, as shown in Equation (15) [34].
where N is the number of boxes, S is the boxes of size, C is the fitted constant, and D represents the fractal box-counting dimension. To calculate the fractal dimension more intuitively, both sides of Equation (15) were logarithmically transformed, yielding the coefficient relationship equation shown in Equation (16).
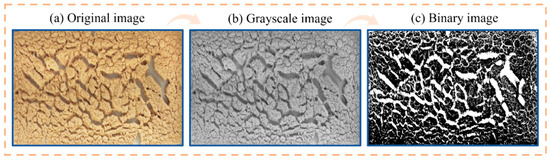
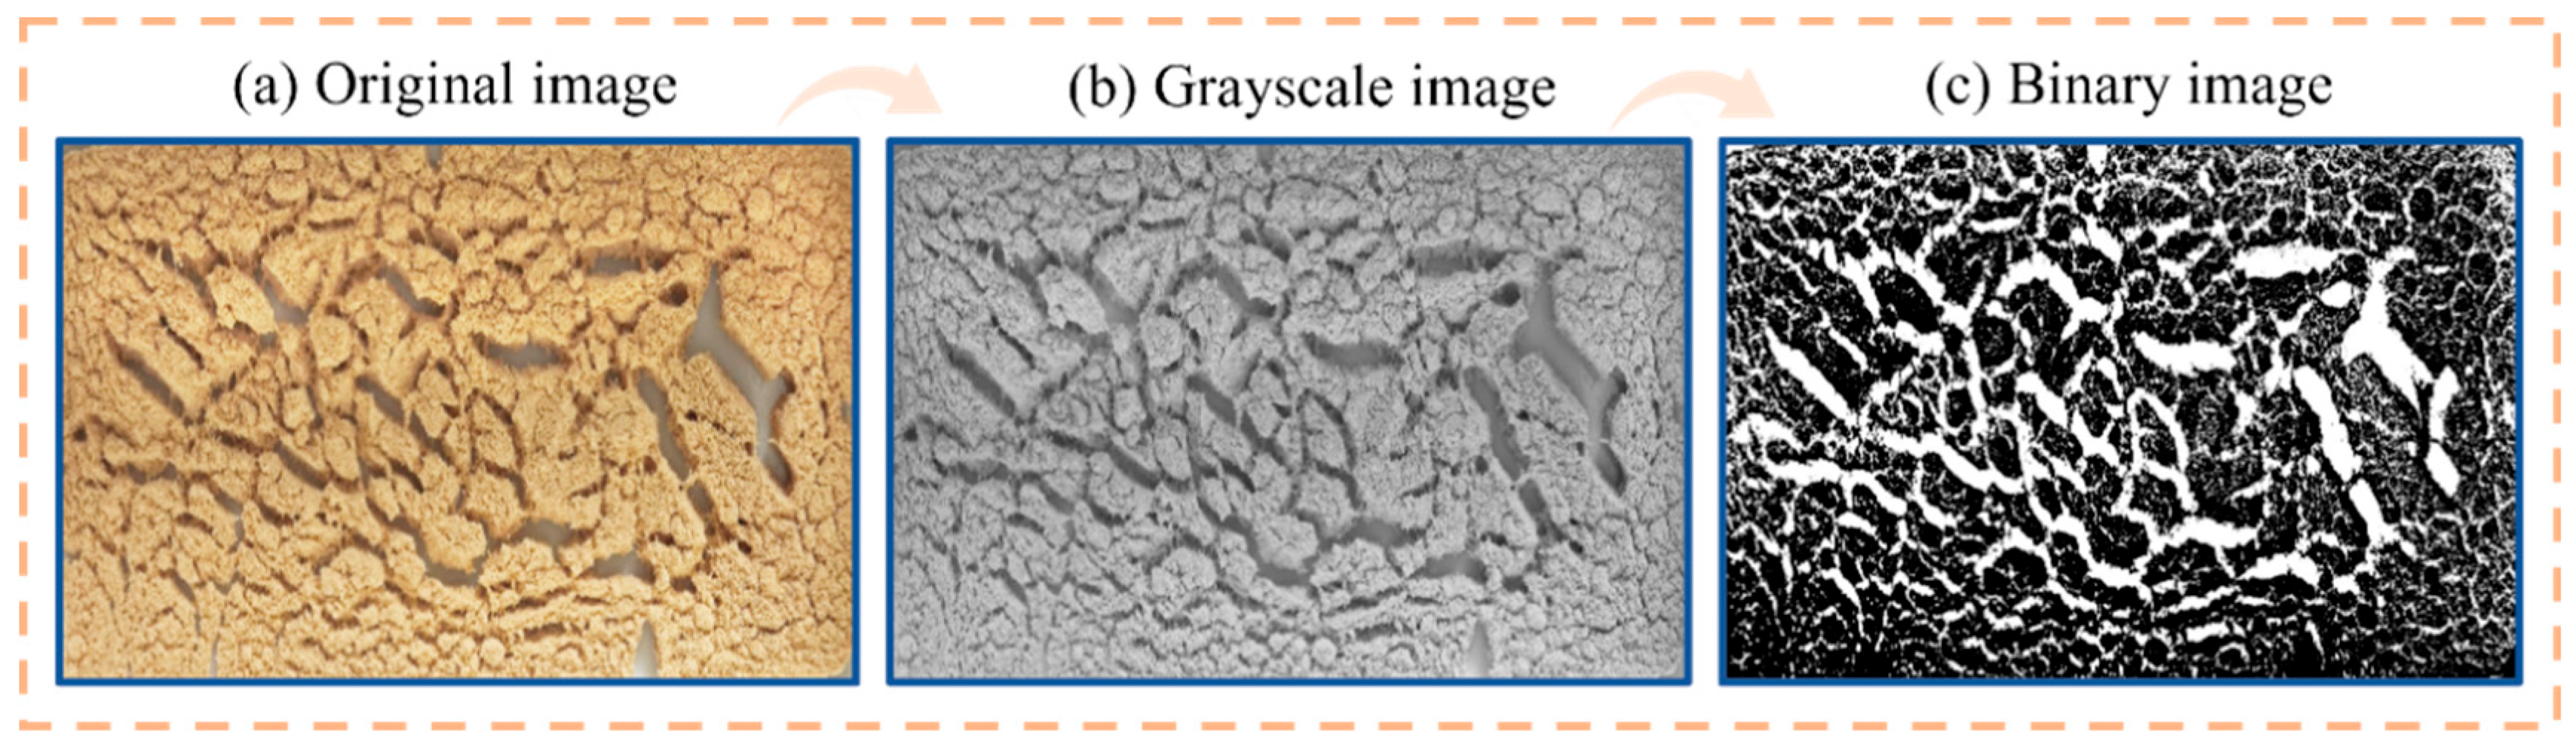
In the present study, high-resolution images of the coal ash slag surfaces after combustion were captured under standardized lighting conditions using a precision imaging system. A series of digital operations were performed in the software ImageJ 1.54d to enhance the surface image quality and convert it into a binary image required for fractal calculation. The image processing workflow for the coal ash surface is roughly depicted in Figure 1.
Figure 1.
Image digital processing workflow.
Firstly, the original surface image of the coal ash slag (Figure 1a) was converted to a grayscale image as shown in Figure 1b. Then, the median filtering operation was applied to eliminate interference elements such as scratches and noise dots. The processed grayscale image was then transformed to obtain the final binary image, as shown in Figure 1c. In the binary image, the black regions represented slagging areas with a pixel value of 0, while the white regions represented fractures with a pixel value of 1.
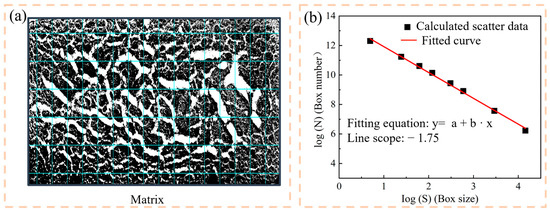
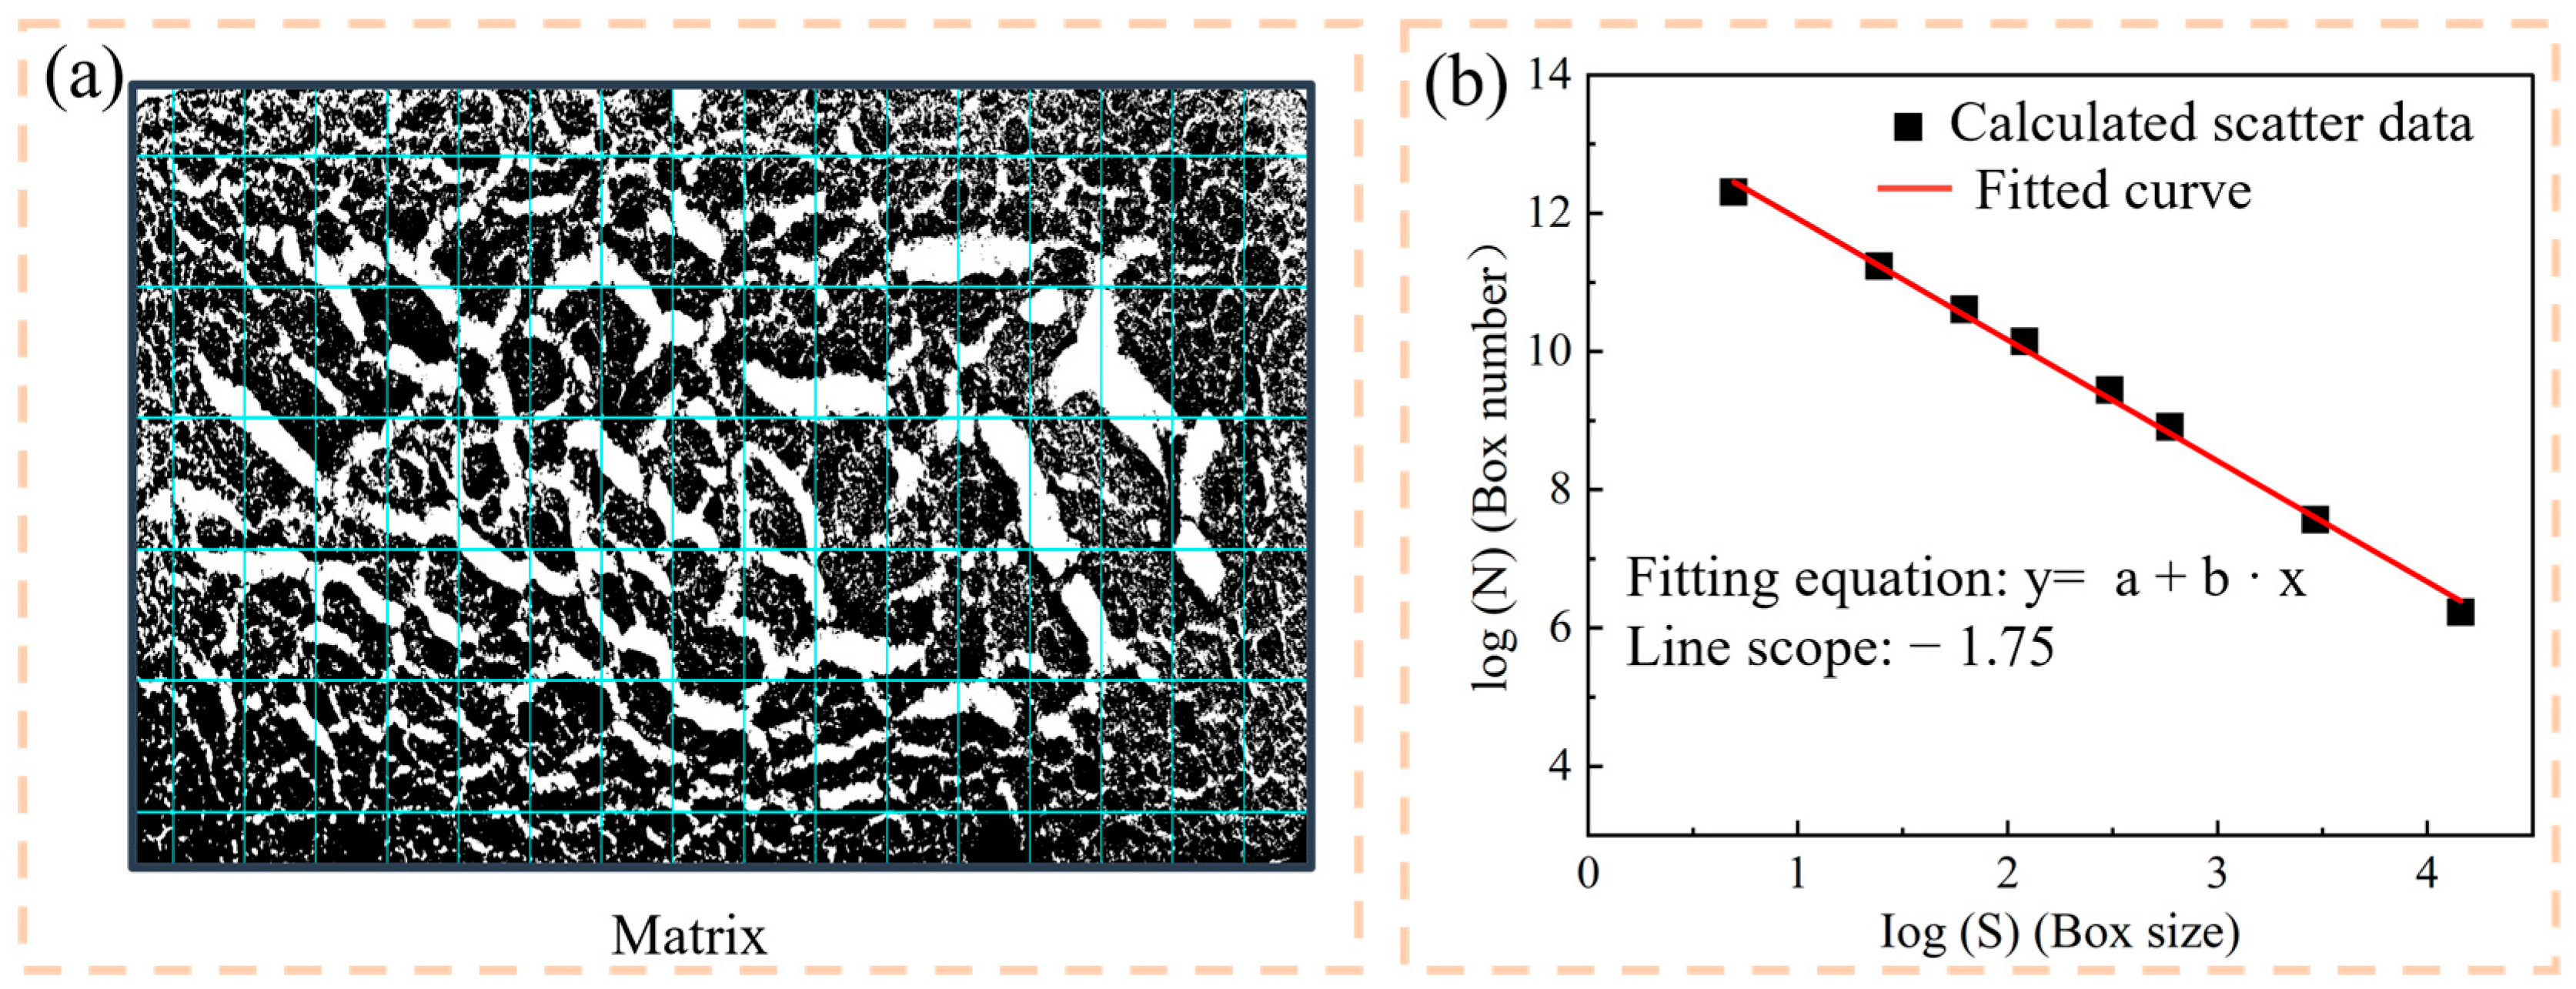
In Figure 1c, the fractal dimension analysis was conducted using the Fractal Box Counter plugin in ImageJ software. According to the image resolution, the subdivision factors were set as [2, 4, 8, 16, 32, 64, 128, 256], meaning that the number of boxes used to divide the image doubled in each iteration. The partial subdivision process of the image is illustrated in Figure 2a. After eight levels of subdivision, evaluation, and counting, the software automatically recorded the corresponding scale factors and the number of fracture boxes (sub-matrices). By linearly fitting the logarithm of the obtained data, the results were obtained as shown in Figure 2b, where the slope of the fitted line, 1.75, represented the fractal dimension of the fractured image. Here, the fractal dimension (D) reflects the complexity and self-similarity of the coal ash surface. The D value closer to 2 indicates a surface with prominent cracks and blocky aggregates, corresponding to coal ash with a high slagging tendency. In contrast, the D value closer to 1 indicates a surface with uniformly distributed particles, corresponding to coal ash with a low slagging tendency.
Figure 2.
Fractal dimension calculation process: (a) schematic diagram of the binary image subdivision; (b) linear regression fitting for a representative ash sample.
3. Results and Discussion
3.1. Ash Properties and Slagging
3.1.1. Combustion Experiment Results
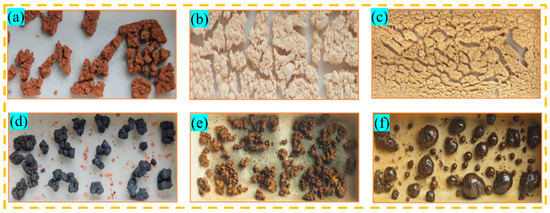
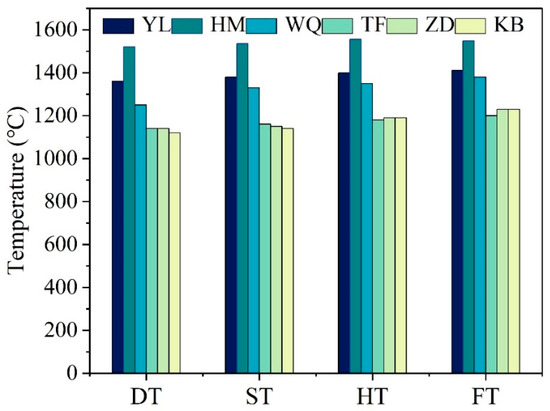
Based on the microstructure of ash residues after high-temperature combustion (Figure 3) combined with the ash fusion temperatures (AFT) (Figure 4), the slagging tendency and agglomeration behavior of six coal samples were analyzed. According to AFT, the samples were classified into three slagging risk levels: high risk (DT < 1107 °C, ST < 1260 °C), medium risk (DT: 1108–1288 °C, ST: 1260–1390 °C), and low risk (DT > 1289 °C, ST > 1390 °C).
Figure 3.
The degree of agglomeration of the coal samples: (a) YL, (b) HM, (c) WQ, (d) TF, (e) ZD, and (f) KB.
Figure 4.
Ash fusion temperatures of the samples.
For WQ and HM, both the deformation temperature (DT) and softening temperature (ST) indicate medium to low risk, which is highly consistent with their loose, powdery ash morphology, uniform particle distribution, and few cracks observed in the ash images, collectively confirming their weak slagging tendency and minor agglomeration. In contrast, TF, ZD, and KB show medium risk based on DT but high risk based on ST. Their ash exhibits partial melting, particle adhesion, and compact structures, indicating more pronounced slagging and agglomeration than predicted by DT alone, suggesting rapid development of the molten phase once softening begins. YL shows low risk according to DT but medium risk based on ST, with its morphology displaying transitional characteristics between loose and compact structures. Notably, the spherical molten clumps with smooth, dense surfaces observed in Figure 3f visually reflect the severe slagging and complete agglomeration corresponding to ST high-risk samples. Overall, the evaluation based on AFT and microstructural observations complement each other: AFT provides a theoretical risk classification, while the morphology reveals the actual extent of melting and agglomeration.
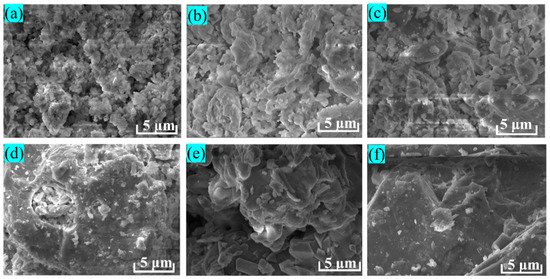
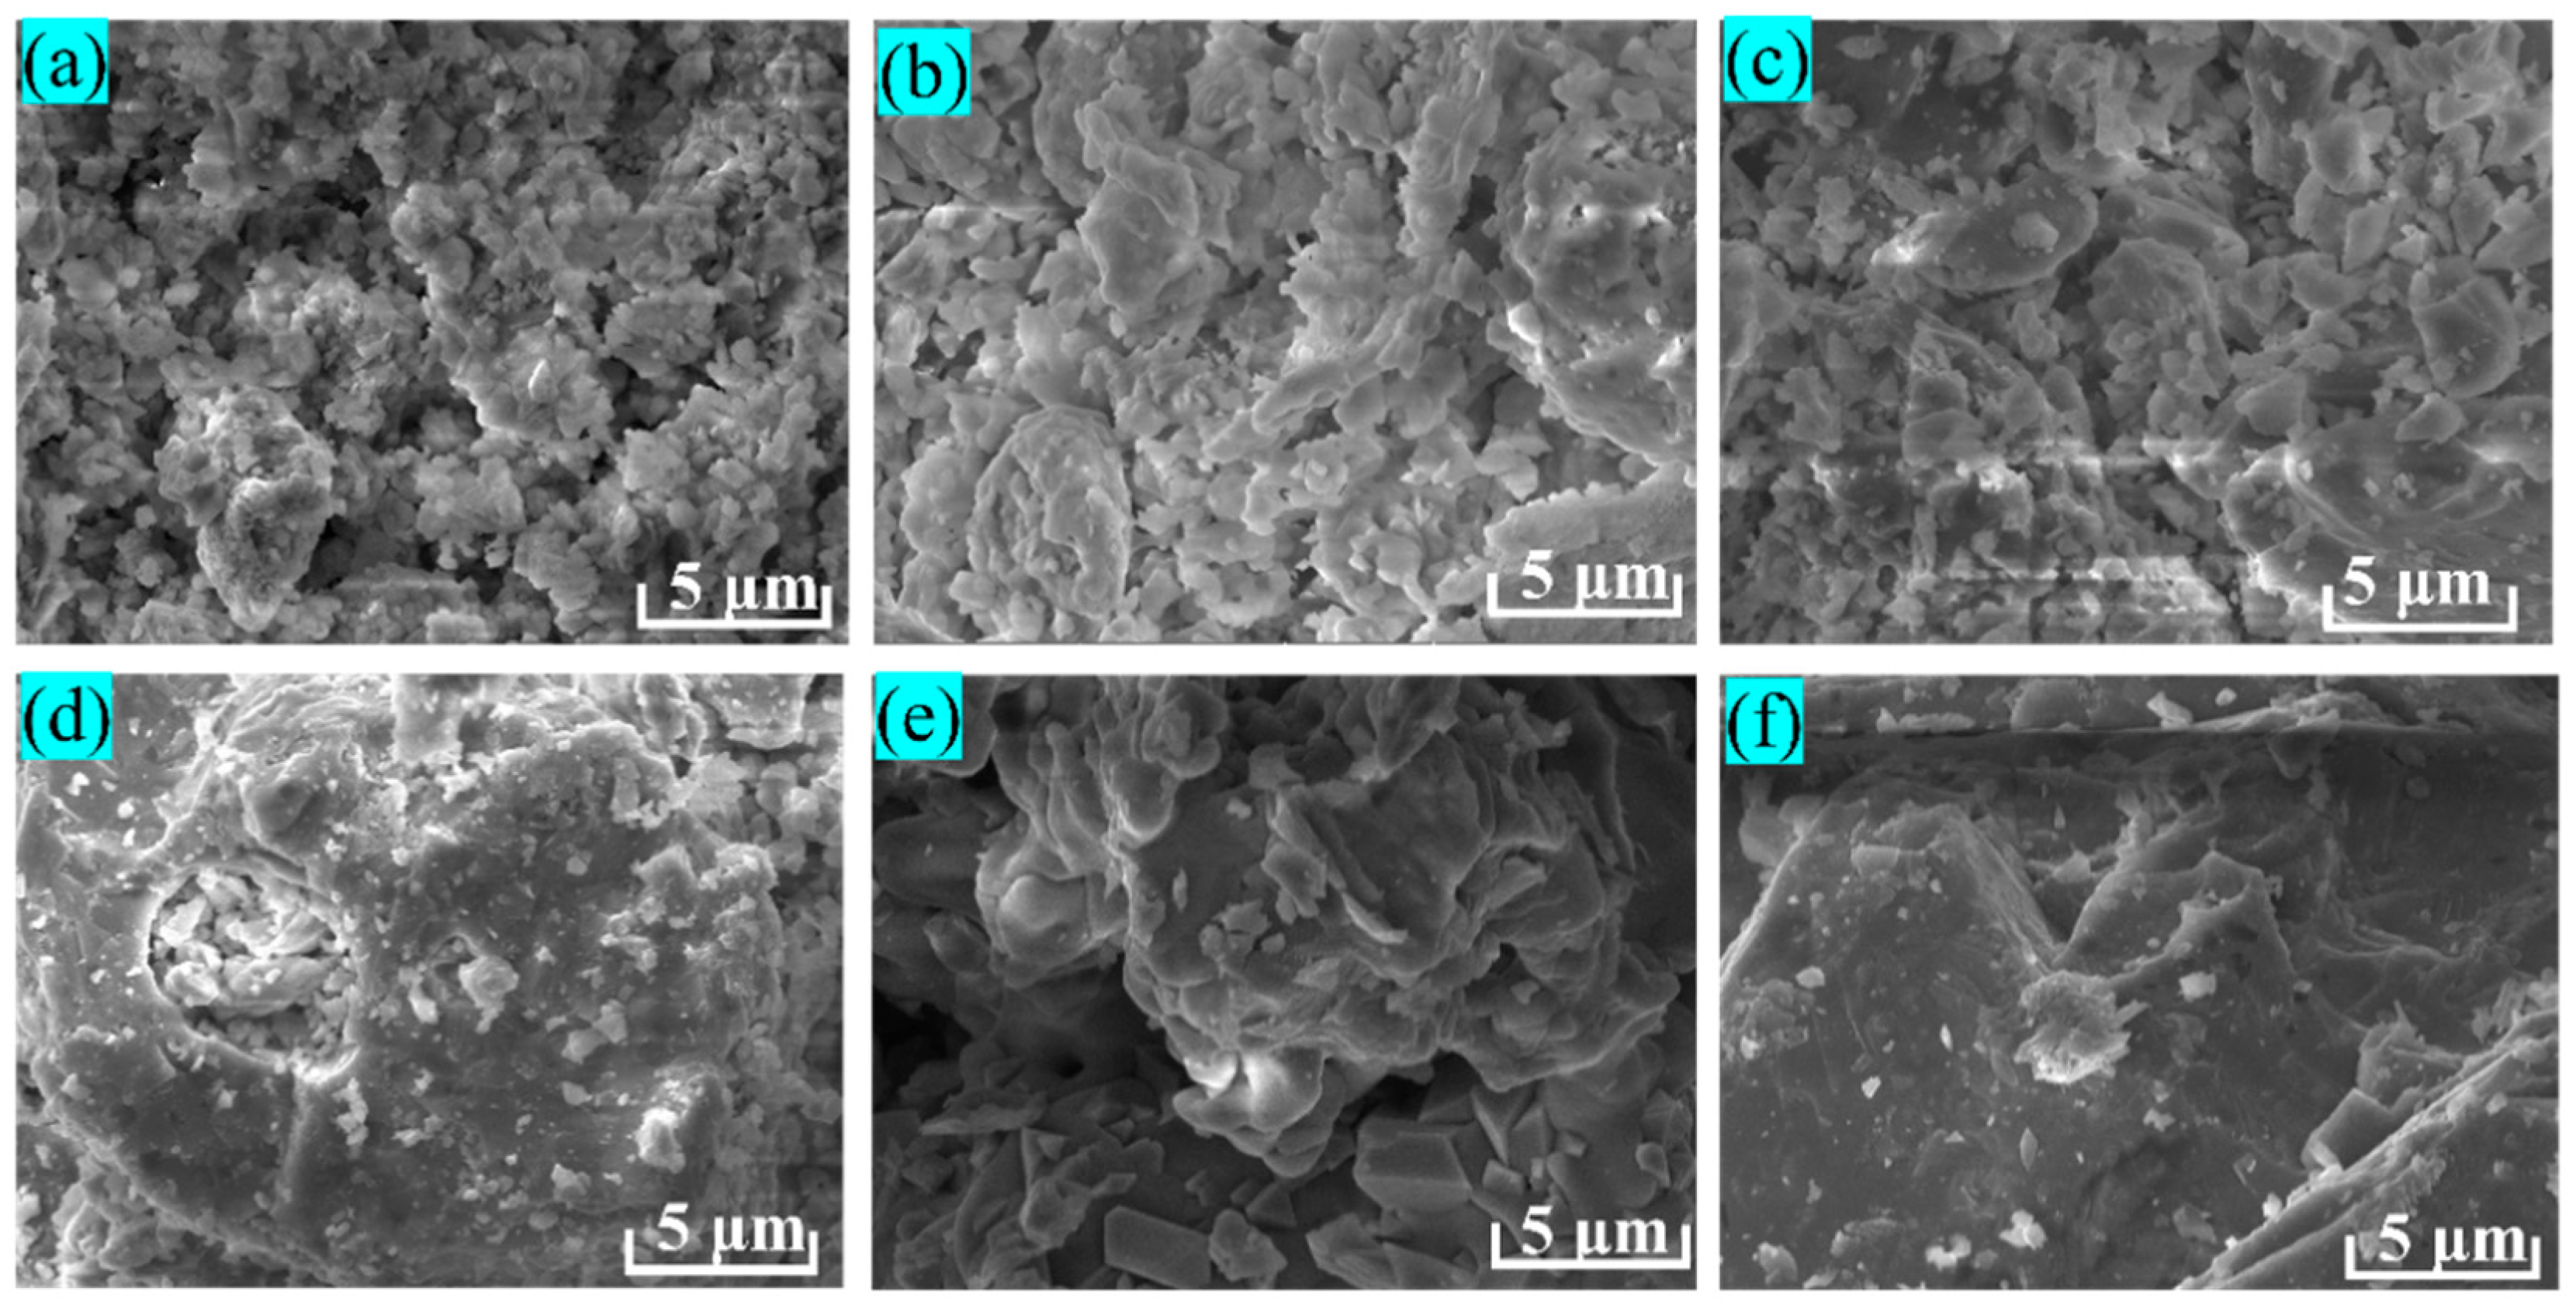
The SEM images of the six coal samples after combustion at 1100 °C are shown in Figure 5. The YL, HM, and WQ samples exhibit relatively fine and flocculent particles with rough surfaces and well-developed porous networks, suggesting the presence of a porous carbonaceous framework formed during combustion. This morphology correlates with a lower tendency for slagging, as the porous structure inhibits dense fusion. In contrast, TF, ZD, and KB samples display more compact and fused agglomerates with smoother surfaces, indicating a higher degree of melting and increased slagging potential. The dense structure of these samples facilitates particle bonding during high-temperature exposure, which can promote the formation of larger slag aggregates. This is consistent with the ash morphology observed in the crucibles.
Figure 5.
SEM images of the coal samples after combustion: (a) YL, (b) HM, (c) WQ, (d) TF, (e) ZD, and (f) KB.
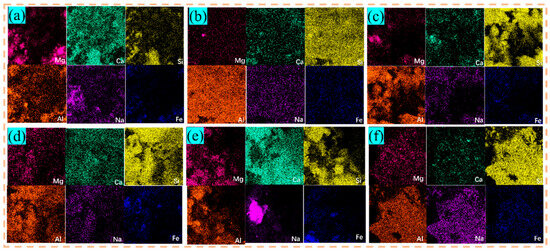
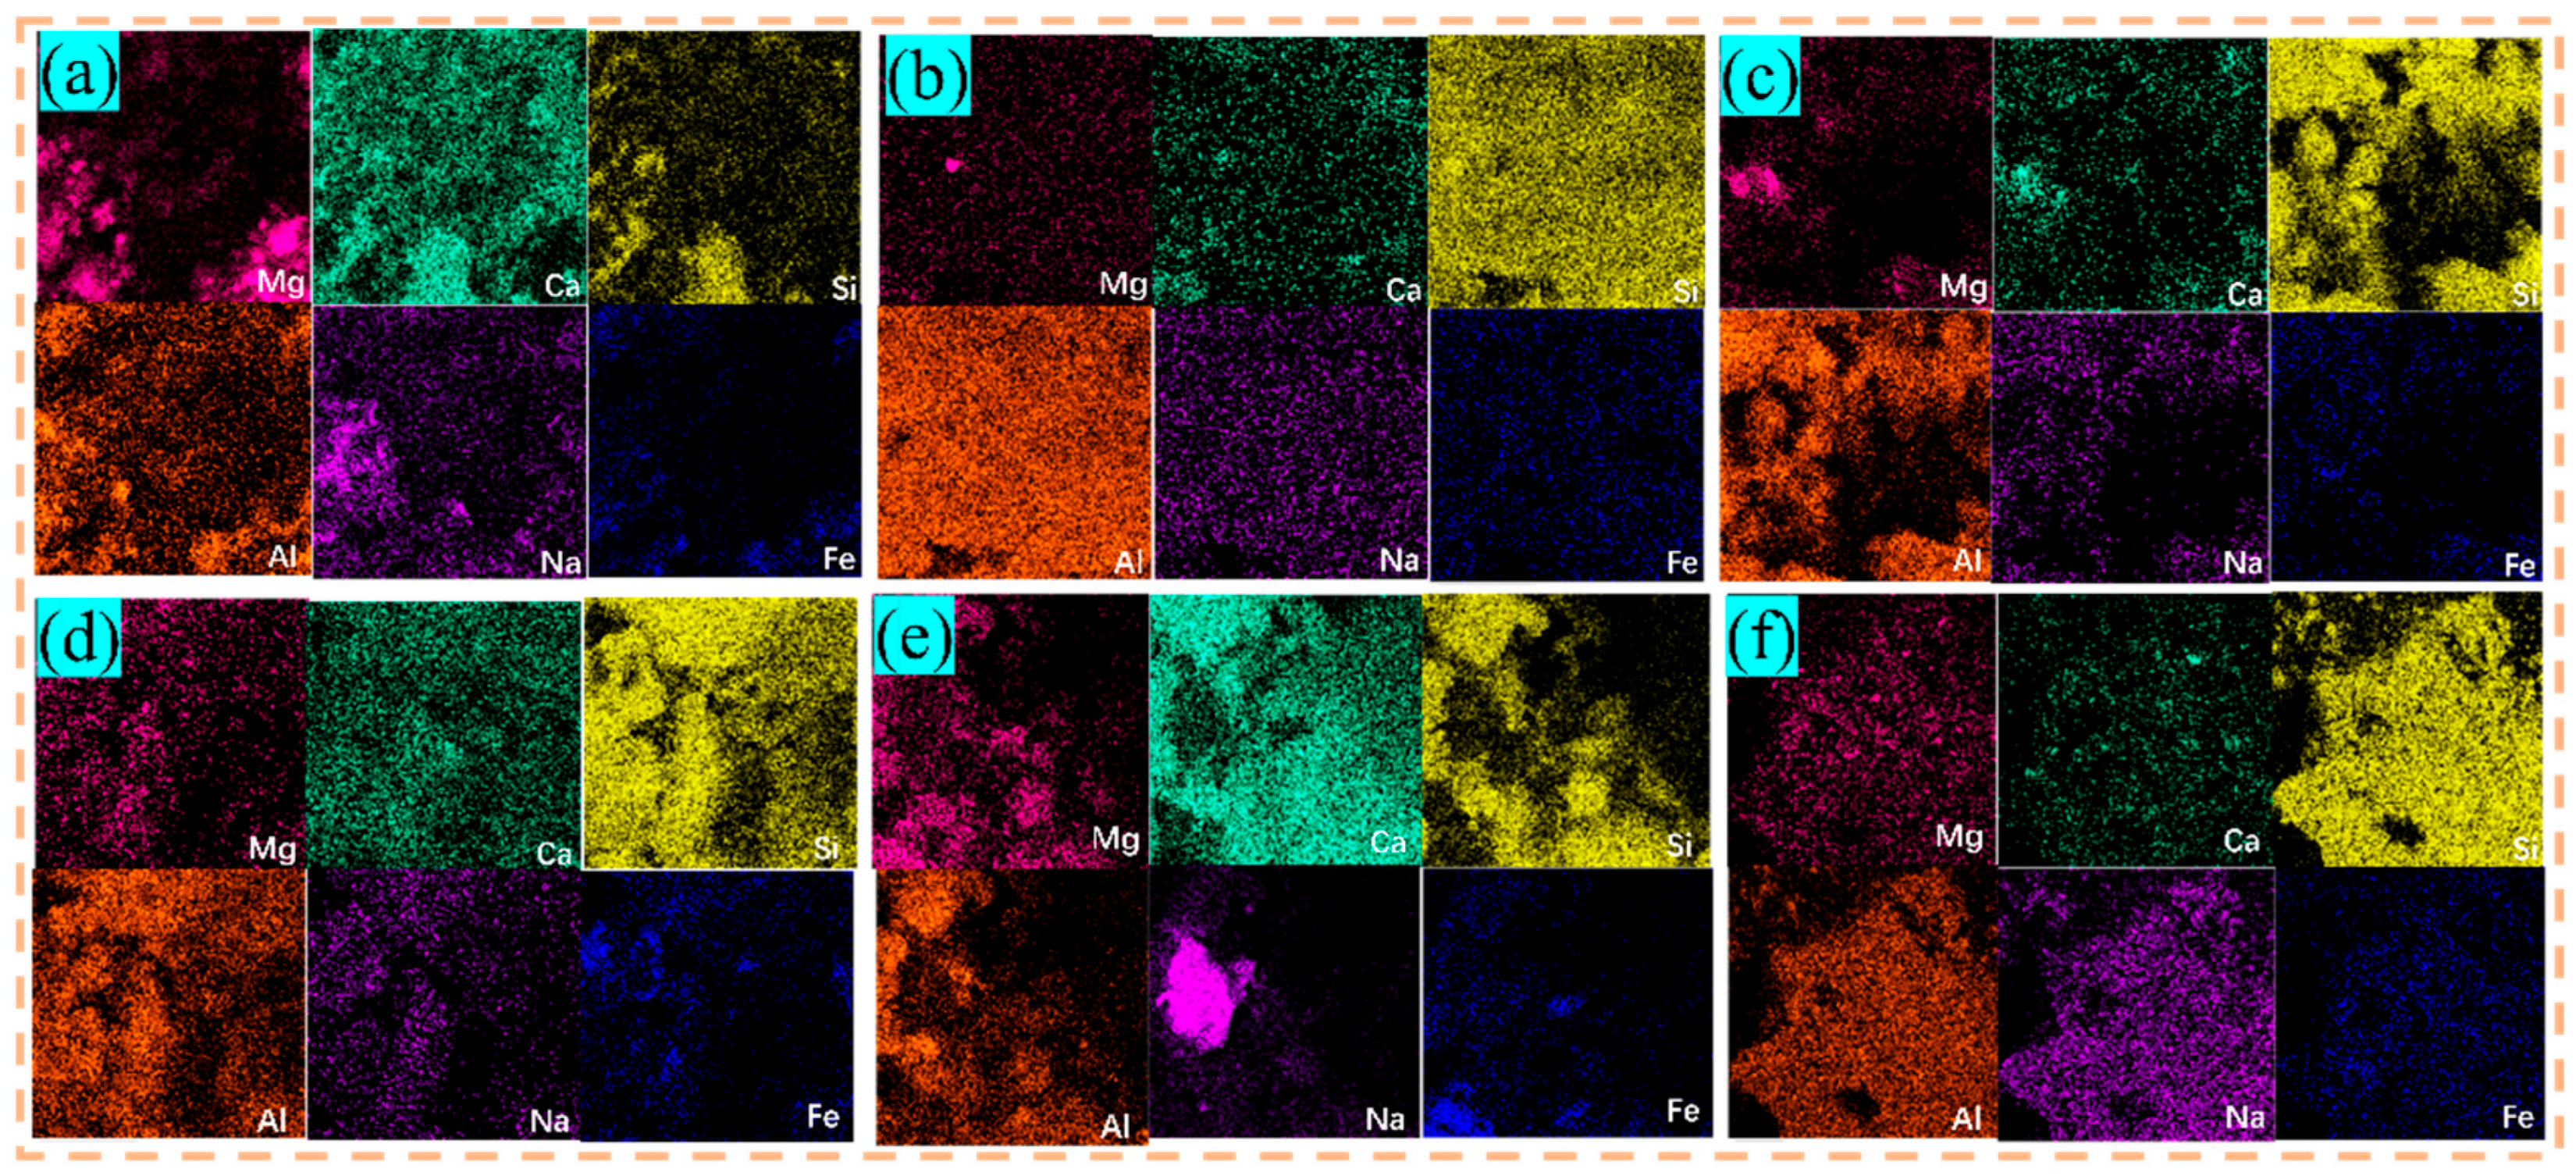
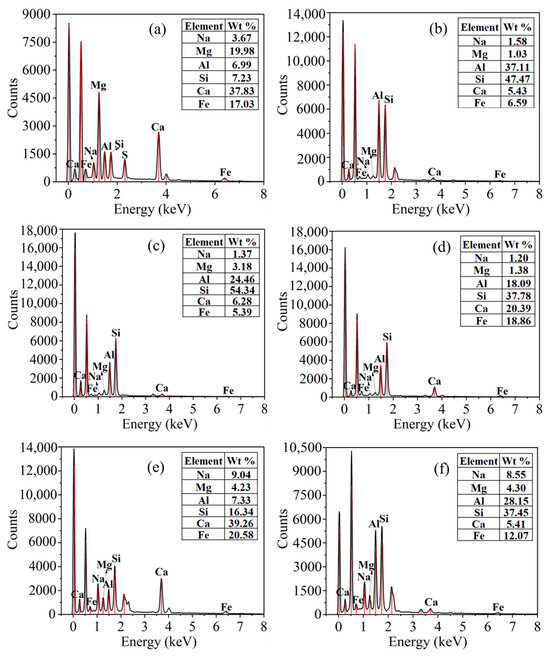
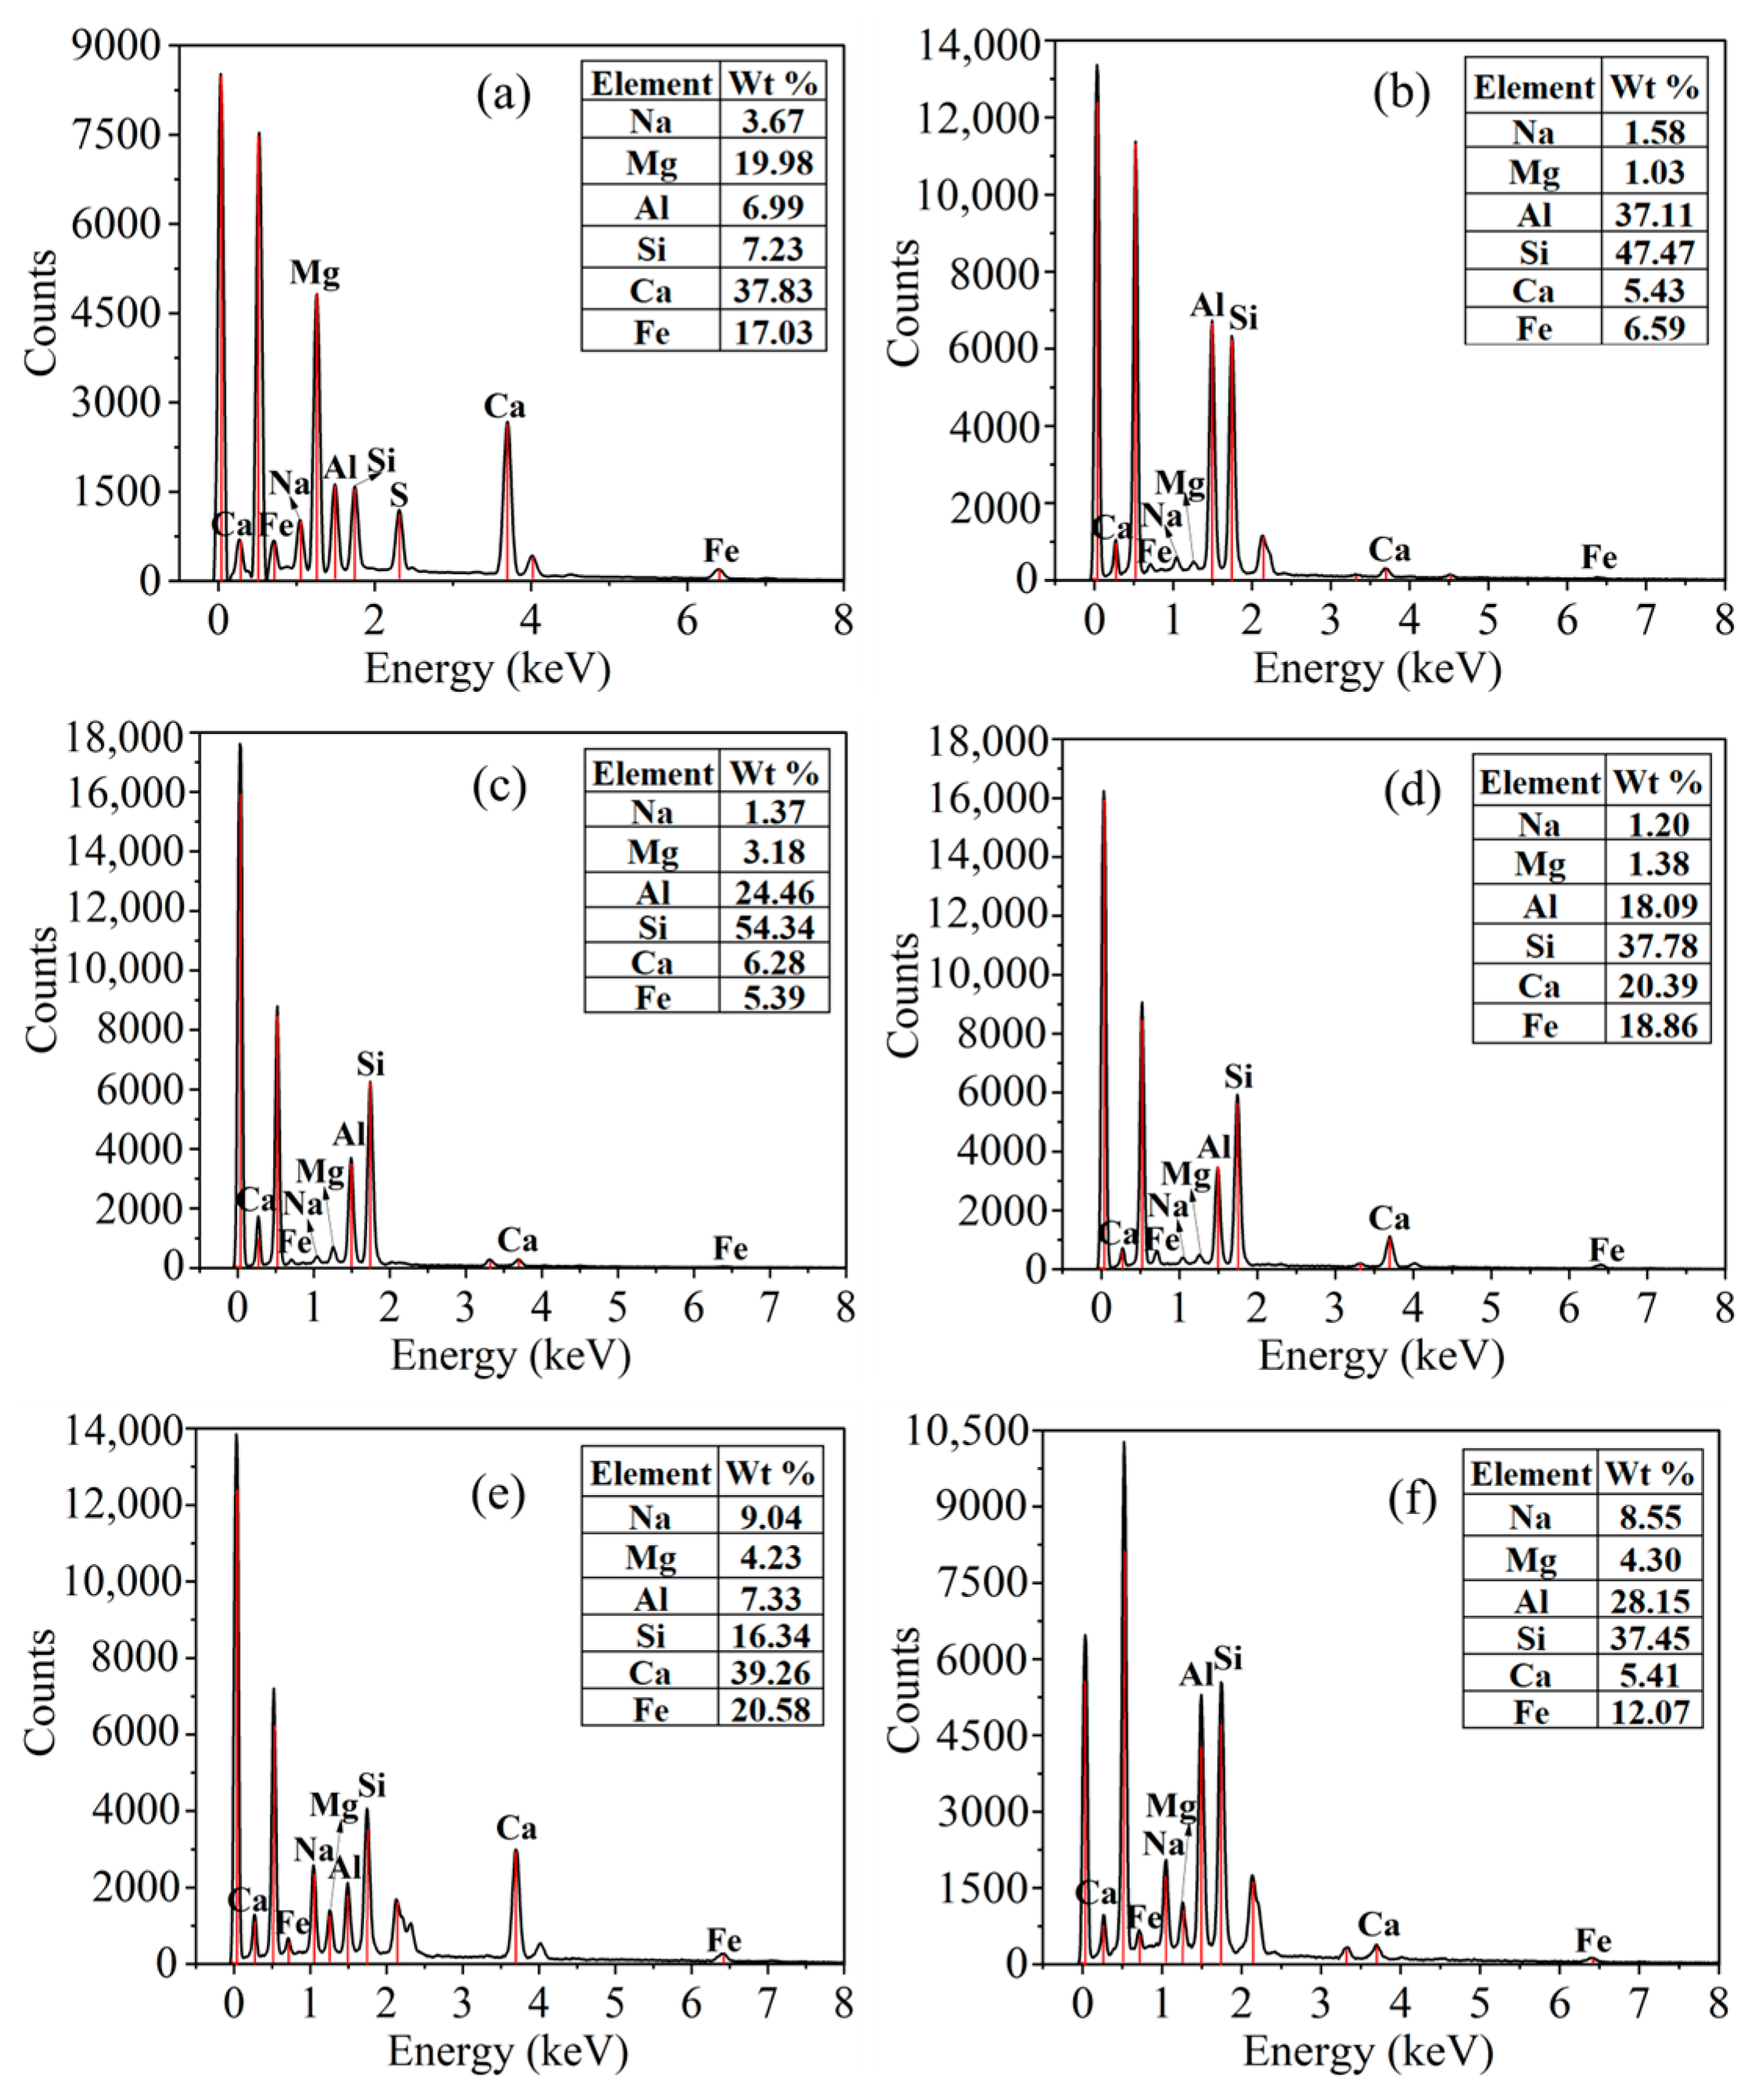
EDS analysis showed that the ash samples were primarily composed of Fe, Al, Ca, and Si (Figure 6), with their total content exceeding 85% in all samples (Figure 7). YL was notably enriched in Ca (37.83%) and Fe (17.03%), whereas HM and WQ contained high levels of Si (47.47–54.34%) and Al (24.46–37.11%). TF and ZD exhibited elevated contents of Ca (20.39–39.26%) and Fe (18.86–20.58%), whereas KB showed high contents of Si (37.45%) and Al (28.15%) and a notable Na content (8.55%). These patterns reflect variations in the original mineralogy, including silicates and oxides, and imply different melting behaviors at elevated temperatures. Samples rich in Ca and Fe (YL, TF, and ZD) tended to form low-melting-point eutectics, which corresponds to a higher slagging risk. Conversely, the Si- and Al-rich samples (HM and WQ) tended to form higher-melting-point phases, indicating a lower slagging risk. The high Na content in KB may lower the AFT, thereby facilitating slag formation. These insights enhance the understanding of the coal ash melting characteristics and slagging behavior under high-temperature conditions.
Figure 6.
Element mapping of the coal ash samples after combustion: (a) YL, (b) HM, (c) WQ, (d) TF, (e) ZD, and (f) KB.
Figure 7.
Elemental content of the coal ash samples determined by EDS: (a) YL, (b) HM, (c) WQ, (d) TF, (e) ZD, and (f) KB.
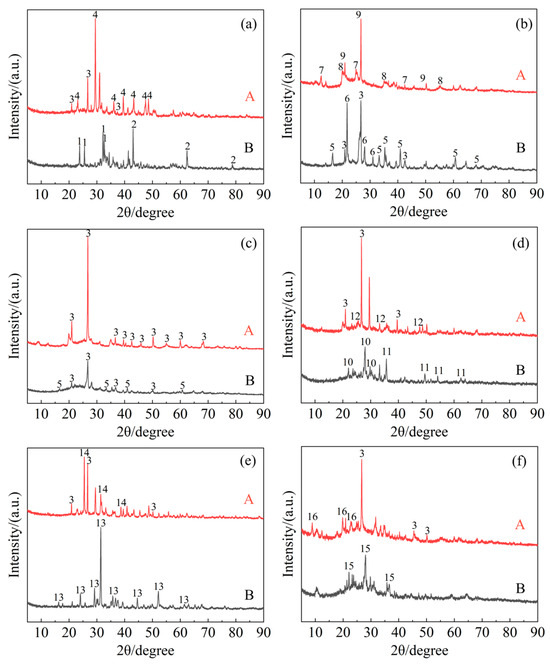
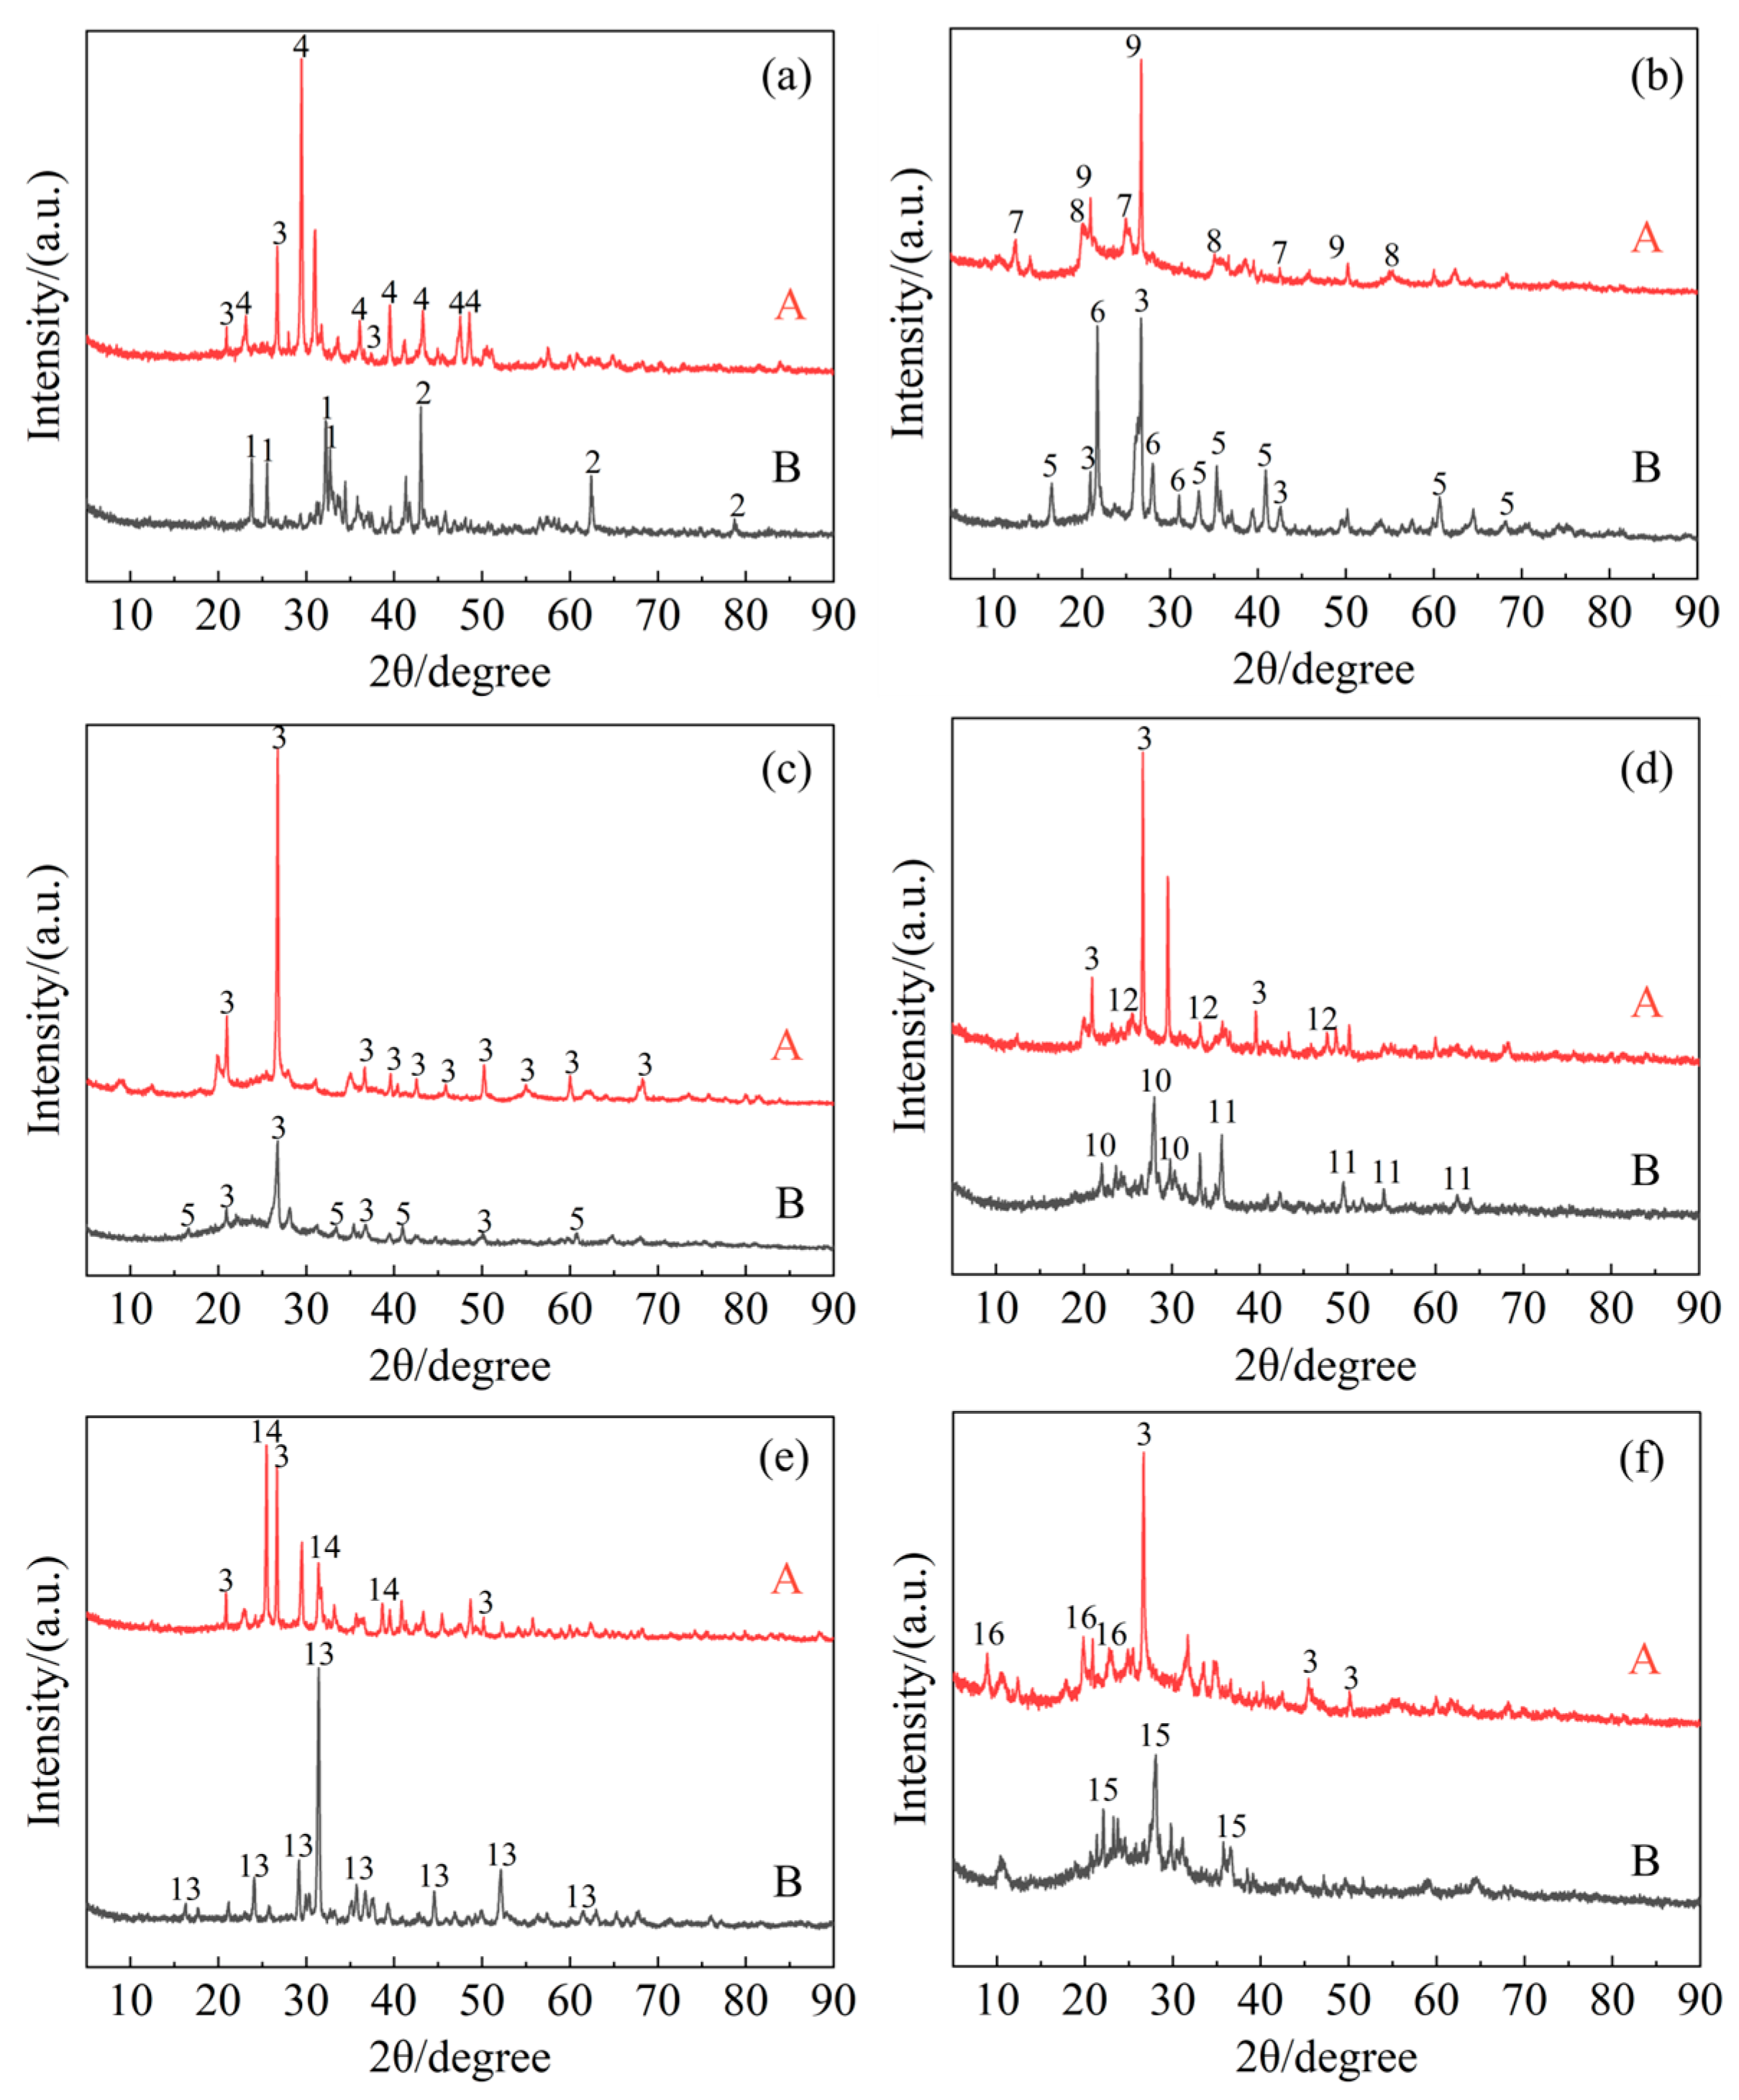
Figure 8 presents the XRD patterns of the raw coal and the ash samples after combustion at 1100 °C, highlighting considerable differences in mineral compositions. These mineralogical changes are closely linked to slagging risk. YL raw ash is dominated by high-melting minerals such as quartz (SiO2) and calcite (CaCO3), which result in a loose ash structure and low slagging tendency. At high temperatures, these phases transform into calcium silicate (Ca2SiO4), magnesia (MgO), and other silicate phases; the formation of low-melting eutectics and sintering promotes slagging. HM raw ash is mainly composed of kaolinite (Al2Si2O5(OH)4), muscovite (KAl2(AlSi3O10) (OH)2), and low dauphinee twinned (SiO2). Dehydration and layered structures promote the formation of porous ash, reducing the risk of slagging. Upon heating, mullite (Al4Si2O8), quartz (SiO2), and other refractory phases appear; mullite enhances refractoriness through sintering, while cristobalite may cause localized melting, yet the overall slagging tendency remains low. For WQ, raw ash is rich in quartz (SiO2), forming a stable skeleton that limits slagging. The high-temperature ash shows recrystallized mullite, elevating the melting temperature. TF raw ash contains quartz (SiO2), iron-bearing silicates, and other aluminosilicate minerals, showing moderate slagging risk. High-temperature ash features sodium-rich anorthite (Ca,Na) (Al,Si)4O8), and titanomagnetite (Fe–Ti oxides), where alkali and Fe–Ti oxides synergistically enhance slagging. ZD raw ash, dominated by quartz (SiO2), remains relatively stable. Upon heating, high-temperature ash contains akermanite (Ca2MgSi2O7), which acts as a flux to densify ash and lower its melting point, thereby promoting slagging. KB raw ash contains quartz (SiO2) and muscovite (KAl2(AlSi3O10) (OH)2), indicating a low slagging risk. After combustion, anorthite (CaAl2Si2O8) and related fluxing minerals promote sintering and ash melting through Na–Ca–Mg interactions.
Figure 8.
XRD patterns of the samples: (A) raw coal, (B) ash samples after combustion at 1100 °C; (a) YL, (b) HM, (c) WQ, (d) TF, (e) ZD, and (f) KB. [1. calcium silicate (Ca2SiO4), 2. magnesia (MgO), 3. quartz (SiO2), 4. calcite (CaCO3), 5. mullite (Al4Si2O8), 6. cristobalite (SiO2), 7. kaolinite (Al2Si2O5(OH)4), 8. muscovite (KAl2(AlSi3O10)(OH)2), 9. low dauphinee twinned (SiO2), 10. sodium-rich anorthite ((Ca,Na) (Al,Si)4O8), 11. titanomagnetite (Fe–Ti oxides), 12. lithium cuprate (LiCuO), 13. akermanite (Ca2MgSi2O7), 14. anhydrite (CaSO4), 15. anorthite (CaAl2Si2O8), 16. muscovite 2M1 (KAl2(AlSi3O10)(OH)2)].
3.1.2. Ash Composition Analysis
Based on their acid–base characteristics, oxides can be divided into acidic oxides (SiO2, SO3, P2O5, and TiO2), basic oxides (Na2O, CaO, K2O, MgO, and Fe2O3), and amphoteric oxides (Al2O3 and ZnO) [29]. Table 3 presents the oxide contents of ash samples obtained via XRF. The results indicate that the oxide compositions vary among the different ash samples. HM and WQ showed high Al2O3 contents (33.14% and 20.71%, respectively), and Al2O3 can react with SiO2 to form high-melting-point aluminosilicates, thus inhibiting slagging. In contrast, YL and ZD showed higher concentrations of basic oxides, with combined CaO and Fe2O3 contents of 61.94% and 51.24%, respectively. When the CaO content exceeds 30% (44.29% in YL and 34.46% in ZD), its interaction with Fe2O3 facilitates the formation of low-melting-point eutectics, thereby increasing the risk of slagging. The TF sample exhibited an abnormally high SO3 content (21.28%), and SO3 tends to form low-melting-point compounds. The KB sample exhibited elevated SiO2 (55.08%) and Na2O (6.75%) contents, indicating a tendency to form sodium silicate glass phases. The ZD sample also showed a relatively high chlorine content (4.36%), and chlorine may react with alkali metals and hydrogen to generate volatile aerosols. These aerosols may accumulate on the boiler surfaces, leading to the formation of adhesive slag layers.
Table 3.
Oxide composition of ash from different coal samples.
Table 3 shows that high-slagging samples (YL, ZD) are enriched in basic oxides, while low-slagging samples (HM, WQ) are dominated by acidic oxides. TF has exceptionally high SO3, and KB contains significant Na2O and SiO2, both of which can promote slagging. One-way ANOVA on total basic oxides (CaO + Fe2O3 + Na2O + K2O + MgO) between high-slagging (TF, ZD, KB) and low-slagging (HM, WQ) groups showed a significantly higher mean in the high-slagging group (p = 0.031), confirming that alkaline oxide enrichment is statistically linked to increased slagging risk.
3.2. E-TOPSIS for Evaluation of Ash Sample Slagging
Based on a comprehensive analysis of coal properties, key factors affecting high-temperature slagging tendency were identified. Eight coal quality indicators were selected to establish a unified evaluation system, reflecting coal slagging tendency from ash composition, high-temperature phase transformation, and slagging/fouling potential. The B/A, S/A, silica ratio (S), and F/C ratio characterize compositional and adhesive effects, while Rs, RFu, DT, and ST evaluate overall slagging/fouling risk and ash fusion behavior.
Table 4 presents the eight major indicators and the slagging tendencies of the six coal samples, with the risk levels visually represented through color coding. The results reveal substantial discrepancies among different evaluation indices when applied to the same sample. For instance, the YL sample exhibited a high slagging risk based on the B/A ratio and S index, whereas its S/A ratio suggested a low slagging risk. A similar pattern was observed for the KB sample, where the S and Rs indices indicated low risk, whereas the S/A ratio suggested a high risk. In contrast, the evaluations for ZD and TF were relatively consistent. The WQ sample, which contains both a high S/A ratio (tending to lower slagging) and a certain content of basic oxides (increasing fusibility), received a medium risk rating—representing a compromise among conflicting indicators. These inconsistencies highlight the necessity of a multi-criteria approach such as E-TOPSIS.
Table 4.
Eight major indicators based on experimental data.
To overcome the limitations of individual indicators, these parameters were selected to construct a comprehensive discriminant index, and the TOPSIS method was applied to perform an integrated slagging risk evaluation for the six coal samples (YL, HM, WQ, TF, ZD, and KB). The data presented in Table 3 and the calculation procedure of the entropy method are also introduced. First, the initial evaluation matrix X was constructed as shown in Equation (17). Subsequently, matrix X was normalized: B/A, S/A, F/C, Rs, and RFu were processed using Equation (2), whereas DT, ST, and S were normalized employing Equation (3). As a result, the normalized matrix Y (Equation (18)) was obtained. The entropy method was then used to determine the weight of each index. The entropy values were calculated via Equations (5) and (6) (Equation (19)), followed by weight determination as per Equation (20).
The normalized matrix Y was then weighted using Equation (8) to generate the weighted decision matrix Z (Equation (21)), and the positive and negative ideal values (Equation (22)) were determined using Equations (10) and (11).
The Euclidean distance formulas (Equations (12) and (13)) were applied to calculate the distance between each sample and the positive and negative ideal solutions. The relative proximities of the ash samples to the ideal solution were calculated using Equation (14) and ranked. The relative proximity (C) ranges from 0 to 1, with higher values indicating lower slagging risk. The C can be divided into three grades to characterize the degree of slagging of the evaluation object (C < 0.5 high; 0.5 ≤ C ≤ 0.6 medium; C > 0.6 low).
The EW method takes into account the correlation between the indices and determines the weight of each index based on the degree of data discretization. Then, the TOPSIS method is applied to synthesize multiple indices through the obtained weights, ultimately providing a comprehensive evaluation using the E-TOPSIS method, as shown in Table 5. The slagging tendency of the six coal samples from low to high is HM, YL, WQ, TF, KB, and ZD. It can be seen that TF, KB, and ZD exhibit severe slagging, while HM has the highest C value, indicating minimal slagging risk; WQ and YL are classified as medium risk. The results are generally consistent with the trends of ash composition and fusion behavior presented in Section 3.1. The slight deviation observed for WQ may be attributed to its ash containing both a high S/A ratio, which tends to lower slagging, and a certain content of basic oxides, which increase fusibility, resulting in a medium risk rating rather than a purely low risk. Overall, the E-TOPSIS method effectively reduces the impact of anomalous indicator values, improving the accuracy of slagging risk evaluation.
Table 5.
Slagging tendency estimation results of ash samples by E-TOPSIS method.
3.3. Fractal Dimension of Slag Morphology
Although the aforementioned comprehensive evaluation model generally meets the accuracy requirements for determining the slagging tendency of high-alkali coal, it primarily takes into account the ash chemical composition and fusion characteristics. As discussed in Section 3.1.1, ash residue images can qualitatively reflect slagging tendencies to some extent; for instance, variations in crack density and distribution may be associated with ash composition and fusion behavior. However, conducting a systematic and quantitative comparison among different samples based solely on image observation remains difficult. Therefore, in this study, the box-counting fractal dimension was employed as a quantitative metric for the systematic evaluation of the complexity of coal ash fracture networks and their relationship with slagging behavior.
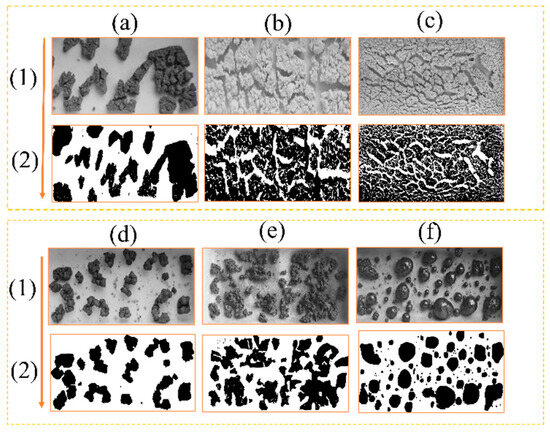
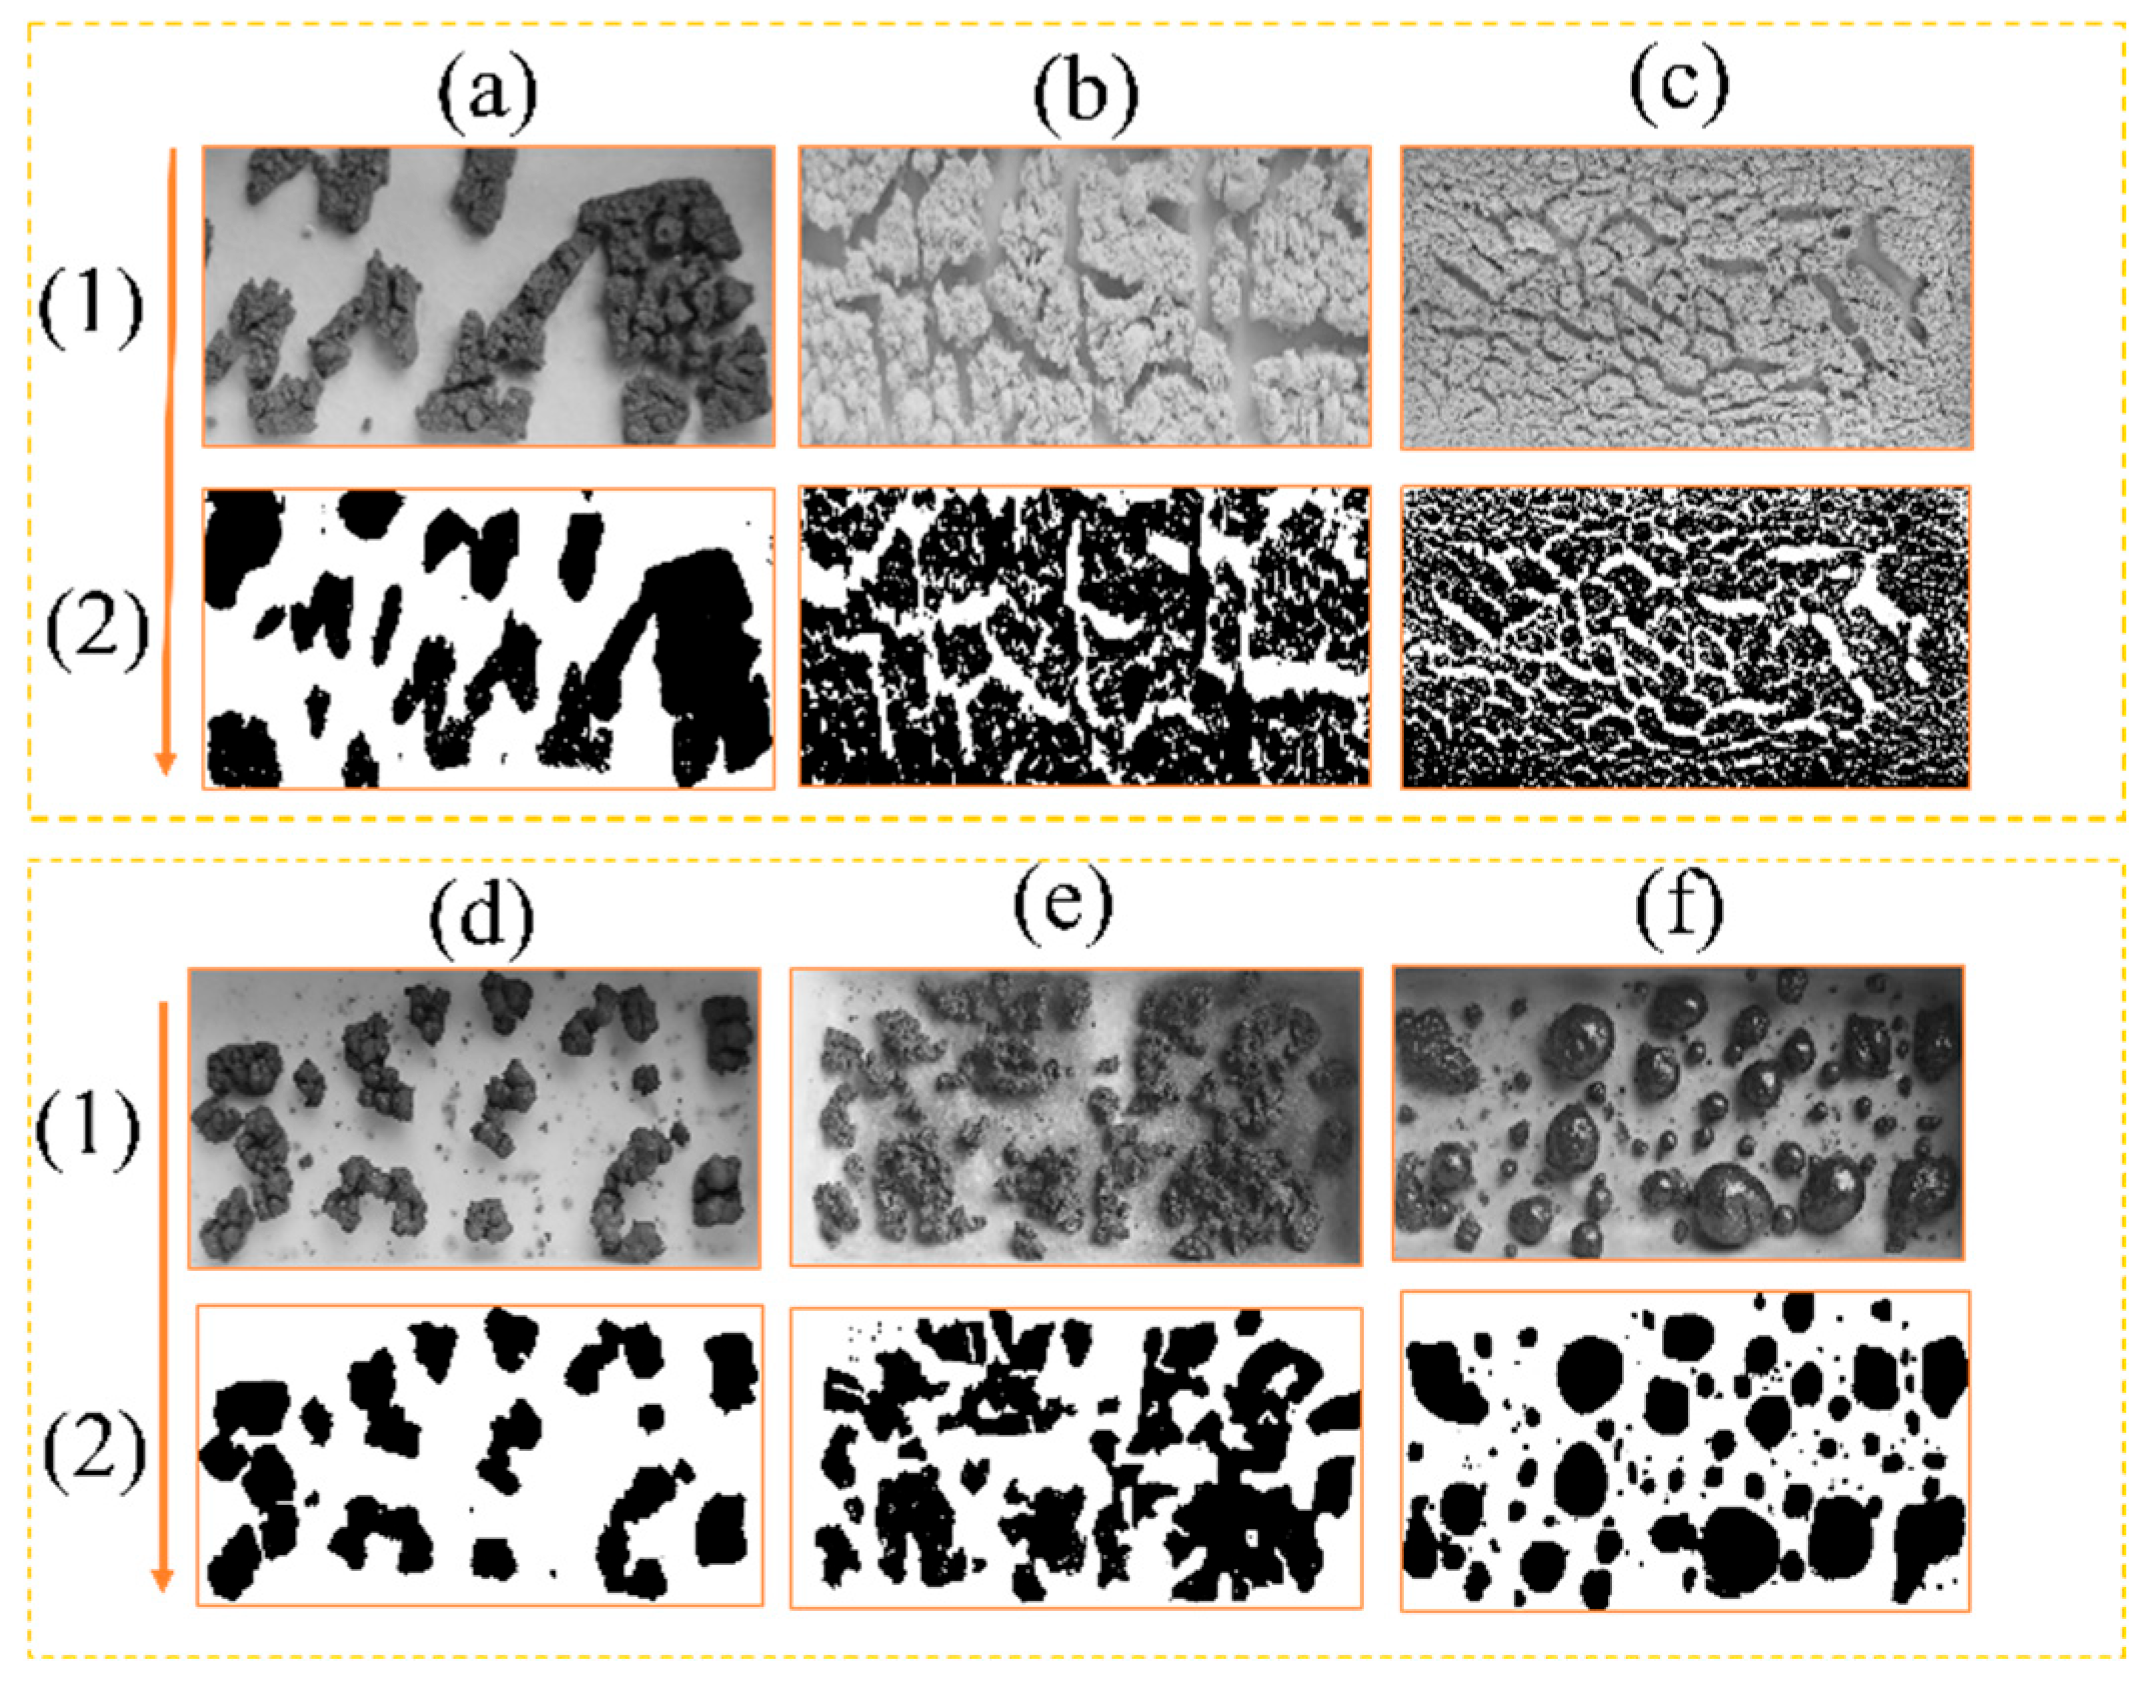
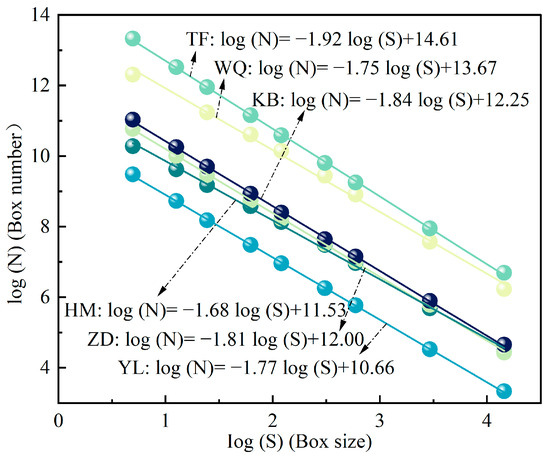
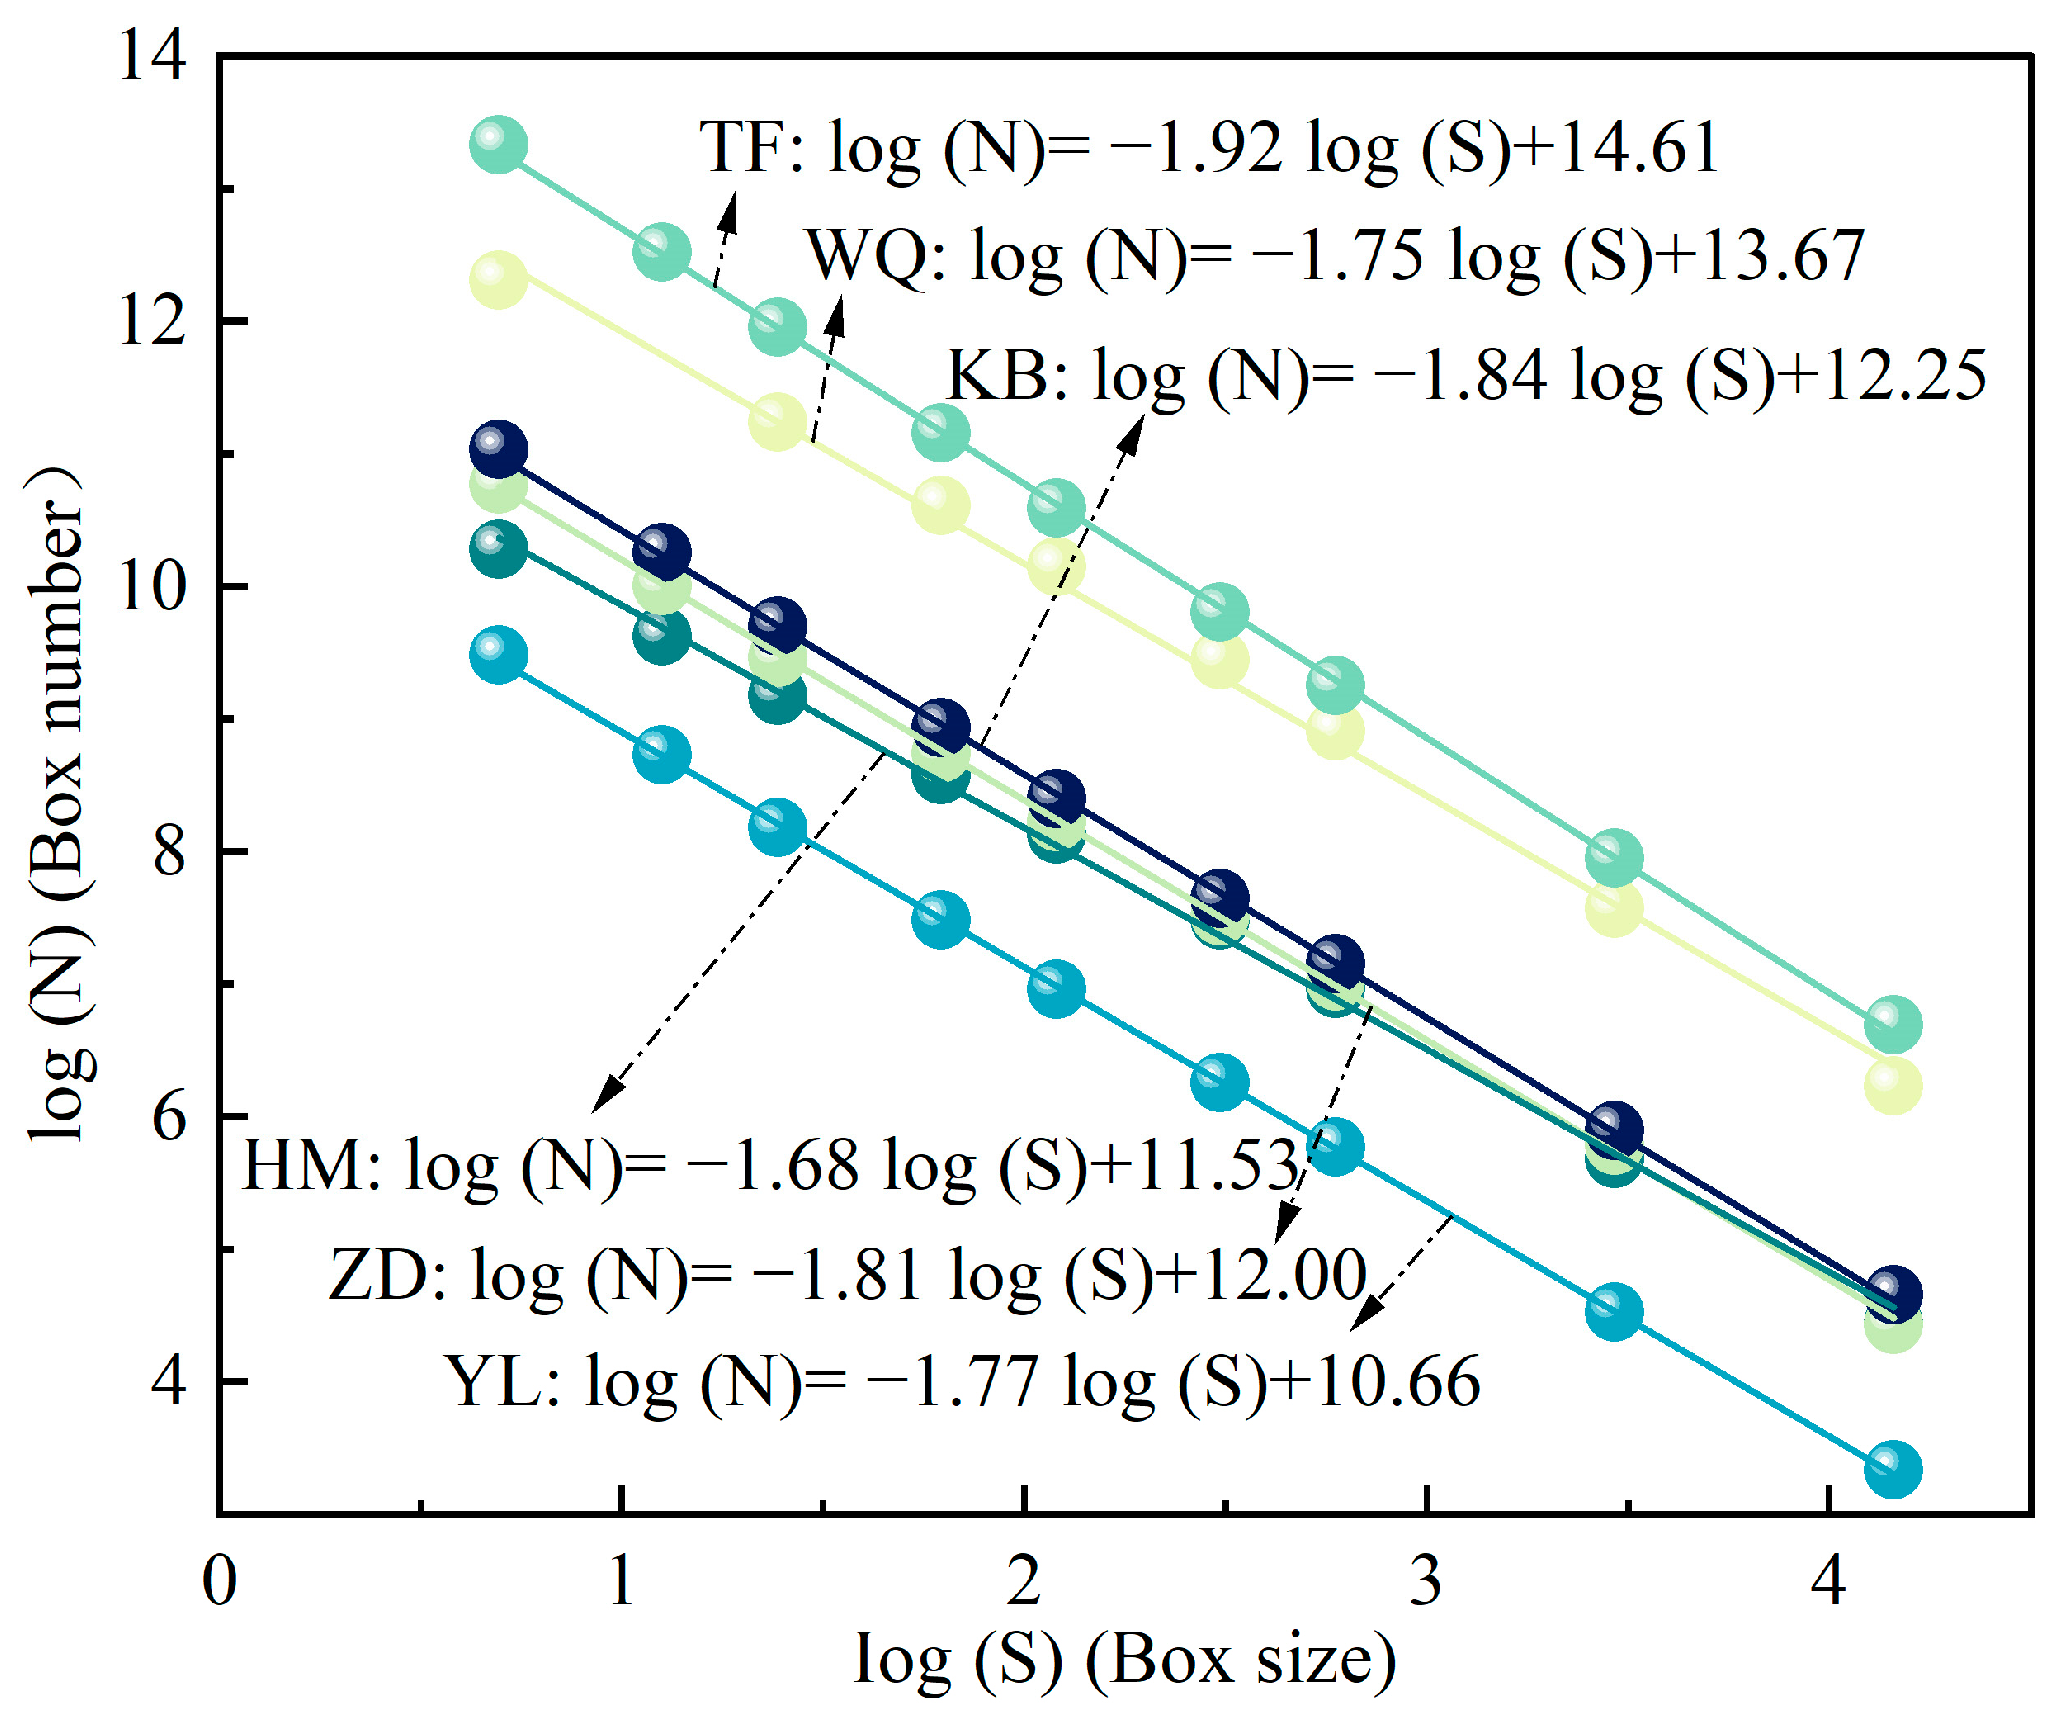
As shown in Figure 9, the distribution of fractures in the binarized images varies significantly among samples and exhibits distinct fractal dimension values (Figure 10). All fitted curves in Figure 10 have correlation coefficients above 0.99, indicating that the fracture networks on the coal ash surface possess pronounced fractal characteristics.
Figure 9.
Coal ash images: (1) Grayscale image; (2) Binary image; (a) YL, (b) HM, (c) WQ, (d) TF, (e) ZD, and (f) KB.
Figure 10.
Computational fitting results for fractal results.
The fractal dimension (D) values differ notably among the samples, in the following order: TF (1.92) > KB (1.84) > ZD (1.81) > YL (1.77) > WQ (1.75) > HM (1.68). Samples with higher D values (TF, KB, and ZD) display sparse and simple fracture networks, with particles mostly distributed independently or forming large pores, suggesting that the ash melts easily and agglomerates at high temperatures, corresponding to a high slagging risk. The YL sample, with an intermediate D value, exhibits a hybrid fracture network combining sparse and locally dense regions, indicating a light to moderate slagging risk. In contrast, samples with lower D values (HM and WQ) have highly dense and interconnected fracture networks, with higher ash fusion temperatures and more difficult melting, resulting in a low slagging risk. The results are consistent with the slagging tendency results obtained from experiments, confirming the feasibility of the fractal dimension method.
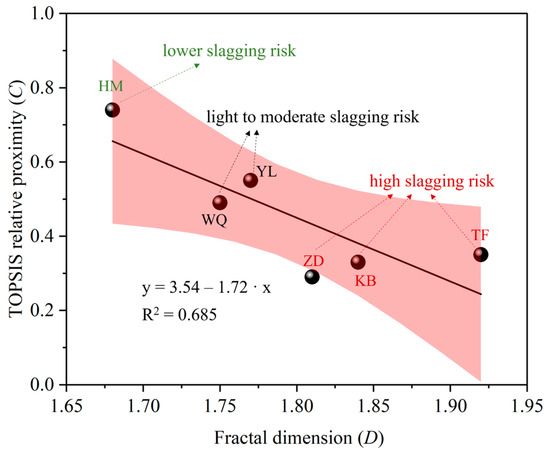
The evaluation of slagging tendency for the six coal samples indicates a clear overall negative correlation between the fractal dimension (D) and the E-TOPSIS relative proximity (C), as shown in Figure 11. Samples with higher fractal dimensions (TF, KB, and ZD) exhibit sparse fracture networks and a pronounced tendency to melt, corresponding to lower C values and higher slagging risks. In contrast, the sample with the lowest fractal dimension (HM) has a dense fracture network and is more resistant to melting, showing a higher C value and a lower slagging risk. The YL and WQ samples fall at intermediate levels, exhibiting light to moderate slagging tendencies.
Figure 11.
Correlation between E-TOPSIS relative proximity (C) and fractal dimension (D).
Although the overall trend is consistent, there are slight differences in the ranking of individual samples between the two methods. The E-TOPSIS assessment indicates that ZD has the highest risk, whereas fractal dimension analysis identifies TF has the sparsest fractures and the most pronounced melting structures; the ranking of WQ also differs between the two methods. These discrepancies mainly arise from differences in methodological focus: the fractal dimension reflects the morphology of the coal ash fracture network after melting, while E-TOPSIS comprehensively considers the coal’s chemical composition, mineralogy, and physical properties. Such a combined strategy is expected to gain broader application beyond the specific samples studied here.
4. Conclusions
This study systematically evaluated the slagging tendencies of six high-alkali coals by integrating advanced characterization techniques with a novel methodology that combines the E-TOPSIS model and fractal dimension analysis. The main conclusions are as follows:
- (1)
- Coal samples TF, ZD, and KB, which are rich in alkaline oxides such as CaO and Fe2O3, tend to form low-melting-point eutectic silicates during combustion, with significant ash agglomeration and high slagging tendency. In contrast, HM and WQ, dominated by acidic oxides (SiO2 and Al2O3), form high-melting-point mullite and quartz, with loose ash and low slagging tendency. The YL sample exhibits balanced acidic and alkaline characteristics, with moderate slagging tendency.
- (2)
- The established E-TOPSIS model effectively integrated eight common slagging indices, overcoming the limitations and inconsistencies of single-index assessments. The slagging risk was ranked from high to low as ZD, KB, TF, WQ, YL, and HM, with corresponding relative closeness (C) values of 0.29, 0.33, 0.35, 0.50, 0.55, and 0.74. Lower C values correspond to higher slagging tendency.
- (3)
- Higher fractal dimension values of ash morphology images (ZD = 1.81, KB = 1.84, TF = 1.92) indicate significant melting and agglomeration, with wide fractures and strong slagging tendency. The fractal dimension values are significantly negatively correlated with the E-TOPSIS model results (y = 3.54 − 1.72x). These results demonstrate that fractal analysis can rapidly assess slagging tendency without complex chemical testing, providing valuable reference for predicting the slagging tendency of high-alkali coal during combustion.
Author Contributions
J.Y.: Methodology, Data curation, Visualization, Writing-original draft. K.W.: Conceptualization, Methodology, Supervision, Writing—review & editing, Funding acquisition. M.G.: Formal analysis. Data curation. Q.H.: Data curation. Z.M.: Supervision, Project administration. All authors have read and agreed to the published version of the manuscript.
Funding
This research was funded by the National Key R&D Program of China grant number 2023YFE0100600. The APC was funded by the corresponding authors.
Data Availability Statement
The data presented in this study are available on request from the corresponding authors.
Conflicts of Interest
The authors declare no conflict of interest.
References
- Wang, C.; Zhao, L.; Sun, R.; Zhou, L.; Jin, L.; Che, D. Experimental Study on NO Emission and Ash Deposition during Oxy-Fuel Combustion of High-Alkali Coal under Oxygen-Staged Conditions. Energy 2022, 251, 123875. [Google Scholar] [CrossRef] [Scilit]
- Liu, J.; Ma, G.; Du, Y.; Wang, C.; Zhao, Y.; Wu, W.; Shi, L.; Zhao, L.; Che, D. Simulation Study on Mineral Transformation Behaviors and Ash Fusion Characteristics during High-Alkali Coal Combustion under Deep Peaking Conditions. Fuel 2025, 399, 135662. [Google Scholar] [CrossRef] [Scilit]
- Raza, M.A.; Karim, A.; Aman, M.M.; Al-Khasawneh, M.A.; Faheem, M. Global Progress towards the Coal: Tracking Coal Reserves, Coal Prices, Electricity from Coal, Carbon Emissions and Coal Phase-Out. Gondwana Res. 2025, 139, 43–72. [Google Scholar] [CrossRef] [Scilit]
- Wang, C.; Fan, G.; Sun, R.; Wang, C.; Chen, W.; Che, D. Effects of Coal Blending on Transformation of Alkali and Alkaline-Earth Metals and Iron during Oxy-Fuel Co-Combustion of Zhundong Coal and High-Si/al Coal. J. Energy Inst. 2021, 94, 96–106. [Google Scholar] [CrossRef] [Scilit]
- Wang, C.; Tang, G.; Sun, R.; Hu, G.; Yuan, M.; Che, D. The Correlations of Chemical Property, Alkali Metal Distribution, and Fouling Evaluation of Zhundong Coal. J. Energy Inst. 2020, 93, 2204–2214. [Google Scholar] [CrossRef] [Scilit]
- Hu, S.; Ni, Y.; Yin, Q.; Wang, J.; Lv, L.; Cen, K.; Zhou, H. Research on Element Migration and Ash Deposition Characteristics of High-Alkali Coal in Horizontal Liquid Slagging Cyclone Furnace. Fuel 2022, 308, 121962. [Google Scholar] [CrossRef] [Scilit]
- Ni, Y.; Hu, S.; Zhang, Y.; Zhang, M.; Li, H.; Zhou, H. Research on the Effects of the Fly Ash Reburning on Element Migration and Ash Deposition Characteristics of High-Alkali Coal in a Full-Scale Slag-Tapping Boiler. Fuel 2023, 335, 126952. [Google Scholar] [CrossRef] [Scilit]
- Park, H.Y.; Lee, J.E.; Kim, H.H.; Park, S.; Baek, S.H.; Ye, I.; Ryu, C. Thermal Resistance by Slagging and Its Relationship with Ash Properties for Six Coal Blends in a Commercial Coal-Fired Boiler. Fuel 2019, 235, 1377–1386. [Google Scholar] [CrossRef] [Scilit]
- Novendianto, I.B.; Utomo, M.S.K.T.S.; Muchammad, M.; Kuswa, F.M.; Ghazidin, H.; Karuana, F.; Santoso, P.A.; Prismantoko, A.; Cahyo, N.; Kusmiyati, K.; et al. Investigation of the Slagging and Fouling Aspects of Co-Firing Coal and Organic Refuse-Derived Fuel. Therm. Sci. Eng. Prog. 2024, 49, 102447. [Google Scholar] [CrossRef] [Scilit]
- Hariana; Prismantoko, A.; Prabowo; Hilmawan, E.; Darmawan, A.; Aziz, M. Effectiveness of Different Additives on Slagging and Fouling Tendencies of Blended Coal. J. Energy Inst. 2023, 107, 101192. [Google Scholar] [CrossRef] [Scilit]
- Li, F.; Yu, B.; Wang, G.; Fan, H.; Wang, T.; Guo, M.; Fang, Y. Investigation on Improve Ash Fusion Temperature (AFT) of Low-AFT Coal by Biomass Addition. Fuel Process. Technol. 2019, 191, 11–19. [Google Scholar] [CrossRef] [Scilit]
- Yang, Y.; Huang, Q.; Ma, P.; Li, S. Mechanistic Studies on the Slagging Propensity in Low-Rank Coal Combustion. Combust. Flame 2022, 238, 111956. [Google Scholar] [CrossRef] [Scilit]
- Wang, Y.; Jin, J.; Liu, D.; Yang, H.; Kou, X. Understanding Ash Deposition for Zhundong Coal Combustion in 330 MW Utility Boiler: Focusing on Surface Temperature Effects. Fuel 2018, 216, 697–706. [Google Scholar] [CrossRef] [Scilit]
- Zhu, C.; Tu, H.; Bai, Y.; Ma, D.; Zhao, Y. Evaluation of Slagging and Fouling Characteristics during Zhundong Coal Co-Firing with a Si/al Dominated Low Rank Coal. Fuel 2019, 254, 115730. [Google Scholar] [CrossRef] [Scilit]
- Yang, H.; Jin, J.; Hou, F.; He, X.; Hang, Y. An ANN-Based Method for Predicting Zhundong and Other Chinese Coal Slagging Potential. Fuel 2021, 293, 120271. [Google Scholar] [CrossRef] [Scilit]
- Seker, M.; Kartal, N.U.; Karadirek, S.; Gulludag, C.B. The Application of Different Optimization Techniques and Artificial Neural Networks (ANN) for Coal-Consumption Forecasting: A Case Study. Gospod. Surowcami Miner.—Miner. Resour. Manag. 2022, 38, 77–112. [Google Scholar] [CrossRef] [Scilit]
- Yang, Y.; Wang, B.; Yuan, Q.; Huang, D.; Peng, H. Characterization, Factors, and Fractal Dimension of Pore Structure of Fly Ash-Based Geopolymers. J. Mater. Res. Technol. 2023, 26, 3395–3407. [Google Scholar] [CrossRef] [Scilit]
- Tomé, A.G.; Ribeiro, E.A.M.; Lima, M.; Brocenschi, R.F.; Ribeiro, L.N.M.; Amaral, E.F.A. Biorefinery of Peanut Shell Agroindustrial Lignocellulosic Waste for Synthesis of a Natural Coagulant Applied in the Treatment of Dairy Wastewater. J. Environ. Chem. Eng. 2023, 11, 111535. [Google Scholar] [CrossRef] [Scilit]
- Zhou, G.; Jiang, L.; Chen, G.; Ma, Y.; Wang, Y.; Liu, R. Electrospun Porous Polyacrylonitrile/Polyvinylpyrrolidone Nanofiber Membrane with Ultra-Hydrophilic and High Moisture-Permeability for Dust Personal Protection. J. Environ. Chem. Eng. 2024, 12, 113524. [Google Scholar] [CrossRef] [Scilit]
- Shi, X.; Pan, J.; Hou, Q.; Jin, Y.; Wang, Z.; Niu, Q.; Li, M. Micrometer-Scale Fractures in Coal Related to Coal Rank Based on Micro-CT Scanning and Fractal Theory. Fuel 2018, 212, 162–172. [Google Scholar] [CrossRef] [Scilit]
- Cai, J.; Yu, Z.; Yang, S.; Tang, J.; Ma, Z.; Xie, X.; Hu, X. Fractal Characteristics of Coal Surface Structure during Low-Temperature Oxidation and Its Effect on Oxidizability. Energy 2023, 284, 128526. [Google Scholar] [CrossRef] [Scilit]
- Wang, D.; Yang, H.; Wu, Y.; Zhao, C.; Ju, F.; Wang, X.; Zhang, S.; Chen, H. Evolution of Pore Structure and Fractal Characteristics of Coal Char during Coal Gasification. J. Energy Inst. 2020, 93, 1999–2005. [Google Scholar] [CrossRef] [Scilit]
- Li, Z.; Liu, D.; Cai, Y.; Wang, Y.; Teng, J. Adsorption Pore Structure and Its Fractal Characteristics of Coals by N2 Adsorption/Desorption and FESEM Image Analyses. Fuel 2019, 257, 116031. [Google Scholar] [CrossRef] [Scilit]
- Chen, T.-L.; Chen, L.-H.; Chen, Y.-H.; Soto, N.F.R.; Chen, Y.-H.; Ma, H.; Chiang, P.-C. A Systematic Approach to Evaluating Environmental-Economic Benefits of High-Gravity Technology for Flue Gas Purification and Municipal Solid Waste Incineration Fly Ash Utilization. J. Environ. Chem. Eng. 2021, 9, 106438. [Google Scholar] [CrossRef] [Scilit]
- Dehghani, Z.; Rahimpour, M.R.; Shariati, A. Simulation and Multi-Objective Optimization of a Radial Flow Gas-Cooled Membrane Reactor, Considering Reduction of CO2 Emissions in Methanol Synthesis. J. Environ. Chem. Eng. 2021, 9, 104910. [Google Scholar] [CrossRef] [Scilit]
- Chen, C.; Bi, Y.; Huang, Y.; Huang, H. Review on Slagging Evaluation Methods of Biomass Fuel Combustion. J. Anal. Appl. Pyrolysis 2021, 155, 105082. [Google Scholar] [CrossRef] [Scilit]
- Chen, C.; Huang, Y.; Qin, S.; Huang, D.; Bu, X.; Huang, H. Slagging Tendency Estimation of Aquatic Microalgae and Comparison with Terrestrial Biomass and Waste. Energy 2020, 194, 116889. [Google Scholar] [CrossRef] [Scilit]
- Prayoga, M.Z.E.; Putra, H.P.; Wargadalam, V.J.; Surachman, H.; Luktyansyah, I.M.; Saudah, S.; Darmawan, A.; Aziz, M.; Prabowo, P.; Wang, Y.; et al. Thermal Characteristics and Slagging-Fouling Analysis in Co-Combustion of Coal and Oil Palm Waste Mixtures. Energy 2025, 319, 134908. [Google Scholar] [CrossRef] [Scilit]
- Zhang, L.; Ke, D.; Yan, J.; Lei, Z.; Li, Z.; Zhang, W.; Kang, S.; Wang, Z.; Ren, S.; Shui, H. Ash Melting Behaviors of High-Sodium Coal and Its Co-Combustion with Coal Gangue to Inhibit Slagging. Fuel 2024, 367, 131537. [Google Scholar] [CrossRef] [Scilit]
- Zhao, W.; Song-song, Z.; Li, G.; Guo-li, Q. Prediction Method of Coal Slagging Property in Layer-Fired Boiler. IOP Conf. Ser. Mater. Sci. Eng. 2020, 721, 012003. [Google Scholar] [CrossRef] [Scilit]
- Le Roux, D.; Olivès, R.; Neveu, P. Combining Entropy Weight and TOPSIS Method for Selection of Tank Geometry and Filler Material of a Packed-Bed Thermal Energy Storage System. J. Clean. Prod. 2023, 414, 137588. [Google Scholar] [CrossRef] [Scilit]
- Li, Z.; Luo, Z.; Wang, Y.; Fan, G.; Zhang, J. Suitability Evaluation System for the Shallow Geothermal Energy Implementation in Region by Entropy Weight Method and TOPSIS Method. Renew. Energy 2022, 184, 564–576. [Google Scholar] [CrossRef] [Scilit]
- Banadkouki, M.R.Z. Selection of Strategies to Improve Energy Efficiency in Industry: A Hybrid Approach Using Entropy Weight Method and Fuzzy TOPSIS. Energy 2023, 279, 128070. [Google Scholar] [CrossRef] [Scilit]
- De Miras, J.R.; Li, Y.; León, A.; Arroyo, G.; López, L.; Torres, J.C.; Martín, D. Ultra-Fast Computation of Fractal Dimension for RGB Images. Pattern Anal. Appl. 2025, 28, 36. [Google Scholar] [CrossRef] [Scilit]

Disclaimer/Publisher’s Note: The statements, opinions and data contained in all publications are solely those of the individual author(s) and contributor(s) and not of MDPI and/or the editor(s). MDPI and/or the editor(s) disclaim responsibility for any injury to people or property resulting from any ideas, methods, instructions or products referred to in the content. |
© 2026 by the authors. Licensee MDPI, Basel, Switzerland. This article is an open access article distributed under the terms and conditions of the Creative Commons Attribution (CC BY) license.