


Abstract
This work performed a sensitivity analysis based on a conventional extractive distillation system to thoroughly evaluate the cost of separating bioethanol from water. The analysis considers the compositions and production volumes that are likely to result from the fermentation process of various biorefineries, regardless of their specific generation. It also outlines how the cost of bioethanol purification decreases as the ethanol concentration in the fermentation broth increases. For each composition-flow point in a gridded workspace, a distillation train was designed using the Aspen Plus® simulation framework, focusing on minimizing the total annual cost. The results are discussed graphically, illustrating total annual costs and specific column costs in relation to feed stream composition and inflow. The findings quantitatively demonstrate that the cost of separation per mass unit of anhydrous ethanol decreases with higher inflow and increased input ethanol concentration. Additionally, it is evident that the primary cost is associated with the preconcentrator column.
1. Introduction
For several decades, research and development on biofuels has been increasing because they represent renewable and environmentally friendly sources of energy; specifically, bioethanol is poised for large-scale production and consumption, with worldwide production increasing to 31.21 billion gallons in 2024 [1]. Some reasons for such growth include the abundance of its raw material (cellulosic material) worldwide, the mature technical feasibility of its production process, its ability to power motor vehicles, and the fact that its use in gasoline reduced CO2-equivalent greenhouse gas emissions from the transportation sector by 54.3 million metric tons in 2024 [2].
The process steps in the transformation chain to produce bioethanol depend on the raw materials [3,4]. This process involves two key stages: fermentation, in which reducing sugars are converted to ethanol, and purification, where the ethanol–water mixture from the fermenter is separated. Two important aspects of the purification process should be noted: (i) the ethanol produced during fermentation is very dilute, ranging from 1.1% to 12.4%wt., depending on the microorganism and conditions used [5], resulting in a significant portion of the energy being used for water removal, and (ii) the ethanol–water mixture forms an azeotrope at 95%wt., making conventional distillation not enough for producing fuel-grade ethanol (e.g., ethanol at 99.5%wt.). Consequently, purification is one of the stages with the highest energy consumption [6,7].
The open literature presents numerous studies proposing various separation process configurations aimed at reducing purification costs [8,9]. Examples include pervaporation, evaporation, adsorption with molecular sieves, pressure-swing distillation, vacuum distillation, extractive distillation, azeotropic distillation, and hybrid methods [10]. All these methods either involve or assume an initial distillation process to elevate the ethanol–water mixture from the fermenter to an ethanol composition near the azeotropic point. In the subsequent step focused on dehydrating the ethanol, distillation-based processes are predominantly used, though they require a substantial amount of energy [11]. Although membrane-based technologies are effective, their high costs impede industrial adoption. Conversely, adsorption systems eliminate the need for solvents; however, they necessitate adsorbents with high selectivity, and the desorption process for recovery demands significant energy consumption [12]. Ultimately, extractive distillation remains the most viable option for large-scale bioethanol fuel production, despite its elevated energy costs [9,13,14].
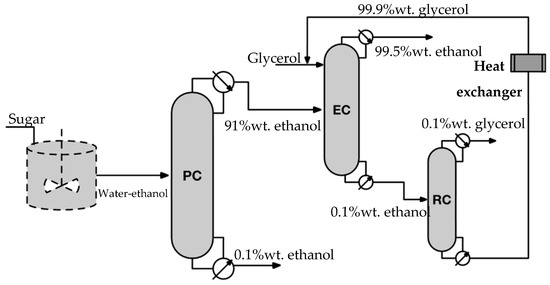
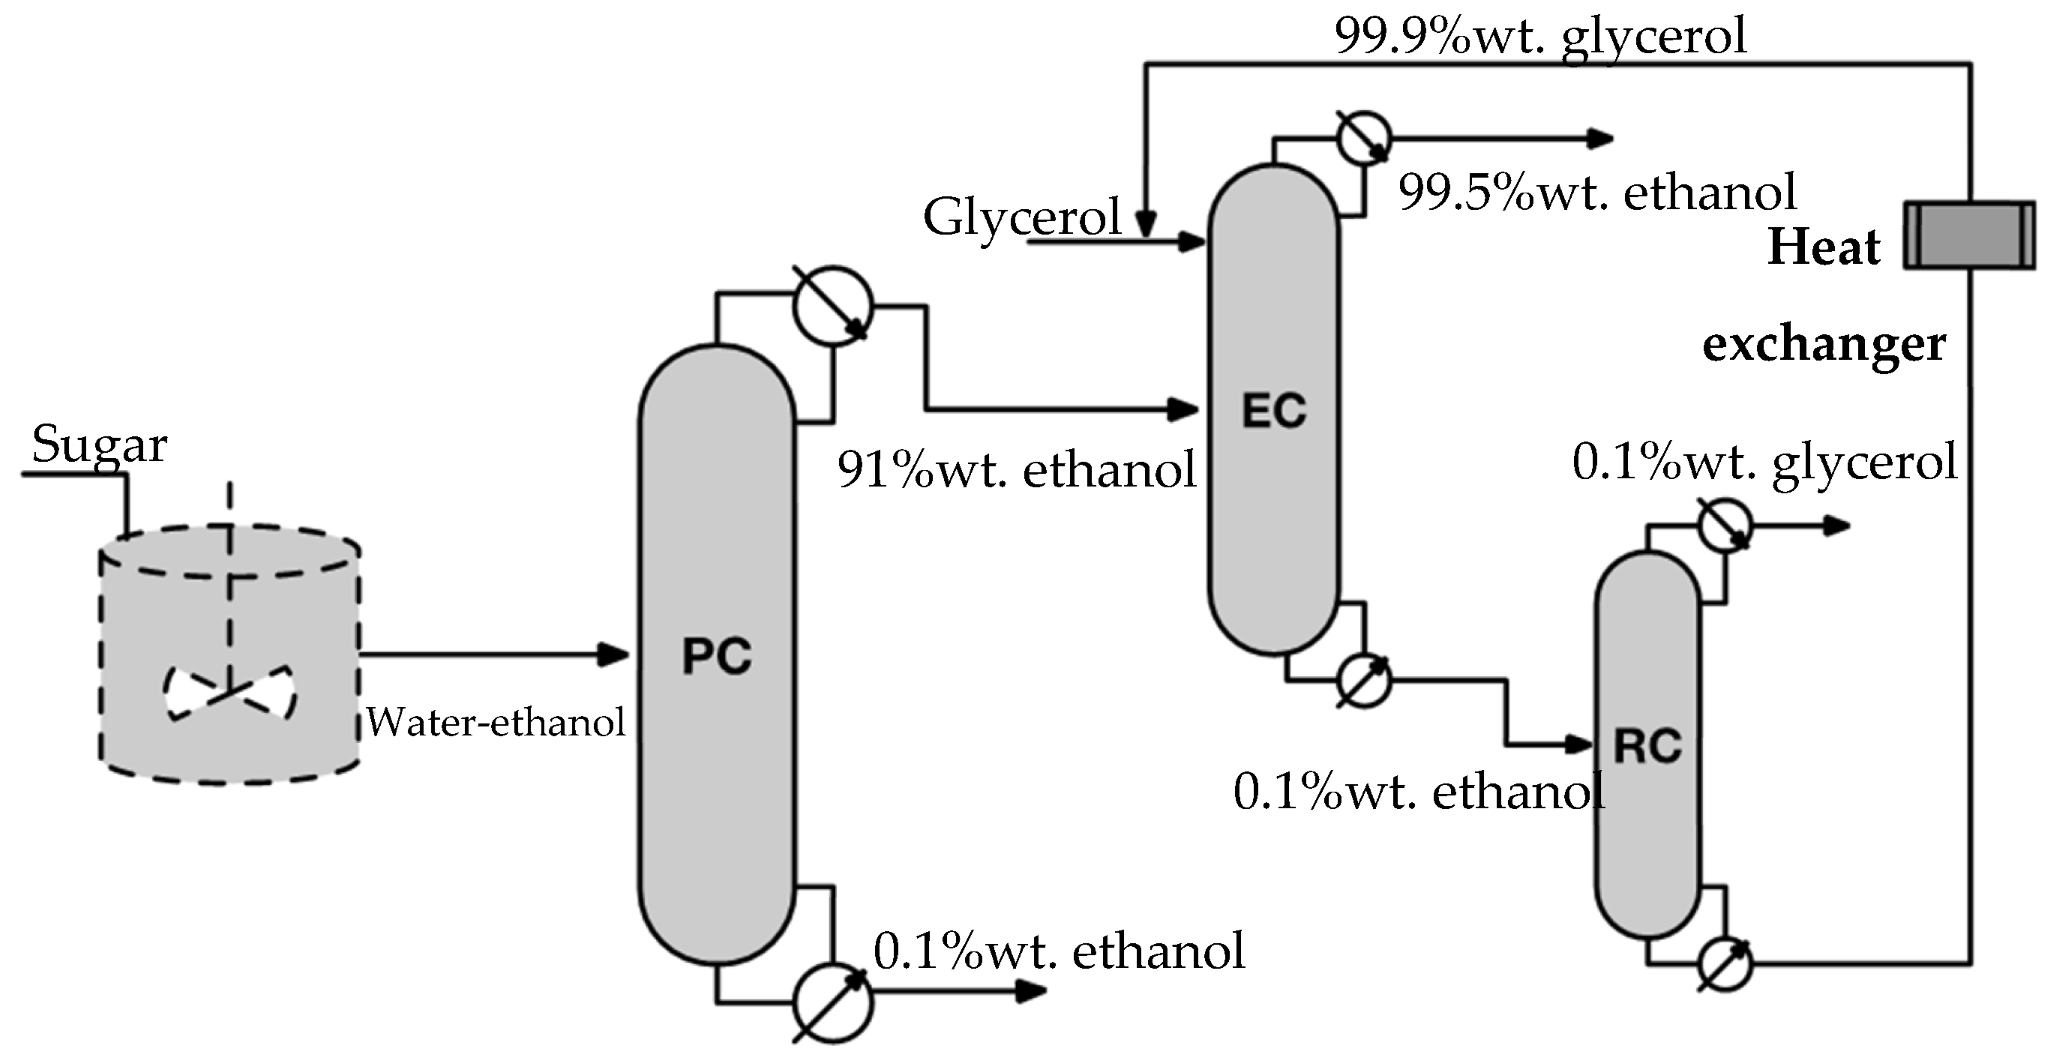
A conventional extractive distillation-based purification system consists of a train of three columns (Figure 1): (1) the first one is a binary distillation column called a preconcentrator, the second one is the extractive distillation column (EC), and the last one is another binary distillation column for extractant recovery (RC). Through the PC, diluted ethanol coming from fermentation is concentrated up to a value close to the azeotropic point. The ethanol-rich stream, coming from the PC top, is fed to the EC simultaneously with an extracting agent; the agent breaks the azeotrope in such a way that fuel-grade (almost dehydrated) bioethanol is obtained from the EC top. The extracting agent–water stream coming from the EC bottom is driven to the RC, where the extracting agent is separated from water; thus, the recovered extracting agent can be recycled to the EC.
Figure 1.
Bioethanol purification system based on conventional extractive distillation.
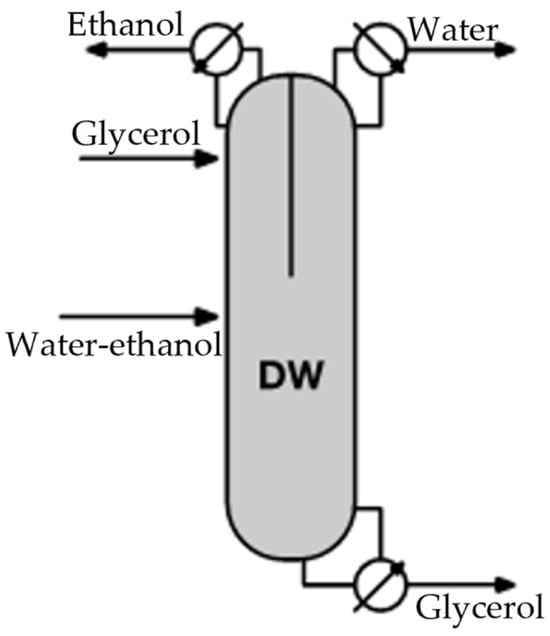
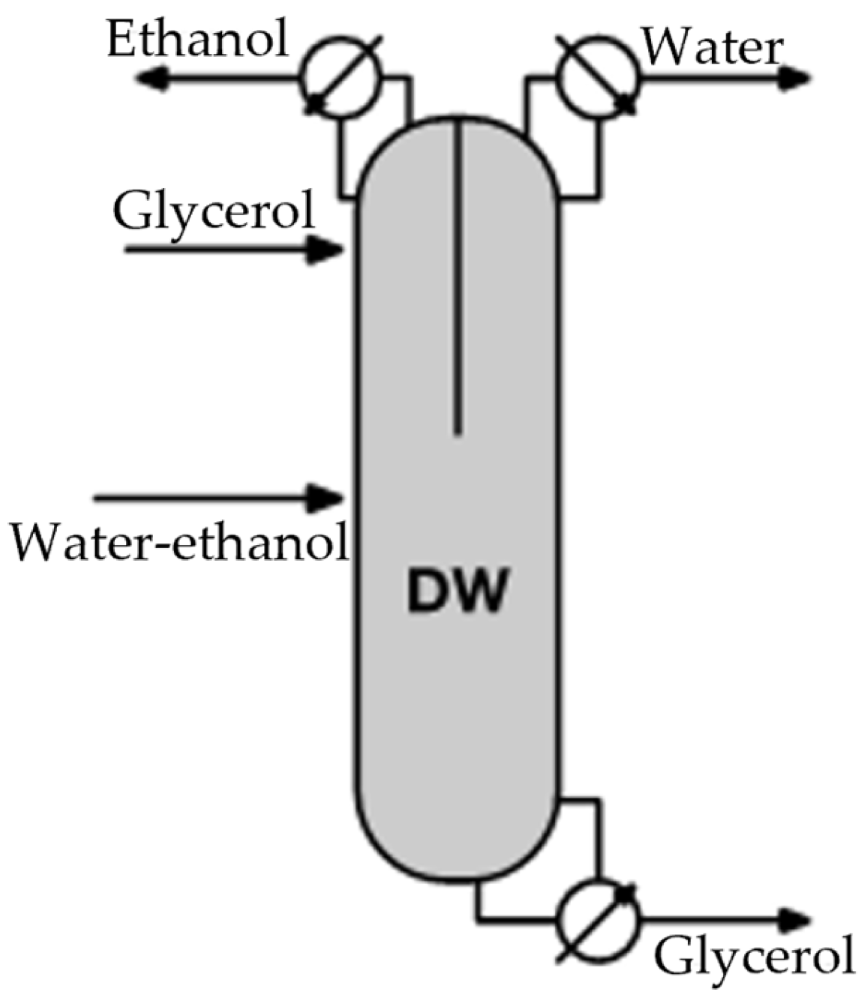
The existing literature on extractive distillation primarily focuses on proposing intensified configurations to lower purification costs. For instance, configurations such as the Petlyuk column or the dividing wall column [13,15,16,17] allow the extractive distillation process to occur simultaneously with the recovery of the extracting agent (see Figure 2). Consequently, one column functions similarly to the final two columns in a traditional extractive distillation setup (refer to Figure 1), which results in reduced investment costs and energy savings.
Figure 2.
Bioethanol dehydration through an extractive dividing wall distillation column.
The commonality among these works is their consideration of an input stream with a specific ethanol composition and flow rate as a basis for calculus, for which intensified systems are designed and compared within an optimization framework. The focus of these works is on extractive distillation and recovery processes, which seem to present significant opportunities in the absence of the preconcentrator column. However, early studies on bioethanol purification, such as those by Kiss and Suszwalak [15], emphasized the considerable thermal energy requirements of the preconcentrator column. Errico et al. [18] provided instances where the reboiler duty of a preconcentrator column accounts for up to 80% of the total duty of an entire separation system. Neagu and Pricop-Nicolae [19] also found that the reboiler of the preconcentrator column uses between 62.5% and 68.6% of the energy needed for the azeotropic and extractive distillation processes they analyzed. However, the costs associated with the preconcentrator column, particularly in relation to the extractive distillation and recovery columns, have not been thoroughly established.
This study aims to characterize the costs associated with the purification of bioethanol from fermentation broths derived from any generation type of biorefinery. It also seeks to identify the specific contributions of each distillation step within the overall bioethanol purification system that employs extractive distillation. To achieve this, the study requires evaluating the costs linked to the entire bioethanol purification process, taking into account practical scenarios related to the industrial production of any bioethanol generation.
2. The Extractive Distillation-Based Separation System and the Costing Problem
For the purification of bioethanol coming from a fermentation process, it is considered an extractive distillation-based purification system consisting of a train of three columns (Figure 1). In the first one, called the Preconcentrator Column (PC), a conventional binary distillation is performed. This process yields an ethanol-rich stream with a composition of 91%wt. from the top and a water-rich stream with a composition of 99.9%wt. from the bottom. According to Kiss and Ignat [20], the economic optimum for the preconcentration step is a 91%wt. composition at the top of the PC. The ethanol-rich stream is fed to the Extractive Column (EC), where an extractive distillation is performed with an entrainer (e.g., glycerol); from the top, fuel-grade ethanol is obtained (99.5%wt.), and from the bottom, an entrainer–water stream. Glycerol is considered as the entrainer because of its effectiveness for ethanol dehydration, its low cost, and its unknown restrictions due to toxicity [21,22]. In addition, glycerol could be obtained as a byproduct in biodiesel production, leading to a high degree of integration in biorefineries and enhancing process sustainability [23]. Next, the entrainer–water is driven to the third column, where a conventional binary distillation is carried out for entrainer recovery from the bottom, with a composition of 99.9%wt. This entrainer-rich stream is sent back to the second column and mixed with fresh entrainer to compensate for entrainer loss. A heat exchanger is used to adjust the conditions of the recycled entrainer.
Although compositions of top streams are established, their flow rates depend on the flow rate and ethanol composition of the PC feeding stream, coming from upstream fermentation. Feeding streams with flow rates between 10,000 and 50,000 L/h and ethanol compositions ranging from 2 to 12%wt. were considered. This recreates a workspace for various production scenarios associated with different types of biorefineries. For instance, when the raw material is lignocellulosic biomass, the ethanol composition resulting from fermentation can be as low as 4%wt. [24]. Conversely, if fermentation is highly efficient and the raw material is sugarcane or corn, the ethanol composition can reach up to 10%wt. [25,26]. Regarding flow rate limits, the upper boundary is determined by the production capacity of cellulosic-based production plants, where significant cost changes are anticipated [27].
Based on the description above, the task of characterizing the bioethanol purification cost and pinpointing the specific contributions of each distillation column involves assessing the investment and operational costs associated with the purification system under likely scenarios of feed flow rate-input composition. Consequently, the focus shifts to designing a purification system that minimizes both investment and operational costs, specifically aiming for the lowest Total Annual Cost. This metric is the primary economic indicator utilized in the synthesis of separation systems [28,29].
3. Design and Costing Approach
The objective is to minimize the Total Annual Cost of the purification system for each feed stream with a defined flow rate and ethanol composition. This implies a first task is to design a purification system, followed by a second task of determining the system’s costs; for each scenario there are multiple designs results (all of them technical feasible), and among them, the one with the minimum TAC is chosen.
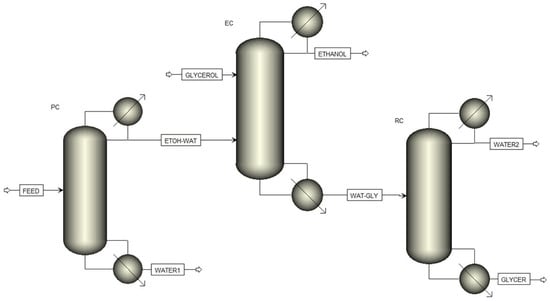
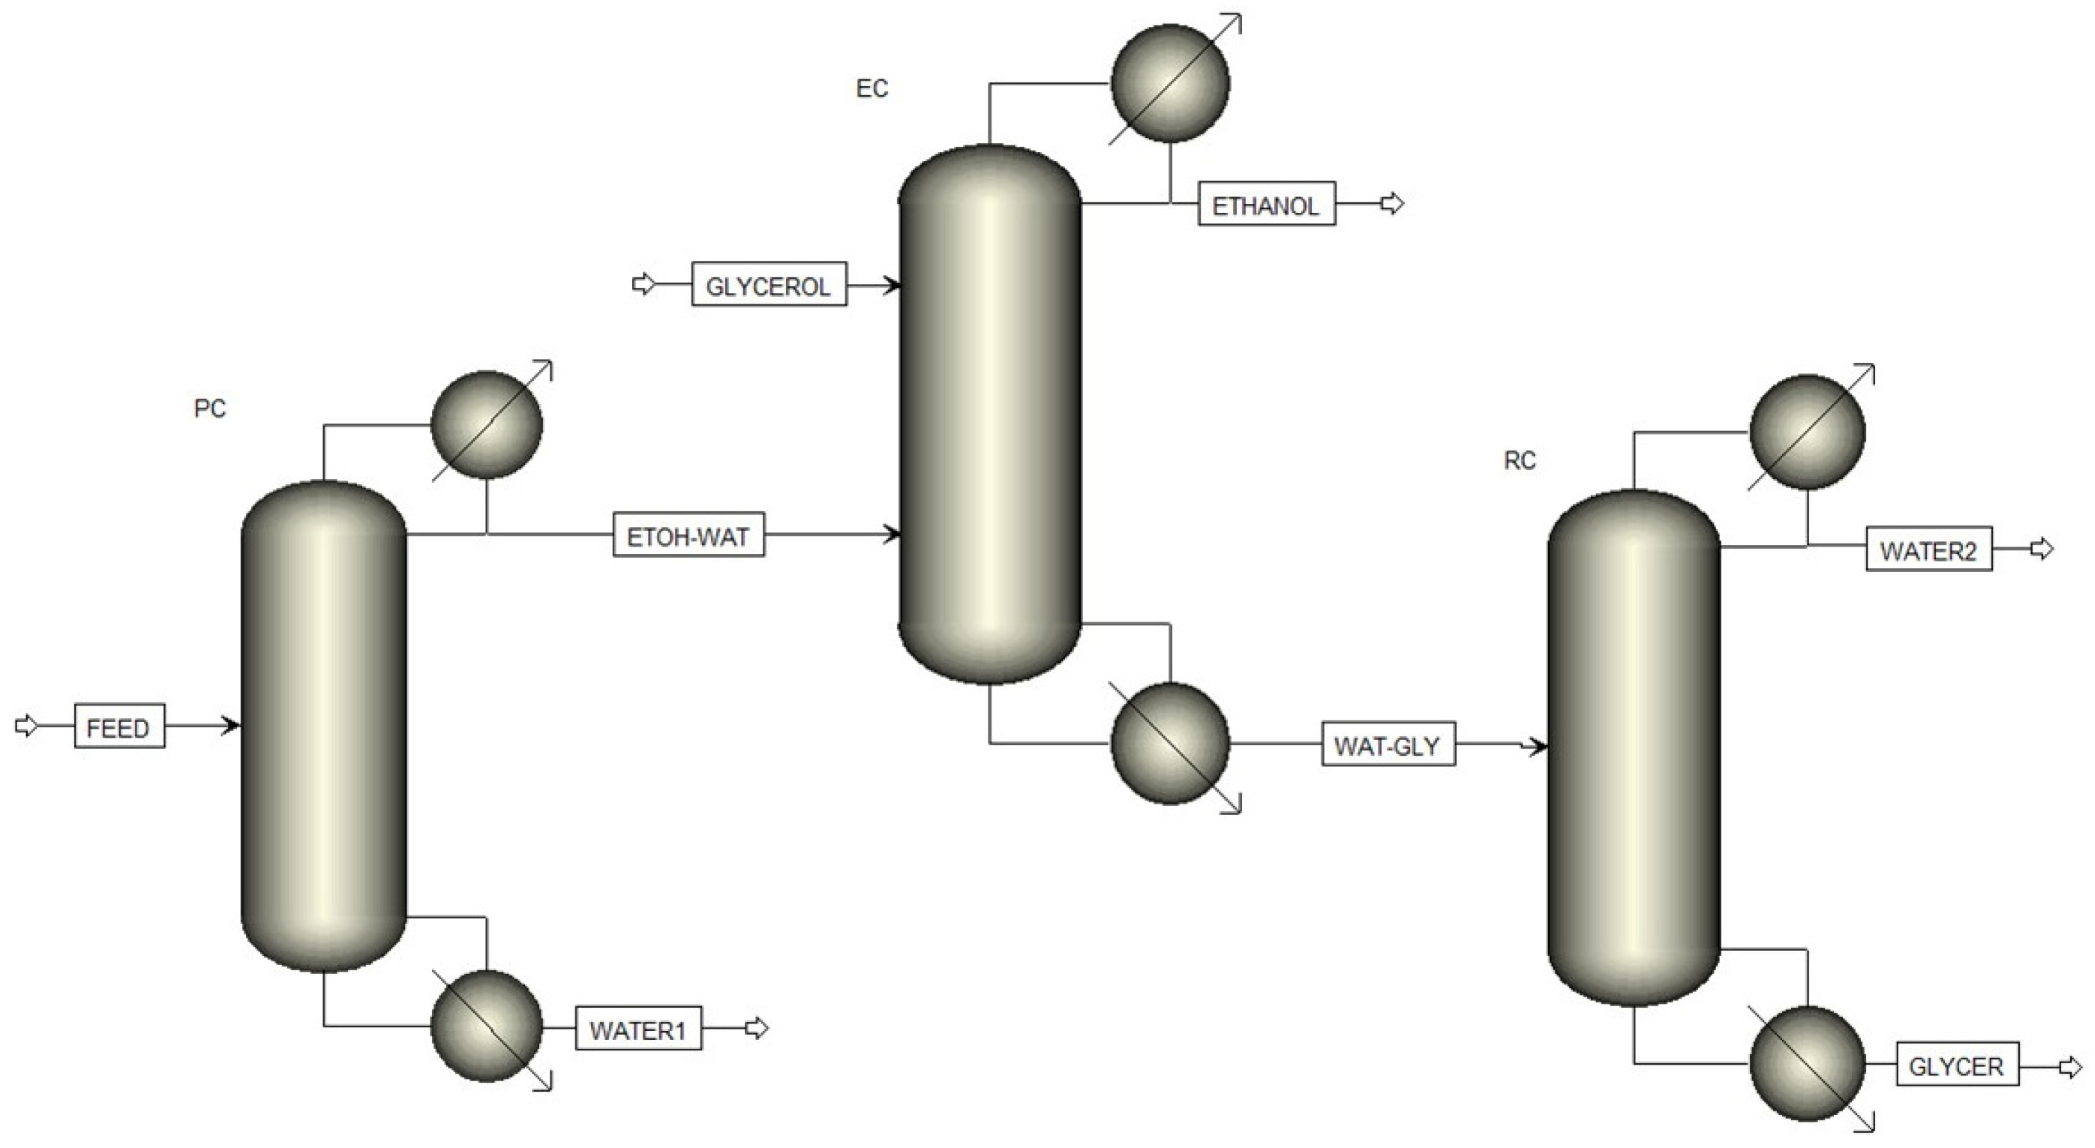
The design of every distillation column and heat exchanger of the purification system (Figure 1) was conducted using Aspen Plus® (version 8.0) (Figure 3 illustrates the layout of the purification system within the software). Each distillation column was developed using the RADFRAC module, with the NRTL thermodynamic model activated to address vapor-liquid equilibrium. This module and thermodynamic model enable the construction and modeling of binary distillation columns for separating mixtures such as ethanol–water and glycerol–water, as well as an extractive distillation column for separating ethanol from water with the aid of an entrainer, as noted in relevant studies [30,31,32,33].
Figure 3.
Layout of the purification system in Aspen Plus®.
The following considerations were applied for the design of distillation columns:
- ➢
- For all columns, all streams are assumed to be in a saturated liquid state. A pressure of 1 bar in the column top, with a fall rate of 0.1 psia per stage, was considered. They are equipped with bubble cap trays, a total condenser, and a kettle-type reboiler.
- ➢
- For PC, the distillate stream has an ethanol composition of 91%wt., while the bottom stream contains 0.1%wt. Columns ranging from 20 to 23 plates, with feed introduced between stages 10 and 20, were tested.
- ➢
- For EC, the distillate stream has an ethanol composition of 99.5%wt., while the bottom stream contains 0.1%wt. Entrainer flow rates tested were between 10 and 100 kmol/h. Columns ranging from 14 to 16 plates, with feed introduced between stages 10 and 14, were tested. The entrainer was fed at second stage, close to the column top.
- ➢
- For RC, the distillate stream has a entrainer composition of 0.1%wt., while the bottom stream contains 99.9%wt. Columns ranging from 12 to 16 plates, with feed introduced between stages 3 and 5, were tested.
The design focused on cost yielded several parameters for each column, including the duties of the reboiler and condenser, as well as the associated amounts of vapor and cooling water. Additionally, the diameter of the column (or tray) and, in the case of the EC, the flow rate of glycerol were determined. These parameters will indicate the glycerol loss at the top of the RC.
The process equipment configurations and their associated conditions are used to apply Guthrie’s method [34,35], for estimating the Total Annual Cost. This cost comprises the sum of a three-year amortized cost of process equipment and the operational cost, which accounts for the services of vapor and cooling water needed for the reboiler and condenser, respectively.
Guthrie’s cost relationships for equipment—such as heat exchangers used for reboilers and condensers, trays, and vertical vessels for column shells—are determined by the equipment’s size, which is measured in terms of area, and the type of construction material used. To estimate the area of process equipment, the relationships provided by Nitsche and Gbadamosi [36] and those by Luyben [37] were utilized. The resulting equipment costs are then updated using the Chemical Engineering Plant Cost Index [38], with the year 1968 serving as the baseline for cost adjustments.
The operational costs for cooling water services were estimated based on prices provided in Seider et al. [39]. Prices for glycerol were obtained from Intratec [40]. For vapor service, the pricing was referenced from Towler and Sinnot [41]. It is important to recall that the design task resulted in determining the amounts of cooling water, vapor (including its quality, such as high, medium, or low pressure), and glycerol. Finally, the Utilities tool in Aspen Plus® is employed to determine the operational cost, assuming 8410 working hours per year.
Ultimately, the Total Annual Cost (TAC) for the entire system is determined by adding together the TAC for each individual column. This TAC is derived from the investment amortized over three years, along with the operational costs. It is worth noting that although the cost references are relatively dated, they are still being utilized today [42].
4. Cost Analysis
The cost characterization of bioethanol purification considered feed flow rates between 10,000 and 50,000 L/h, with feed compositions ranging from 2 to 12% weight. A gridded workspace for the bioethanol production scenario was constructed by combining the feed compositions of {2, 4, 6, 8, 10, 12}%wt with flow rates of {1, 2, 3, 4, 5} × 104 L/h. In this way, 30 bioethanol production scenarios were developed, resulting in the design of 30 bioethanol purification systems aimed at minimizing total annual costs (TAC).
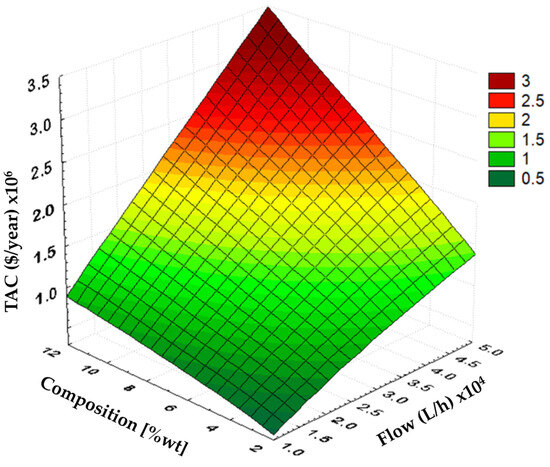
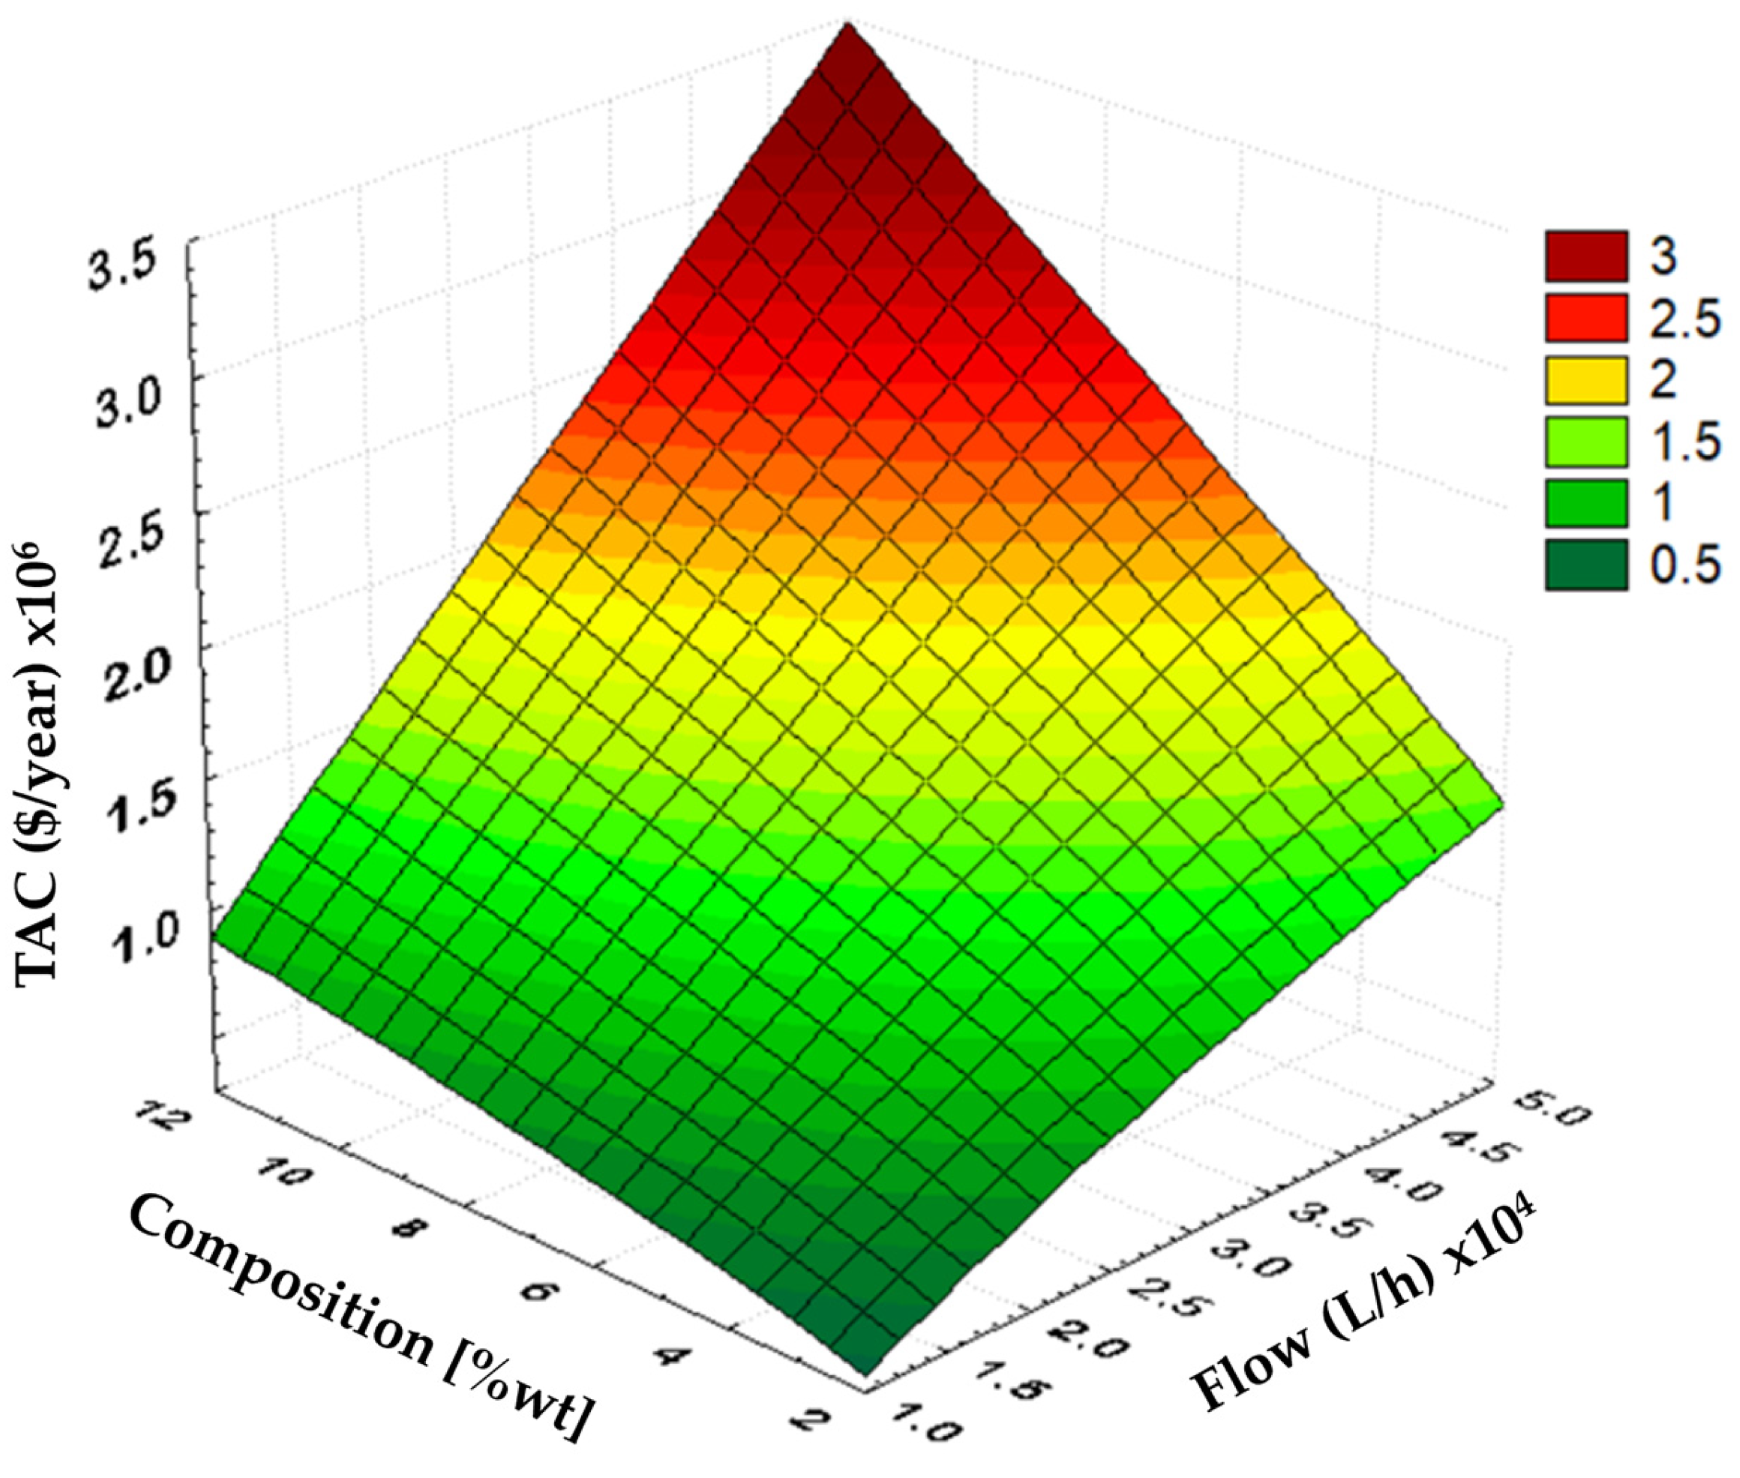
In Figure 4, the minimum total annual cost (TAC) is illustrated across the workspace for various bioethanol production scenarios. It is observed that the purification cost increases significantly when the input compositions are higher, as well as when the feed flow rates are higher. Notably, the slope of the cost along the feed flow rate becomes steepest as the input composition increases. Similarly, the slope of the cost along the input composition also steepens as the feed flow rate increases.
Figure 4.
Minimum TAC of bioethanol purification under different feeding conditions.
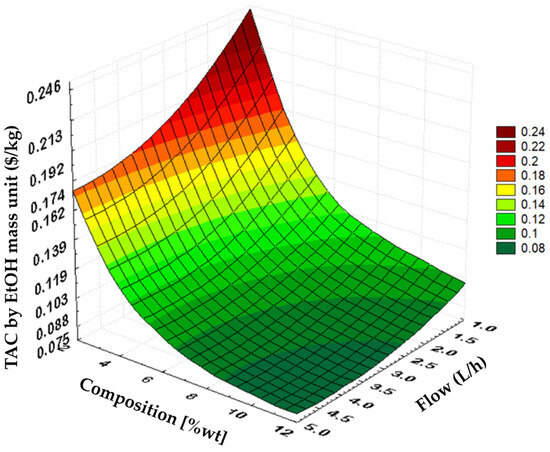
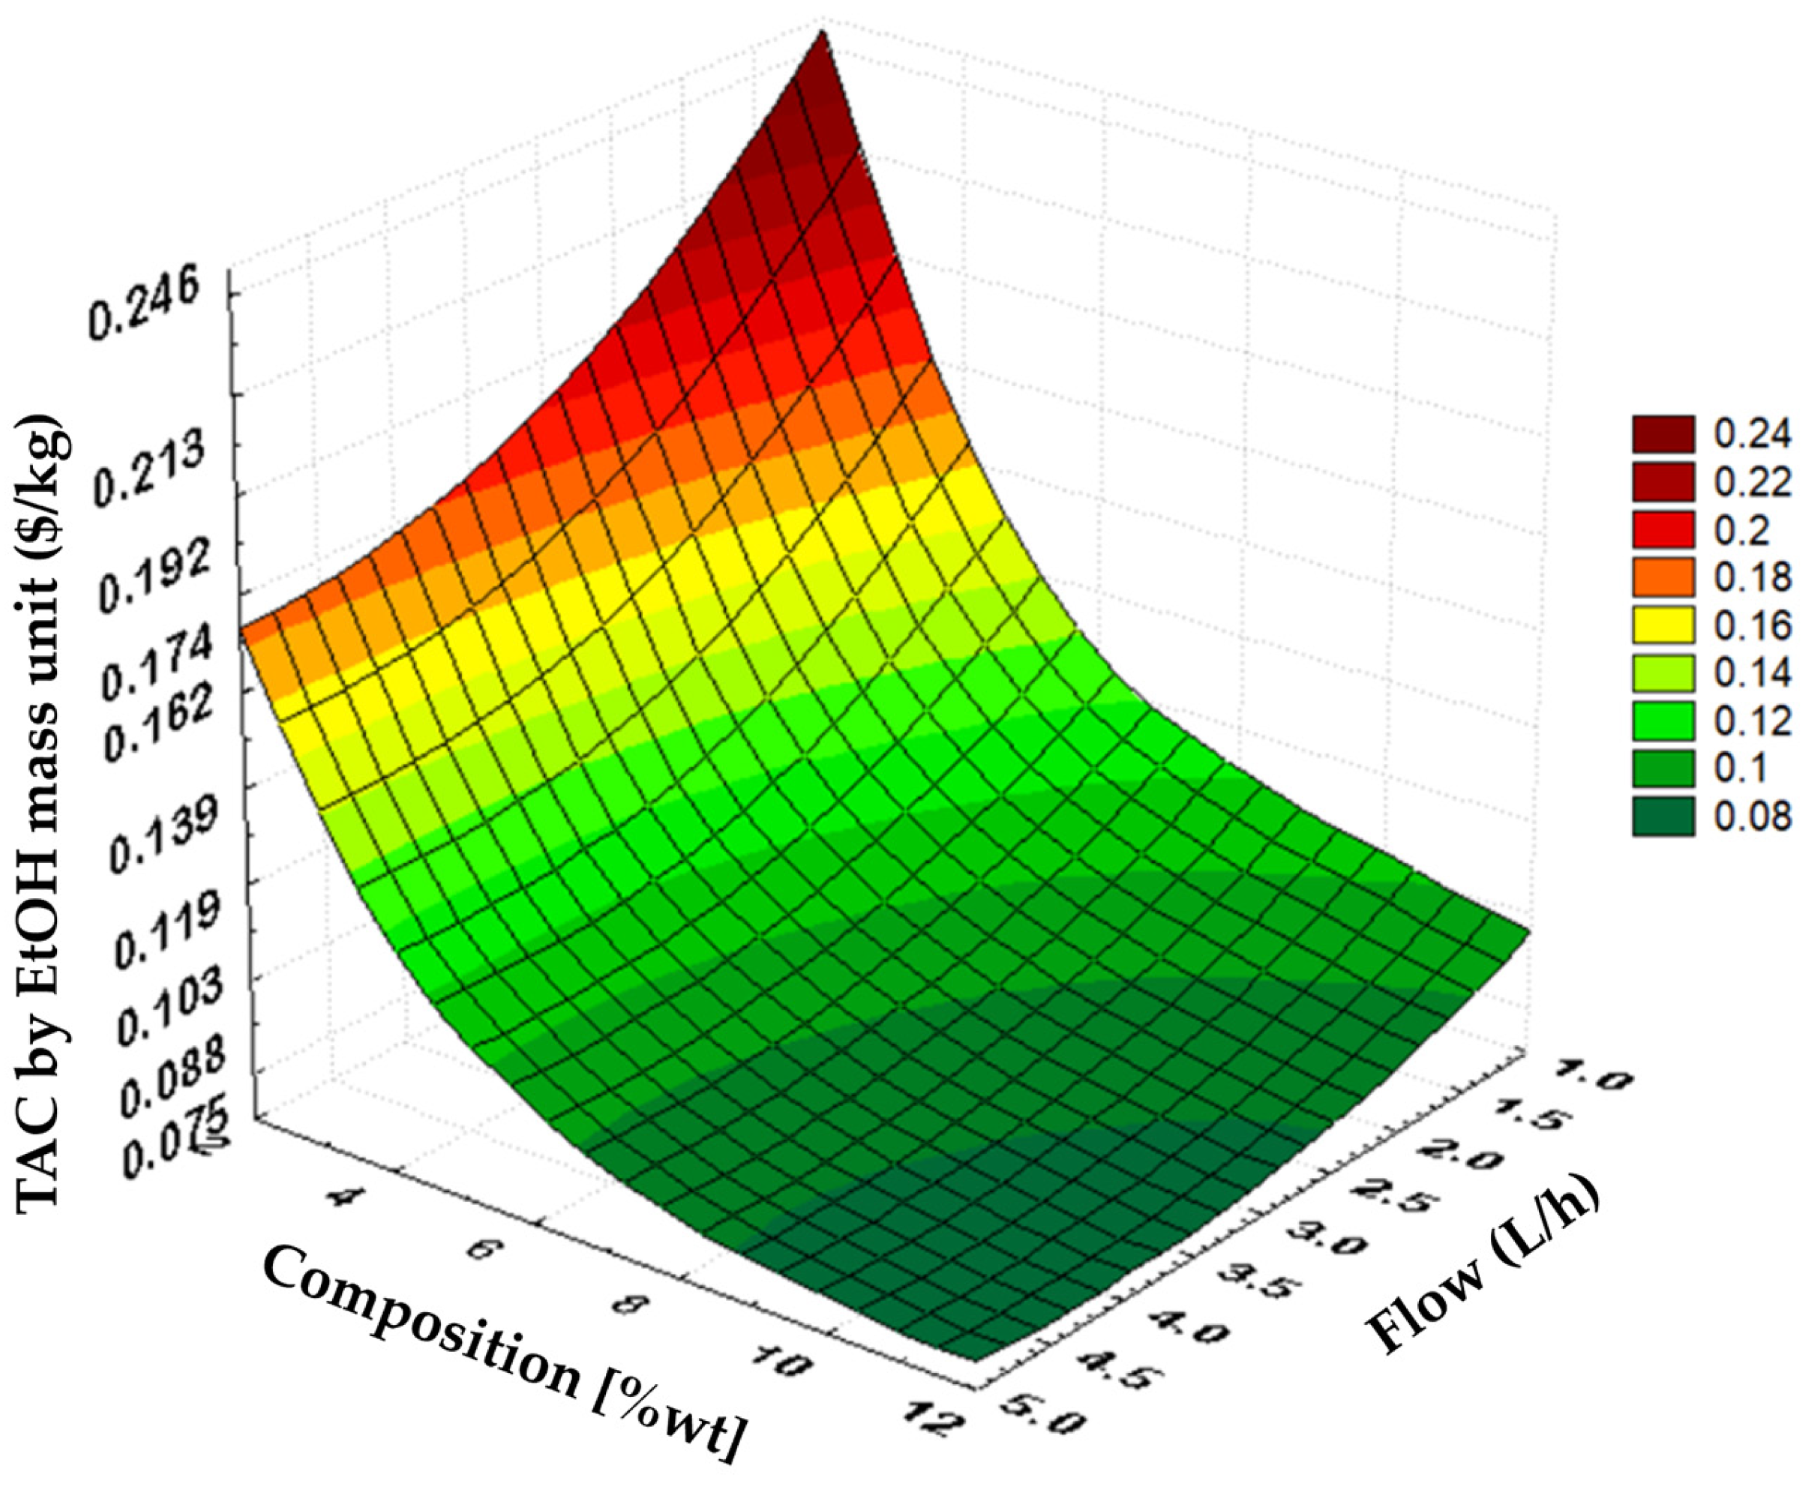
The result suggests that obtaining fermentation broths with a high ethanol composition incurs a greater ethanol purification cost compared to those with a low ethanol composition, contrary to what is typically anticipated. For a fair assessment of the separation cost, the Total Annual Cost (TAC) is divided by the quantity of fuel-grade ethanol produced (TAC-by-EtOH), and its corresponding response surface is illustrated in Figure 5. The analysis reveals that higher normalized separation costs occur at low ethanol compositions and low feed flow rates. It is important to note that the feeding flow rate is significantly greater than that of the fuel-grade ethanol distillate, often exceeding ten times, depending on the feeding ethanol composition. For example, with a feeding ethanol composition of 5%wt., the feeding flow can be nearly twenty times that of the ethanol distillate flow. Loy et al. [43] estimate a separation cost of $0.1185 per kg of ethanol for a flow rate of 192,900 kg/h and an ethanol composition of 10%wt., and the values obtained here are of a similar order of magnitude. Additionally, it is observed that at low compositions (e.g., 2–6%wt.), the rate of change in cost relative to the feeding ethanol composition is steep, whereas at higher compositions, the slope is significantly reduced. A similar trend is noted regarding the feed flow rate; the change rate of the TAC-by-EtOH is less pronounced at higher feed flow rates compared to lower ones.
Figure 5.
Minimum TAC-by-EtOH at different feeding conditions.
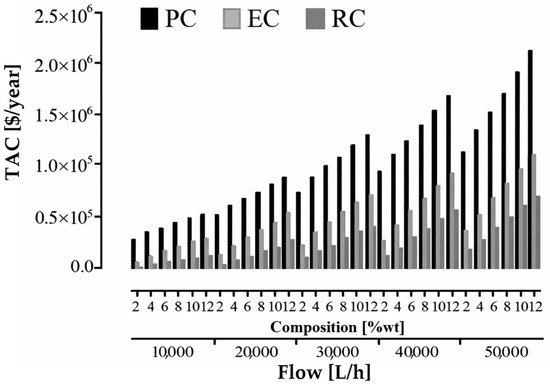
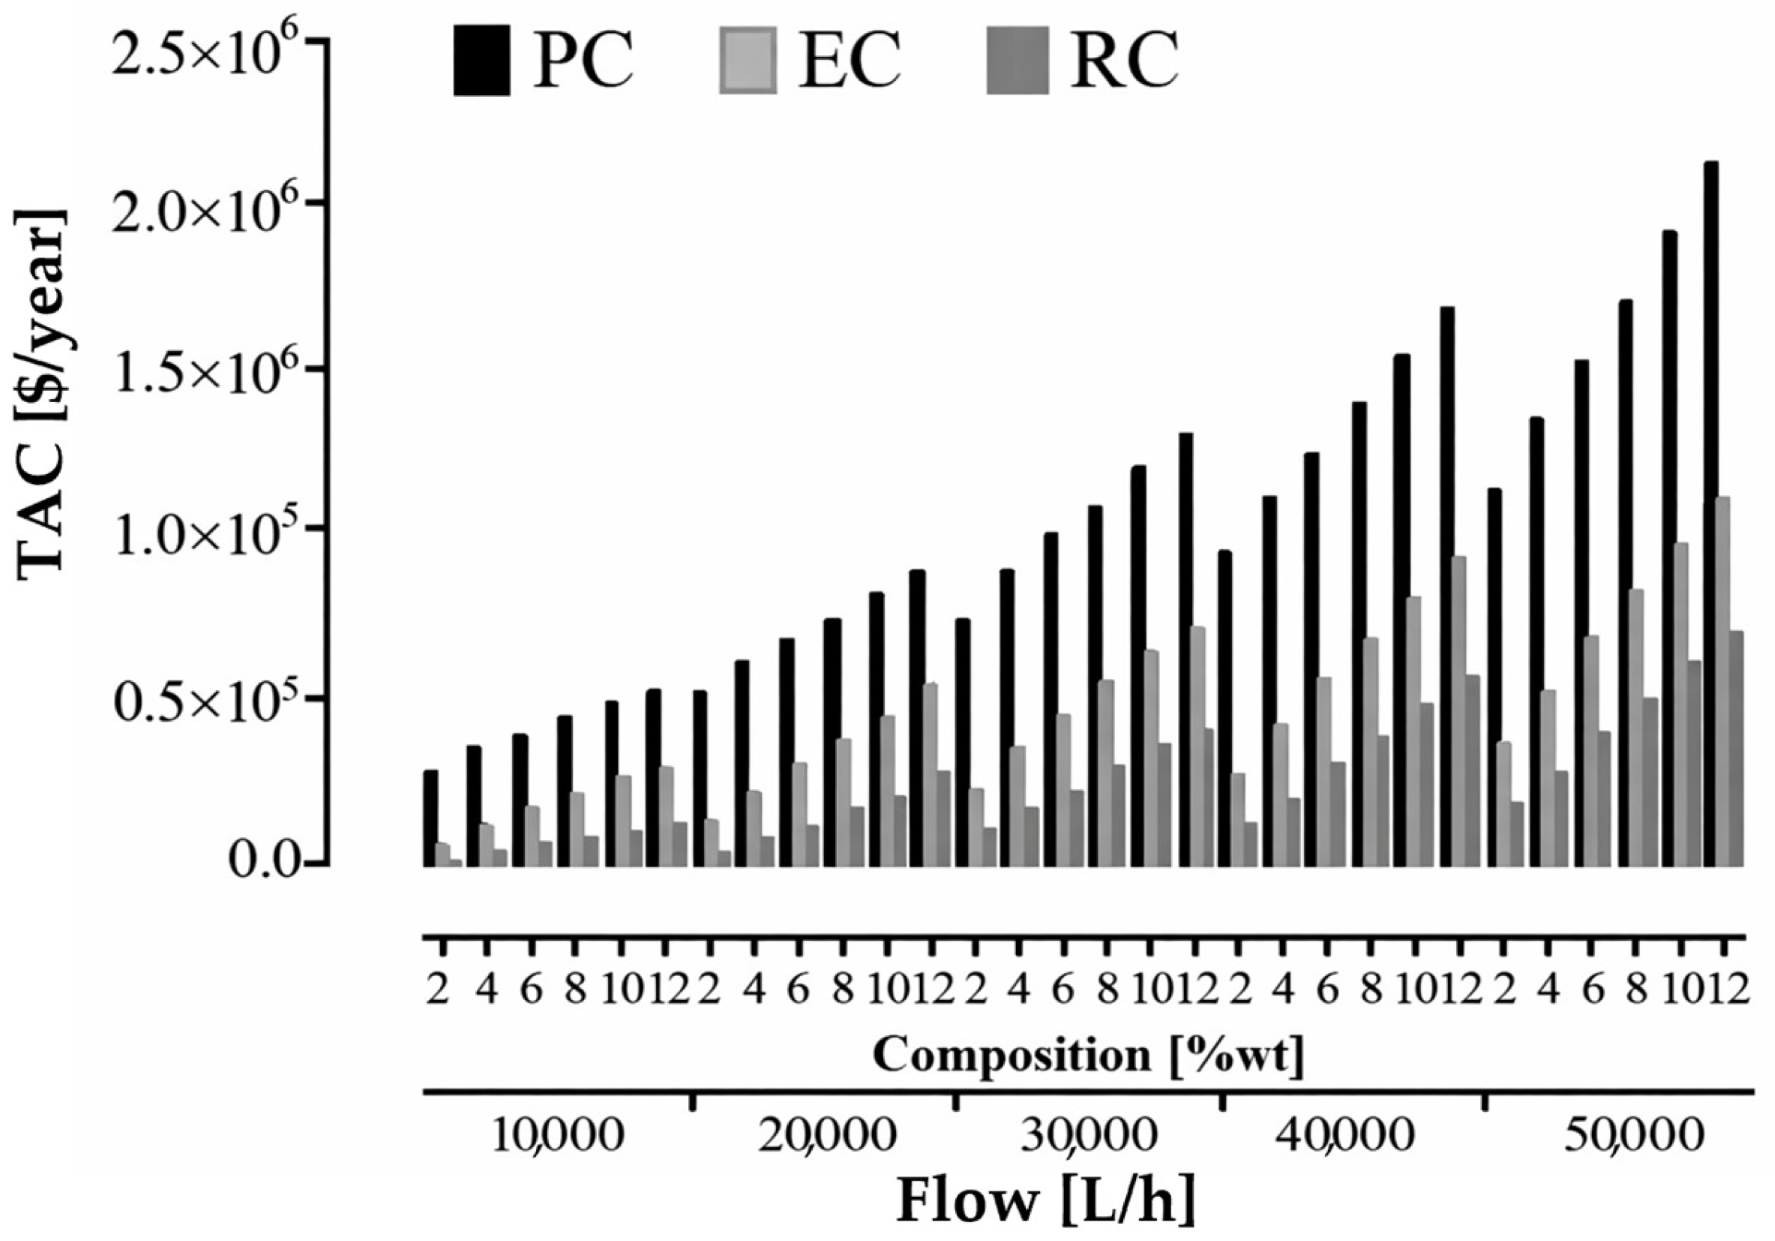
To gain a deeper understanding of TAC behavior (Figure 4), Figure 6 illustrates the minimum TAC for each column under various feeding conditions. Notably, in every feeding scenario, the TAC for the PC is significantly higher than that of the other distillation columns. The PC experiences a significantly higher feed flow rate than the EC and RC, resulting in a larger diameter and increased service requirements. On other hand, for each feed flow rate, the TAC increases as the input composition rises. This increase is due to the larger diameter of the column that results from higher input composition, which subsequently leads to increased costs for process equipment and services. Furthermore, the need for entrainer in the EC also rises with the increased input composition, as a greater amount of ethanol is processed with the entrainer.
Figure 6.
Minimum TAC behavior per distillation column.
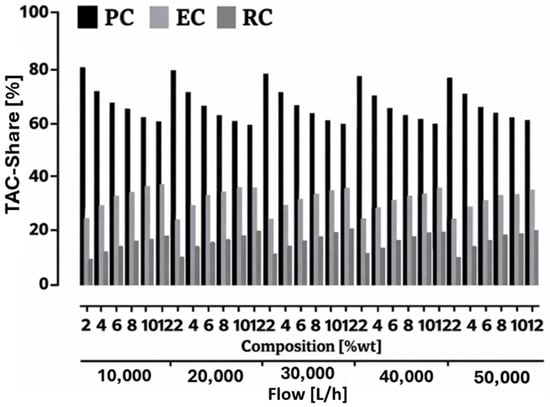
Figure 7 illustrates the contribution of each distillation column to the overall cost of the purification system. For every feed flow rate, the share attributed to the PC is roughly 60%. This share increases as the ethanol composition in the feed stream decreases, reaching a maximum of 80%. Moreover, the contribution from the PC share tends to rise slightly with higher feed flow rates. For example, at a feed flow of 10,000 L/h with an ethanol composition of 12%wt., the share percentage is 55%. Conversely, at a feed flow rate of 50,000 L/h with the same ethanol composition, the share percentage rises to 56%.
Figure 7.
Contribution of each column in the complete separation system’s TAC.
Continuing to observe Figure 7, the share of the EC ranges from slightly above 20% at the lowest flow rate and ethanol composition to just below 40% at the lowest flow rate with the highest ethanol composition. At low ethanol compositions, the share shows minimal variation as the flow rate changes; however, at high ethanol compositions, the share decreases as the flow rate increases. For any given flow rate, the share rises with increasing ethanol composition, with a more pronounced effect observed at low flow rates. In contrast, the shares for the RC begin at around 5% at the lowest flow rate and ethanol composition and increase to nearly 20% at the highest flow rate and ethanol composition. This share grows with higher flow rates, ultimately exceeding the EC share. Similar to the EC, for any flow rate, the RC share also increases with an increase in ethanol composition.
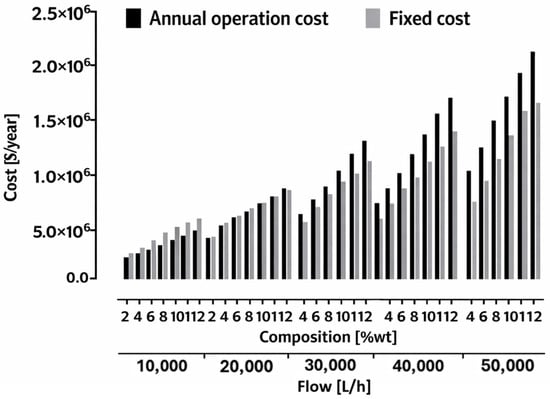
Figure 8 illustrates the operational expenses and the annualized investment costs. It is evident that both costs increase with rising flow rates and higher ethanol compositions, indicating that the trends observed in Figure 4 are influenced by both cost factors. Although not depicted here, the equipment size and duty for the EC and RC also increase, while the diameter of the PC significantly expands with higher ethanol compositions. For any given ethanol composition, it is noticeable that the operational expenses are somewhat lower than the fixed costs at lower flow rates; however, at high feed flow rates, the operational expenses quickly surpass the fixed costs. It is important to note that the number of stages in the columns remains relatively constant across different flow rates, but the services required to operate the system increase as flow rates rise. Regardless of the flow rate, the cost difference remains consistent, even as costs escalate with increasing ethanol composition.
Figure 8.
Comparison of the fixed costs and operation costs in the bioethanol purification system.
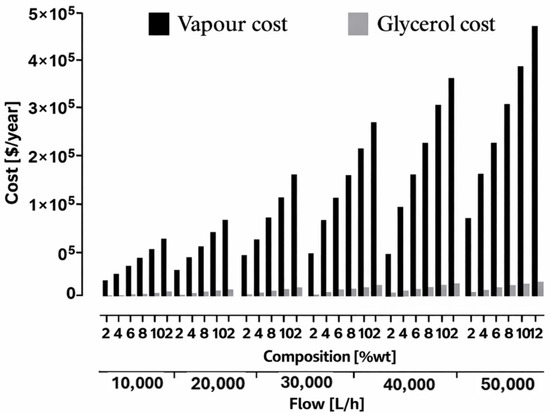
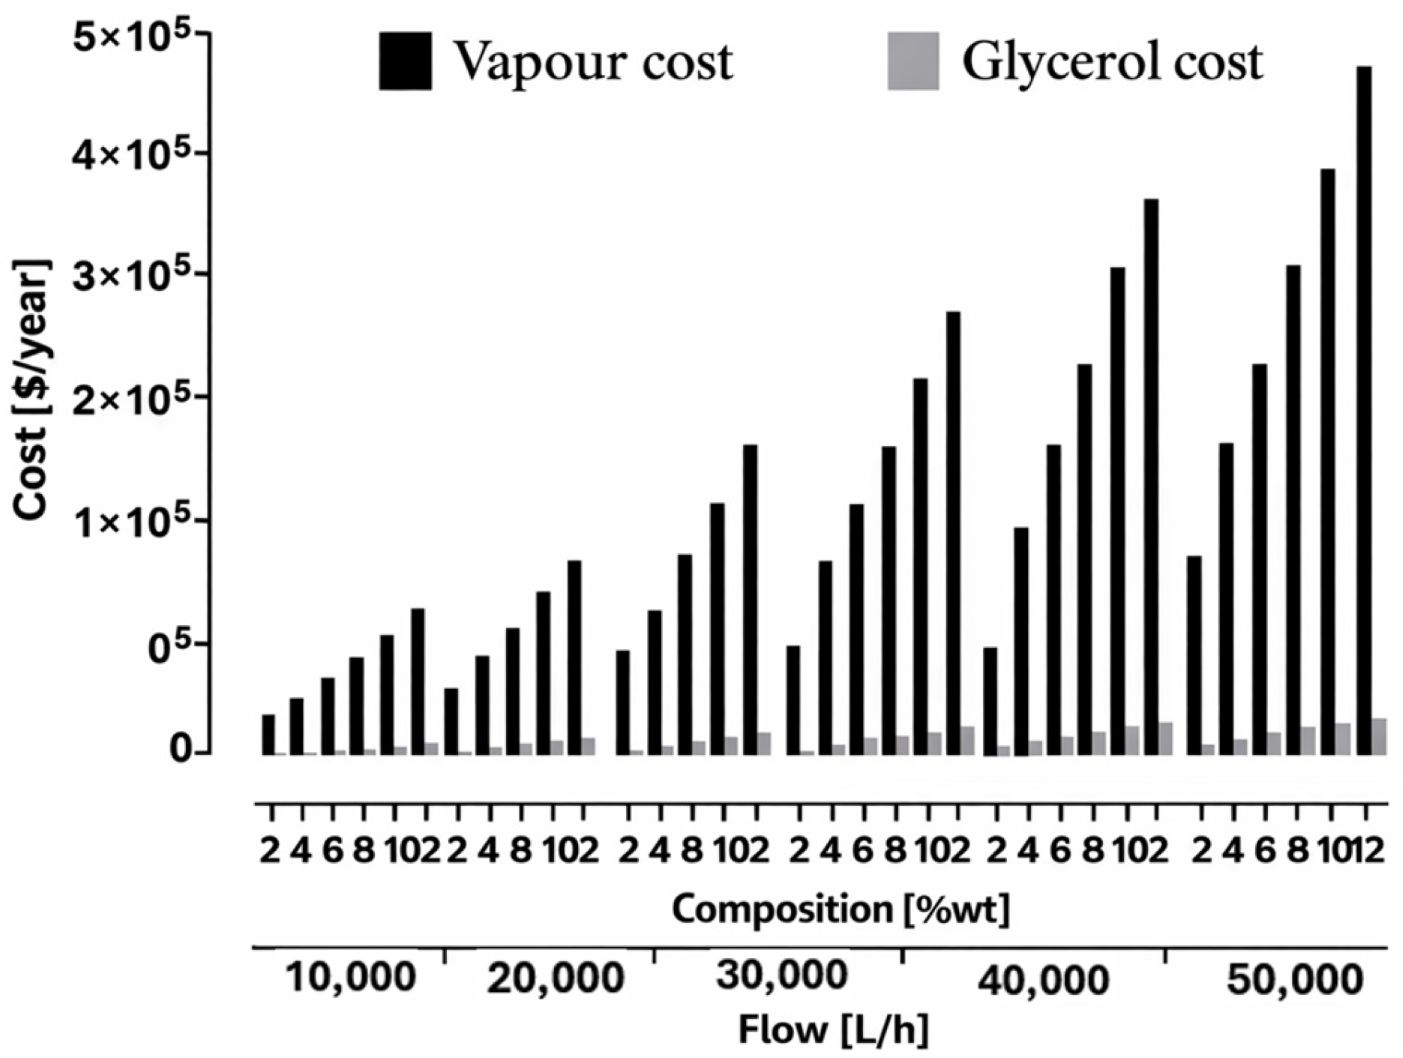
The cost of the entrainer is considered a significant part of the overall operational cost for the EC process. As illustrated in Figure 9, the expense associated with the entrainer is considerably lower than that of the medium-pressure vapor. This disparity arises from the minimal glycerol loss, as nearly all the entrainer is
Figure 9.
Comparison of services costs in the Extractive Distillation Column to purify bioethanol.
5. Conclusions
This work analyzes the cost of bioethanol purification using extractive distillation within a biorefinery context. It examines each individual cost associated with the columns in the column train, as well as fixed and operational expenses. The primary separation cost is mainly linked to the preconcentration step; however, its significance diminishes as the ethanol concentration in the input stream increases and remains relatively stable across varying flow rates. The share of the extractive column (EC) rises when the ethanol composition in the feed stream is significant, a trend that also occurs in the rectifying column (RC). Concerning different flow rates, the proportion of costs associated with each column remains almost unchanged. At lower flow rates, operational costs are less than fixed costs. As flow rates increase, operational costs become more significant due to the rise in service usage, while the number of stages in the columns remains nearly constant. In terms of total annual cost (TAC) per kilogram of ethanol, it aligns with common understanding: the separation cost per kilogram of ethanol decreases when larger flows and higher compositions are processed. In the analyzed scenario, the ethanol composition has a substantial impact on purification costs. Ultimately, it can be concluded that the greatest potential for cost reductions in bioethanol purification lies in achieving fermentation broths with a higher ethanol content.
Author Contributions
Conceptualization, H.H.-E. and O.D.L.-M.; Methodology, H.H.-E., O.D.L.-M., F.O.B.-M., S.H. and M.D.L.-R.; Formal analysis, H.H.-E., O.D.L.-M.; Investigation, O.D.L.-M.; Resources, H.H.-E.; Writing—original draft, O.D.L.-M., H.H.-E. and M.D.L.-R.; Writing—review & editing, H.H.-E., F.O.B.-M., and S.H.; Supervision, H.H.-E., F.O.B.-M. and S.H.; Funding acquisition, H.H.-E. All authors have read and agreed to the published version of the manuscript.
Funding
CONACYT-SENER through the project 249564 (CONACYT: National Council of Science and Technology of México, SENER: Energy Secretariat—México).
Data Availability Statement
The original contributions presented in this study are included in the article. Further inquiries can be directed to the corresponding author. The data is given in graphical format; nevertheless, numerical data can be provided.
Conflicts of Interest
The authors declare no conflicts of interest.
References
- Renewable Fuel Association. Annual Ethanol Production. U.S. and World Ethanol Production. Available online: https://ethanolrfa.org/markets-and-statistics/annual-ethanol-production (accessed on 30 December 2025).
- Renewable Fuels Association. 2025 Ethanol Industry Outlook-Back to Our Roots. Available online: https://ethanolrfa.org/file/2912/2025%20Outlook.pdf (accessed on 30 December 2025).
- Chisti, Y.; Karimi, K. Bioethanol Production. In Encyclopedia of Sustainable Technologies, 2nd ed.; Abraham, M.A., Ed.; Elsevier: Amsterdam, The Netherlands, 2024; Volume 3, pp. 279–294. [Google Scholar] [CrossRef] [Scilit]
- Joyia, M.A.K.; Ahmad, M.; Chen, Y.-F.; Mustaqeem, M.; Ali, A.; Abbas, A.; Gondal, M.A. Trends and advances in sustainable bioethanol production technologies from first to fourth generation: A critical review. Energy Convers. Manag. 2024, 321, 119037. [Google Scholar] [CrossRef] [Scilit]
- Afedzi, A.E.K.; Pramuk Parakulsuksatid, P. Recent advances in process modifications of simultaneous saccharification and fermentation (SSF) of lignocellulosic biomass for bioethanol production. Biocatal. Agric. Biotechnol. 2023, 54, 102961. [Google Scholar] [CrossRef] [Scilit]
- Zhang, X.; Fu, J.; Lin, G.; Jiang, D.; Yan, X. Switchgrass based bioethanol productivity and potential environmental impact from marginal lands in China. Energies 2017, 10, 260. [Google Scholar] [CrossRef] [Scilit]
- Karimi, S.; Karri, R.R.; Yaraki, M.T.; Koduru, J.R. Processes and separation technologies for the production of fuel-grade bioethanol: A review. Environ. Chem. Lett. 2021, 19, 2873–2890. [Google Scholar] [CrossRef] [Scilit]
- Frolkova, A.; Raeva, V. Bioethanol dehydration: State of the art. Theor. Found. Chem. Eng. 2010, 44, 545–556. [Google Scholar] [CrossRef] [Scilit]
- Edeh, I. Bioethanol Production: An Overview. In Bioethanol Technologies; Inambao, F., Ed.; IntechOpen: London, UK, 2021. [Google Scholar] [CrossRef] [Scilit]
- Gonzalez-Contreras, M.; Lugo-Mendez, H.; Sales-Cruz, M.; López-Arenas, T. Synthesis, design and evaluation of intensified lignocellulosic biorefineries-Case study: Ethanol production. Chem. Eng. Process. Process Intensif. 2021, 159, 108220. [Google Scholar] [CrossRef] [Scilit]
- Assaf, J.C.; Mortada, Z.; Rezzoung, S.; Maache-Rezzoug, Z.; Debs, E.; Louka, N. Comparative review on the production and purification of bioethanol from biomass: A focus on corn. Processes 2024, 12, 1001. [Google Scholar] [CrossRef] [Scilit]
- Gomez-Castro, F.I.; Reynel-Avila, H.; Romero-Izquiero, A.G.; Gutierrez-Antonio, C.; Mendoza-Castillo, D.I.; Bonilla-Petriciolet, A.; Lara-Montaño, O.D.; May-Vazquez, M.M.; Hernandez, S. Overcoming the ethanol/water azeotrope: A review on advanced technologies for bioethanol purification. Eng. Rep. 2025, 7, e70451. [Google Scholar] [CrossRef] [Scilit]
- Kiss, A.A.; Ignat, R.M. Innovative single step bioethanol dehydration in an extractive dividing-wall column. Sep. Purif. Technol. 2012, 98, 290–297. [Google Scholar] [CrossRef] [Scilit]
- Vane, M.; Alvarez, F.R.; Rosenblum, L.; Govindaswamy, S. Efficient Ethanol Recovery from Yeast Fermentation Broth with Integrated Distillation–Membrane Process. Ind. Eng. Chem. Res. 2013, 52, 1033–1041. [Google Scholar] [CrossRef] [Scilit]
- Kiss, A.A.; Suszwalak, D.J.P.C. Enhanced bioethanol dehydration by extractive and azeotropic distillation in dividing-wall columns. Sep. Purif. Technol. 2012, 86, 70–78. [Google Scholar] [CrossRef] [Scilit]
- García-Ventura, U.M.; Barroso-Muñoz, F.O.; Hernández, S.; Castro-Montoya, A.J. Experimental study of the production of high purity ethanol using a semi-continuous extractive batch dividing wall distillation column. Chem. Eng. Process. Process Intensif. 2016, 108, 74–77. [Google Scholar] [CrossRef] [Scilit]
- Aurangzeb, M.; Jana, A.K. A novel heat integrated extractive dividing wall column for ethanol dehydration. Ind. Eng. Chem. Res. 2019, 58, 9109–9117. [Google Scholar] [CrossRef] [Scilit]
- Errico, M.; Rong, B.G.; Tola, G. Optimal synthesis and design of extractive distillation systems for bioethanol separation: From simple to complex columns. Comput. Aided Chem. Eng. 2013, 32, 372–378. [Google Scholar] [CrossRef] [Scilit]
- Neagu, M.; Pricop-Nicolae, M. Azeotropic and extractive distillation for bio-ethanol dehydration: Process design, simulation, and cost analysis. Processes 2025, 13, 3634. [Google Scholar] [CrossRef] [Scilit]
- Kiss, A.A.; Ignat, R.M. Optimal Economic Design of an Extractive Distillation Process for Bioethanol Dehydration. Energy Technol. 2013, 1, 166–170. [Google Scholar] [CrossRef] [Scilit]
- Navarrete-Contreras, S.; Sánchez-Ibarra, M.; Barroso-Muñoz, F.O.; Hernández, S.; Castro-Montoya, A.J. Use of glycerol as entrainer in the dehydration of bioethanol using extractive batch distillation: Simulation and experimental studies. Chem. Eng. Process. Process Intensif. 2014, 77, 38–41. [Google Scholar] [CrossRef] [Scilit]
- Singh, A.; Rangaiah, G.P. Review of technological advances in bioethanol recovery and dehydration. Ind. Eng. Chem. Res. 2017, 56, 5147–5163. [Google Scholar] [CrossRef] [Scilit]
- Nhien, L.C.; Long, N.V.D.; Lee, M. Novel heat-integrated and intensified biorefinery process for cellulosic ethanol production from lignocellulosic biomass. Energy Convers. Manag. 2017, 141, 367–377. [Google Scholar] [CrossRef] [Scilit]
- Chen, H.; Fu, X. Industrial technologies for bioethanol production from lignocellulosic biomass. Renew. Sustain. Energy Rev. 2016, 57, 468–478. [Google Scholar] [CrossRef] [Scilit]
- Gupta, R.B.; Demirbaş, A. Gasoline, Diesel, and Ethanol Biofuels from Grasses and Plants; Cambridge University Press: Cambridge, UK, 2010. [Google Scholar] [CrossRef] [Scilit]
- Pandey, A.K.; Kumar, M.; Kumari, S.; Gaur, N.A. Integration of acid pre-treated paddy straw hydrolysate to molasses as a diluent enhances ethanol production using a robust Saccharomyces cerevisiae NGY10 strain. Renew. Energy 2022, 186, 790–801. [Google Scholar] [CrossRef] [Scilit]
- Ethanol Producer Magazine. U.S. Ethanol Plants. Available online: http://ethanolproducer.com/plants/listplants/US/Existing/Sugar-Starch/ (accessed on 13 March 2017).
- Silviana, S.; Lestari, M.A.; Sanyoto, G.J.; Hapsari, F.D.; Mutiarini, A.; Septiani, I.E. Analysis and cost estimation of methanol/glycerin distillation unit process system. E3S Web Conf. 2020, 202, 10002. [Google Scholar] [CrossRef] [Scilit]
- Gkika, D.A.; Mitropoulos, A.C.; Kyzas, G.Z. How Economic Theories Shape Chemical Technology Profile. ChemEngineering 2024, 8, 91. [Google Scholar] [CrossRef] [Scilit]
- García-Herreros, P.; Gómez, J.M.; Gil, I.D.; Rodríguez, G. Optimization of the Design and Operation of an Extractive Distillation System for the Production of Fuel Grade Ethanol Using Glycerol as Entrainer. Ind. Eng. Chem. Res. 2011, 50, 3977–3985. [Google Scholar] [CrossRef] [Scilit]
- Lee, F.M.; Pahl, R.H. Solvent screening study and conceptual extractive distillation process to produce anhydrous ethanol from fermentation broth. Ind. Eng. Chem. Process Des. Dev. 1985, 24, 168–172. [Google Scholar] [CrossRef] [Scilit]
- Pacheco-Basulto, J.A.; Hernández-McConville, D.; Barroso-Muñoz, F.O.; Hernández, S.; Segovia-Hernández, J.G.; Castro-Montoya, A.J.; Bonilla-Petriciolet, A. Purification of bioethanol using extractive batch distillation: Simulation and experimental studies. Chem. Eng. Process. Process Intensif. 2012, 61, 30–35. [Google Scholar] [CrossRef] [Scilit]
- Uyazán, A.M.; Gil, I.D.; Aguilar, J.; Rodríguez, G.; Caicedo, L.A. Producción de alcohol carburante por destilación extractiva: Simulación del proceso con glicerol. Ing. E Investig. 2006, 26, 45–50. [Google Scholar]
- Turton, R.; Bailie, R.C.; Whiting, W.B.; Shaeiwitz, J.A.; Bhattacharyya, D. Analysis, Synthesis, and Design of Chemical Processes, 4th ed.; Prentice Hall: East Lansing, MI, USA, 2012. [Google Scholar]
- Jiménez Gutiérrez, A. Diseño de Procesos en Ingeniería Química; Reverté: Barcelona, Spain, 2003. [Google Scholar]
- Nitsche, M.; Gbadamosi, R. Heat Exchanger Design Guide; Butterworths Heinemann: Cambridge, MA, USA, 2016. [Google Scholar]
- Luyben, W.L. Distillation Design and Control Using ASPENTM Simulation, 2nd ed.; Wiley-AIChE: New York, NY, USA, 2013. [Google Scholar]
- Chemical Engineering. Available online: https://www.chemengonline.com/ (accessed on 30 December 2025).
- Seider, W.D.; Seader, J.D.; Lewin, D.R. Product & Process Design Principles—Synthesis, Analysis & Evaluation, 3rd ed.; John Wiley and Sons, Inc.: Hoboken, NJ, USA, 2009. [Google Scholar]
- Intratec. Glycerol Price: Historical and Current. Intratec Primary Commodity Prices. Available online: https://www.intratec.us/solutions/primary-commodity-prices/commodity/glycerol-prices (accessed on 10 March 2025).
- Towler, G.; Sinnott, R.K. Chemical Engineering Design: Principles, Practice and Economics of Plant and Process Design, 2nd ed.; Butterworth Heinemann: Cambridge, MA, USA, 2012. [Google Scholar]
- Towler, G.; Sinnott, R.K. Chemical Engineering Design: Principles, Practice and Economics of Plant and Process Design, 3rd ed.; Butterworth Heinemann: Cambridge, MA, USA, 2022; Chapter 7-Capital Cost Estimating; pp. 239–278. [Google Scholar]
- Loy, Y.Y.; Lee, X.L.; Rangaiah, G.P. Bioethanol recovery and purification using extractive dividing-wall column and pressure swing adsorption: An economic comparison after heat integration and optimization. Sep. Purif. Technol. 2015, 149, 413–427. [Google Scholar] [CrossRef] [Scilit]
Disclaimer/Publisher’s Note: The statements, opinions and data contained in all publications are solely those of the individual author(s) and contributor(s) and not of MDPI and/or the editor(s). MDPI and/or the editor(s) disclaim responsibility for any injury to people or property resulting from any ideas, methods, instructions or products referred to in the content. |
© 2026 by the authors. Licensee MDPI, Basel, Switzerland. This article is an open access article distributed under the terms and conditions of the Creative Commons Attribution (CC BY) license.