Article

FTIR-Based Machine Learning Identification of Virgin and Recycled Polyester for Textile Recycling in Industry 4.0


by
Maria Inês Barbosa
,
Ana Margarida Teixeira
,
Maria Leonor Sousa
,
Pedro Ribeiro
,
Clara Sousa
and
Pedro Miguel Rodrigues
*
CBQF—Centro de Biotecnologia e Química Fina—Laboratório Associado, Escola Superior de Biotecnologia, Universidade Católica Portuguesa, Rua de Diogo Botelho 1327, 4169-005 Porto, Portugal
*
Author to whom correspondence should be addressed.
Processes 2026, 14(6), 964; https://doi.org/10.3390/pr14060964
Submission received: 15 February 2026 / Revised: 11 March 2026 / Accepted: 16 March 2026 / Published: 18 March 2026

Abstract

Advances in Industry 4.0 manufacturing have accelerated the adoption of machine learning (ML) for automated classification. Polyester (PES), a widely used synthetic fiber, competes with natural fibers like cotton and other synthetics, highlighting the need for continuous research and improvement. In the textile sector, distinguishing recycled polyester (rPES) from virgin polyester (vPES) remains challenging due to overlapping chemical signatures and material variability. A combination of Fourier transform infrared (FTIR) spectroscopy and ML has not been explored for this purpose. In this study, we evaluated ML models to discriminate three PES fiber types (45 vPES, 65 rPES, and 55 mixed PES) using 165 FTIR spectra across four spectral regions, R1, R2, R3, and R4, as well as their combined representation. Six ML approaches were tested on data reduced with fast independent component analysis (FastICA) (1–30 components) using an 80/20 train–test dataset split. The Decision Tree classifier achieved the highest Accuracy in four of the five spectral evaluations, with classification accuracies ranging from 66.67% to 77.78% for region R4, which also had a balanced classification profile with an area-under-the-curve (AUC) value of 0.81. Notably, despite the moderate overall Accuracy, the model achieved 100% discrimination of rPES when distinguishing it from both mixed and vPES. Mixed fibers remained the most difficult to classify, highlighting the need for improved feature representation.

1. Introduction

Polyester (PES) is one of the most widely used synthetic fibers in the textile industry, accounting for approximately 59% of global fiber production—around 78 million tons in 2024 [1]—yet less than 1% originates from post-consumer textiles [2]. Its widespread use is driven by its versatility, durability, cost-effectiveness, and ease of blending with natural fibers [3,4], which are also competitors striving to maintain their market shares [5,6]. As the textile sector progresses toward Industry 4.0, the integration of data-driven technologies and intelligent manufacturing systems has become increasingly important for enhancing production efficiency and ensuring reliable material traceability.
Recycled polyester (rPES), predominantly derived from post-consumer PET bottles, represented roughly 12% of the total polyester market in 2023/2024, corresponding to about 9.3 million tons [1]. By repurposing existing plastic waste, rPES contributes to circular economy strategies and reduces the environmental impact [7], offering advantages over natural fibers such as cotton, whose cultivation consumes large amounts of water and can threaten global aquifers [6]. Advances in manufacturing and quality-control technologies, including machine learning (ML), have significantly improved rPES properties, enabling performance comparable to virgin PES (vPES) [8,9].
Mechanical recycling remains the most common pathway for rPES production, involving collection, sorting, washing, and reprocessing of PET waste [10,11]. However, mechanical processes may induce fiber shortening and reduced mechanical strength due to inter-fiber friction [11]. Integrating smart manufacturing solutions and ML-based monitoring can help mitigate these limitations through real-time optimization. Chemical recycling, which depolymerizes polyester via glycolysis, methanolysis, or hydrolysis [2,12], yields material quality comparable to vPES [13], though it is generally more energy-intensive and costly [14]. Emerging Industry 4.0 methodologies, including artificial intelligence (AI) and ML-driven process analytics, present promising routes to increase efficiency and scalability in both recycling approaches [15,16].
AI has been increasingly applied to textile fiber identification, classification, and property prediction, offering greater speed, accuracy, and scalability than traditional methods. Several studies highlight the potential of ML for textile classification [17,18]. Kainz et al. [19] evaluated supervised and unsupervised deep learning models for automated material identification under Industry 4.0 manufacturing paradigms. Tsai and Yuan [20] and Zhou et al. [21] analyzed different types of fibers, including cotton, Tencel, wool, cashmere, polyethylene terephthalate, polylactic acid, and polypropylene, using spectroscopy and pattern recognition models to support automated recycling and circular economy applications. Similarly, Valentino M. et al. [22] applied a microscopy technique combined with ML to rapidly distinguish cashmere from wool, streamlining quality assessment and counterfeit detection. In the same context, Tan et al. [23] proposed an ML-based method to distinguish cashmere from other animal fibers, aiming to improve reliable identification and prevent adulteration of cashmere products.
The combination of Fourier transform infrared (FTIR) spectroscopy ML has recently gained substantial attention as a rapid, non-destructive, and highly accurate approach for fiber identification and characterization. Several studies have demonstrated that supervised ML models applied to FTIR spectra enable reliable discrimination between natural and synthetic fibers. For instance, in historical textiles, FTIR spectra of wool and silk were classified with accuracies ranging from 90.48 to 92.31% [24]. Likewise, a dataset of more than 4000 FTIR spectra from 61 natural, regenerated, and synthetic fibers was analyzed using discriminant analysis and random forest models, achieving 99% discrimination accuracy and confirming the method’s applicability in cultural heritage, forensic, and industrial domains [25]. FTIR coupled with ML has also been used to classify jute–sisal blends with 100% accuracy [26], and FTIR combined with principal component analysis (PCA) and discriminant analysis enabled the classification of 89 single- and two-component fibers (e.g., cotton–polyester, wool–polyamide, viscose-based textiles), while also supporting semi-quantitative composition estimation [27]. In forensic applications, FTIR spectra of over 100 natural and synthetic fibers, such as cotton, wool, terry wool, and diverse polymeric fibers, were processed using ML algorithms, resulting in discrimination accuracy values between 96.53 and 100% [28].
For PES fibers, however, most AI and ML-driven research has focused on predicting structural properties, including molecular orientation, crystallinity, and fiber diameter, as well as mechanical performance (e.g., strength, elongation, and tenacity) [29,30,31,32]. Nonetheless, studies dedicated to blend quantification are beginning to emerge. Spectroscopic methods integrated with chemometrics and ML algorithms have shown promising capabilities in distinguishing chemical structures and degradation-related functional groups in PES fibers [33]. Mäkelä et al. [34] applied hyperspectral near-infrared (NIR) imaging combined with ML-based calibration to predict PES content, while Cura et al. [35] demonstrated that NIR spectroscopy provides effective textile-waste classification. Similar contributions can be found in [36,37]. Despite these advances, model performance may be negatively affected by sample thickness, multilayered textile structures, aging or chemical degradation, surface wrinkles, and moisture content [38]. These factors highlight the need for robust ML models capable of handling real-world variability, particularly in smart manufacturing and textile-recycling environments.
As far as we were able to verify, only a few studies have attempted to distinguish between vPES and rPES [39,40], and notably, none of these works employ AI or ML methods. This gap is particularly relevant, as accurate discrimination between vPES and rPES is essential for sustainable manufacturing, traceability, and regulatory compliance, and AI- or ML-driven approaches have strong potential to boost this capability by enabling more robust, scalable, and data-driven differentiation [41,42]. The importance of developing such reliable differentiation methods becomes even more evident when considering that mechanical and chemical recycling pathways differ substantially in environmental impact, and misclassification can lead to greenwashing [43,44,45,46]. Certifications such as the Global Recycled Standard (GRS), Recycled Claim Standard (RCS), SCS Recycled Content Standard, and ISCC PLUS require transparent and verifiable traceability [1]. In this context, analytical methods supported by ML and advanced data analytics, aligned with Industry 4.0 principles, can strengthen quality assurance, improve verification of supplier declarations, and enhance transparency in sustainable textile supply chains—particularly because visual inspection cannot reliably distinguish between vPES and rPES fibers.
The aim of this study is to discriminate three types of PES fibers (vPES, rPES, and a combination/mix of both—mPES) using 165 FTIR spectra and ML models. Different spectral regions were analyzed and six ML classifiers were tested using FTIR data selected via the ANOVA F-value method (p < 0.05) and reduced to 1–30 components through fast independent component analysis (FastICA), a data dimensionality reduction (DDR) technique selected based on our previous work on FTIR data analysis [16] where it showed better results compared to other DDR approaches.

2. Materials and Methods

2.1. Infrared Spectra Dataset Acquisition

FTIR spectra were acquired from PES fibers. For each individual fiber strand, spectra were collected at five distinct points along its length in order to account for local heterogeneity and to ensure independent measurements. Each measurement was performed on a single strand, not on fiber bundles or multiple strands simultaneously. In total, 165 spectra were obtained: 45 vPES, 65 rPES, and 55 mPES. These individual measurements were used as separate samples for subsequent ML analyses, with all spectra obtained from the same fiber always assigned to the same training or test set, thus avoiding any information leakage between datasets.
Spectral acquisition was performed using a PerkinElmer Spectrum BX FTIR System spectrophotometer (PerkinElmer Inc., Waltham, MA, USA) equipped with a deuterated triglycine sulfate (DTGS) detector. Spectra were collected in attenuated total reflectance (ATR) mode using a PIKE Technologies GladiATR accessory (PIKE Technologies, Madison, WI, USA). Each spectrum corresponded to the average of 32 scans, recorded at a spectral resolution of 4 cm−1, covering the wavenumber range from 4000 to 600 cm−1. Instrument control and data collection were performed by the manufacturer’s proprietary software.
To minimize the influence of confounding variables, fibers of comparable diameter were selected by visual inspection under an optical microscope. No surface treatments or finishing processes were applied prior to spectral acquisition. All samples were sourced from controlled production batches and showed no spectral evidence of oxidative degradation. Moisture interference was considered negligible, as the O-H stretching band (3200–3600 cm−1) was not present in the acquired spectra and this region was not included in the ML models.
All FTIR spectra datasets were stored in a structured Microsoft 365 Excel file containing 165 spectral entries, each represented by 1701 wavenumber bins.

2.2. Data Preprocessing, Analysis, and Classification

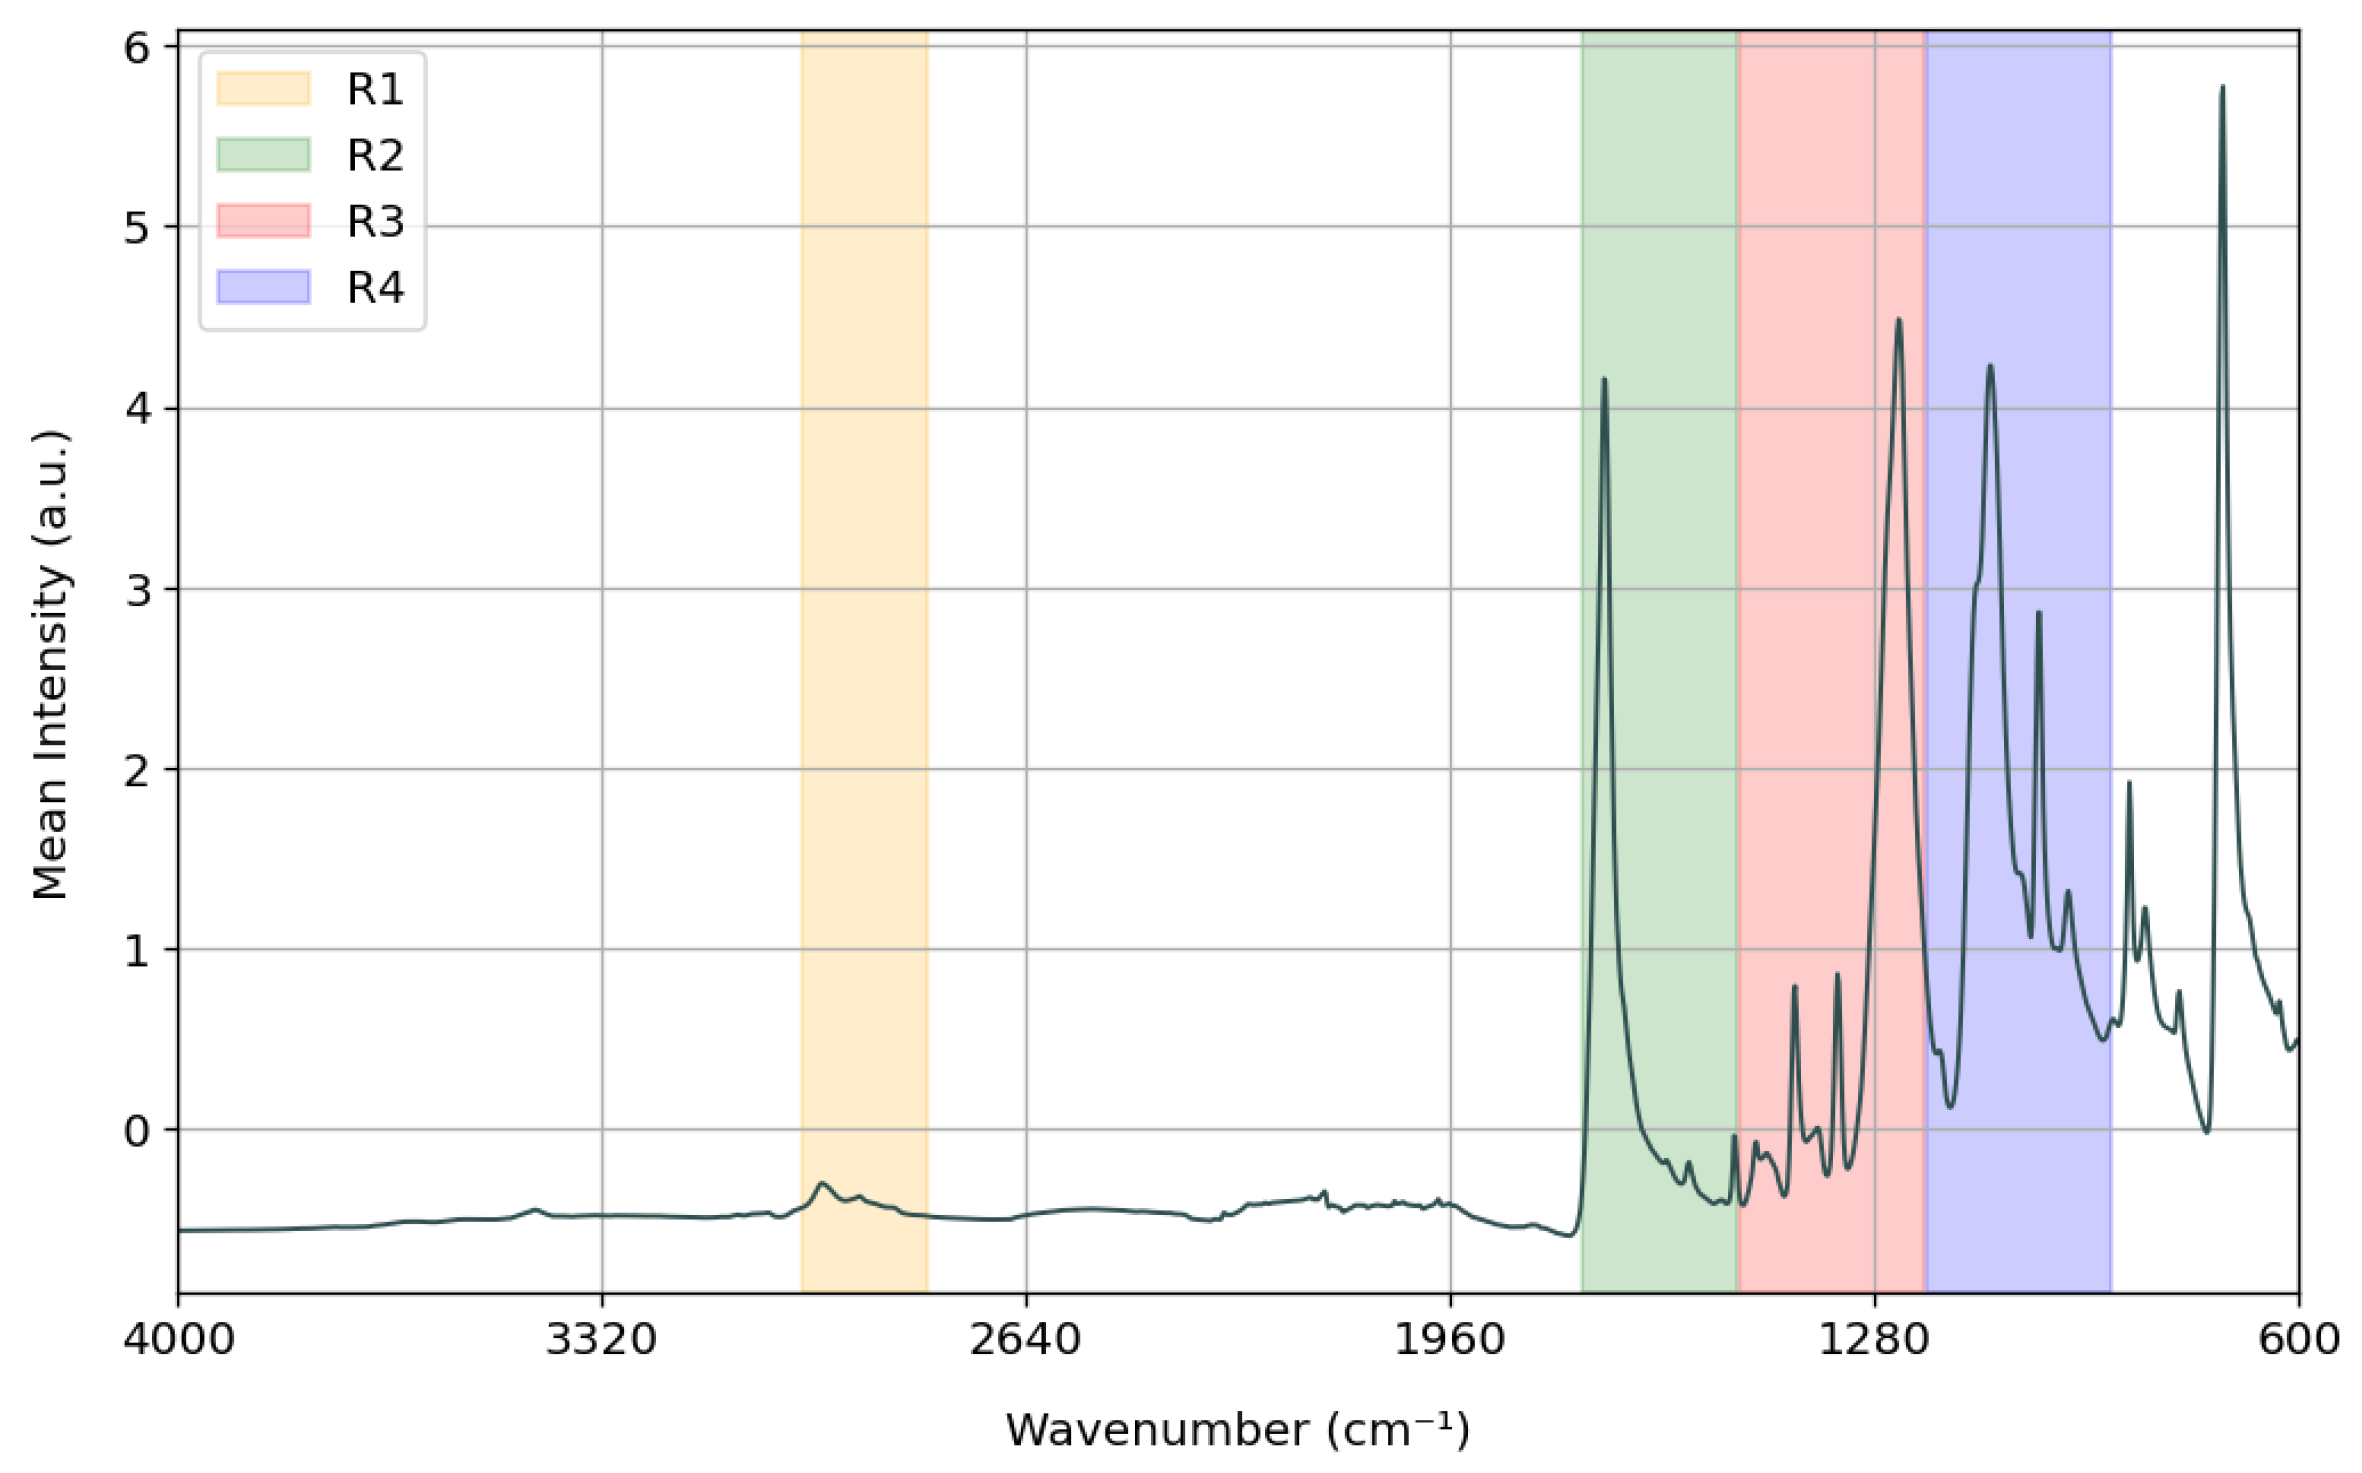
Python (version 3.9.21; Python Software Foundation, Wilmington, DE, USA) was used to import and preprocess the infrared spectra. The preprocessing pipeline included Standard Normal Variate (SNV) normalization, followed by Savitzky–Golay [47] smoothing and first-derivative filtering (window size of 17 points, polynomial order of 2, and first derivative). For data analysis, specific spectral regions that show visible activities were examined to assess their contribution to classification performance: R1 (3000–2800 cm−1), R2 (1750–1500 cm−1), R3 (1498–1200 cm−1), and R4 (1198–900 cm−1) (see Figure 1), as well as the full spectral window R1–R4 (3000–2800 and 1750–900 cm−1).
The dataset was then partitioned into an 80% training set and a 20% independent test set. A comprehensive feature-engineering and data-reduction pipeline was then fitted exclusively on the training data, ensuring a robust evaluation fully insulated from any form of data leakage. All transformation (feature selection and DDR) steps were learned strictly from the training portion and subsequently applied to the test data using the parameters estimated from the training set, meaning that every assumption applied to the test samples was derived solely from the training data. The pipeline comprised three sequential stages:
  • Feature Selection: To identify the most informative spectral features, an ANOVA F-test was applied independently within each spectral region and for the full spectral window (R1–R4). Each FTIR frequency bin was treated as an individual feature, and all bins were ranked according to their F-value, reflecting their ability to discriminate between classes. Subsets of increasing size were evaluated, starting from 30 features and increasing in steps of 10 up to the maximum available for each region.
  • DDR: Following feature selection, the selected subsets were transformed using FastICA. The number of independent components was varied from 1 to 30 in single-unit increments, while the remaining FastICA hyperparameters were kept at their default settings. Both the feature-selection stage and the FastICA decomposition were fitted exclusively on the training data, and the learned parameters were subsequently applied unchanged to the test set to avoid data leakage.
  • Model Training: After feature engineering and data reduction, six predefined scikit-learn classifiers (see Table 1) were trained on the transformed training data (feature-selected and ICA-reduced).
Model performance was then evaluated on the held-out 20% test set. Performance metrics including A c c u r a c y , P r e c i s i o n , R e c a l l , F 1 - s c o r e , and A U C , therefore reflecting the evaluation on this independent test set, ensuring a rigorous and reliable estimate of model generalization.
Accuracy represents the fraction of correctly classified samples among all samples, expressed as a percentage, and was computed as follows [48]:
A c c u r a c y = T P + T N T P + T N + F P + F N × 100 %
where T P , T N , F P , and F N denote the number of true positives, expressed as a percentage, false positives, and false negatives, respectively [49].
Precision (also referred to as the positive predictive value) measures the proportion, expressed as a percentage, of correctly predicted positive samples among all samples predicted as positive [50]:
P r e c i s i o n = T P T P + F P × 100 %
Recall (also known as sensitivity or the true positive rate) corresponds to the proportion of correctly predicted positive samples relative to the total number of actual positive samples [50]:
R e c a l l = T P T P + F N × 100 %
F1-Score is defined as the harmonic mean of Precision and Recall, providing a single balanced measure of classification performance [51]:
F 1 - S c o r e = 2 × P r e c i s i o n × R e c a l l P r e c i s i o n + R e c a l l × 100 %
The AUC evaluates the model’s ability to discriminate between classes by summarizing the trade-off between the true positive rate and the false positive rate across different decision thresholds. AUC values range from 0 to 1, where 1 indicates perfect discrimination and 0.5 corresponds to random classification [52].
Figure 2 presents a schematic representation of the data analysis and prediction workflow. The dataset and the Python code supporting this work are publicly available on GitHub (version 2.47.0) at https://github.com/pmrodri/PES_Fibres (accessed on 10 March 2026).

3. Results

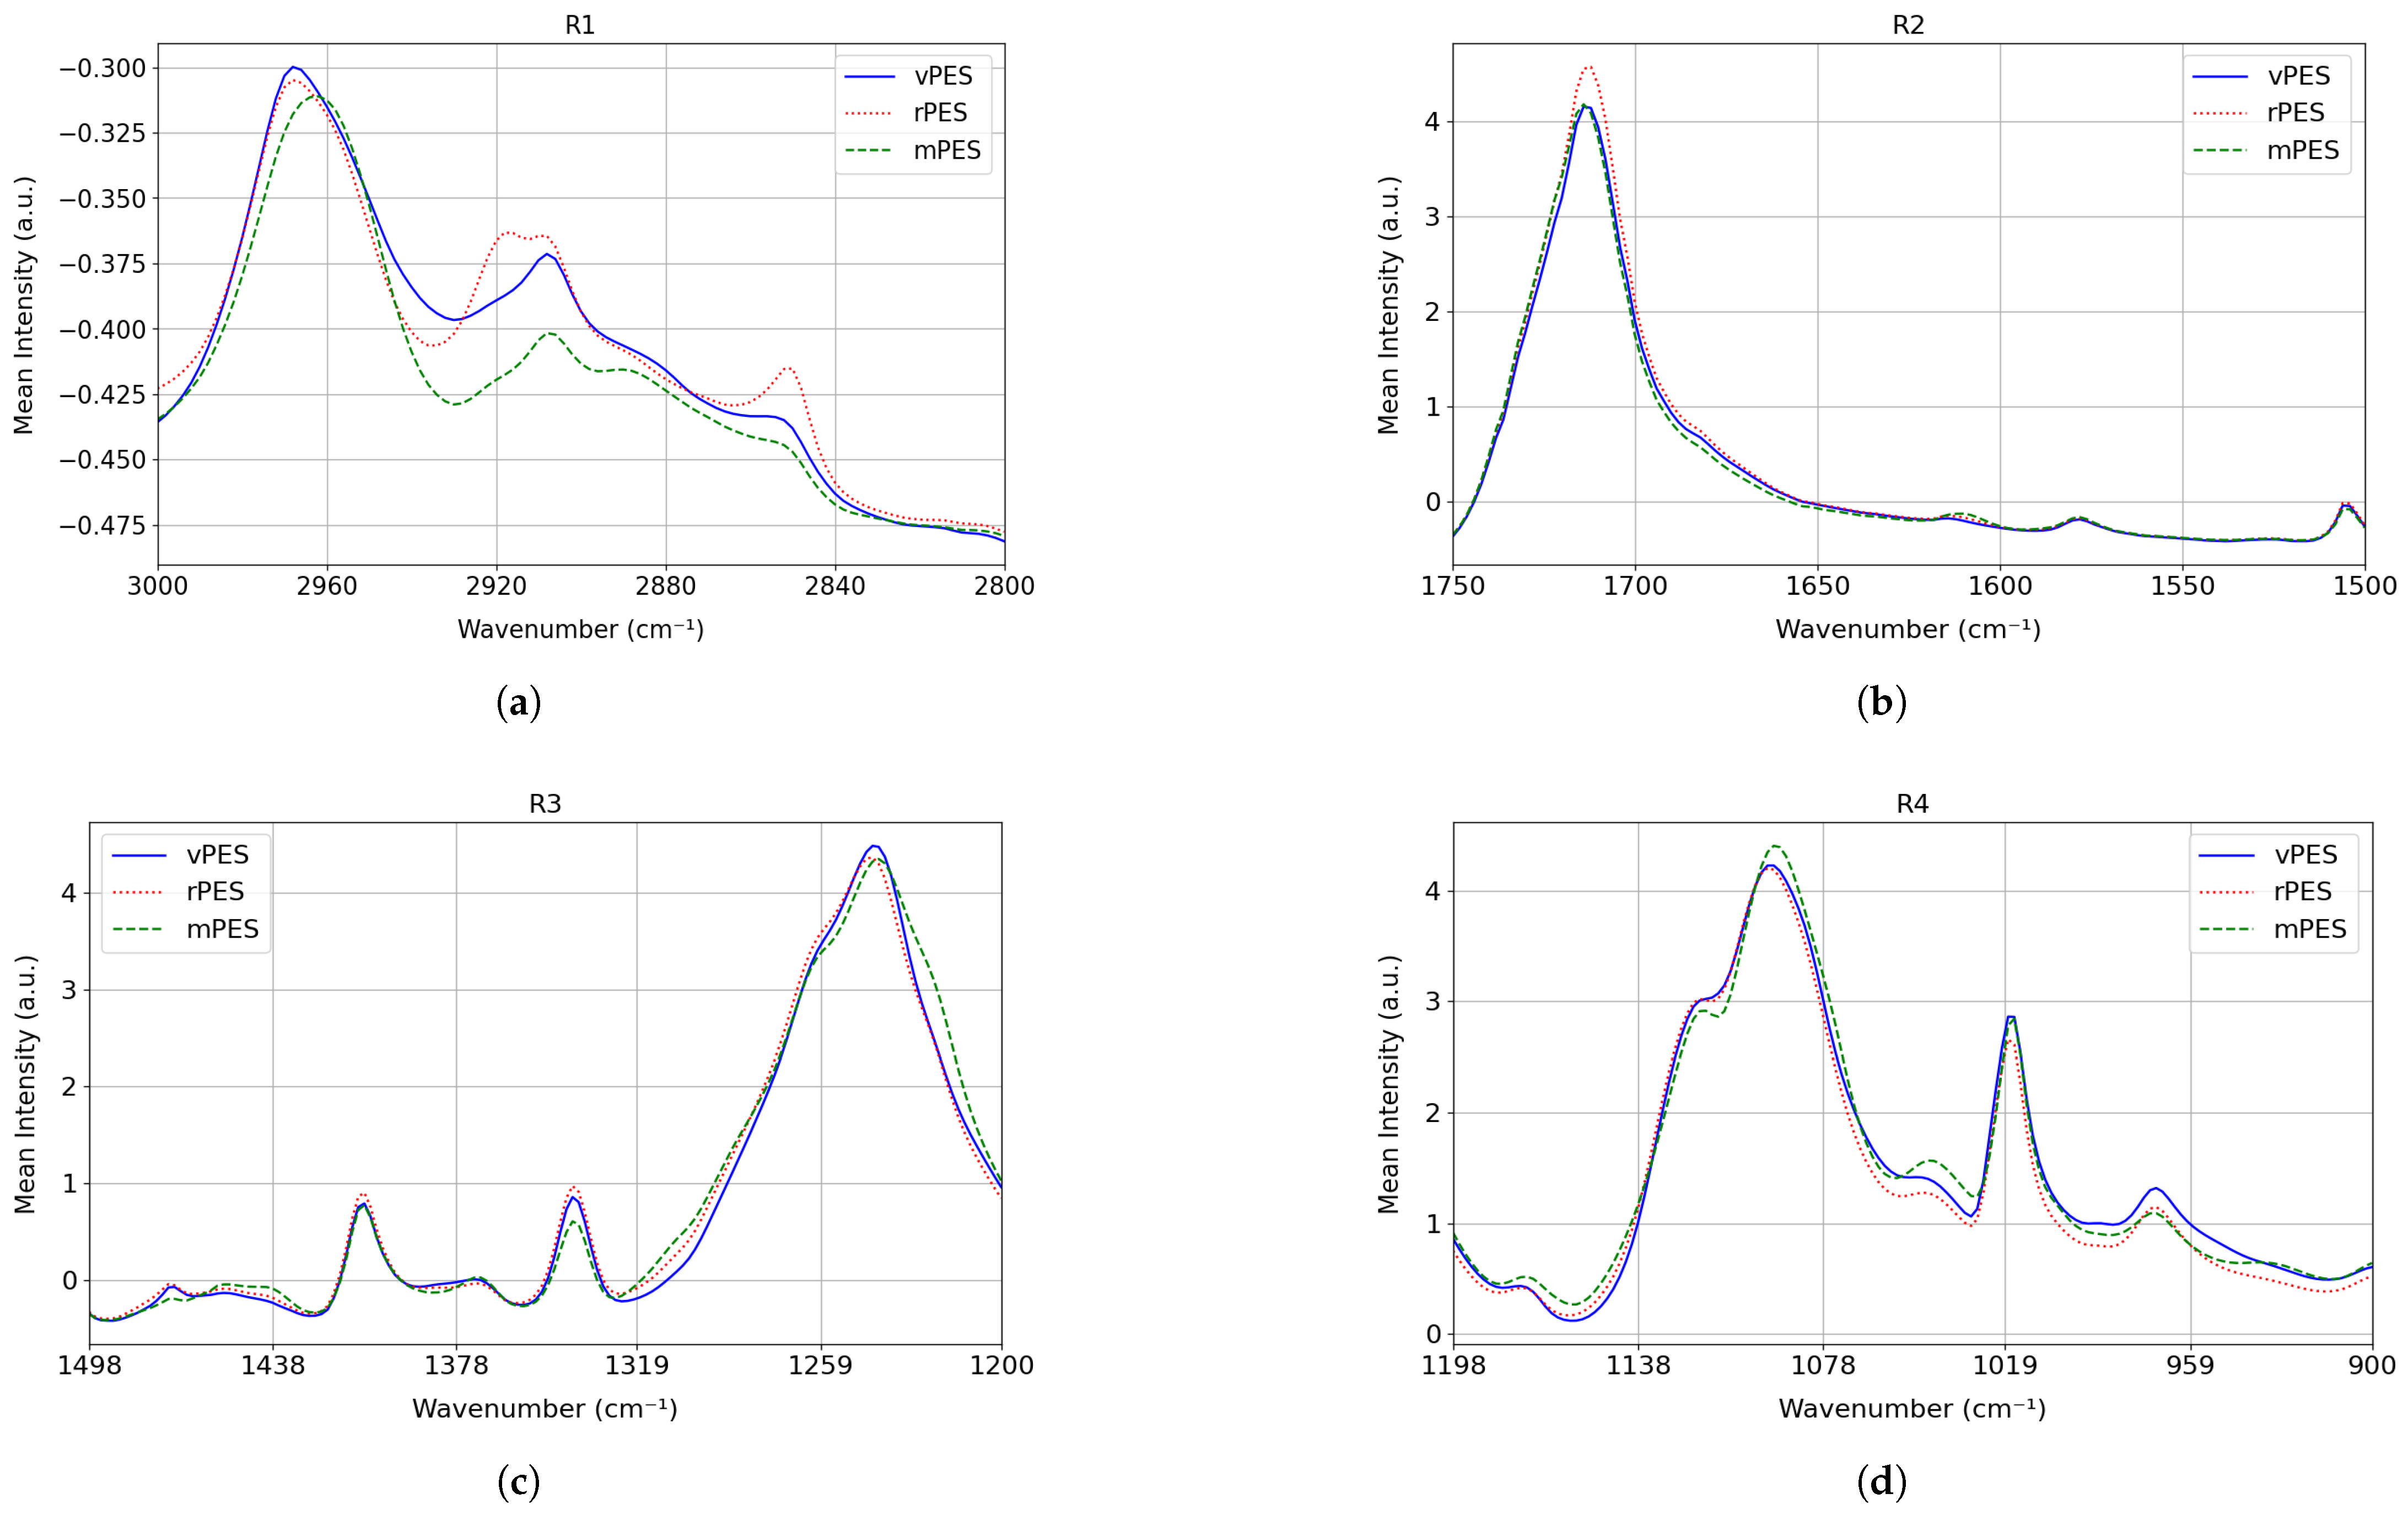
Figure 3 presents the mean spectra for each region generated with training data. Each curve corresponds to a PES fiber type, providing an overview of the spectral differences observed across the regions.
Table 2 summarizes the classification performance of the ML models across the previously defined spectral regions. Using Accuracy as the primary comparison metric, the best-performing region is highlighted in brown.
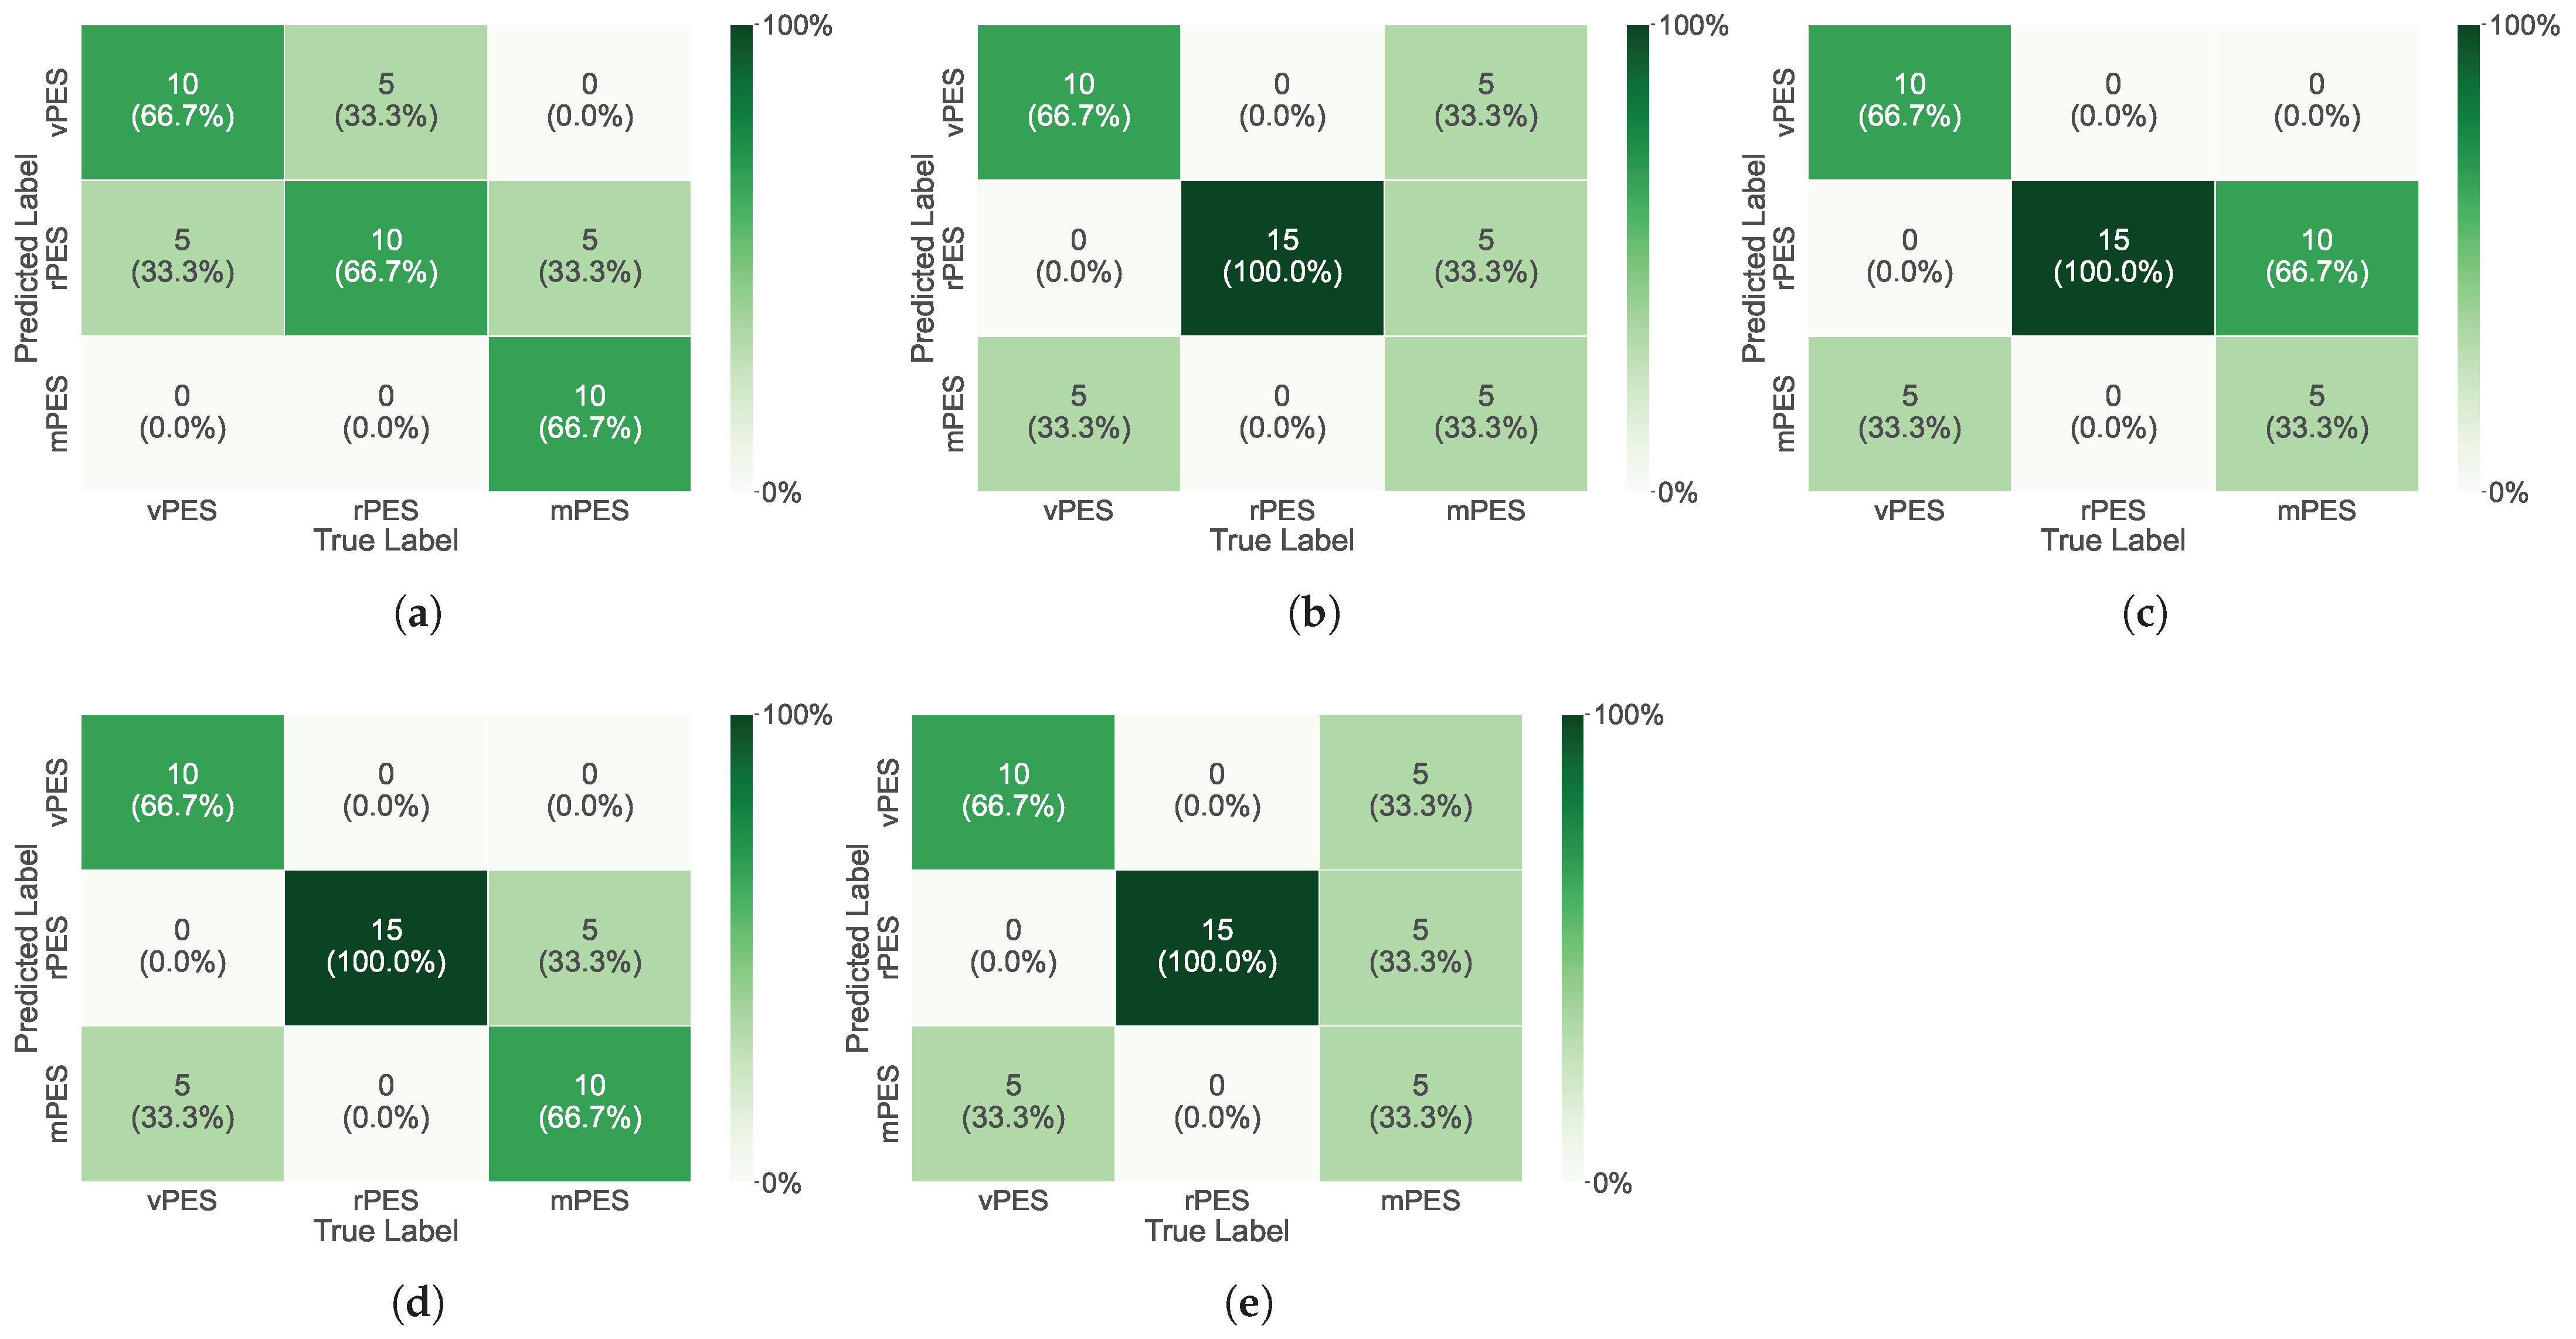
For each row of Table 2, the corresponding confusion matrices are provided to give a detailed view of the classification outcomes for each spectral region and its respective best-performing model (Figure 4). These matrices allow visual inspection of class-specific performance, including the distribution of correct and incorrect predictions across the three PES fiber categories (vPES, rPES, and mPES).

4. Discussion

The analysis of the mean spectra across the four spectral regions, shown in Figure 3, provides an overall view of the spectral differences among the three PES fiber types. In this figure, R1 exhibits the most apparent spectral separations between fiber types. However, Table 2 indicates that the highest classification performance was achieved in R4, suggesting that this region contains more subtle yet more informative features for ML classification, even if these distinctions are less visible in the mean spectra. It is also important to note that mean spectra may induce misleading interpretations, since averaging can mask intra-class variability and attenuate fine-grained spectral patterns that are crucial for discrimination. While mean spectra highlight general class-wise trends, they do not fully capture the multivariate relationships exploited by the ML models.
Comparing all spectral regions using an accuracy-based analysis (Table 2), region R4 combined with the DT classifier using seven FastICA components achieved the highest Accuracy and the strongest overall performance. This model reached an Accuracy of 77.78%, clearly outperforming the remaining regions, which all achieved only 66.67%. The accompanying Precision (80.56%), Recall (77.78%), and F1-score (79.14%) values for region R4 are also the highest among all evaluated models. Although its AUC of 0.81 is not the maximum observed, it is the most stable across metrics and remains high, while also presenting a low execution time (0.0439 s), comparable to those of the other regions. Importantly, despite the 77.78% Accuracy, this model showed a strong ability to distinguish rPES from both mixed and virgin PES versions with 100% of discrimination capability, demonstrating high practical discriminative power, in accordance with confusion matrices results presented in Figure 4d.
Region R1, also using a DT classifier, achieved the highest overall AUC of 0.92. However, its Accuracy remained at 66.67%, indicating weaker decision-making performance. This discrepancy may reflect limited generalizability or suboptimal decision boundaries: although the model separates the classes well in probabilistic terms, as suggested by the high AUC, this separation does not translate into correct class assignments. The remaining metrics for R1 are likewise lower than those obtained for R4. The other regions (R2, R3, and the full R1–R4 spectral window) show similar performance, each reaching 66.67% Accuracy and exhibiting lower AUC values than R4.
Figure 4 provides further insight into model behavior by presenting the confusion matrices associated with the best classifier for each analyzed region. In R1 (Figure 4a), misclassifications mainly involve vPES and rPES fibers, with rPES being over-predicted; one-third of mPES samples are assigned to rPES, although no samples from the raw fiber classes are misclassified as mPES. For R2 (Figure 4b), despite achieving the same Accuracy as R1, the error distribution differs. The model cleanly separates vPES and rPES fibers, but confusion increases for mPES, with one-third of true vPES samples misclassified as mPES. In the R3 region (Figure 4c), mPES remains the most challenging class: two-thirds of misclassified mPES samples are assigned to rPES. Nevertheless, the model maintains complete separation between the vPES and rPES classes, again showing a systematic tendency to over-predict rPES. Region R4 (Figure 4d), which provides the highest Accuracy, preserves perfect discrimination between vPES and rPES fibers. Misclassifications arise mainly within the mPES class, where one-third of samples are misassigned. This indicates that the performance improvements seen in R4 stem largely from enhanced discrimination of the raw materials rather than from better recognition of mixed fibers. Finally, when the full spectral window R1–R4 is used (Figure 4e), the model continues to separate vPES and rPES effectively. However, mPES fibers remain the most difficult class, with true mPES samples distributed across all predicted classes and one-third of vPES samples being misclassified as mPES. As a result, rPES tends to be over-predicted while mPES is under-predicted, reinforcing the observation that mixed fibers consistently present the greatest classification challenge across regions.
Finally, these findings are particularly relevant in the context of Industry 4.0, where automated decision-making and real-time quality monitoring are essential for achieving resilient and transparent supply chains. The ability to accurately distinguish vPES from rPES using FTIR data combined with ML contributes to the digital transformation of textile manufacturing by enabling rapid, non-destructive, and autonomous material verification. Such capability supports smart production systems in reducing dependency on manual inspection, as labor is becoming increasingly scarce and costly, minimizing classification errors, and ensuring that recycled materials are consistently correctly identified throughout the manufacturing workflow. Moreover, robust digital identification systems are fundamental for enhancing traceability and guaranteeing compliance with sustainability certifications within cyber–physical production environments. As textile manufacturing increasingly incorporates IoT sensors, cloud-based analytics, and data-driven control strategies, reliable ML-assisted material classification becomes a key enabler for fully integrated, adaptive, and sustainable Industry 4.0 operations.

5. Conclusions

PES fibers are facing increasing competition from natural fibers, such as cotton, which are seeking to expand their share of the textile market. Maintaining the competitiveness of PES requires continuous technological advancement driven by dedicated research efforts. In this context, this work demonstrates the potential of integrating FTIR spectroscopy with ML to enable automated, non-destructive, rapid, and reproducible discrimination between vPES and rPES fibers. Such data-driven approaches provide a promising pathway for industrial deployment by supporting accurate material identification, supply-chain traceability, regulatory compliance, and quality-control procedures. By reducing the likelihood of material misclassifications, these models can enhance production efficiency and contribute to meeting sustainability targets.
The results further show that classifier selection strongly influences model performance, with DT consistently outperforming the remaining algorithms across all spectral regions. Although region R1 (3000–2800 cm−1) yielded the highest AUC, region R4 (1198–900 cm−1) offered the most balanced and reliable classification, achieving superior Accuracy and strong values for all complementary metrics. Misclassification patterns were predominantly associated with mPES fibers, which were frequently confused with the raw material classes, even when the full spectral window R1–R4 was used.
Future work should aim to improve feature representations and explore alternative modeling strategies, including robust validation schemes such as cross-validation. Moreover, expanding the size and diversity of the dataset will be essential to capture the natural variability in PES fibers and to strengthen the generalization of future classification models. In addition, integrating data fusion approaches and multimodal analysis that combine FTIR data with complementary infrared techniques, such as NIR spectroscopy, as well as imaging-based methods, may further enhance the discriminative power of these pipelines. Additional DDR techniques, including PCA, linear discriminant analysis (LDA), non-negative matrix factorization (NMF), and autoencoder-based methods, could also be tested to find out their capability to improve the discrimination results. Furthermore, extending the approach to other synthetic fibers (e.g., nylon) and natural fibers (e.g., cotton, wool) could provide a more comprehensive assessment of the model’s applicability across textile materials. Altogether, the integration of FTIR spectroscopy with ML methods offers a fast, non-destructive, and reliable framework for distinguishing virgin from recycled PES fibers. When aligned with Industry 4.0 principles, such FTIR–ML pipelines can support automated material verification in smart manufacturing environments, thereby improving traceability, quality control, and sustainability across the textile value chain.

Author Contributions

Conceptualization, M.I.B., P.R. and P.M.R.; methodology, M.I.B., P.R., C.S. and P.M.R.; validation, C.S. and P.M.R.; Data Curation, A.M.T., M.L.S. and C.S.; investigation, M.I.B., A.M.T., M.L.S., P.R., C.S. and P.M.R.; writing—original draft, M.I.B., A.M.T., C.S. and P.M.R.; writing—review and editing, M.I.B., A.M.T., M.L.S., P.R., C.S. and P.M.R.; supervision, P.M.R.; funding acquisition, P.M.R. All authors have read and agreed to the published version of the manuscript.

Funding

This study was funded by the Integrated Project be@t—Textile Bioeconomy, to strengthen the National Bioeconomy, financed by the Environmental Fund through Component 12—Promotion of Sustainable Bioeconomy (Investment TC-C12-i01—Sustainable Bioeconomy No. 02/C12-i01.01/2022) using European funds allocated to Portugal by the Recovery and Resilience Plan (RRP) within the scope of the European Union (EU) Recovery and Resilience Mechanism in the framework of Next Generation EU for the period 2021–2026. This work was supported by National Funds from FCT—Fundação para a Ciência e a Tecnologia through project UID/50016/2025. M.I.B. and C.S. also thank FCT and the Recovery and Resilience Plan (RRP)—Portuguese Republic, for funding through contract numbers 2023.15056.TENURE.059 and 2023.15056.TENURE.046.

Data Availability Statement

The original data presented in the study are openly available in Github (version 2.47.0) at https://github.com/pmrodri/PES_Fibres (accessed on 10 March 2026).

Conflicts of Interest

The authors declare no conflicts of interest.

References

  1. Textile Exchange. Materials Market Report, 12th ed.; Burbank, CA, USA, 2025; Available online: https://textileexchange.org/knowledge-center/reports/materials-market-report-2025/ (accessed on 28 January 2026).
  2. Enking, J.; Becker, A.; Schu, G.; Gausmann, M.; Cucurachi, S.; Tukker, A.; Gries, T. Recycling processes of polyester-containing textile waste–A review. Resour. Conserv. Recycl. 2025, 219, 108256. [Google Scholar] [CrossRef]
  3. Deopura, B.; Padaki, N. Synthetic Textile Fibres. In Textiles and Fashion; Elsevier: Amsterdam, The Netherlands, 2015; pp. 97–114. [Google Scholar] [CrossRef]
  4. Shahid, M.A.; Okyay, N.; Babaarslan, O. A Comparative Analysis of Denim Fabric Performances from Cotton/Polyester Blended Rigid and Stretched Yarns. Fibers 2024, 12, 86. [Google Scholar] [CrossRef]
  5. Adeleke, A.A. A Review of Plastic Contamination Challenges and Mitigation Efforts in Cotton and Textile Milling Industries. AgriEngineering 2023, 5, 193–217. [Google Scholar] [CrossRef]
  6. Adeleke, A.A. Technological advancements in cotton agronomy: A review and prospects. Technol. Agron. 2024, 4, e008. [Google Scholar] [CrossRef]
  7. Chairat, S.; Gheewala, S.H. Life cycle assessment and circularity of polyethylene terephthalate bottles via closed and open loop recycling. Environ. Res. 2023, 236, 116788. [Google Scholar] [CrossRef] [PubMed]
  8. Zhang, R.; Ma, X.; Shen, X.; Zhai, Y.; Zhang, T.; Ji, C.; Hong, J. PET bottles recycling in China: An LCA coupled with LCC case study of blanket production made of waste PET bottles. J. Environ. Manag. 2020, 260, 110062. [Google Scholar] [CrossRef]
  9. Seval, U. The bursting strength properties of knitted fabrics containing recycled polyester fiber. J. Text. Inst. 2020, 112, 1998–2003. [Google Scholar] [CrossRef]
  10. Dzoh Fonkou, J.P.; Beggio, G.; Salviulo, G.; Lavagnolo, M.C. Analytical Methods for In-Depth Assessment of Recycled Plastics: A Review. Environments 2025, 12, 154. [Google Scholar] [CrossRef]
  11. Baloyi, R.B.; Gbadeyan, O.J.; Sithole, B.; Chunilall, V. Recent advances in recycling technologies for waste textile fabrics: A review. Text. Res. J. 2023, 94, 508–529. [Google Scholar] [CrossRef]
  12. El Darai, T.; Ter-Halle, A.; Blanzat, M.; Despras, G.; Sartor, V.; Bordeau, G.; Lattes, A.; Franceschi, S.; Cassel, S.; Chouini-Lalanne, N.; et al. Chemical recycling of polyester textile wastes: Shifting towards sustainability. Green Chem. 2024, 26, 6857–6885. [Google Scholar] [CrossRef]
  13. Valerio, O.; Muthuraj, R.; Codou, A. Strategies for polymer to polymer recycling from waste: Current trends and opportunities for improving the circular economy of polymers in South America. Curr. Opin. Green Sustain. Chem. 2020, 25, 100381. [Google Scholar] [CrossRef]
  14. Schade, A.; Melzer, M.; Zimmermann, S.; Schwarz, T.; Stoewe, K.; Kuhn, H. Plastic Waste Recycling-A Chemical Recycling Perspective. ACS Sustain. Chem. Eng. 2024, 12, 12270–12288. [Google Scholar] [CrossRef]
  15. Rodrigues, P.M.; Sousa, C. Machine Learning-Based Spectral Analyses for Camellia japonica Cultivar Identification. Molecules 2025, 30, 546. [Google Scholar] [CrossRef] [PubMed]
  16. Ribeiro, P.; Barbosa, M.I.; Sousa, C.; Rodrigues, P.M. Near-Infrared Spectroscopy Machine-Learning Spectral Analysis Tool for Blueberries (Vaccinium corymbosum) Cultivar Discrimination. Foods 2025, 14, 1428. [Google Scholar] [CrossRef] [PubMed]
  17. Malashin, I.; Martysyuk, D.; Tynchenko, V.; Gantimurov, A.; Nelyub, V.; Borodulin, A.; Galinovsky, A. Machine Learning in Polymeric Technical Textiles: A Review. Polymers 2025, 17, 1172. [Google Scholar] [CrossRef]
  18. Mulenga, T.K.; Rangappa, S.M.; Siengchin, S. Natural Fiber Composites: A Comprehensive Review on Machine Learning Methods. Arch. Comput. Methods Eng. 2025, 32, 4331–4357. [Google Scholar] [CrossRef]
  19. Kainz, M.; Krondorfer, J.K.; Jaschik, M.; Jernej, M.; Ganster, H. Supervised and Unsupervised Textile Classification via Near-Infrared Hyperspectral Imaging and Deep Learning. arXiv 2025, arXiv:2505.03575. [Google Scholar] [CrossRef]
  20. Tsai, P.F.; Yuan, S.M. Using Infrared Raman Spectroscopy with Machine Learning and Deep Learning as an Automatic Textile-Sorting Technology for Waste Textiles. Sensors 2024, 25, 57. [Google Scholar] [CrossRef]
  21. Zhou, J.; Yu, L.; Ding, Q.; Wang, R. Textile Fiber Identification Using Near-Infrared Spectroscopy and Pattern Recognition. Autex Res. J. 2019, 19, 201–209. [Google Scholar] [CrossRef]
  22. Valentino, M.; Behal, J.; Tonetti, C.; Carletto, R.; Itri, S.; Memmolo, P.; Stella, E.; Miccio, L.; Bianco, V.; Ferraro, P. Discernment of textile fibers by polarization-sensitive Digital Holographic microscope and machine learning. Opt. Lasers Eng. 2024, 181, 108395. [Google Scholar] [CrossRef]
  23. Tan, C.; Chen, H.; Lin, Z.; Wu, T. Category identification of textile fibers based on near-infrared spectroscopy combined with data description algorithms. Vib. Spectrosc. 2019, 100, 71–78. [Google Scholar] [CrossRef]
  24. Król, M.; Stoch, P.; Wójcik, S.; Nowak Przybyszewska, E.; Mozgawa, W. Machine learning-assisted vibrational spectroscopy for textile fiber identification in historical tapestries. J. Cult. Herit. 2025, 73, 571–578. [Google Scholar] [CrossRef]
  25. Peets, P.; Kaupmees, K.; Vahur, S.; Leito, I. Reflectance FT-IR spectroscopy as a viable option for textile fiber identification. Herit. Sci. 2019, 7, 93. [Google Scholar] [CrossRef]
  26. Misra, S.; Saha, D.; Debnath, S.; Singh, R. Identification and classification of blended fibres using attenuated total reflectance-Fourier transform infrared (ATR-FTIR) spectroscopy coupled with chemometric analysis. Microchem. J. 2025, 216, 114713. [Google Scholar] [CrossRef]
  27. Peets, P.; Leito, I.; Pelt, J.; Vahur, S. Identification and classification of textile fibres using ATR-FT-IR spectroscopy with chemometric methods. Spectrochim. Acta Part A Mol. Biomol. Spectrosc. 2017, 173, 175–181. [Google Scholar] [CrossRef]
  28. Sharma, V.; Mahara, M.; Sharma, A. On the textile fibre’s analysis for forensics, utilizing FTIR spectroscopy and machine learning methods. Forensic Chem. 2024, 39, 100576. [Google Scholar] [CrossRef]
  29. Xie, R.; Liu, Y.; He, X.; Zhang, Y.; Wang, H. Structural properties and diameter prediction of fine denier polyester fiber based on machine learning algorithms. J. Text. Inst. 2023, 115, 1946–1953. [Google Scholar] [CrossRef]
  30. Xie, R.; He, X.; Liu, Y.; Zhang, Y.; Wang, X.; Xu, J.; Wang, H. Machine learning assisted mechanical properties prediction of fine denier polyester fiber. J. Text. Inst. 2024, 116, 575–583. [Google Scholar] [CrossRef]
  31. Dadgar, M.; Noshad, K. Machine learning modeling of melt-spinning for yarn property prediction. Results Mater. 2025, 28, 100776. [Google Scholar] [CrossRef]
  32. Zhang, X.; Xin, B.; Zheng, Y.; Shi, M.; Lin, L.; Gao, C.; Yi, Y.; Yang, Z.; Li, H. Fiber recognition with machine learning methods by fiber tensile fracture via acoustic emission method. Text. Res. J. 2020, 90, 2552–2563. [Google Scholar] [CrossRef]
  33. Hu, K.; Brambilla, L.; Castiglioni, C. IR Spectroscopy as a Diagnostic Tool in the Recycling Process and Evaluation of Recycled Polymeric Materials. Sensors 2025, 25, 6205. [Google Scholar] [CrossRef]
  34. Mäkelä, M.; Rissanen, M.; Sixta, H. Machine vision estimates the polyester content in recyclable waste textiles. Resour. Conserv. Recycl. 2020, 161, 105007. [Google Scholar] [CrossRef]
  35. Cura, K.; Rintala, N.; Kamppuri, T.; Saarimäki, E.; Heikkilä, P. Textile Recognition and Sorting for Recycling at an Automated Line Using Near Infrared Spectroscopy. Recycling 2021, 6, 11. [Google Scholar] [CrossRef]
  36. Gao, Q.; Zhang, L.; Wang, F.; Xiong, W.; Cui, H.; Wu, X.; Wang, W.; Zhang, L. Online Rapid Detection of Polyester Content Blended Fabrics Using Hyperspectral Imaging and a Stratified Prediction Model; SSRN: Rochester, NY, USA, 2025. [Google Scholar] [CrossRef]
  37. Li, J.; Liu, Q.; Niu, H.; Wang, X. Identification of textile fiber composition in waste textiles using improved CNN and near-infrared spectroscopy. J. Ind. Text. 2025, 55, 15280837251359681. [Google Scholar] [CrossRef]
  38. Becker, A.; Datko, A.; Kroell, N.; Küppers, B.; Greiff, K.; Gries, T. Near-infrared-based sortability of polyester-containing textile waste. Resour. Conserv. Recycl. 2024, 206, 107577. [Google Scholar] [CrossRef]
  39. Claussen, L.; Lloyd, A.; Ruiz, D.; Havenith, G. Recycled versus virgin polyester sportswear – can a difference be perceived in actual use? Int. J. Fash. Des. Technol. Educ. 2023, 18, 147–155. [Google Scholar] [CrossRef]
  40. Patil, P.; Deshpande, R.; Indi, Y.; Hattimare, R. A Green Approach: Comparative Study of Virgin and Recycled Polyester for Textile Application. J. Emerg. Technol. Innov. Res. 2018, 5, 719–723. [Google Scholar]
  41. Ingle, N.; Jasper, W.J. A review of the evolution and concepts of deep learning and AI in the textile industry. Text. Res. J. 2025, 95, 1709–1737. [Google Scholar] [CrossRef]
  42. Yildirim, P.; Birant, D.; Alpyildiz, T. Data mining and machine learning in textile industry. WIREs Data Min. Knowl. Discov. 2017, 8, e1228. [Google Scholar] [CrossRef]
  43. Plakantonaki, S.; Kiskira, K.; Zacharopoulos, N.; Chronis, I.; Coelho, F.; Togiani, A.; Kalkanis, K.; Priniotakis, G. A Review of Sustainability Standards and Ecolabeling in the Textile Industry. Sustainability 2023, 15, 11589. [Google Scholar] [CrossRef]
  44. Fidan, F.S.; Aydoğan, E.K.; Uzal, N. Sustainability assessment of denim fabric made of PET fiber and recycled fiber from postconsumer PET bottles using LCA and LCC approach with the EDAS method. Integr. Environ. Assess. Manag. 2024, 20, 2347–2365. [Google Scholar] [CrossRef]
  45. Fatima, A.; Khan, F.U.; Hussain, M.; Malik, R.N. Sustainability assessment of home textiles made of recycled PET fibre using life cycle assessment and life cycle costing analyses. Sci. Total Environ. 2025, 982, 179652. [Google Scholar] [CrossRef]
  46. Zhao, S.; Hou, N.; Li, R. Life cycle assessment of recycled polyester and analysis of key emission sources. Int. J. Life Cycle Assess. 2025, 30, 3250–3263. [Google Scholar] [CrossRef]
  47. Savitzky, A.; Golay, M.J.E. Smoothing and Differentiation of Data by Simplified Least Squares Procedures. Anal. Chem. 1964, 36, 1627–1639. [Google Scholar] [CrossRef]
  48. Sammut, C.; Webb, G.I. Accuracy. In Encyclopedia of Machine Learning and Data Mining; Springer: Boston, MA, USA, 2017; p. 8. [Google Scholar] [CrossRef]
  49. Doğan, O. Data Linkage Methods for Big Data Management in Industry 4.0. In Optimizing Big Data Management and Industrial Systems With Intelligent Techniques; IGI Global: Hershey, PA, USA, 2019; pp. 108–127. [Google Scholar] [CrossRef]
  50. Ting, K.M. Precision and Recall. In Encyclopedia of Machine Learning and Data Mining; Springer: Boston, MA, USA, 2017; pp. 990–991. [Google Scholar] [CrossRef]
  51. Goutte, C.; Gaussier, E. A Probabilistic Interpretation of Precision, Recall and F-Score, with Implication for Evaluation. In Advances in Information Retrieval; Springer: Berlin/Heidelberg, Germany, 2005; pp. 345–359. [Google Scholar] [CrossRef]
  52. Nahm, F. Receiver operating characteristic curve: Overview and practical use for clinicians. Korean J. Anesthesiol. 2022, 75, 25–36. [Google Scholar] [CrossRef]
Figure 1. Spectral regions used for data analysis: R1 (3000–2800 cm−1), R2 (1750–1500 cm−1), R3 (1498–1200 cm−1), and R4 (1198–900 cm−1).
Processes 14 00964 g001
Figure 2. Data processing and machine learning prediction workflow. FTIR spectra from PES samples are converted into feature vectors and split into training (80%) and test (20%) sets. Feature selection (ANOVA F-value) and dimensionality reduction (FastICA selection according to the training data) are performed using only the training data, and the resulting transformations are applied to the test set to avoid data leakage. The processed features are then used to train multiple classifiers, generating the final classification report. n* = 100 (R1), 125 (R2), 149 (R3), 149 (R4), 523 (Full spectral window).
Processes 14 00964 g002
Figure 3. Mean spectra generated with training data for the four spectral regions used in the classification analysis. Each curve represents the mean spectrum of a class (vPEs, rPEs, and mPEs), calculated across the regions: (a) R1 (3000–2800 cm−1), (b) R2 (1750–1500 cm−1), (c) R3 (1498–1200 cm−1), and (d) R4 (1198–900 cm−1).
Processes 14 00964 g003
Figure 4. Confusion matrices associated with the best classification result obtained for each evaluated spectral region. Panels (ad) correspond to regions R1, R2, R3, and R4, respectively, while panel (e) represents the full spectral window R1–R4.
Processes 14 00964 g004
Table 1. Six Scikit-learn ML classifier configurations.
ClassifierHyperparameters
AdaBoostDefault parameters (e.g., n_estimators = 50, learning_rate = 1.0, algorithm = “SAMME.R”)
Decision Tree (DT)max_depth = 5 + Default parameters (e.g., criterion = “gini”, splitter = “best”, min_samples_split = 2)
K-Nearest Neighbors (KNNs)Default parameters (e.g., n_neighbors = 5, weights = “uniform”, algorithm = “auto”)
LinearSVC (LinSVC)Default parameters (e.g., C = 1.0, penalty = “l2”, loss = “squared_hinge”)
Logistic Regression (LogReg)solver = “lbfgs” + Default parameters (e.g., C = 1.0, penalty = “l2”, max_iter = 100)
Support Vector Machine (SVC) γ = “auto”, probability = 1 + Default parameters (e.g., C = 1.0, kernel = “rbf”, tol = 1 × 10⁻³)
Table 2. Classification performance of PES fiber spectra across different spectral regions.
Region (cm−1)FastICA
# Components
# FeaturesClassifierAccuracyPrecisionRecallF1-ScoreAUCExecTime
R1 (3000–2800)160DT66.6772.2266.6769.330.920.0379
R2 (1750–1500)140DT66.6763.8966.6765.250.560.0144
R3 (1498–1200)160SVC66.6770.0066.6768.290.690.0380
R4 (1198–900)7120DT77.7880.5677.7879.140.810.0439
Full spectral window R1–R41190DT66.6763.8966.6765.250.560.0473
ExecTime = Time to execute the process in seconds (s).
Disclaimer/Publisher’s Note: The statements, opinions and data contained in all publications are solely those of the individual author(s) and contributor(s) and not of MDPI and/or the editor(s). MDPI and/or the editor(s) disclaim responsibility for any injury to people or property resulting from any ideas, methods, instructions or products referred to in the content.