1. Introduction
Cement-bonded fiber (CBF) composites are widely recognized as effective non-asbestos building materials, offering mechanical properties and durability that can be tailored through specific material choices [
1]. While extensive research has focused on optimizing CBFs through alternative fibers or manufacturing parameters [
2,
3], the cement binder itself is often treated as a constant. In industrial practice, however, the choice of binder is a fundamental decision variable. European standard EN 197-1 classifies common cements by strength classes based on their compressive strength development [
4]. Class 32.5 cements are typically recommended for applications where high early-age strength is not a necessity, in average ambient temperatures (10–15 °C), and for structures with common thicknesses (<50 cm). Cements belonging to the 42.5 strength class are widely employed where the required 28-day concrete compressive strength must exceed 30 N/mm
2 and are suitable for lower-temperature environments. Class 52.5 cements are utilized for applications demanding even greater initial strength, such as the rapid de-molding of precast elements. Although 52.5 offers fast-setting characteristics, the most commonly used cement type today remains 42.5.
Despite these distinct classifications, a critical knowledge gap persists regarding how these standard cement classes perform within a unified wood–fiber composite framework. While their properties in conventional concrete are well-documented [
5,
6], their specific interactions with lignocellulosic inhibitors remain poorly understood.
To ensure reliable ultimate performance, it is essential to first mitigate the adverse early-age effects typical of organic reinforcements. Recent investigations into specialized cementitious systems have provided key insights into this mechanism. For instance, Das (2025) [
7] quantitatively demonstrated that the ionic concentration within the pore solution acts as a critical modulator for early-age stability and shrinkage control in fiber-reinforced systems. Furthermore, complementary research on high-performance marine composites [
8] highlighted that microstructural evolution is heavily dependent on the curing regime; specifically, the synergy between curing conditions and fiber dosage was found to be the governing factor for effective interfacial bonding. While experimental studies provide macroscopic data on dimensional stability, understanding the underlying mechanisms requires a multi-scale approach. Recent numerical studies, such as the ECCSrm meso-scale model developed by Das et al. (2025) [
9], have highlighted that fiber characteristics (distribution, volume fraction, and elastic modulus) play a decisive role in governing the shrinkage behavior and stress transfer within the cementitious matrix. Although wood fibers differ from synthetic fibers due to their hygroscopic nature, the fundamental mechanical principle demonstrated in such models—that a well-distributed fiber network and strong matrix encapsulation are essential for restraining dimensional changes—remains critical for interpreting the physico-mechanical response of cement-bonded composites.
Drawing from these insights, our study applies a similar principle of ionic modulation to wood–cement composites. Wood fibers are inherently hydrophilic and release inhibitory substances—specifically soluble sugars and polyphenols [
10] that can disrupt hydration. To counteract this, we incorporate a specific dosage of calcium chloride (CaCl
2) as a setting accelerator alongside a controlled curing protocol. Rather than focusing on the transient early-age evolution, this chemical intervention is employed to stabilize the hydration kinetics, thereby allowing us to isolate the cement strength class (32.5/42.5/52.5) as the primary variable. This approach ensures that the measured properties reflect the true potential of the binder types. Consequently, the primary objective of this study is to systematically evaluate the influence of three standard cement strength classes on the ultimate (28-day) physical and mechanical properties of wood–fiber-reinforced composites, filling the gap in binder-focused comparative analysis.
2. Materials and Methods
2.1. Materials
In this study, the raw materials were meticulously selected to ensure the reproducibility and reliability of the experimental CBFs. Three distinct grades of Portland cement (CEM II 32.5 R, CEM II 42.5 R, and CEM II 52.5 R) were procured from a commercial supplier in Bursa Çimento (Bursa, Turkey). These specific grades were chosen to provide a comprehensive evaluation of how varying early and final strength development profiles influences the ultimate performance of the fiberboards.
For reinforcement, pine (
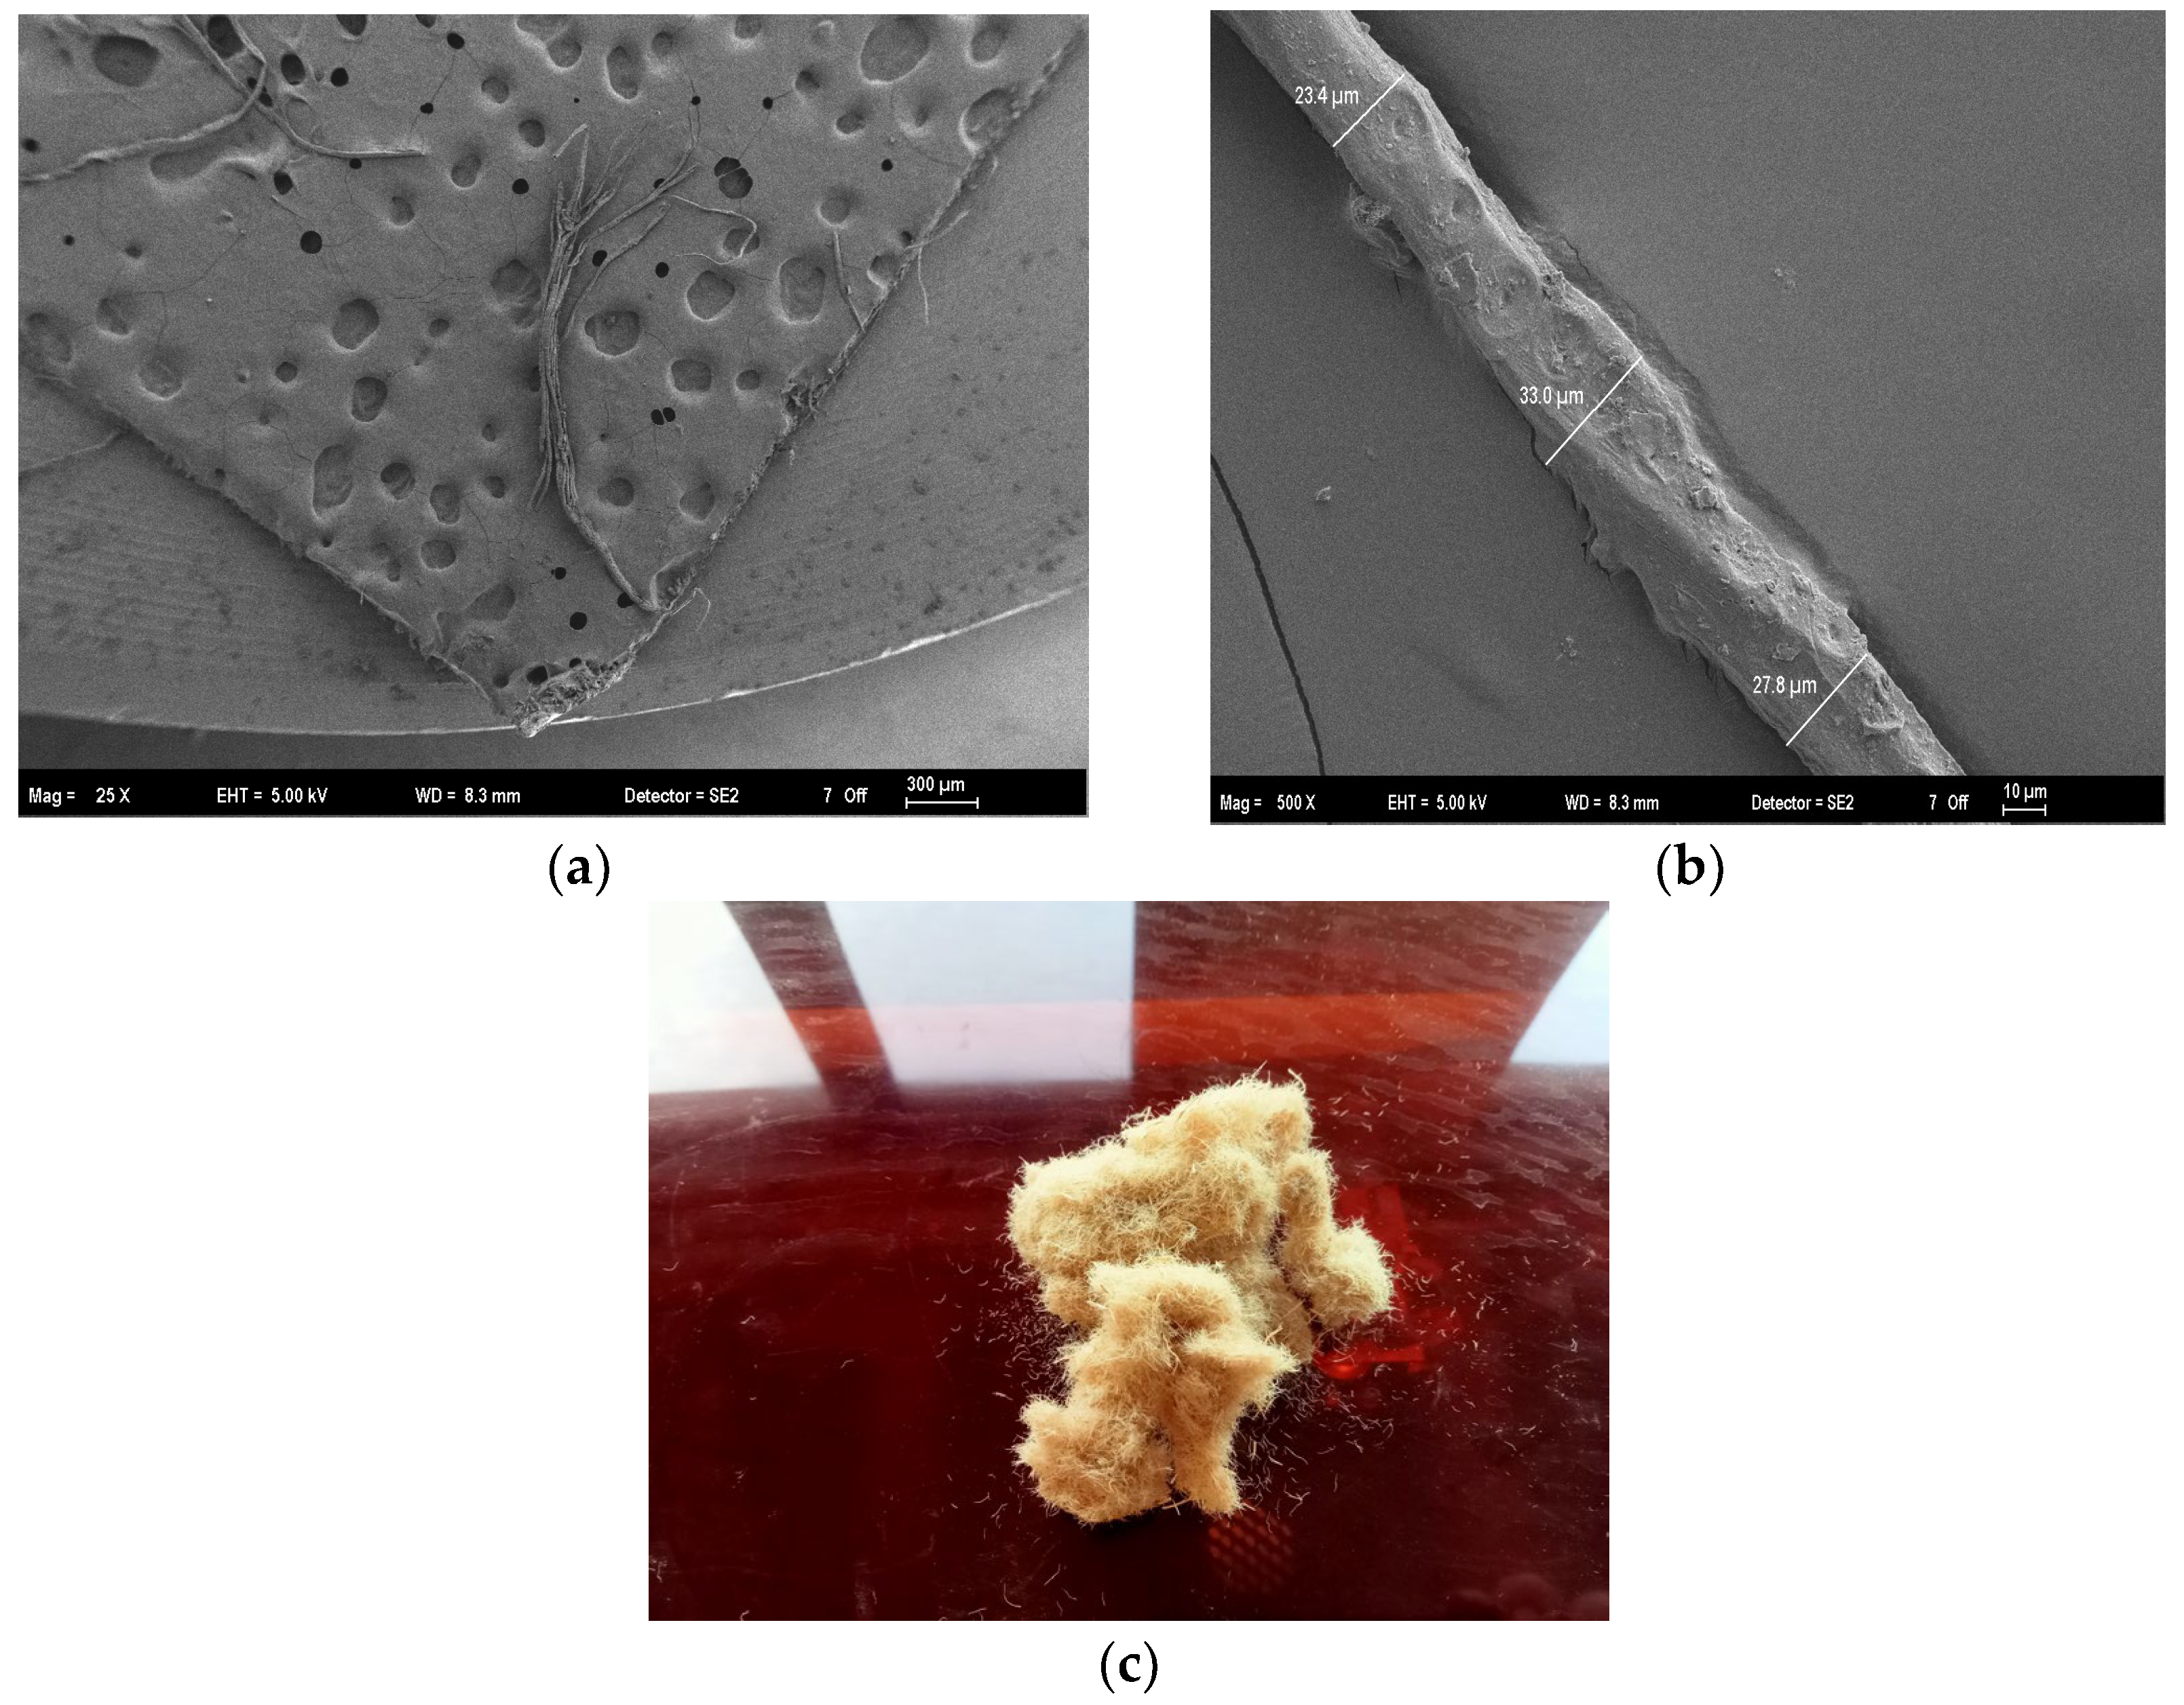
Pinus spp.) wood fibers were sourced from a commercial medium-density fiberboard (MDF) manufacturer (Kastamonu Entegre A.Ş, Istanbul, Turkey). Derived from softwood-based MDF production residues, these fibers possessed an average length of 758 µm and a diameter of 28 µm. The typical morphology of these fibers is shown in
Figure 1. The chemical composition of wood fibers was determined in accordance with TAPPI standards. Solvent extractives were determined based on TAPPI T 204 cm-97 [
11]. The acid-insoluble lignin content was analyzed following TAPPI T 222 om-02 [
12], while the ash content was determined according to TAPPI T 211 om-02 [
13]. Holocellulose content (the sum of cellulose and hemicellulose) was determined using the acid chlorite method [
14]. Subsequently, alpha-cellulose content was determined according to TAPPI T 203 cm-99, and hemicellulose content was calculated as the difference between holocellulose and alpha-cellulose. The chemical composition of the pine fibers used in this study was determined as 45.2% cellulose, 25.4% hemicellulose, 27.9% lignin, and 1.5% ash/extractives, consistent with the characterization reported in our previous work [
15].
Prior to board fabrication, the fibers were conditioned to a stable moisture content to facilitate homogeneous dispersion within the matrix. To mitigate the well-known inhibitory effects of wood extractives, specifically hemicelluloses and soluble sugars, on cement hydration [
16], calcium chloride (CaCl
2) was employed as a setting accelerator. Analytically pure CaCl
2 (Merck KGaA, Darmstadt, Germany) was introduced at a fixed dosage of 5% by weight of cement, and distilled water was utilized throughout the mixing process to maintain chemical consistency.
2.2. Characterization of Cement
The chemical and physical properties of the cement types are critical for understanding the hydration kinetics and final board performance. The chemical composition of the cements was determined using X-ray fluorescence (XRF) analysis. The specific surface area (fineness) was determined using a Blaine air permeability apparatus in accordance with the EN 196-6 [
17] standard. Additionally, the particle size distribution (PSD) of cement samples was determined using a laser diffraction particle-size analyzer (Malvern Mastersizer 3000, Malvern Panalytical, Malvern, UK) following ISO 13320 [
18].
The chemical compositions and physical characteristics (Blaine fineness and PSD parameters of the three cement types used in this study are presented in
Table 1.
As evidenced in
Table 1 and visualized in
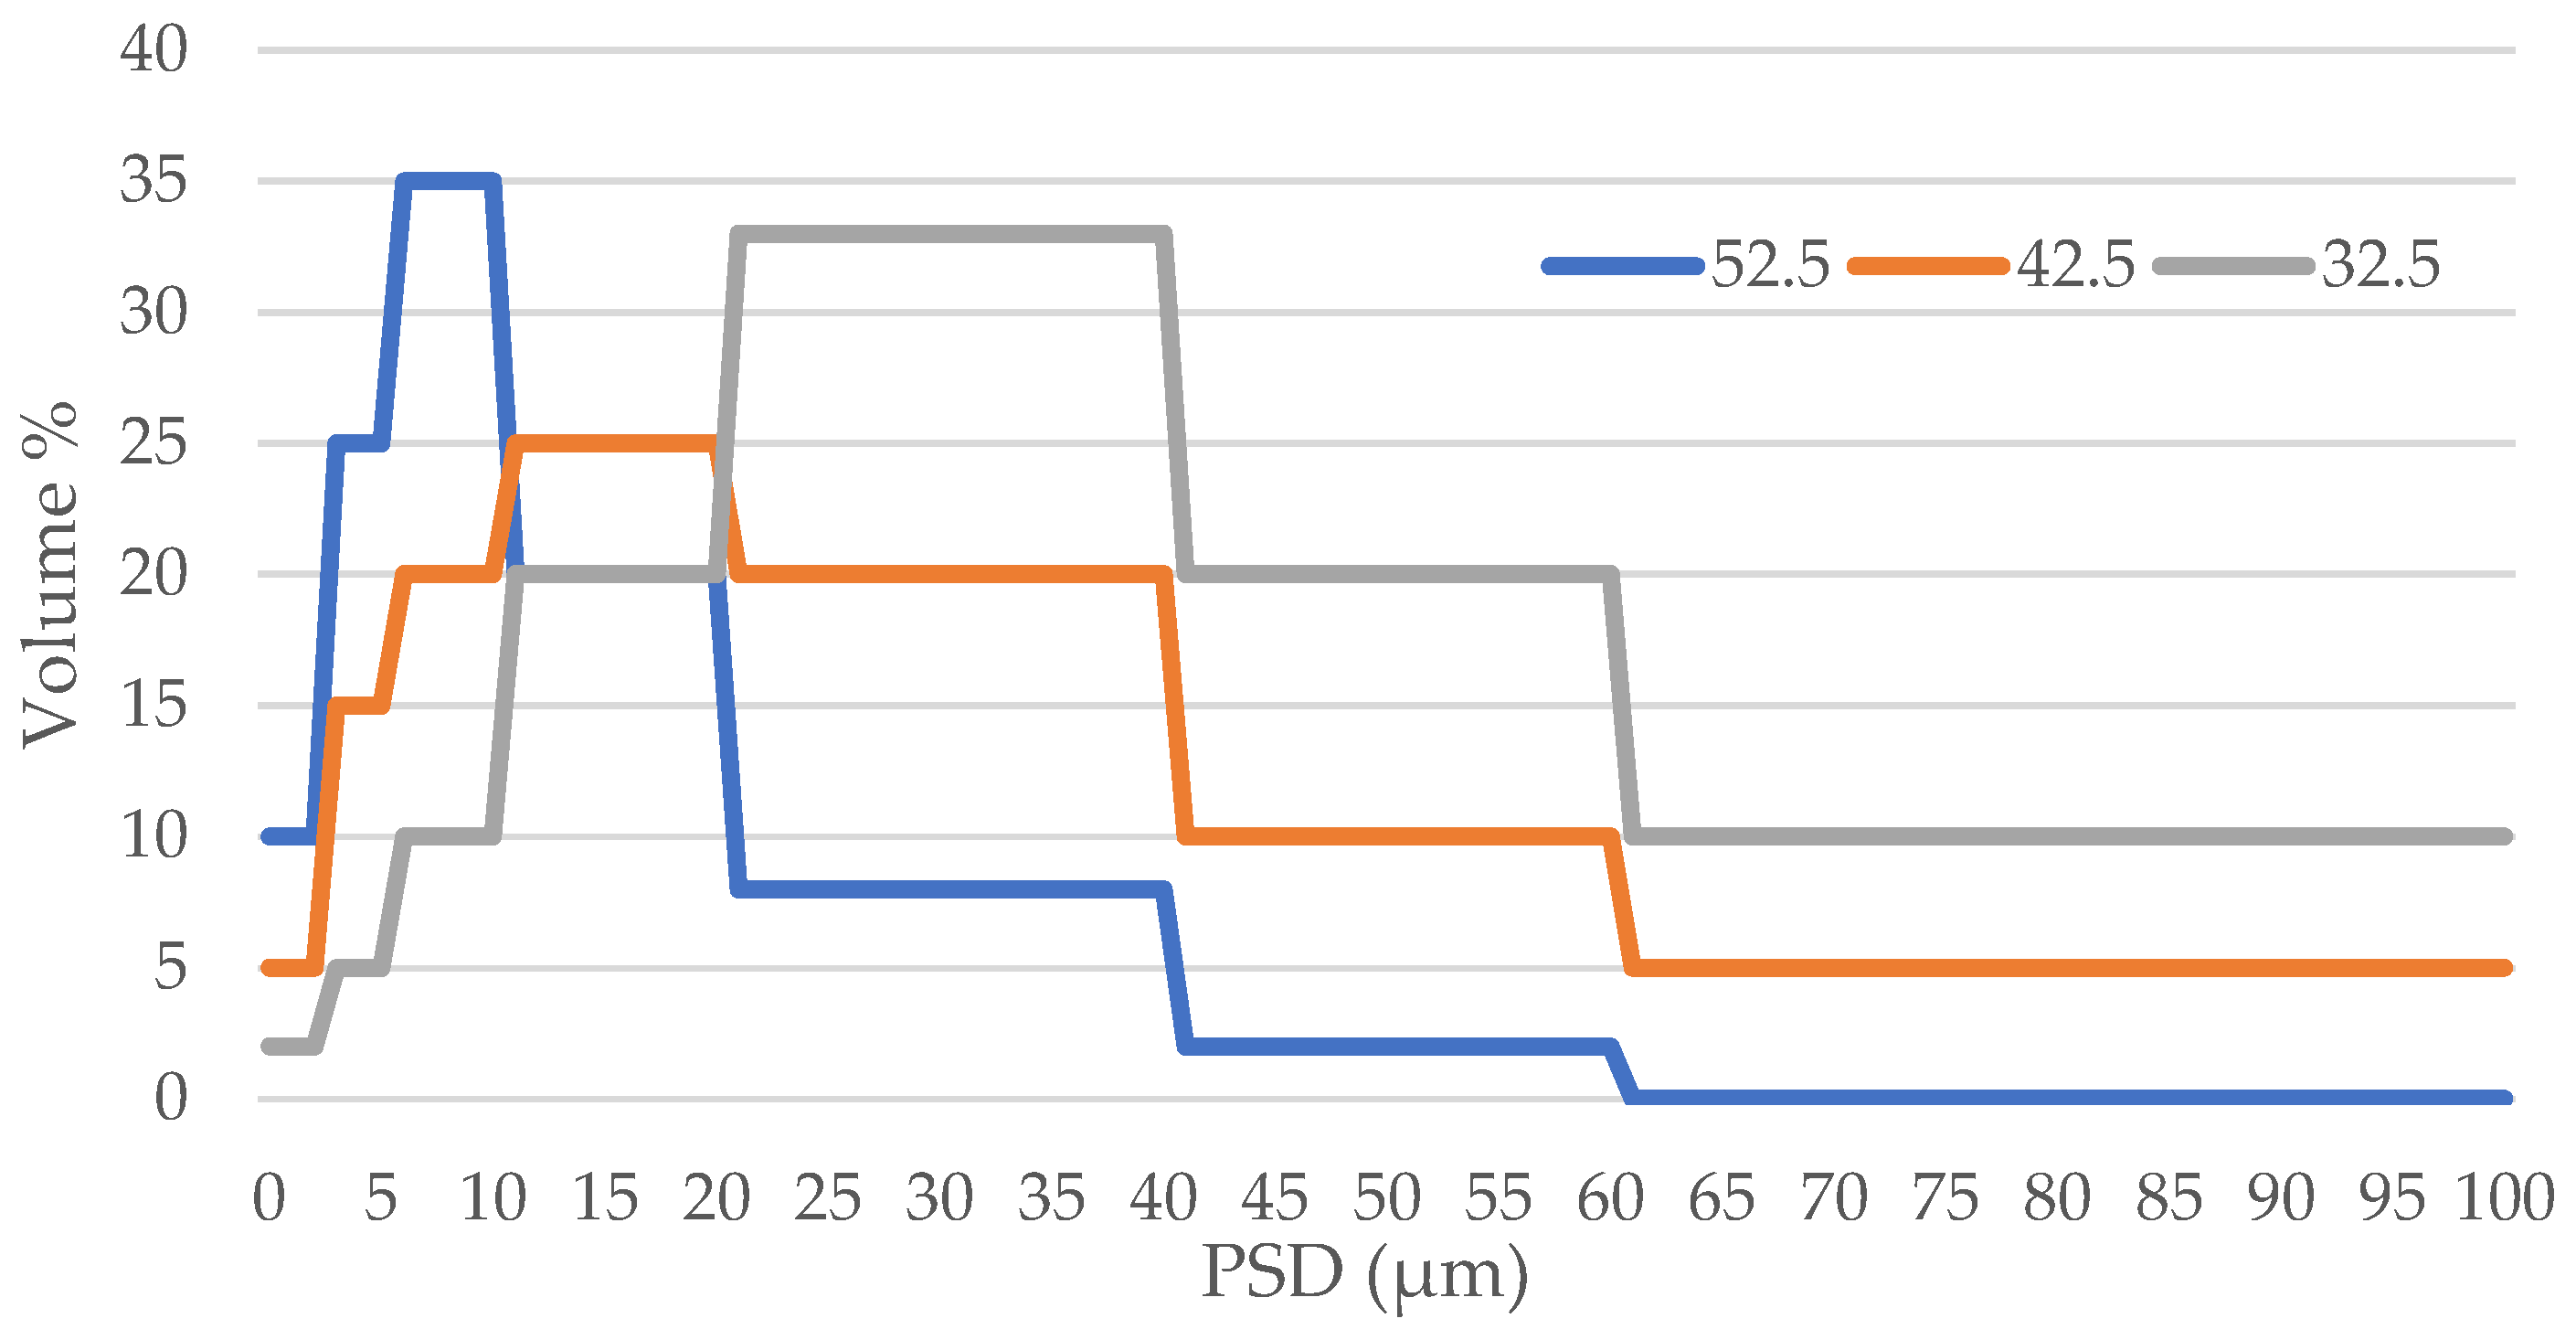
Figure 2, the CEM II 42.5 R sample exhibits a distinct “well-graded” particle size distribution. Unlike CEM II 52.5 R, which is confined to a narrow fine fraction (D90 = 26.40 µm), the 42.5 grade spans a broader range (D10 = 2.45 µm to D90 = 48.20 µm). This specific distribution supports the formation of a densely packed matrix with reduced porosity.
2.3. Board Manufacturing
A total of 12 different board formulations were produced using three cement types and four fiber/cement ratios (1/2, 1/3, 1/4, and 1/5 by weight). The amount of distilled water was calculated using the formula proposed by Fuwape [
19] to achieve optimal workability and density (1.3 g/cm
3). The detailed mix proportions for each formulation are presented in
Table 2.
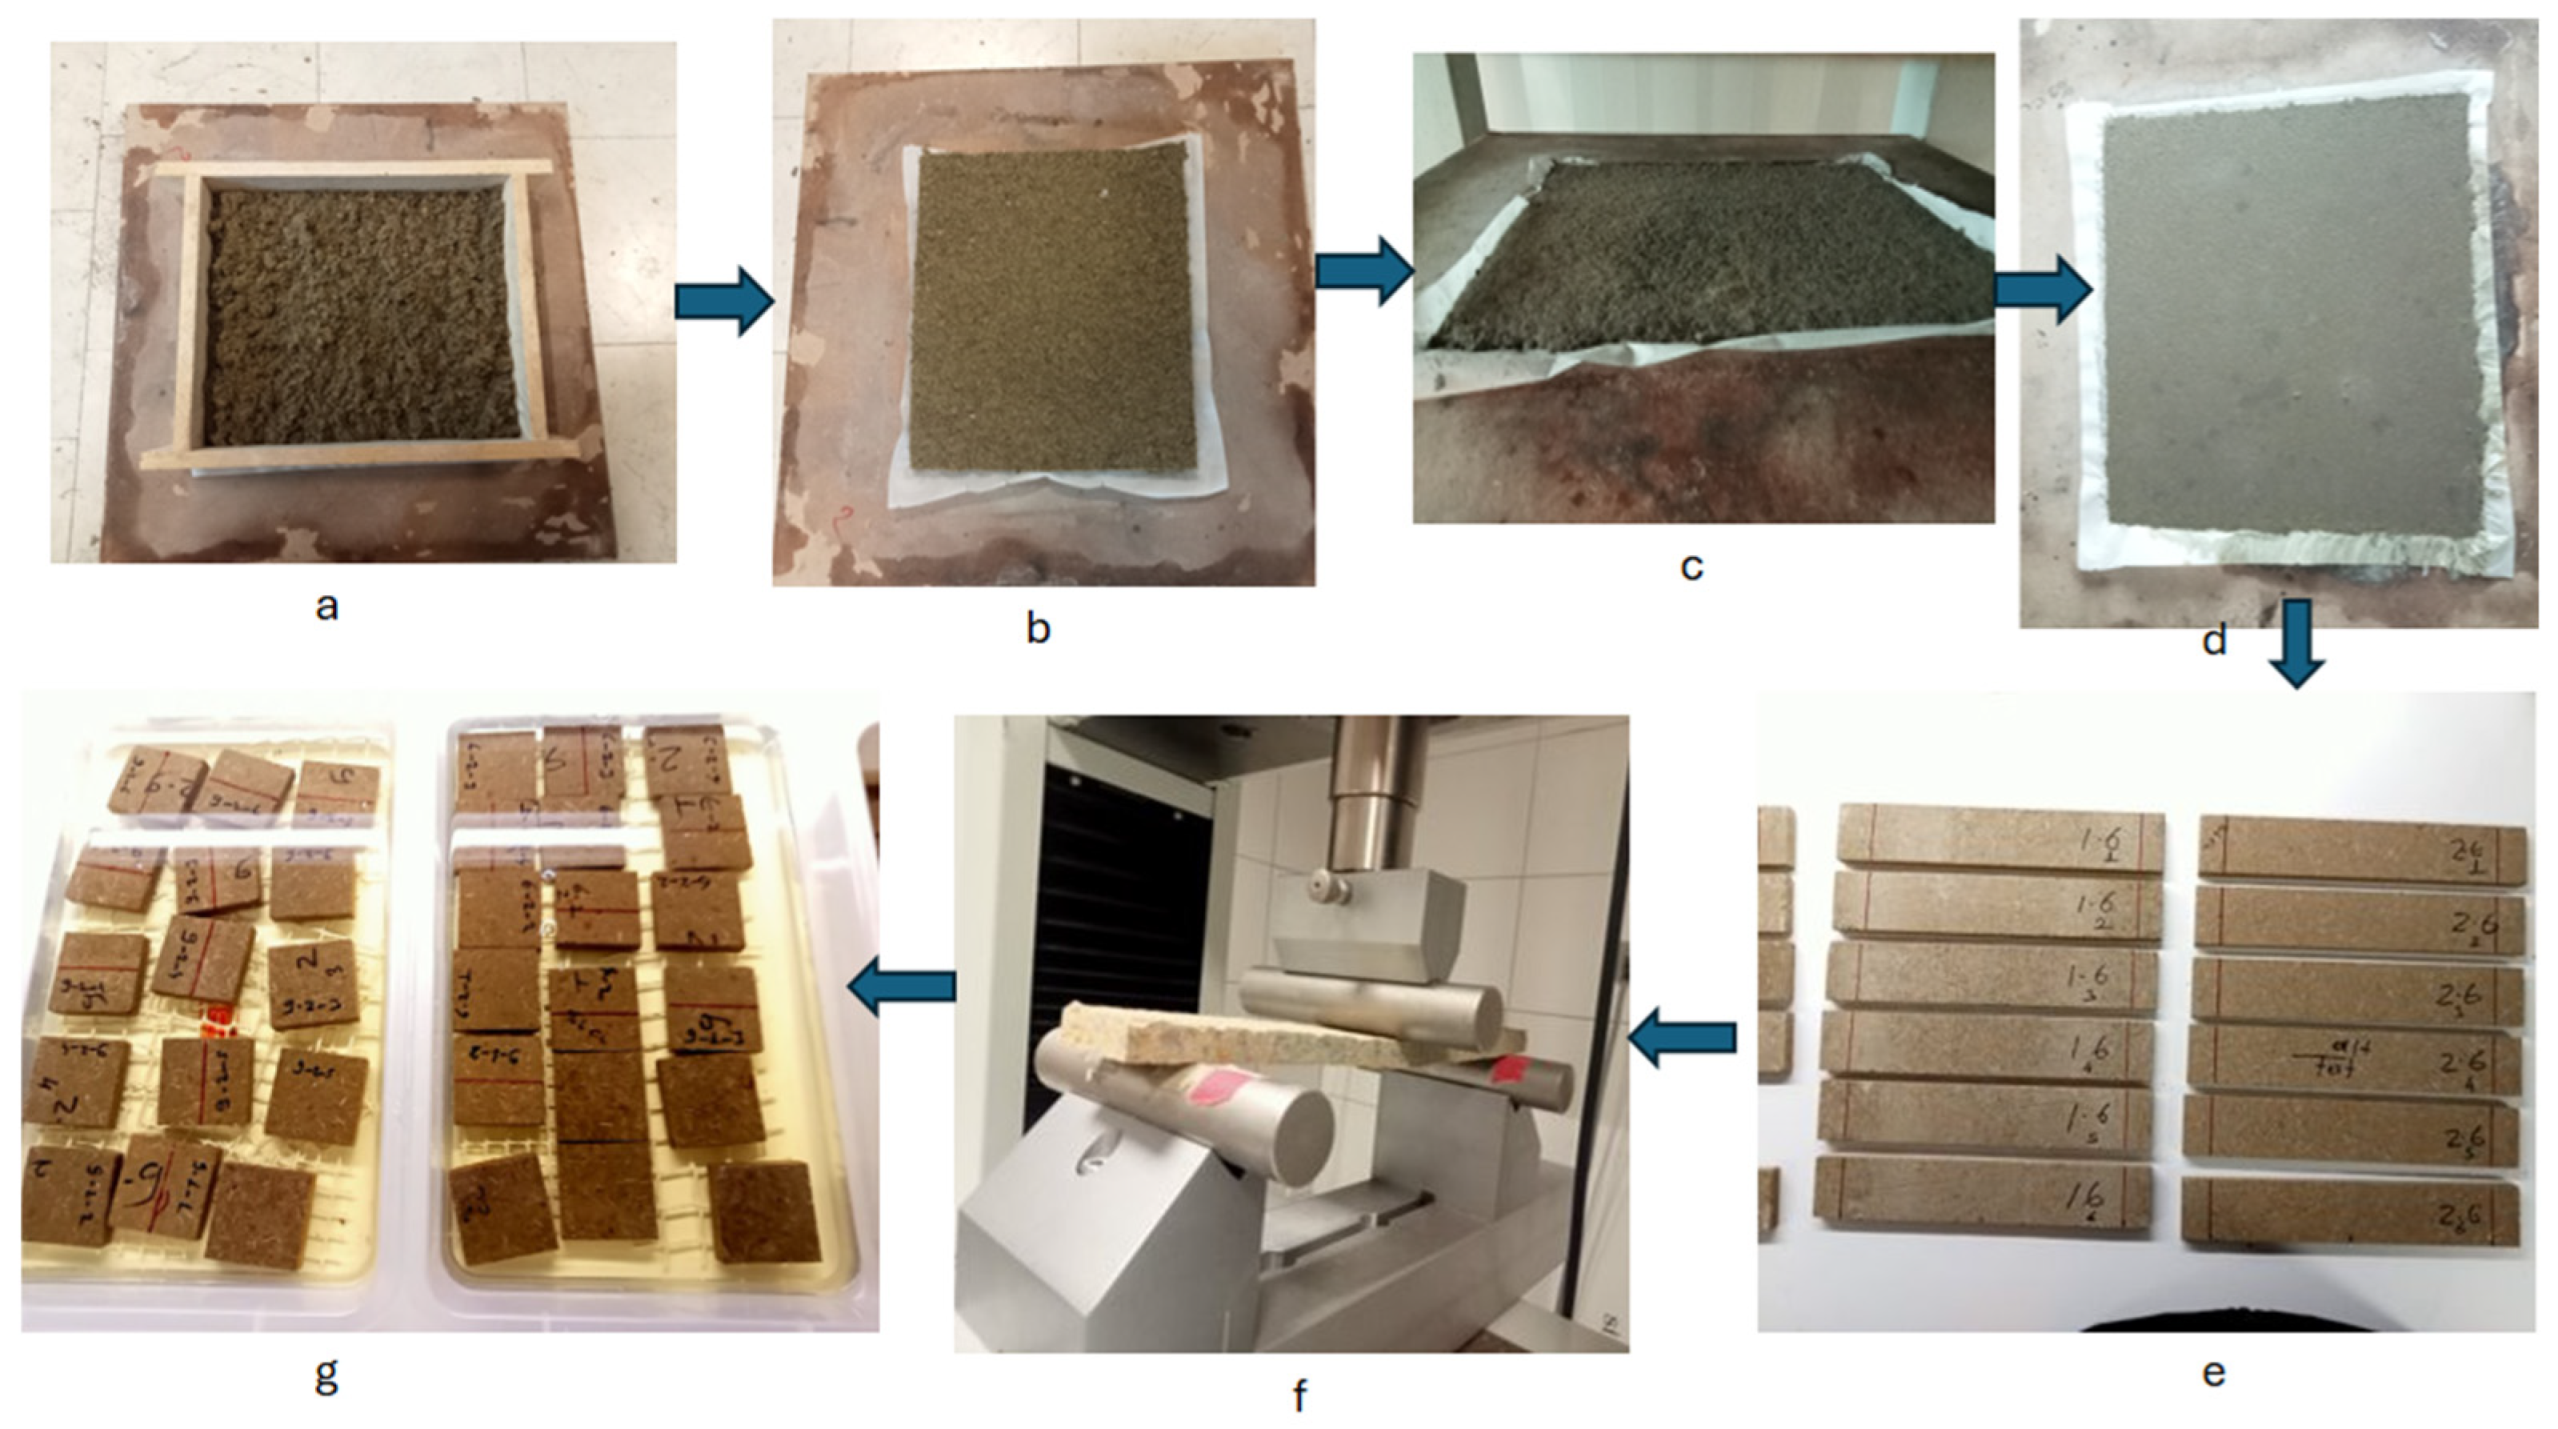
The manufacturing process and the experimental workflow are visualized in
Figure 3. The wood fibers, cement, and CaCl
2 were mixed dry in a laboratory-type paddle mixer at 45 rpm for 5 min to ensure homogeneous dispersion. Subsequently, the calculated amount of water was slowly added to form a homogeneous paste. The mixture was evenly distributed into a metal frame (35 × 30 × 1.2 cm). The mats were subjected to pressing at ambient temperature (23 ± 2 °C) under a pressure of 4 MPa (40 bar). To ensure the setting of the cement, the boards were kept under pressure in a clamped mold for 24 h. After demolding, the wet boards were cured under standard laboratory conditions (23 ± 2 °C and 65 ± 5% relative humidity) for 28 days to complete hydration.
2.4. Characterization of Boards
2.4.1. Physical Properties
The density of the cement-bonded fiberboards was determined in accordance with the TS EN 323 [
20] standard. The dimensions (length, width, thickness) of each sample were measured using a digital caliper with a precision of ±0.01 mm to calculate the volume. Density values were obtained by dividing the mass by the volume. WA and TS were determined according to TS EN 317 [
21]. Eight replicate samples per group were conditioned and immersed in water for 24 h. Initial and final mass and thickness measurements were recorded to calculate the percentage changes.
2.4.2. Mechanical Properties
MOR and MOE were determined via a three-point bending test according to TS EN 310 [
22]. Samples were conditioned at 23 ± 2 °C and 50 ± 5% relative humidity for 72 h prior to testing. Tests were performed using a Shimadzu universal testing machine (Shimadzu Corp., Kyoto, Japan) equipped with a 10 kN load cell at a crosshead speed of 5 mm/min. Eight replicates were tested for each formulation.
2.4.3. Determination of Thermal Conductivity
Thermal conductivity (λ) was measured using a LASER COMP.—FOX 314-95ET heat flow meter (TA Instruments, New Castle, DE, USA) according to ASTM C518-17 [
23]. Measurements were conducted on 10 × 10 cm samples at a mean temperature of 20 °C.
2.4.4. Microstructural Analysis
FTIR Spectral Measurements: Functional group analysis was performed using a Bruker Tensor 37 spectrometer (Bruker Optik GmbH, Leipzig, Germany) equipped with a Diamond ATR module. Spectra were recorded on powdered samples in the range of 4000–400 cm−1 with a resolution of 4 cm−1 and 32 scans per sample.
XRD Phase Identification: Analysis was performed on powdered samples taken from the fracture zones. The analysis was conducted using a Bruker D8 Advance diffractometer (Bruker AXS, Karlsruhe, Germany) (Cu-Kα radiation, 40 kV, 40 mA) with a scanning speed of 0.5°/min, a range of 10–100° (2θ), and a step size of 0.02°. The phase identification was performed using the ICDD (International Centre for Diffraction Data) database.
Microscopic Examination (SEM): Microstructure and fiber–matrix interfaces were examined using SEM (Carl Zeiss, Oberkochen, Germany). Specimens were gold–palladium (Au/Pd)-coated. Images were acquired at an accelerating voltage of 15 kV and a working distance of 10–12 mm using a secondary electron (SE) detector.
2.4.5. Data Analysis
Statistical analysis was conducted using IBM SPSS Statistics 22.0 (IBM Corp., Armonk, NY, USA). Prior to analysis, the data were checked for normality (Shapiro–Wilk test) and homogeneity of variance (Levene’s test). Since the data followed a normal distribution, two-way analysis of variance (ANOVA) was applied to evaluate the main effects of cement type and fiber/cement ratio, as well as their interaction. Post hoc comparisons were conducted using Tukey’s HSD test with a significance level set at α = 0.05.
3. Results
3.1. Measured Physical Properties of CBF Panels
Measured physical properties of the experimentally manufactured CBF are presented in
Table 3.
As observed in
Table 4, the density of the boards generally increased with an increase in cement content relative to the fibers. This is attributed to the higher specific gravity of the cement matrix compared to wood fibers. For the 42.5 cement type, density values rose from 1.06 g/cm
3 to 1.68 g/cm
3 as the fiber/cement ratio decreased from 1/2 to 1/5. Although the target density was set at 1.30 g/cm
3, variations in actual density were observed. This behavior can be attributed to the higher compaction efficiency in cement-rich mixtures, whereas the “spring-back” effect of wood fibers in fiber-rich mixtures tended to reduce the density.
Notably, the 42.5 cement exhibited higher density values compared to other types, particularly at lower fiber/cement ratios. Statistical analysis (ANOVA) confirmed that both cement type and fiber/cement ratio had a significant effect on density (p < 0.05). The Tukey multiple comparison test revealed specific differences between groups: the boards produced with 42.5 and 52.5 cements at a 1/5 ratio (1.68 and 1.67 g/cm3, respectively) formed a statistically homogeneous group, whereas the density of the boards produced with 32.5 cement (1.49 g/cm3) was significantly lower.
3.2. Hygroscopic Properties
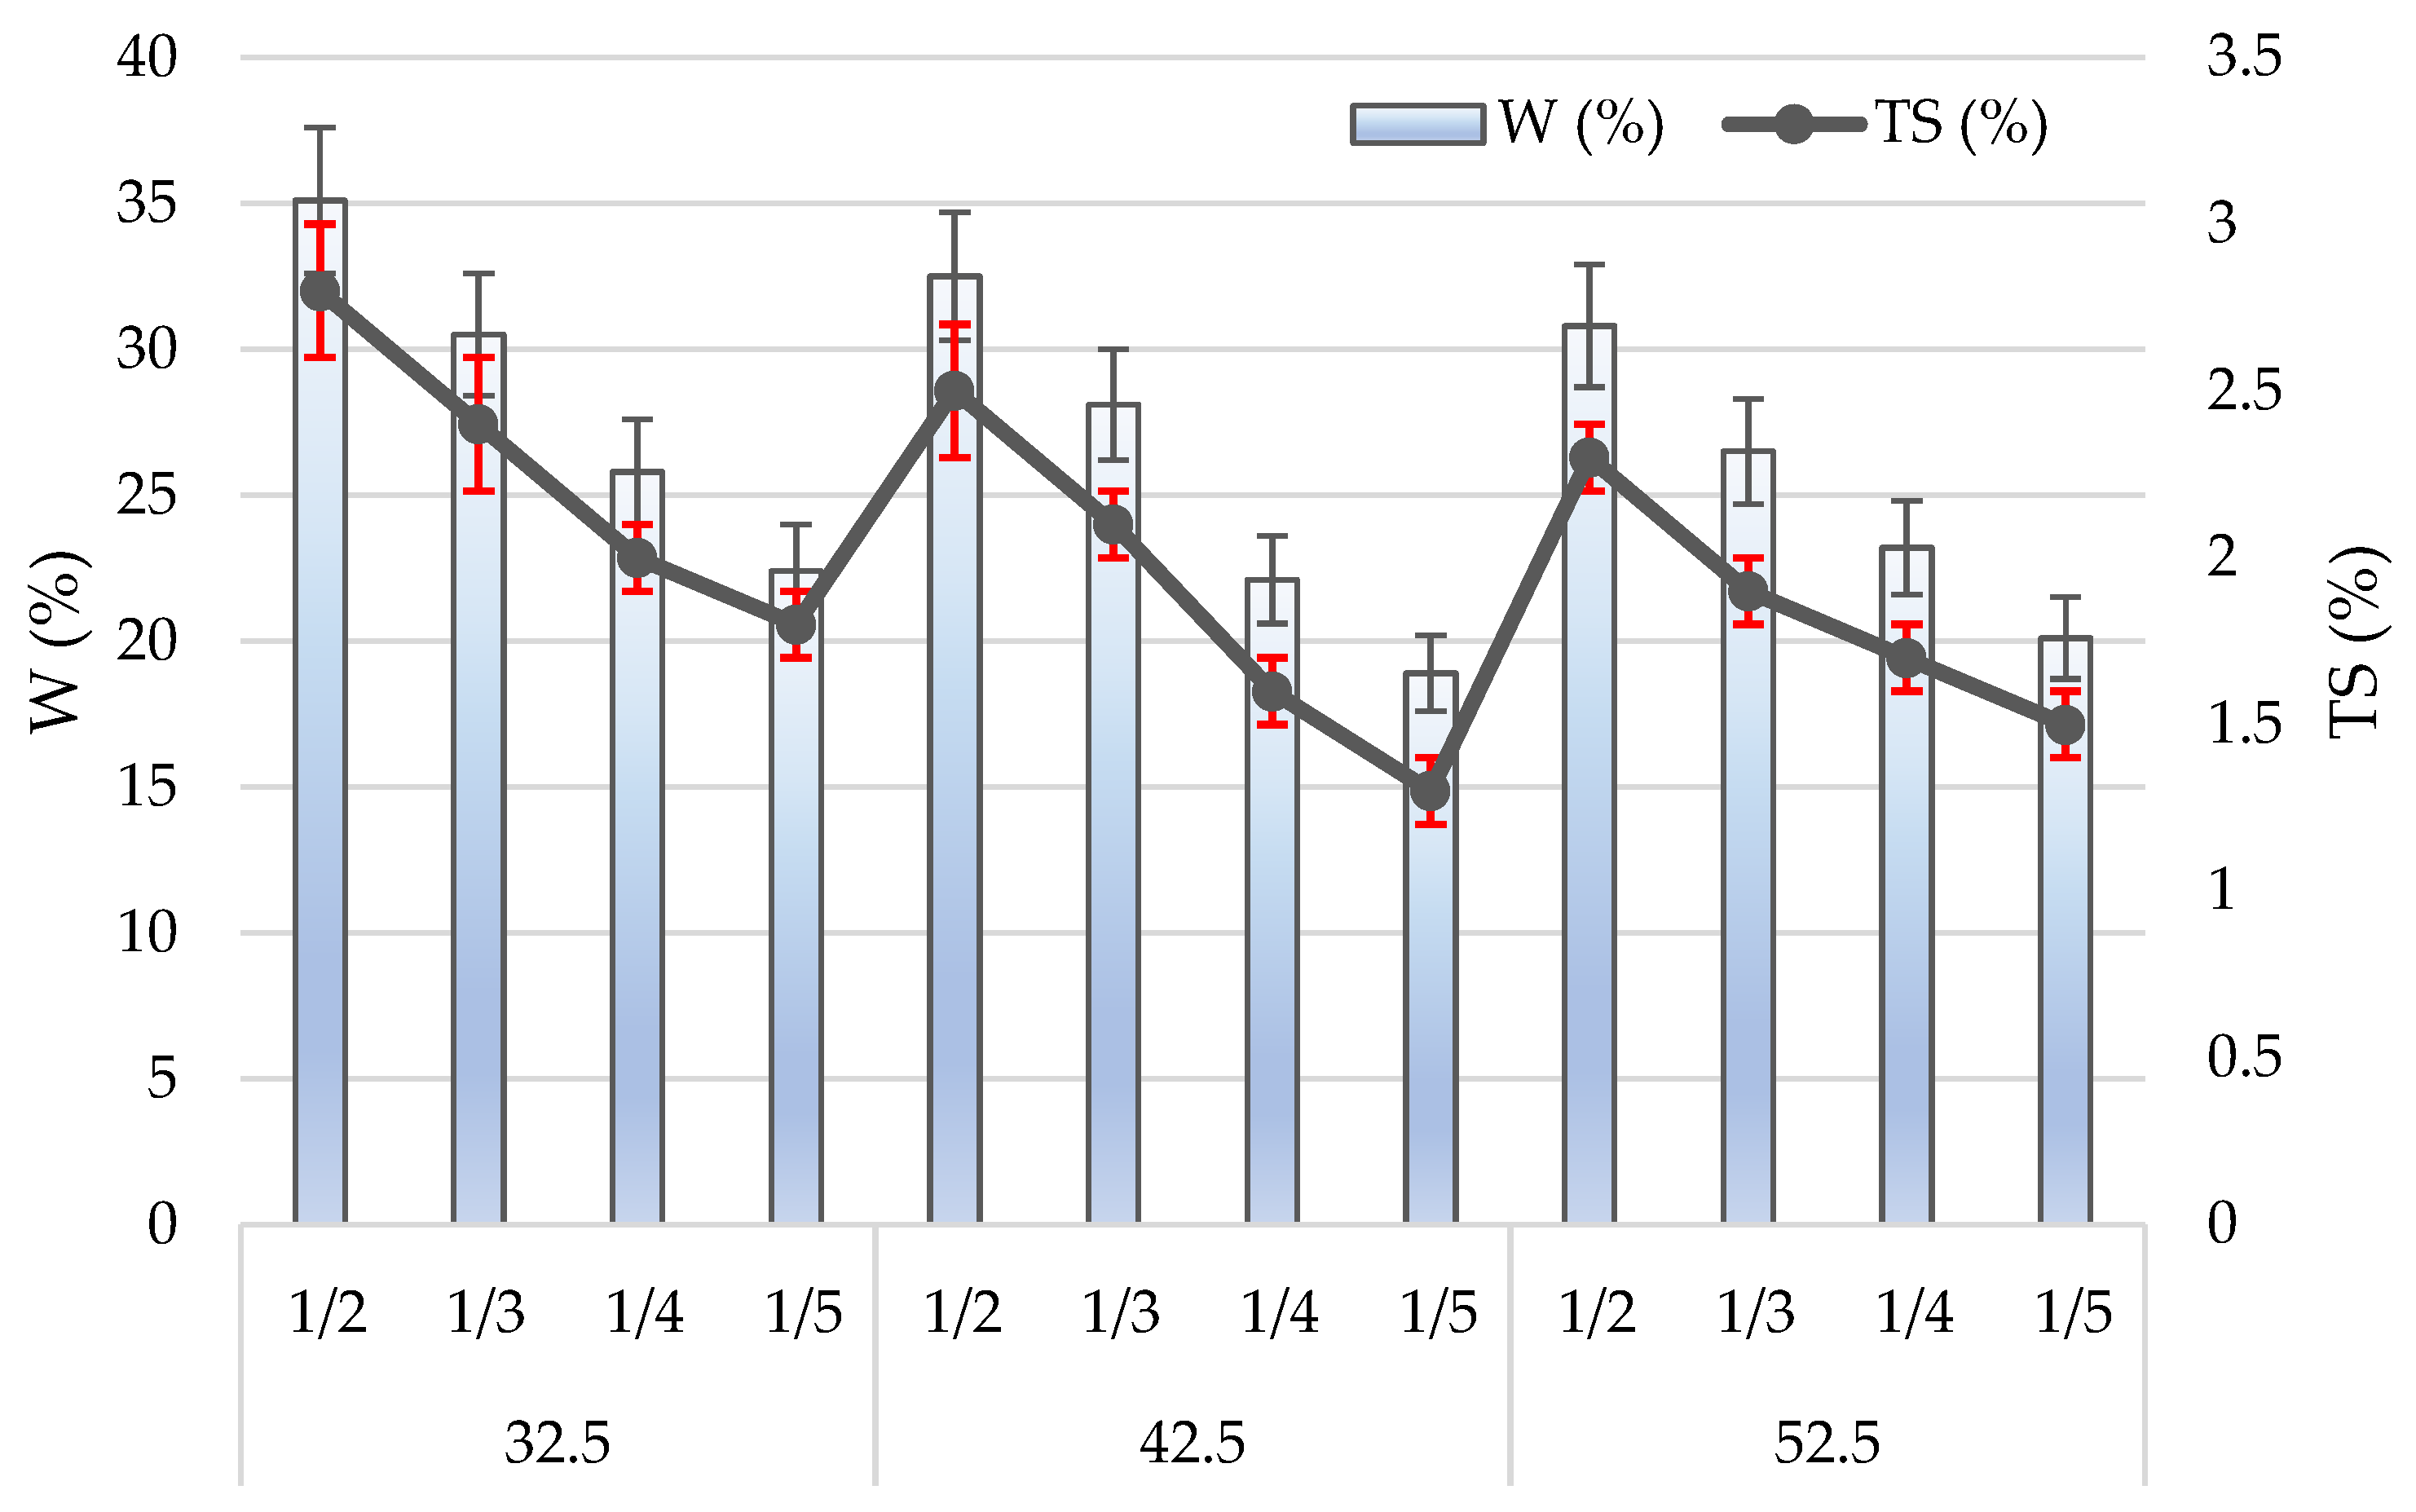
As illustrated in
Figure 4, the fiber/cement ratio emerges as the dominant factor influencing the dimensional stability (TS and WA) of the boards. Reducing the fiber/cement ratio from 1/2 to 1/5 resulted in a dramatic decrease in water absorption (WA) and thickness swelling (TS) values across all cement types. This improvement mechanism is directly linked to the water-holding capacity of hydrophilic hydroxyl groups present in the cellulose and hemicellulose of wood fibers, as discussed by Abdollahiparsa et al. [
24]. A reduction in fiber content minimizes the water-absorbing sources within the matrix. Simultaneously, the increased cement content provides better physical encapsulation of the fibers, thereby limiting water access to the hydrophilic sites.
This mechanism is strongly supported by the density increments observed in our experimental data. As shown in
Table 3, decreasing the fiber ratio from 1/2 to 1/5 led to a significant increase in board densities (e.g., from 1.06 g/cm
3 to 1.68 g/cm
3 for 42.5 R cement). As highlighted in studies by Frybort et al. [
1] and De Souza et al. [
2], increased density implies reduced porosity and the formation of a more compact structure, which physically restricts water penetration into the composite material.
Regarding the effect of cement type, contrary to the expectation that the highest strength class (52.5 R) would perform best, CEM II 42.5 R exhibited the lowest water absorption (18.9%) and swelling (1.3%) values, particularly at low fiber content (1/5). This behavior can be explained by the physical properties of the cements. As presented in
Table 2, while 52.5 R possesses a very fine particle structure (D50: 8.9 µm) and 32.5 R is relatively coarse (D50: 21.4 µm), the 42.5 R cement (D50: 14.8 µm) offers an optimal particle size distribution. The coarser nature and lower Blaine fineness of the 32.5 R cement likely resulted in slower hydration and a more porous microstructure, leading to the lowest density (1.49 g/cm
3 max) and highest water absorption even at the 1/5 ratio [
6]. On the other hand, the 42.5 R cement achieved the highest density (1.68 g/cm
3), suggesting it filled the matrix voids most efficiently and provided optimal interlocking at the fiber–cement interface.
3.3. Flexural Properties
The MOR and MOE values clearly demonstrate the critical impact of the fiber/cement ratio and cement type on mechanical performance (
Table 4). As a general trend, a decrease in the fiber/cement ratio (increasing cement content) is associated with a significant increase in both MOR and MOE values.
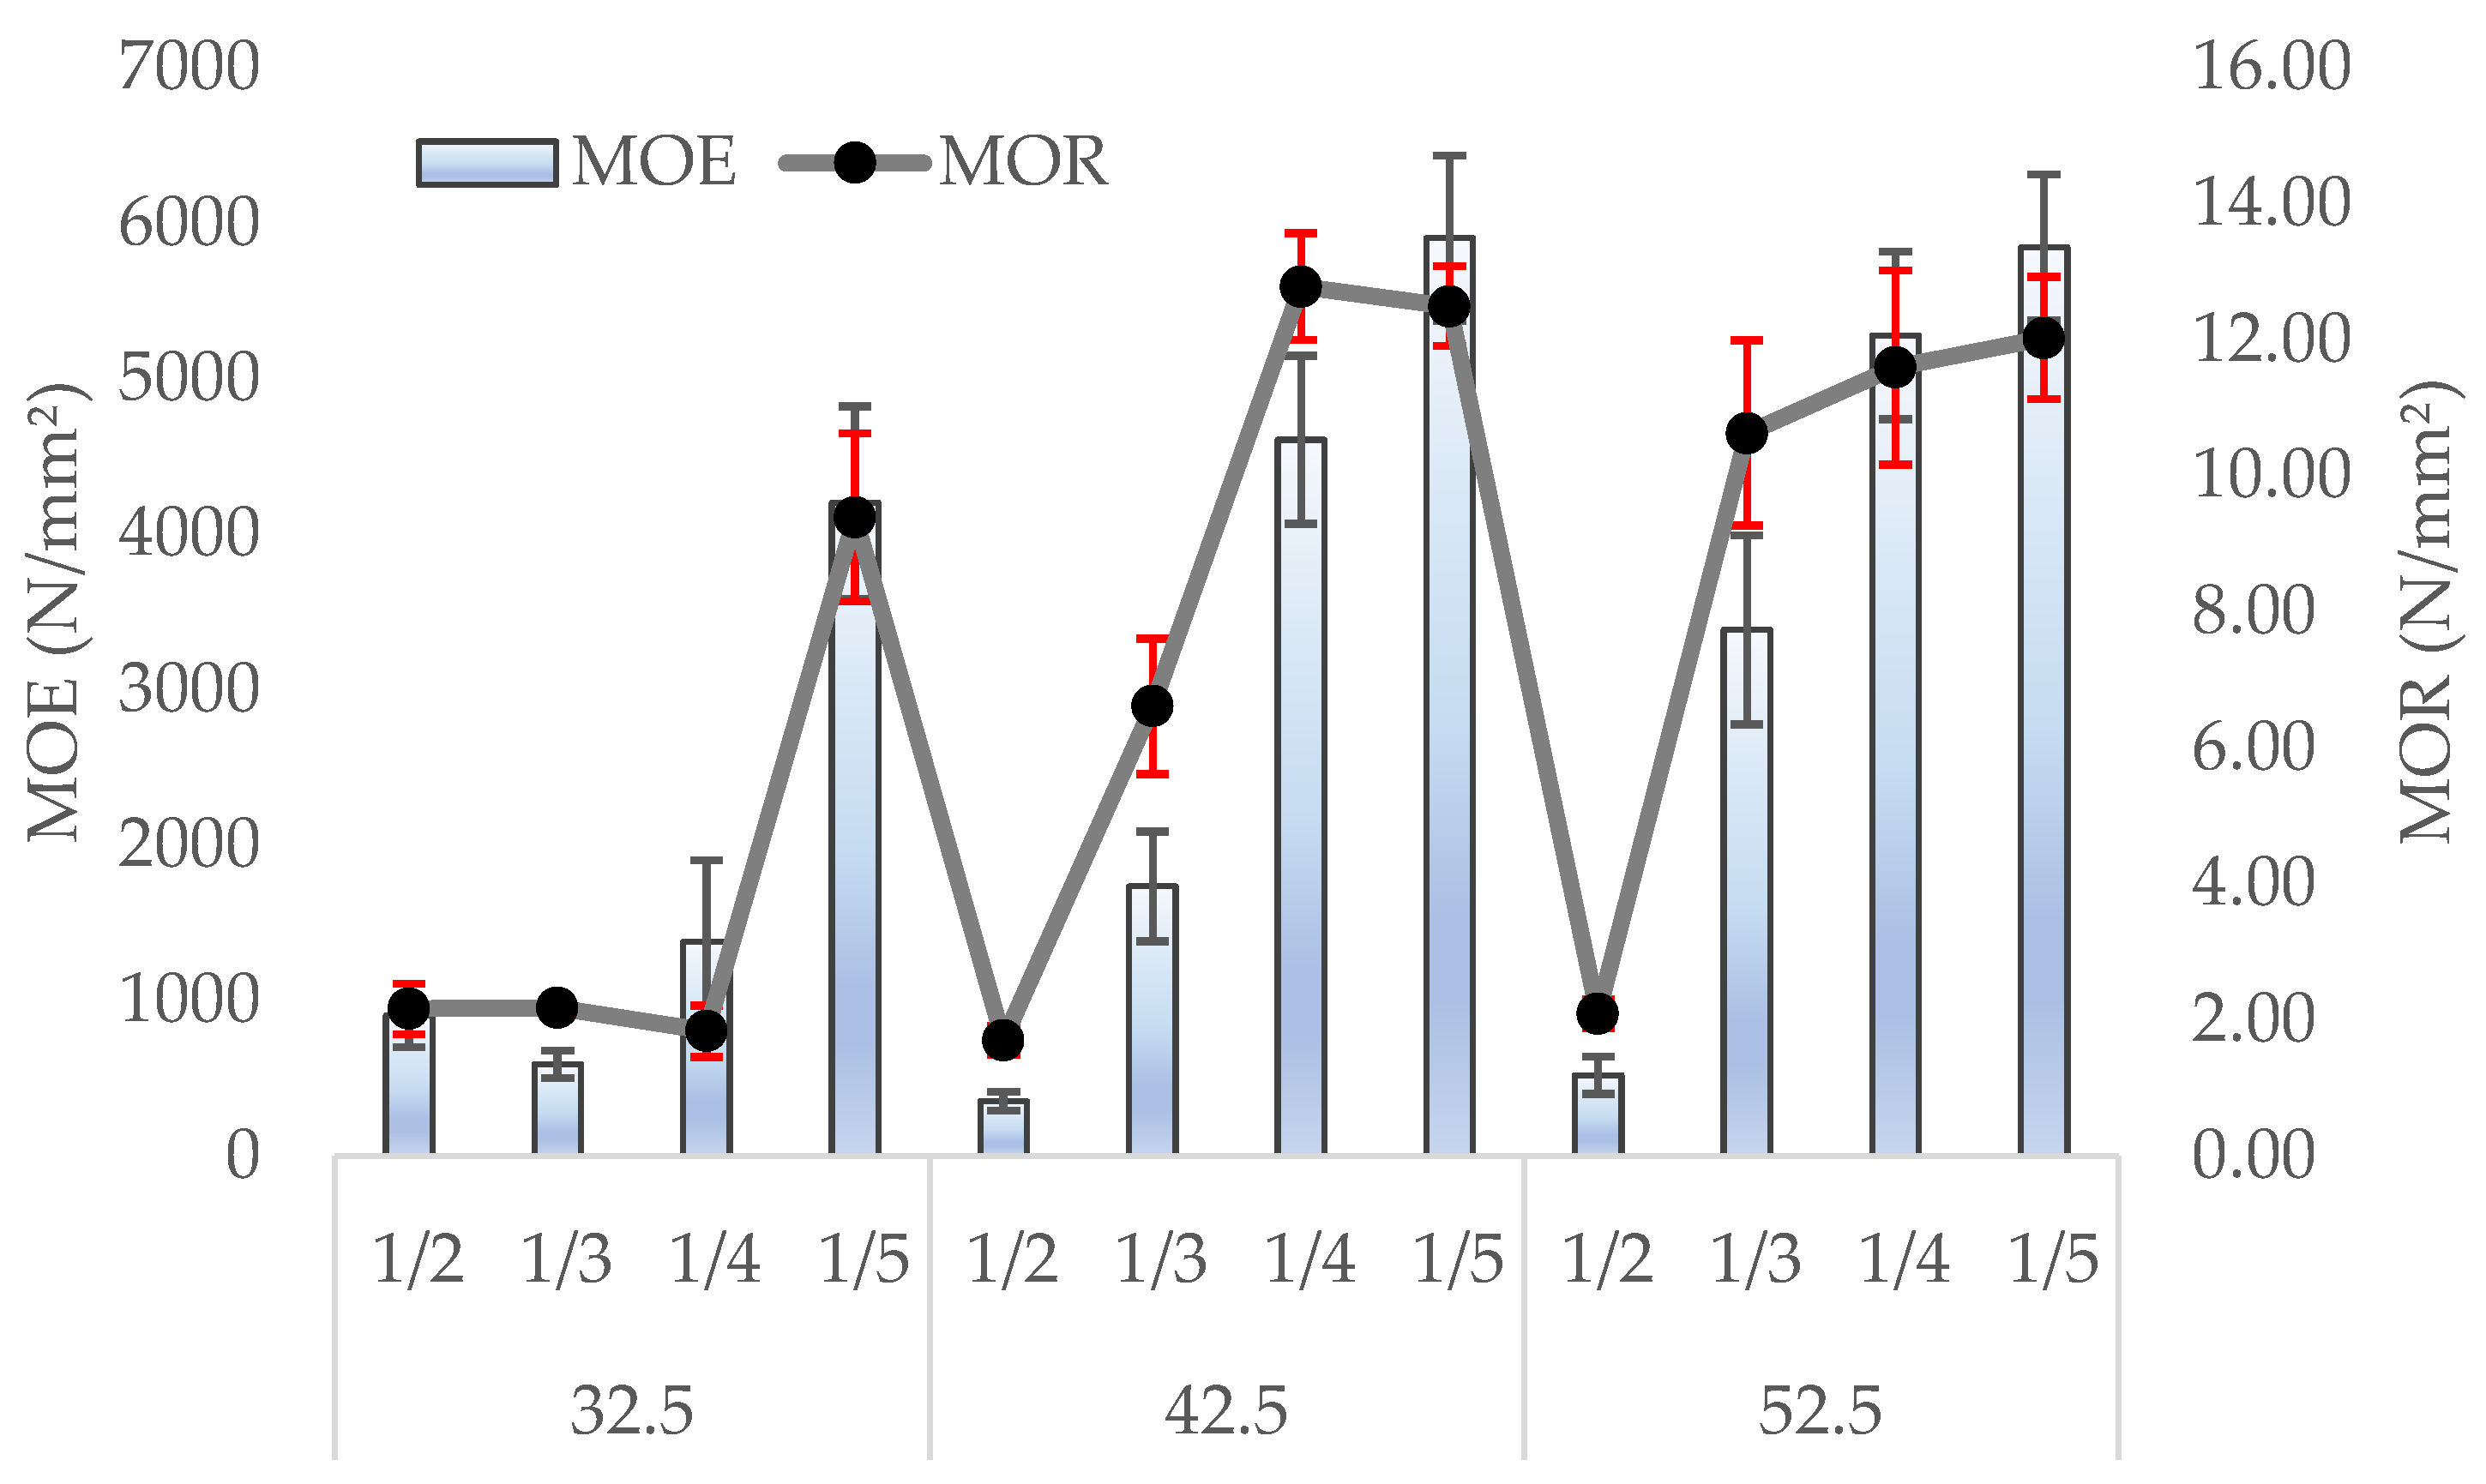
The mechanical performance of the plates, characterized by MOR and MOE, was significantly affected by both the cement hydration capacity and the fiber/cement ratio (
Figure 5). In general, a decrease in fiber content resulted in increases in strength values. Remarkably, CEM II 42.5 R samples achieved the highest overall flexural strength (12.78 ± 0.8 N/mm
2) at a fiber/cement ratio of 1/4, surpassing even the highest strength class (CEM II 52.5 R), which recorded a maximum MOR of 12.02 ± 0.9 N/mm
2 at a ratio of 1/5. This finding is critically important because it can be argued that the “well-graded” particle size distribution of 42.5 cement (as shown in
Figure 2) provides a more efficient interlocking mechanism with the fibers compared to the finer but narrower distribution of the 52.5 class. Moreover, 32.5 cement showed a significant improvement at the lowest fiber content (1/5 ratio), reaching a MOR of 9.39 N/mm
2, while it is thought that it could not develop sufficient bond strength at higher fiber loadings (1/2 and 1/3 ratios) probably due to the larger particle size and slower hydration rate. These results are consistent with the literature, which states that excessive fiber content prevents adequate encapsulation by the matrix, creating weak interfaces and voids [
25].
3.4. Thermal Conductivity
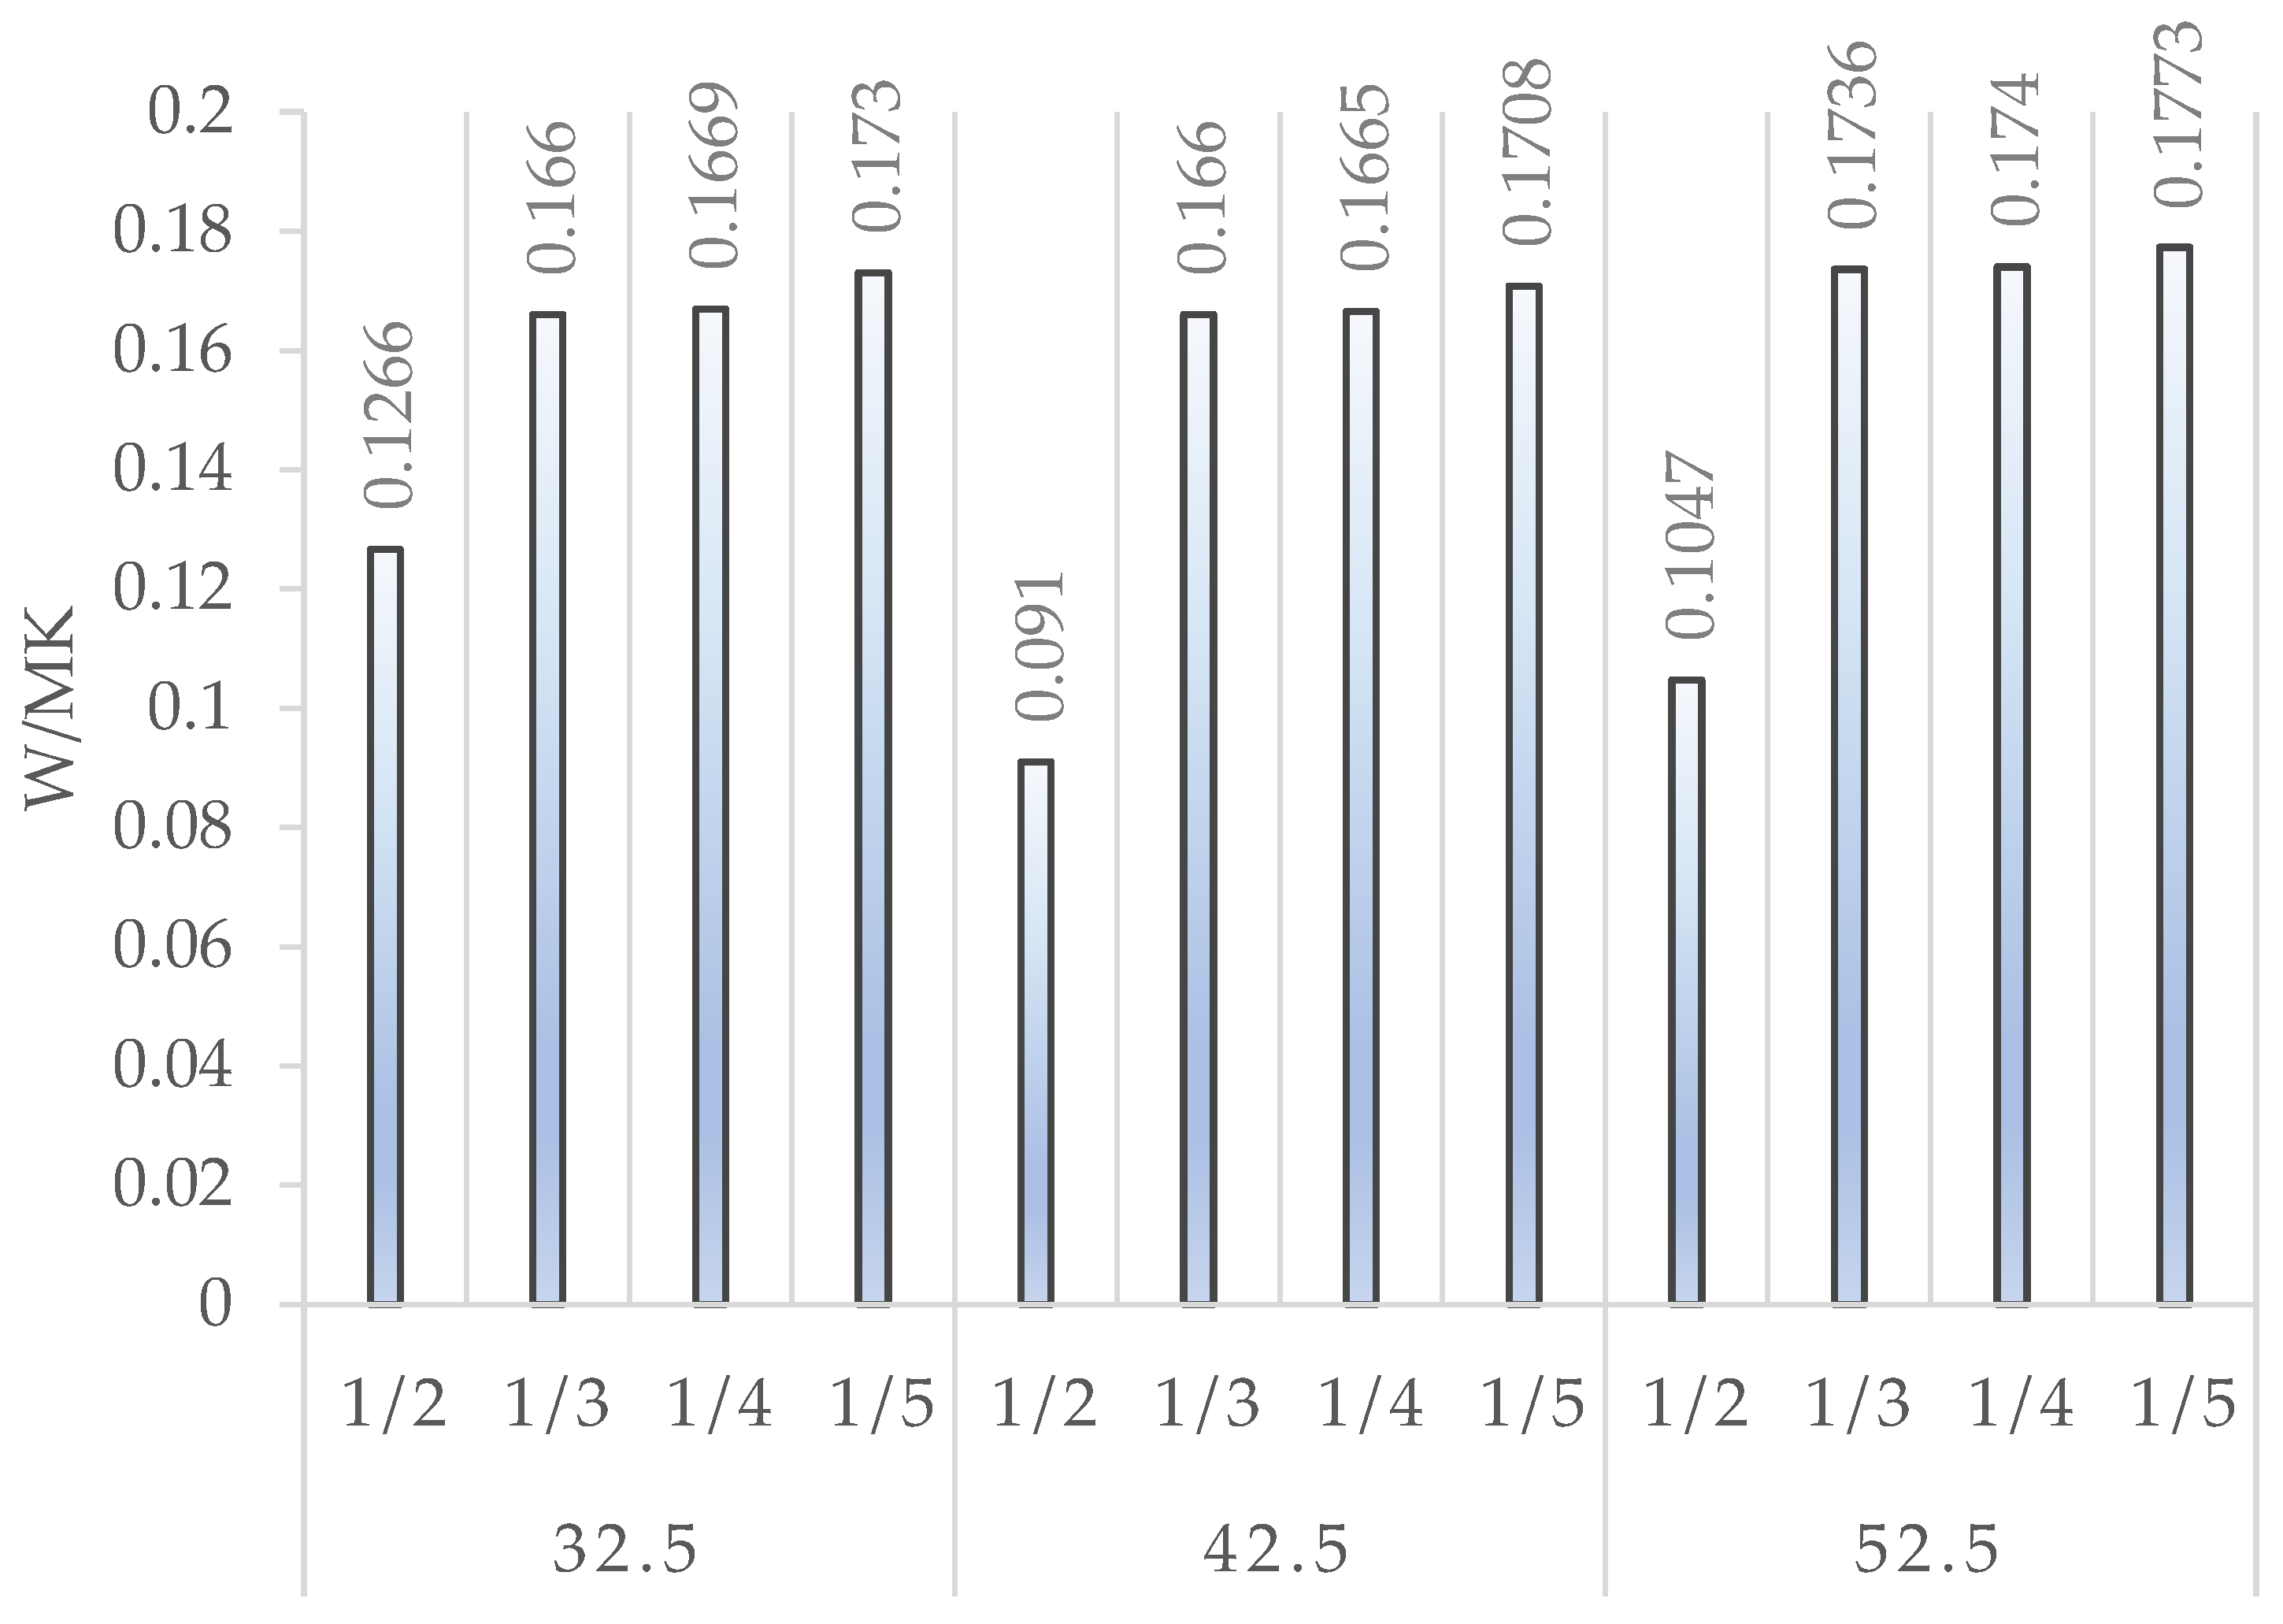
Generally, an increasing trend in thermal conductivity is observed as the fiber/cement ratio decreases (cement content increases). This is an expected outcome, as the cement matrix possesses significantly higher thermal conductivity (approx. 2.26 W/mK) compared to the porous structure of wood fibers, which introduce air voids into the composite [
26].
In this study, thermal conductivity (TC) values ranged from a relatively low 0.091 W/mK (for 42.5 cement at a 1/2 ratio) to 0.177 W/mK (for 52.5 cement at a 1/5 ratio). This increasing trend in TC with lower fiber content can be attributed to the insulating role of porous wood fibers. Most importantly, the CEM II 42.5 R grade showed the most optimal thermal performance. At the structural optimum of a 1/4 fiber/cement ratio, 42.5 cement exhibited the lowest thermal conductivity (λ = 0.1665 W/mK) compared to 32.5 (0.1669 W/mK) and 52.5 (0.1740 W/mK) grades (
Figure 6).
This positive effect of fiber content on thermal insulation is consistent with findings in the literature [
26,
27]. These results underscore the importance of optimizing the fiber/cement ratio not only for mechanical properties but also for creating energy-efficient building materials.
3.5. Fourier Transform Infrared Spectroscopy (FTIR)
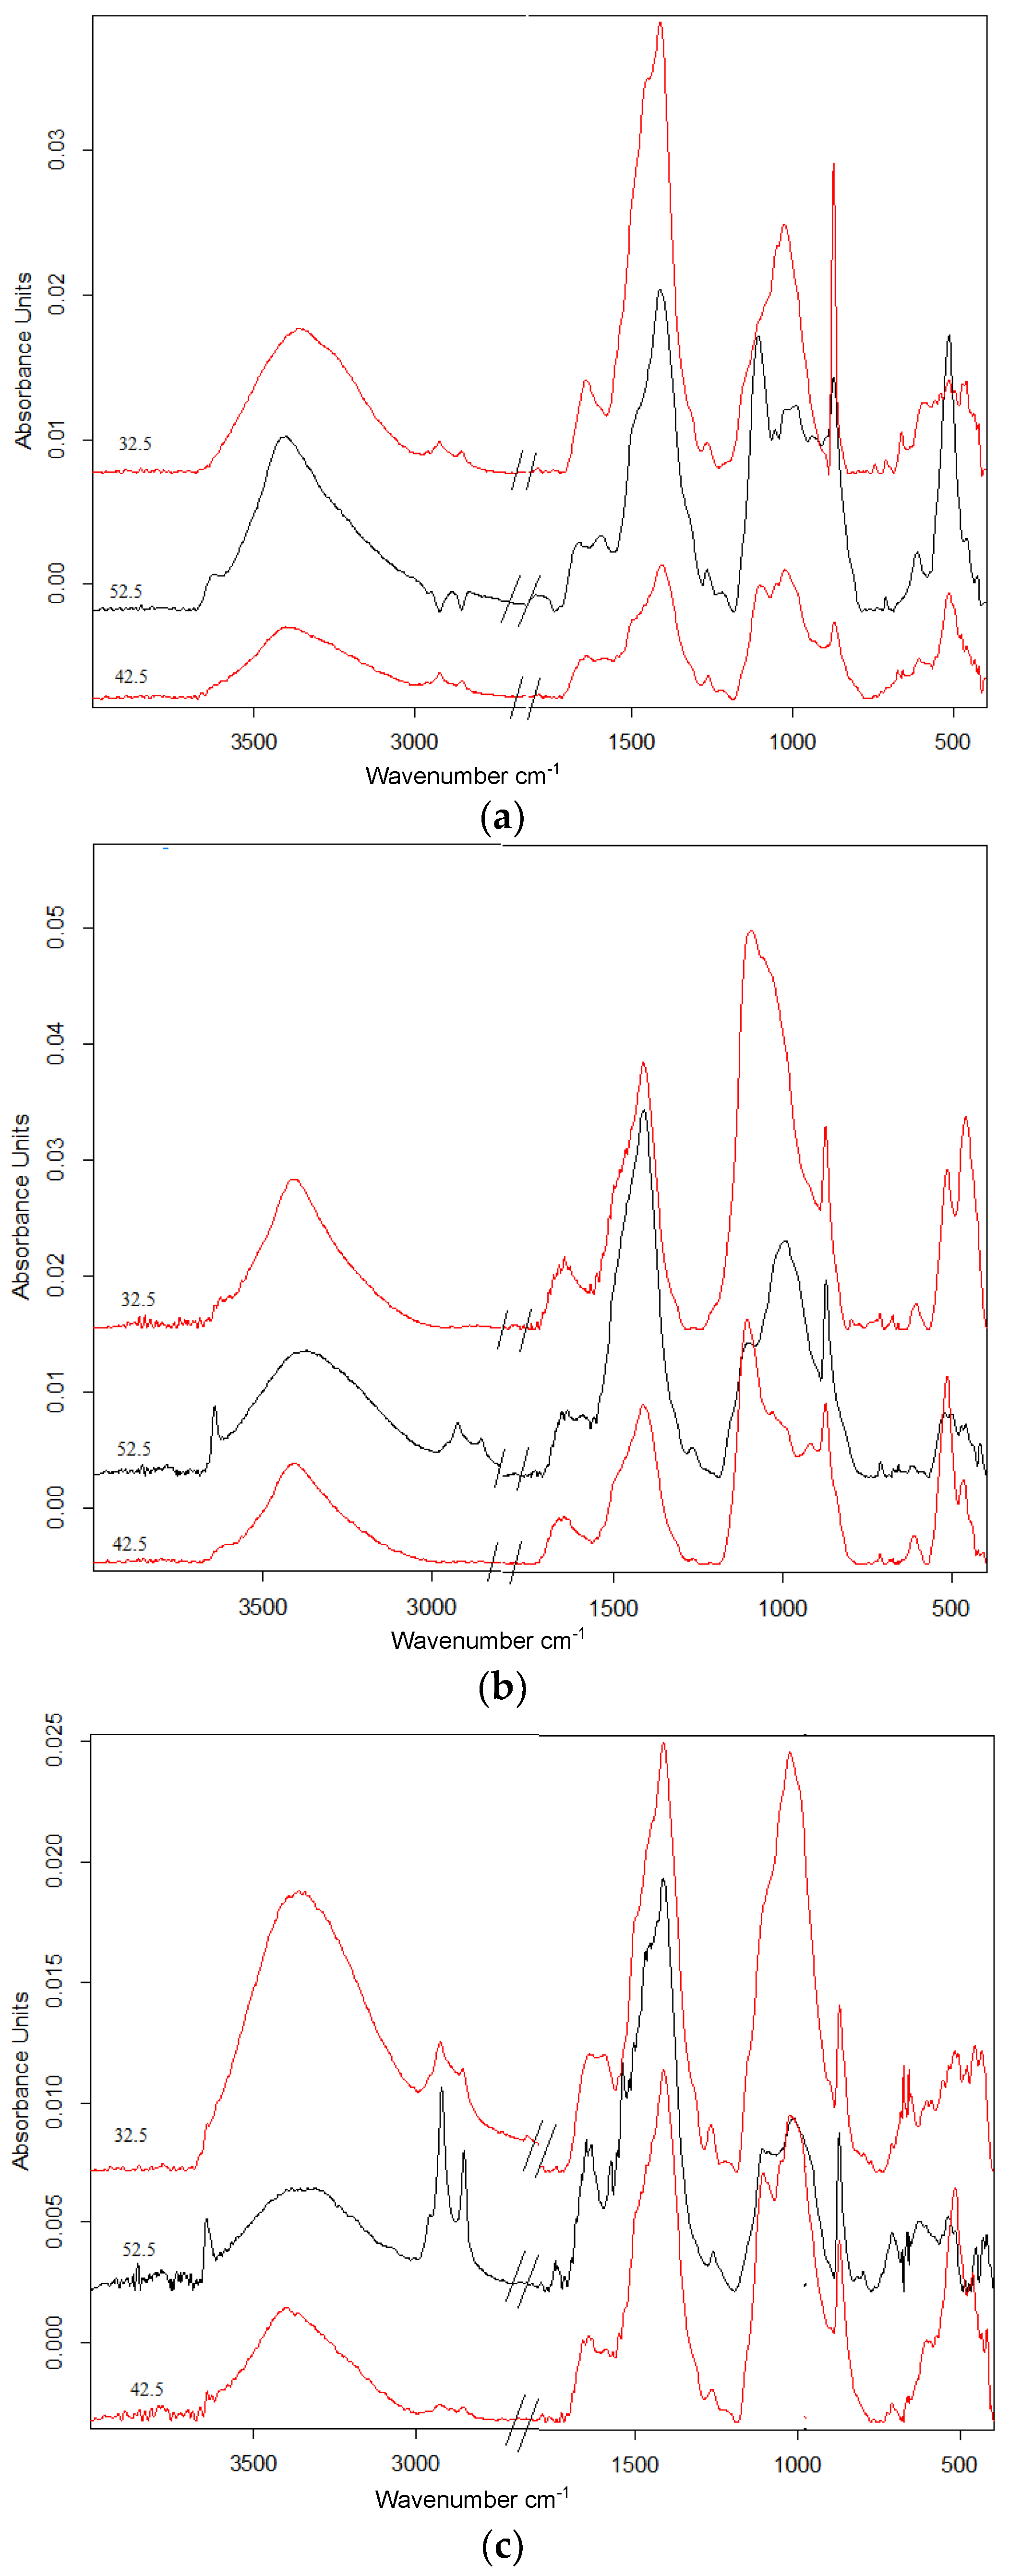
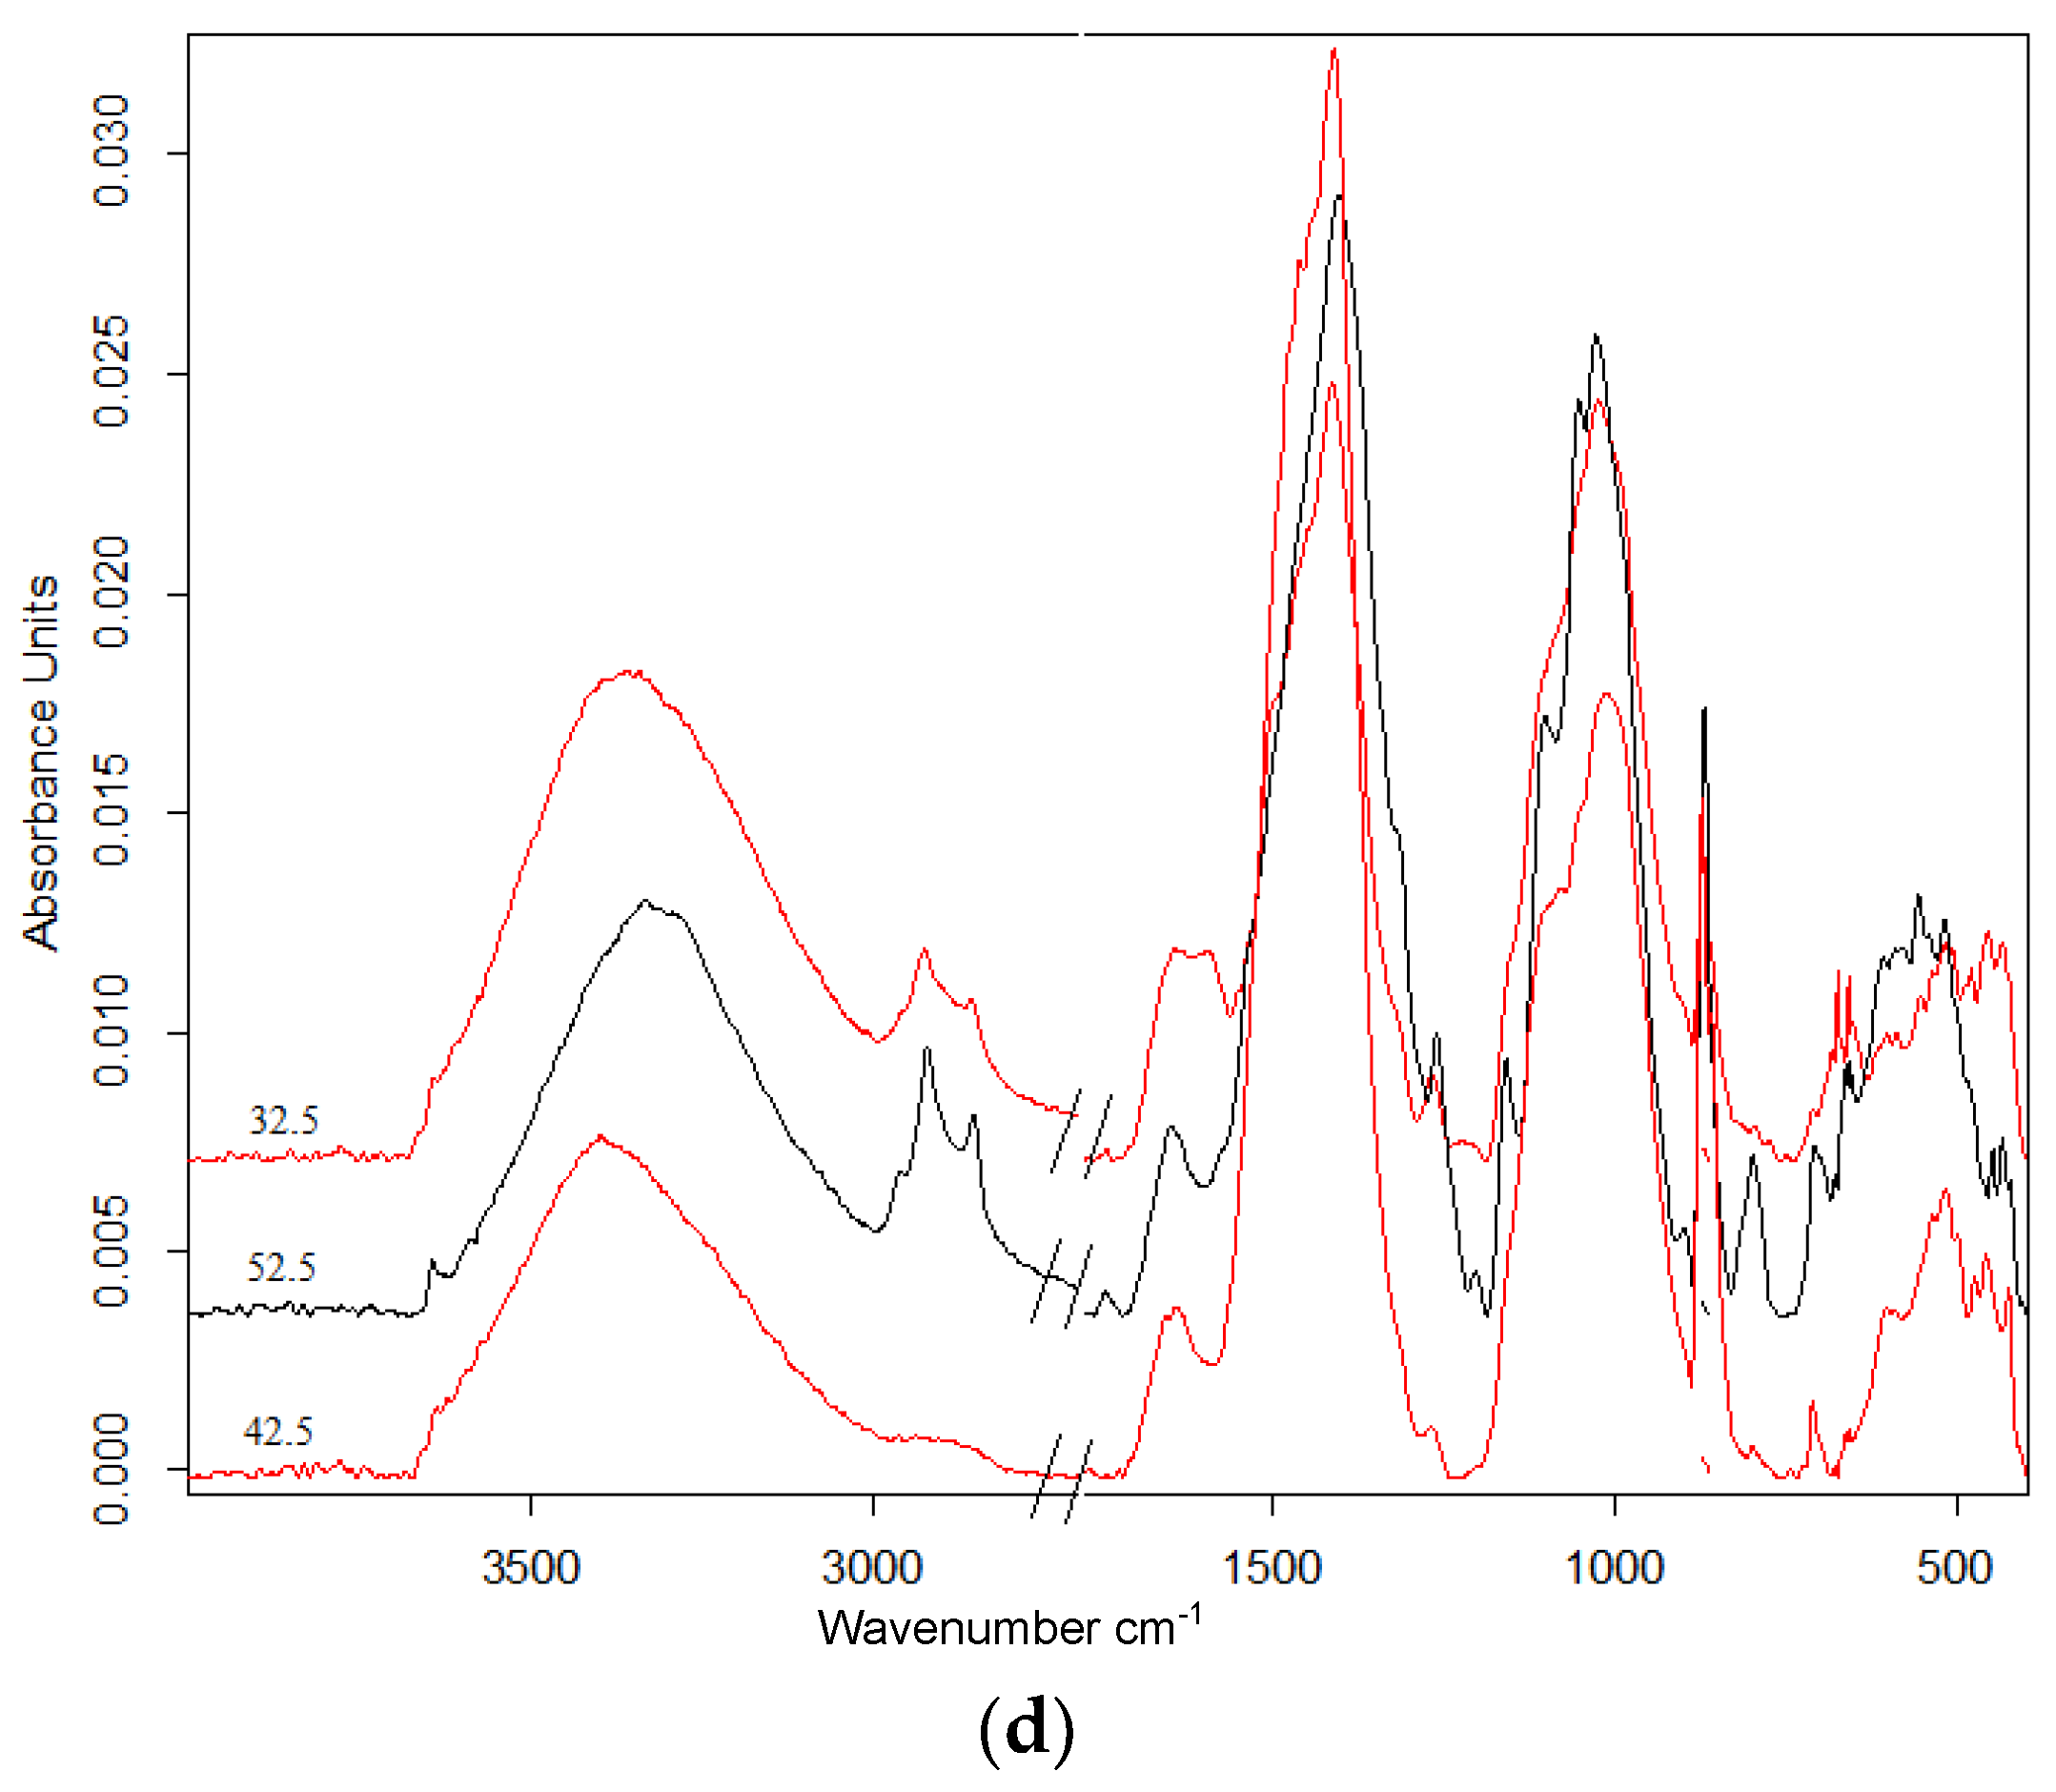
FTIR analysis was performed to characterize the chemical fingerprint of the composites and to understand the molecular interactions at the fiber–cement interface (
Figure 7).
The spectra reveal a distinct combination of organic and inorganic phases. Wood fibers were characterized by O-H stretching (~3300 cm
−1) [
28], C-H stretching (~2900 cm
−1) [
29], hemicellulose C=O vibrations (~1730 cm
−1) [
30], and lignin aromatic rings (~1600/1510 cm
−1) [
29]. At the same time, the cemented matrix can be attributed to the sharp Ca(OH)
2 peak (~3640 cm
−1) [
31] and, most importantly, the silicate (Si-O) [
32] stretching bands in the 1000–1200 cm
−1 region, indicating the polymerization of the silicate network and the formation of the C-S-H gel, which is the primary source of mechanical strength.
To go beyond qualitative observation, the peak intensities of the key Si-O (1100–1200 cm
−1) and Al-O (680–820 cm
−1) bands were calculated to quantify the degree of hydration (
Table 5). This quantitative analysis can support chemical validation for the remarkable mechanical performance of 42.5 cement discussed in previous sections. The most significant finding is the total Si-O density of 0.460 achieved by 42.5 cement at a fiber/cement ratio of 1/4. This value is significantly higher than other groups (e.g., compared to 0.024 for 32.5 cement at the same ratio) and indicates that this formulation facilitates the extensive polymerization of the silicate network. This chemical evidence also aligns with the mechanical data, which show that this group achieved a high MOR of 12.78 N/mm
2. Notably, 42.5 cement is thought to form an enhanced hydration network that effectively surrounds the fibers.
In contrast, increasing the fiber ratio to 1/2 resulted in a significant decrease in Si-O densities across all cement types (e.g., down to 0.017 for 42.5). This confirms that excessive organic content inhibits the hydration reaction and prevents the formation of a continuous binder matrix, leading to the observed low mechanical values (MOR ≈ 1.7–2.2 N/mm2).
A similar trend was observed in the aluminate phases (peaks at 820 and 680 cm−1) contributing to early strength and pore filling. The 42.5 cement (1/4 ratio) again showed the highest total Al-O density (0.101), suggesting a strong formation of C-A-H or C-A-S-H phases. In contrast, 52.5 cement at a 1/2 ratio showed negligible aluminate formation (0.003), indicating delayed hydration kinetics in the presence of high fiber content.
In summary, the FTIR data demonstrate that material performance is driven by an optimal chemical equilibrium. It was observed that using 42.5 cement in a 1/4 ratio represented a suitable chemical balance for creating an effective fiber–matrix bond by maximizing both silicate and aluminate hydration products.
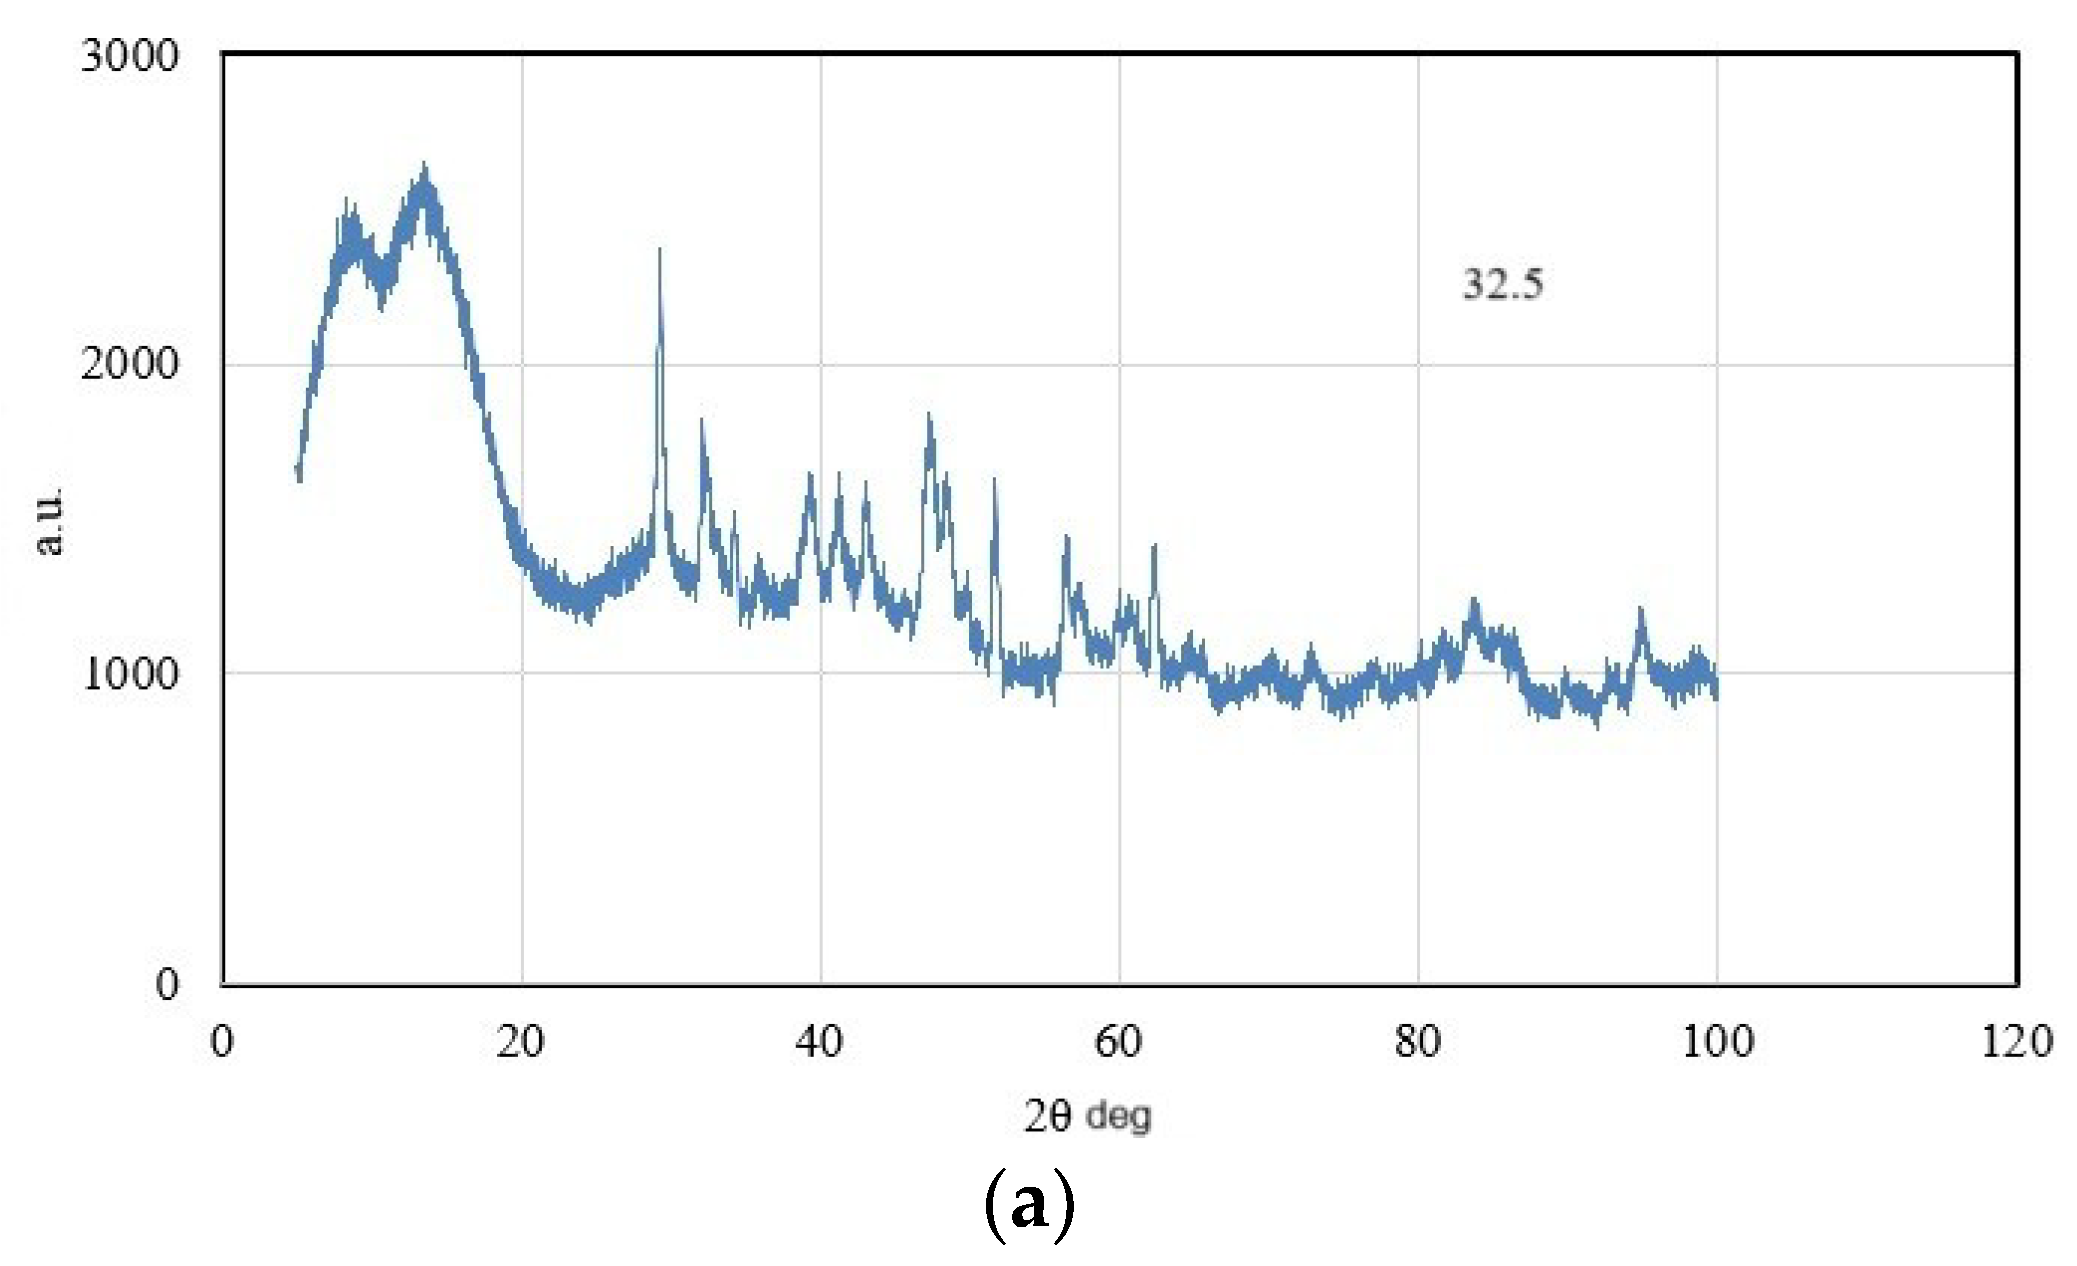
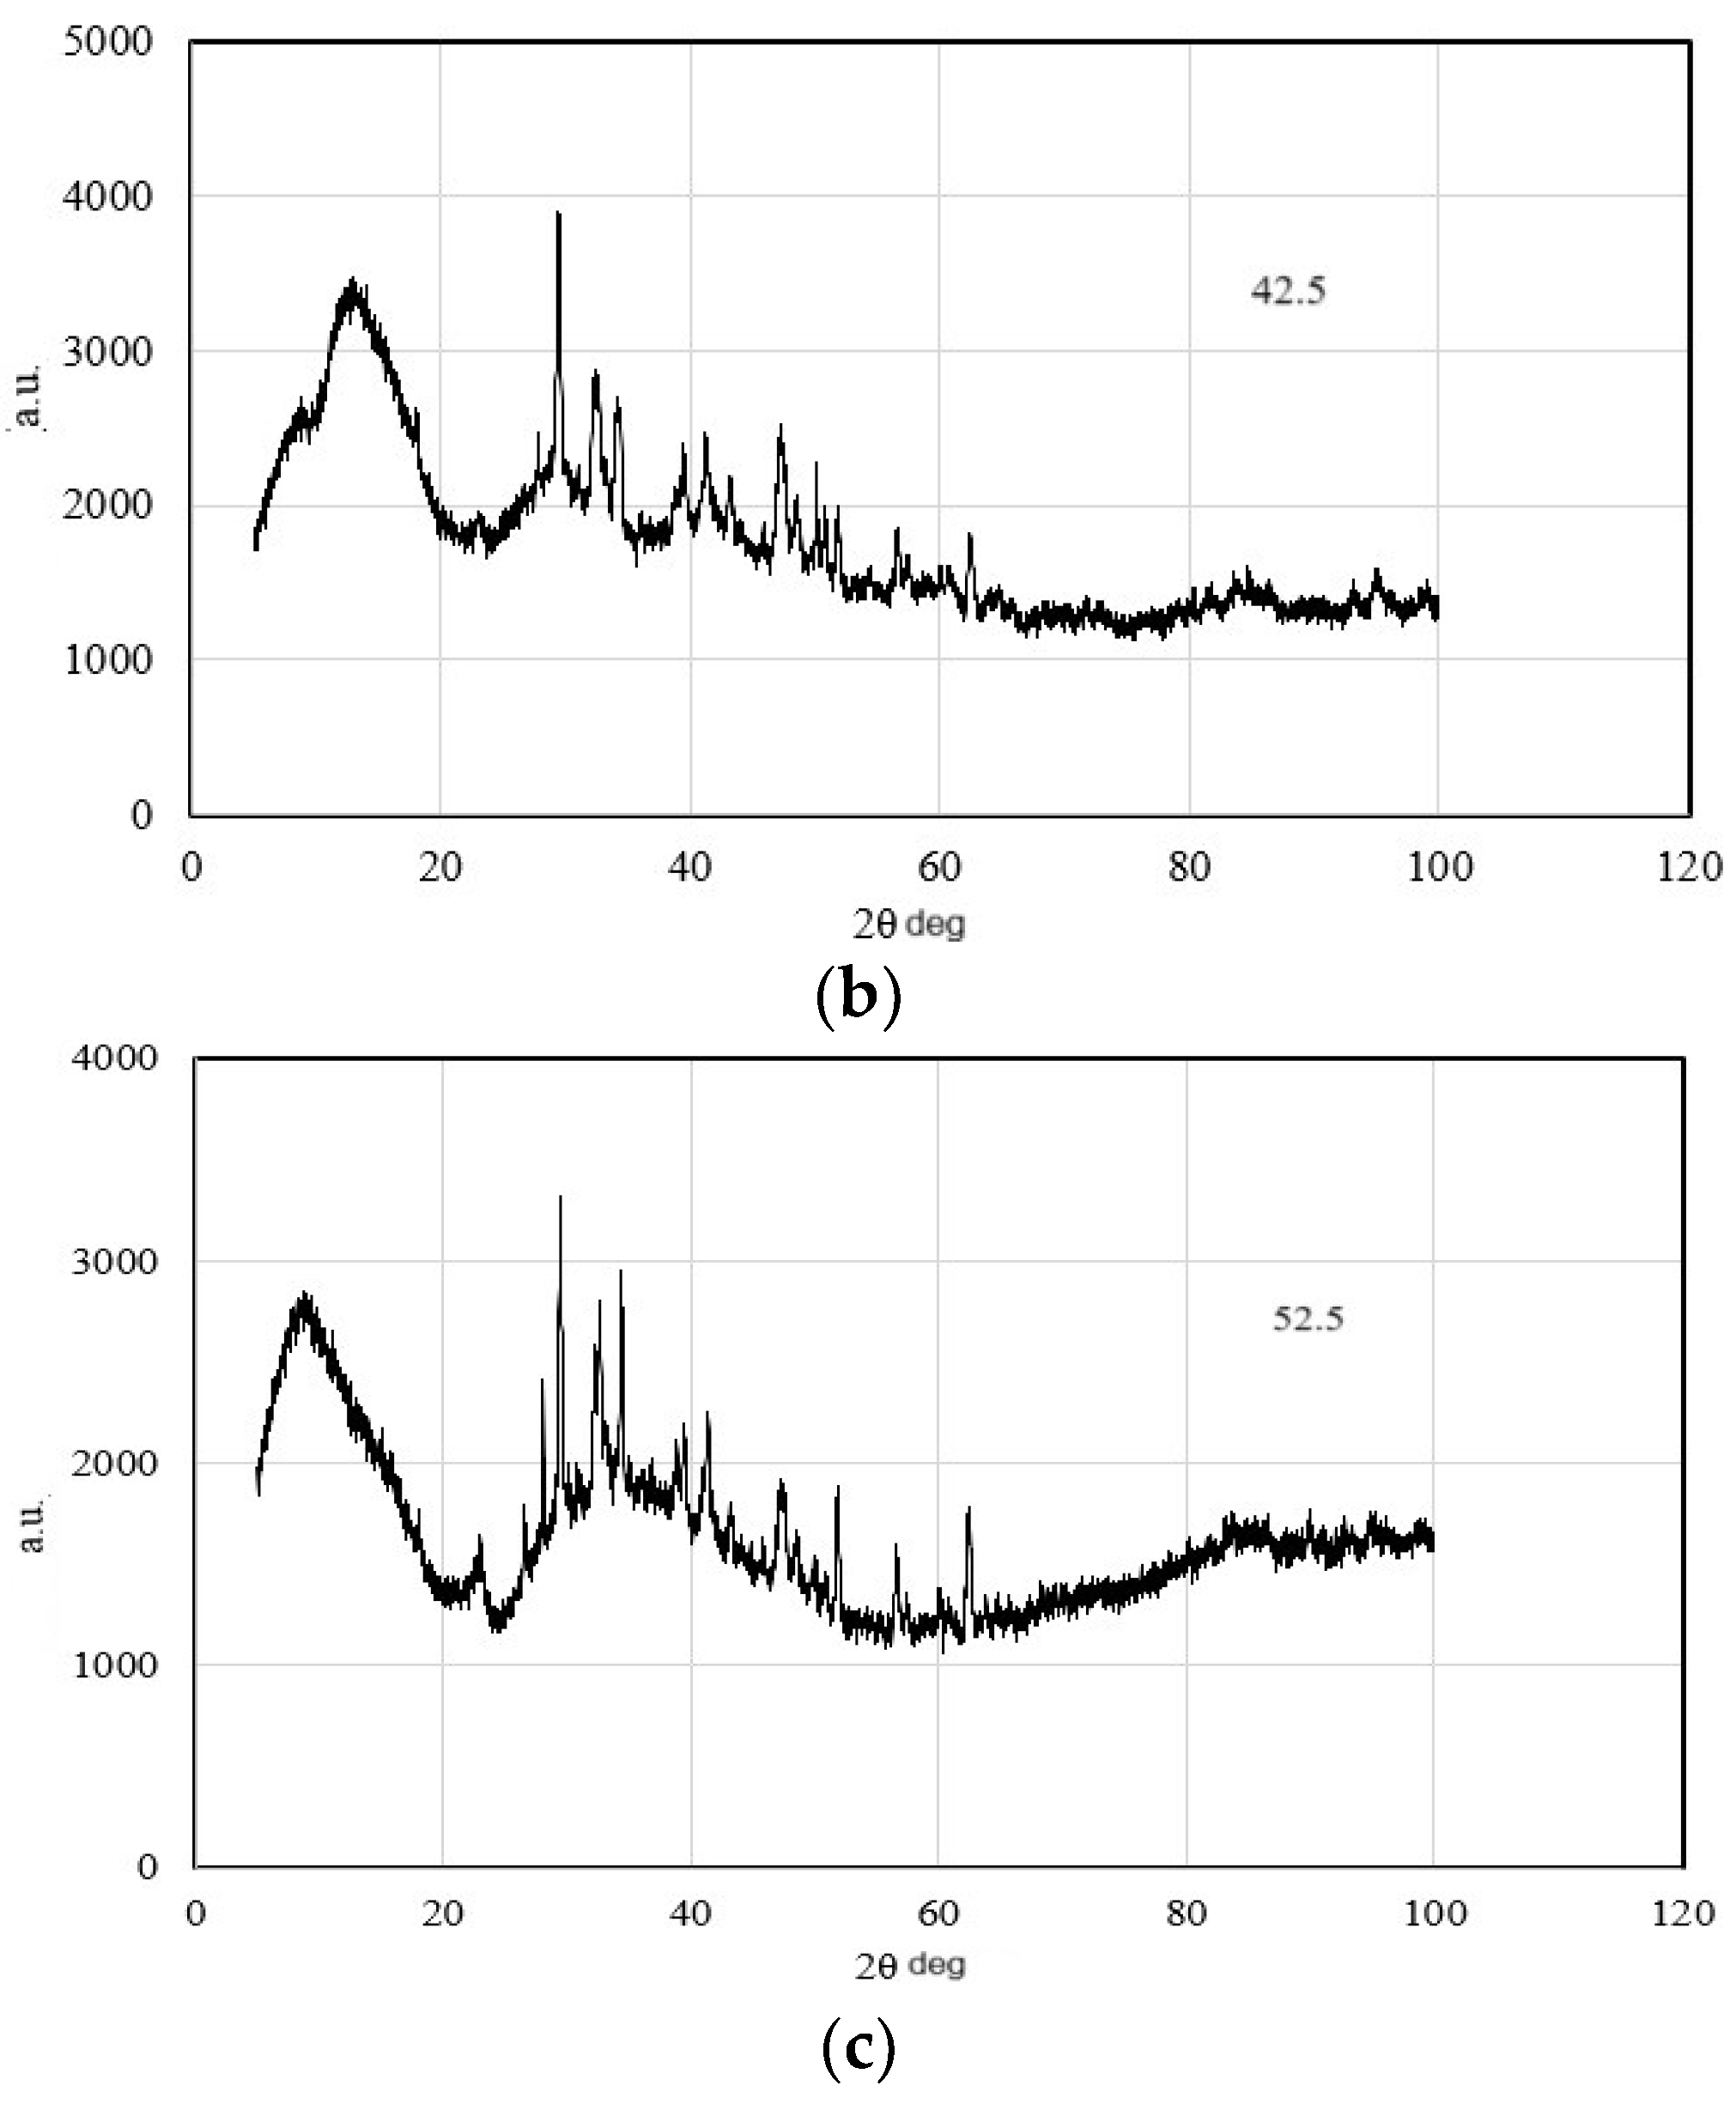
3.6. X-Ray Diffraction
The mineralogical composition of the produced panels was analyzed to visualize the crystalline and amorphous phases formed within the matrix (
Figure 8).
Diffraction patterns reveal a complex microstructure consisting of hydration products and unreacted clinker phases. The most critical feature for mechanical performance is the broad amorphous “peak” observed between 20° and 35° 2θ. This feature corresponds to the weakly crystalline calcium silicate hydrate (C-S-H) gel, which is the primary binder in cemented systems [
33]. This amorphous peak is significantly more pronounced and denser in the 42.5 and 52.5 cement samples compared to the 32.5 type. This density can be considered a physical indication that higher-strength-grade cements form a denser and more voluminous C-S-H gel network necessary for binding wood fibers. The sharp reflection at 34.1° 2θ was identified as Portlandite (Ca(OH)
2)—a significant byproduct of hydration, consistent with standard crystallographic data [
34]. The stronger presence of this peak in the 42.5 and 52.5 samples confirms a more advanced degree of hydration compared to the 32.5 cement. In addition, the peaks at 29.4° and 48.5° correspond to calcite (CaCO
3) [
33], which is attributed to the carbonation of some of the hydration products during the curing process via reaction with atmospheric CO
2.
The strong gel-formation potential, which we first identified through high CaO/SiO
2 ratios and intense Si-O vibrations in the FTIR analysis, is physically supported by a prominent amorphous “dense C-S-H network” in the XRD patterns. This microstructure is not merely a theoretical feature; it is the direct reason why groups 42.5 and 52.5 achieve good mechanical strength (
Table 4). In particular, the XRD data for the optimum 42.5 sample (1/4 ratio) complete the picture: they confirm that the chemically determined high bond density has been converted into a solid, load-bearing structure capable of providing the high strength we observed (12.77 N/mm
2).
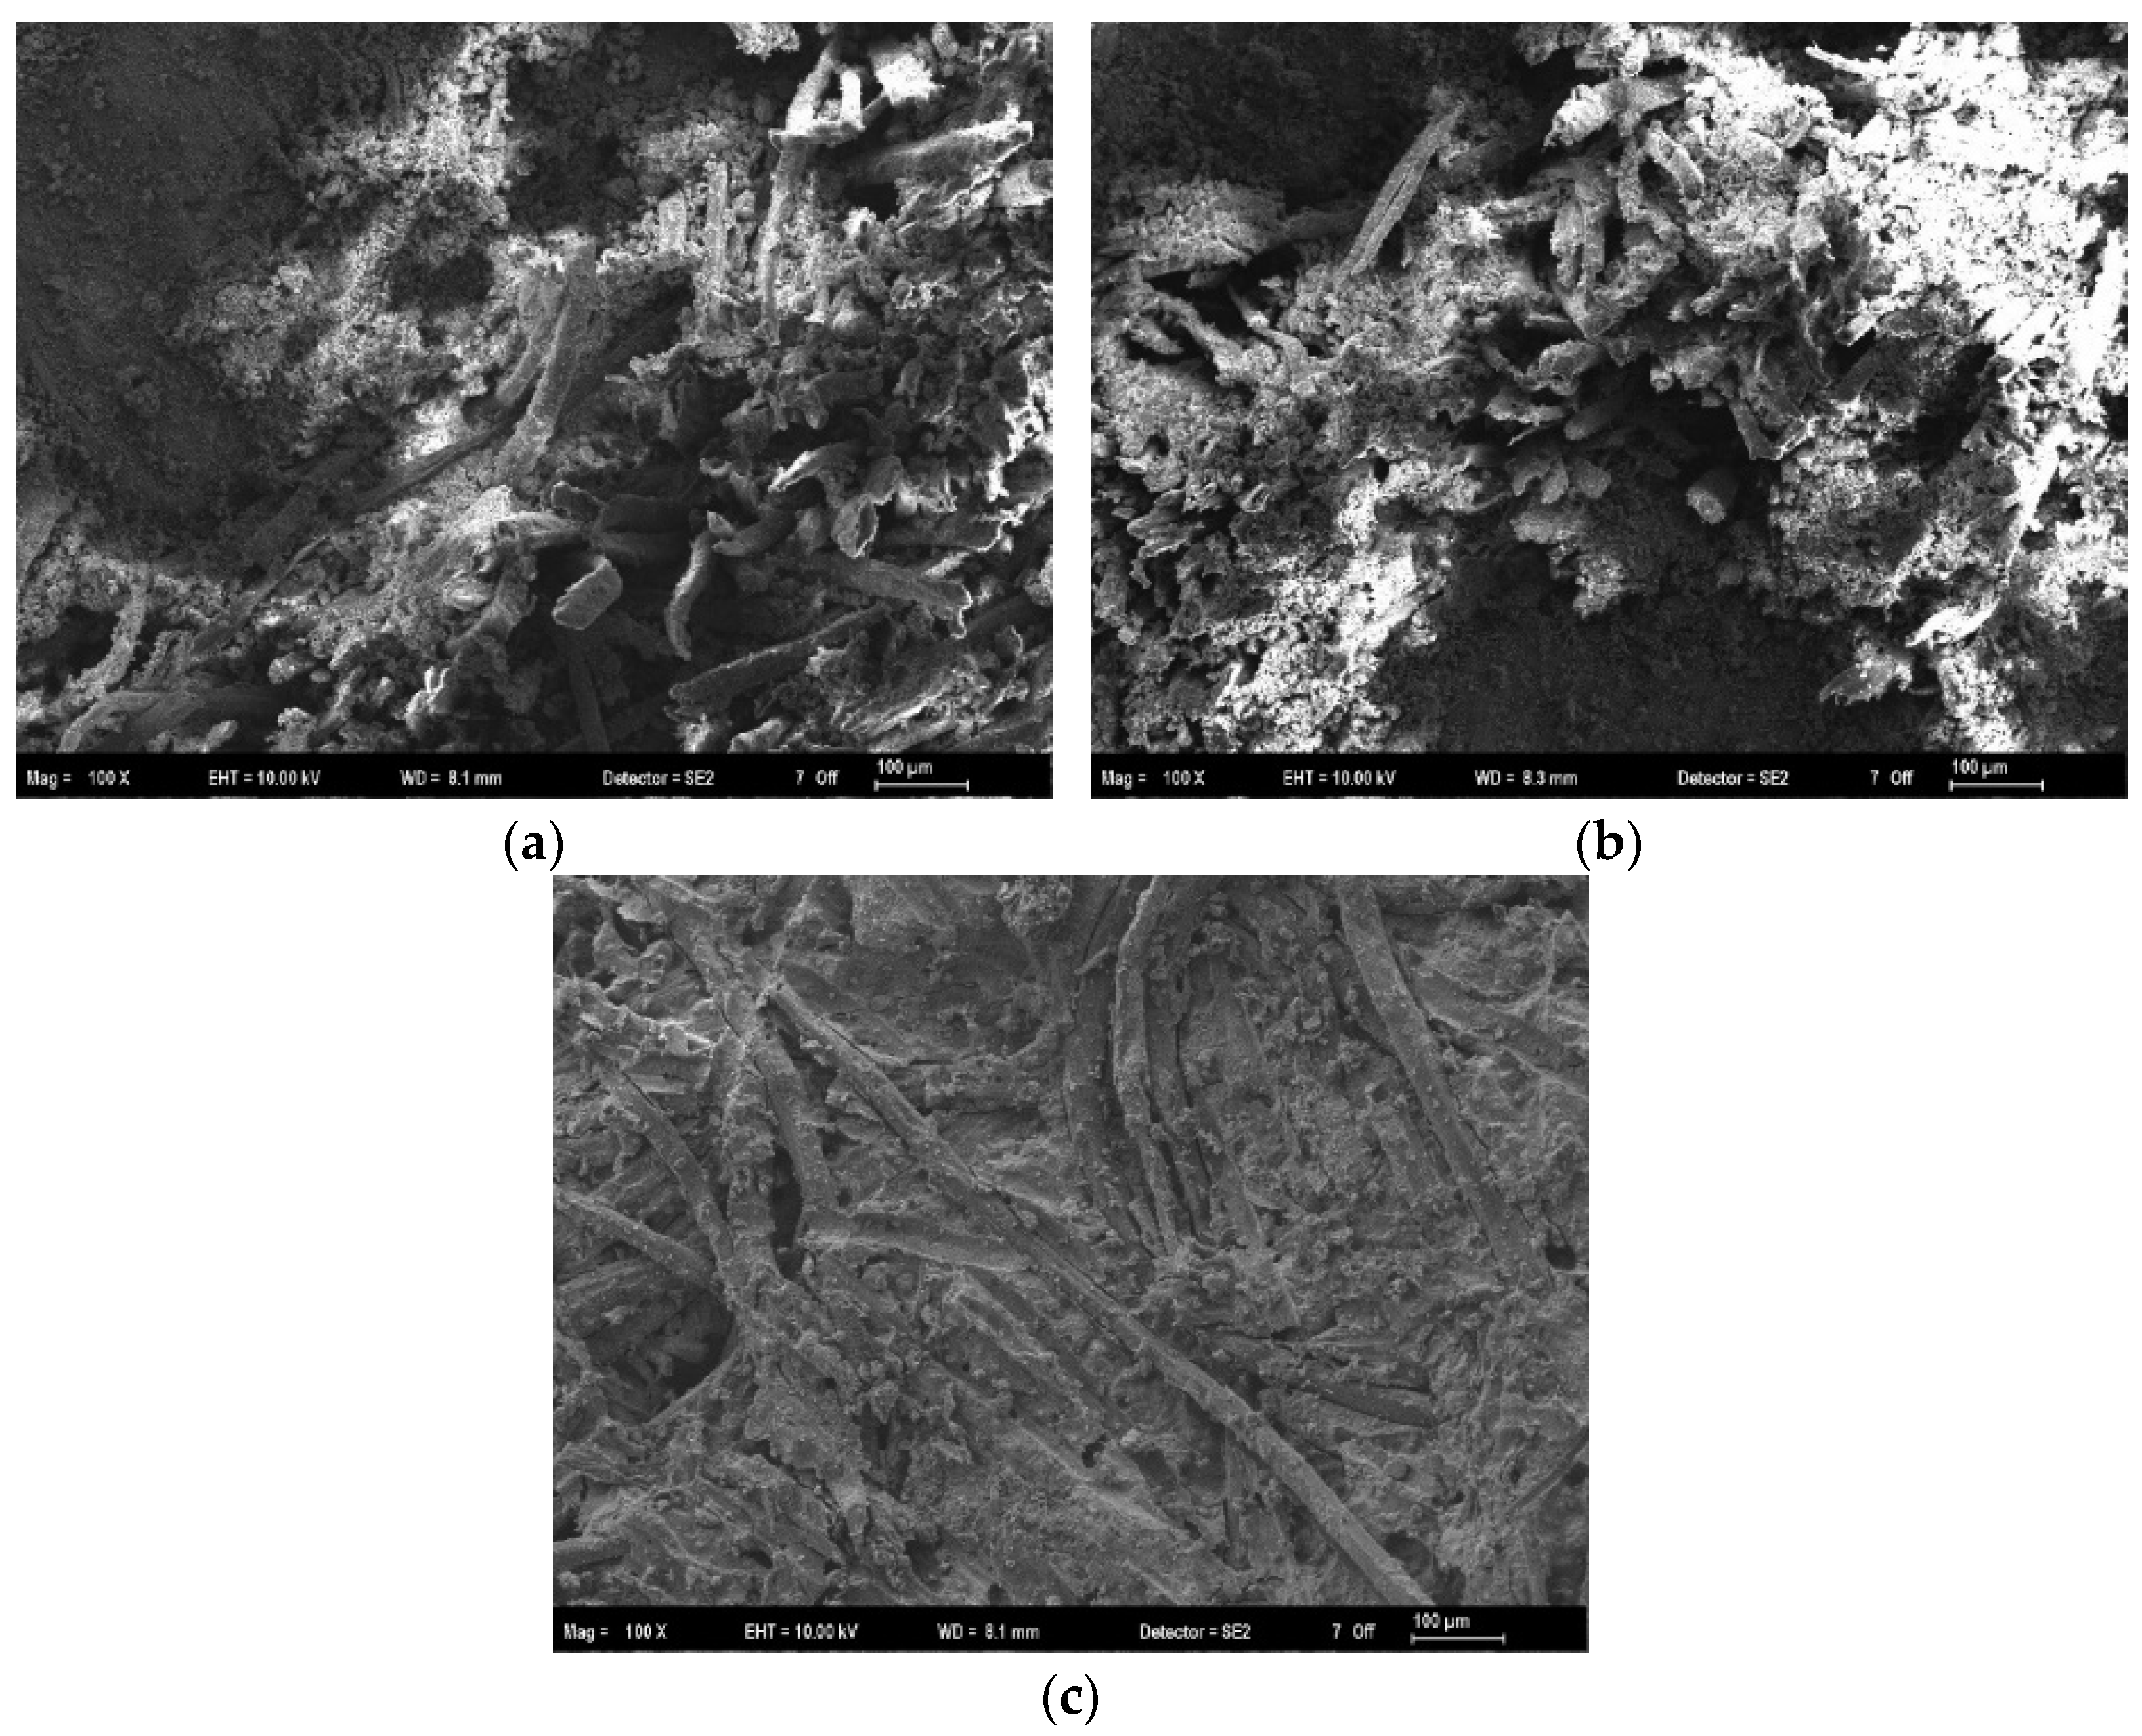
3.7. Scanning Electron Microscope
Figure 9 shows the surface morphology of boards produced with different cement grades at a reference 1/4 ratio.
In fiberboards with a 32.5 cement binder, the wood fibers are only partially encapsulated by the matrix. The texture is coarse and porous, and there are visible voids at the fiber–cement interface. This lack of close bonding creates weak points where stress cannot be effectively transferred from the matrix to the fiber and leads to water ingress. This visual evidence is directly related to the high water absorption and low MOR values previously reported.
In contrast, 52.5 and 42.5 CBL exhibit much denser morphology with improved fiber winding. Here, the fibers appear to be fully embedded within a compact and continuous hydration product network.
The dense matrix we observed in the 42.5 samples supports the dense Si-O bond and amorphous C-S-H phases previously identified in FTIR and XRD analyses. The encapsulation of the fibers seen in the SEM images ensures efficient load transfer from the matrix to the reinforcement. This strong interfacial bond may be the primary reason why the 42.5 group exhibits the highest stiffness and strength. Conversely, visible voids within the matrix of the 32.5 samples provide a clear structural explanation for their lower mechanical resistance and increased water absorption.
4. Discussion
While the general trends observed in this study—specifically the correlation between increased cement content and mechanical performance—align with the established literature [
35], the data reveal a noteworthy phenomenon: the CEM II 42.5 R grade, particularly at the 1/4 fiber/cement ratio, exhibited mechanical properties exceeding those of the higher-strength CEM II 52.5 R grade. This observation suggests that a higher cement strength class does not automatically yield a stronger composite in fiber-reinforced systems. The performance of the 42.5 grade appears to stem from a favorable combination of particle packing, hydration kinetics, and interfacial morphology. We propose three interconnected mechanisms to explain this behavior.
The first factor is physical packing. As detailed in
Table 6 and visualized in
Figure 2, composite density is closely linked to a well-graded particle size distribution (PSD).
Grade 52.5: Characterized by a “fine and narrow” distribution (≈70% < 10 µm), this cement reacts rapidly but may offer limited packing efficiency across the particle spectrum.
Grade 42.5: Demonstrates a broader distribution with a balanced volume of fine (≈20% < 5 µm), medium (≈45%), and coarse (≈35%) particles.
This graded structure of the 42.5 cement likely facilitates the more efficient filling of voids between the wood fibers, contributing to a denser and more homogeneous matrix. In contrast, the 32.5 cement, being predominantly coarse (>60% > 20 µm), may fail to establish a sufficiently continuous micro-network at high fiber loads.
The second factor involves reaction rate. The high fineness and C3S content of the 52.5 grade typically leads to rapid hydration. While advantageous for conventional concrete, this rapid reaction can be challenging in wood–cement composites. Hydration products can form a dense crust around the fibers before fully penetrating the porous cellular structure of the wood. Furthermore, the rapid heat release associated with rapid hydration can cause ITZ thermal stresses. Conversely, the 42.5 grade offers a more moderate hydration rate. This reduces the risk of thermal shock and allows time for hydration products to partially penetrate the fiber voids and lumen, potentially promoting a “mechanical interlock” that can provide effective stress transfer.
The FTIR analysis provides chemical support for these physical observations. The microstructure of the cement paste is influenced by its minor components, which can alter the growth of the C-S-H gel [
33]. The 42.5 cement at the 1/4 ratio showed a total Si-O intensity ratio of 0.46, which was higher than other groups. This suggests an extensive polymerization of the C-S-H gel, correlating with the peak MOR of 12.78 N/mm
2.
Additionally, this formulation exhibited the highest total Al-O intensity (0.101), indicating a robust formation of C-A-S-H phases. It is plausible that the specific chemical composition of the 42.5 grade promoted a C-S-H morphology—potentially more fibrillar than foil-like—that provided enhanced anchoring to the cellulose fibers. In contrast, increasing the fiber ratio to 1/2 drastically reduced these intensities (e.g., Si-O dropping to 0.017), confirming that high organic content inhibits the hydration reaction regardless of the cement grade.
Summary, the 42.5 cement at a 1/4 ratio appears to represent a favorable physio-chemical balance. It combines the physical benefit of a well-graded PSD with controlled hydration kinetics, creating conditions conducive to a robust fiber–matrix interface.
5. Conclusions
This study investigated the physical, mechanical, and thermal performance of cement-bonded fiberboards produced with different cement grades (CEM II 32.5, 42.5, 52.5) and fiber/cement ratios. Based on the experimental results and microstructural observations, the following conclusions can be drawn:
Mechanical–Thermal Trade-off: The results indicate a distinct inverse relationship between insulation and strength. While reducing the fiber ratio enhanced mechanical performance through matrix densification, it naturally increased thermal conductivity. The data suggest that fiber loading acts as a dominant factor influencing the bulk properties of the composite.
Effectiveness of the 42.5 Grade: Under the conditions of this study, the CEM II 42.5 R grade at a 1/4 ratio exhibited the most favorable balance of properties, exceeding the mechanical values obtained for the higher-strength 52.5 grade. This formulation achieved a flexural strength of 12.78 N/mm2 and water absorption of 23.2%, while maintaining a thermal conductivity of 0.1665 W/mK. This observation suggests that higher cement fineness does not necessarily guarantee superior composite performance in fiber-reinforced systems.
Microstructural Mechanism: The enhanced performance of the 42.5 grade appears to be associated with a synergy of well-graded particle size distribution and controlled hydration kinetics. FTIR and SEM analyses support the hypothesis that this specific formulation facilitated the formation of a dense C-S-H gel network and effective fiber encapsulation, potentially avoiding the interfacial defects observed in the rapidly hydrating 52.5 samples.
These findings imply that material design should be application-specific. The 42.5 grade at a 1/4 ratio presents a viable option for structural or exterior applications requiring high strength and moisture resistance. Conversely, higher fiber loadings may be more suitable for non-load-bearing partition walls where thermal efficiency is prioritized.
Author Contributions
Conceptualization, E.A., S.S.A. and E.G.; methodology, E.G., E.A. and S.S.A.; validation, E.G.; formal analysis, E.G.; investigation, E.A. and S.S.A.; resources, E.G.; data curation, E.A. and S.S.A.; writing—original draft preparation, S.S.A.; writing—review and editing, E.A., S.S.A. and E.G.; visualization, S.S.A.; supervision, E.G. All authors have read and agreed to the published version of the manuscript.
Funding
This research received no external funding.
Data Availability Statement
The original contributions presented in the study are included in the article; further inquiries can be directed to the corresponding author.
Acknowledgments
The authors would like to thank the staff of the Department of Forest Industry Engineering at Bursa Technical University for their technical assistance during the experimental studies. During the preparation of this manuscript, the authors used AI-based tools (ChatGPT 5.2/Gemini 3.0 pro) for English language editing and grammatical refinement. The authors have reviewed and edited the output and take full responsibility for the content of this publication.
Conflicts of Interest
The authors declare no conflicts of interest. The funders had no role in the design of the study; in the collection, analyses, or interpretation of data; in the writing of the manuscript; or in the decision to publish the results.
Abbreviations
The following abbreviations are used in this manuscript:
| CBF | Cement-Bonded Fiberboard |
| MOR | Modulus of Rupture |
| MOE | Modulus of Elasticity |
| WA | Water Absorption |
| TS | Thickness Swelling |
| PSD | Particle Size Distribution |
| C-S-H | Calcium Silicate Hydrate |
| ITZ | Interfacial Transition Zone |
| PC | Portland Cement |
| CaCl2 | Calcium Chloride |
| d | Density |
| FTIR | Fourier Transform Infrared Spectroscopy |
| SEM | Scanning Electron Microscopy |
| TC | Thermal Conductivity |
| XRD | X-ray Diffraction |
| XRF | X-ray Fluorescence |
References
- Frybort, S.; Mauritz, R.; Teischinger, A.; Müller, U. Cement bonded composites—A mechanical review. BioResources 2008, 3, 602–626. [Google Scholar] [CrossRef] [Scilit]
- De Souza, M.J.C.; de Melo, R.R.; Guimarães, J.B., Jr.; Carnaval, T.K.B.D.A.; Pimenta, A.S.; Mascarenhas, A.R.P. Wood–cement boards with addition of coconut husk. Wood Mater. Sci. Eng. 2022, 17, 617–626. [Google Scholar] [CrossRef] [Scilit]
- Taiwo, A.S.; Ayre, D.S.; Khorami, M.; Rahatekar, S.S. Optimizing the mechanical properties of cement composite boards reinforced with cellulose pulp and bamboo fibers for building applications in low-cost housing estates. Materials 2024, 17, 646. [Google Scholar] [CrossRef] [Scilit] [PubMed]
- EN 197-1:2011; Cement—Part 1: Composition, Specifications and Conformity Criteria for Common Cements. European Committee for Standardization: Brussels, Belgium, 2011.
- Sharbatdar, M.K.; Roudy, H.; Wahedy, M.N. The effect of adding zeolite and silica fume on properties of hardened ordinary and high strength concretes with cement grades 32.5, 42.5, and 52.5. Arab. J. Geosci. 2023, 16, 372. [Google Scholar] [CrossRef] [Scilit]
- Eskandari-Naddaf, H.; Kazemi, R. ANN prediction of cement mortar compressive strength, influence of cement strength class. Constr. Build. Mater. 2017, 138, 1–11. [Google Scholar] [CrossRef] [Scilit]
- Das, A.K. Natural sea-based materials SBM-ECCs: Experimental, analytical, and machine learning approaches to early-age behavior and modulating factors. Appl. Soft Comput. 2025, 186, 114101. [Google Scholar] [CrossRef] [Scilit]
- Das, A.K.; Qi, Y. High performance natural seawater coral sand ECC (HP-NSCS-ECC) in coastal conditions: Experimental characterization, microstructure, and sustainability. Constr. Build. Mater. 2025, 499, 143860. [Google Scholar] [CrossRef] [Scilit]
- Das, A.K.; Jiang, J.; Leung, C.K. ECCSrm: A novel meso-scale finite element model to simulate shrinkage of engineered cementitious composites (ECCs) incorporaring fiber characteristics. Constr. Build. Mater. 2025, 461, 139753. [Google Scholar] [CrossRef] [Scilit]
- Diakité, M.-S.; Lequart, V.; Hérisson, A.; Chenot, É.; Potel, S.; Leblanc, N.; Martin, P.; Lenormand, H. Processing Hemp Shiv Particles for Building Applications: Alkaline Extraction for Concrete and Hot Water Treatment for Binderless Particle Board. Appl. Sci. 2024, 14, 8815. [Google Scholar] [CrossRef] [Scilit]
- TAPPI. T 204 cm-97; Solvent Extractives of Wood and Pulp. TAPPI Press: Atlanta, GA, USA, 1997.
- TAPPI. T 222 om-02; Acid-Insoluble Lignin in Wood and Pulp. TAPPI Press: Atlanta, GA, USA, 2002.
- TAPPI. T 211 om-02; Ash in Wood, Pulp, Paper and Paperboard: Combustion at 525 °C. TAPPI Press: Atlanta, GA, USA, 2002.
- Wise, L.E.; Murphy, M.; d’Addieco, A.A. Chlorite holocellulose, its fractionation and bearing on summative wood analysis and on studies on the hemicelluloses. Pap. Trade J. 1946, 122, 35–43. [Google Scholar]
- Arpaci, S.S.; Guntekin, E. Optimizing Mechanical and Thermal Properties of Slag-Based Geopolymer Fiber Boards via Fiber Pretreatment and Reinforcement Type. Polymers 2026, 18, 423. [Google Scholar] [CrossRef] [Scilit]
- Pan, D.; Zhang, N.; Li, J.; Ye, H.; Yu, Z.; Zhang, Y. CaCl2-induced interfacial deposition for the preparation of high-strength and flame-retardant plywood using geopolymer-based adhesive. Ceram. Int. 2021, 47, 33678–33686. [Google Scholar] [CrossRef] [Scilit]
- EN 196-6; Methods of Testing Cement—Part 6: Determination of Fineness. European Committee for Standardization (CEN): Brussels, Belgium, 2018.
- ISO 13320:2020; Particle Size Analysis—Laser Diffraction Methods. International Organization for Standardization (ISO): Geneva, Switzerland, 2020.
- Fuwape, J.A.; Fabiyi, J.S.; Osuntuyi, E.O. Technical assessment of three-layered cement-bonded boards produced from wastepaper and sawdust. Waste Manag. 2007, 27, 1611–1616. [Google Scholar]
- TS EN 323; Wood–Based Panels—Determination of Density. Turkish Standards Institution (TSE): Ankara, Turkey, 1999.
- TS EN 317; Particleboards and Fibreboards—Determination of Swelling in Thickness After Immersion in Water. Turkish Standards Institution (TSE): Ankara, Turkey, 1999.
- TS EN 310; Wood-Based Panels—Determination of Modulus of Elasticity in Bending and of Bending Strength. Turkish Standards Institution (TSE): Ankara, Turkey, 1999.
- ASTM C518-17; Standard Test Method for Steady-State Thermal Transmission Properties by Means of the Heat Flow Meter Apparatus. ASTM International: West Conshohocken, PA, USA, 2017.
- Abdollahiparsa, H.; Shahmirzaloo, A.; Teuffel, P.; Blok, R. A review of recent developments in structural applications of natural fiber-reinforced composites (NFRCs). Compos. Adv. Mater. 2023, 32, 26349833221147540. [Google Scholar] [CrossRef] [Scilit]
- Biskri, Y.; Babouri, L.; Boukhelf, F.; Charradi, K.; Annaba, K.; El Mendili, Y. On the physical-mechanical behavior of fiber cement composite: Effect of chemical treatment of sisal fibers. J. Build. Eng. 2025, 101, 111978. [Google Scholar] [CrossRef] [Scilit]
- Aloulou, F.; Sammouda, H. Thermal conductivity and mechanical properties of organo-clay-wood fiber in cement-based mortar. In Sand in Construction; IntechOpen: London, UK, 2022. [Google Scholar]
- Soroushian, P.; Balachandra, A.; Nassar, S.; Weerasiri, R.; Darsanasiri, N.; Abdol, N. Effect of fiber type and content on the performance of extruded wood fiber cement products. Case Stud. Constr. Mater. 2022, 16, e00968. [Google Scholar] [CrossRef] [Scilit]
- Pandey, K.K.; Pitman, A.J. FTIR studies of the changes in wood chemistry during weathering. Wood Sci. Technol. 2003, 37, 239–249. [Google Scholar]
- Faix, O. Classification of lignins from different botanical origins by FT-IR spectroscopy. Holzforschung 1991, 45, 21–27. [Google Scholar] [CrossRef] [Scilit]
- Colom, X.; Carrillo, F.; Nogués, F.; Garriga, P. Structural analysis of photodegraded wood by means of FTIR spectroscopy. Polym. Degrad. Stab. 2003, 80, 543–549. [Google Scholar] [CrossRef] [Scilit]
- Wu, J.; Wan, C.; Hong, Z.; Zhou, A.; Tan, Y.; Deng, Y. Insights into clinker-clay interactions in stabilized soft clay using NMR, TEM, and FTIR. J. Rock Mech. Geotech. Eng. 2024; in press.
- Richardson, I.G. The nature of C-S-H in hardened cements. Cem. Concr. Res. 1999, 29, 1131–1147. [Google Scholar] [CrossRef] [Scilit]
- Scrivener, K.; Ouzia, A.; Juilland, P.; Mohamed, A.K. Advances in understanding cement hydration mechanisms. Cem. Concr. Res. 2019, 124, 105823. [Google Scholar] [CrossRef] [Scilit]
- Taylor, H.F.W. Cement Chemistry, 2nd ed.; Thomas Telford: London, UK, 1997; Volume 2, p. 459. [Google Scholar]
- Neville, A.M. Properties of Concrete, 4th ed.; Longman: London, UK, 1995. [Google Scholar]
Figure 1.
Pine (Pinus spp.) wood fibers used in the study: (a) SEM micrograph showing length measurement, (b) SEM micrograph showing diameter measurement, and (c) macroscopic view of the bulk fibers.
Figure 1.
Pine (Pinus spp.) wood fibers used in the study: (a) SEM micrograph showing length measurement, (b) SEM micrograph showing diameter measurement, and (c) macroscopic view of the bulk fibers.
Figure 2.
Particle size distribution (PSD) curves of the cement types.
Figure 2.
Particle size distribution (PSD) curves of the cement types.
Figure 3.
Manufacturing process and experimental testing of cement-bonded fiberboards: (a) deposition of the fiber–cement mixture into the mold, (b) manual distribution and mat formation, (c) mat ready for cold pressing, (d) surface view of the cured board, (e) test specimens cut to standard dimensions, (f) three-point bending test setup showing the failure mode, and (g) water absorption samples immersed in water.
Figure 3.
Manufacturing process and experimental testing of cement-bonded fiberboards: (a) deposition of the fiber–cement mixture into the mold, (b) manual distribution and mat formation, (c) mat ready for cold pressing, (d) surface view of the cured board, (e) test specimens cut to standard dimensions, (f) three-point bending test setup showing the failure mode, and (g) water absorption samples immersed in water.
Figure 4.
Effects of fiber/cement ratio and cement type on TS and WA. The error bars shown in red represent the standard deviation. Statistical analysis (two-way ANOVA, p < 0.05) revealed significant differences between groups. Significant differences among fiber/cement ratios are indicated by the following ranking order: 1/5 (a) < 1/4 (b) < 1/3 (c) < 1/2 (d). For WA: The 32.5 cement type (b) showed significantly higher water absorption compared to 42.5 and 52.5 types (a). Similarly for TS, the 32.5 cement type (b) exhibited significantly higher thickness swelling compared to the statistically equivalent 42.5 and 52.5 types (a).
Figure 4.
Effects of fiber/cement ratio and cement type on TS and WA. The error bars shown in red represent the standard deviation. Statistical analysis (two-way ANOVA, p < 0.05) revealed significant differences between groups. Significant differences among fiber/cement ratios are indicated by the following ranking order: 1/5 (a) < 1/4 (b) < 1/3 (c) < 1/2 (d). For WA: The 32.5 cement type (b) showed significantly higher water absorption compared to 42.5 and 52.5 types (a). Similarly for TS, the 32.5 cement type (b) exhibited significantly higher thickness swelling compared to the statistically equivalent 42.5 and 52.5 types (a).
Figure 5.
Effects of fiber/cement ratio and cement type on MOE and MOR. The error bars shown in red represent the standard deviation. According to Tukey’s post hoc test results (p < 0.05), significant differences are indicated by the following ranking orders: For MOE: All cement types were statistically different from each other, increasing in the order of 32.5 (a) < 42.5 (b) < 52.5 (c). All fiber/cement ratios also differed significantly, increasing as the ratio decreased: 1/2 (a) < 1/3 (b) < 1/4 (c) < 1/5 (d). For MOR: The 32.5 cement type (a) showed significantly lower strength compared to 42.5 and 52.5 types, which were statistically similar (b). Significant differences were observed between all fiber/cement ratios, with strength increasing in the order of 1/2 (a) < 1/3 (b) < 1/4 (c) < 1/5 (d).
Figure 5.
Effects of fiber/cement ratio and cement type on MOE and MOR. The error bars shown in red represent the standard deviation. According to Tukey’s post hoc test results (p < 0.05), significant differences are indicated by the following ranking orders: For MOE: All cement types were statistically different from each other, increasing in the order of 32.5 (a) < 42.5 (b) < 52.5 (c). All fiber/cement ratios also differed significantly, increasing as the ratio decreased: 1/2 (a) < 1/3 (b) < 1/4 (c) < 1/5 (d). For MOR: The 32.5 cement type (a) showed significantly lower strength compared to 42.5 and 52.5 types, which were statistically similar (b). Significant differences were observed between all fiber/cement ratios, with strength increasing in the order of 1/2 (a) < 1/3 (b) < 1/4 (c) < 1/5 (d).
Figure 6.
Effects of fiber/cement ratio and cement type on thermal conductivity of the boards.
Figure 6.
Effects of fiber/cement ratio and cement type on thermal conductivity of the boards.
Figure 7.
FTIR spectra of the cement-bonded fiberboards produced with different types of cement and fiber/cement ratios: (a) 1/2 ratio, (b) 1/3 ratio, (c) 1/4 ratio, and (d) 1/5 ratio.
Figure 7.
FTIR spectra of the cement-bonded fiberboards produced with different types of cement and fiber/cement ratios: (a) 1/2 ratio, (b) 1/3 ratio, (c) 1/4 ratio, and (d) 1/5 ratio.
Figure 8.
X-ray diffraction (XRD) patterns of the cement-bonded fiberboards produced with a fiber/cement ratio of 1/4 using different cement strength classes: (a) 32.5, (b) 42.5, and (c) 52.5.
Figure 8.
X-ray diffraction (XRD) patterns of the cement-bonded fiberboards produced with a fiber/cement ratio of 1/4 using different cement strength classes: (a) 32.5, (b) 42.5, and (c) 52.5.
Figure 9.
SEM micrographs showing the microstructure and fiber–matrix interface of cement-bonded fiberboards (fiber/cement ratio: 1/4) produced with different cement strength classes: (a) 32.5, (b) 42.5, and (c) 52.5.
Figure 9.
SEM micrographs showing the microstructure and fiber–matrix interface of cement-bonded fiberboards (fiber/cement ratio: 1/4) produced with different cement strength classes: (a) 32.5, (b) 42.5, and (c) 52.5.
Table 1.
Chemical composition and physical properties of the Portland cement types.
Table 1.
Chemical composition and physical properties of the Portland cement types.
| Property | Component/Parameter | CEM II 32.5 R | CEM II 42.5 R | CEM II 52.5 R |
|---|
| Chemical Composition (%) | SiO2 | 18.5 | 24.6 | 18.4 |
| | Al2O3 | 3 | 6.7 | 4.1 |
| | Fe2O3 | 2.2 | 4.1 | 4 |
| | CaO | 60.5 | 55.7 | 60.7 |
| | MgO | 0.9 | 5 | 1 |
| | SO3 | 2.9 | 2.7 | 1.1 |
| | Other | 2.1 | 1.9 | 3.4 |
| Physical Properties | Blaine Fineness (cm2/g) | 3600–3800 | 3900–4200 | 4300–4800 |
| Particle Size Distribution | D10 (µm) | 3.12 | 2.45 | 1.54 |
| | D50 (µm) | 21.4 | 14.8 | 8.9 |
| | D90 (µm) | 78.5 | 48.2 | 26.4 |
Table 2.
Mix proportions to produce experimental boards.
Table 2.
Mix proportions to produce experimental boards.
| Cement Strength Class | Fiber/Cement Ratio | Cement (g) | Wood Fiber (g) | CaCl2 (g) * | Water (g) ** |
|---|
| 32.5 | 1/2 | 1092 | 546 | 54.6 | 546 |
| | 1/3 | 1228.5 | 409.5 | 61.4 | 552.8 |
| | 1/4 | 1310.4 | 327.6 | 65.5 | 556.9 |
| | 1/5 | 1365 | 273 | 68.3 | 559.7 |
| 42.5 | 1/2 | 1092 | 546 | 54.6 | 546 |
| | 1/3 | 1228.5 | 409.5 | 61.4 | 552.8 |
| | 1/4 | 1310.4 | 327.6 | 65.5 | 556.9 |
| | 1/5 | 1365 | 273 | 68.3 | 559.7 |
| 52.5 | 1/2 | 1092 | 546 | 54.6 | 546 |
| | 1/3 | 1228.5 | 409.5 | 61.4 | 552.8 |
| | 1/4 | 1310.4 | 327.6 | 65.5 | 556.9 |
| | 1/5 | 1365 | 273 | 68.3 | 559.7 |
Table 3.
Physical properties of CBF panels.
Table 3.
Physical properties of CBF panels.
| Cement Strength Class | Fiber/Cement Ratio | Density (d) [g/cm3] | Water Absorption (WA) [%] | Thickness Swelling (TS) [%] |
|---|
| 32.5 | 1/2 | 1.28 ± 0.08 | 35.1 ± 2.5 | 2.8 ± 0.2 |
| | 1/3 | 1.23 ± 0.05 | 30.5 ± 2.1 | 2.4 ± 0.2 |
| | 1/4 | 1.56 ± 0.08 | 25.8 ± 1.8 | 2.0 ± 0.1 |
| | 1/5 | 1.49 ± 0.06 | 22.4 ± 1.6 | 1.8 ± 0.1 |
| 42.5 | 1/2 | 1.06 ± 0.04 | 32.5 ± 2.2 | 2.5 ± 0.2 |
| | 1/3 | 1.39 ± 0.07 | 28.1 ± 1.9 | 2.1 ± 0.1 |
| | 1/4 | 1.57 ± 0.05 | 22.1 ± 1.5 | 1.6 ± 0.1 |
| | 1/5 | 1.68 ± 0.09 | 18.9 ± 1.3 | 1.3 ± 0.1 |
| 52.5 | 1/2 | 1.10 ± 0.09 | 30.8 ± 2.1 | 2.3 ± 0.1 |
| | 1/3 | 1.40 ± 0.07 | 26.5 ± 1.8 | 1.9 ± 0.1 |
| | 1/4 | 1.56 ± 0.08 | 23.2 ± 1.6 | 1.7 ± 0.1 |
| | 1/5 | 1.67 ± 0.05 | 20.1 ± 1.4 | 1.5 ± 0.1 |
Table 4.
Mechanical properties of CBF panels (MOR and MOE).
Table 4.
Mechanical properties of CBF panels (MOR and MOE).
| Cement Strength Class | Fiber/Cement Ratio | Modulus of Elasticity (MOE) [N/mm2] | Modulus of Rupture (MOR) [N/mm2] |
|---|
| 32.5 | 1/2 | 903 ± 203 | 2.16 ± 0.4 |
| | 1/3 | 588 ± 90 | 2.18 ± 0.1 |
| | 1/4 | 1376 ± 525 | 1.83 ± 0.4 |
| | 1/5 | 4200 ± 619 | 9.39 ± 1.2 |
| 42.5 | 1/2 | 351 ± 61 | 1.70 ± 0.2 |
| | 1/3 | 1733 ± 353 | 6.61 ± 1.0 |
| | 1/4 | 4605 ± 540 | 12.78 ± 0.8 |
| | 1/5 | 5902 ± 532 | 12.49 ± 0.6 |
| 52.5 | 1/2 | 518 ± 120 | 2.09 ± 0.2 |
| | 1/3 | 3383 ± 609 | 10.63 ± 1.4 |
| | 1/4 | 5275 ± 538 | 11.59 ± 1.4 |
| | 1/5 | 5842 ± 470 | 12.02 ± 0.9 |
Table 5.
The Si-O and Al-O peak intensity ratios of composites based on cement type and fiber ratio.
Table 5.
The Si-O and Al-O peak intensity ratios of composites based on cement type and fiber ratio.
| Cement Type | Fiber/Cement Ratio | Si-O (1200 cm−1) | Si-O (1100 cm−1) | Total Si-O | Al-O (820 cm−1) | Al-O (680 cm−1) | Total Al-O |
|---|
| 32.5 | 1/2 | 0.010 | 0.030 | 0.040 | 0.007 | 0.007 | 0.014 |
| | 1/3 | 0.053 | 0.053 | 0.106 | 0.032 | 0.049 | 0.081 |
| | 1/4 | 0.008 | 0.016 | 0.024 | 0.013 | 0.024 | 0.037 |
| | 1/5 | 0.013 | 0.020 | 0.033 | 0.017 | 0.021 | 0.038 |
| 42.5 | 1/2 | 0.008 | 0.009 | 0.017 | 0.001 | 0.001 | 0.002 |
| | 1/3 | 0.012 | 0.025 | 0.037 | 0.025 | 0.030 | 0.055 |
| | 1/4 | 0.130 | 0.330 | 0.460 | 0.034 | 0.067 | 0.101 |
| | 1/5 | 0.025 | 0.036 | 0.061 | 0.021 | 0.033 | 0.054 |
| 52.5 | 1/2 | 0.012 | 0.012 | 0.024 | 0.000 | 0.003 | 0.003 |
| | 1/3 | 0.007 | 0.013 | 0.020 | 0.025 | 0.025 | 0.050 |
| | 1/4 | 0.007 | 0.019 | 0.026 | 0.023 | 0.035 | 0.058 |
| | 1/5 | 0.016 | 0.024 | 0.040 | 0.022 | 0.035 | 0.057 |
Table 6.
Fineness and particle size distribution parameters of cement samples.
Table 6.
Fineness and particle size distribution parameters of cement samples.
| Cement Type | Blaine Fineness (cm2/g) | PSD | Discussion |
|---|
| 32.5 | 3600–3800 | Coarser and wider distribution. | Lower fineness leads to a slower hydration reaction and consequently lower early-age strength [35]. |
| 42.5 | 3900–4200 | Well-graded (wide distribution). Contains a balanced mix of both fine and medium-sized particles. | The well-graded structure allows for the most efficient packing of particles, creating a less porous (low porosity) and homogeneous matrix [35]. |
| 52.5 | 4300–4800 | Very fine and narrow distribution. Most particles are of a similar and very small size. | The highest fineness results in very rapid hydration and high early strength. However, this can lead to a brittle interface with thermal stresses and micro-cracks around the wood fiber due to rapid heat release. |
| Disclaimer/Publisher’s Note: The statements, opinions and data contained in all publications are solely those of the individual author(s) and contributor(s) and not of MDPI and/or the editor(s). MDPI and/or the editor(s) disclaim responsibility for any injury to people or property resulting from any ideas, methods, instructions or products referred to in the content. |