


Abstract
With the rapid development of integrated energy systems (IES) towards integration and marketization, the collaborative planning of multi-energy entities has become a research hotspot. However, in real-world market environments, various energy entities often face information asymmetry and competitive interests, posing significant challenges to the optimal scheduling of the system. To address the incomplete information and competitive constraints among multiple energy hubs (EH) within IES, this paper constructs a multi-entity game planning model that accounts for environmental costs and carbon trading mechanisms. The model employs Bayesian game methods to handle the incomplete information among EH and analyzes the dynamic interactive behaviors of market entities under different strategies through multilateral incomplete information evolutionary game theory. Meanwhile, this paper incorporates carbon trading mechanisms along with the coupling technologies of power-to-gas (P2G) and carbon capture systems (CCS) to balance the economic efficiency and environmental protection. Additionally, in response to investment uncertainty, the real options theory is utilized for evaluation, and then a multi-entity incomplete information planning model is constructed, which is solved by using a nested algorithm proposed in this paper. This approach balances the interests of various entities and enhances the comprehensive long-term investment returns considering options. Simulation results demonstrate that the model effectively reflects the game behaviors among multi-energy entities under incomplete information, yielding optimized scheduling solutions that closely align with real-world scenarios. It improves economic benefits while reducing environmental pollution, providing theoretical foundations and methodological support for the planning of integrated energy systems involving multiple entities in electricity market environments.
1. Introduction
As the global energy landscape is undergoing profound adjustments and the challenges of climate change are becoming increasingly severe, the transformation and development of energy systems have emerged as a core strategy for countries to achieve sustainable development [1]. Traditional energy systems, dominated by fossil fuels, suffer from issues such as low energy utilization efficiency and severe environmental pollution, making it difficult to meet modern society’s demands for clean, efficient, and sustainable energy [2]. With technological advancements and policy incentives, energy systems are rapidly evolving towards integration and marketization. The Integrated Energy System (IES), as a novel energy supply model, integrates multiple energy forms, including electricity, heat, and gas, to achieve cascading utilization and collaborative optimization of energy [3,4,5]. This approach effectively enhances energy utilization efficiency, reduces carbon emissions, and has become a key direction for energy transformation.
Meanwhile, with the continuous deepening of market-oriented reforms in the energy market, the operational model of integrated energy systems involving multiple energy entities has gradually emerged [6]. In a market-oriented environment, various energy entities, such as energy suppliers, energy hubs, and users, possess independent decision-making powers and distinct interest demands. They compete and cooperate with one another in the energy market, jointly influencing the operation and planning of the system [7]. However, the real market environment is complex and ever-changing, with widespread information asymmetry and competitive interests among energy entities. On the one hand, due to limitations in technological means, poor information transmission, or intentional concealment by entities, it is difficult for energy entities to obtain complete and accurate information, resulting in insufficient decision-making bases [8]. On the other hand, each entity, in pursuit of maximizing its own interests, engages in competitive relationships in terms of energy transactions and resource allocation. This competition may trigger non-cooperative behaviors, further exacerbating the uncertainty of the system. The intertwining of information asymmetry and competitive interests poses significant challenges to the optimal scheduling of integrated energy systems. How to achieve collaborative planning and efficient operation among multiple energy entities in such a complex environment has become a critical issue that urgently requires resolution [9,10,11].
Furthermore, environmental issues have become a global focal point, with energy activities being one of the primary sources of carbon emissions [12]. To address climate change, countries have set carbon reduction targets and introduced market-based mechanisms such as carbon trading systems to incentivize enterprises to reduce carbon emissions through economic means. In integrated energy systems, environmental costs and carbon trading mechanisms significantly influence the decision-making behaviors of energy entities [13,14,15]. While pursuing economic benefits, energy entities must also consider carbon emission constraints and environmental costs, necessitating a comprehensive consideration of both economic and environmental aspects in system planning and operation to achieve an organic integration of the two. Therefore, researching planning and decision-making methods for multi-energy entities’ incomplete information games that account for environmental costs and carbon trading mechanisms not only helps address the challenges of system optimization and scheduling caused by information asymmetry and competitive interests in real-world markets, improves energy utilization efficiency and system operational reliability, but also promotes the low-carbon transformation of energy systems, achieving a win-win situation for both economic and environmental benefits [16,17,18]. This research holds significant theoretical importance and practical application value for driving the healthy and sustainable development of integrated energy systems.
At the planning level, existing research primarily focuses on optimizing system topology, equipment selection, and capacity configuration, aiming to construct an efficient and reliable integrated energy system architecture. For instance, Reference [19] proposes a multi-objective optimization-based planning method for integrated energy systems, comprehensively considering indicators such as economic efficiency, reliability, and environmental friendliness. It determines the optimal equipment configuration scheme for the system through optimization algorithms. At the operational level, existing research emphasizes the optimal scheduling and real-time control of systems to achieve rational energy distribution and efficient utilization. For example, Reference [20] constructs a dynamic optimal scheduling model for integrated energy systems, taking into account the coupling relationships between different energy forms and real-time load variations. By solving the model, it obtains the optimal scheduling strategy, thereby enhancing the operational efficiency of the system. However, most existing studies assume complete information transparency and cooperative behavior among energy entities, neglecting the impacts of information asymmetry and competitive interests in real-world markets. In actual operations, energy entities often make decisions based on the limited information they possess, and their behaviors exhibit uncertainty and self-interest, which may lead the system to deviate from its optimal operational state [21,22]. Therefore, how to effectively plan and operate integrated energy systems under conditions of incomplete information and competition has emerged as a new research direction.
In the energy sector, the theory of incomplete information games has gradually been applied to research in electricity markets, natural gas markets, and other areas [23]. For instance, in the study of electricity markets, Reference [24] employs Bayesian game methods to analyze the bidding strategies of power generators under incomplete information, taking into account the uncertainty of competitors’ cost information. By establishing a game model and solving for the Nash equilibrium, it provides a theoretical basis for decision-making by power generators. In the research on natural gas markets, Reference [25] utilizes evolutionary game theory to investigate the strategic choices and dynamic adjustment processes of natural gas suppliers under different market environments, revealing the behavioral evolution patterns of market entities. Although the theory of incomplete information games has achieved certain results in research on some energy markets, its application in the complex multi-entity environment of integrated energy systems is still in its infancy. Integrated energy systems involve multiple energy forms and numerous energy entities, with more intricate information exchanges and strategic interactions among them. Existing research is still insufficient to meet practical needs.
In the planning and operation of energy systems, the incorporation of environmental costs and carbon trading mechanisms has become a research hotspot. Reference [26] considers environmental costs in an integrated energy system planning model by quantifying the environmental impact of carbon emissions and integrating environmental costs into the objective function. This approach enables the planning scheme to effectively control carbon emissions while meeting energy demands. Reference [27] examines the impact of carbon trading mechanisms on the operation of electricity markets, analyzing the optimal power generation strategies and carbon emission patterns of power generators under carbon trading markets, and providing policy recommendations for the low-carbon transformation of electricity markets. Reference [28] proposes a tri-level bi-directional converter (BdC)-based interconnection planning framework for hybrid AC/DC microgrid clusters with high renewable energy penetrations. By incorporating dynamic BdC efficiency linearization and a data-correlated uncertainty set derived from historical patterns, the proposed method addresses the non-convex nature of converter efficiency and renewable energy uncertainty simultaneously. However, existing studies, while comprehensively considering environmental costs and carbon trading mechanisms, often overlook the incomplete information and competitive relationships among energy entities. In real markets, energy entities have differing expectations regarding environmental policies and carbon trading prices, and their decision-making behaviors are influenced by information asymmetry. This can lead to inefficient operation of carbon trading markets and a decline in the overall emission reduction effectiveness of the system [29,30]. Therefore, it is necessary to incorporate environmental costs and carbon trading mechanisms into a multi-energy entity incomplete information game framework and conduct systematic research.
Therefore, despite certain progress made in the planning and operation of integrated energy systems, the following deficiencies still exist [24,25,26,27,28,29]:
- (1)
- Most existing research on the planning and operation of integrated energy systems is based on assumptions of complete information transparency and cooperative behavior among entities, failing to fully consider the impacts of information asymmetry and competitive interests on system decision-making in real markets. This leads to planning schemes that are difficult for achieving the expected results in practical applications.
- (2)
- The application of incomplete information game theory in the energy sector is mostly concentrated on single markets or simple systems, with immature research in the complex multi-entity environment of integrated energy systems. There is a lack of in-depth analysis targeting the complex information exchanges and strategic interactions among multiple energy entities.
- (3)
- When introducing environmental costs and carbon trading mechanisms, existing research often considers their impacts on energy systems in isolation, failing to integrate them with the incomplete information game behaviors of multiple energy entities. This makes it difficult to comprehensively reflect the interactions and influencing mechanisms among various factors in real markets.
- (4)
- In the planning of integrated energy systems, investment uncertainty significantly affects the long-term operational benefits of the system. Existing research, when assessing investment uncertainty, mostly employs traditional probabilistic analysis methods, failing to fully account for management flexibility and option value. This results in investment decisions that are overly conservative or aggressive, reducing the system’s long-term investment returns.
In response to the deficiencies in existing research, this paper focuses on the planning and decision-making method for incomplete information games among multiple energy entities, taking into account environmental costs and carbon trading mechanisms. The main research contents and innovations are as follows:
- (1)
- To address the incomplete information and competitive constraints within IES, this study comprehensively considers the incomplete information issues among EH, and incorporates carbon trading mechanisms along with the coupling technologies of power-to-gas (P2G) and carbon capture systems (CCS); based on these, a multi-entity game planning model that balances system economic efficiency and environmental protection is constructed.
- (2)
- To analyze the dynamic interactive behaviors of market entities, the Bayesian game method is employed to address the incomplete information problems among energy hubs. Through multilateral incomplete information evolutionary game analysis, the dynamic interactive behaviors of market entities under different strategies are examined, revealing the strategic choices and evolutionary patterns of each entity in an environment characterized by information asymmetry and competition.
- (3)
- In response to investment uncertainty in integrated energy systems, real options theory is utilized for evaluation, fully considering management flexibility and option value. This approach can balance the interests of various entities and enhances the comprehensive long-term investment returns considering options.
- (4)
- The constructed multi-entity incomplete information planning model is solved by using the propose nested algorithm, and the effectiveness of the model is validated through simulation experiments, yielding an optimized scheduling scheme that reflects the game behaviors among multiple energy entities under incomplete information.
2. Basic Theoretical Model of the Planning and Decision-Making Method for Incomplete Information Game
2.1. Model of Carbon Emission and Carbon Trading
The carbon trading market allows each energy hub (EH) to buy and sell carbon emission quotas. The carbon emission of each EH is calculated as follows:
where represents the carbon emission of the i-th EH at time t; represents the carbon emission factor of grid power; represents the carbon emission factor of fuel gas; represents the carbon emission factor of the boiler; represents the electric power purchased from the power grid at time t; represents the gas power purchased from the gas network at time t; represents the thermal power generated by the boiler at time t; stands for carbon trading profit; represents the carbon price at time t; represents the carbon quota allocated to the i-th EH at time t; stands for carbon capture cost; represents the unit carbon capture cost; and represents the amount of carbon captured by CCS equipment at time t.
2.2. Game Model with Incomplete Information
Due to information asymmetry, each agent is unaware of the types (such as cost parameters, efficiency parameters, etc.) of other agents (the agent in this paper refers to the energy hub). Using Bayesian games, each agent has a type drawn from a type space , which follows a probability distribution . Each agent selects an action (such as power generation plans, trading strategies, etc.) to maximize its expected utility. The payoff function for each agent i is as follows:
where represents the payment function of the i-th EH; represents the operational decision variables of i-th EH (such as power purchase, power generation, P2G operation, etc.); represents the operational decision variables of other EH; represents the private type of the i-th EH; Ri represents the income of the i-th EH; and Ci represents the cost of the i-th EH.
2.3. The Real Option Investment Model
When deliberating on whether to invest in P2G or CCS equipment, assuming the investment cost is I and the future cash flows are uncertain, real options can be utilized to evaluate the investment value [31,32,33]. The option valuation model is as follows:
where C represents the option value; S represents the present value of the project; K represents the investment cost; N( ) represents a normal distribution function; r represents the risk-free rate; T represents investment time; represents the volatility of project value; and d1 and d2 are option value factors respectively.
It should be noted that in this paper, Equation (4) is used solely for introducing concepts and laying theoretical groundwork, rather than serving as the core valuation method actually employed. When introducing the concept of real options, the Black–Scholes formula (i.e., Equation (4)) stands as the most classic and widely recognized option pricing model. Using it as a starting point facilitates readers’ quick understanding of the fundamental ideas behind real options. In the actual solution process of this paper, we do not directly use the Black–Scholes formula to value the P2G/CCS investment options. Instead, in the subsequent Section 4.2 and Section 4.3, we adopt the Least Squares Monte Carlo (LSM) method as the core evaluation tool for the inner-layer real options.
3. The Planning and Decision-Making Model for Incomplete Information Game Among Multiple Energy Entities
3.1. The Objective Function
In this paper, the objective function aims to maximize the expected net present value of each Energy Hub (EH) over a multi-period planning horizon, and its expression is shown as follows:
where indicates the investment decision variables of i-th EH (such as whether to invest P2G or CCS); indicates the private type of other EH; indicates external uncertainty (such as carbon price, energy price, etc.); stands for discount rate; t stands for the t-th period; T represents the total number of planning periods; represents the total real option value of i-th EH; represents the expected net present value of i-th EH; and represents the payment function of the i-th EH for the t-th period.
The calculation formula of is as follows:
where stands for operating profit; stands for technical benefits; stands for amortization of investment cost; stands for operation and maintenance cost; where represents the selling price; represents the electric power sold to the power grid at time t; represents the price of electricity purchased from the power grid at time t; represents the price of gas purchased at time t; represents the sales price of fuel gas produced by P2G equipment; represents the gas power produced by P2G equipment at time t; is a variable of 0–1, indicating whether P2G equipment has been invested at time t (if it has been invested, it is 1, otherwise it is 0); represents the unit operation and maintenance cost of P2G equipment; represents the electric power consumed by P2G equipment at time t; represents the investment cost of i-th EH for technology k (P2G or CCS); and are variables of 0–1, indicating whether technology k has been invested at time t and t − 1 (if it has been invested, it is 1, otherwise it is 0); represents the economic life of technology k; represents the unit operation and maintenance cost of the gas turbine; represents the power generated by the gas turbine at time t; represents the unit operation and maintenance cost of the boiler; represents the unit operation and maintenance cost of P2G equipment; represents the electric power consumed by P2G equipment at time t; represents the unit operation and maintenance cost of CCS equipment.
The calculation formula of is as follows:
where represents the value of deferred options; represents the expansion option value; means the giving up option value; represents the optimal investment time of technology k; represents the project value of investing in technology k at time ; represents the investment cost of technology k; stands for discount factor; represents the expansion ratio, which is between 0 and 1; represents expansion decision-making time; represents the project value after expansion at time ; represents the cost of expanding investment; indicates the time to give up the project; represents the residual value that can be obtained by abandoning the project at time .
3.2. The Constraints
The energy balance equations of the system are as follows:
where stands for local power generation; stands for electrical load; represents the gas power consumed by the gas turbine; stands for gas load; stands for thermal power generated by combined heat and power (CHP) system; represents the thermal power generated by the boiler; and stands for heat load.
The equipment capacity constraints are:
where the superscript max indicates the maximum capacity.
4. The Nested Algorithm Framework Structure of Multi-Energy-Agent Game Model
4.1. The Co-Evolutionary Algorithm
The co-evolutionary algorithm originates from the biological phenomenon of “co-evolution,” where the evolution of one species alters the fitness landscape of other species, thereby driving their evolution. This process involves mutual influence and continuous cycles. In this paper, each energy hub (EH1, EH2, …) is regarded as an independent “species,” with each maintaining a population composed of multiple possible strategies (i.e., investment plans, operational strategies). The “fitness” of a strategy does not solely depend on itself but is highly contingent upon the strategies adopted by other entities. For instance, the success of an investment strategy by EH1 depends on whether EH2, EH3, and others have also made investments (which affects market competition, energy prices, etc.). The populations of all entities evolve simultaneously; the evolution (strategy update) of one entity’s population alters the fitness environment of the other entities’ populations, prompting them to evolve accordingly until the entire system reaches a stable equilibrium state.
In this paper, the co-evolutionary algorithm is employed to solve the equilibrium of multi-agent Bayesian games, with the following steps:
Step 1: Initialization. Set the parameters for the co-evolutionary algorithm: population size is M, maximum number of generations is Gmax, convergence value is ε, crossover probability is Pc, and mutation probability is Pm.
Step 2: Execute co-evolutionary iterations (iterative loop from g = 1 to Gmax).
Step 3: Perform the following operations for each agent i:
- (1)
- Fitness evaluation (for each individual j in population Pop,i).
- (2)
- Selection: select parent individuals using the roulette wheel selection method based on fitness.
- (3)
- Crossover: perform crossover operations on the selected parent individuals with probability Pc to generate offspring.
- (4)
- Mutation: perform mutation operations on the offspring individuals with probability Pm.
- (5)
- Form a new population: replace the old population with the newly generated offspring population.
- (6)
- Conduct convergence check: calculate the average strategy change for each agent’s population. If the change for all agents is less than ε, terminate the loop.
Step 4: Output the optimal strategy for each agent, i.e., the individual with the highest fitness in the population).
4.2. The Least Squares Monte Carlo (LSM) Method
The LSM method, proposed by Longstaff and Schwartz, is a numerical approach for pricing American options. It combines Monte Carlo simulation with least squares regression to estimate, through backward recursion, the value of continuing to hold the option at each time point, thereby facilitating optimal exercise decisions. In the multi-energy-agent game planning model presented in this paper, the LSM method is utilized for the inner-layer real option evaluation to calculate the value of flexibility in investment decisions. In this paper, real options encompass delay options, expansion options, and abandonment options. Taking the delay option as an example (with other options following a similar approach), the steps for evaluating a delay option are outlined as follows:
Step 1: Generate random paths: simulate Npath random paths for carbon prices, electricity prices, and gas prices, which are assumed to conform to the geometric Brownian motion (GBM) model.
Step 2: Calculate project value for each path: for each path, at each possible investment time point τ, compute the net present value (NPV) of cash flows from τ to T.
Step 3: Perform backward recursion, starting from the final time point T and moving backward:
- (1)
- At time point T, the option value is determined as max (value of continuing to hold, value of immediate investment, abandonment value).
- (2)
- At time point t, use least squares regression to estimate the conditional expected value of continuing to hold the option.
- (3)
- Then, compare the value of immediate investment, the value of continuing to hold, and the abandonment value, selecting the maximum as the current option value.
Step 4: Obtain the option value: the option value at the initial time is deemed the value of the real option.
4.3. The Nested Algorithm Framework Structure
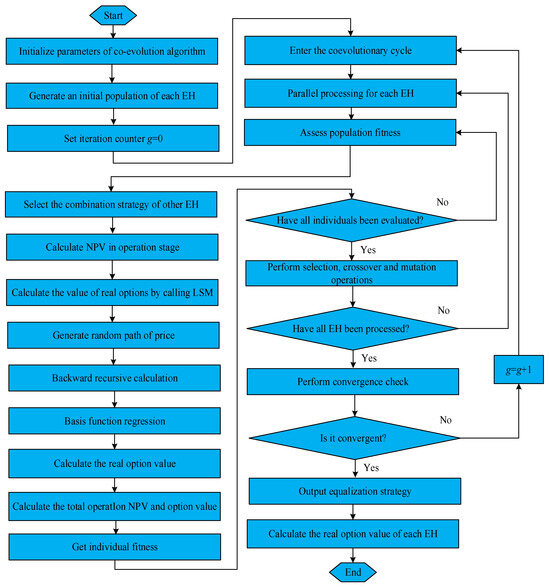
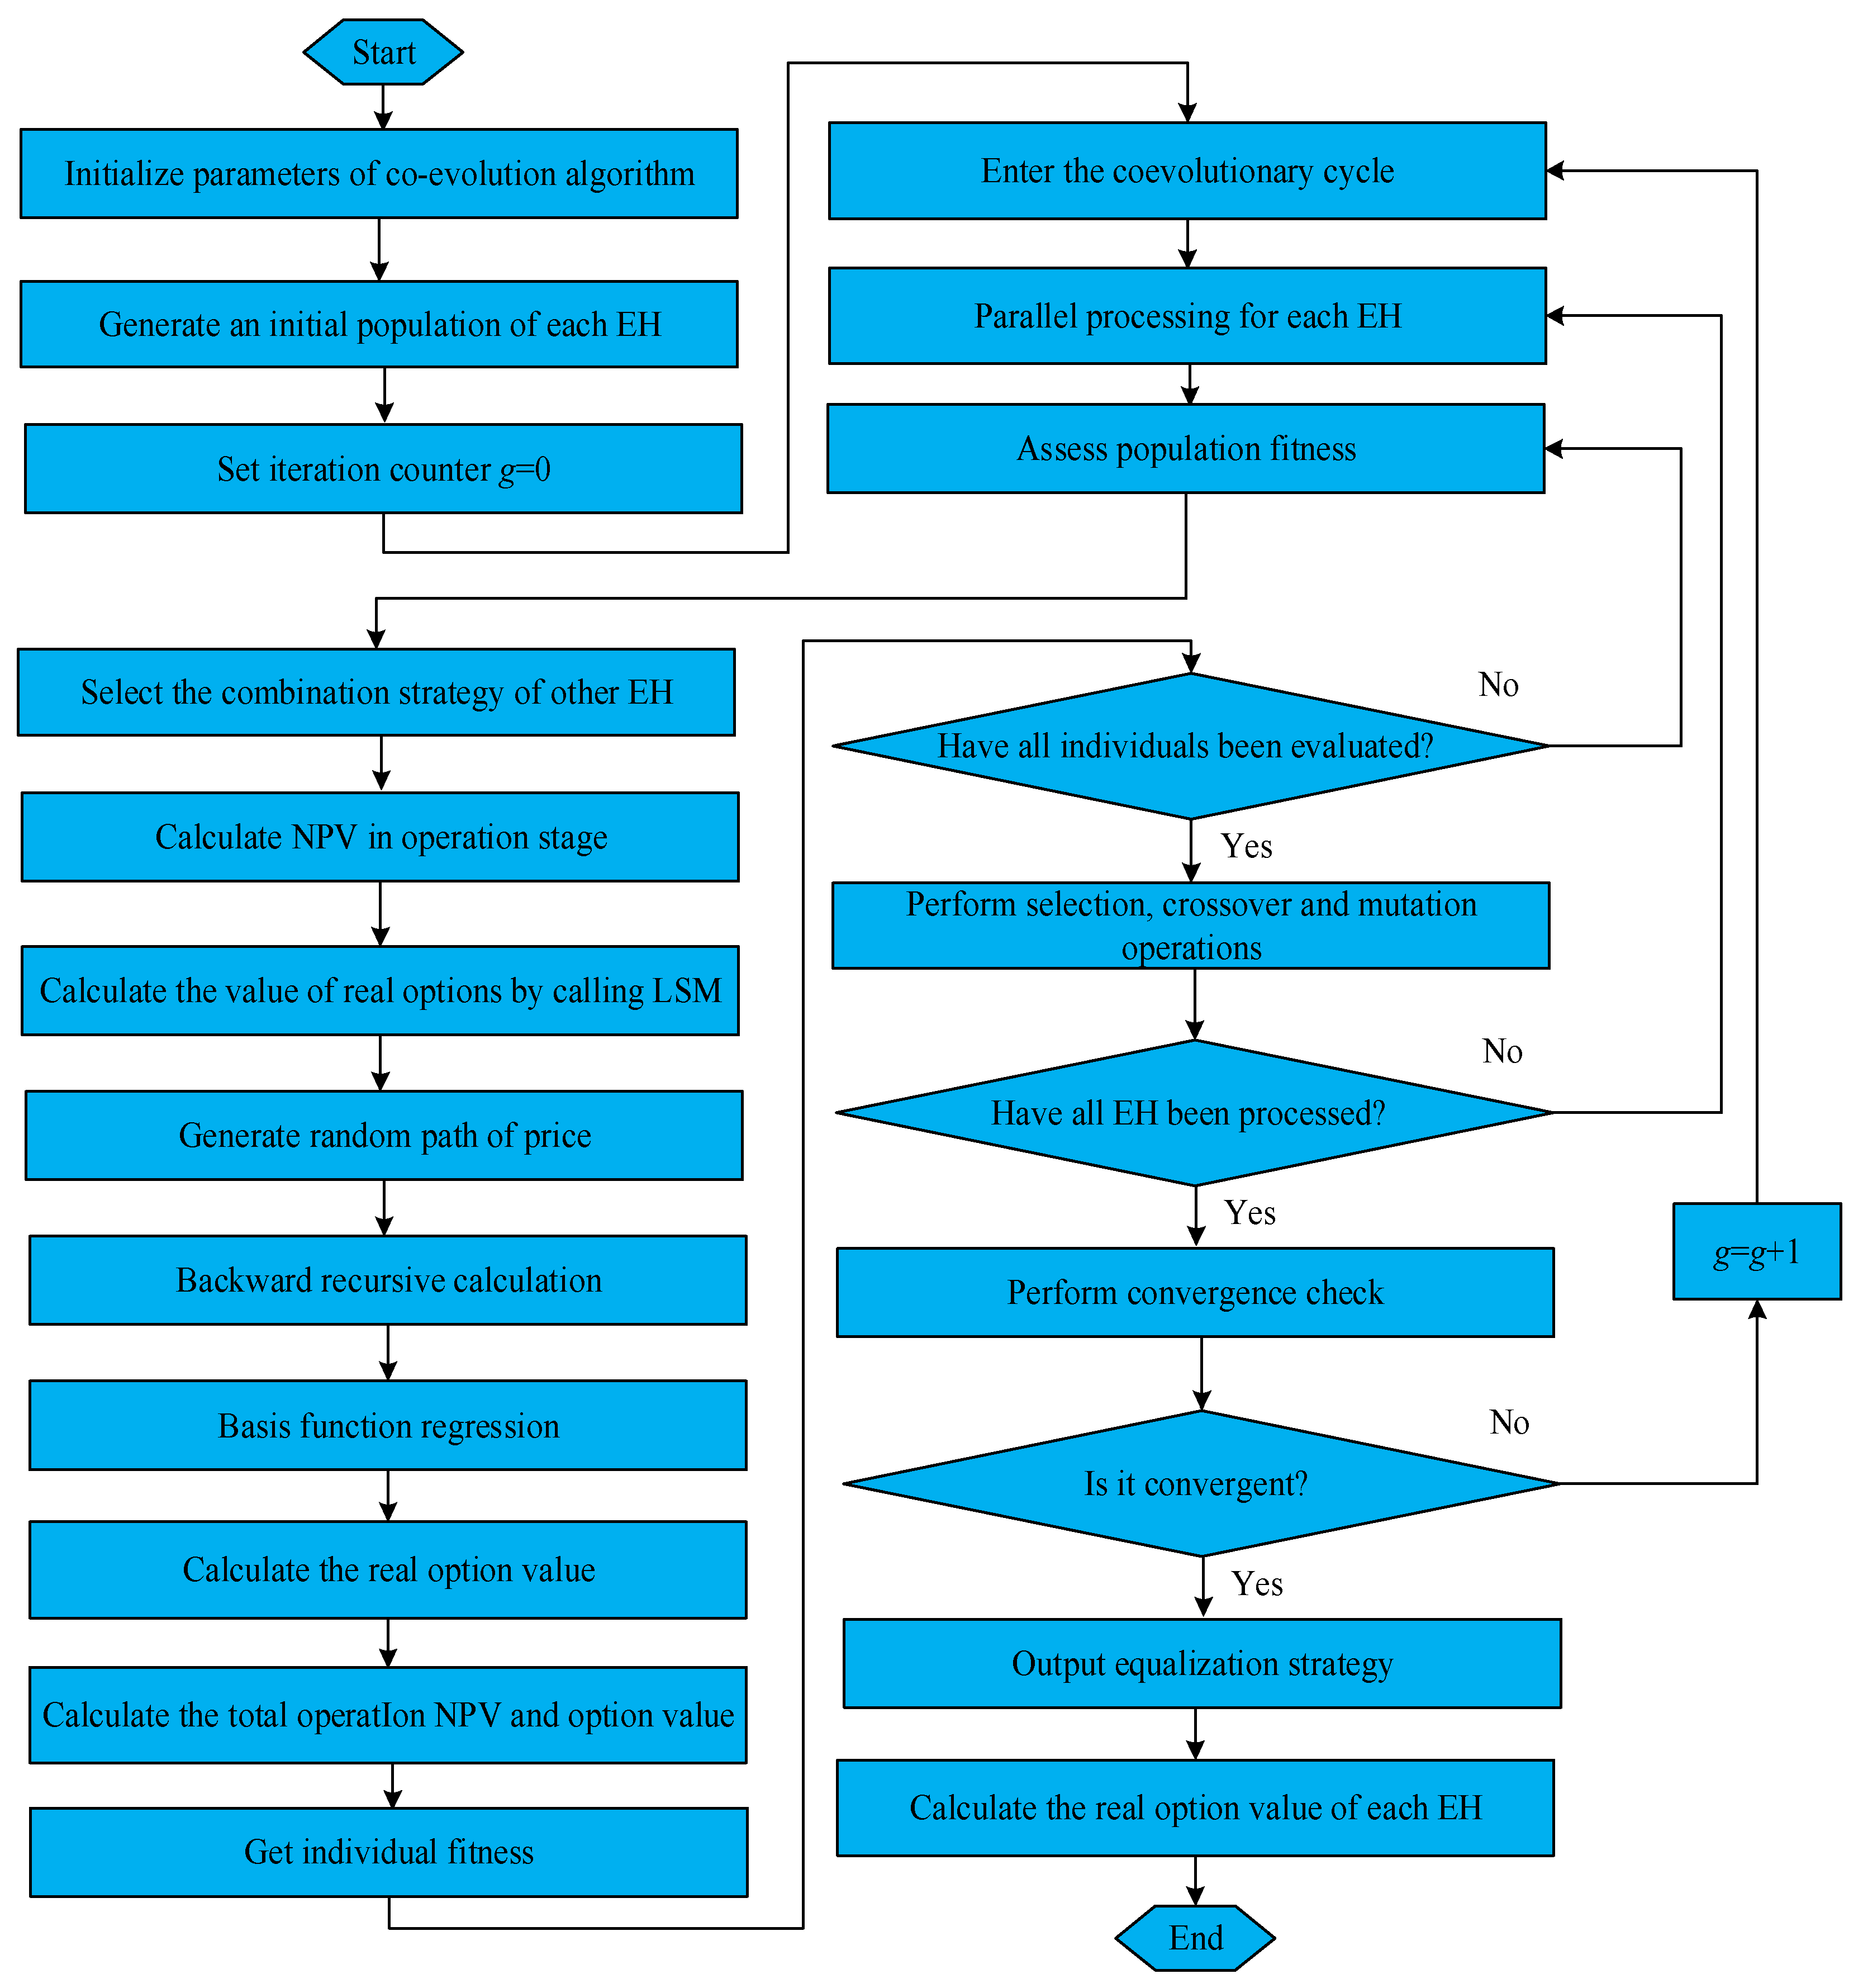
To solve the multi-energy-agent game model proposed in this paper, a nested algorithm framework structure is designed. In the outer layer, a co-evolutionary algorithm is employed to solve the equilibrium strategies for the multi-agent Bayesian game. In this algorithm, each agent has a population, and each individual within the population represents a strategy (including operational strategies and investment decisions). Through the co-evolutionary process, the populations of each agent are continuously updated until convergence to an equilibrium is achieved. In the inner layer, the LSM method is utilized to evaluate the real option values under given strategies. For each strategy of each agent, multiple random paths are simulated (taking into account uncertainties such as carbon prices and energy prices), and the LSM method is applied to calculate the values of delay options, expansion options, and abandonment options. The block diagram of the algorithm structure is shown in Figure 1, and the detailed calculation steps are as follows:
Figure 1.
Block diagram of the proposed nested algorithm framework structure.
Step 1: Initialization. Set the parameters for the co-evolutionary algorithm: population size is M, maximum number of generations is Gmax, convergence value is ε, crossover probability is Pc, and mutation probability is Pm. Set the LSM parameters: number of simulated paths is Npath, number of time steps is T, and basis functions is Fb.
Step 2: Generate the initial populations. For each agent i (i.e., i-th EH), randomly generate an initial population Pop,i of size M. Each individual represents a strategy, including operational decision variables (such as Pgrid,i, Ggrid,i, PP2G,i at each time step) and investment decision variables (such as the decision time points for ).
Step 3: Execute co-evolutionary iterations (iterative loop from g = 1 to Gmax).
Step 4: Perform the following operations for each agent i:
- (1)
- Fitness evaluation for each individual j in population Pop,i:
- Fix agent i’s strategy as individual j, and randomly select strategy combinations from the current populations of other agents.
- Calculate the fitness (i.e., the objective function value) of individual j under this strategy combination.
- Invoke the inner-layer LSM algorithm to calculate the real option value .
- Calculate the total objective function value, including the net present value of operational profits and the real option value.
- (2)
- Selection: select parent individuals using the roulette wheel selection method based on fitness.
- (3)
- Crossover: perform crossover operations on the selected parent individuals with probability Pc to generate offspring.
- (4)
- Mutation: perform mutation operations on the offspring individuals with probability Pm.
- (5)
- Form a new population: replace the old population with the newly generated offspring population.
- (6)
- Conduct convergence check: calculate the average strategy change for each agent’s population. If the change for all agents is less than ε, terminate the loop.
Step 5: Output the optimal strategy for each agent (i.e., the individual with the highest fitness in the population).
5. Numerical Test and Analysis
5.1. Basic Data and Simulation Conditions
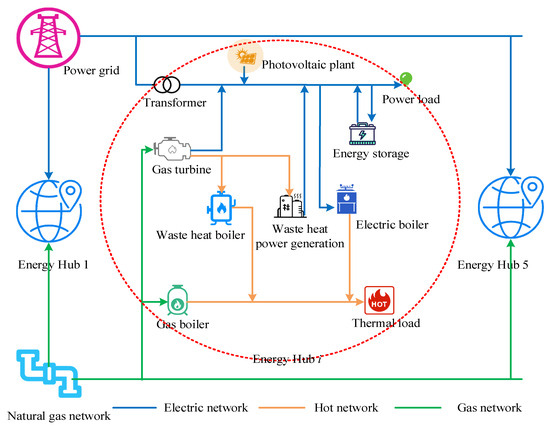
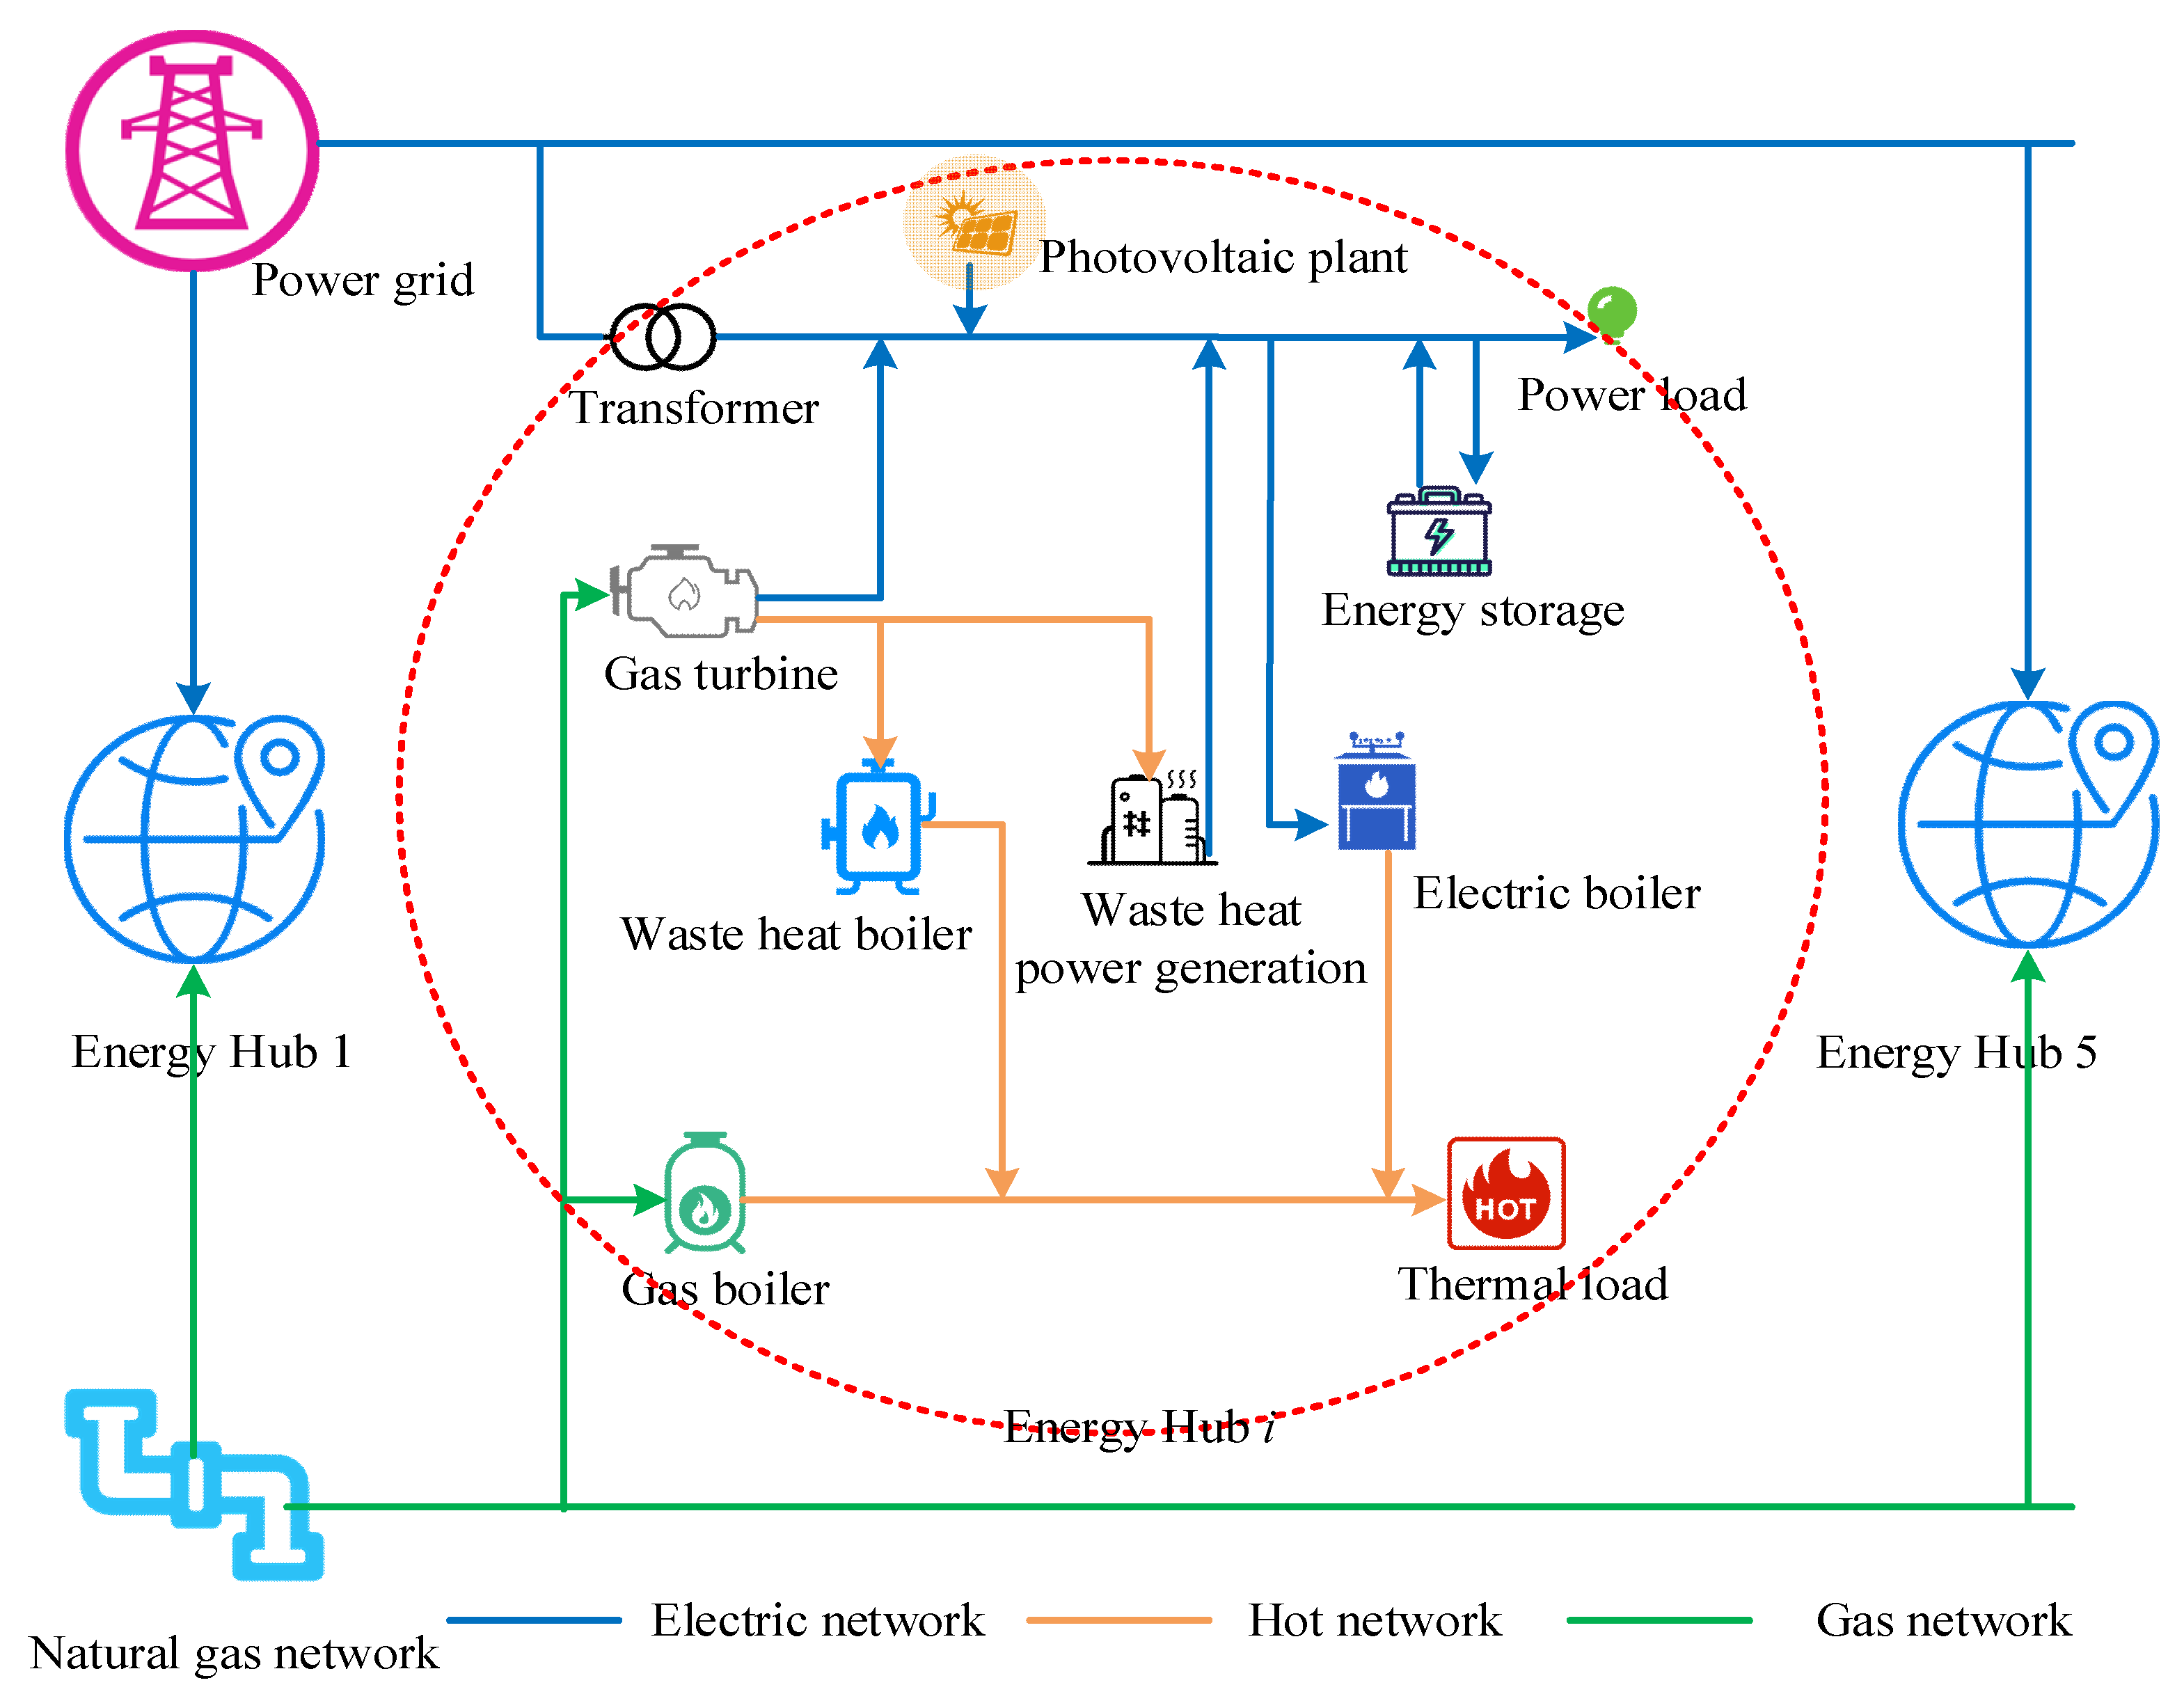
Consider an integrated energy system (IES) comprising five EHs, with a planning horizon of 10 years and each year serving as a time stage. Each EH has the option to invest in P2G technology and CCS technology, while also taking into account the carbon trading mechanism and environmental impacts. The structural diagram of an IES with 5 EHs is shown in Figure 2. The partial parameters of the energy hubs are shown in Table 1. The load characteristics and growth trend of each energy hub are shown in Table 2. The carbon emissions and quota allocation of each energy hub are shown in Table 3. Based on Intel(R) Core(TM) i5-1340P, 16 GB RAM, MATLAB R2020a, the simulation is carried out. The population size M of coevolutionary algorithm is set to 80, the maximum number of iterations Gmax is set to 120, the convergence threshold is set to 10−4, the crossover probability Pc is set to 0.75, and the mutation probability Pm is set to 0.12. Monte Carlo simulation path number Npath is set to 2000 and real option risk-free rate r is set to 0.03%.
Figure 2.
The structural diagram of an IES with 5 EHs.
Table 1.
The partial parameters of the energy hub.
Table 2.
The load characteristics and growth trend of each energy hub.
Table 3.
The carbon emission and quota allocation of each energy hub.
5.2. Simulation Results and Analysis
Conduct simulation comparisons on the following five methods, M1–M5, respectively, to verify the effectiveness of the multi-energy agent game planning method proposed in this paper.
Method 1: The traditional energy planning method [30];
Method 2: The stochastic planning method [31];
Method 3: The non-cooperative game planning method under complete information [32];
Method 4: The robust optimization planning method [33];
Method 5: The multi-energy agent game planning method considering real option value under incomplete information proposed in this paper.
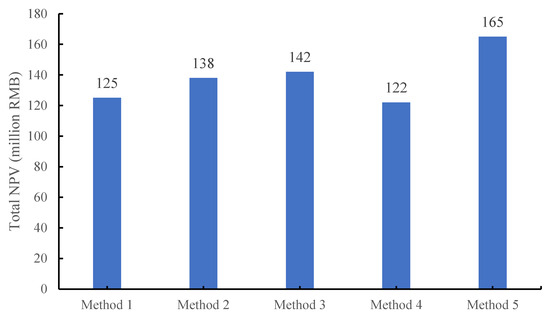
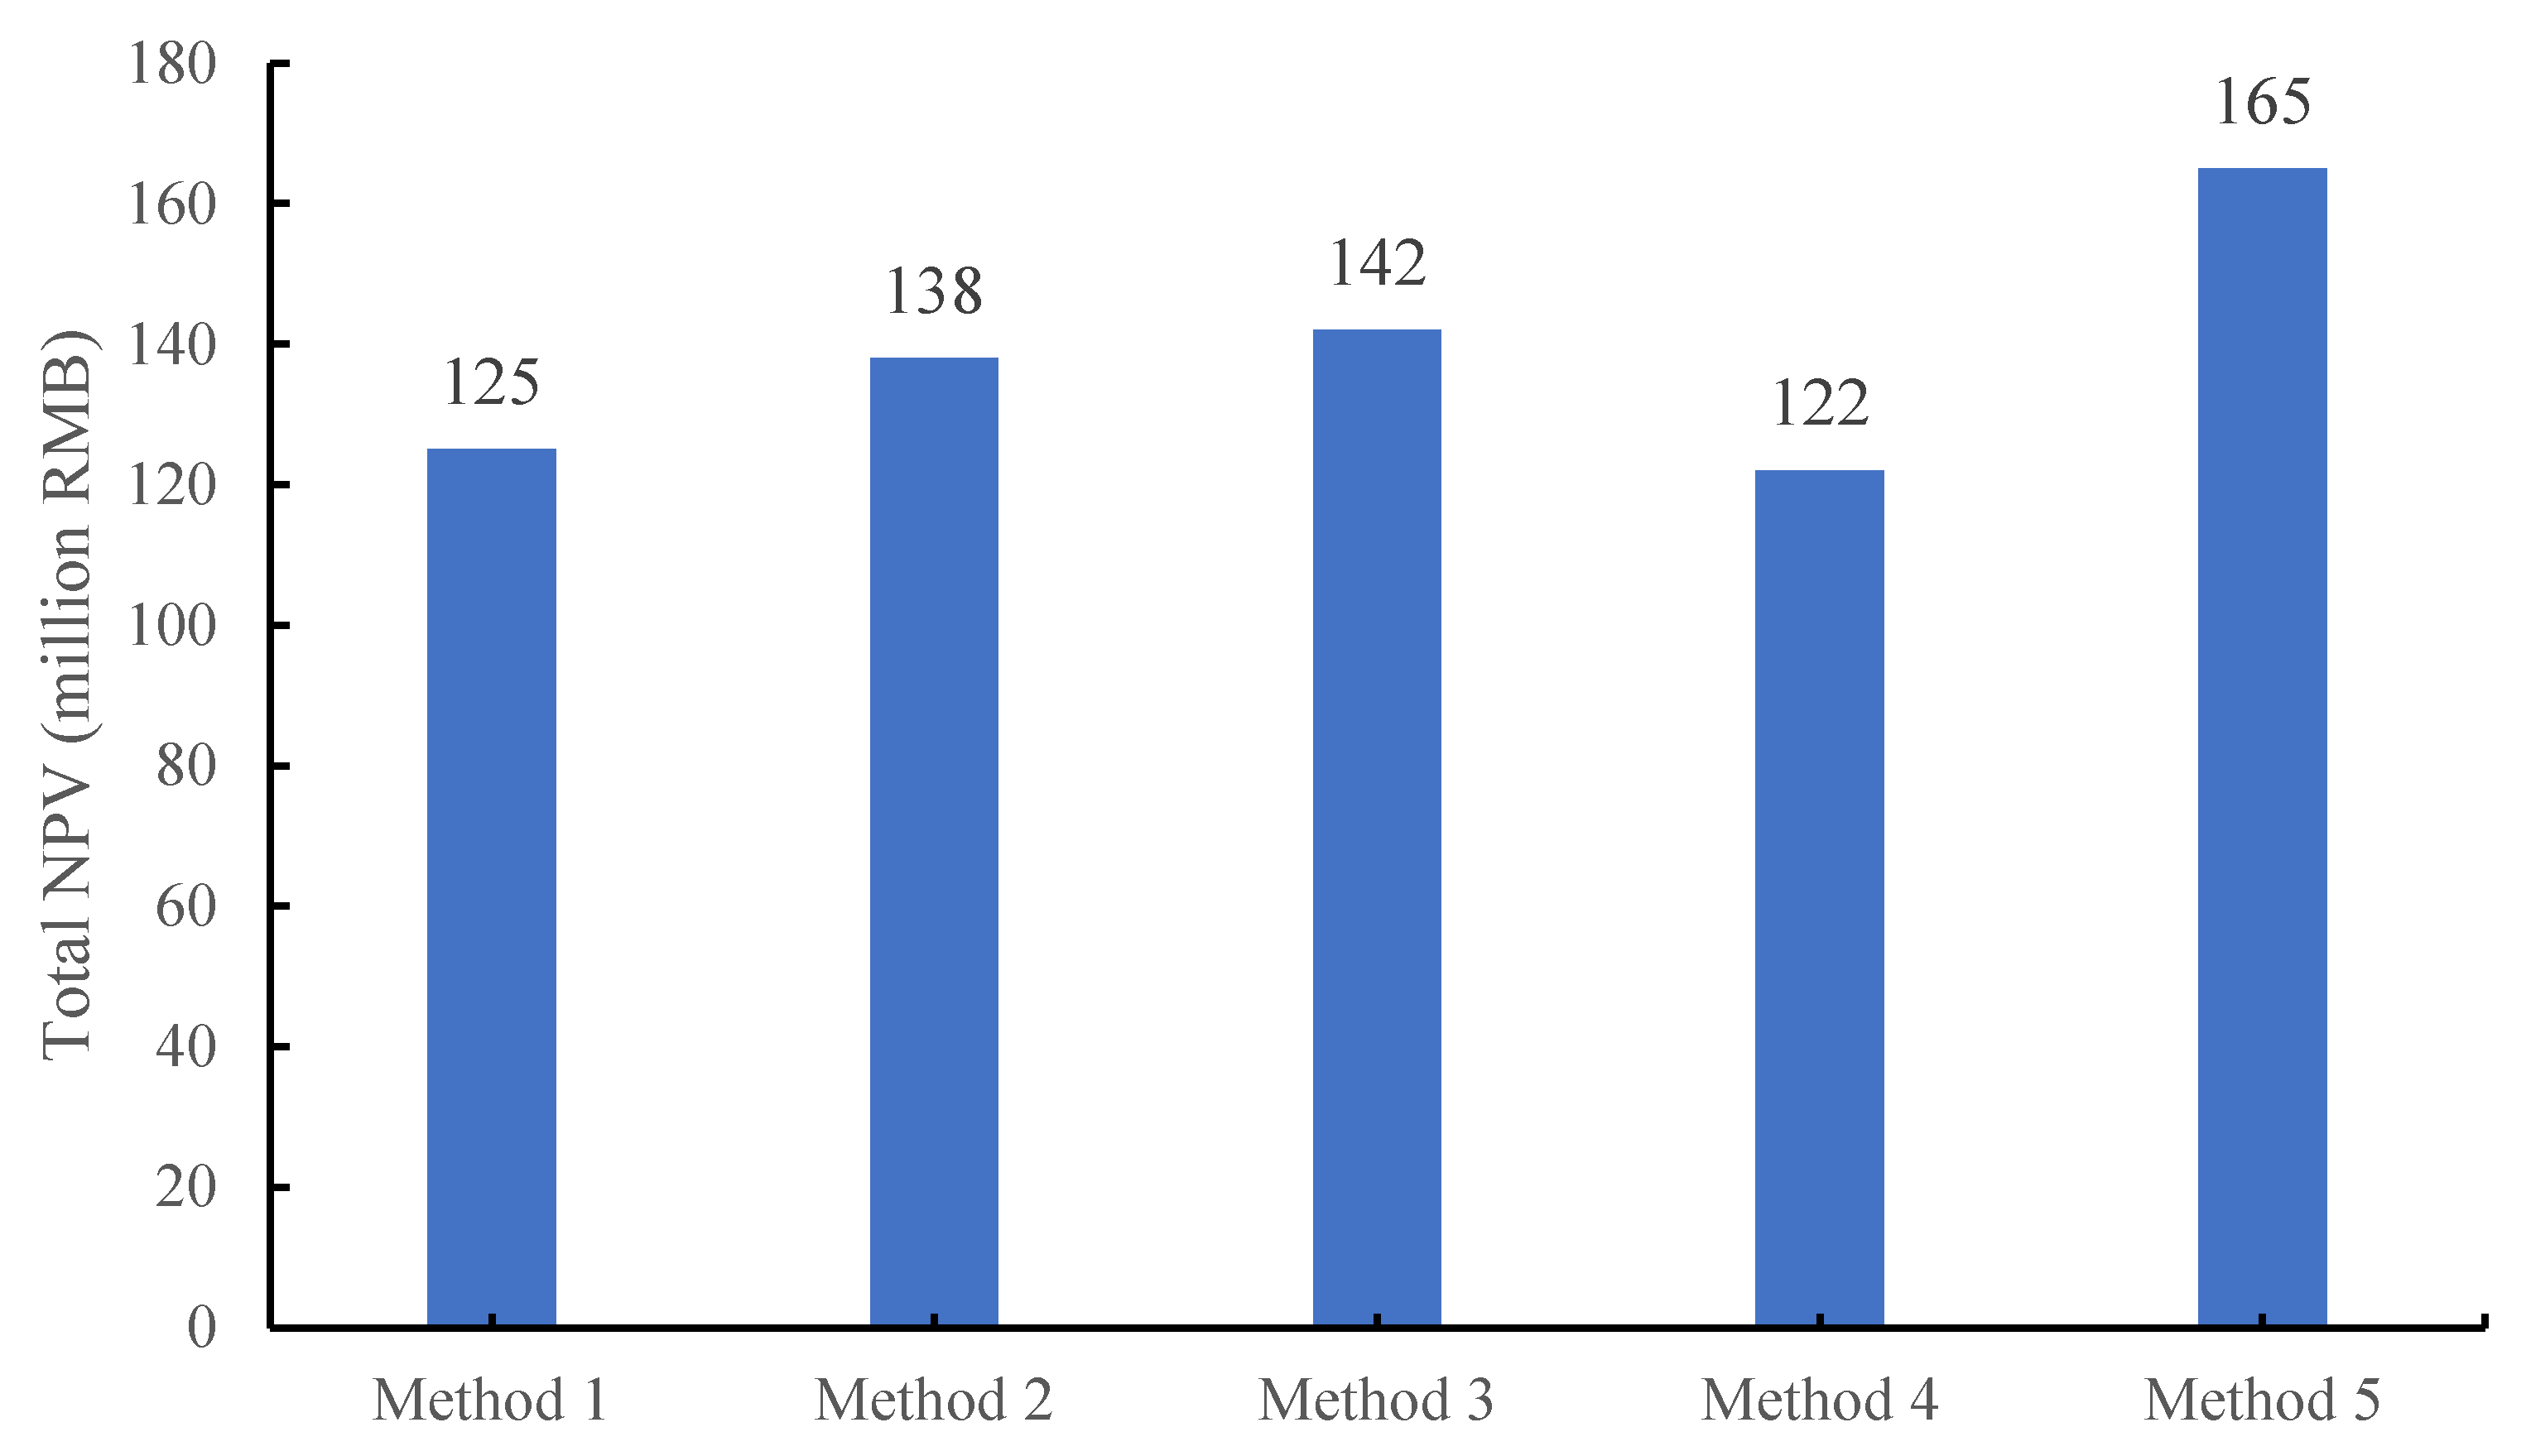
Taking 10 years as the planning period, the economic benefits of the above five methods are shown in Table 4, and Figure 3 shows a graphical comparison of the total NPV for each method. As can be seen from Table 4, since Method 1-Method 4 do not consider the real option value, all their values are 0, indicating that these four methods do not bring additional value in terms of dealing with uncertainty and flexibility. In contrast, the real option value of Method 5 proposed in this paper is 23 million RMB, giving it a certain advantage in coping with uncertainty. In terms of the comparison of the net present values (NPV) of each energy hub, the NPVs of Method 1 to Method 4 in EH1 to EH5 are relatively close with minor fluctuations. However, the NPV of Method 5 proposed in this paper in each energy hub are all higher than those of the other methods, showing a more outstanding performance. From the comparison of the total NPV in Figure 3, the total NPVs of Method 1 to Method 4 are 125, 138, 142, and 122 million RMB respectively, while the total NPV of Method 5 proposed in this paper is the highest at 165 million RMB. Therefore, on the whole, Method 5 proposed in this paper performs best in terms of economic returns. It not only has an advantage in real option value but also leads in the NPVs of each scenario and the total NPV. The returns of the other four methods are relatively lower with little difference among them.
Table 4.
The comparison of economic benefits for each method.
Figure 3.
The graphical comparison of the total NPV for each method.
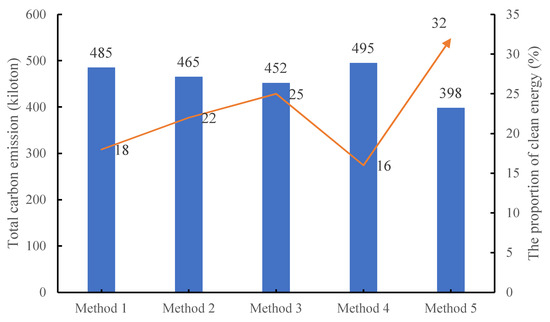
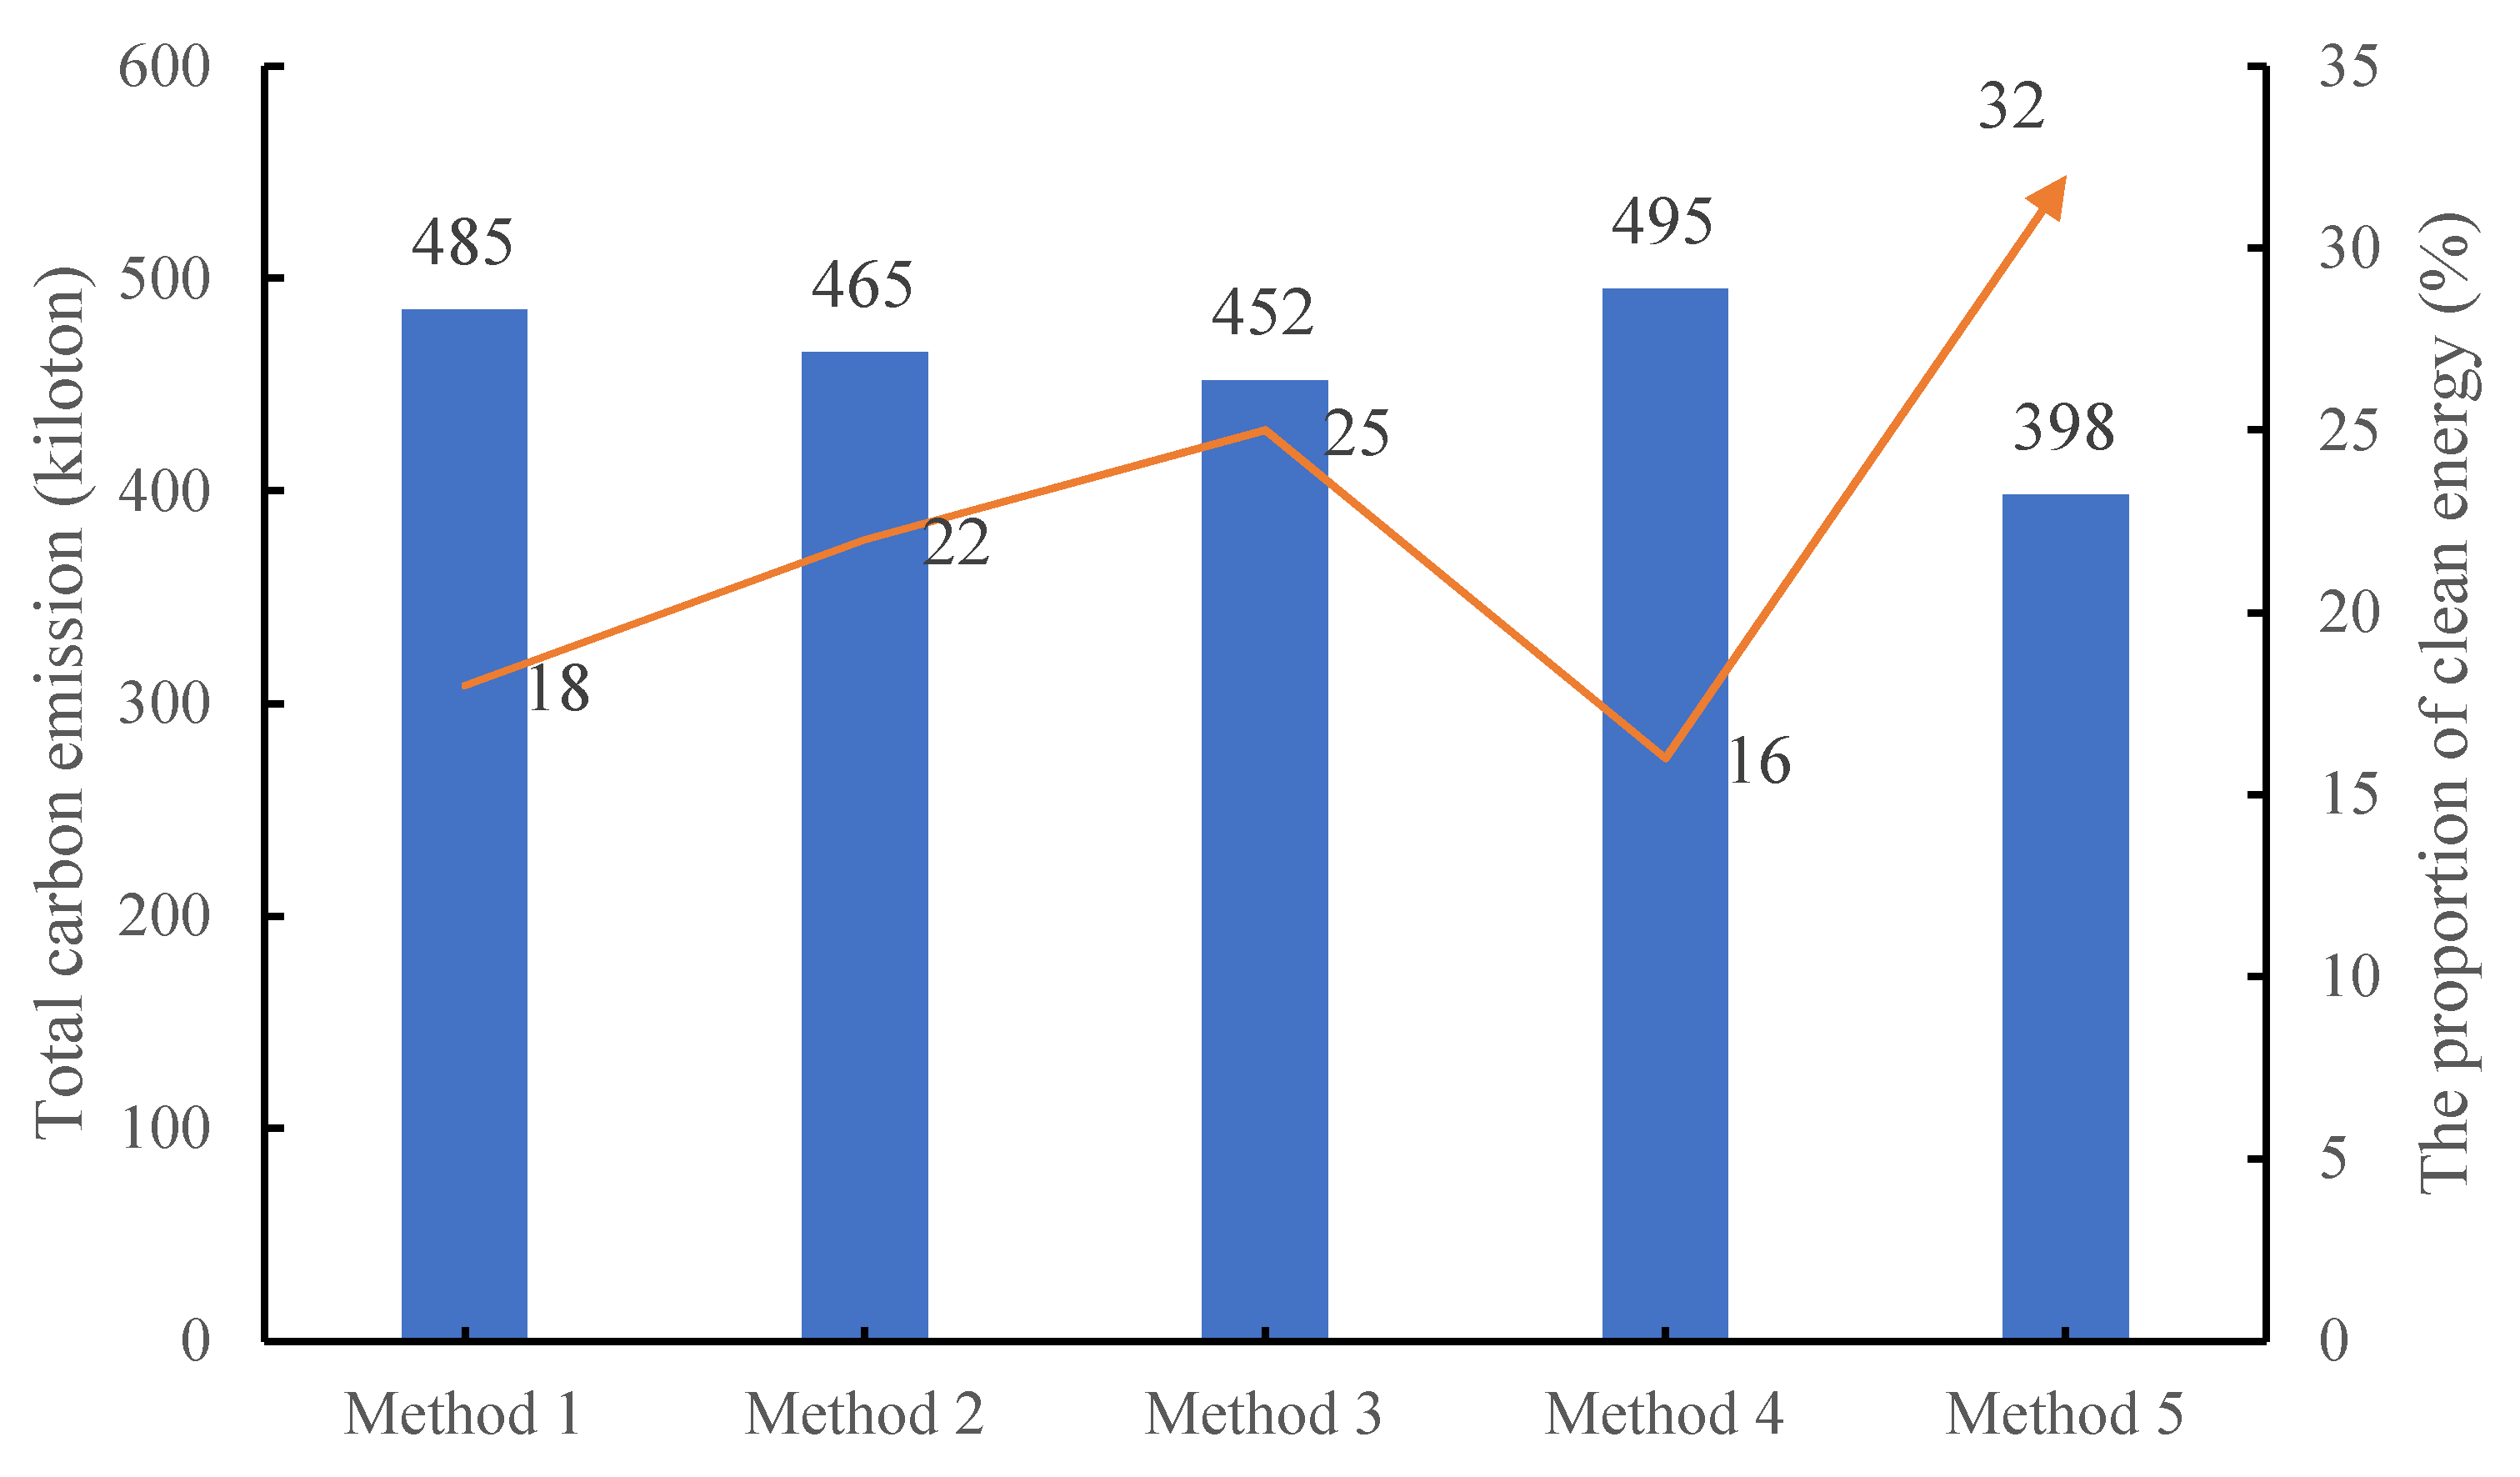
Figure 4 shows the comparison of environmental benefits for each method. From Figure 4, it is evident that in terms of total carbon emissions, Method 5 has the lowest value at 398 kilotons, while Method 4 has the highest at 495 kilotons, with Method 1, Method 2, and Method 3 falling in between at 485, 465, and 452 kilotons respectively. This indicates that Method 5 is the most effective in reducing overall carbon emissions among the five methods. Regarding the proportion of clean energy, Method 5 again leads with 32%, followed by Method 3 at 25%, Method 2 at 22%, Method 1 at 18%, and Method 4 at the lowest of 16%. This shows that Method 5 not only minimizes carbon emissions but also utilizes clean energy to a greater extent. In conclusion, Method 5 demonstrates superior environmental benefits compared to the other four methods, as it achieves both lower total carbon emissions and a higher proportion of clean energy usage.
Figure 4.
The comparison of environmental benefits for each method.
The comparison of technology portfolio results for each method is shown in Table 5. Table 5 reveals that Method 5 stands out in terms of equipment investment portfolio capacities across all categories. It has the highest capacities in P2G (14.5 MW), CCS (18.5 MW), PV (9.6 MW), and ES (6.7 MW), indicating a more robust and comprehensive investment in these key technologies compared to the other methods. Method 3 also shows relatively strong capacities, especially in CCS (14.8 MW), but falls short of Method 5 in the other areas. Method 2 has moderate capacities in all categories, while Method 1 and Method 4 generally have lower capacities, with Method 4 having the lowest in P2G (7.8 MW) and PV (5.4 MW). Overall, Method 5 demonstrates the most aggressive and balanced investment in the equipment portfolio, suggesting a potentially more efficient and effective approach, whereas the other methods show varying degrees of investment with room for improvement in enhancing their overall equipment capacities.
Table 5.
The comparison of technology portfolio results for each method.
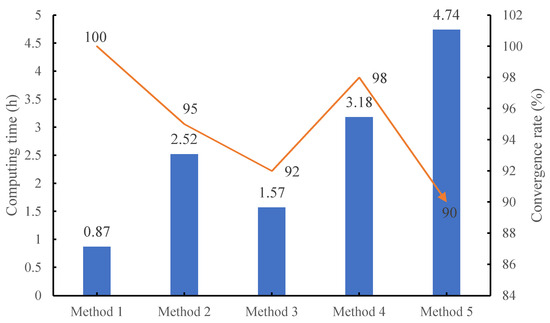
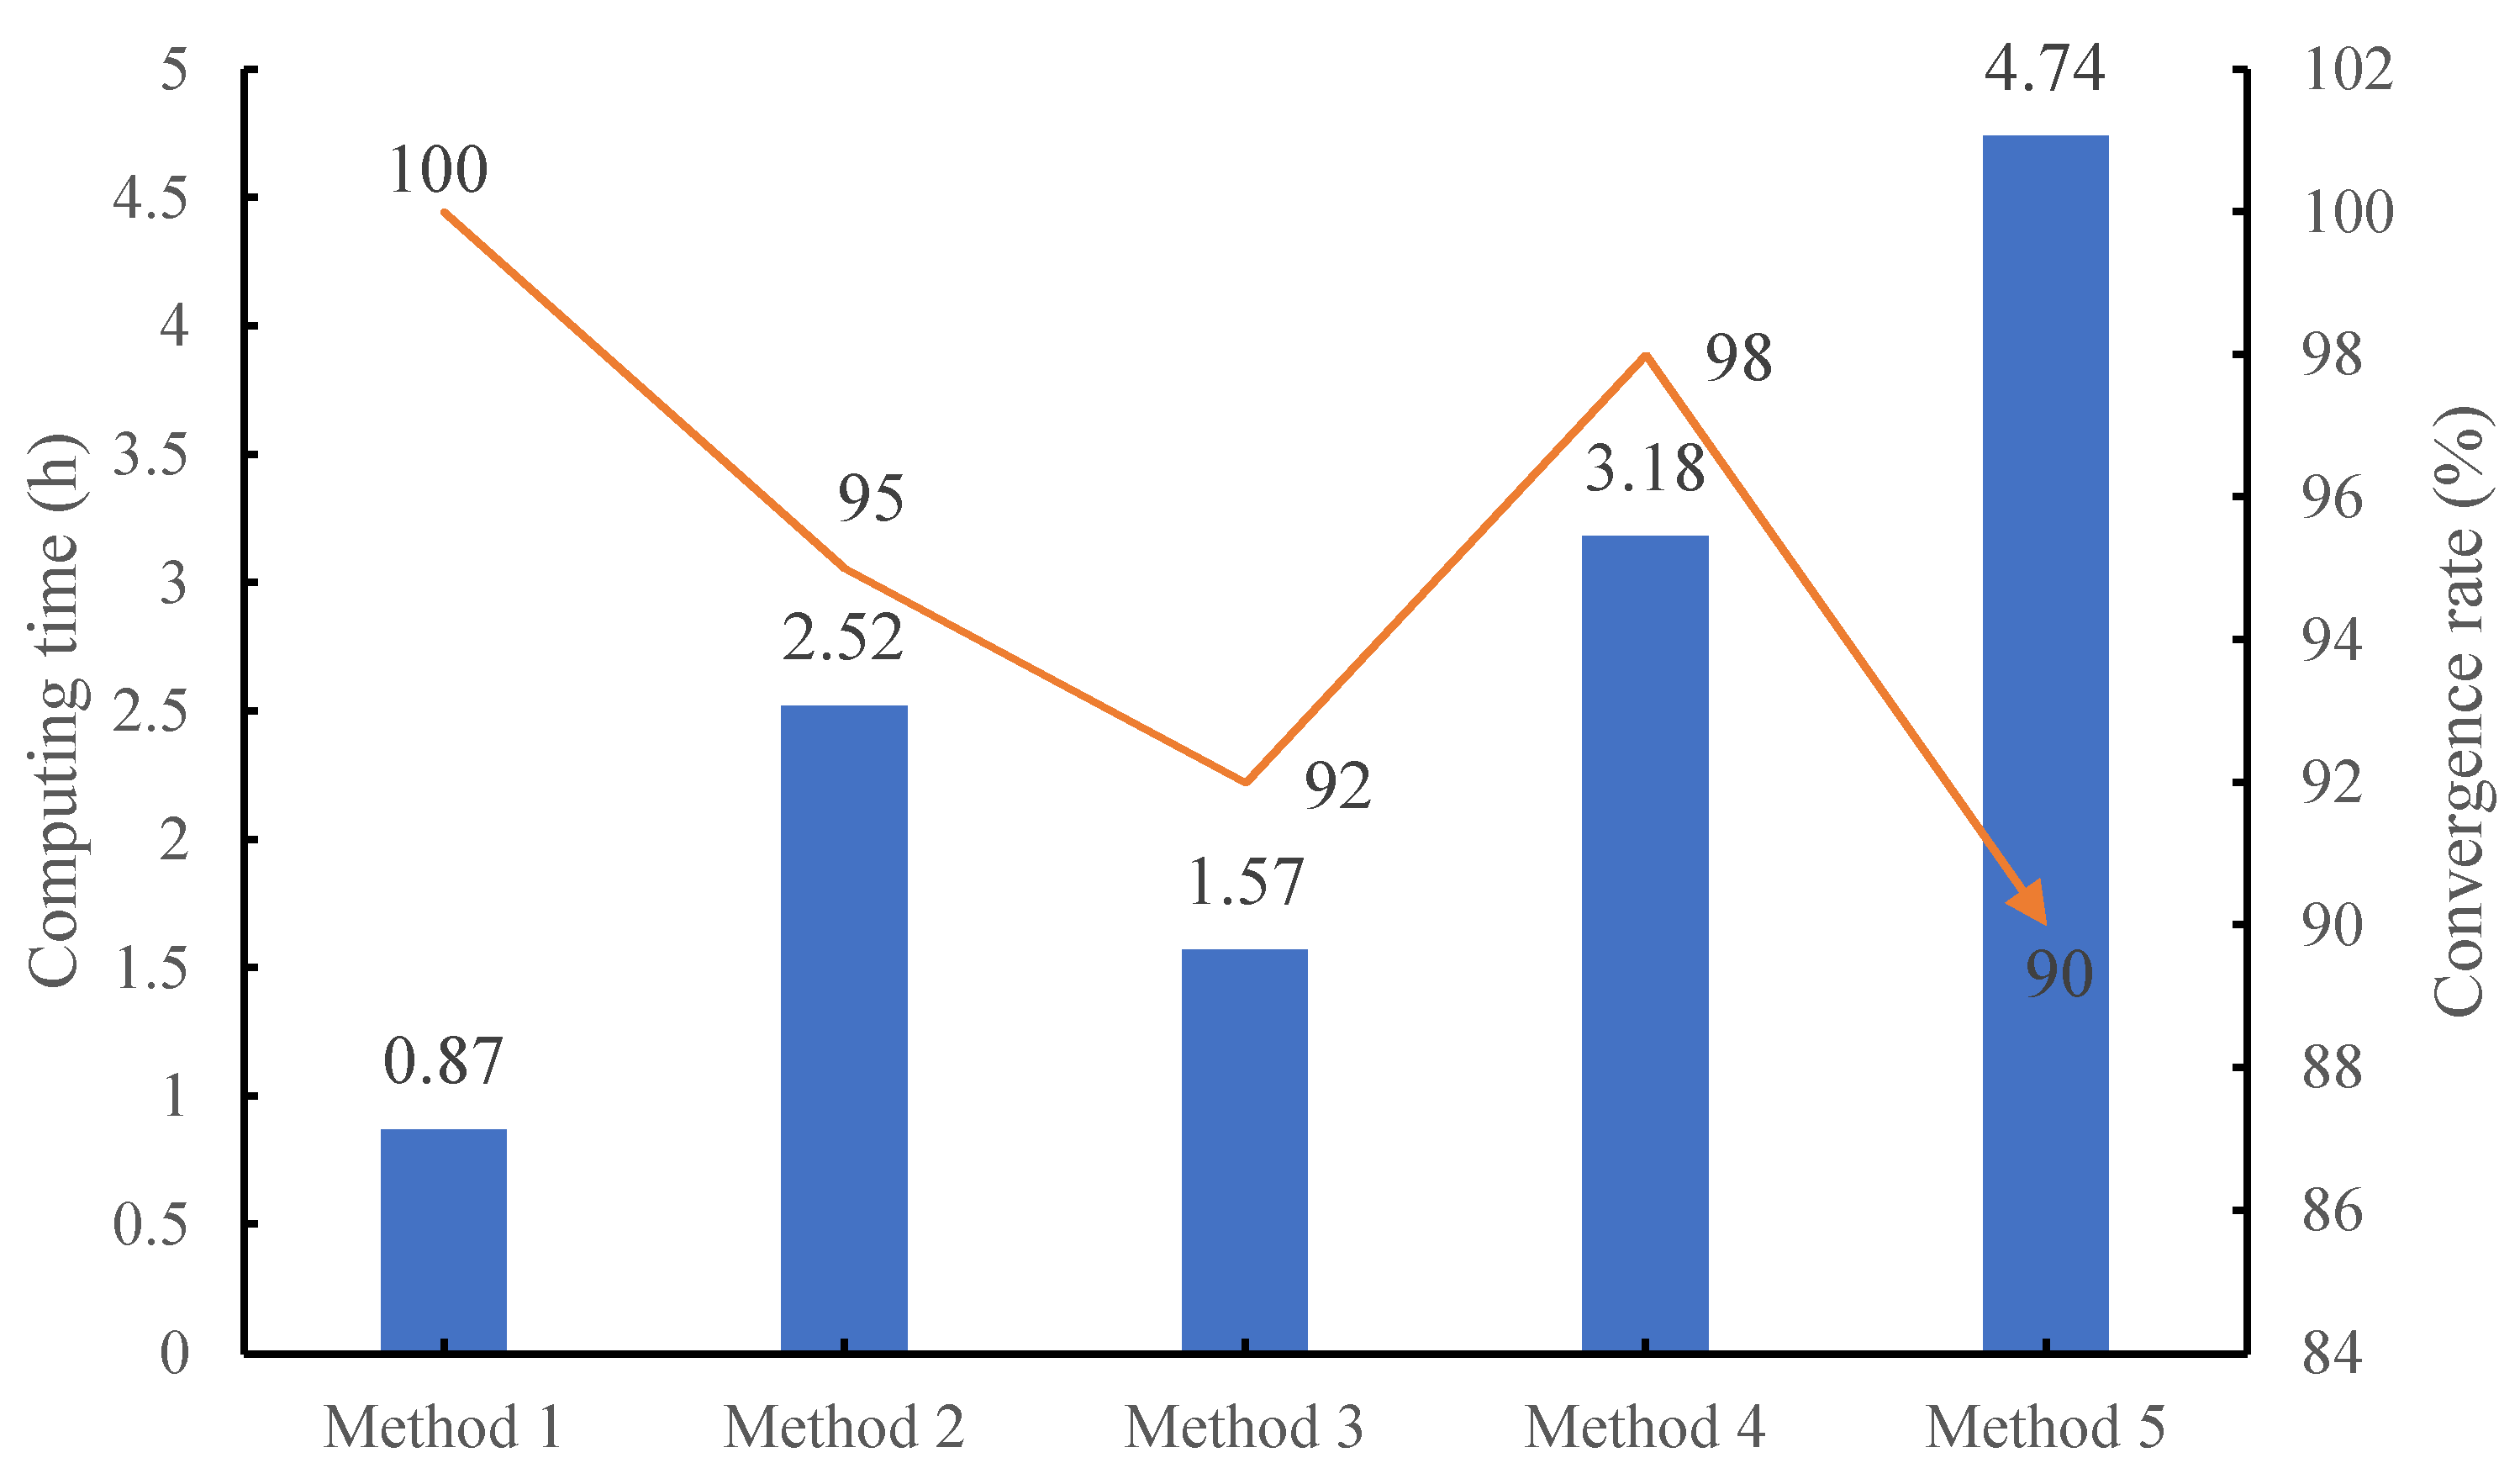
Figure 5 shows the comparison of calculation performance for each method. The table shows that Method 1 has the shortest computing time at 0.87 h and achieves a perfect convergence rate of 100%, indicating it is highly efficient and reliable in computations. Method 2 and Method 3 have longer computing times of 2.52 and 1.57 h respectively, with convergence rates slightly lower than Method 1 at 95% and 92%, suggesting a trade-off between computing time and convergence reliability. Method 4 has the longest computing time among the first four methods at 3.18 h but maintains a high convergence rate of 98%, showing it is still relatively reliable despite the longer processing duration. Method 5 has the longest computing time of 4.74 h and the lowest convergence rate of 90%, indicating it is the least efficient in terms of both computing time and convergence performance. Overall, Method 1 stands out as the most computationally efficient and reliable, while Method 5 lags behind the others in both aspects. Since this paper focuses on long-term planning research for multiple energy entities, the requirements for the computational time performance of the methods are not stringent. Therefore, even though Method 5 proposed in this paper has the lowest computational performance, it is still within an acceptable range.
Figure 5.
The comparison of calculation performance for each method.
In this paper, the uncertainty factors we primarily consider include carbon prices, energy prices (electricity and gas prices), and investment costs. For carbon prices, electricity prices, and gas prices, we assume they follow GBM, which is the most commonly used stochastic process model in energy commodity pricing and real options analysis. Regarding investment costs, we assume they adhere to the learning curve effect, meaning that as the cumulative installed capacity increases, the unit investment cost declines exponentially. In the sensitivity analysis presented in Table 6, we conducted deterministic perturbations of key parameters—that is, while keeping other parameters constant, we increased or decreased the target parameters by specific magnitudes (e.g., carbon price +30%, carbon price −30%, investment cost +20%, discount rate +2%) and then reran the model to observe the percentage change in NPV. Table 6 illustrates how key parameter variations impact the net present value (NPV) of five methods. When carbon price increases by 30%, Method 5 shows the highest positive influence on NPV at 18.67%, followed by Method 4, Method 3, Method 2, and Method 1, indicating that Method 5 is the most sensitive and benefits the most from a carbon price hike. Conversely, when carbon price decreases by 30%, Method 5 has the least negative impact on NPV at −9.28%, suggesting it is also more resilient to carbon price drops compared to the others. Regarding a 20% increase in investment cost, Method 1 experiences the largest NPV decline at −18.26%, while Method 5 has the smallest at −11.54%, showing Method 5 is less affected by higher investment costs. Finally, when the discount rate increases by 2%, Method 1 again sees the biggest NPV drop at −16.75%, and Method 5 the smallest at −13.62%, indicating Method 5 is relatively more stable under discount rate changes. Overall, Method 5 demonstrates superior sensitivity performance, being most responsive to favorable changes and most resilient to unfavorable ones, making it the most robust among the five methods.
Table 6.
The sensitivity analysis of key parameters for each method.
6. Conclusions
The method proposed in this paper constructs a multi-entity game planning model that considers environmental costs and carbon trading mechanisms. It employs Bayesian game methods to address the incomplete information issues among EH and utilizes multilateral incomplete information evolutionary game theory to analyze the dynamic interactive behaviors of market entities under different strategies. Meanwhile, by introducing P2G and CCS technologies, along with carbon trading mechanisms, it achieves a dual balance between economic and environmental aspects. Additionally, in response to investment uncertainty, this paper employs real options theory for evaluation and uses the proposed nested algorithm to obtain a solution, effectively balancing the interests of various entities and enhancing the comprehensive long-term investment returns. Although the computational time 4.74 h of the proposed method in this paper is the longest, it yields the best solution quality, with a total NPV of 165 million yuan, 16.2% higher than the 142 million yuan of the second-best method (i.e., Method 3, the non-cooperative game planning method under complete information). The simulation results demonstrate that the proposed method can accurately reflect the game behaviors of multiple energy entities under incomplete information. The generated optimized solutions closely align with real-world scenarios, significantly improving economic benefits while reducing environmental pollution. It provides a solid theoretical foundation and methodological support for the planning of IES involving multiple entities in electricity market environments. In the future, we will further study the scalability enhancement strategies such as parallel computing and surrogate models to facilitate the application of the method proposed in this paper to larger-scale real-world systems.
Author Contributions
Conceptualization, N.Y., Z.L. and L.Z.; methodology, N.Y. and Y.Z.; software, S.Y.; validation, Z.L., Y.W. and P.Z.; formal analysis, Y.W.; investigation, Z.L.; resources, P.Z., S.Y., L.Z. and Y.Z.; data curation, Z.L., Y.W. and P.Z.; writing—original draft preparation, Z.L.; writing—review and editing, Y.W., N.Y. and P.Z.; visualization, S.Y.; supervision, N.Y. and L.Z.; project administration, Z.L., Y.W. and N.Y. All authors have read and agreed to the published version of the manuscript.
Funding
This work is supported by the science and technology project of State Grid Shandong Electric Power Company: Research on Joint Planning Methods for Wide-Area Distributed Energy Systems Considering Flexible Weak Coupling (No. 520626250010).
Data Availability Statement
The original contributions presented in this study are included in the article. Further inquiries can be directed to the corresponding author.
Conflicts of Interest
Authors Zhipeng Lu, Yuejiao Wang, Pu Zhao and Song Yang were employed by State Grid Shandong Electric Power Company. The remaining authors declare that the research was conducted in the absence of any commercial or financial relationships that could be construed as a potential conflict of interest. The authors declare that this study received funding from State Grid Shandong Electric Power Company. The funder was not involved in the study design, collection, analysis, interpretation of data, the writing of this article or the decision to submit it for publication.
References
- Ouyang, D.; Li, J.; Li, G.; Ren, X.; Peng, Q. Decision-Making for Autonomous Vehicles in Multi-Scenarios With Global Map Model and Dynamic Safe Topological Structure. IEEE Trans. Intell. Transp. Syst. 2025, 26, 22106–22123. [Google Scholar] [CrossRef] [Scilit]
- Gong, X.; Lyu, P.; Wang, B. Cooperative Motion Planning and Decision Making for CAVs at Roundabouts: A Data-Efficient Learning-Based Iterative Optimization Method. IEEE Internet Things J. 2024, 11, 32205–32220. [Google Scholar] [CrossRef] [Scilit]
- Geisslinger, M.; Trauth, R.; Kaljavesi, G.; Lienkamp, M. Maximum Acceptable Risk as Criterion for Decision-Making in Autonomous Vehicle Trajectory Planning. IEEE Open J. Intell. Transp. Syst. 2023, 4, 570–579. [Google Scholar] [CrossRef] [Scilit]
- Yang, N.; Lin, D.; Ding, L.; Yang, C.; Zhang, L.; Yang, Y.; Ye, X.; Xiong, Z.; Huang, Y. Optimal Planning for Charging Stations within Multi-coupled Networks Considering Load-Balance Effects. Energy 2025, 336, 138481. [Google Scholar] [CrossRef] [Scilit]
- Zhao, X.; Li, C.; Tang, Y.; Lv, Y. An Integrated Decision-Making Method of Flexible Process Plan and Cutting Parameter Considering Dynamic Machining Resources. IEEE Trans. Autom. Sci. Eng. 2025, 22, 18184–18200. [Google Scholar] [CrossRef] [Scilit]
- Yang, B.; Zhou, Y.; Yan, Y.; Su, S.; Li, J.; Yao, W.; Li, H.; Gao, D.; Wang, J. A critical and comprehensive handbook for game theory applications on new power systems: Structure, methodology, and challenges. Prot. Control Mod. Power Syst. 2025, 10, 1–27. [Google Scholar] [CrossRef] [Scilit]
- Cui, C.; Li, B.; Chen, X. Group Decision-Making Method of Entry Policy During a Pandemic. Tsinghua Sci. Technol. 2024, 29, 56–65. [Google Scholar] [CrossRef] [Scilit]
- Liao, Y.; Yu, G.; Chen, P.; Zhou, B.; Li, H. Integration of Decision-Making and Motion Planning for Autonomous Driving Based on Double-Layer Reinforcement Learning Framework. IEEE Trans. Veh. Technol. 2024, 73, 3142–3158. [Google Scholar] [CrossRef] [Scilit]
- Yan, Q.; Ma, R.; Dong, X.; Ma, R.; An, C. Joint source-grid-storage planning method considering coupling relationship of water abandonment events. Prot. Control Mod. Power Syst. 2025, 10, 121–131. [Google Scholar] [CrossRef] [Scilit]
- Yang, N.; Xiong, Z.; Ding, L.; Liu, Y.; Wu, L.; Liu, Z.; Shen, X.; Zhu, B.; Li, Z.; Huang, Y. A Game-Based Power System Planning Approach Considering Real Options and Coordination of All Types of Participants. Energy 2024, 312, 133400. [Google Scholar] [CrossRef] [Scilit]
- Hu, D.; Qin, R.; Huang, T.; Yang, J.; Ma, X. Wind Power Integrated with Thermal System Multi-objective Optimal Dispatch Based on Immune Memory Particle Swarm Optimization Algorithm. High Volt. Appar. 2015, 51, 20–26+30. [Google Scholar] [CrossRef]
- Liu, W.; Liu, H.; Zheng, L.; Huang, Z.; Ma, J. Synergizing Decision Making and Trajectory Planning Using Two-Stage Optimization for Autonomous Vehicles. IEEE Trans. Veh. Technol. 2025, 74, 5489–5503. [Google Scholar] [CrossRef] [Scilit]
- Yang, N.; Hao, J.; Li, Z.; Ye, D.; Xing, C.; Zhang, Z.; Wang, C.; Huang, Y.; Zhang, L. Data-Driven Decision-Making for SCUC: An Improved Deep Learning Approach Based on Sample Coding and Seq2Seq Technique. Prot. Control Mod. Power Syst. 2025, 10, 13–24. [Google Scholar] [CrossRef] [Scilit]
- Chen, X.; Zheng, J.; Hu, Q. A Hybrid Planning Method for 3D Autonomous Exploration in Unknown Environments With a UAV. IEEE Trans. Autom. Sci. Eng. 2024, 21, 5713–5724. [Google Scholar] [CrossRef] [Scilit]
- Wu, Y.; Shen, Z.; Wu, K. Distribution Network Planning Method Considering Distribution System Operators and Multi-agent Game. High Volt. Appar. 2025, 61, 209–218. [Google Scholar] [CrossRef]
- Wan, T.; Tao, Y.; Qiu, J.; Lai, S. Distributed Energy and Carbon Emission Right Trading in Local Energy Systems Considering the Emission Obligation on Demand Side. IEEE Syst. J. 2023, 17, 6292–6301. [Google Scholar] [CrossRef] [Scilit]
- Li, Q.; He, M.; Tang, X.; Lee, W.-J.; Zhang, Z. Capacity Configuration in Integrated Energy Production Unit Considering Ladder-Type Carbon Trading Under CCER Quota. IEEE Trans. Ind. Appl. 2025, 61, 884–894. [Google Scholar] [CrossRef] [Scilit]
- Yan, X.; Gu, C.; Zhang, H.; Liu, N.; Li, F.; Song, Y. Network Pricing With Investment Waiting Cost Based on Real Options Under Uncertainties. IEEE Trans. Power Syst. 2023, 38, 427–435. [Google Scholar] [CrossRef] [Scilit]
- Aguiar, N.; Gupta, V.; Khargonekar, P.P. A Real Options Market-Based Approach to Increase Penetration of Renewables. IEEE Trans. Smart Grid 2020, 11, 1691–1701. [Google Scholar] [CrossRef] [Scilit]
- Hai, X.; Zhu, Z.; Liu, Y.; Khong, A.W.H.; Wen, C. Resilient Real-Time Decision-Making for Autonomous Mobile Robot Path Planning in Complex Dynamic Environments. IEEE Trans. Ind. Electron. 2025, 72, 11551–11562. [Google Scholar] [CrossRef] [Scilit]
- Ma, X.; Shen, Y.; Liu, P.; Zhan, J. Recent Advances, Critical Reflections, and Future Directions in Large-Scale Group Decision-Making: A Comprehensive Survey. IEEE Trans. Syst. Man Cybern. Syst. 2025, 55, 9816–9835. [Google Scholar] [CrossRef] [Scilit]
- Yang, N.; Shen, X.; Liang, P.; Ding, L.; Yan, J.; Xing, C.; Wang, C.; Zhang, L. Spatial-temporal Optimal Pricing for Charging Stations: A Model-Driven Approach Based on Group Price Response Behavior of EVs. IEEE Trans. Transp. Electrif. 2024, 10, 8869–8880. [Google Scholar] [CrossRef] [Scilit]
- Yang, J. Applying Generalized Planning to Non-Markovian Problems: A Case Study of the Justified Perspectives Model in Epistemic Planning. IEEE Access 2024, 12, 172266–172279. [Google Scholar] [CrossRef] [Scilit]
- Zhang, S.; Zhuang, W.; Li, B.; Li, K.; Xia, T.; Hu, B. Integration of Planning and Deep Reinforcement Learning in Speed and Lane Change Decision-Making for Highway Autonomous Driving. IEEE Trans. Transp. Electrif. 2025, 11, 521–535. [Google Scholar] [CrossRef] [Scilit]
- Han, Z.; Yao, X.; Li, C.; Yuan, S.; Dong, Y.; Ma, S. Optimal Dispatch Strategy of Wind-Hydrogen Coupling System Considering Stepped Carbon Trading Mechanism. IEEE Trans. Appl. Supercond. 2024, 34, 5702104. [Google Scholar] [CrossRef] [Scilit]
- Chen, X.; Liu, L.; Kang, X.; Ma, X.; Li, X.; Li, S.; Zhao, B.; Zhang, Y.; Liu, X. Three-layer game multi-objective optimization scheduling strategy of integrated energy systems considering the ULDs. Smart Power Energy Secur. 2025, 1, 154–164. [Google Scholar] [CrossRef] [Scilit]
- Zhou, Y.; Ma, Z.; Wang, T.; Zhang, J.; Shi, X.; Zou, S. Joint Energy and Carbon Trading for Multi-Microgrid System Based on Multi-Agent Deep Reinforcement Learning. IEEE Trans. Power Syst. 2024, 39, 7376–7388. [Google Scholar] [CrossRef] [Scilit]
- Liang, Z.; Chung, C.; Wang, Q.; Chen, H.; Yang, H.; Wu, C. Fortifying renewable-dominant hybrid microgrids: A bi-directional converter based interconnection planning approach. Engineering 2025, 51, 130–143. [Google Scholar] [CrossRef] [Scilit]
- Yan, N.; Ma, G.; Li, X.; Guerrero, J.M. Low-Carbon Economic Dispatch Method for Integrated Energy System Considering Seasonal Carbon Flow Dynamic Balance. IEEE Trans. Sustain. Energy 2023, 14, 576–586. [Google Scholar] [CrossRef] [Scilit]
- Li, X.; Ju, Y.; Ju, D.; Zhang, W.; Dong, P.; Wang, A. Multi-Attribute Group Decision Making Method Based on EDAS Under Picture Fuzzy Environment. IEEE Access 2019, 7, 141179–141192. [Google Scholar] [CrossRef] [Scilit]
- Gao, F.; Hou, H.; Dong, Z.Y.; Tang, J.; Yan, Y.; Zhang, J.; Xie, C. A two-stage resilience planning for integrated electricity-gas energy system considering hydrogen refueling stations during typhoons. Smart Power Energy Secur. 2025, 1, 25–35. [Google Scholar] [CrossRef] [Scilit]
- Duan, J.; Sun, Q.; Wu, C.; Yang, Y.; Tu, S. Non-Cooperative Game Based Optimal Dispatch Model for Integrated Energy Systems. CSEE J. Power Energy Syst. 2024, 10, 1195–1207. [Google Scholar] [CrossRef] [Scilit]
- Ge, L.; Li, Y.; Yan, J. Adjustable Robust Optimization for Large-Scale Photovoltaics Planning in Smart Distribution Networks. IEEE Trans. Sustain. Comput. 2025, 10, 717–729. [Google Scholar] [CrossRef] [Scilit]

Disclaimer/Publisher’s Note: The statements, opinions and data contained in all publications are solely those of the individual author(s) and contributor(s) and not of MDPI and/or the editor(s). MDPI and/or the editor(s) disclaim responsibility for any injury to people or property resulting from any ideas, methods, instructions or products referred to in the content. |
© 2026 by the authors. Licensee MDPI, Basel, Switzerland. This article is an open access article distributed under the terms and conditions of the Creative Commons Attribution (CC BY) license.