Abstract
The coupling of electricity, heat, and hydrogen subsystems together with carbon capture technologies introduces complex operational interactions in modern multi-energy systems. Existing game-based scheduling studies mainly focus on electricity–heat or electricity–heat–gas coupling, often neglecting hydrogen blending, carbon capture integration, and strategic coordination among heterogeneous stakeholders. To address these gaps, this study develops a game-theoretic hierarchical optimization framework for electricity–heat–hydrogen integrated energy systems incorporating carbon capture. Compared with conventional multi-energy game models, the proposed framework integrates hydrogen blending and carbon capture into a unified electricity–heat–hydrogen–carbon coupling structure, enabling coordinated low-carbon operation. A Stackelberg leader–follower structure is adopted, where the upper-level operator determines electricity and heat prices, and lower-level participants optimize generation dispatch and demand response accordingly. The bi-level model is transformed into an equivalent single-level formulation using Karush–Kuhn–Tucker conditions and solved through a hybrid particle swarm optimization–mathematical programming approach. Simulation results based on an extended IEEE 30-bus system demonstrate improved coordination, enhanced scheduling flexibility, and reduced operating costs and carbon emissions. Compared with centralized optimization, the proposed framework enables the integrated energy operator and energy supplier to achieve revenues of 3.18 × 10⁵ CNY and 3.95 × 10⁵ CNY, respectively, while reducing the load aggregator’s cost by 41.71%, confirming its effectiveness for coordinated low-carbon IES scheduling.
1. Introduction
The ongoing transformation of energy systems and the growing emphasis on low-carbon development have highlighted the importance of coordinated operation among multiple energy carriers. Traditional electricity-centered energy systems are increasingly insufficient to accommodate diversified energy demand and flexible regulation requirements. In this context, integrated energy systems (IES), which couple electricity, heat, cooling, hydrogen, and natural gas while enabling coordinated operation of generation, networks, loads, and storage, have emerged as an effective technical pathway for multi-energy integration. By facilitating large-scale renewable energy utilization and enhancing complementarities among different energy carriers, IES provide improved operational flexibility and resource allocation efficiency. Consequently, developing structured optimization approaches for coordinated scheduling in multi-energy systems has become an important research focus [1].
Within IES, energy carriers are intertwined through complex spatiotemporal couplings, while interactions among participating stakeholders are increasingly strategic. Conventional single-objective and centralized optimization approaches fall short of capturing both the cooperative dynamics across multiple energy carriers and the competitive behaviors among heterogeneous participants. For example, Li et al. [2] reformulated the co-optimization problem of distribution system operator revenue and virtual power plant costs into a single-level optimization, but did not account for multi-energy interactions or storage integration. Similarly, Xu and Li [3] transformed the energy-carbon co-optimization in virtual power plants into a single-level optimization, yet overlooked the impact of technologies like hydrogen and storage. In scenarios involving demand response, storage dispatch, carbon emission constraints, and energy trading mechanisms, system scheduling problems exhibit pronounced nonlinearity and nested hierarchical structures. Therefore, designing optimization frameworks that can simultaneously reflect multi-energy coupling, low-carbon technology integration, and multi-agent strategic interaction remains a key scientific challenge.
Game-theoretic methods have recently been widely adopted for addressing such challenges in energy system optimization. Among them, the Stackelberg leader–follower game model, with its explicit hierarchical decision-making structure, provides a powerful framework to capture the strategic interactions between system operators and user-side participants [4]. However, existing hierarchical game models exhibit notable limitations. Most studies focus on electricity price-driven demand response or electricity–heat trading, with limited integration of hydrogen blending and carbon capture, thereby failing to fully reflect the low-carbon transition potential at the strategic level. In addition, many models simplify the participant structure to two-agent interactions, which cannot adequately capture multi-role coordination among operators, suppliers, and aggregators. Furthermore, some studies emphasize system-level cost minimization while insufficiently addressing market-oriented pricing mechanisms and profit redistribution among stakeholders. These shortcomings limit the applicability of current hierarchical game models in complex low-carbon multi-energy systems [5].
These limitations can be further illustrated through representative recent studies. For example, Wei et al. [6] introduced a Stackelberg-based carbon reduction incentive mechanism in IES, combining green electricity with carbon offsetting, yet it did not consider the impact of emerging low-carbon technologies such as storage and hydrogen systems on the game outcome. Similarly, Li et al. [7] proposed a bi-level Stackelberg model to analyze multi-energy trading but restricted the energy types to electricity and heat, without incorporating hydrogen or carbon capture. In addition, Wang et al. [8] developed a Stackelberg scheduling framework for multi-community IES under wind and solar uncertainty and load fluctuations, using a two-stage stochastic model. However, its game model involved only two participant roles and lacked the dimensional richness required for complex energy cooperation, while its solution method did not integrate heuristic optimization, limiting applicability to high-dimensional problems.
Against this backdrop, this paper develops a hierarchical game-theoretic optimization framework for electricity–heat–hydrogen integrated energy systems incorporating carbon capture. Within this leader–follower structure, the integrated energy operator (IEO) determines electricity and heat pricing strategies at the upper level, while the energy supplier (ES) and load aggregator (LA) respond at the lower level by optimizing their generation and demand decisions. The proposed model integrates electricity–heat load balance, energy storage scheduling, hydrogen blending operations, and carbon capture costs into a unified optimization structure, enabling coordinated scheduling among multiple energy carriers and participating agents. Simulation results demonstrate that the proposed framework improves operational stability, reduces system operating costs, and mitigates carbon emissions, providing methodological support for hierarchical coordination in IES.
The main contributions of this paper are as follows:
(1) A hierarchical game-based scheduling framework for IES is established, capturing the leader–follower interactions among the IEO, ESs, and LAs to enhance coordinated multi-agent operation.
(2) A hydrogen blending system (HBS) is integrated into the IES model, enabling coordinated electricity–heat–hydrogen operation and strengthening low-carbon performance through carbon capture.
(3) The hierarchical game model is reformulated into a single-level optimization using Karush–Kuhn–Tucker (KKT) conditions and solved via a hybrid particle swarm optimization–CPLEX approach [9].
2. Integrated Energy System Modeling
2.1. Modeling of the IEO
As the unified dispatcher and market regulator within the IES, the IEO is responsible for coordinating the supply–demand balance across multiple energy carriers such as electricity and heat, guiding market prices, and controlling carbon emissions. In the Hierarchical game framework, the IEO acts as the leader whose decision objective is to maximize operational revenue or minimize total system cost, while ensuring energy balance and stable system operation. At the same time, the IEO strategically influences followers to make optimal responses [10]. The objective function of the IEO can be expressed as:
Here, denotes the time period, with representing the scheduling horizon; denotes the revenue from selling electricity and heat; represents the cost associated with energy exchange with the external power grid; denotes the cost of purchasing energy from ESs.
The IEO’s revenue from energy sales, , primarily consists of electricity sales revenue and heat sales revenue , which can be expressed as:
In the equation, and denote the electric and thermal power of the LA, respectively. represents the charging power of the battery energy storage system (BESS), while indicates the charging heat power of the thermal energy storage system (TESS). refers to the electric consumption of the carbon capture and storage (CCS). The variables and represent the selling prices of electricity and heat, respectively.
The cost of electricity trading with the grid, , can be expressed as follows:
In the equation, and denote the amount of electricity supplied by the ES to the grid and the electricity purchased from the grid, respectively. and represent the numbers of connected wind turbines and photovoltaic units. and correspond to the grid-connected outputs of wind and photovoltaic generation, respectively. and indicate the on-grid electricity price and the time-of-use electricity price. Furthermore, and represent the discharging and charging power of the BESS, while denotes the power output of the hydrogen blending system–gas turbine (HBS-GT) [11].
In addition, at time t, the cost of purchasing from the ES mainly consists of two components, and , which can be expressed as follows:
In the equation, and represent the costs of electricity and heat purchases, respectively. and denote the purchase prices of electricity and heat, respectively. Moreover, , , and correspond to the heat generated by the HBS-GT, the hydrogen blending system–gas boiler (HBS-GB), and TESS, respectively.
To prevent direct transactions between the ES side, the LA side, and the power grid, the purchase and selling prices specified by the IEO should satisfy the following constraints [12]:
In the equation, and denote the on-grid electricity price and the grid selling price, respectively. and represent the maximum and minimum heat prices, respectively. and correspond to the upper limits of the average electricity price and the average heat price, respectively.
2.2. Modeling of the ES
The ES incorporates various devices to produce, convert, and store energy, meeting users’ diverse demands. As shown in Figure 1, the system includes wind turbines (WT), photovoltaic panels (PV), and a Battery Energy Storage System (BESS) for electricity storage and dispatch. The Thermal Energy Storage System (TESS) stores heat for later use. A Hydrogen Blending System (HBS), comprising Hydrogen Blending System–Gas Turbine (HBS-GT) and Hydrogen Blending System–Gas Boiler (HBS-GB), enables low-carbon energy generation by blending hydrogen with natural gas. A Carbon Capture and Storage (CCS) system captures and stores CO2 emissions. The Electrolyzer (EL) in the HBS produces hydrogen, while the Hydrogen Storage Tank (HST) stores it for future use. The system is managed by the Load Aggregator (LA), which adjusts energy consumption based on price signals. These components work together to provide a flexible, efficient, and sustainable energy solution.
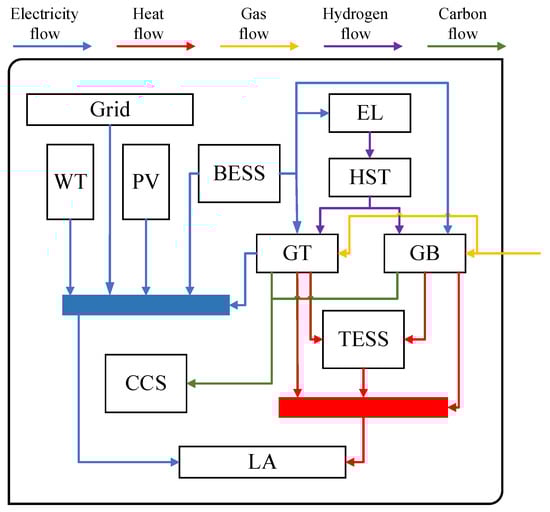
Figure 1.
Structural Diagram of the ES.
The application of wind power is mainly constrained by the intermittency and uncertainty of wind speed. Therefore, in order to accurately characterize wind power output, it is necessary to simulate the power generation of wind turbines based on the time series of wind speed. According to the analysis of a large amount of historical wind speed data in [13], the wind speed in a given region approximately follows a two-parameter Weibull distribution. For each time period, the cumulative distribution function of wind speed is given as follows:
The corresponding probability density function can be obtained as follows:
where C and K represent the shape and scale parameters of the Weibull distribution, respectively.
The relationship between the output power of a wind turbine and wind speed can be fitted by different types of curves. Extensive experimental results [14] have demonstrated that linear fitting provides a close approximation to the actual power output. In the linear fitting model, the wind power output is described as a function of the actual wind speed as follows:
In the equation, represents the actual wind speed, denotes the cut-in wind speed, indicates the cut-out wind speed, refers to the rated wind speed of the turbine, and corresponds to the rated installed capacity of the turbine.
By combining Equations (15) and (17), the probability density function of the wind power output can be obtained as follows:
In the equation, .
The uncertainty of photovoltaic power output arises from the strong diurnal variation of solar irradiance, which is also highly affected by cloudy and rainy weather conditions. Therefore, it cannot be directly described using a probability distribution function. According to [15], the probability density of solar irradiance within a day follows a two-parameter Beta distribution, which is expressed as follows:
In the equation, E represents the solar irradiance, denotes the maximum irradiance, refers to the incomplete Gamma function, and and are the shape parameters. As shown in [16], there exists a linear relationship between the photovoltaic output power and the solar irradiance E, which can be expressed as follows:
In the equation, denotes the area of the photovoltaic array, and represents the photoelectric conversion efficiency. This expression indicates that the PV power output is linearly related to the solar irradiance. Therefore, the PV power output can also be described using a two-parameter Beta distribution:
In the equation, denotes the maximum value of the photovoltaic power output.
The BESS offers several advantages, including fast response speed, high regulation accuracy, and high energy density. It has been widely applied in various scenarios of power systems, such as peak shaving and valley filling, frequency and voltage regulation, and emergency backup. The charging and discharging model of the BESS is given as follows [17]:
In the equation, and denote the charging and discharging efficiencies of the BESS, respectively, while and represent the charging and discharging power of the BESS, respectively.
The BESS is modeled with an hourly time resolution, and its operation is governed by inter-temporal SOC balance equations, charging/discharging efficiency parameters, power limits, and mutual exclusivity constraints. The terminal condition ensures daily energy neutrality and avoids artificial energy accumulation across scheduling horizons. The BESS charging and discharging model must also satisfy several constraints, including the upper limits of charging and discharging power as well as power balance, which can be expressed as follows:
In the equation, and represent the upper limits of the charging and discharging power of the BESS, respectively, while and are the state variables corresponding to the charging and discharging operations of the BESS.
The TESS is primarily employed for storing and releasing thermal energy. In this study, the TESS is considered as part of the energy supply side and collaborates with the electricity–heat coupling system to participate in multi-energy flow optimization and scheduling [18].
The charging and discharging model of the TESS is expressed as follows:
In the equation, and represent the charging and discharging efficiencies of the TESS, respectively, while and denote the charging and discharging power of the TESS, respectively.
The charging and discharging model of the TESS must also satisfy several constraints, including the upper limits of charging and discharging power as well as power balance [19], which can be formulated as follows:
In the equation, and represent the upper limits of the charging and discharging power of the TESS, respectively, while and are the state variables corresponding to the charging and discharging processes of the TESS.
The HBS is considered in this study as a low-carbon gas source pathway within the integrated energy system. It consists of four main components: the HBS-GT, the HBS-GB, the EL, and the HST. Together, they form a complete chain from hydrogen production using clean electricity to storage and blended combustion, enabling low-carbon substitution of natural gas and multi-gas coordination [20].
The HBS-GT integrates hydrogen-blended fuel into combined heat and power (CHP) systems, improving efficiency and reducing carbon emissions. The HBS-GB provides heat through hydrogen–natural gas co-combustion, suitable for industrial and residential applications. The EL generates hydrogen via electrolysis, while the HST balances production and consumption, enhancing system flexibility and stability.
The hydrogen produced by the EL and subsequently delivered to the HST can be expressed as follows:
In the equation, denotes the lower heating value of hydrogen, represents the conversion efficiency of the EL, indicates the hydrogen capacity of the HST at time t, and refers to the power consumption of the EL. denotes the storage loss rate.
The constraints of the EL are expressed as follows:
In the equation, denotes the maximum power consumption of the EL.
The mathematical model of the HBS-GT is formulated as follows [21]:
In the equation, and denote the mass of hydrogen and natural gas consumed by the HBS-GT, respectively. represents the lower heating value of natural gas, while and indicate the electrical and thermal conversion efficiencies, respectively.
In addition, the constraints of the HBS-GT are expressed as follows:
In the equation, and represent the maximum electrical and thermal output power of the HBS-GT, respectively. The hydrogen blending ratio is calculated as follows:
The mathematical model of the HBS-GB is formulated as follows [22]:
In the equation, and denote the consumption of hydrogen and natural gas by the HBS-GB, respectively, while represents the conversion efficiency of the HBS-GB.
The constraints of the HBS-GB are expressed as follows:
In the equation, denotes the maximum output power of the HBS-GB.
The total electricity consumption of the CCS is denoted as , which primarily consists of the fixed electricity consumption and the operational electricity consumption [23]. The total electricity consumption can be calculated as follows:
In the equation, represents the mass of CO2 captured by the CCS, while denotes the electricity required to capture one ton of CO2. The operational constraints of the CCS are expressed as follows:
In the equation, denotes the maximum power consumption of the CCS; represents the total CO2 emissions of the system; indicates the ideal CO2 absorption; and corresponds to the capture efficiency of CO2 captured by the CCS. represents the maximum climbing power for CCS.
The total revenue of the ES is the sum of the revenues from the renewable energy system, ESS, HBS, minus the operating cost of the CCS, which can be expressed as follows:
In the equation, , , , and denote the revenues of the renewable energy system, ESS, HBS, and CCS, respectively [24]. The revenue of the renewable energy system can be expressed as follows:
In the equation, , , and represent the electricity sales revenue, the operation and maintenance (O&M) cost, and the curtailment penalty cost of the renewable energy system, respectively. Likewise, and denote the O&M cost coefficient and the penalty cost coefficient, respectively. and correspond to the curtailed power of photovoltaic and wind generation, respectively.
In addition, the profit of the ESS can be expressed as follows:
In the equation, , , and represent the sales revenue, the operation and maintenance cost, and the purchase cost of the ESS, respectively. Meanwhile, and denote the unit O&M costs of the BESS and TESS, respectively [25].
The profit of the HBS can be expressed as follows:
In the equation, , , and denote the unit O&M cost of power generation by the GT, the unit O&M cost of heat production by the GT, and the unit O&M cost of heat production by the GB, respectively. and represent the natural gas purchase quantities for the GT and GB, while indicates the overall cost of hydrogen production [26].
In addition, the cost of the CCS can be expressed as follows:
In the equation, and represent the unit prices of electricity consumption and heat consumption for the CCS, respectively, while denotes the unit O&M cost of the CCS.
2.3. Modeling of the Load Aggregator (LA)
The LA represents the aggregated demand-side behavior of multiple end-users and is responsible for flexibly adjusting both electrical and thermal loads in response to the price signals released by the IEO. Within the leader–follower game structure, the LA acts as the follower, and its decision-making is directly influenced by the electricity and heat prices set by the IEO [27].
The objective function of the LA is to maximize consumer surplus, defined as the difference between the user’s utility function and the energy consumption cost, which can be expressed as:
In the equation, denotes the utility function, which reflects the user’s satisfaction with the consumption of electricity and heat. The utility function is commonly represented in quadratic or logarithmic forms [28]; in this study, the quadratic form is adopted:
In the equation, , , , and represent the preference coefficients for electricity and heat consumption, respectively. These parameters reflect the users’ demand preferences for different types of energy and directly influence their consumption behavior.
The consumer’s electrical load, denoted as , can be expressed as [29]:
In the equation, denotes the fixed electrical load, representing the portion of electricity consumption with relatively certain timing and demand, which ensures the continuity of normal production and daily life. Meanwhile, represents the shiftable load, which allows users to autonomously adjust the timing and power of electricity consumption in response to price signals and other information. This component must also satisfy the following constraints [30]:
In the equation, represents the upper limit of the shiftable electrical load, while denotes the total shiftable load within a given time horizon T.
Similarly, the thermal load can also be divided into two components: the fixed thermal load and the reducible thermal load, expressed as follows:
In the equation, denotes the fixed thermal load, which represents the minimum thermal demand required to ensure normal production and daily life. Meanwhile, refers to the reducible thermal load, which can be curtailed according to user comfort levels and the energy supply situation. This component must also satisfy the following constraints [31]:
In the equation, represents the upper limit of the reducible thermal load at time t.
3. Model Solution
3.1. Hierarchical Game Formulation
In many practical integrated energy systems, such as industrial parks and operator-managed regional platforms, a unified IEO is responsible for infrastructure coordination and retail price formulation within regulatory limits. Under such semi-centralized market structures, electricity and heat prices are typically determined by the operator, while downstream entities adjust their generation and demand decisions accordingly. To reflect this institutional setting, the problem is formulated as a single-leader–multi-follower hierarchical game, in which the IEO sets prices and the ES and LA respond through operational optimization. This structure captures the strategic dependence between pricing authority and operational responses within regulated IES environments.
The hierarchical game in this work can be formulated as:
Here, , , and denotes the objective functions of the IEO, ES, and LA, respectively. Meanwhile, , , and represents the strategies adopted by the IEO, ES, and LA, respectively [32].
The strategies of the IEO, ES, and LA are defined as follows:
The strategies of the IEO are the electricity and heat purchase and selling prices over a 24 h horizon. The ES determines the electric and thermal outputs of its units, while the LA adjusts shiftable electric loads and reducible thermal loads.
In the Stackelberg framework, no participant can improve its payoff by unilaterally changing its strategy. To ensure the equilibrium is both valid and solvable, its existence and uniqueness must be verified. Following [33], this is guaranteed if:
(1) The strategy spaces of the leader and followers are non-empty, compact, and convex;
(2) Given the leader’s strategy, the followers’ problems admit a unique optimal solution;
(3) Given the followers’ strategies, the leader also has a unique optimal solution.
3.2. Solution of the Hierarchical Game Formulation
To address the volatility of wind and photovoltaic outputs, this study introduces a chance-constrained method to handle the system power balance. By constructing an inequality with a confidence level of and employing the inverse distribution function of the random variable, the stochastic constraint is transformed into a deterministic one, thereby enhancing both tractability and robustness of the model. Furthermore, can be determined from historical data or standard distribution tables, achieving an effective balance between probabilistic constraints and modeling simplicity [34]. The chance constraint is expressed as:
Here, denotes the probability that the event holds; represents the confidence level; is the allowable upper limit of power imbalance; and refers to the prediction error of wind and photovoltaic outputs, assumed to follow a normal distribution.
The above chance constraint can then be reformulated into the following deterministic description:
Here, denotes the Lagrange multiplier associated with the corresponding inequality constraint, and represents the inverse function of the random variable distribution function .
In cases where is multivalued, its maximum value is selected:
Here, denotes the supremum operator, representing the least upper bound of the set.
To ensure the validity of the KKT transformation, the convexity of the lower-level optimization problems is first verified. The ES’s objective function is linear, while the LA’s objective incorporates a quadratic utility function that is concave over its domain; minimizing its negative therefore preserves convexity. In addition, all constraints in the lower-level problems are linear equalities and inequalities, forming convex feasible regions.
Since the lower-level problems are convex and satisfy Slater’s condition, strong duality holds, and the KKT conditions are both necessary and sufficient for optimality. The complementarity conditions introduced by the KKT reformulation lead to non-convexity in the transformed problem; these are linearized using the Big-M method, resulting in a MILP model that is solved to global optimality using IBM ILOG CPLEX Optimization Studio 20.1.
The optimization problem for the ES can be reformulated as:
The corresponding Lagrangian function is:
where denotes inequality constraints and denotes equality constraints.
The KKT conditions for the ES problem are:
Similarly, the KKT conditions for the LA problem, given by Equation (70), are derived to transform its optimization problem into equivalent constraints.
By incorporating the KKT conditions of the ES and LA as constraints into the IEO’s optimization problem, the original bi-level Hierarchical Game is transformed into a single-level optimization problem:
The complementary slackness conditions in Equations (69) and (70) are nonlinear and need to be linearized for computational tractability. We introduce binary variables and apply the big-M method for linearization:
where is a sufficiently large positive number.
Traditional centralized optimization requires complete participant information, such as equipment parameters and energy-use preferences. In competitive electricity markets, however, this information is not transparent, and participants must optimize independently. To achieve coordinated scheduling and equilibrium, this study adopts a particle swarm optimization (PSO) algorithm nested with the CPLEX solver [35]. The upper-level IEO problem is solved by PSO, while the lower-level ES and LA problems, formulated as MIQP and MILP, are solved using CPLEX.
In this hybrid framework, PSO is employed to optimize the continuous upper-level pricing variables. For each candidate price vector generated by PSO, the resulting single-level reformulated problem—after incorporating the KKT conditions and Big-M linearization—is solved deterministically by CPLEX to global optimality. Therefore, the equilibrium responses of the followers are computed exactly, and the heuristic component is confined to exploring the upper-level decision space. Although PSO does not theoretically guarantee global optimality, multiple independent runs with different initial populations are conducted to assess convergence stability, and consistent objective values are observed, indicating robust solution quality.
The overall solution process is shown in Figure 2.
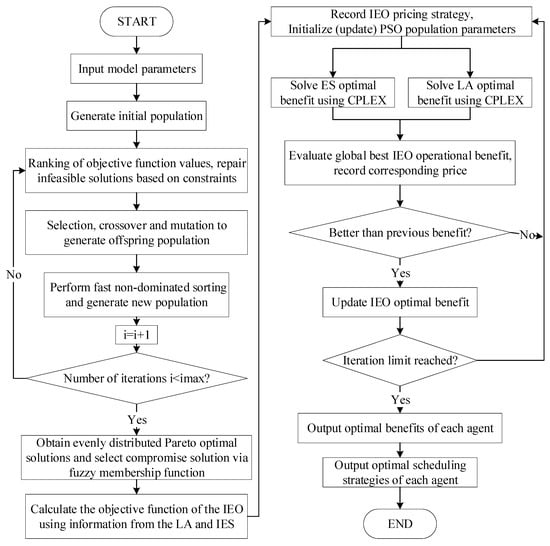
Figure 2.
Flowchart of the solution process for the game model.
The PSO algorithm was configured with a population size of 50 particles and a maximum of 200 iterations. The velocity of each particle was clamped to ±20% of the decision variable range to prevent excessive oscillations. The CPLEX solver (version 12.10) was used to solve the lower-level MIQP/MILP problems with a relative MIP gap tolerance of 0.01%. The big-M value in Equation (73) was set to after preliminary testing to ensure constraint satisfaction without causing numerical instability. Convergence was assumed when the objective value of the IEO changed by less than over 20 consecutive iterations.
4. Case Study
This study conducts case analysis based on the extended IEEE 30-bus system, whose structure is illustrated in Figure 3. The typical wind and photovoltaic output curves, as well as the electricity and heat load profiles, are shown in Figure 4 [36]. These data are sourced from Inner Mongolia Electric Power Group, based on wind and solar output, and load demand profiles for a specific region from 2022 to the first half of 2025. Representative typical-day profiles are adopted to construct a deterministic scheduling framework for mechanism validation, while uncertainty modeling is reserved for future extensions.
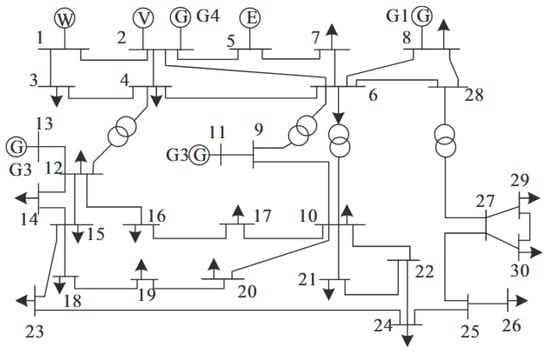
Figure 3.
Topology of the IEEE 30-bus system.
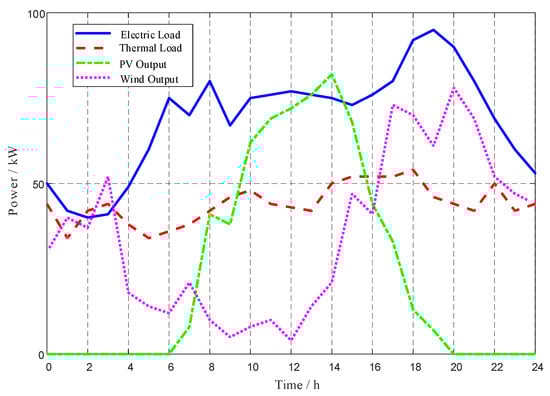
Figure 4.
Typical output and load curves.
The IEEE 30-bus system is adopted as a benchmark platform for conceptual validation of the proposed coordination framework. Although simplified in network scale, the model formulation preserves linear and convex structures, enabling extension to larger urban integrated electricity–heat–hydrogen systems with multi-period operation. The use of real-world renewable and load data enhances the practical relevance of the case study.
In addition, Table 1 presents several key parameters of the system. The values are based on simplified data from an actual power station in Inner Mongolia, provided by Inner Mongolia Electric Power Group.

Table 1.
Main system parameters.
4.1. Simulation Results and Analysis
The hybrid PSO–CPLEX framework converges within 15 min on a standard workstation (Intel i9 processor, 32 GB RAM, Intel Corporation, Santa Clara, CA, USA). The average computational time of each MILP/MIQP subproblem is approximately 5 s. These results indicate that the proposed method is computationally tractable for medium-scale systems.
The convergence curves of the IEO, ES, and LA are shown in Figure 5. As observed in Figure 5, the system reaches equilibrium after approximately 50 iterations, thereby validating the effectiveness of the proposed model and solution method. The results further reveal that, with the progression of iterations, the revenue of the IEO consistently increases, while the revenue of the ES, as a follower, gradually decreases. Meanwhile, the cost of the LA increases, reflecting the dynamic evolution of the three parties under strategic adjustments within the game framework [37]. Ultimately, the IEO and ES converge to daily operating revenues of 3.18 × 10⁵ CNY and 3.95 × 10⁵ CNY, respectively, under the 24 h scheduling horizon, while the daily operating cost of the LA stabilizes at −1.09 × 10⁶ CNY.
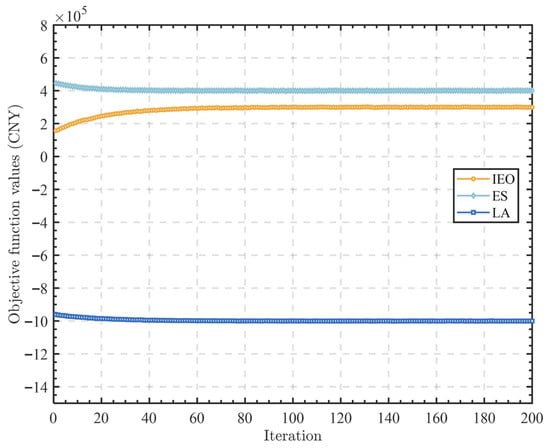
Figure 5.
Iterative convergence of the objective function values for the IEO, ES, and LA.
Figure 6 illustrates the electricity trading prices between the IEO and the main grid under the Hierarchical game mechanism over a 24 h period, including the time-of-use purchase and selling prices of the grid, as well as the electricity purchase and selling prices set by the IEO. The results show that the prices determined by the IEO exhibit clear temporal fluctuations, reflecting strong strategic responsiveness. During peak load periods, the IEO significantly raises the selling price, creating a price incentive that encourages users to actively reduce their electricity consumption and thereby realize demand response. In addition, the IEO’s purchase price consistently remains higher than that of the grid, while its selling price stays lower than the grid’s selling price, ensuring positive profit margins for the IEO through the price differential. This strategy highlights the IEO’s ability, as the leader in the Hierarchical game, to adjust system operation through price leverage while avoiding excessive price burdens on users. Moreover, the IEO maintains a reasonable price spread between purchase and selling prices during most periods, with selling prices exceeding purchase prices, which maximizes profits, promotes ES output and LA participation, and enhances both system efficiency and game convergence.
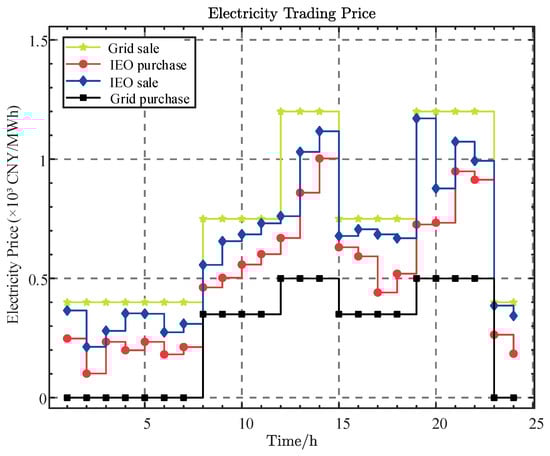
Figure 6.
Electricity price optimization results.
Figure 7 illustrates the heat purchase and selling price strategies formulated by the IEO under the Hierarchical game mechanism over a 24 h horizon, along with the upper and lower boundary constraints of the allowable heat price range. The figure includes the IEO’s purchase and selling prices as well as the system-defined minimum and maximum heat prices. Compared with the electricity pricing strategy, the heat pricing strategy demonstrates more stable boundary-constrained characteristics, fluctuating flexibly within the upper and lower limits with fewer extreme oscillations. This indicates stronger adjustability of heat demand and highlights the buffering role of thermal storage in balancing heat supply and demand. It can be observed that the IEO’s selling price of heat consistently remains below the system’s upper limit of 0.48 thousand CNY/MWh, following a stepwise distribution that reflects the game-based strategy of adjusting prices according to heat demand periods. During periods of high heat demand, the IEO increases the selling price to encourage demand shifting on the user side or the release of stored heat, thereby reducing peak heat loads and enhancing scheduling flexibility [38]. Furthermore, the IEO’s purchase and selling prices maintain a clear spread in most periods, ensuring operator profitability while aligning with reasonable price ranges under market mechanisms, which demonstrates the coordination ability of the game framework in balancing supply-side costs and demand-side responses.

Figure 7.
Optimization results of heat prices.
Figure 8 presents the 24 h optimized electricity scheduling results of the integrated energy system, including renewable generation, grid purchases, GT output, BESS and hydrogen storage charging/discharging behaviors, as well as demand-side requirements. As shown in the figure, wind and photovoltaic outputs dominate during the daytime hours of 11:00–17:00, with a maximum supply exceeding 160 kW, clearly reflecting the system’s priority for renewable utilization. In addition, multiple storage systems jointly participate in regulation: the BESS primarily discharges during peak load periods and charges during off-peak hours to ensure supply reliability, while the HESS and GB mainly provide and store heat to maintain stable thermal supply. The negative bars indicate storage charging in earlier periods, while the positive bars represent orderly discharge during peak hours, forming a typical “valley charging and peak discharging” strategy that optimizes the temporal distribution of electricity. Furthermore, grid electricity purchases remain consistently low, since renewable energy and storage jointly cover demand during peak periods, thereby reducing dependence on the grid and enhancing both system independence and economic efficiency [39].
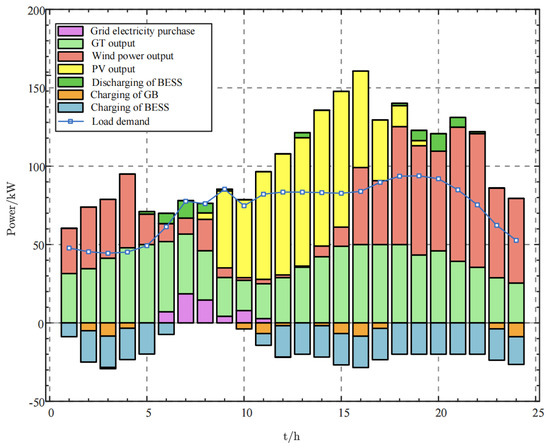
Figure 8.
Optimized electricity scheduling results.
Figure 9 presents the 24 h optimized thermal energy scheduling results of the integrated energy system, including the outputs of GB and GT, as well as the charging and discharging behaviors of the HESS. As shown in the figure, GB output consistently dominates across all periods, while the system relies on the combined supply of GB and GT during nighttime and early morning hours to meet demand. The dynamic variations of HESS are also illustrated, where positive values correspond to heat release and negative values to heat storage. The HESS charges during low-demand periods and primarily discharges during evening peak hours, following a typical “valley charging and peak discharging” strategy that effectively balances thermal supply and improves energy utilization efficiency. Overall, the figure demonstrates that while achieving thermal supply–demand balance, the system fully leverages the coordinated regulation of various energy and storage units, thereby reducing dependence on external systems and enhancing both independence and economic efficiency.
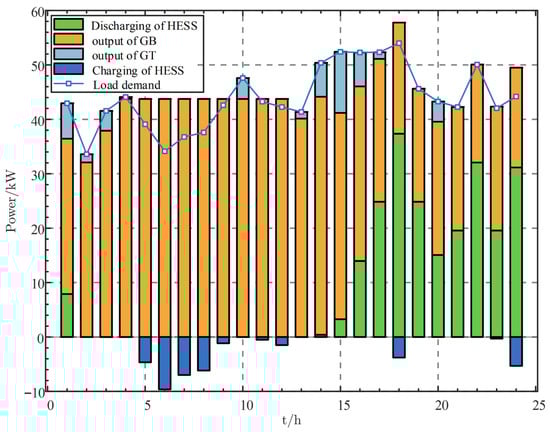
Figure 9.
Optimized thermal energy scheduling results.
4.2. Scenario Analysis
To verify the effectiveness and feasibility of the model, four scenarios were set up for comparative analysis:
Scenario 1: Hierarchical game-based operation with the HBS, but HBS is not mixed with hydrogen.
Scenario 2: Centralized optimization (non-game) operation with the HBS.
Scenario 3: Hierarchical game-based operation with the HBS.
Scenario 4: Two-stage spatiotemporal decoupling operation with hydrogen blending.
The comparative analysis between Scenario 1 and Scenario 3 primarily aims to demonstrate the carbon reduction capability of the HBS. The comparison between Scenario 2 and Scenario 3 is intended to verify the effectiveness of the game-based coordination mechanism in optimizing overall system performance. It should be noted that both the centralized and hierarchical models share identical system configurations, technical parameters, and operational constraints. The distinction lies solely in the decision-making structure: the centralized model assumes full information and minimizes total system cost, whereas the hierarchical framework reflects decentralized profit-driven coordination under price-based interaction. Furthermore, to clarify the difference between the proposed KKT-based hierarchical reformulation strategy and the recent two-stage spatiotemporal decoupling method proposed in Ref. [40], an additional Scenario 4 is designed for comparison.
As illustrated in Figure 10 and Figure 11, the comparative analysis of Scenario 1 and Scenario 3 validates the role of the HBS as a key component for optimizing energy structure and reducing carbon emissions. In Scenario 1, the HBS operates under a Hierarchical game-based optimization approach without hydrogen blending, resulting in significant fluctuations in carbon emissions across different time periods. Particularly in the initial hours, carbon emission peaks were notably high, and the performance of carbon capture was unstable. Although the CCS captured a considerable amount of carbon during certain intervals, the overall net carbon emissions remained relatively high and exhibited considerable volatility due to the absence of synergistic hydrogen integration.
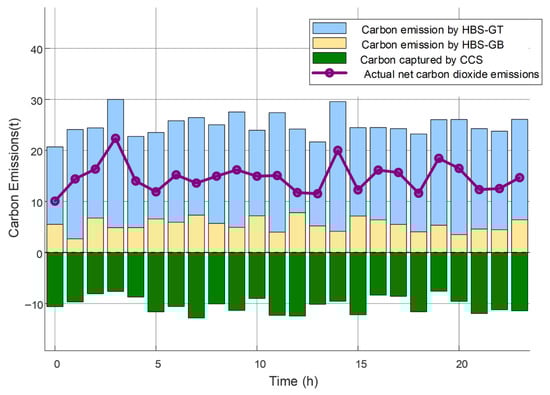
Figure 10.
Carbon balance diagram for Scenario 1.
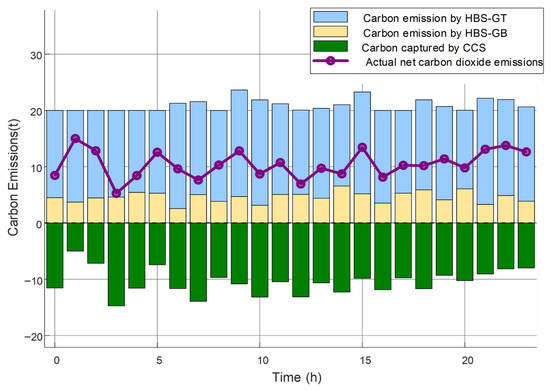
Figure 11.
Carbon balance diagram for Scenario 3.
In contrast, Scenario 3 introduces hydrogen into the HBS operation, leading to further optimization of the system’s operational strategy. The blending of hydrogen directly reduces the carbon emission intensity per unit of energy output from the HBS-GT, thereby significantly lowering carbon emissions during power generation compared to Scenario 1. As a result, the overall carbon emissions demonstrate enhanced stability over time, with markedly reduced fluctuations. Simulation results show that net carbon emissions of the system are significantly reduced across multiple time intervals, highlighting substantial carbon mitigation effects.
Through the comparison of the two scenarios, it is evident that the introduction of hydrogen not only achieves source-level carbon reduction by lowering the emission intensity of the HBS-GT, but also improves the operational efficiency of the CCS through synergistic effects, thereby significantly strengthening the overall low-carbon operational capability of the system. This analytical outcome fully substantiates the indispensable role of hydrogen as a key component in the energy structure for reducing CO2 emissions and enhancing green, low-carbon performance.
Furthermore, a comparison of the economic performance under Scenario 2 and Scenario 3 is conducted, as shown in Table 2. In Scenario 2, both the ES and LA experience negative revenues. The ES incurs a loss of −3.46 × 10⁵ CNY, while the LA’s cost reaches −1.87 × 10⁶ CNY, indicating limited incentive alignment under centralized coordination.
Table 2.
Profits of leader and followers.
In contrast, Scenario 3 significantly improves the revenue distribution among entities. The IEO achieves a positive revenue of 3.18 × 10⁵ CNY per day, and the ES obtains 3.95 × 10⁵ CNY, representing a substantial improvement compared with its loss in Scenario 2. Although the LA still incurs a cost of 1.09 × 10⁶ CNY, this value is reduced by approximately 41.7% relative to Scenario 2. These results indicate that the hierarchical game framework enhances incentive compatibility and revenue allocation under the same technical conditions. In addition, The total system cost slightly increases to 3.77 × 10⁵ CNY, corresponding to an efficiency loss of about 3.29%. This moderate cost increase reflects decentralized strategic interaction in the hierarchical framework, where individual profit optimization leads to a small deviation from the centralized optimum while substantially enhancing incentive compatibility.
In addition, increased operator revenue does not necessarily imply maximized social welfare. The centralized model minimizes total system cost under full information and can be regarded as a proxy for system-wide welfare, whereas the hierarchical framework reflects decentralized profit-driven coordination under carbon constraints. Although the two approaches pursue different objectives, the results show that the hierarchical mechanism improves revenue allocation and reduces the load aggregator’s cost without significantly compromising overall system efficiency, while maintaining lower carbon emissions.
In Scenario 4, the model complexity is reduced following the core idea of Ref. [41]. Specifically, the scheduling horizon is aggregated into representative time blocks, and the leader–follower interaction is removed. The electricity and heat prices are fixed exogenously, and the bi-level game structure is replaced by a centralized optimization framework. Hydrogen blending and carbon capture remain enabled to ensure comparability with Scenario 3. The comparison results between Scenario 3 and Scenario 4 are summarized in Table 3.
Table 3.
Comparison between hierarchical reformulation and spatiotemporal decoupling strategies.
The results show that Scenario 4 reduces computation time by approximately 62%, demonstrating the effectiveness of the spatiotemporal decoupling strategy in improving computational efficiency. Scenario 4 exhibits slightly higher operating cost and moderately increased carbon emission compared with Scenario 3. This difference reflects the distinct modeling focus of the two approaches: Scenario 4 emphasizes structural simplification and scalability through spatiotemporal decomposition, whereas Scenario 3 retains hierarchical price-driven interaction among the IEO, ES, and LA, enabling additional coordination benefits.
4.3. Sensitivity Analysis of CCS Parameters
To further enhance the credibility of the carbon capture modeling, a sensitivity analysis is conducted on two key CCS parameters: the capture efficiency and the energy penalty coefficient . These parameters directly influence the amount of CO2 captured and the associated electricity consumption, thereby affecting both system economics and emission performance. The quantitative results of the sensitivity analysis are summarized in Table 4
Table 4.
Sensitivity analysis of CCS technical parameters.
The results in Table 4 indicate a clear trade-off between economic performance and emission mitigation. Increasing the capture efficiency from 0.90 to 0.95 reduces net carbon emissions by 5.2% but raises the proxy total cost by 3.4%, due to the additional electricity consumption required for higher CO2 capture. Conversely, lowering the efficiency decreases operating cost while increasing emissions, reflecting reduced capture intensity.
A similar trend is observed for variations in the energy penalty coefficient. Higher electricity consumption per ton of captured CO2 slightly increases both operating cost and net emissions, while lower energy penalty improves system performance. Overall, the variations remain moderate, confirming that the CCS subsystem behaves consistently with engineering expectations and that the main conclusions of the proposed hierarchical framework are robust under reasonable parameter changes.
4.4. Sensitivity Analysis of Market and Policy Parameters
To evaluate the robustness of the proposed hierarchical Stackelberg framework under policy fluctuations, a sensitivity analysis was conducted based on Scenario 3, as summarized in Table 5. Two key parameters were considered: (1) the upper limit of the average electricity price and (2) the carbon price parameter. All technical parameters, renewable outputs, and load profiles were kept unchanged.
Table 5.
Sensitivity analysis of electricity price cap and carbon price.
When the average electricity price cap is tightened by 10%, the IEO revenue decreases by approximately 6.9%, and the ES profit declines slightly. The system total cost increases by about 1.3%, while carbon emissions rise moderately due to weakened demand response incentives. Conversely, relaxing the price cap enhances pricing flexibility, resulting in a 6.6% increase in IEO revenue and a slight reduction in both total cost and emissions.
Regarding carbon pricing, reducing the carbon price by 20% weakens emission reduction incentives, leading to a 5.7% increase in net carbon emissions, although economic returns slightly improve. In contrast, increasing the carbon price by 20% reduces emissions by approximately 5.7%, while raising total system cost by about 2.4% due to higher carbon-related expenses. Overall, the system demonstrates stable economic performance and rational environmental responsiveness under moderate policy fluctuations, confirming the robustness of the proposed hierarchical coordination mechanism.
5. Conclusions
This study addresses the optimal scheduling problem of integrated energy systems (IES) characterized by electricity–heat–hydrogen–carbon multi-energy synergy. A generalized energy storage optimization model based on a hierarchical game framework is proposed, incorporating price-driven mechanisms and multi-agent strategy interactions to capture the interest dynamics among IEO, ES, and LA [40]. The main conclusions are as follows:
- (1)
- A hierarchical game model with IEO as the leader and ES and LA as followers is developed, forming a multi-agent coordination framework. By setting electricity and heat prices, IEO guides ES dispatch and LA response, achieving multi-level coupling of generation, grid, load, and storage. The proposed model integrates price mechanisms, load coordination, storage scheduling, and carbon control, effectively handling the complexity of multi-energy system interactions.
- (2)
- By transforming the follower optimization problems into equivalent constraints and applying KKT conditions, the game is reformulated into a single-level model. A hybrid solution framework combining particle swarm optimization with the CPLEX solver enhances computational stability and precision. Simulation results confirm that IEO can leverage flexible electricity and heat pricing to guide user response and resource dispatch, achieving both cost reduction and carbon emission mitigation. Energy storage systems efficiently perform peak shaving and valley filling, enabling temporal energy shifting.
- (3)
- HBS is integrated as a key component for energy structure optimization and carbon reduction. Subsystem models of EL, HST, HBS-GT, and HBS-GB are established, realizing electricity–gas–heat complementarity and diversified hydrogen utilization. Simulation results demonstrate that increasing the hydrogen blending ratio leads to continuous reductions in CO2 emissions, significantly enhancing the green and low-carbon performance of the energy system.
Author Contributions
Conceptualization, Y.G. and J.Y.; methodology, S.H.; software, X.Y. and D.L.; validation, S.H. and D.L.; formal analysis, D.L.; data curation, X.Y. and Y.G.; writing—original draft preparation, J.Y.; writing—review and editing, Y.G. All authors have read and agreed to the published version of the manuscript.
Funding
This research was funded by Inner Mongolia Electric Power (Group) Co., Ltd., with its science and technology project, 2025-3-5.
Data Availability Statement
Due to the confidentiality requirements of the State Grid company, the research data cannot be disclosed.
Conflicts of Interest
The author Yu Guo is employed by the company Inner Mongolia Electric Power (Group) Co., Ltd. The remaining authors declare that the research was conducted in the absence of any commercial or financial relationships that could be construed as a potential conflict of interest.
References
- Gao, Y.; Tahir, M.; Siano, P.; Bi, Y.; Hu, S.; Yang, J. Optimization of renewable energy-based integrated energy systems: A three-stage stochastic robust model. Appl. Energy 2025, 377, 124635. [Google Scholar] [CrossRef]
- Li, Q.; Liu, S.; Zou, B.; Jin, Y.; Ge, Y.; Li, Y.; Chen, Q.; Du, X.; Li, F.; Zheng, C. A Stackelberg Game for Co-Optimization of Distribution System Operator Revenue and Virtual Power Plant Costs with Integrated Data Center Flexibility. Energies 2025, 18, 4123. [Google Scholar] [CrossRef]
- Xu, D.; Li, M. A Stackelberg Game Model for the Energy–Carbon Co-Optimization of Multiple Virtual Power Plants. Inventions 2025, 10, 16. [Google Scholar] [CrossRef]
- Qin, M.L.; Yang, Y.B.; Zhao, X.Q.; Xu, Q.S.; Yuan, L. Low-carbon economic multi-objective dispatch of integrated energy system considering the price fluctuation of natural gas and carbon emission accounting. Prot. Control Mod. Power Syst. 2023, 8, 61. [Google Scholar] [CrossRef]
- Gao, Y.; Zhao, Y.; Hu, S.; Tahir, M.; Wang, Y.; Yang, J.Q. A three-stage adjustable robust optimization framework for energy base leveraging transfer learning. Energy 2025, 319, 135037. [Google Scholar] [CrossRef]
- Wei, F.; Jing, Z.X.; Wu, P.Z.; Wu, Q.H. A Stackelberg game approach for multiple energies trading in integrated energy systems. Appl. Energy 2017, 200, 315–329. [Google Scholar] [CrossRef]
- Li, Y.; Wang, B.; Yang, Z.; Li, J.Z.; Chen, C. Hierarchical stochastic scheduling of multi-community integrated energy systems in uncertain environments via Stackelberg game. Appl. Energy 2022, 308, 118392. [Google Scholar] [CrossRef]
- Wang, Y.L.; Zhen, L.; Wang, J.Y.; Du, B.X.; Qin, Y.M.; Liu, X.L.; Liu, L. A Stackelberg game-based approach to transaction optimization for distributed integrated energy system. Energy 2023, 283, 128475. [Google Scholar] [CrossRef]
- Gao, Y.; Tahir, M.; Siano, P.; Hussain, S.; Sun, W.Q.; He, Y.; Meng, Q.L. A bi-level hybrid game framework for Stochastic Robust optimization in multi-integrated energy microgrids. Sustain. Energy Grids Netw. 2025, 44, 102024. [Google Scholar] [CrossRef]
- Hou, H.; Ge, X.D.; Yan, Y.L.; Lu, Y.C.; Zhang, J.; Dong, Z.Y. An integrated energy system “green-carbon” offset mechanism and optimization method with Stackelberg game. Energy 2024, 294, 130617. [Google Scholar] [CrossRef]
- Yang, B.; Zhou, Y.M.; Su, R.; Yan, B.; Li, H.; Gao, D.; Jiang, L. Stackelberg game based optimal coordination for low carbon park with hydrogen blending system. Renew. Energy 2026, 256, 124118. [Google Scholar]
- Meng, Q.L.; Zu, G.Q.; Ge, L.J.; Li, S.; Xu, L.; Wang, R.; He, K.; Jin, S. Dispatching strategy for low-carbon flexible operation of park-level integrated energy system. Appl. Sci. 2022, 12, 12309. [Google Scholar] [CrossRef]
- Meng, Q.L.; Jin, X.L.; Luo, F.Z.; Wang, Z.; Hussain, S. Distributionally robust scheduling for benefit allocation in regional integrated energy system with multiple stakeholders. J. Mod. Power Syst. Clean Energy 2024, 12, 1631–1642. [Google Scholar] [CrossRef]
- Meng, Q.L.; Xu, J.; Ge, L.J.; Wang, Z.; Wang, J.; Xu, L.; Tang, Z. Economic optimization operation approach of integrated energy system considering wind power consumption and flexible load regulation. J. Electr. Eng. Technol. 2024, 19, 209–221. [Google Scholar] [CrossRef]
- Li, B.T.; Zheng, D.C.; Li, B.; Ji, L.; Hong, Q.; Meng, Q. Research on low voltage ride-through strategies for doubly-fed wind farms during asymmetric faults. Int. J. Electr. Power Energy Syst. 2024, 160, 110138. [Google Scholar]
- Liu, J.C.; Wang, Z.G.; Zang, X.D.; Li, X.; Guo, L.; Meng, Q. Data-driven dynamic assessment method of wind farm frequency characteristics based on state space mapping. CSEE J. Power Energy Syst. 2025, 11, 1018–1029. [Google Scholar]
- Liang, T.T.; Du, Z.J.; Hu, H. Optimized operation of integrated energy systems based on fully distributed algorithms. Distrib. Util. 2025, 42, 23–31. [Google Scholar]
- Gao, C.Z.; Lu, H.; Chen, M.Z.; Chang, X.Q.; Zheng, C.X. A low-carbon optimization of integrated energy system dispatch under multi-system coupling of electricity–heat–gas–hydrogen based on stepwise carbon trading. Int. J. Hydrogen Energy 2025, 97, 362–376. [Google Scholar] [CrossRef]
- Li, H.; Li, X.; Chen, S.; Li, S.; Kang, Y.; Ma, X. Low-carbon optimal scheduling of integrated energy system considering multiple uncertainties and electricity–heat integrated demand response. Energies 2024, 17, 245. [Google Scholar] [CrossRef]
- Li, Q.; Xiao, X.K.; Pu, Y.C.; Luo, S.; Liu, H.; Chen, W. Hierarchical optimal scheduling method for regional integrated energy systems considering electricity–hydrogen shared energy. Appl. Energy 2023, 349, 121670. [Google Scholar] [CrossRef]
- Kong, X.; Xiao, J.; Liu, D.; Wu, J.; Wang, C.; Shen, Y. Robust stochastic optimal dispatching method of multi-energy virtual power plant considering multiple uncertainties. Appl. Energy 2020, 279, 115707. [Google Scholar] [CrossRef]
- Yang, Y.; Hu, G.; Spanos, C.J. Optimal sharing and fair cost allocation of community energy storage. IEEE Trans. Smart Grid 2021, 12, 4185–4194. [Google Scholar] [CrossRef]
- Chen, Y.; Park, B.; Kou, X.; Hu, M.; Dong, J.; Li, F.; Amasyali, K.; Olama, M. A comparison study on trading behavior and profit distribution in local energy transaction games. Appl. Energy 2020, 280, 115941. [Google Scholar] [CrossRef]
- Kim, H.; Lee, J.; Bahrami, S.; Wong, V.W.S. Direct energy trading of microgrids in distribution energy market. IEEE Trans. Power Syst. 2019, 35, 639–651. [Google Scholar] [CrossRef]
- Li, J.Y.; Zhang, C.R.; Xu, Z.; Wang, J.; Zhao, J.; Zhang, Y.J.A. Distributed transactive energy trading framework in distribution networks. IEEE Trans. Power Syst. 2018, 33, 7215–7227. [Google Scholar] [CrossRef]
- Xu, J.; Yi, Y. Multi-microgrid low-carbon economy operation strategy considering both source and load uncertainty: A Nash bargaining approach. Energy 2023, 263, 125712. [Google Scholar] [CrossRef]
- Zhao, B.X.; Duan, P.F.; Fen, M.D.; Xue, Q.; Hua, J.; Yang, Z. Optimal operation of distribution networks and multiple community energy prosumers based on mixed game theory. Energy 2023, 278, 128025. [Google Scholar] [CrossRef]
- Jiang, A.H.; Yuan, H.H.; Li, D.L. A two-stage optimization approach on the decisions for prosumers and consumers within a community in the peer-to-peer energy sharing trading. Int. J. Electr. Power Energy Syst. 2021, 125, 106527. [Google Scholar] [CrossRef]
- Wang, Y.L.; Wang, Y.D.; Huang, Y.J.; Yang, J.; Ma, Y.; Yu, H.; Zeng, M.; Zhang, F.; Zhang, Y. Operation optimization of regional integrated energy system based on the modeling of electricity–thermal–natural gas network. Appl. Energy 2019, 251, 113410. [Google Scholar] [CrossRef]
- Ding, T.; Yang, Q.R.; Yang, Y.H.; Li, C.; Bie, Z.; Blaabjerg, F. A data-driven stochastic reactive power optimization considering uncertainties in active distribution networks and decomposition method. IEEE Trans. Smart Grid 2018, 9, 4994–5004. [Google Scholar] [CrossRef]
- Li, G.G.; Li, Q.Q.; Liu, Y.; Liu, H.M.; Song, W.; Ding, R. A cooperative Stackelberg game-based energy management considering price discrimination and risk assessment. Int. J. Electr. Power Energy Syst. 2022, 135, 0142–0615. [Google Scholar] [CrossRef]
- Cheng, Y.H.; Zhang, N.; Zhang, B.S.; Kang, C.; Xi, W.; Feng, M. Low-carbon operation of multiple energy systems based on energy–carbon integrated prices. IEEE Trans. Smart Grid 2020, 11, 1307–1318. [Google Scholar] [CrossRef]
- Yan, H.R.; Hou, H.J.; Deng, M.; Si, L.; Wang, X.; Hu, E.; Zhou, R. Stackelberg game theory-based model to guide users’ energy use behavior, with the consideration of flexible resources and consumer psychology, for an integrated energy system. Energy 2024, 288, 129806. [Google Scholar]
- Li, K.; Ye, N.; Li, S.; Wang, H.; Zhang, C. Distributed collaborative operation strategies in multi-agent integrated energy system considering integrated demand response based on game theory. Energy 2023, 273, 127137. [Google Scholar] [CrossRef]
- Qiu, Y.B.; Li, Q.; Ai, Y.X.; Chen, W.; Benbouzid, M.; Liu, S.; Gao, F. Two-stage distributionally robust optimization-based coordinated scheduling of integrated energy system with electricity–hydrogen hybrid energy storage. Prot. Control Mod. Power Syst. 2023, 8, 33. [Google Scholar] [CrossRef]
- Li, Y.; Wang, C.L.; Li, G.Q.; Chen, C. Optimal scheduling of integrated demand response-enabled integrated energy systems with uncertain renewable generations: A Stackelberg game approach. Energy Convers. Manag. 2021, 235, 113996. [Google Scholar] [CrossRef]
- Zhang, M.J.; Yang, J.H.; Yu, P.S.; Tinajero, G.D.A.; Guan, Y.; Yan, Q.; Zhang, X.; Guo, H. Dual-Stackelberg game-based trading in community integrated energy system considering uncertain demand response and carbon trading. Sustain. Cities Soc. 2024, 101, 105088. [Google Scholar] [CrossRef]
- Chen, D.Y.; Liu, F.; Liu, S. Optimization of virtual power plant scheduling coupling with P2G-CCS and doped with gas hydrogen based on stepped carbon trading. Power Syst. Technol. 2022, 46, 2042–2053. [Google Scholar]
- Tan, J.J.; Li, Y.; Zhang, X.P.; Pan, W.; Ruan, W. Operation of a commercial district integrated energy system considering dynamic integrated demand response: A Stackelberg game approach. Energy 2023, 274, 126888. [Google Scholar] [CrossRef]
- Wang, S.Y.; Luo, F.Z.; Fo, J.C.; Lv, Y.Q.; Wang, C.S. Two-stage spatiotemporal decoupling configuration of SOP and multi-level electric-hydrogen hybrid energy storage based on feature extraction for distribution networks with ultra-high DG penetration. Appl. Energy 2025, 398, 126438. [Google Scholar] [CrossRef]
- Liu, X.Z.; Wu, J.Z.; Jenkins, N.; Bagdanavicius, A. Combined analysis of electricity and heat networks. Appl. Energy 2016, 162, 1238–1250. [Google Scholar] [CrossRef]


Disclaimer/Publisher’s Note: The statements, opinions and data contained in all publications are solely those of the individual author(s) and contributor(s) and not of MDPI and/or the editor(s). MDPI and/or the editor(s) disclaim responsibility for any injury to people or property resulting from any ideas, methods, instructions or products referred to in the content. |
© 2026 by the authors. Licensee MDPI, Basel, Switzerland. This article is an open access article distributed under the terms and conditions of the Creative Commons Attribution (CC BY) license.