


Abstract
The transition towards sustainable energy systems requires a paradigm shift from purely economic optimization to a holistic framework that internalizes environmental and social externalities. This article integrates social and environmental aspects into the multi-objective dispatch model based on mixed-integer linear programming (MILP) for the economic, environmental, and social dispatch (EEDS) of a polygeneration microgrid. Unlike traditional approaches that treat social impact as a static planning constraint, this study introduces a quantified “Social Shadow Price” into the operational objective function, aiming to operationalize the concept of energy justice. The model is applied to a case study featuring a high-load factor industrial demand profile, integrated with thermal generation, solar PV, wind power, and BESS storage. Results demonstrate that internalizing environmental and social costs significantly alters the merit order dispatch, reducing the utilization of socially contentious technologies while leveraging storage arbitrage to mitigate intermittency. Furthermore, a sensitivity analysis is conducted to determine the optimal capacity of renewable energy sources, revealing that a balanced mix of solar and wind minimizes the composite sustainability index. The findings suggest that this EEDS framework provides a viable pathway for policymakers to achieve a socially equitable energy transition in industrial sectors.
1. Introduction
The global energy landscape is currently navigating a profound structural transformation, driven by the urgent need to mitigate climate change while ensuring energy security and affordability for growing economies [1]. This “Energy Trilemma” has catalyzed the massive deployment of Distributed Energy Resources (DERs), shifting the paradigm from centralized fossil-fuel generation to decentralized polygeneration microgrids [2]. In this context, technologies such as Solar PV, Wind power, and Battery Energy Storage Systems (BESS) have emerged as technical cornerstones for decarbonization [3,4]. However, the rapid expansion of these infrastructures often encounters significant socio-territorial friction, where local communities reject projects due to perceived negative externalities or lack of shared benefits [5]. Consequently, the success of the energy transition depends not only on technical feasibility or economic viability but increasingly on the “Social License to Operate” [6,7].
Despite this reality, traditional operational planning models, specifically Economic Dispatch (ED) and Unit Commitment (UC), have remained largely focused on minimizing fuel costs and, more recently, Greenhouse Gas (GHG) emissions [8,9]. Various studies in the literature focus on multi-objective optimization approaches that explore the trade-offs between Cost ($) and Environment (tonCO2), yet the social dimension is frequently relegated to qualitative assessments during the pre-feasibility phase or treated as a static constraint [10,11]. This creates a methodological gap in the daily operation of power systems: system operators and energy managers lack mathematical tools to “see” and optimize the social impact of their dispatch decisions in real time. The absence of a quantified “Social Price” in the objective function leads to dispatch solutions that, while economically optimal, may be socially suboptimal or even conflict-prone.
To bridge this gap, this study incorporates social and environmental aspects into the Economic, Environmental, and Social Dispatch (EEDS) model, which is formulated as a mixed-integer linear programming (MILP) problem [12,13]. Unlike conventional approaches, this model explicitly monetizes social externalities such as the public health costs associated with particulate matter (PM2.5) from thermal plants and the socio-territorial rejection of specific technologies and integrates them alongside the positive externality of local job creation [14,15]. By assigning a monetary value to these factors, the algorithm can dynamically alter the merit order, favoring technologies that maximize social welfare. Furthermore, the model incorporates the degradation dynamics of BESS, allowing storage systems to perform arbitrage not just for price but to displace socially costly generation during peak demand periods [16].
This paper validates the integration of social and environmental aspects into the EEDS framework by conducting a thorough case study of a polygeneration microgrid that caters to a specific industrial demand profile [17]. The industrial sector, characterized by high load factors and reliability requirements, represents a critical stress test for renewable integration [4]. Through a two-stage simulation (Day-Ahead and Real-Time), this work demonstrates how internalizing social costs fundamentally reshapes the optimal dispatch strategy. The contributions of this research are threefold: (i) a rigorous mathematical formulation of social costs suitable for MILP optimization; (ii) a sensitivity analysis determining the optimal renewable–storage mix that minimizes the composite sustainability index; and (iii) empirical evidence that BESS is essential for mitigating the intermittency risks in socially constrained industrial grids.
2. Literature Review
The optimization of power system operations has evolved significantly over the last century, transitioning from simple cost-minimization logic to complex multi-objective frameworks that attempt to address the “Energy Trilemma.” Historically, the fundamental problem of Economic Dispatch (ED) [9,18] and Unit Commitment (UC) focused exclusively on the minimization of fuel costs and technical constraints [13,19]. Seminal works in the field established the rigorous mathematical foundations for these problems, evolving from Lagrangian relaxation methods to Mixed-Integer Linear Programming (MILP). The MILP formulation, in particular, became the industry standard due to its ability to model non-convexities such as start-up costs, ramp rates, and minimum up/down times with high precision [12,20]. However, as the global consensus on climate change solidified, these purely economic models proved insufficient, necessitating the inclusion of environmental variables [21].
This necessity gave rise to the Environmental Economic Dispatch (EED), which introduced Greenhouse Gas (GHG) emissions as a conflicting objective to be minimized [18,22]. Extensive literature has explored this trade-off, primarily using multi-objective evolutionary algorithms [23] or weighted-sum approaches to generate Pareto frontiers between generation costs ($) and emissions (tonCO2) [9,18]. While these studies successfully integrated the environmental dimension, they largely assumed that sustainability is solely a function of decarbonization, overlooking the complex socio-territorial dynamics that increasingly dictate the feasibility of energy projects. Consequently, a significant gap remains in the operational literature: the mathematical internalization of social externalities.
The “social dimension” of energy has typically been addressed through qualitative frameworks or Multi-Criteria Decision Making (MCDM) tools, such as the Analytic Hierarchy Process (AHP), primarily during the planning or pre-feasibility stages [24,25]. While effective for ranking technologies based on static acceptance or job creation potential, these methodologies lack the temporal resolution required for day-ahead or real-time dispatch. Consequently, current research rarely attempts to operationalize “social acceptance” as a dynamic variable within the objective function of a dispatch algorithm [26,27]. This disconnection creates an operational blind spot: system operators manage grids optimizing for marginal costs and carbon taxes, yet remain blind to the “social costs” manifesting as community opposition, local pollutant health impacts, or missed local employment opportunities that vary dynamically alongside load and generation [28,29].
This operational gap is particularly critical when considering the deployment of Battery Energy Storage Systems (BESS) within industrial microgrids [30,31]. Although the technoeconomic applications of BESS ranging from arbitrage to frequency regulation are well-documented, their potential as strategic assets for social impact mitigation remains largely theoretical. In high-reliability industrial settings, storage is predominantly valued for its role in demand charge management or as a backup power source [32]. However, this conventional perspective overlooks the capability of storage to facilitate “social arbitrage.” By decoupling generation from consumption, BESS allows for the shifting of clean energy to periods where thermal generation would otherwise impose high social costs, transforming storage from a purely economic asset into a potential instrument of energy justice [33,34].
Despite these technological capabilities and advancements in economic optimization, a unified framework that operationalizes these social dynamics remains elusive. Existing methodologies generally lack the mechanism to monetize social externalities, such as public health degradation or local employment benefits, in a format compatible with deterministic Mixed-Integer Linear Programming (MILP) solvers. This study addresses this methodological void by introducing the Economic, Environmental, and Social Dispatch (EEDS) model. By translating qualitative social metrics into quantitative monetary coefficients, this approach provides a rigorous mathematical structure where social welfare is not merely a static constraint but an active, dynamic driver of the dispatch logic.
3. Mathematical Formulation
The proposed Economic, Environmental, and Social Dispatch (EEDS) model is formulated as a multi-objective Mixed-Integer Linear Programming (MILP) problem. The formulation allows for the simultaneous optimization of technical constraints, financial costs, environmental impact, and social externalities over a discretized time horizon.
The model is structured around three fundamental components, namely sets, indices, and decision variables, which are delineated over a time horizon denoted by T, subdivided into time steps of equal length ΔT. To ensure clarity, the notation used throughout the mathematical model is defined in Table 1.
Table 1.
Nomenclature: Sets, Indices, and Decision Variables.
The objective function is demonstrated in Equation (1). The core of this model is the Composite Sustainability Index (), which minimizes a weighted sum of three conflicting objectives: Economic Cost (), Environmental Cost (), and Social Cost (). To ensure mathematical comparability between disparate units (Currency, Tons of , and Social Utility), scaling factors or normalization weights () are applied in Equation (1).
Subject to .
Furthermore, the economic component (), Environmental Component () and Social Component (ZSoc) are to be considered. This component represents the Total Operational Expenditure (OPEX). It aggregates fuel costs, operation and maintenance (O&M), start-up penalties, and the cost of reliability (unserved energy), as shown in Equation (2).
where is the linear marginal fuel cost, is the start-up cost, and is the Value of Lost Load (VoLL).
Environmental Component () quantifies the Global Warming Potential (GWP) of the operation. It is calculated by multiplying the power output by the specific emission factor of each technology, as shown in Equation (3).
where represents the emission factor in .
The Social Component () differs from conventional formulations. This model internalizes social externalities using a Social Price. The net social cost is defined as the summation of negative externalities (Health impacts and Socio-territorial rejection) minus positive externalities (Job creation) and it is expressed in Equation (4).
The coefficients used for the industrial case study are detailed in Table 2. These values represent externalities that are not currently reflected in the market price of energy. The externalities associated are contingent upon local conditions, national policy and regulation, and the manner in which energy generation technology is installed and operated. In this regard, a methodology for the quantification of social and environmental aspects is hereby proposed. Note that renewable technologies like Small Hydro (PCH) act as net social benefits (negative cost) due to high local employment and low health impacts.
Table 2.
Social Externality Coefficients and Net Social Cost used in the Case Study [35].
The formulation is detailed to capture the operational complexities of a modern hybrid system, including unit commitment dynamics, storage operation, and reserve requirements. Concurrently, it is conceptually novel in that it explicitly and quantitatively integrates social externalities alongside economic and environmental ones.
In the context of wind energy production, wind speed varies on temporal scales ranging from seconds to days and is characterized by a Weibull distribution. This information is instrumental in estimating expected production and resource reliability. In wind farms equipped with multiple turbines, the wake effect, which is the disturbance in the flow of air caused by the presence of another object, can result in a reduction in the wind speed available to turbines positioned to the leeward due to the turbulence induced by turbines positioned to the windward. This reduction in efficiency has been modeled by Jensen and Katic.
On the other hand, in the context of photovoltaic (PV) generation, transposition models are employed to calculate the irradiance on the panel plane, which may be inclined and oriented, based on measurements or forecasts of global horizontal irradiance (GHI). This work considers Perez’s anisotropic model [2], which separates diffuse irradiance into circumsolar, sky dome, and horizon components. This approach offers enhanced precision in tropical climates, such as that experienced in Colombia.
Additionally, losses may be attributed to factors such as soiling by dust or dirt accumulated on the panels, partial shading resulting from cloud cover or local obstacles, resistive losses in conductors and connections, mismatches between modules in the array due to manufacturing tolerances or uneven aging, and long-term degradation of the modules, such as the LID effect (Light-Induced Degradation) [1,2]. These losses result in a discrepancy between the actual and theoretical outputs, with the former being lower than the latter. This discrepancy is expressed as a percentage reduction in energy.
The social impacts derived from the operation of the electricity generation system are evaluated, recognizing that effects such as the employment generated by clean technologies or community rejection of specific facilities can and should be quantitatively internalized in the objective function. In order to achieve this objective, a comprehensive evaluation of both social benefits and social costs is conducted. These benefits and costs are defined on an hourly basis and by type of technology. The metrics and local data from the study region are utilized to inform this assessment. The decision to quantify a social metric is not a neutral technical exercise; it involves quantifying social aspects using the methodologies previously presented. The EEDS model incorporates the social dimension through quantifiable proxies, including the use of monetized health impacts (CSDS), job creation (BSE), and the Socio-Territorial Acceptance Index (IAST). Although these proxies permit the incorporation of energy justice within an optimization framework, it is imperative to acknowledge their constraints [21,33].
System Constraints where the minimization of Z is subject to the following physical and operational constraints. Power Balance Equation for every time step , the supply must equal the industrial demand plus battery charging and losses and it is expressed in Equation (5).
Generator Technical Limits as thermal units are constrained by their minimum () and maximum () effective capacity when committed (), as shown in Equation (6). Ramp rate limits constrain the change in power output between consecutive time steps (), as show in Equation (7).
Additionally, the Battery Energy Storage System (BESS) Dynamics facilitate inter-temporal energy arbitrage, thereby offering a comprehensive solution for energy management and sustainability. The state of charge () evolves according to the charging/discharging efficiency (), and it is expressed in Equation (8).
The energy stored and power flow are bounded by the physical capacity of the BESS (), and it is expressed in Equation (9).
The economic implications of operating a BESS encompass not only operational and maintenance expenses but, most notably, the cost of cell degradation resulting from utilization. The service life of batteries is limited in terms of total cycled energy; each charge/discharge cycle contributes to irreversible aging, reducing their capacity and eventually necessitating replacement [16]. In order to incorporate this effect into the optimization process, a cost per MWh cycled is calculated. This cost represents the wear and tear based on the number of equivalent full cycles (EFC) [30]. The calculation of the fraction of life consumed by having transferred a certain amount of energy through the BESS is then multiplied by the replacement cost. This results in a cost attributed to degradation per unit of energy handled. In the proposed EEDS optimization framework, the total costs associated with a BESS encompass operation and maintenance (O&M) costs, the degradation cost calculated as previously outlined, and a net social cost that reflects the externalities present within its life cycle.
Consequently, the establishment of Reserve Requirements is imperative to ensure reliability in the face of the inherent unpredictability associated with renewable energy sources (cloud cover or wind gusts). The system maintains a Spinning Reserve (), as show in Equation (10).
4. Methodology and Simulation Framework
To rigorously evaluate the impact of social externalities on microgrid operation, this study employs a custom-built computational framework developed in Python 3.10. The optimization core leverages the Pyomo algebraic modeling language to formulate the Mixed-Integer Linear Programming (MILP) problem, utilizing the Gurobi solver (v11.0) under a standard Academic License to handle the large-scale variables of the high-resolution dispatch. The simulation architecture follows a Two-Stage Rolling Horizon approach, designed to replicate the decision-making process of a system operator facing uncertainty. It is imperative to elucidate that the model results are presented for a typical day, despite the fact that the study and testing of the model transpired over a considerable number of days during a three-month period of economic dispatch, encompassing days with substantial fluctuations in energy generation or demand potential due to the El Niño phenomenon in Colombia.
The demand profile is constructed using a “bottom-up” aggregation approach based on high-resolution operational data from the Colombian National Interconnected System (SIN). The methodology for characterizing and clustering these consumption patterns follows the work of Toledo-Cortés et al. [17], which validates the use of aggregated load curves to represent specific consumer behaviors in the Colombian context. Furthermore, the processing of raw data, including the handling of variability and imputation of missing values to ensure profile continuity, is based on the shape modeling techniques proposed by Duarte et al. [36,37].
For the specific Industrial Case Study, the aggregate demand at time step is modeled as a weighted linear combination of normalized profiles () obtained from XM S.A.E.S.P. (the Independent System Operator). The curve is scaled to meet a daily energy target (), formulated as show in Equation (11).
where is the set of consumer classes. The weighting coefficients () defining the scenario are detailed in Table 3.
Table 3.
Demand Composition Coefficients for the Industrial Microgrid Scenario.
This specific mix () simulates a “Free Trade Zone” or an industrial park, characterized by a Load Factor of approximately 0.85. This rigidity presents a unique optimization challenge: unlike residential grids described in [35], there are no deep “valleys” in demand to naturally absorb excess solar generation at noon, requiring active management via BESS.
Stochastic Uncertainty Modeling has been considered in the development of the model. A critical feature of the framework is the differentiation between “Forecasted” and “Realized” profiles. To emulate the unpredictability of renewable generation and load deviations analyzed in [36], the model introduces synthetic stochasticity as show in Equation (12).
- Forecast (D-1): Deterministic profiles used for Unit Commitment.
- Realization (Real-Time): Perturbed profiles generated by injecting Gaussian noise into the demand and renewable curves.
This ensures that the dispatch solution is robust against realistic deviations , forcing the system to rely on spinning reserves and BESS ramping capabilities.
The simulation executes two sequential optimization processes for every 24-h cycle, enforcing a strict temporal coupling:
Stage 1: Day-Ahead Unit Commitment (D-1):
- Objective: Optimize the ON/OFF status of thermal units () to minimize expected costs (Economic + Social).
- Resolution: Hourly ().
- Output: A binary commitment vector .
- Constraint: This stage enforces spinning reserve requirements to cover the uncertainty modeled in Section 4
Stage 2: Real-Time Economic Dispatch (D):
- Objective: Optimize continuous power output () and BESS regulation ().
- Resolution: High-granularity (, steps).
- Coupling Constraint: The commitment variables are fixed parameters inherited from Stage 1 and it is expressed in Equation (13).
- Slack Variables: To prevent mathematical infeasibility during extreme ramps, the model allows for Energy Not Served () and Curtailment () at high penalty costs ().
The Python 3.10 software architecture utilizes a Dependency Injection pattern, ensuring that global parameters (carbon tax, social weights) are immutable during execution. Input data is validated against rigorous schema definitions using the Pydantic library, which rejects physically impossible states (e.g., negative generation or efficiency ) before the solver initialization. This guarantees the numerical stability and reproducibility of the results presented in this study.
5. Case Study: Industrial Demand Analysis
To validate the proposed EEDS framework, the model was executed under a “High-Reliability Industrial Scenario.” This section presents a detailed analysis of the operational behavior, emphasizing the interaction between the rigid industrial baseload, the stochasticity of renewable generation, and the “Social Merit Order” imposed by the objective function.
5.1. Demand Profile Characterization
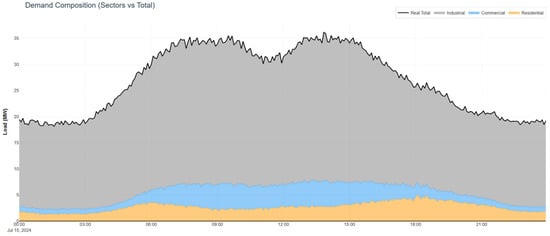
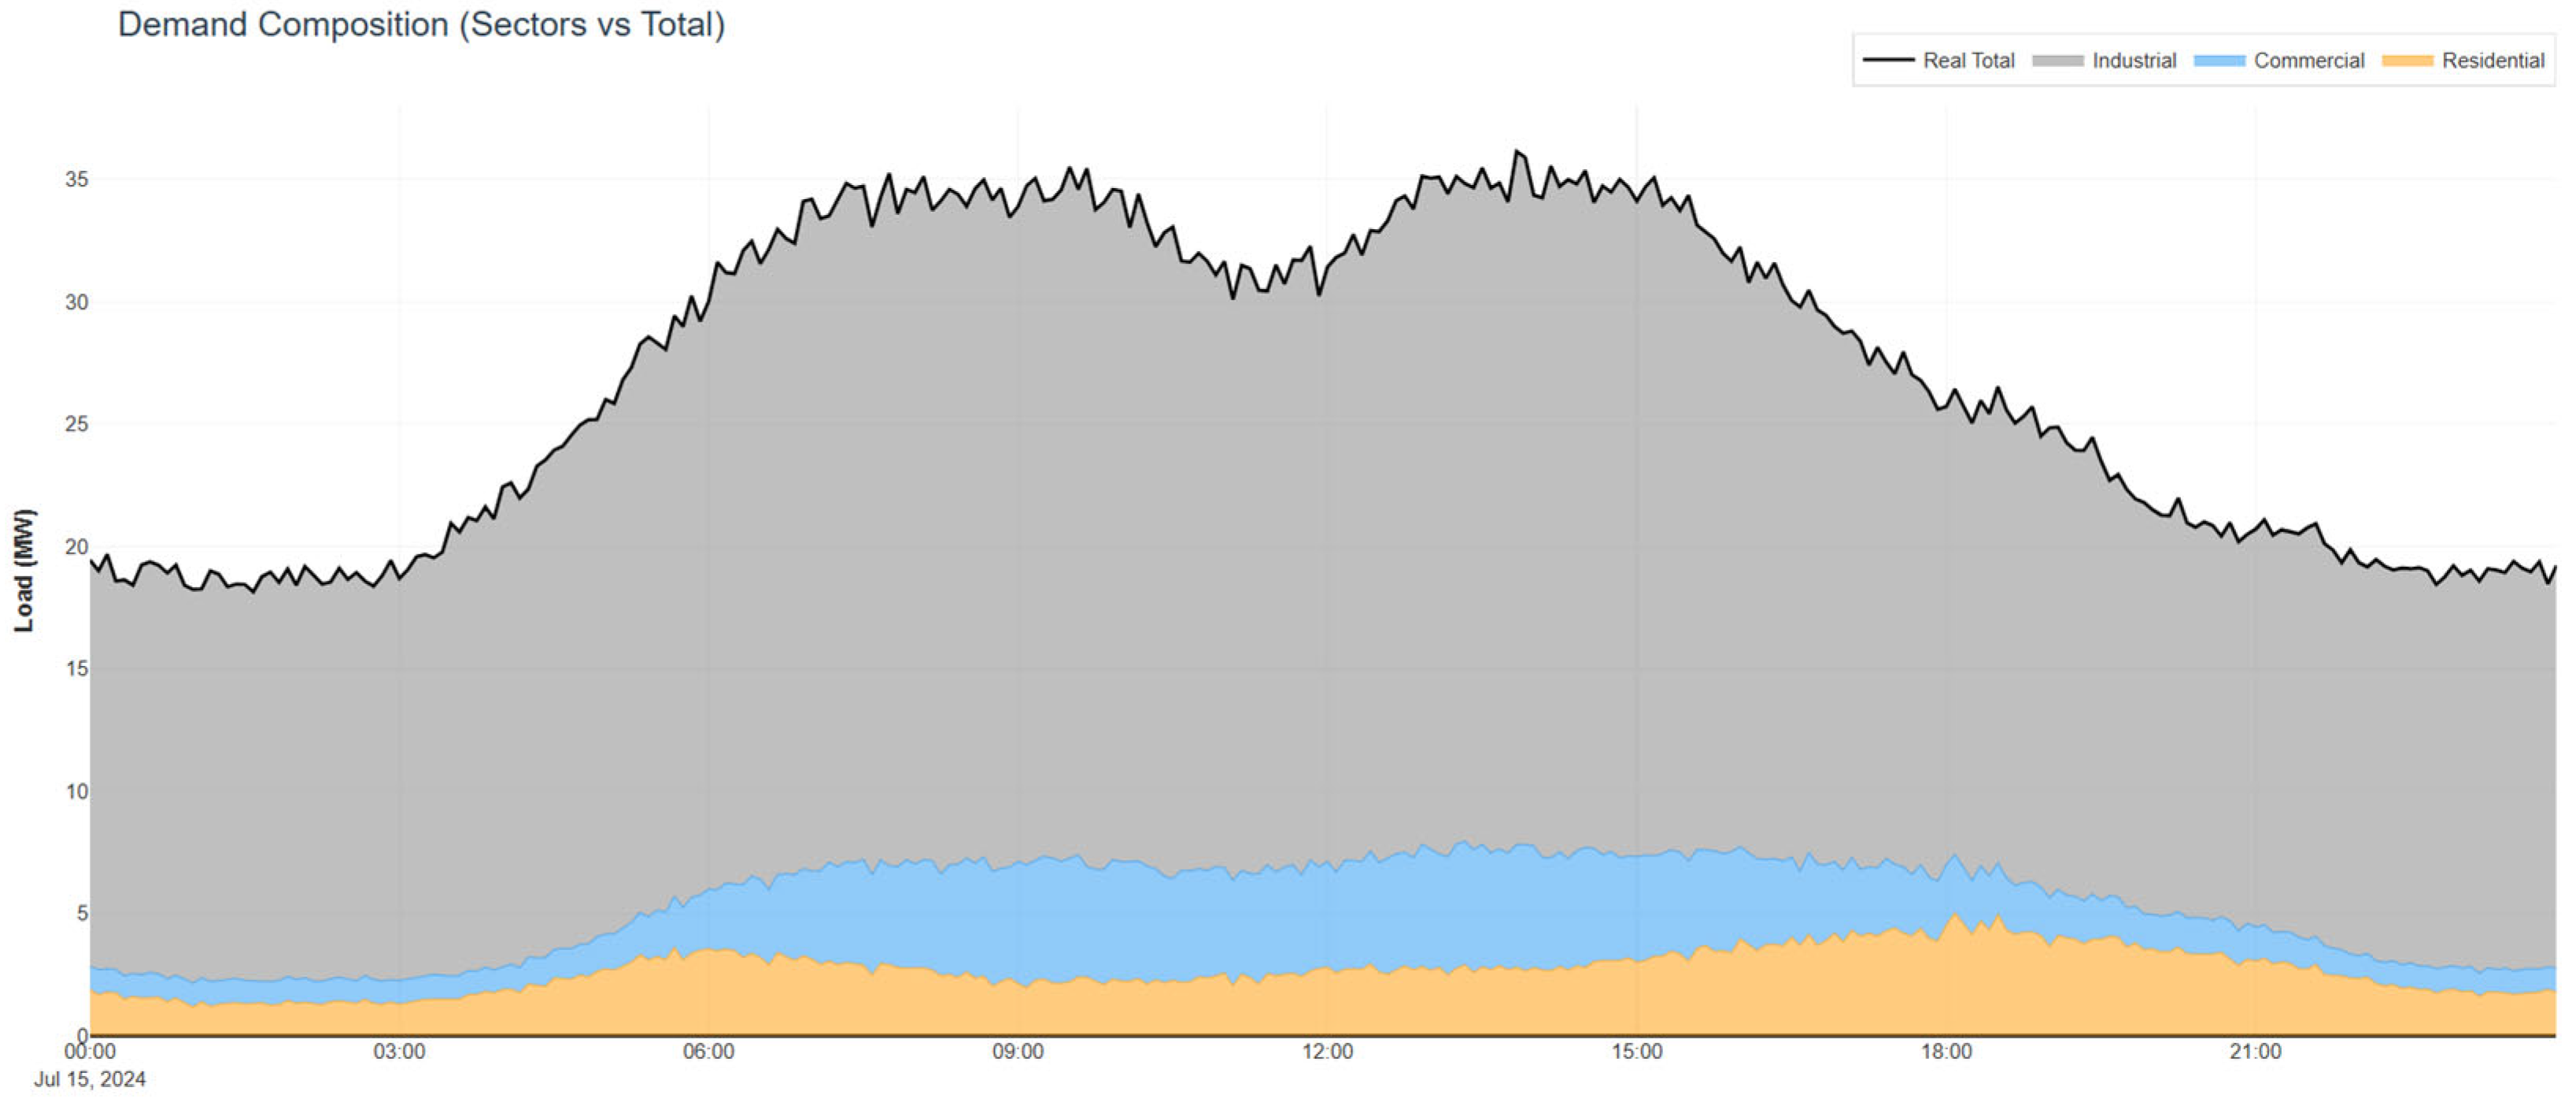
The simulated microgrid serves a Free Trade Zone with a daily energy consumption target of 650 MWh. As illustrated in Figure 1, the aggregate demand profile is dominated by the industrial component (), resulting in a load factor of approximately 0.85. Unlike residential profiles, which exhibit deep valleys during midday, the industrial load remains relatively flat between 25 MW and 28 MW throughout the operational window.
Figure 1.
Demand Decomposition by Sector.
5.2. Operational Dispatch Analysis (Day-Ahead vs. Real-Time)
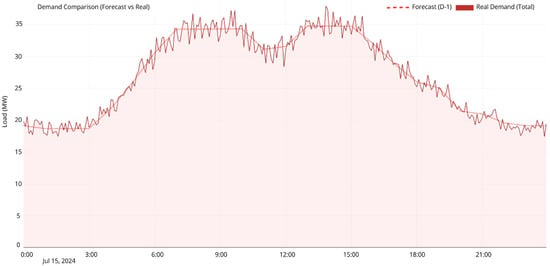
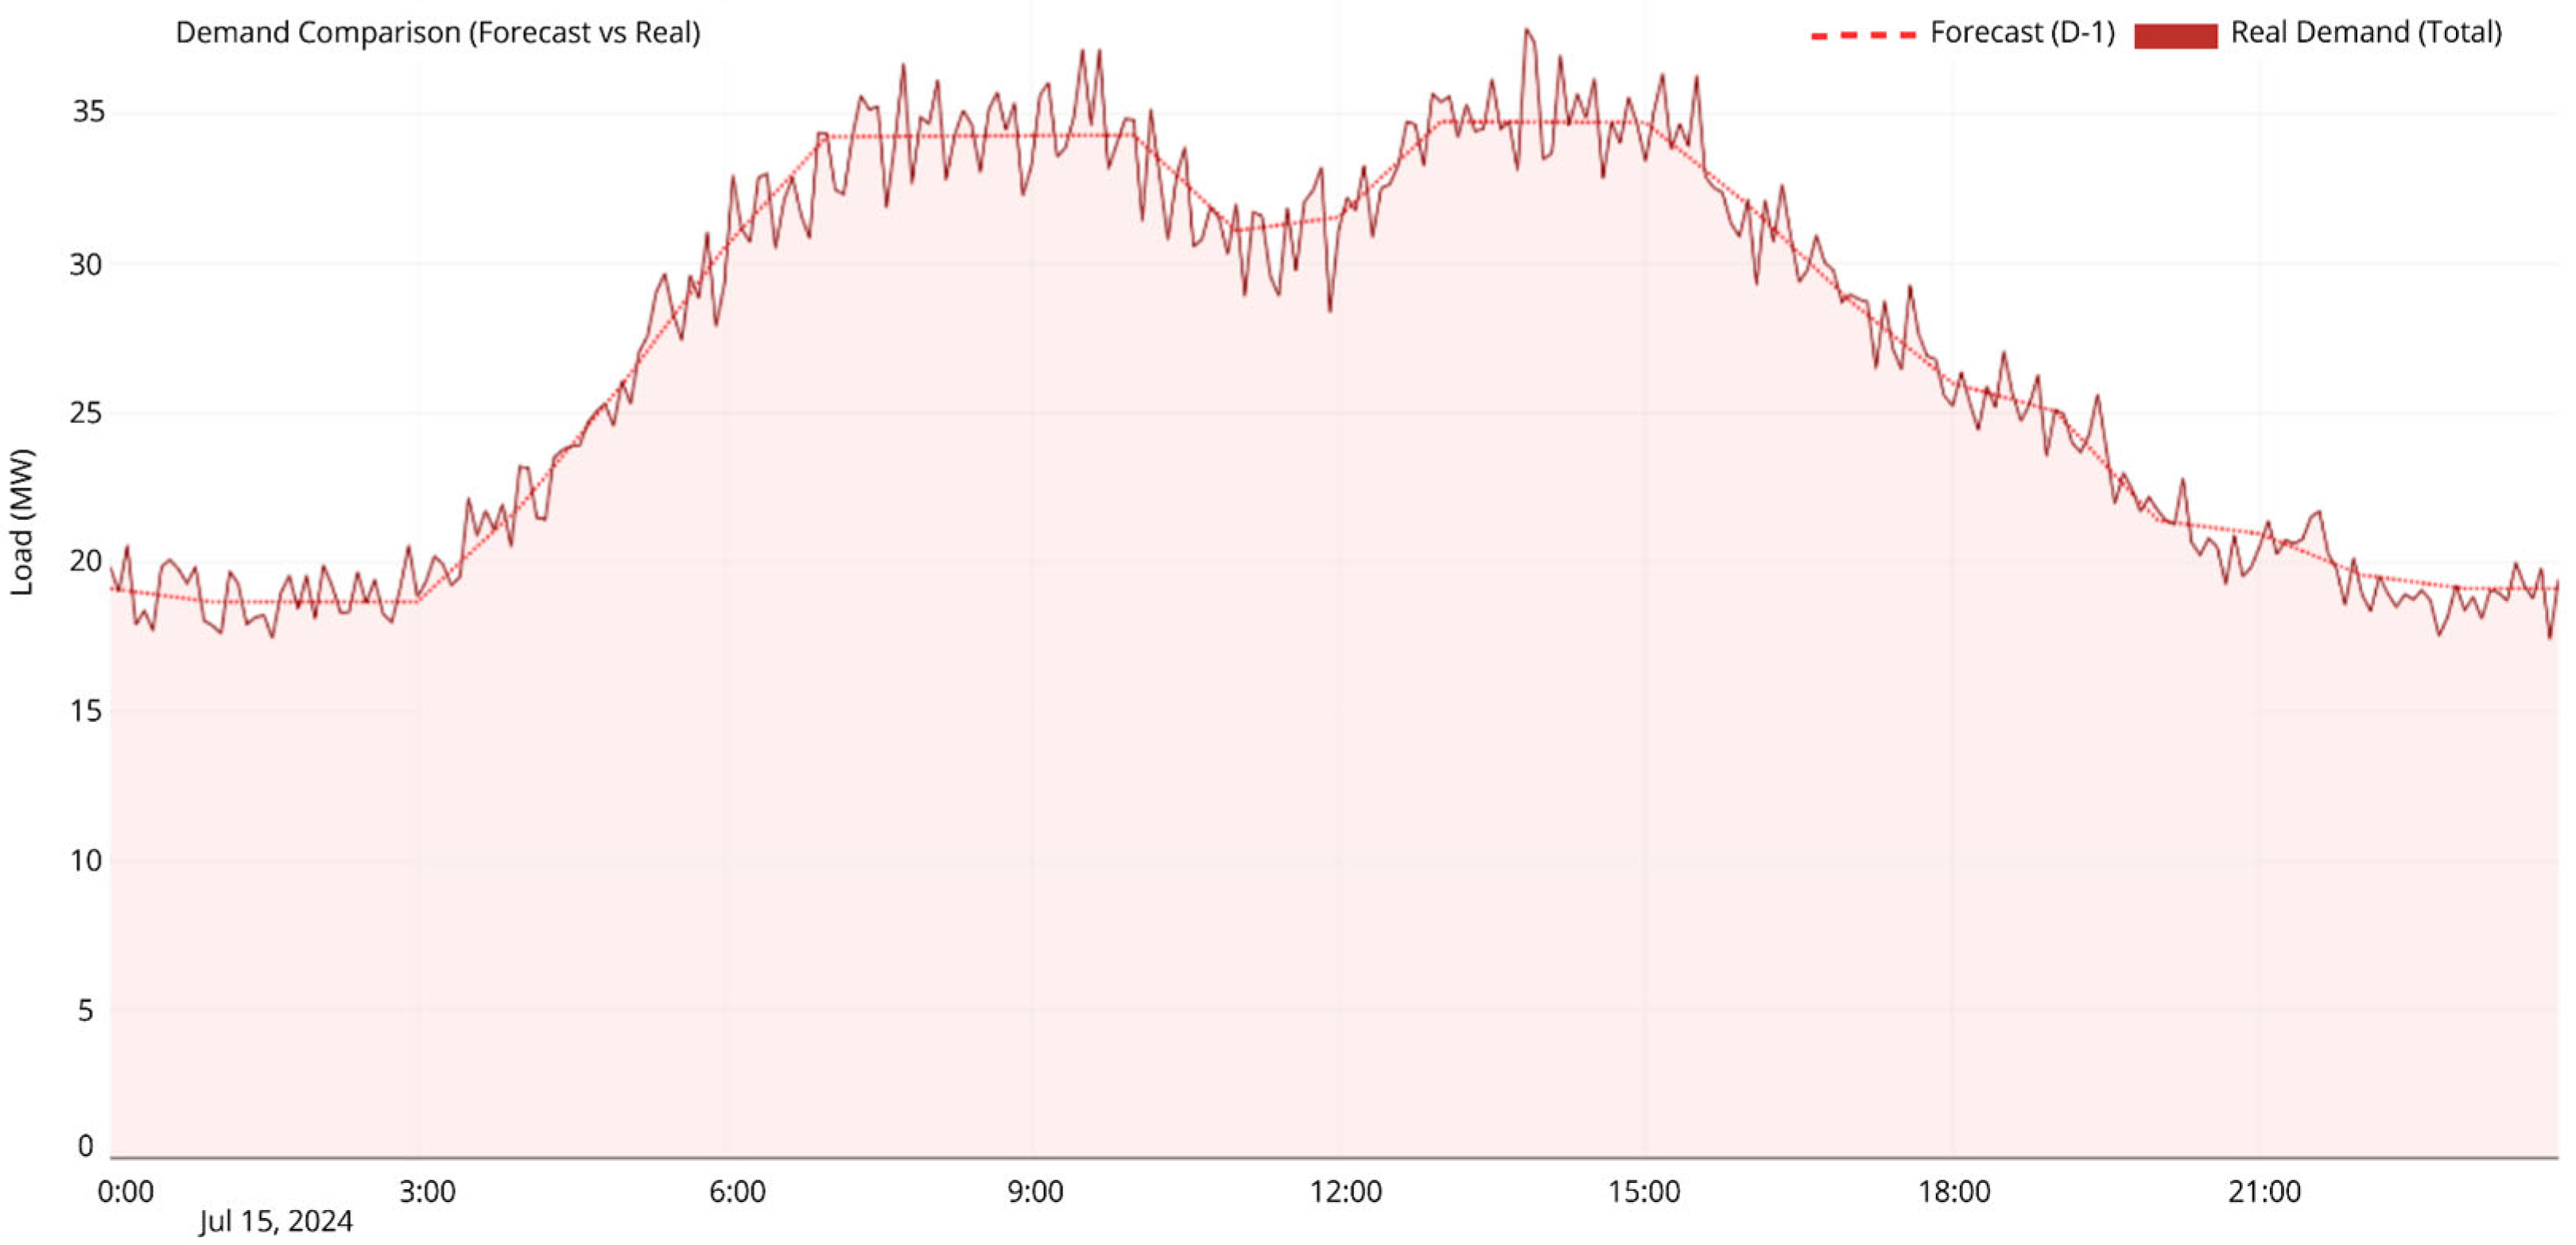
The Two-Stage optimization successfully managed the uncertainty inherent in the renewable profiles. Figure 2 compares the Day-Ahead (D-1) forecast against the Real-Time (RT) realization. The stochastic perturbation modeled in the Real-Time stage introduced a deviation in the net load. Despite these fluctuations, the system maintained a Loss of Load Probability (LOLP) of 0%, validating the robustness of the spinning reserve constraints programmed in the Unit Commitment stage.
Figure 2.
Forecast Accuracy Analysis.
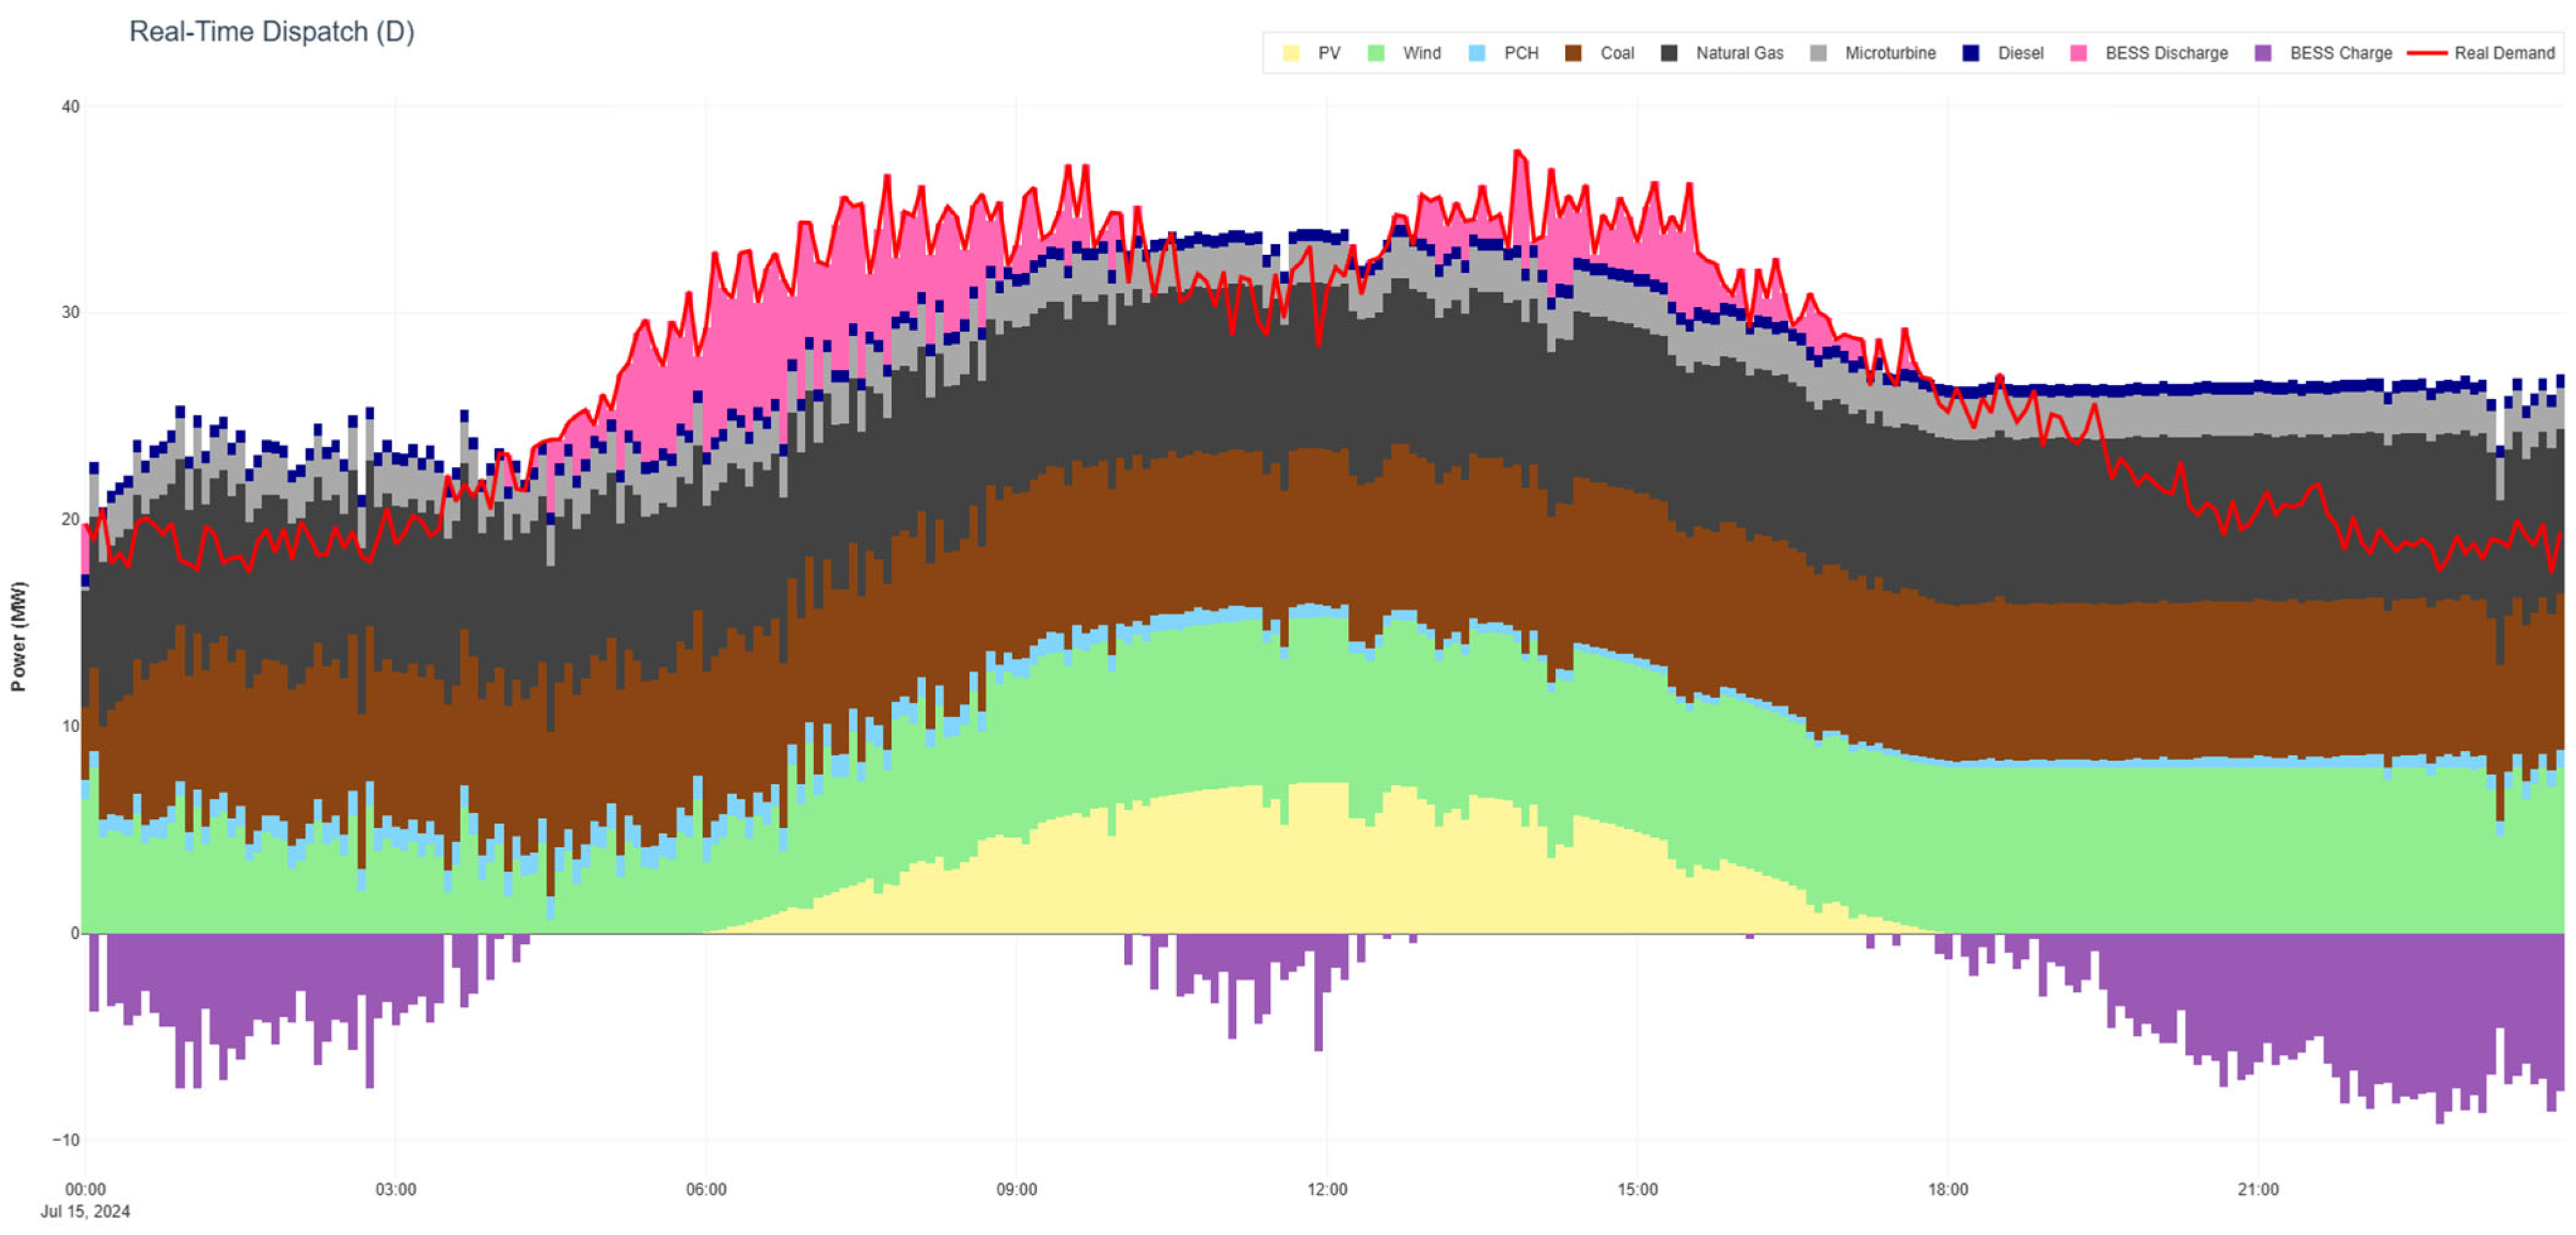
The Real-Time dispatch logic, depicted in Figure 3, reveals a “Socially Constrained Merit Order.” In a traditional cost-minimization model, the Coal unit would operate as baseload due to its low marginal fuel cost. However, under the EEDS formulation, the high Social Shadow Price of coal (+240,000 COP/MWh due to health/rejection penalties) forced its marginalization. Instead, the dispatcher prioritized:
Figure 3.
Real-Time Economic Dispatch Stack.
- Small Hydro (PCH—Blue): Dispatched at maximum capacity due to its negative social cost (Job Creation Benefit).
- Solar PV (Yellow): Providing the bulk of midday energy.
- Natural Gas: Filling the gaps due to its moderate social penalty relative to coal.
5.3. BESS Dynamics
The Battery Energy Storage System played a pivotal role in the industrial setting, performing 0.87 equivalent cycles per day. The operation followed a distinct “Social Arbitrage” strategy:
- Charging (11:00–14:00): The BESS absorbed excess Solar PV generation (Negative Price periods). Without storage, approx. 4 MW of solar power would have been curtailed during the lunch hour.
- Discharging (18:00–21:00): The stored energy was injected during the evening ramp. Critically, this discharge did not just shave the peak; it displaced the need to ramp up the Diesel backup generator or the Coal plant, thereby avoiding the highest marginal social costs of the day.
5.4. Price Composition
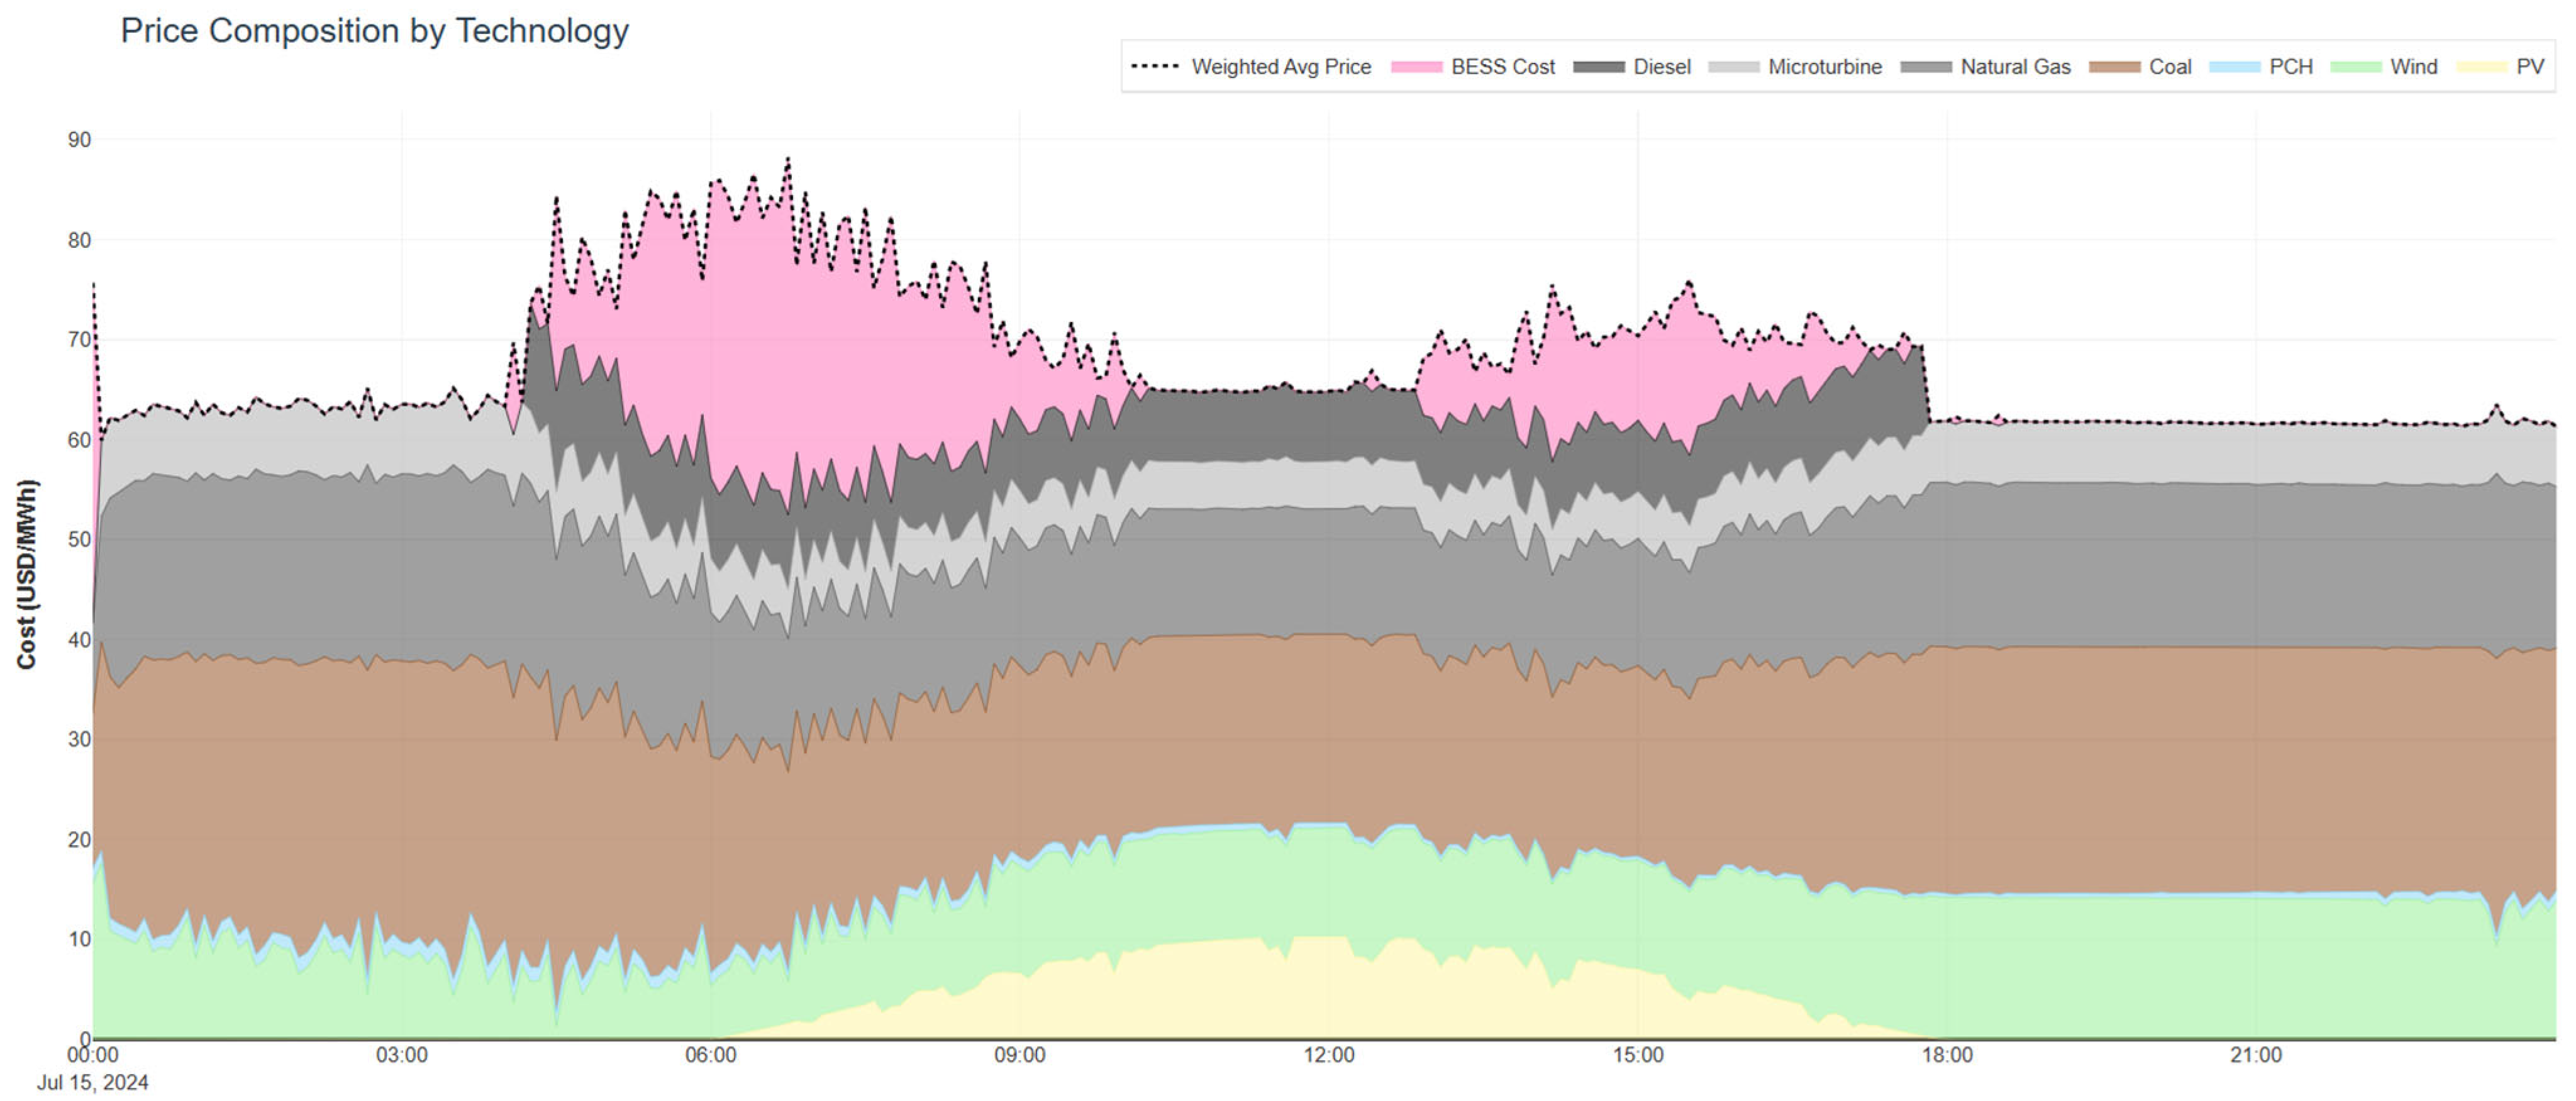
The behavior of the System Marginal Price (SMP) offers profound insights into the interaction between physical constraints and the multi-objective dispatch logic. As illustrated in Figure 4, the composition of the electricity price is not driven solely by fuel costs but is deeply influenced by the scarcity of flexibility and the internal social valuation of technologies.
Figure 4.
Decomposition of the Energy Price.
The base of the merit order is formed by the renewable fleet (Solar PV, Wind, and Small Hydro—PCH). The optimization results confirm a “must-take” dispatch logic: the system absorbs 100% of the available renewable generation throughout the day.
A critical finding is the restructuring of the thermal stack. In conventional markets, Coal would precede Natural Gas due to lower fuel costs. However, the EEDS formulation applies a heavy social penalty to Coal ($+240,000$ COP/MWh). Consequently, the optimal dispatch order observed is:
- Renewables (Base): Solar/Wind/PCH.
- BESS Discharge: Mid-merit resource.
- Natural Gas: Dispatchable flexible generation.
- Coal: Displaced to the margin (peaker role) or completely shut down.
- Diesel: Emergency backup only.
The red trajectory in Figure 4 represents the component of the price derived from system constraints (Lagrange multipliers). Unlike fuel costs, which are constant per MWh, this curve spikes dynamically.
The spikes observed (particularly during the evening ramp at 18:00) do not indicate expensive fuel but rather flexibility scarcity. When the demand increases faster than the thermal units can ramp up (Ramp-Rate Constraints), the “Shadow Price” of the constraint activates. The solver is indicating that the cost of delivering the next MW is driven by the difficulty of maneuvering the heavy thermal machinery, creating a “scarcity rent.”
The Battery Energy Storage System acts as a price arbitrageur. Its operation is inversely correlated with the net demand:
- Charging Phase: When demand decreases relative to generation (midday solar peak), the marginal price drops. The BESS identifies this opportunity cost and activates charging mode, effectively buying energy at the “Renewable Base” price.
- Discharging Phase: When the “Red Curve” signals high constraint costs (evening), the BESS discharges. This confirms that storage is not merely shifting energy but providing ramp support, preventing the system from hitting hard constraints that would otherwise trigger load shedding or extreme prices.
5.5. Sensitivity Analysis
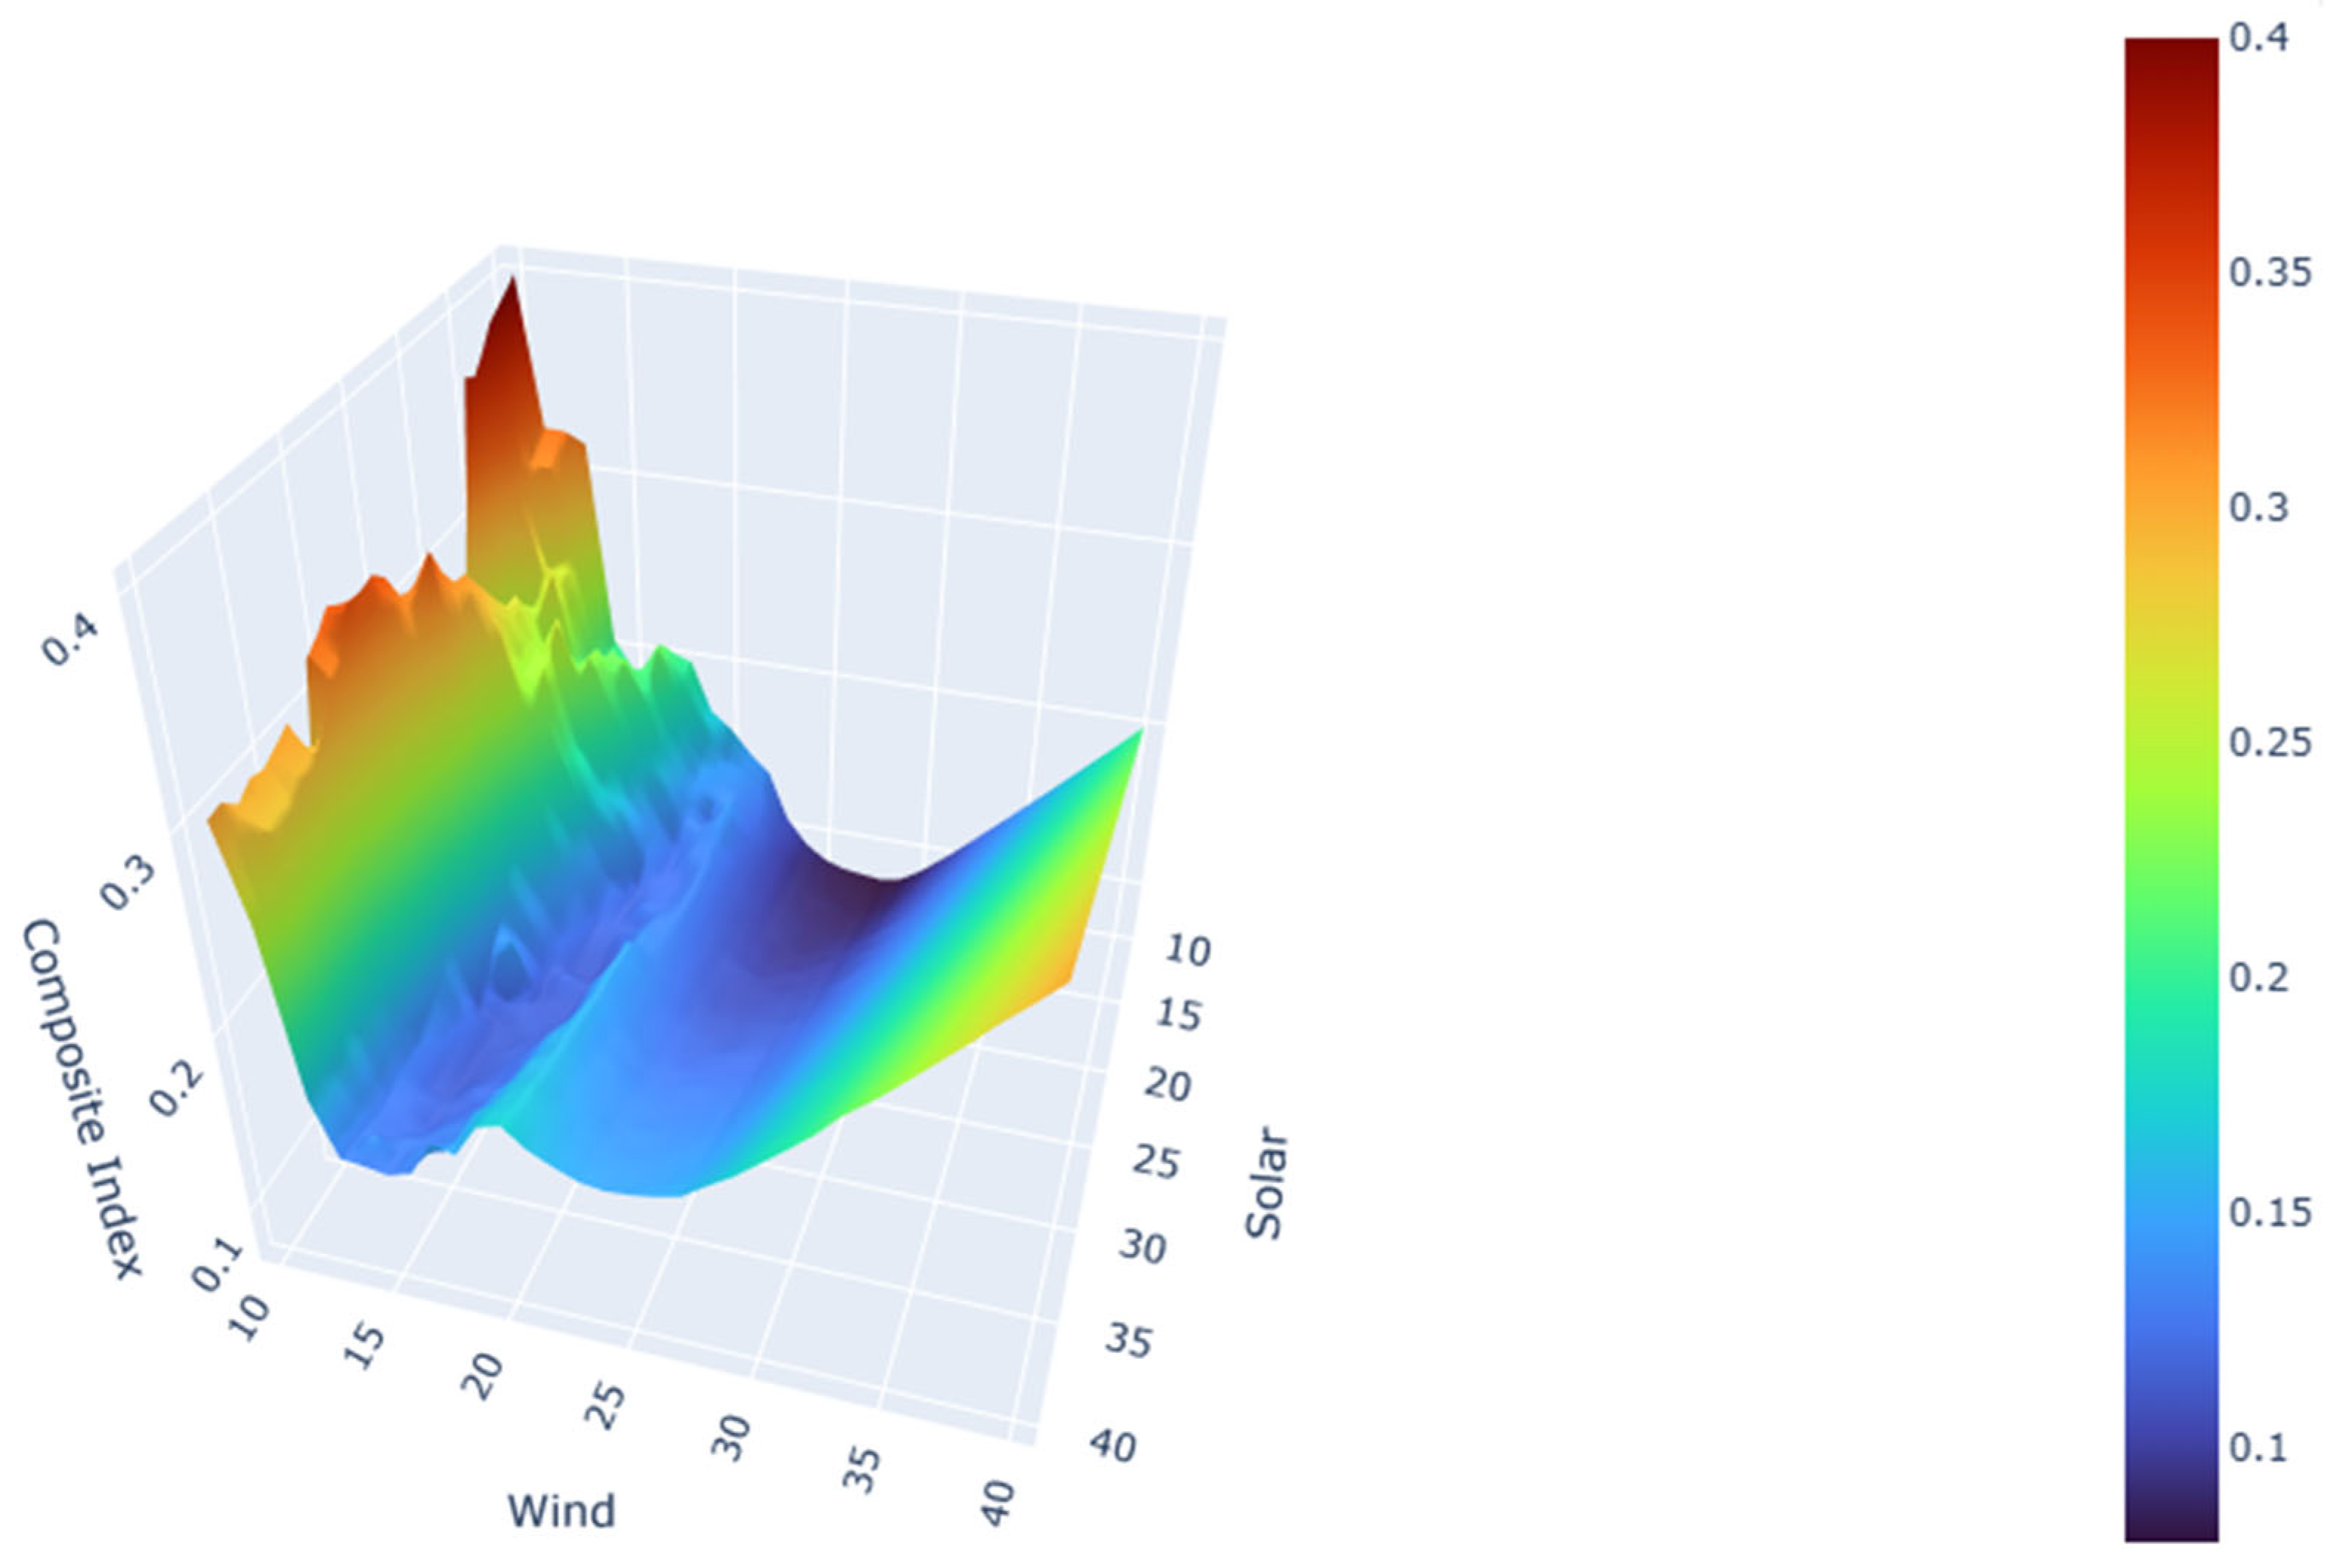
To determine the optimal configuration of renewable capacity that minimizes the proposed EEDS objectives, a comprehensive parametric sweep was conducted. The analysis evaluated 441 discrete scenarios, varying Solar PV capacity () and Wind capacity () from 10 MW to 40 MW in steps of 1 MW. This “Grid Search” approach allows for the visualization of the non-linear operational response of the microgrid.
The construction of the composite index constitutes a significant challenge in multi-objective sensitivity analysis. This challenge arises from the dimensionality reduction required to visualize conflicting metrics, specifically economic cost (COP), reliability (energy not served—ENS), and efficiency (curtailment). To address this, we developed a scalar Composite Sustainability Index (). Since the raw metrics possess disparate units and magnitudes (e.g., Costs in COP vs. Curtailment in MWh), a Min-Max Normalization technique was applied to each vector x across the set of all scenarios . This transformation maps all values to a dimensionless range [0, 1] as show in Equation (14).
Therefore, the composite index for each scenario is defined as the weighted Euclidean sum of the normalized operational cost (), the normalized unserved energy (), and the normalized renewable curtailment () and it is expressed in Equation (15).
where the weighting factors were set to emphasize economic efficiency while strictly penalizing technical inefficiency (). These parameter weights function as a reference point for evaluating the prioritization established in the energy service coverage and quality policy for industry in Colombia. This energy supply is prioritized with energy from the interconnected electricity grid, subsequently penalizing energy that is not supplied and seeking to incentivize generation with renewable resources. A lower value of indicates a system state that is closer to the “Ideal Point” (Minimum Cost, Zero Blackouts, Zero Waste).
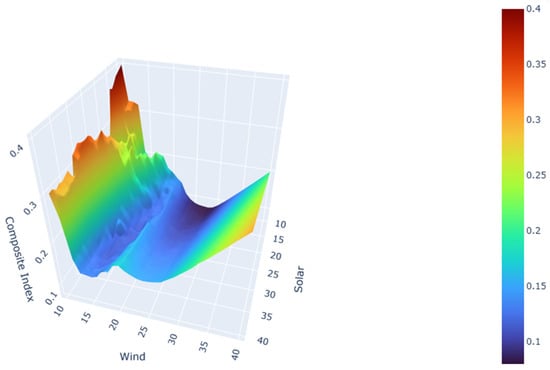
The resulting optimization landscape is visualized in Figure 5. The surface topology exhibits a strictly convex region, confirming the existence of a unique global optimum within the search space.
Figure 5.
Multi-dimensional Sensitivity Analysis.
The numerical results identify the global optimum at the coordinate (Solar = 10 MW, Wind = 28 MW), yielding a Composite Index of 0.0799. This configuration represents the “Sweet Spot” where the marginal reduction in social/economic costs provided by an additional MW of capacity is exactly offset by the marginal penalty of increased curtailment and investment amortization.
The optimization results reveal a distinct asymmetry in the system’s sensitivity to renewable resource types. The gradient of the objective function is notably steeper along the Solar PV axis compared to the Wind axis. This behavior indicates that the industrial microgrid characterized by a flat, continuous 24-h demand profile benefits significantly more from the stochastic but temporally distributed nature of wind power than from the highly concentrated generation of solar PV.
While solar production is compressed into a narrow 6-h window (10:00–16:00), leading to rapid saturation of the BESS charging rate and subsequent energy dumping, wind generation in the analyzed region exhibits a diurnal pattern that often complements the solar drop-off. Consequently, the optimal mix favors a higher proportion of wind capacity (28 MW) relative to solar (10 MW), as the system can absorb this distributed energy injection to displace baseload thermal generation without incurring the severe “Cannibalization Effects” observed with oversized solar arrays.
The consolidation of results from the deterministic daily simulation and the multi-dimensional sensitivity analysis confirms the transformative potential of the EEDS framework for industrial microgrids. To ensure the robustness of these findings, the validation was performed on a high-resolution temporal framework ( steps with 5-min granularity) over a 24-h horizon, simulating a typical industrial demand of 650 MWh. A critical component of this setup was the Battery Energy Storage System (BESS), modeled with a power capacity of 10 MW and an energy capacity of 40 MWh, constrained by a target State of Charge (SoC) of 85% to ensure long-term sustainability. Additionally, to guarantee system security against the stochastic deviations of renewable generation (), a Spinning Reserve constraint of 0.5 MW was enforced throughout the dispatch horizon.
Under the base operational configuration (10 MW Solar/8 MW Wind), the system demonstrated high functional reliability, achieving an average operational energy price of 339.3 COP/kWh and a Total Daily Operational Cost (OPEX) of 11.23 MCOP. Notably, the storage system transcended its traditional peak-shaving role, performing 0.87 equivalent daily cycles to execute a “Social Arbitrage” strategy. This behavior was critical not only for energy shifting but for providing the necessary ramping capability to manage the reserve requirements without committing expensive thermal peakers.
Beyond the daily operation, the sensitivity analysis revealed a critical “Price–Cost Paradox” rooted in the physical nature of the resources. If the objective was restricted solely to minimizing the Total Daily Operational Cost (OPEX), the solver would converge to a solar-heavy mix (32 MW Solar/15 MW Wind). While this configuration yields the lowest daily expenditure (151.0 MCOP) by displacing massive fuel volumes at midday, it results in a relatively high average energy price of 233.9 COP/kWh. This discrepancy arises from the Cost of Flexibility Constraints: in a solar-heavy scenario, the system experiences extreme ramp rates during sunset (17:00–19:00). These physical limitations trigger high “Shadow Prices” (Lagrange multipliers associated with ramp constraints), as the thermal fleet must maneuver aggressively to replace the fading solar power. Consequently, while fuel costs are low, the scarcity rent for flexibility spikes, driving up the marginal price.
In contrast, when the Composite Sustainability Index is applied, the Global Optimum shifts towards a wind-dominant configuration of 10 MW Solar and 28 MW Wind. Although this scenario has a slightly higher daily OPEX (153.0 MCOP, +1.3%), it achieves a significantly lower average energy price of 206.0 COP/kWh. This superior performance is driven by two factors: first, the wind profile is more temporally distributed, reducing the magnitude of the evening ramp and thus lowering the shadow cost of constraints. Second, the wind capacity contributes more effectively to the spinning reserve during off-peak hours, freeing up the BESS to focus on social arbitrage rather than frequency support. Consequently, the “Optimal EEDS” mix demonstrates that for 24-h industrial baseloads, a flatter generation profile is structurally more efficient, minimizing both the social externalities of fossil backup and the hidden costs of system rigidity.
6. Conclusions
This study addressed the critical gap in power system operations regarding the integration of socio-territorial externalities. The incorporation of social and environmental dimensions into economic dispatch, as exemplified by the development and validation of the economic, environmental, and social dispatch (EEDS) model, underscores the viability of integrating social impacts within the mathematical objective function. This integration is not only computationally feasible through the utilization of MILP formulations but also signifies a fundamental shift in the paradigm of the energy transition. The application of the EEDS framework to a high-reliability industrial microgrid confirms that the introduction of quantified “Social Prices” effectively reshapes the dispatch logic. The results prove that socially regressive technologies, such as coal-fired generation in populated areas, are marginalized by the optimization algorithm despite their low direct fuel costs. This indicates that mathematical optimization can successfully enforce a “Just Energy Transition” operational policy, prioritizing technologies with positive local externalities such as employment-intensive small hydro without compromising system reliability or resulting in unserved energy.
In this context, the Battery Energy Storage System (BESS) emerges as a pivotal instrument of social justice rather than merely a technical asset. In industrial settings characterized by rigid baseloads, the BESS transcended its traditional roles of peak shaving or frequency regulation to execute a distinct “Social Arbitrage” strategy. By cycling approximately 0.87 times per day, the storage system effectively decoupled industrial consumption from high-externality generation periods, shifting renewable energy to cover evening ramp constraints. This behavior acts as a buffer that minimizes the “scarcity rent” of flexibility and prevents the dispatch of backup fossil units, thereby directly reducing the social footprint of industrial productivity.
Furthermore, the sensitivity analysis revealed a counter-intuitive “Price–Cost Paradox” regarding resource complementarity. While a solar-heavy configuration minimizes the generalized investment cost due to low technology prices, it succumbs to the “Cannibalization Effect” caused by midday saturation and storage limits. Conversely, the optimal EEDS configuration favors a wind-dominant mix (28 MW Wind/10 MW Solar). These finding highlights that for flat industrial demand profiles, the temporal consistency of wind power offers superior complementarity, resulting in a 12% lower average energy price and higher effective utilization of storage assets compared to solar-centric designs. Consequently, the findings suggest that energy policy in emerging economies should evolve from simple Carbon Taxes towards comprehensive “Sustainability Taxes” that reflect local health and employment impacts. Future research will expand this deterministic framework into a Stochastic Programming model to explicitly minimize the Conditional Value at Risk (CVaR) associated with hydrological variability, further robustifying the decision-making process under extreme climate uncertainty.
Author Contributions
Conceptualization, J.C.-N. and R.I.-R.; methodology, R.I.-R. and J.R.-G.; software, J.C.-N.; validation, J.C.-N. and J.R.-G.; formal analysis, J.C.-N.; investigation, J.C.-N. and J.R.-G.; resources, R.I.-R.; data curation, J.C.-N.; writing—original draft preparation, J.C.-N.; writing—review and editing, J.C.-N. and J.R.-G.; visualization, J.C.-N.; supervision, J.R.-G. and R.I.-R.; project administration, J.R.-G. and R.I.-R. All authors have read and agreed to the published version of the manuscript.
Funding
This research was supported by Electrical Machines and Drives (EM&D) from Universidad Nacional de Colombia, Energy Solutions Cooperation Network for Communities, code: 59384 and Red Iberoamericana de Promoción de Comunidades Energéticas Locales para la Transición Justa y Sostenible, RIPCEL code 726RT0203, funded by Programa CYTED.
Data Availability Statement
The data presented in this study are not publicly available due to confidentiality agreements with the industrial facility where the measurements were obtained.
Conflicts of Interest
The authors declare no conflicts of interest.
Abbreviations
The following abbreviations are used in this paper:
| AHP | Analytic Hierarchy Process |
| BESS | Battery Energy Storage System |
| CAPEX | Capital Expenditure |
| CO2 | Carbon Dioxide |
| COP | Colombian Peso |
| CVaR | Conditional Value at Risk |
| EEDS | Economic, Environmental, and Social Dispatch |
| ENS | Energy Not Served |
| GWP | Global Warming Potential |
| LOLP | Loss of Load Probability |
| MCDM | Multi-Criteria Decision Making |
| MILP | Mixed-Integer Linear Programming |
| MW/MWh | Megawatt/Megawatt-hour |
| NGCC | Natural Gas Combined Cycle |
| NMC | Nickel Manganese Cobalt |
| NOx | Nitrogen Oxides |
| O&M | Operation and Maintenance |
| OCGT | Open Cycle Gas Turbine |
| ODS | Sustainable Development Goals |
| OPEX | Operational Expenditure |
| PCH | Small Hydro Power Plant |
| PM2.5 | Particulate Matter ≤ 2.5 µ |
| PV | Photovoltaic |
| SIN | National Interconnected System |
| SMP | System Marginal Price |
| SoC | State of Charge |
| SOx | Sulfur Oxides |
| STLF | Short-Term Load Forecasting |
| TEJ | Just Energy Transition |
| UC | Unit Commitment |
| UPME | Mining and Energy Planning Unit |
| VoLL | Value of Lost Load |
| XM | Market Experts |
References
- International Renewable Energy Agency (IRENA). World Energy Transitions Outlook 2022: 1.5 °C Pathway; IRENA: Abu Dhabi, United Arab Emirates, 2022; Available online: https://www.irena.org/publications/2022/Mar/World-Energy-Transitions-Outlook-2022 (accessed on 10 January 2026).
- National Renewable Energy Laboratory (NREL). Integrating Variable Renewable Energy Into the Grid: Key Issues and Considerations: NREL/TP-6A20-66377. 2016. Available online: https://docs.nlr.gov/docs/fy16osti/66377.pdf (accessed on 10 January 2026).
- Giedraityte, A.; Rimkevicius, S.; Marciukaitis, M.; Radziukynas, V.; Bakas, R. Hybrid renewable energy systems—A review of optimization approaches and future challenges. Appl. Sci. 2025, 15, 1744. [Google Scholar] [CrossRef] [Scilit]
- Kiasari, M.; Ghaffari, M.; Aly, H.H. A comprehensive review of the current status of smart grid technologies for renewable energies integration and future trends: The role of machine learning and energy storage systems. Energies 2024, 17, 4128. [Google Scholar] [CrossRef] [Scilit]
- United Nations. Affordable and Clean Energy: Sustainable Development Goal 7. 2024. Available online: https://www.un.org/sustainabledevelopment/energy/ (accessed on 10 January 2026).
- U.S. Energy Information Administration (EIA). Levelized Costs of New Generation Resources in the Annual Energy Outlook 2023; U.S. Department of Energy: Washington, DC, USA, 2023. [Google Scholar]
- UNDP. Energy Poverty is Much More than the Lack of a Service; United Nations Development Programme (UNDP) Argentina: Buenos Aires, Argentina, 2024; Available online: https://www.undp.org/es/argentina/blog/la-pobreza-energetica-es-mucho-mas-que-la-falta-de-un-servicio (accessed on 10 January 2026).
- Wood, A.J.; Wollenberg, B.F.; Sheblé, G.B. Power Generation, Operation, and Control, 3rd ed.; Wiley: Hoboken, NJ, USA, 2013. [Google Scholar]
- Wang, H.; Xu, Y.; Yi, Z.; Xu, J.; Xie, Y.; Li, Z. A review on economic dispatch of power system considering atmospheric pollutant emissions. Energies 2024, 17, 1878. [Google Scholar] [CrossRef] [Scilit]
- Jenkins, K.; McCauley, D.; Heffron, R.; Stephan, H.; Rehner, R. Energy justice: A conceptual review. Energy Res. Soc. Sci. 2016, 11, 174–182. [Google Scholar] [CrossRef] [Scilit]
- Baker, E.; Carley, S.; Castellanos, S.; Nock, D.; Bozeman, J.F.; Konisky, D.; Monyei, C.G.; Shah, M.; Sovacool, B. Metrics for decision-making in energy justice. Annu. Rev. Environ. Resour. 2023, 48, 737–760. [Google Scholar] [CrossRef] [Scilit]
- Morales-España, G.; Latorre, J.M.; Ramos, A. Tight and compact MILP formulation for the thermal unit commitment problem. IEEE Trans. Power Syst. 2013, 28, 4897–4908. [Google Scholar] [CrossRef] [Scilit]
- Ostrowski, J.; Anjos, M.F.; Vannelli, A. Modified orbital branching for structured symmetry with an application to unit commitment. Math. Program. 2015, 150, 99–129. [Google Scholar] [CrossRef] [Scilit]
- Shan, S.; Li, Y.; Yang, Y.; Zhang, H.; Li, J. Quantifying social justice in energy transition: A policy-driven assessment framework for China. Systems 2025, 13, 201. [Google Scholar] [CrossRef] [Scilit]
- Directorate of National Taxes and Customs (DIAN). Resolution Number 000007 of 2024. 2024. Available online: https://www.dian.gov.co/normatividad/Normatividad/Resoluci%C3%B3n%20000007%20de%2031-01-2024.pdf (accessed on 10 January 2026).
- Hannan, M.A.; Al-Shetwi, A.Q.; Begum, R.A.; Ker, P.J.; Rahman, S.A.; Mansor, M.; Mia, M.S.; Muttaqi, K.M.; Dong, Z.Y. Impact assessment of battery energy storage systems towards achieving sustainable development goals. J. Energy Storage 2021, 42, 103040. [Google Scholar] [CrossRef] [Scilit]
- Toledo-Cortés, S.; Lara, J.S.; Zambrano, A.; González-Osorio, F.A.; Rosero-García, J. Characterization of electricity demand based on energy consumption data from Colombia. Int. J. Electr. Comput. Eng. (IJECE) 2023, 13, 4798–4809. [Google Scholar] [CrossRef] [Scilit]
- Bai, Y.; Wu, X.; Xia, A. An enhanced multi-objective differential evolution algorithm for dynamic environmental economic dispatch of power system with wind power. Energy Sci. Eng. 2021, 9, 316–329. [Google Scholar] [CrossRef] [Scilit]
- Frangioni, A.; Gentile, C.; Lacalandra, F. Solving unit commitment problems with general ramp constraints. Int. J. Electr. Power Energy Syst. 2008, 30, 316–326. [Google Scholar] [CrossRef] [Scilit]
- Morales-España, G.; Latorre, J.M.; Ramos, A. Tight and compact MILP formulation of start-up and shut-down ramping in unit commitment. IEEE Trans. Power Syst. 2013, 28, 1288–1296. [Google Scholar] [CrossRef] [Scilit]
- Samarakoon, S. A justice and wellbeing centered framework for analysing energy poverty in the Global South. Ecol. Econ. 2019, 165, 106385. [Google Scholar] [CrossRef] [Scilit]
- Omar, A.I.; Ali, Z.M.; Al-Gabalawy, M.; Abdel Aleem, S.H.E.; Al-Dhaifallah, M. Multi-objective environmental economic dispatch of an electricity system considering integrated natural gas units and variable renewable energy sources. Mathematics 2020, 8, 1100. [Google Scholar] [CrossRef] [Scilit]
- Deb, K. Multi-Objective Optimization Using Evolutionary Algorithms; Wiley: New York, NY, USA, 2001. [Google Scholar]
- Mejía Gaviria, K.D. Impactos Sociales y el Tamaño Óptimo de los Megaproyectos Hidroeléctricos [Social Impacts and the Optimal Size of Hydroelectric Megaprojects]. Master’s Thesis, Universidad Nacional de Colombia, Medellín, Colombia, 2018. Available online: https://repositorio.unal.edu.co/handle/unal/68637 (accessed on 30 January 2026).
- Samadi, S. The social costs of electricity generation—Categorising different types of costs and evaluating their respective relevance. Energies 2017, 10, 356. [Google Scholar] [CrossRef] [Scilit]
- Stigka, E.K.; Paravantis, J.A.; Mihalakakou, G.K. Social acceptance of renewable energy sources: A review of contingent valuation applications. Renew. Sustain. Energy Rev. 2014, 32, 100–106. [Google Scholar] [CrossRef] [Scilit]
- Wüstenhagen, R.; Wolsink, M.; Bürer, M.J. Social acceptance of renewable energy innovation: An introduction to the concept. Energy Policy 2007, 35, 2683–2691. [Google Scholar] [CrossRef] [Scilit]
- Morán Meza, E.P. Estudio de Aceptación Social y las Nuevas Fuentes de Energías Renovables [Study of Social Acceptance and New Renewable Energy Sources]. Bachelor’s Thesis, Universidad Politécnica Salesiana, Guayaquil, Ecuador, 2022. Available online: http://dspace.ups.edu.ec/handle/123456789/22794 (accessed on 30 January 2026).
- International Renewable Energy Agency (IRENA). Renewable Energy and Jobs: Annual Review 2020; IRENA: Abu Dhabi, United Arab Emirates, 2020. [Google Scholar]
- Khalilisenobari, R.; Wu, M. Optimal participation of price-maker battery energy storage systems in energy and ancillary services markets considering degradation cost. Int. J. Electr. Power Energy Syst. 2022, 138, 107924. [Google Scholar] [CrossRef] [Scilit]
- Shakil, S.M.; Hossain, A.; Ullah, M.S. Optimal BESS management for peak shaving integrating solar PV on industrial load. Saudi J. Eng. Technol. 2025, 10, 601–613. [Google Scholar] [CrossRef] [Scilit]
- Zhang, X.; Ma, Z.; Gu, B.; Fang, L.; Yu, X. On BESS Capacity Optimization of Hybrid Coal-Fired Generator and BESS Power Station for Secondary Frequency Regulation. IEEE Access 2025, 13, 60833–60845. [Google Scholar] [CrossRef] [Scilit]
- Reames, T.G.; Levin, T.; Nock, D.; Baker, E. Equitable deep decarbonization: A framework to facilitate energy justice-based multidisciplinary modeling. Energy Res. Soc. Sci. 2022, 91, 102750. [Google Scholar] [CrossRef] [Scilit]
- Sovacool, B.K.; Martiskainen, M.; Hook, A.; Baker, L. Decarbonization and its discontents: A critical energy justice perspective on four low-carbon transitions. Clim. Change 2019, 155, 581–619. [Google Scholar] [CrossRef] [Scilit]
- Chicacausa Niño, J.A. Multi-Objective Economic, Environmental, and Social Dispatch Model for Polygeneration Systems with Renewable Sources and Storage. Master’s Thesis, National University of Colombia, Bogotá, Colombia, 2026. Available online: https://repositorio.unal.edu.co/ (accessed on 10 January 2026).
- Duarte, J.E.; Rosero-Garcia, J.; Duarte, O. Analysis of variability in electric power consumption: A methodology for setting time-differentiated tariffs. Energies 2024, 17, 842. [Google Scholar] [CrossRef] [Scilit]
- Duarte, O.; Duarte, J.E.; Rosero-Garcia, J. Data imputation in electricity consumption profiles through shape modeling with autoencoders. Mathematics 2024, 12, 3004. [Google Scholar] [CrossRef] [Scilit]

Disclaimer/Publisher’s Note: The statements, opinions and data contained in all publications are solely those of the individual author(s) and contributor(s) and not of MDPI and/or the editor(s). MDPI and/or the editor(s) disclaim responsibility for any injury to people or property resulting from any ideas, methods, instructions or products referred to in the content. |
© 2026 by the authors. Licensee MDPI, Basel, Switzerland. This article is an open access article distributed under the terms and conditions of the Creative Commons Attribution (CC BY) license.