


Abstract
In this work, we present the scale-up of a batch anaerobic fermentation system for the production of succinic acid from glycerol using A. succinogenes. The system has been successfully scaled up from an initial bioreactor working volume of 1 L (laboratory scale) to a working volume of 100 L (pilot scale). At the same time, we have developed a hybrid model, combining the intrinsic kinetics of the microbial growth, with a computational fluid dynamics model (CFD) of the bioreactor. The proposed model is able to predict the productivity drop, usually observed while scaling up a bioprocess. In our process, this is a result of the limitations on the mass transfer of CO2 between the gas and the liquid phase of the system. The model is successfully used to predict the amount of aeration needed in order to achieve increased succinic acid productivity. Using the model, the final succinic acid increased by 4.3%, and the succinic acid productivity increased by 8.5%, while the fermentation by-products decreased by approxiamtely 3% each.
1. Introduction
The importance of biological processes is continuously increasing. More and more traditional chemical processes for the production of platform chemicals, pharmaceuticals and food ingredients are being substituted by bioprocesses. Nevertheless, for these bioprocesses to be widely adopted by the industry, their efficiency, productivity and yield must be improved to reach the ones of their traditional chemical counterparts. A big step for this improvement can be achieved through efficient scale-up methodologies to the industrial (cubic meter) scale [1].
Scaling up a bioprocess poses some serious limitations, which must be addressed to achieve economic feasibility at the industrial scale. The so-called “bioprocess scale-up effect” includes the reduction of biomass yield, increased formation of metabolic by-products compared to smaller-scale fermentation, and introduction of substrate limitations due to the formation of concentration gradients inside the fermentation fluid [2,3,4]. It is obvious that the productivity and efficiency of the bioprocess depend to a great extent on two factors that are complementary: the intracellular activity (genome and metabolome) and the extracellular environment (mass and momentum transfer and shear stress) [5].
The role of the extracellular environment and the bioreactor fluid dynamics become of greater importance than the intracellular workings as the scale of the process becomes greater. One of the main reasons for this is the presence of concentration gradients inside the bioreactor. These gradients affect the pH, the main reaction metabolites and the concentration of dissolved gases, creating heterogeneities inside the reaction volume [6,7,8]. These heterogeneities can result in excessive substrate consumption and by-product production and in a general deterioration in the system performance [9]. These heterogeneities are usually caused by insufficient mixing regimes resulting from geometry and operational differences between the lab and industrial scales, as well as restrictions posed by the nature of large-scale fermentations [6].
Computational fluid dynamics (CFD) is a useful tool for the prediction of metabolite concentration gradients inside the fermentor [10]. The use of CFD, even though it is computationally expensive, can be justified as it offers a detailed view of the mixing conditions and the fluid motion inside the bioreactor, during the course of the fermetation. CFD simulations involve solving the fundamental conservation equations for energy, mass and momentum [11]. The use of CFD is preferable in scale-up studies, since it is independent of the empirical correlations usually employed, and therefore the computational results are closer to reality. CFD takes into account the local bioreactor conditions, instead of having a global bioreactor view [8,12]. Therefore, CFD studies can be used to predict mass transport coefficients and the overall mass transfer from the gas to the liquid phase [13].
Since the increase in scale of a bioprocess and the efficient design of a bioreactor pose a significant bottleneck on bioprocess feasibility [14], there has been extensive research performed on both the modeling of the mixing regime inside the bioreactor and the sparging method and its effect on the gas distribution [15], as well as the coupling of CFD models with models predicting the growth of the microorganisms, in order to achieve a more accurate representation of the bioprocess. Computational fluid dynamic modeling has been used effectively for simulating gas dispersion inside bioreactors, calculating the mass transfer coefficient (kLa) from the gas to the liquid phase of large-scale bioreactors [13,16]. CFD models have been also used as a tool for simulating the different metabolic and physiological states that microorganisms exist inside the bioreactor. This diversity is a result of the hydrodynamic pressures on the microorganisms among many other reasons. The CFD models can then be coupled with metabolic models, to produce a clear picture of the state of the microorganisms [12,17,18]. Another concern when designing a bioprocessing system is the non-homogeneous nature of large-scale bioreactors, where due to insufficient mixing, concentration gradients of nutrients, gases, and pH are observed. Thus the scale-up conditions are highly different from the conditions occurring inside a lab-scale system. By implementing a CFD model, both the concentration gradients as well the distribution of cells inside the bioreactor can be calculated, helping to better design the scale-up of the bioprocess [19].
A bioprocess system, where the concentration gradients of the gas substrates are of high importance, is the biological production of succinic acid from glycerol, using A. succinogenes, where CO2 is consumed from the microbial culture and its availability affects the final product titre [20,21]. A. succinogenes is a natural producer of succinic acid, and it has been adapted to grow on glycerol, reaching succinic acid yields as high as 1.28 [22]. Moreover, studies on the metabolism of the microorganism have shown that the availability of CO2 is the main factor affecting the final ratio of valuable products (succinic acid) and unwanted by-products (acetic and formic acid), as its presence shifts the carbon flow in the tricarboxylic acid (TCA) cycle, towards the C4 which has succinic acid as a final product [23,24,25]. In this study, we propose a hybrid modeling method for the scale-up of the bioproduction of succinic acid from glycerol using A. succinogenes, where the concentration of the dissolved gases is calculated using a CFD approach—more specifically, employing a two-phase mixture model, which is a simplified multi-phase model—to solve multi-phase flow, where the phases move at different velocities [26]. Since agitation speed, bioreactor volume and sparging flow rate affect the total mass transfer from the gas to the liquid phase [27], we investigate their effect both computationally and experimentally. As the fermentation kinetic model describes the average reactor behavior, the CFD approach is designed to provide a representative bulk-average dissolved CO2 concentration that can be used with this kinetic model. Finally, to further support this approach, the simulation results are experimentally verified.
2. Materials and Methods
2.1. Experimental Setup
Medium and Inoculum Preparation
The microorganism used for the experiments, Actinobacillus succinogenes (DSM No. 22257), was acquired from Deutsche Sammlung von Mikroororganismen und Zellkulturen (DSMZ) (Braunschweig, DE). The cell culture was initially revived, by cultivation for 48, using a 30 g/L tryptic soy broth medium (TSB). The activated culture was then stored in cryopreservation vials containing 30% glycerol. The culture was then stored in deep freeze at −80 °C. The stock culture was adapted to high glycerol concentrations using the method described by Vlysidis et al. [22]. For the fermentation, a semi-defined medium described by Vlysidis et al. [22] was used. The initial glycerol concentrations ranged from 30 to 60 g/L. The medium was sterilized for 15 min at 121 °C.
The inoculum preparation procedure was the following: The content of the cryopreservation vial was thawed. Afterwards, it was added to a flask containing 100 mL of 15 g/L of TSB and 30 g/L of glycerol medium. The culture was then placed on a rotary shaker (200 RPM) and incubated for 24 h at 37 °C. Subsequently, 10 mL of the inoculum was transferred into a flask containing 90 mL of the fermentation medium. The culture was then left to incubate for a further 36 h at 37 °C. After the incubation period was finished, a 1 L bioreactor was inoculated aseptically. The culture was then fermented for a further 36 h until it reached its exponential face. Then it was used as an inoculum for the 20 L bioreactor. For the 150 L pilot scale reactor, the same process was used. The 20 L bioreactor was used to prepare the inoculum. There the culture was left to grow for a further 36 h until it reached its exponential phase, and then it was inoculated into the 150 L pilot bioreactor. All reactants were purchased from Sigma-Aldrich UK.
2.2. Analytical Methods
The cell concentration was calculated indirectly through the measurement of the optical density (Shimadzu UV mini 1240 spectrophotometer) of the fermentation broth. Samples of 2 mL were taken at regular time intervals until the experiment was finished and after being diluted with a 7% HCl solution for the MgCO3 to be dissolved and not to interfere with the measurement. They were then centrifuged to remove the biomass. The residual glycerol and the fermentation products were simultaneously measured from the solid-free samples using High-Performance Liquid Chromatography (HPLC) (ThermoScientific Diomex UltiMate 3000) with an Aminex HPX-87H 300 mm × 7.8 mm (Bio-Rad) column. Residual glycerol was detected using a Refractive Index detector (ERC RefractoMax 520) and the fermentation products (succinic, acetic and formic acid) using a diode array detector (ThermoScientific Diomex UltiMate 3000 DAD).
Experimental Configuration
Three different bioreactors were used to conduct the experiments: an Electrolab 351 bench-top reactor with a working volume of 1 L; an Electrolab Fermac 310 with a working volume of 18 L, which was used for experiments with volumes of 10 L (half-filled) and 18 L; and a Life Sciences Ltd., UK 150 L pilot scale bioreactor with a working volume of 150 L. All of the vessels were equipped with baffles, and the agitation speed for all the experiments was 600 RPM. The temperature of the fermentors was maintained at 37 °C, throughout the duration of the fermentation. The pH was measured and was kept at 6.4, controlled through the addition of concentrated (10 M) NaOH solution. Carbon dioxide (purchased from BOC gases, UK) was supplied at different rates throughout the experiments. Air was constantly supplied through a pump at a rate of 0.01 vvm. For most experiments the flow of CO2 was 0.06 vvm and in the final 100 L reactor validation experiment the CO2 flow increased to 0.22 vvm, adding up to 0.07 vvm and 0.23 vvm total gas flow entering the bioreactor, respectively. For the boundary conditions of the CFD simulations the total gas flow was used.
2.3. CFD Studies
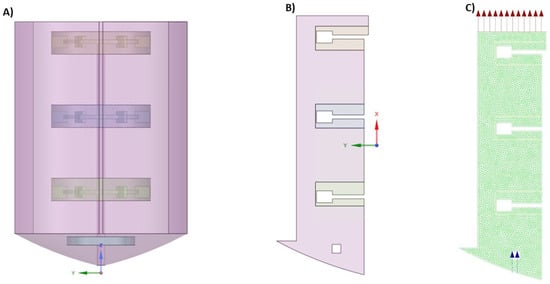
A 1:1 scale CAD model of the bioreactor was constructed. The geometry of the reactor (baffles, mixing turbines, sparger) was represented. The computational studies were performed using ANSYS Fluent (2021 R1). The CAD model was used to visualize the fluid volume, which was then imported to Fluent to generate the volume mesh used to perform the calculations (Figure 1A).
Figure 1.
CAD model of the pilot scale bioreactor: (A) 3D extracted fluid volume from the CAD model. (B) 2D axisymmetric simplification of the extracted fluid volume. (C) Mesh structure of the 2D model.
The bioreactor has four baffles and it was agitated with an impeller with 3 Rushton turbines with six blades on each one, equally spaced on the disk. Sparging was performed from a sparging ring at the bottom of the bioreactor, which had four equally spaced gas outlets. The bioreactor dimensions, which correspond to the dimensions of the CAD model, are presented in Table 1.
Table 1.
Pilot scale bioreactor dimensions.
For simplification of the calculations and reduction of the computational cost, a 2D render (Figure 1B) of the reactor was used. Moreover, axisymmetry was assumed in order to finally reduce the 2D model in half. Despite the presence of baffles and multiple Rushton turbines breaking axisymmetry locally, the present 2D axisymmetric model was adopted to capture macroscopic trends and to keep the computational cost low, compared to using a full 3D model [28,29,30].
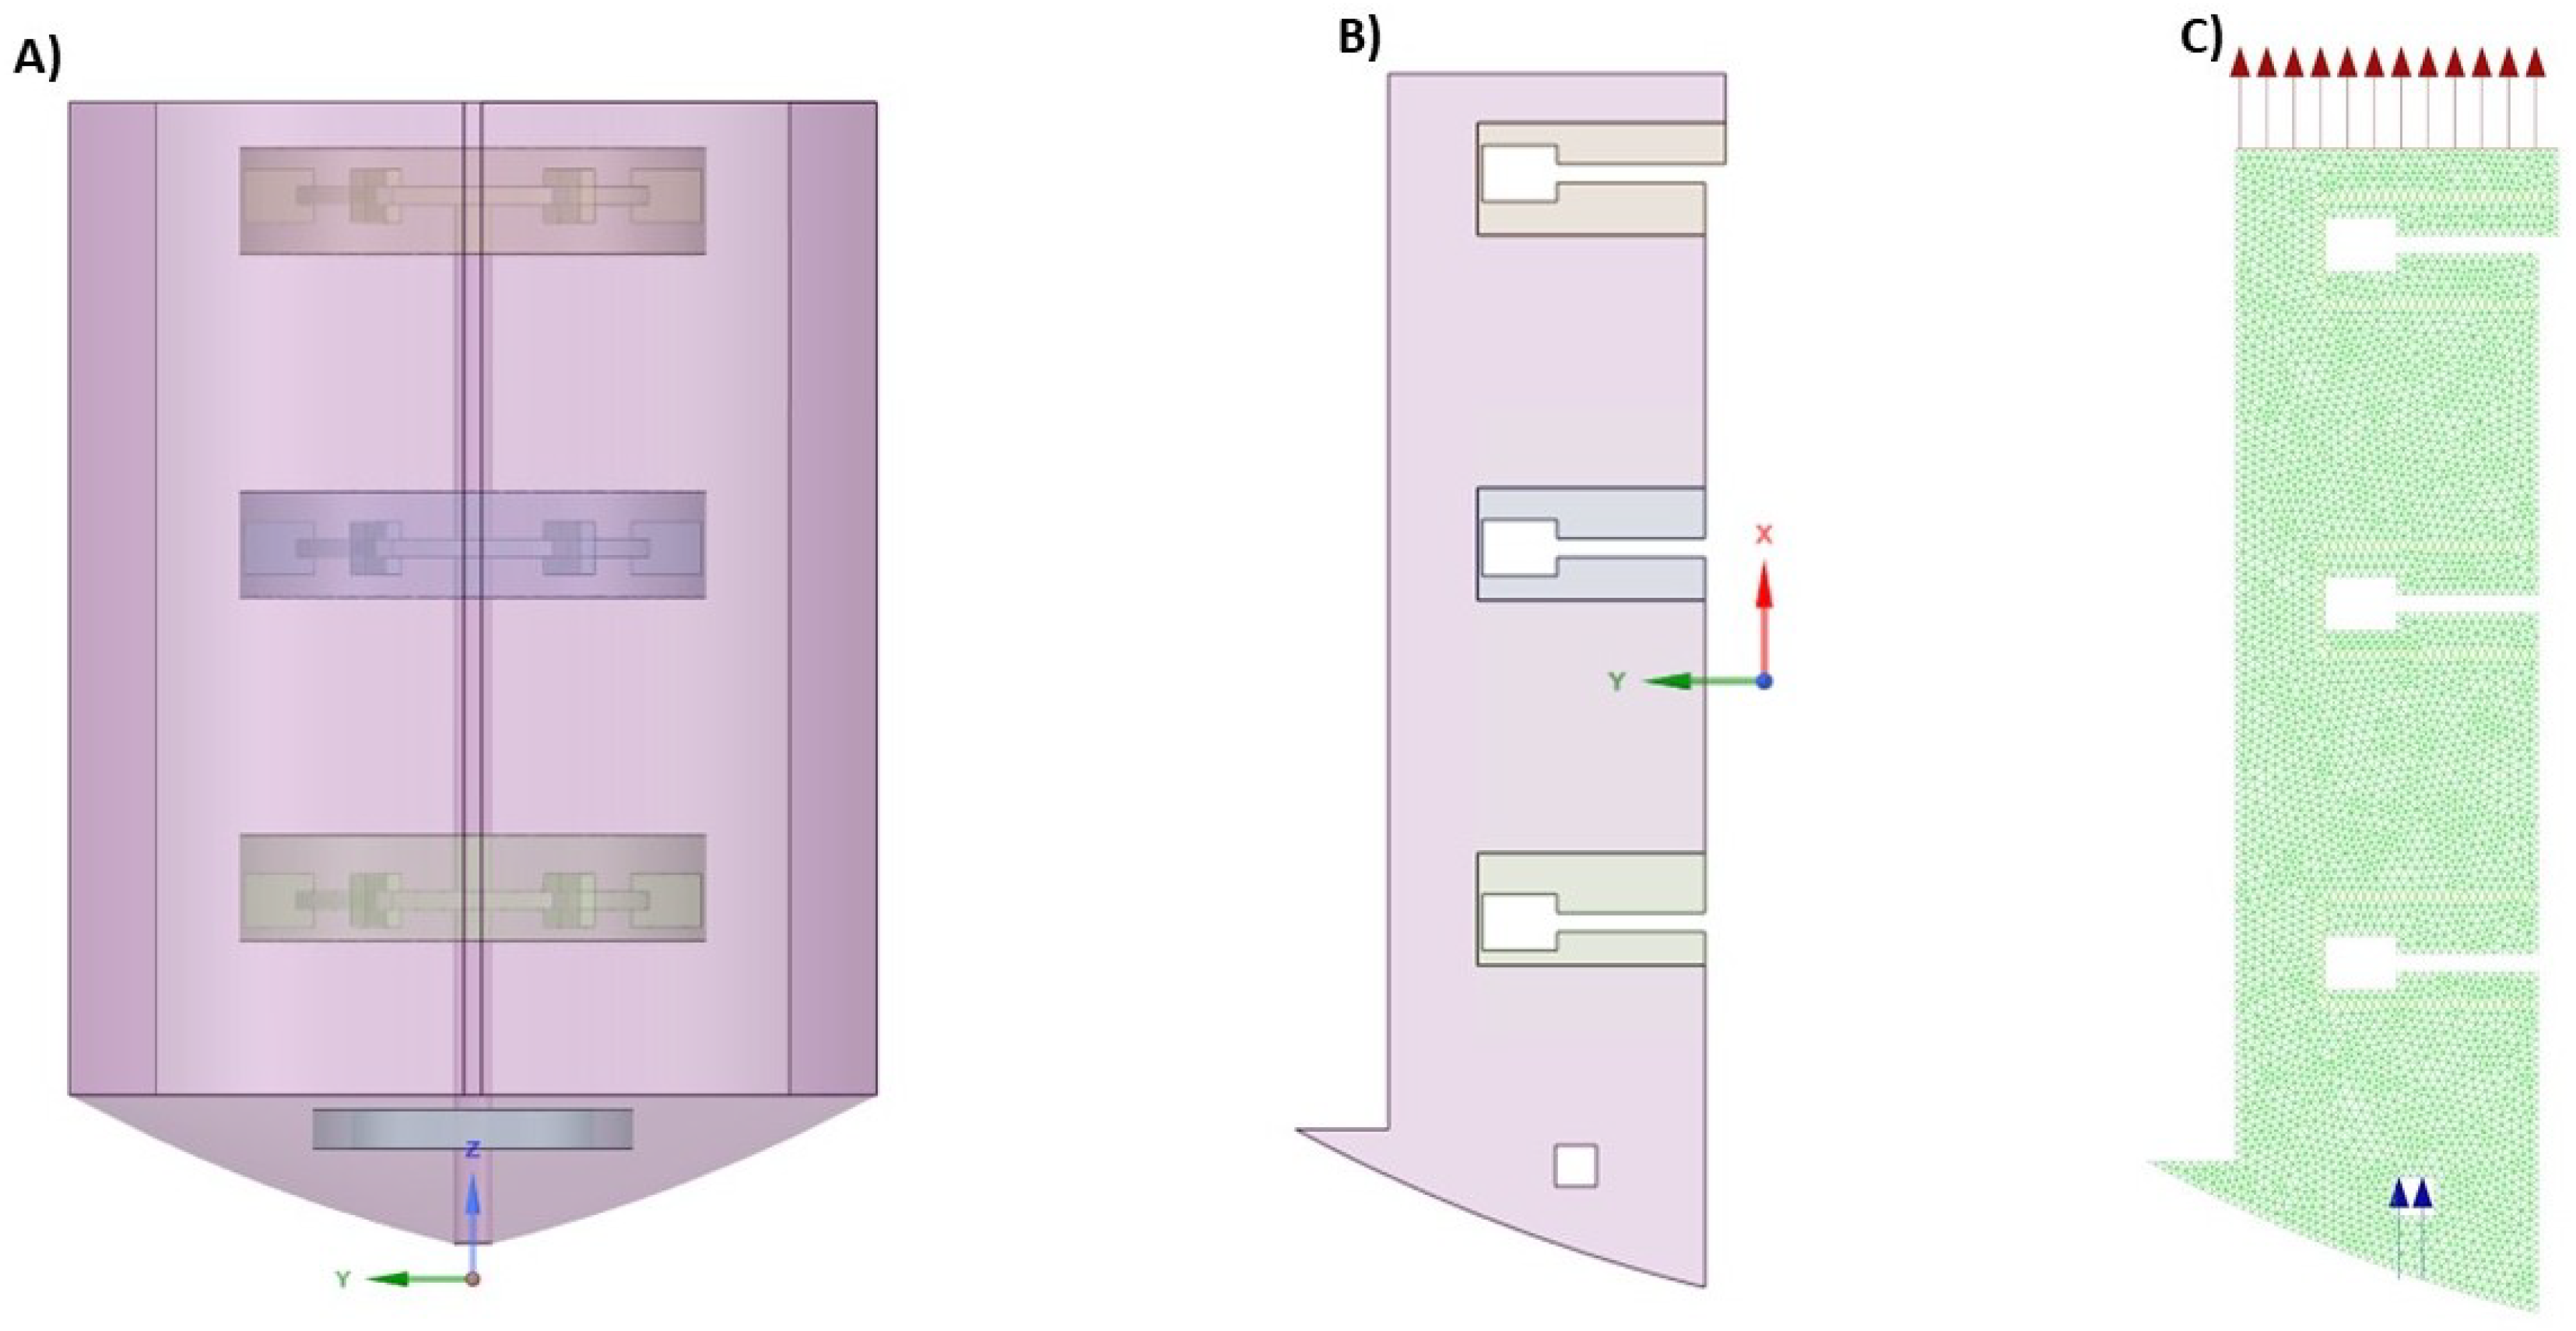
The meshing was performed by employing Fluent Meshing, and the triangular meshing method was used, with an element size of 0.005 m. This resulted in a mesh of 8448 elements, with minimum orthogonal quality of 0.9 and skewness of 0.44 (Figure 1C).
The gas inlet holes were set as velocity inlet boundaries, and the top of the fluid was set as a pressure outlet. The boundaries between the fluid and the solid were set as stationary walls with a no-slip condition. The boundaries between the fluid cell zones were set as internal walls. For the multi-phase modeling, the mixture model was employed, which, as mentioned above, was used to simulate phases that move with different velocities. For modeling the turbulent flow, the standard k- model with scalable wall functions was utilized [13,31,32]. For the simulation of the gas bubbles, the surface tension coefficient was set to 0.073 N/m [33]. For the calculations of the inter-phase forces, occurring from the flow of the bubbles, the Grace drag coefficient was used, as the volume fraction of the gas phase was relatively small compared to the liquid phase [34,35]. Finally, for the mass transfer of CO2 between the bubble phase and the bulk of the liquid, Henry’s law model with the Hughmark correlation was used [36,37]. In Figure 1B, the area around the impellers is set as a separate zone from the rest of the fluid volume. The movement of the impellers was simulated by using a frame motion approach and setting the rotational velocity of the zone. The mesh interfaces between the fluid zones and the three impeller zones were set as matching in order for the momentum to transfer from the impellers to the rest of the fluid.
The properties of the materials used in the simulations were found in the ANSYS Fluent database.
Mesh Sensitivity Analysis
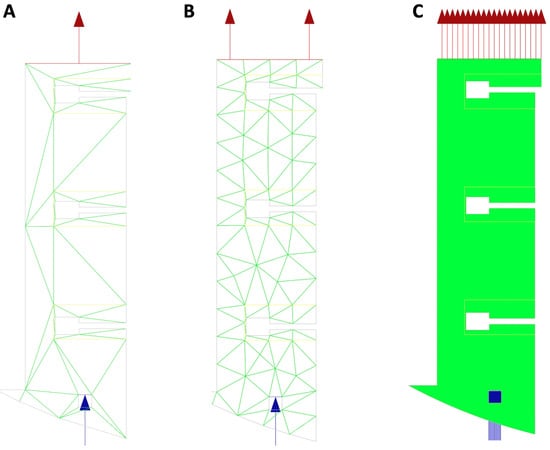
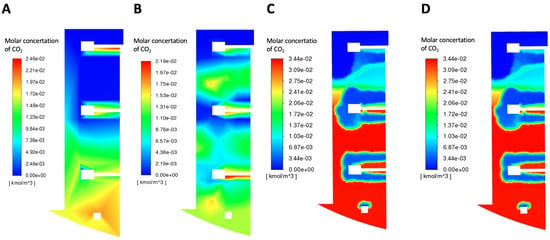
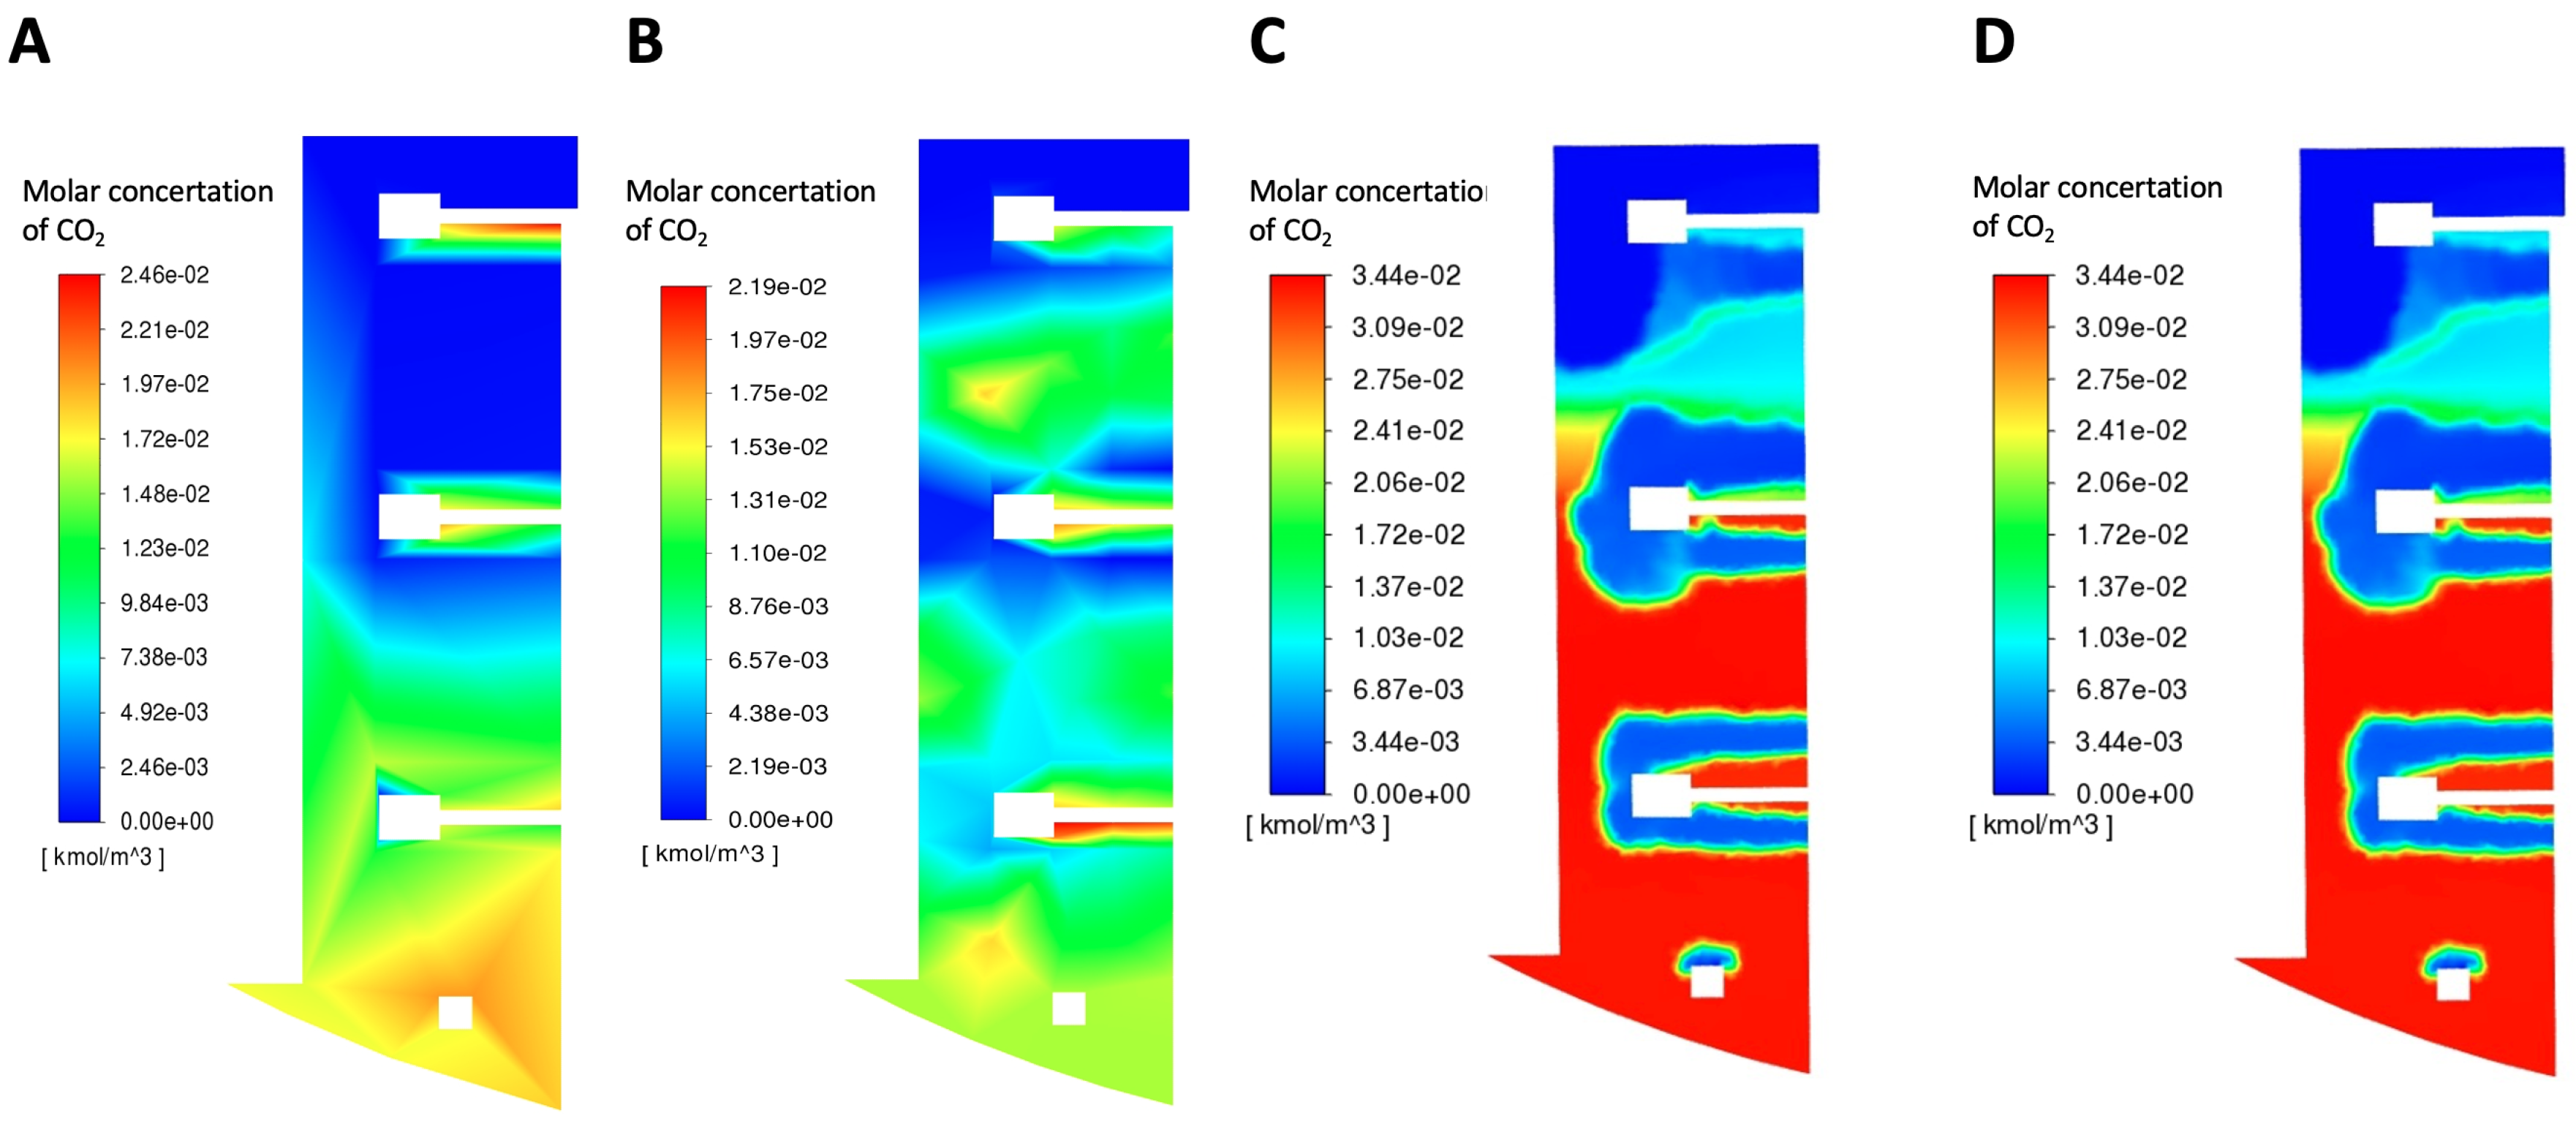
A sensitivity analysis of the mesh size was also performed: the mesh size was incrementally increased from an element size of 0.5 m (60 elements) to an element size of 0.0005 m (137,170 elements). In Figure 1C and Figure 2C, the meshes with different element sizes can be seen, whereas in Figure 3, the molar concentration calculations of CO2 with different mesh sizes are presented.
Figure 2.
CAD model mesh for different element sizes: (A) 0.5 m, (B) 0.05 m, (C) 0.005 m.
Figure 3.
Molar CO2 concentration for different mesh element sizes: (A) 0.5 m, (B) 0.05 m, (C) 0.005 m, (D) 0.0005 m.
From Figure 3A,B we can see that for the larger mesh elements, sizes 0.5 m and 0.05 m, the CO2 gradient has a very square, unnatural shape compared to the latter two (Figure 3C,D. The CO2 distribution is identical for Figure 3C (mesh size 0.005 m) and Figure 3D (mesh size 0.0005 m) indicating mesh-independent behavior based on the CO2 concentration profiles. Due to the higher computational cost of meshing with an element size of 0.0005 m (28% more elements compared to an element size 10 times smaller), an element size of 0.005 m was chosen.
A steady-state solver, with coupled pressure and velocity, was used, and the second-order upwind scheme was the discretization method of choice. The number of iterations was set to 3000, but the system converged after the first 1880 iterations. For the first 1200 iterations, the calculation was run as steady state, and after that the calculation was run as pseudo-transient.
For the solution initialization, a hybrid method was used. This method involves solving a simplified Laplace equation to approximate the flow and pressure fields and draw the corresponding initial conditions, resulting in faster overall simulations [38].
2.4. System Modeling
Kinetic Modeling
A kinetic model developed previously by our group [39], was used to calculate the concentration profiles of the substrate, the main product and the by-products. The model consists of a set of algebraic and ordinary differential equations (DAEs) (Equations (2)–(6)). The DAE system was then solved with the ode13s Matlab solver (version 2018a, Mathworks).
The system of equations simulates biomass growth, substrate (glycerol) consumption and production of the main fermentation product (succinic acid) and two prevalent by-products (acetic and formic acid). Firstly, the specific growth rate for A. succinogenes is determined using Equation (1):
Here is the maximum biomass growth rate, the glycerol concentration, CO2 the CO2 concentration, the substrate saturation constants for the two substrates, the substrate inhibition constant for glycerol, the succinic acid concentration, the critical succinic acid concentration, the power term correction for succinic acid inhibition, the maximum death rate coefficient, and the initial glycerol concentration.
The total growth rate of the biomass is presented in Equation (2):
where X is the biomass concentration.
Since the culture consumes the main substrate for its growth as well as for its metabolic maintenance, the consumption of the substrate can be correlated with the growth rate of the microorganism as well as with the total biomass concentration, corresponding with the growth and the standing phase of the microorganism respectively (Equation (3)):
Here and are the growth and the non-growth associated terms for the consumption of glycerol respectively.
The same can be applied to the production of succinic acid, which is mainly produced during the growth phase of the cells, as well as from the metabolic processes of the already existing bacterial culture (Equation (4)):
and being the growth and the non-growth associated terms for the production of succinic acid respectively.
Finally, the main bioprocess by-products, acetic and formic acid, are related to the stationary phase of the culture, and their production rate is proportional to the existing biomass concentration (Equations (5) and (6)):
Here and are the non-growth associated terms for the production of acetic and formic acid respectively, with being their respective concentrations.
The model was previously calibrated and validated with data collected from 1.8 L batch experiments. The calculated kinetic parameters used for the model are presented in Table 2.
Table 2.
Model kinetic parameters.
3. Results
3.1. Bench-Top Scale-Up Results
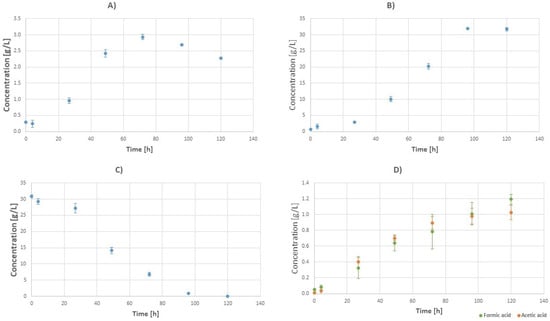
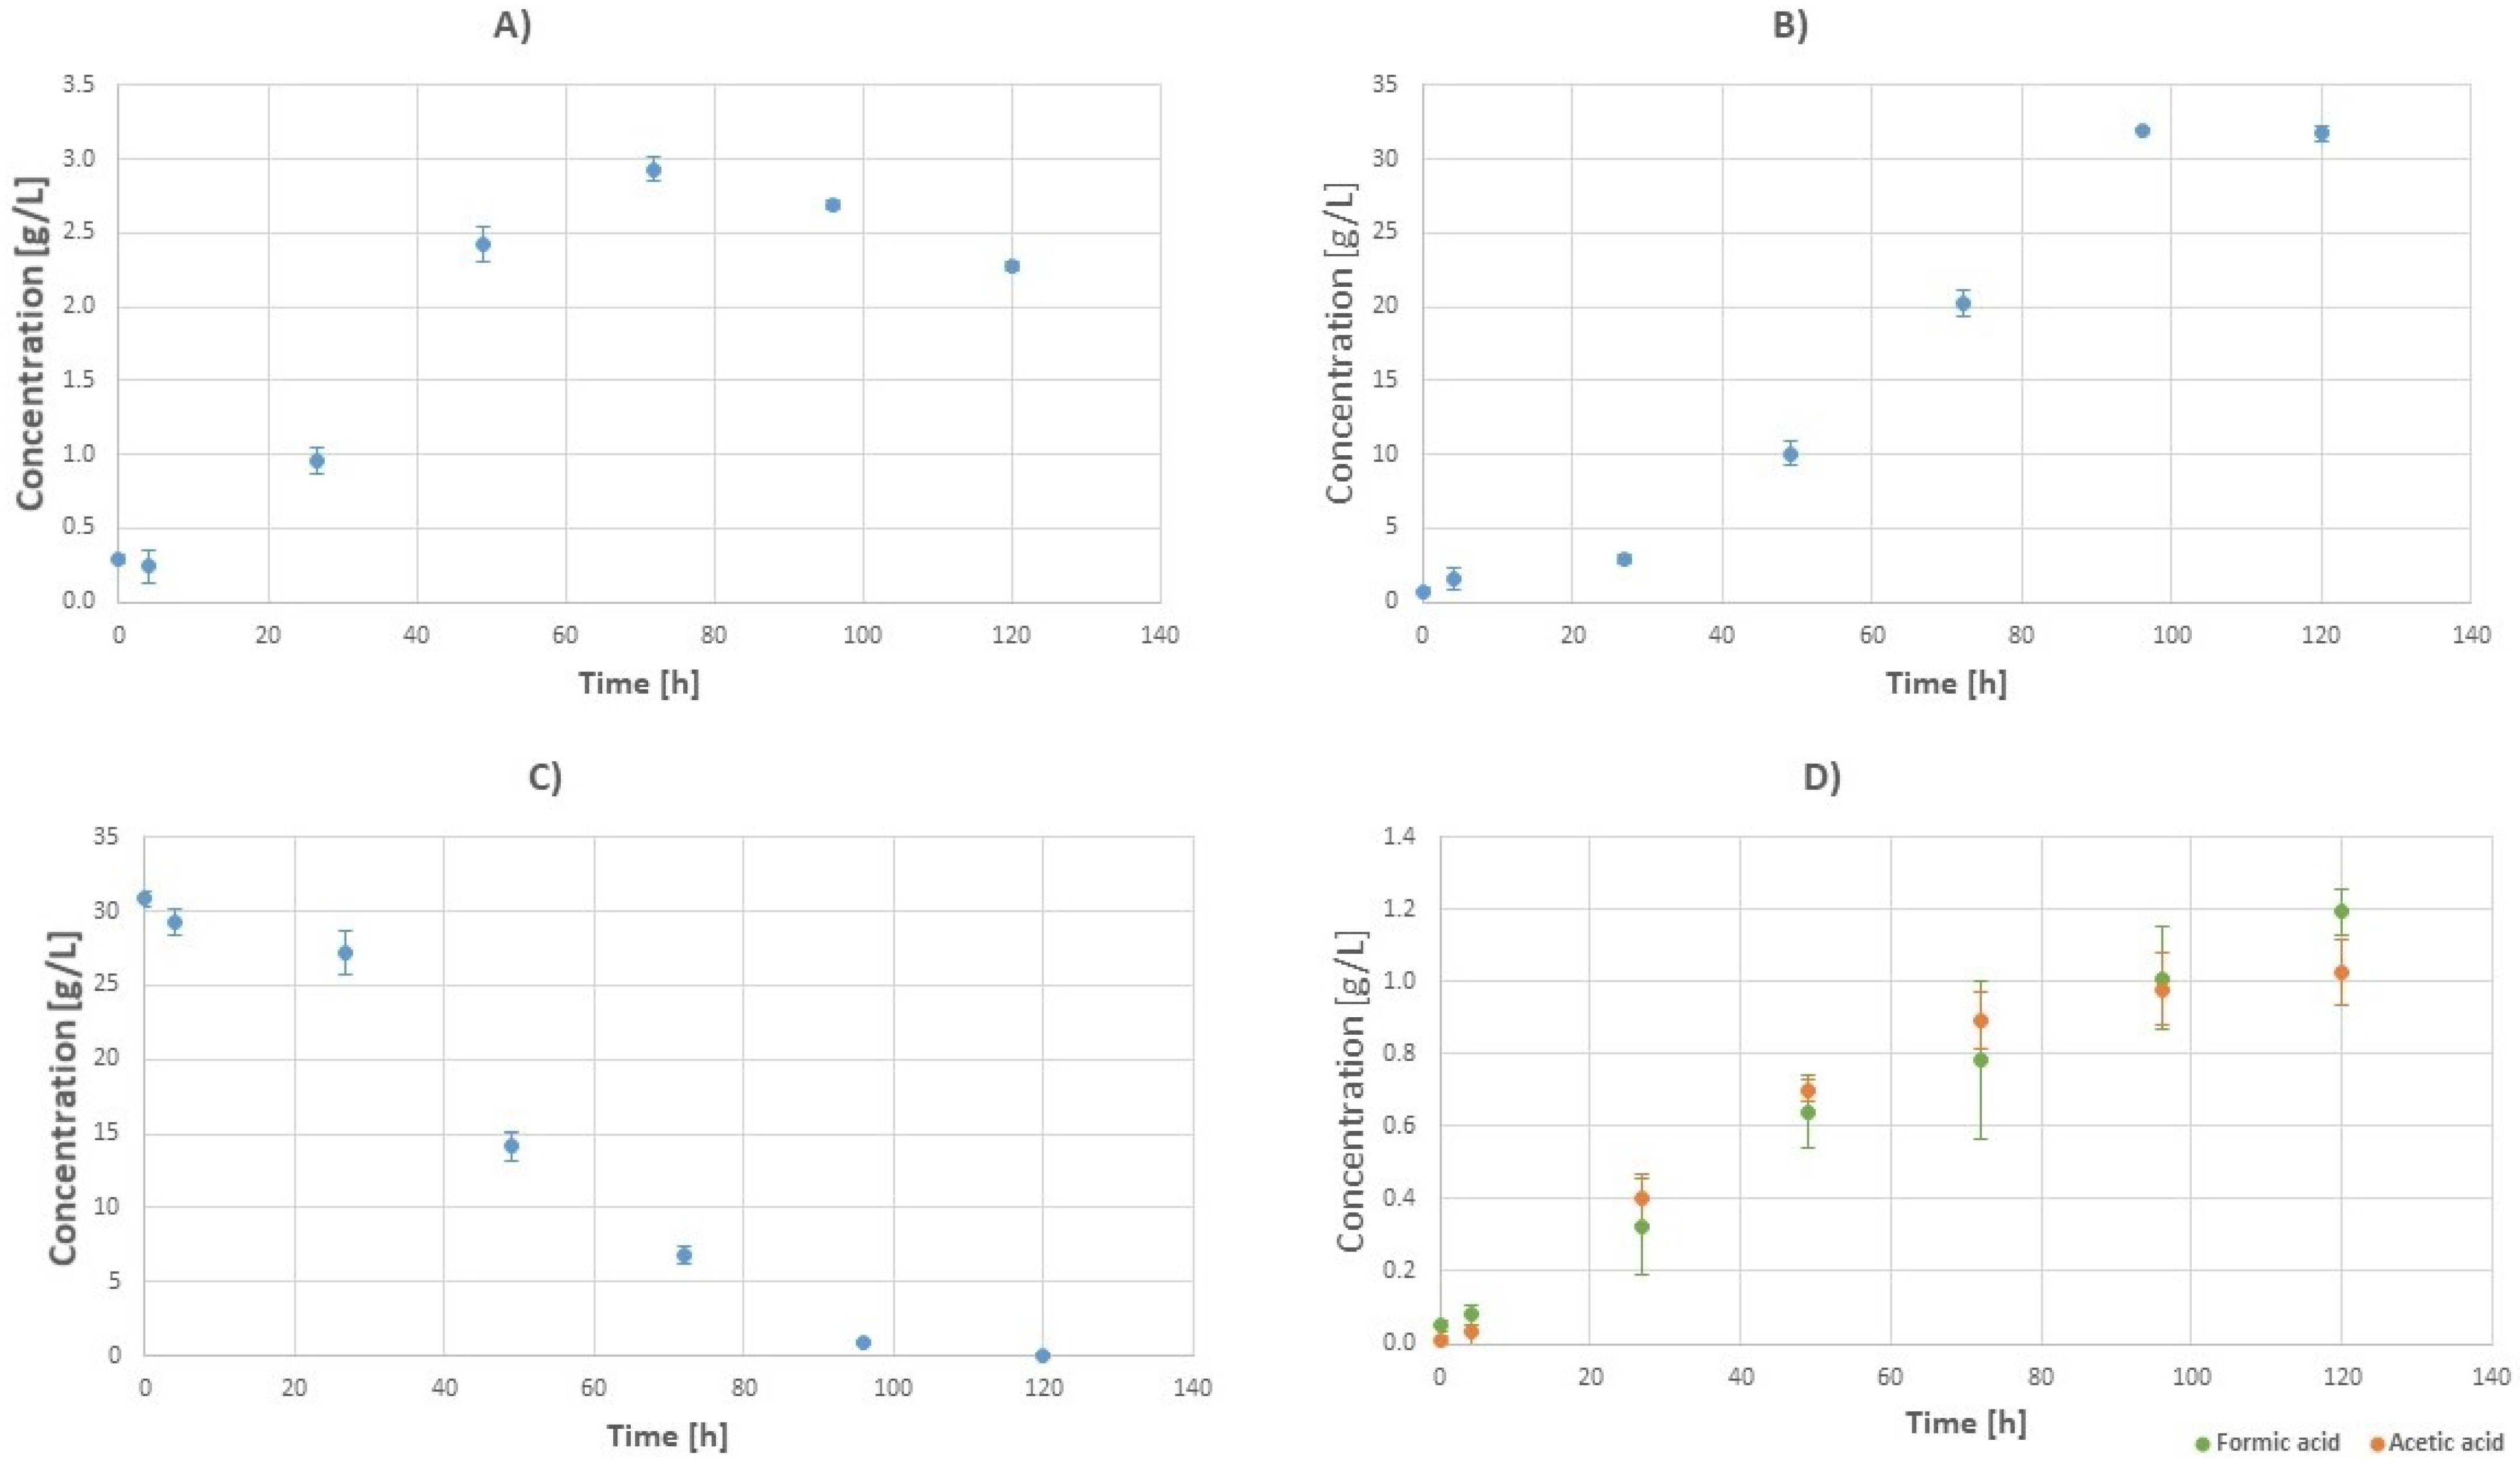
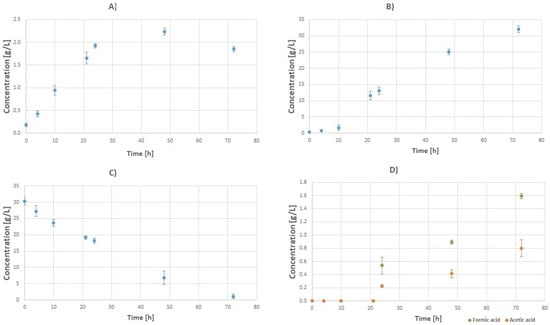
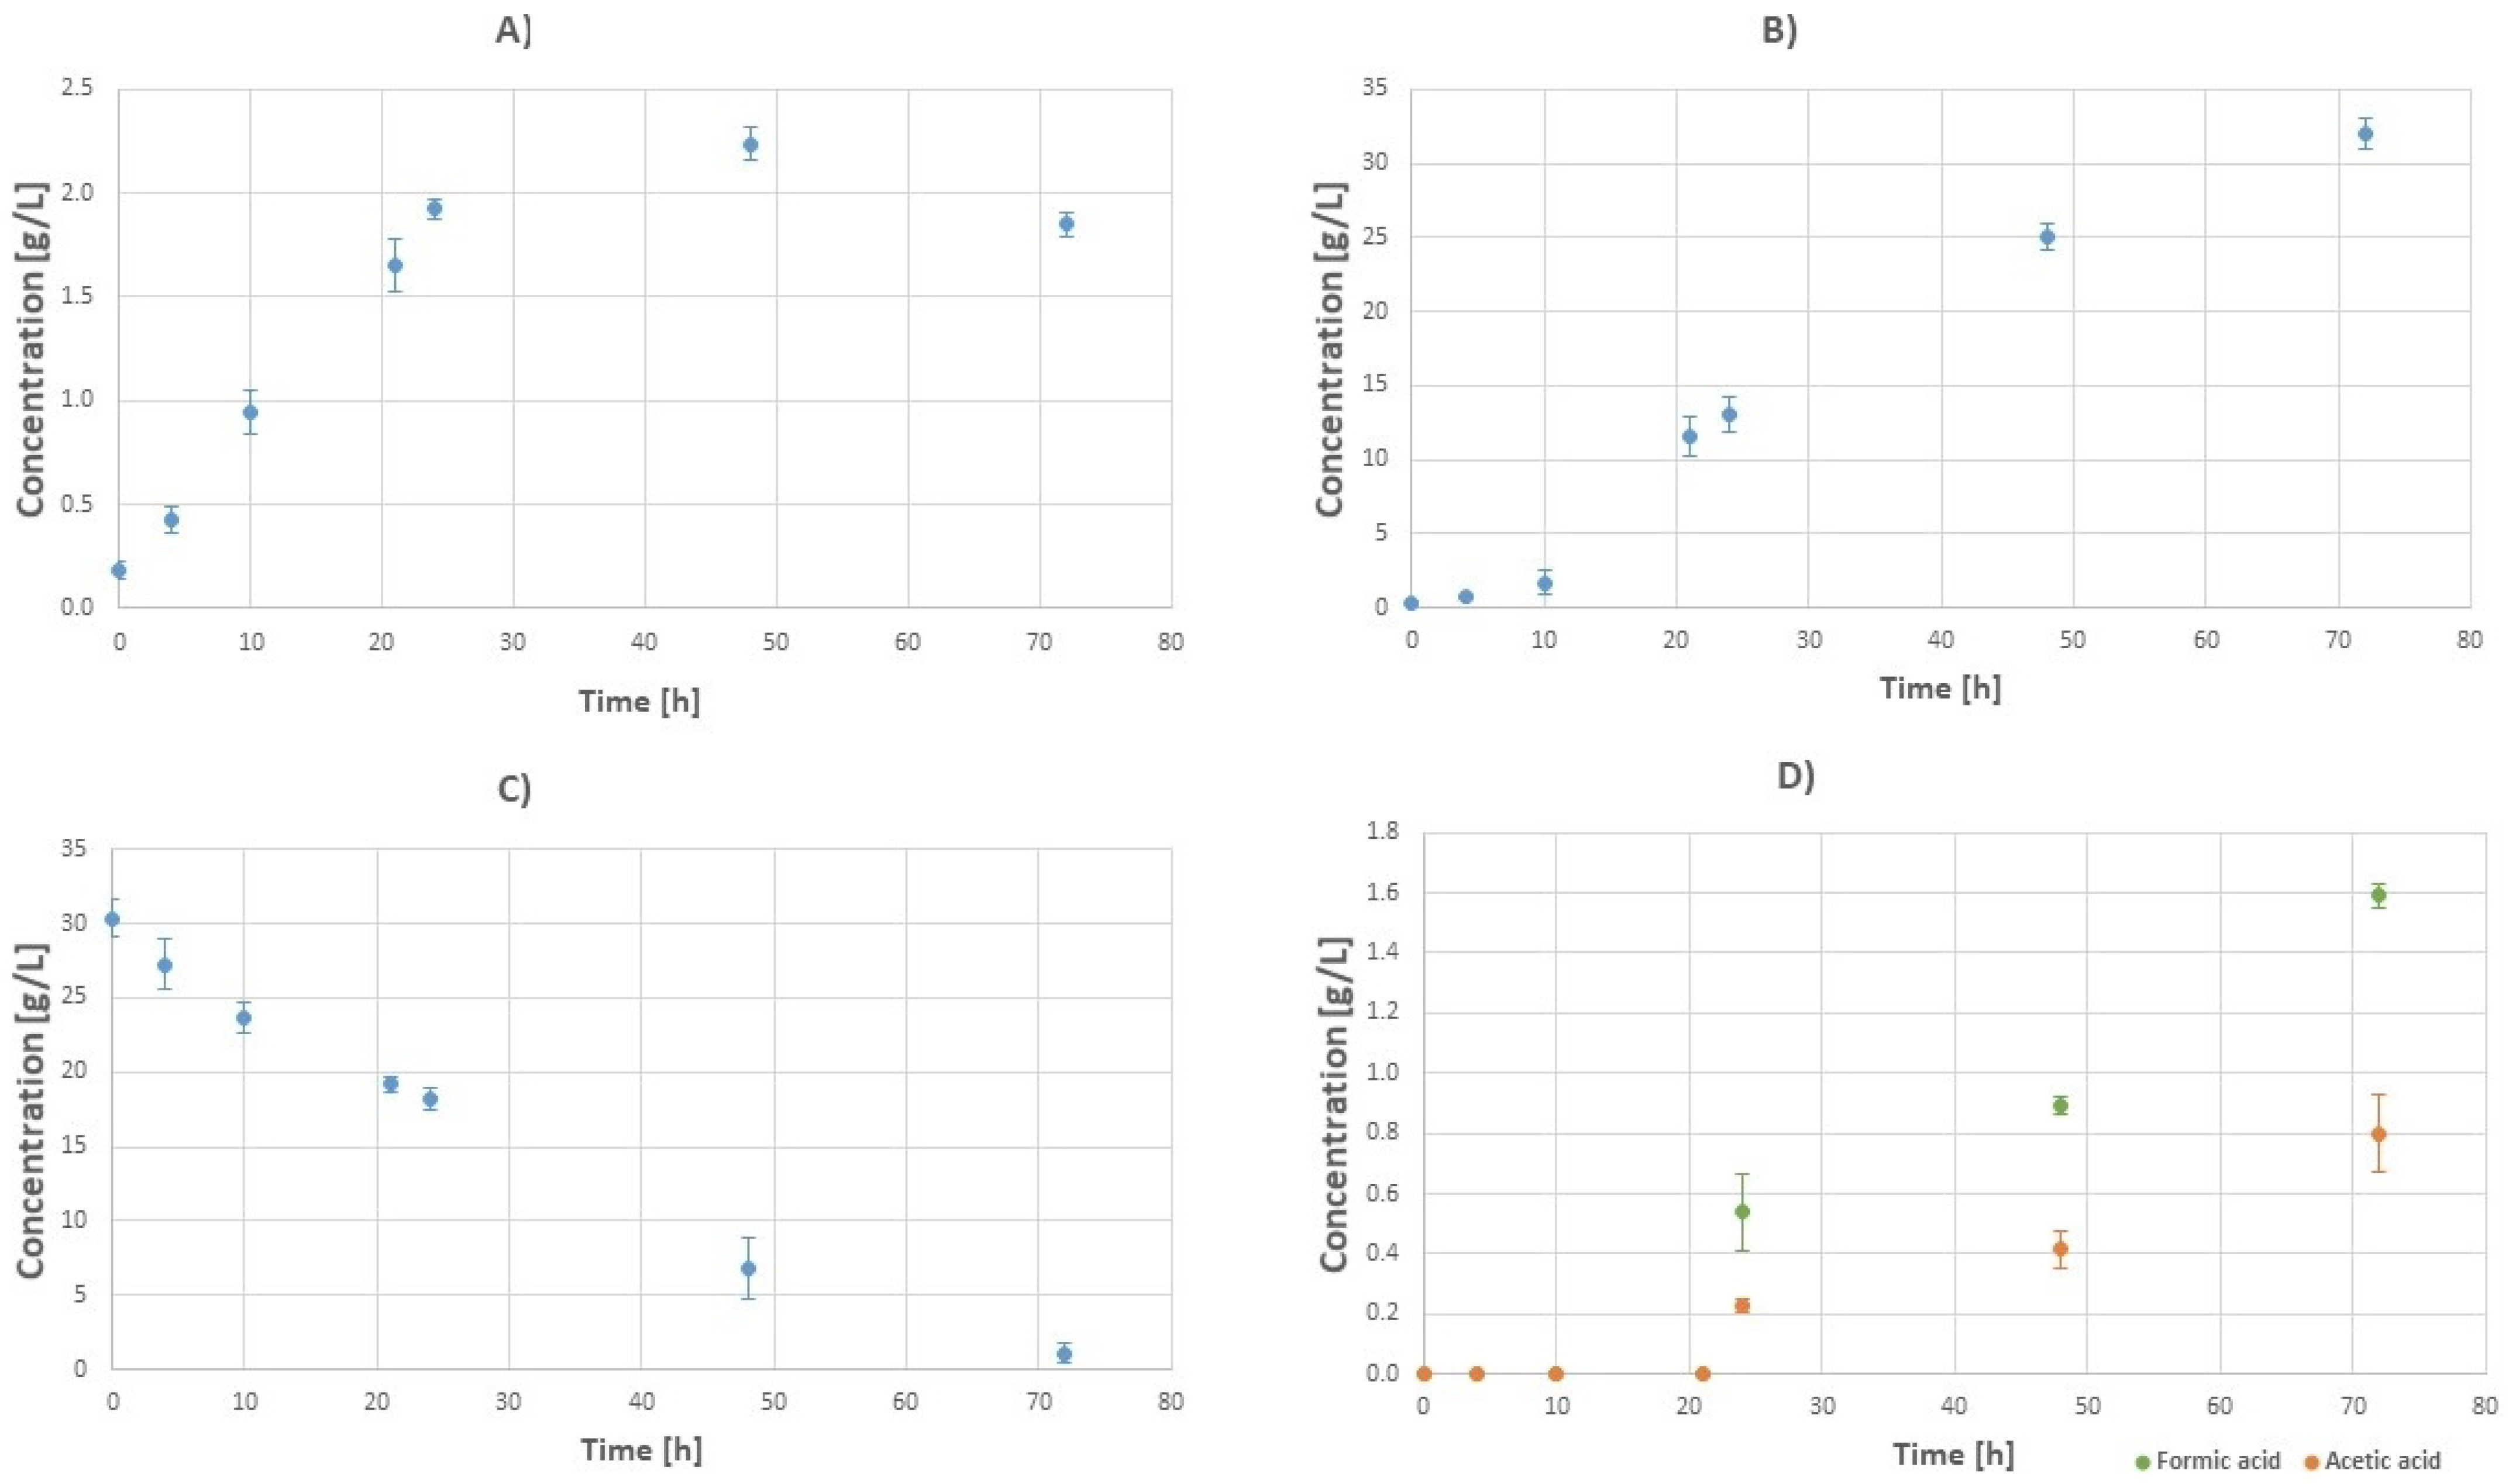
A series of bench-top experiments was conducted in order to evaluate the effects of the increasing working volume, on the overall efficiency of the bioprocess. The scale-up was performed gradually first at a working volume of 1.8 L then on a volume of 10 L (Figure 4) and finally at a working volume of 18 L (Figure 5).
Figure 4.
Batch fermentation concentration profiles at a working volume of 10 L with initial glycerol concentration of 30 g/L (tfin = 120): (A) Biomass. (B) Succinic acid. (C) Glycerol. (D) Fermentation by-products: formic acid (green) and acetic acid (orange).
Figure 5.
Batch fermentation concentration profiles at a working volume of 18 L with initial glycerol concentration of 30 g/L (tfin = 73 h): (A) Biomass. (B) Succinic acid. (C) Glycerol. (D) Fermentation by-products: formic acid (green) and acetic acid (orange).
For the 10 L fermentation, the maximum succinic acid titre was 31.37 ± 0.24 g/L with succinic acid productivity of 0.26 and a succinic acid yield of 1.03 . For the 18 L fermentation, the maximum succinic acid titre was 32.02 ± 0.52 g/L with succinic acid productivity of 0.44 and a succinic acid yield of 1.05 . In comparison, the fermentation results of the 1.8 L scale had a maximum succinic acid titre of 35.31 g/L, a succinic acid productivity of 0.47 and a succinic acid yield of 1.21 . The succinic acid titre of the 1.8 L fermentation was therefore 11% more than that of the 10 L working volume and 9% more than that of the 18 L working volume. Also, its productivity was 45% greater than the one of the 10 L bioreactor and 6% greater than the one of the 18 L. Finally, the 1.8 L bioreactor had 15% more succinic acid yield than the 10 L bioreactor and 13% more than the 18 L bioreactor.
3.2. Pilot-Scale Experiments and CFD Simulations
Experiments with the pilot reactor (100 L working volume) were conducted with initial glycerol concentrations of 30 g/L and 60 g/L. In Table 3 the productivity and yield results are presented for each fermentation run and are compared with the results from the lab-scale (1.8 L working volume) and the bench-top reactor (10 and 18 L working volume). CFD simulations were then performed for the pilot-scale bioreactor to calculate the concentration gradients inside the bioreactor as well as the velocity of the mixed fluid. Therefore the quality of the mixing can be assessed. By calculating the concentration gradients of the substrate components, the impact of mass transport phenomena on the fermentation can be more easily evaluated.
Table 3.
Comparison of the experimental results between lab (1.8 L, [39]) bench-top (10 and 18 L) and pilot (100 L) scale.
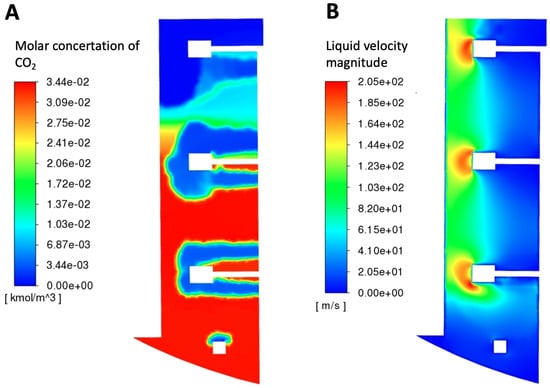
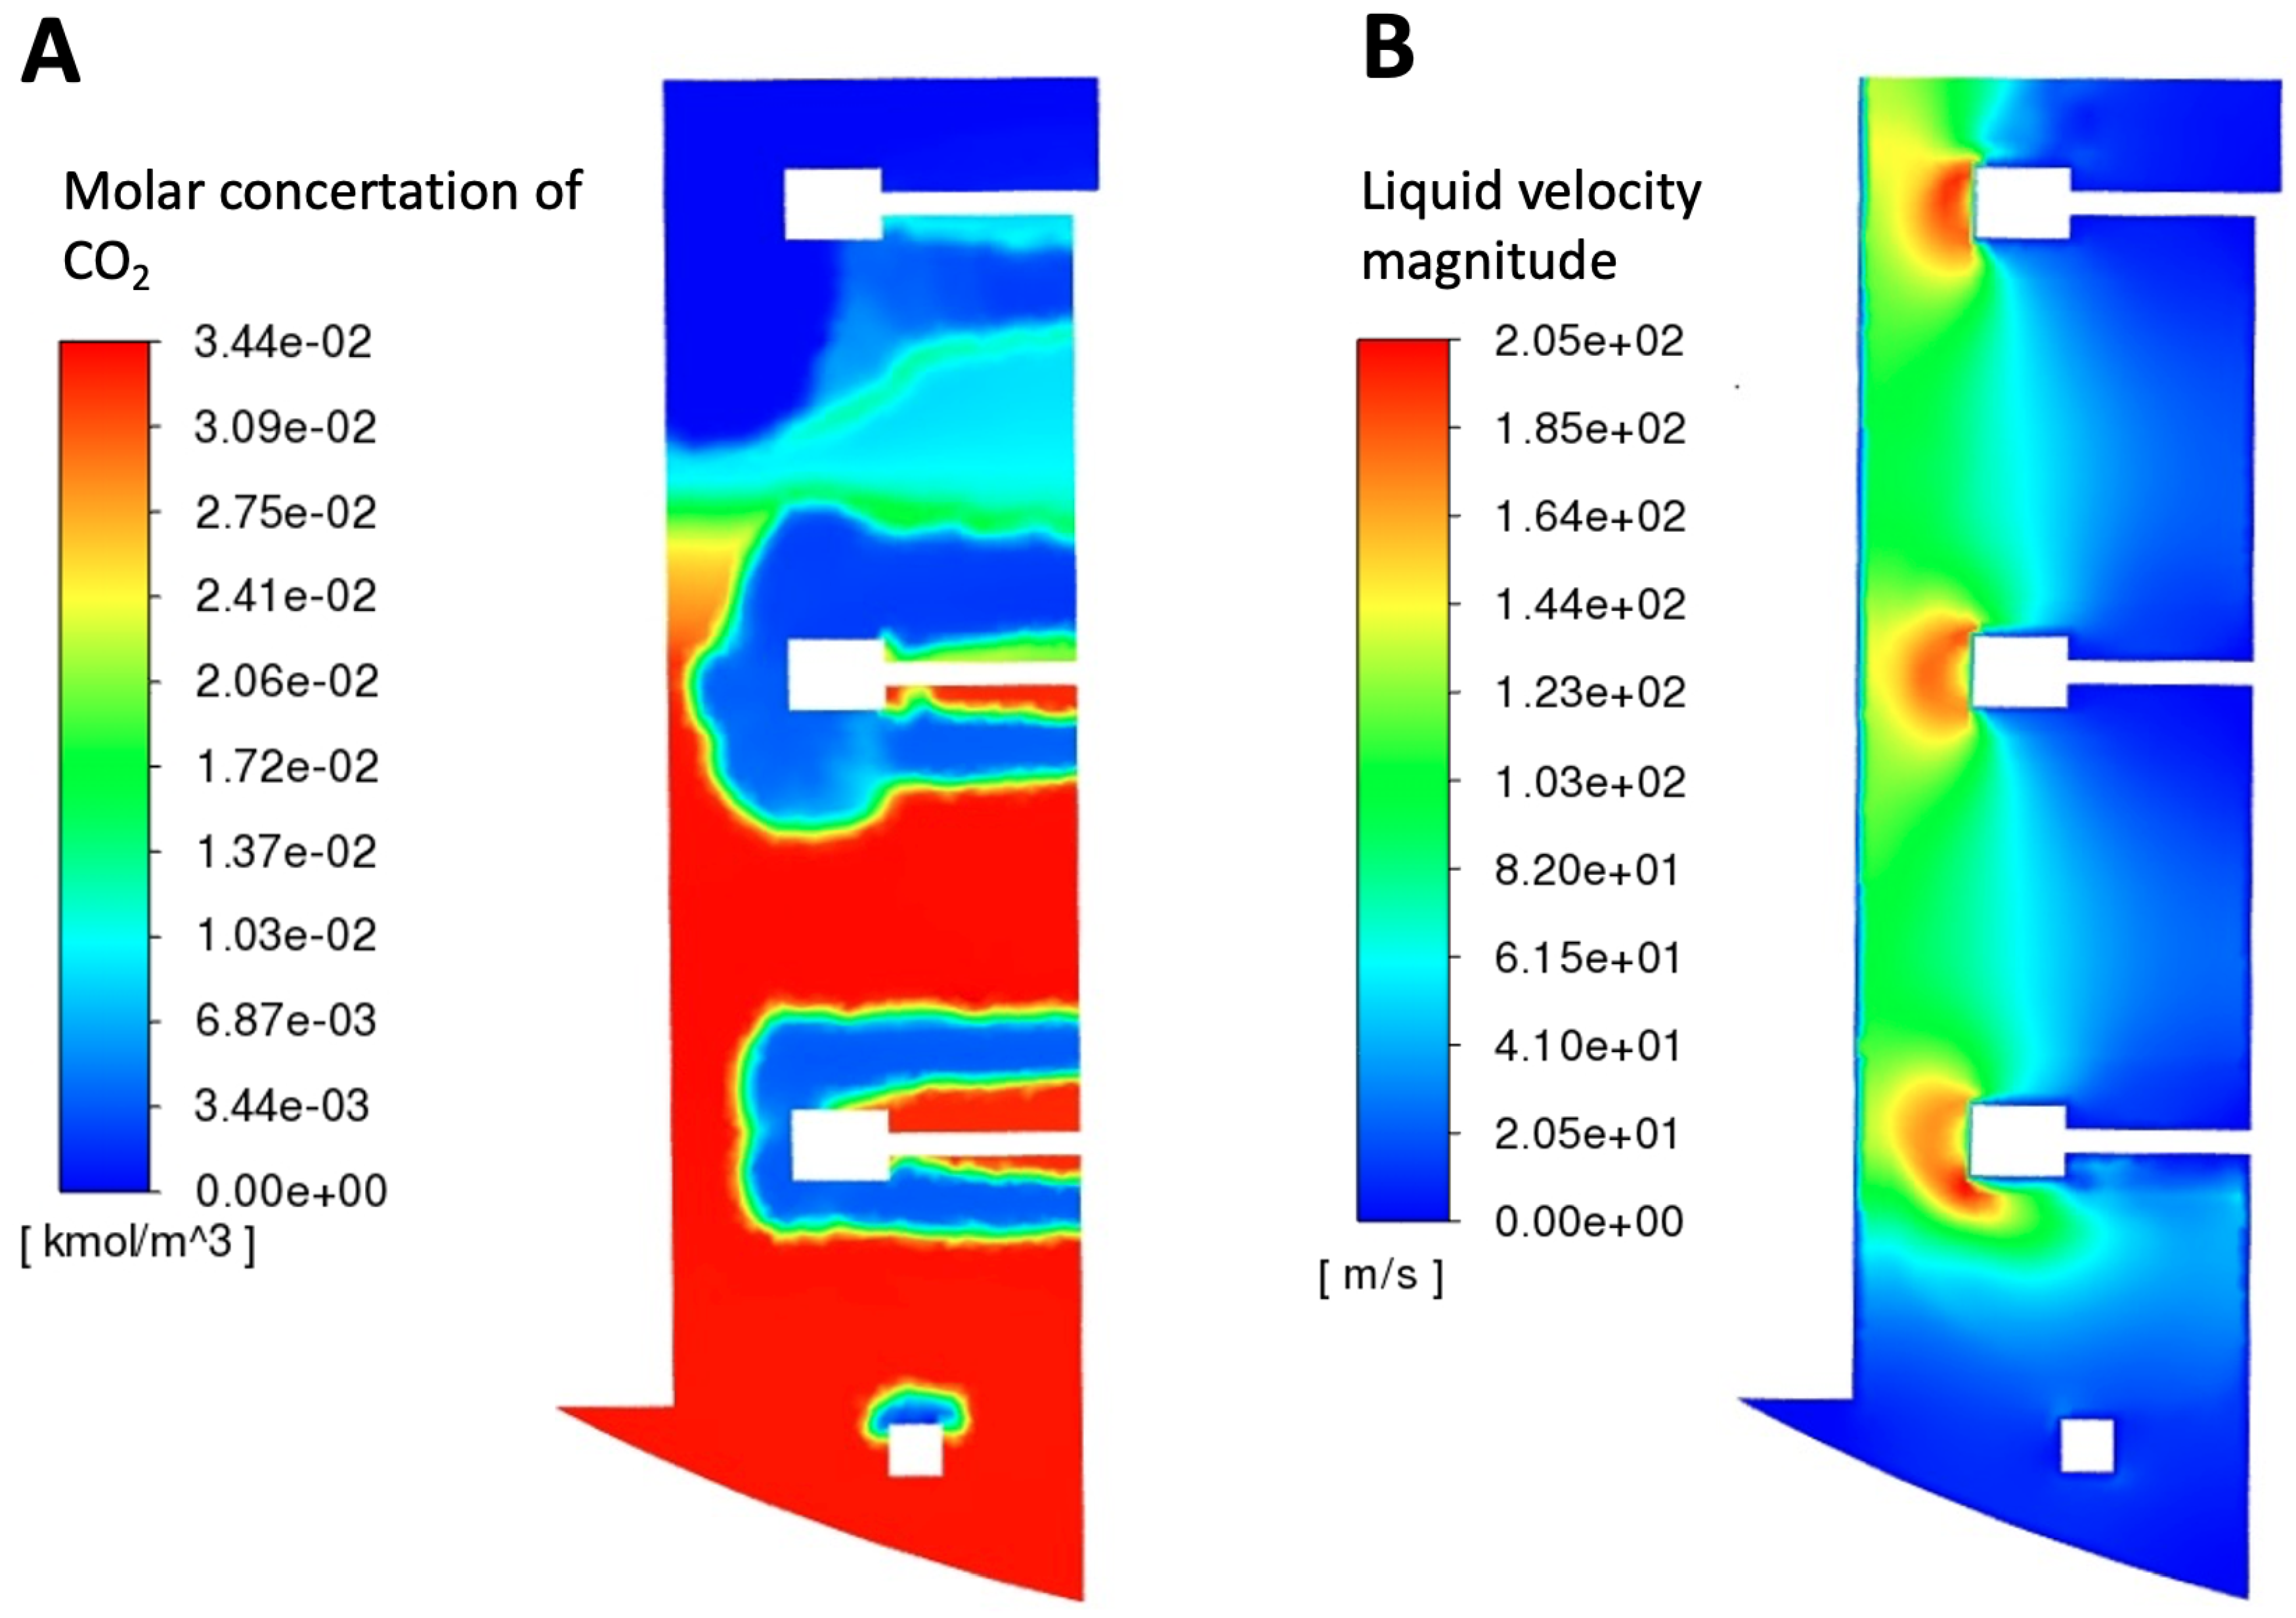
In Figure 6A, the concentration of carbon dioxide inside the bioreactor can be observed. A mixture of air and carbon dioxide (0.06 vvm CO2 0.01 vvm air) is inserted inside the vessel through a sparger in the bottom of the reactor. The concentration is higher towards the bottom and the middle of the reactor (below the lowest impeller and between it and the middle one). In the top part of the bioreactor, as can be seen, there is almost no carbon dioxide at all.
Figure 6.
Results of the CFD simulation for the 100 L bioreactor, agitation speed 500 RPM and CO2 0.07 vvm: (A) Molar concentration of CO2 inside the liquid phase. (B) Liquid phase velocity magnitude.
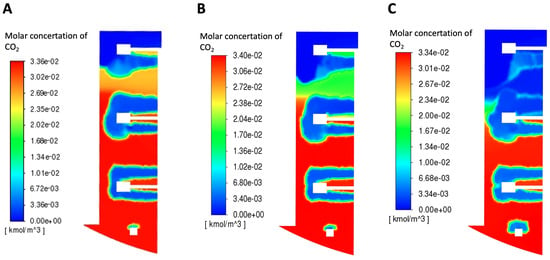
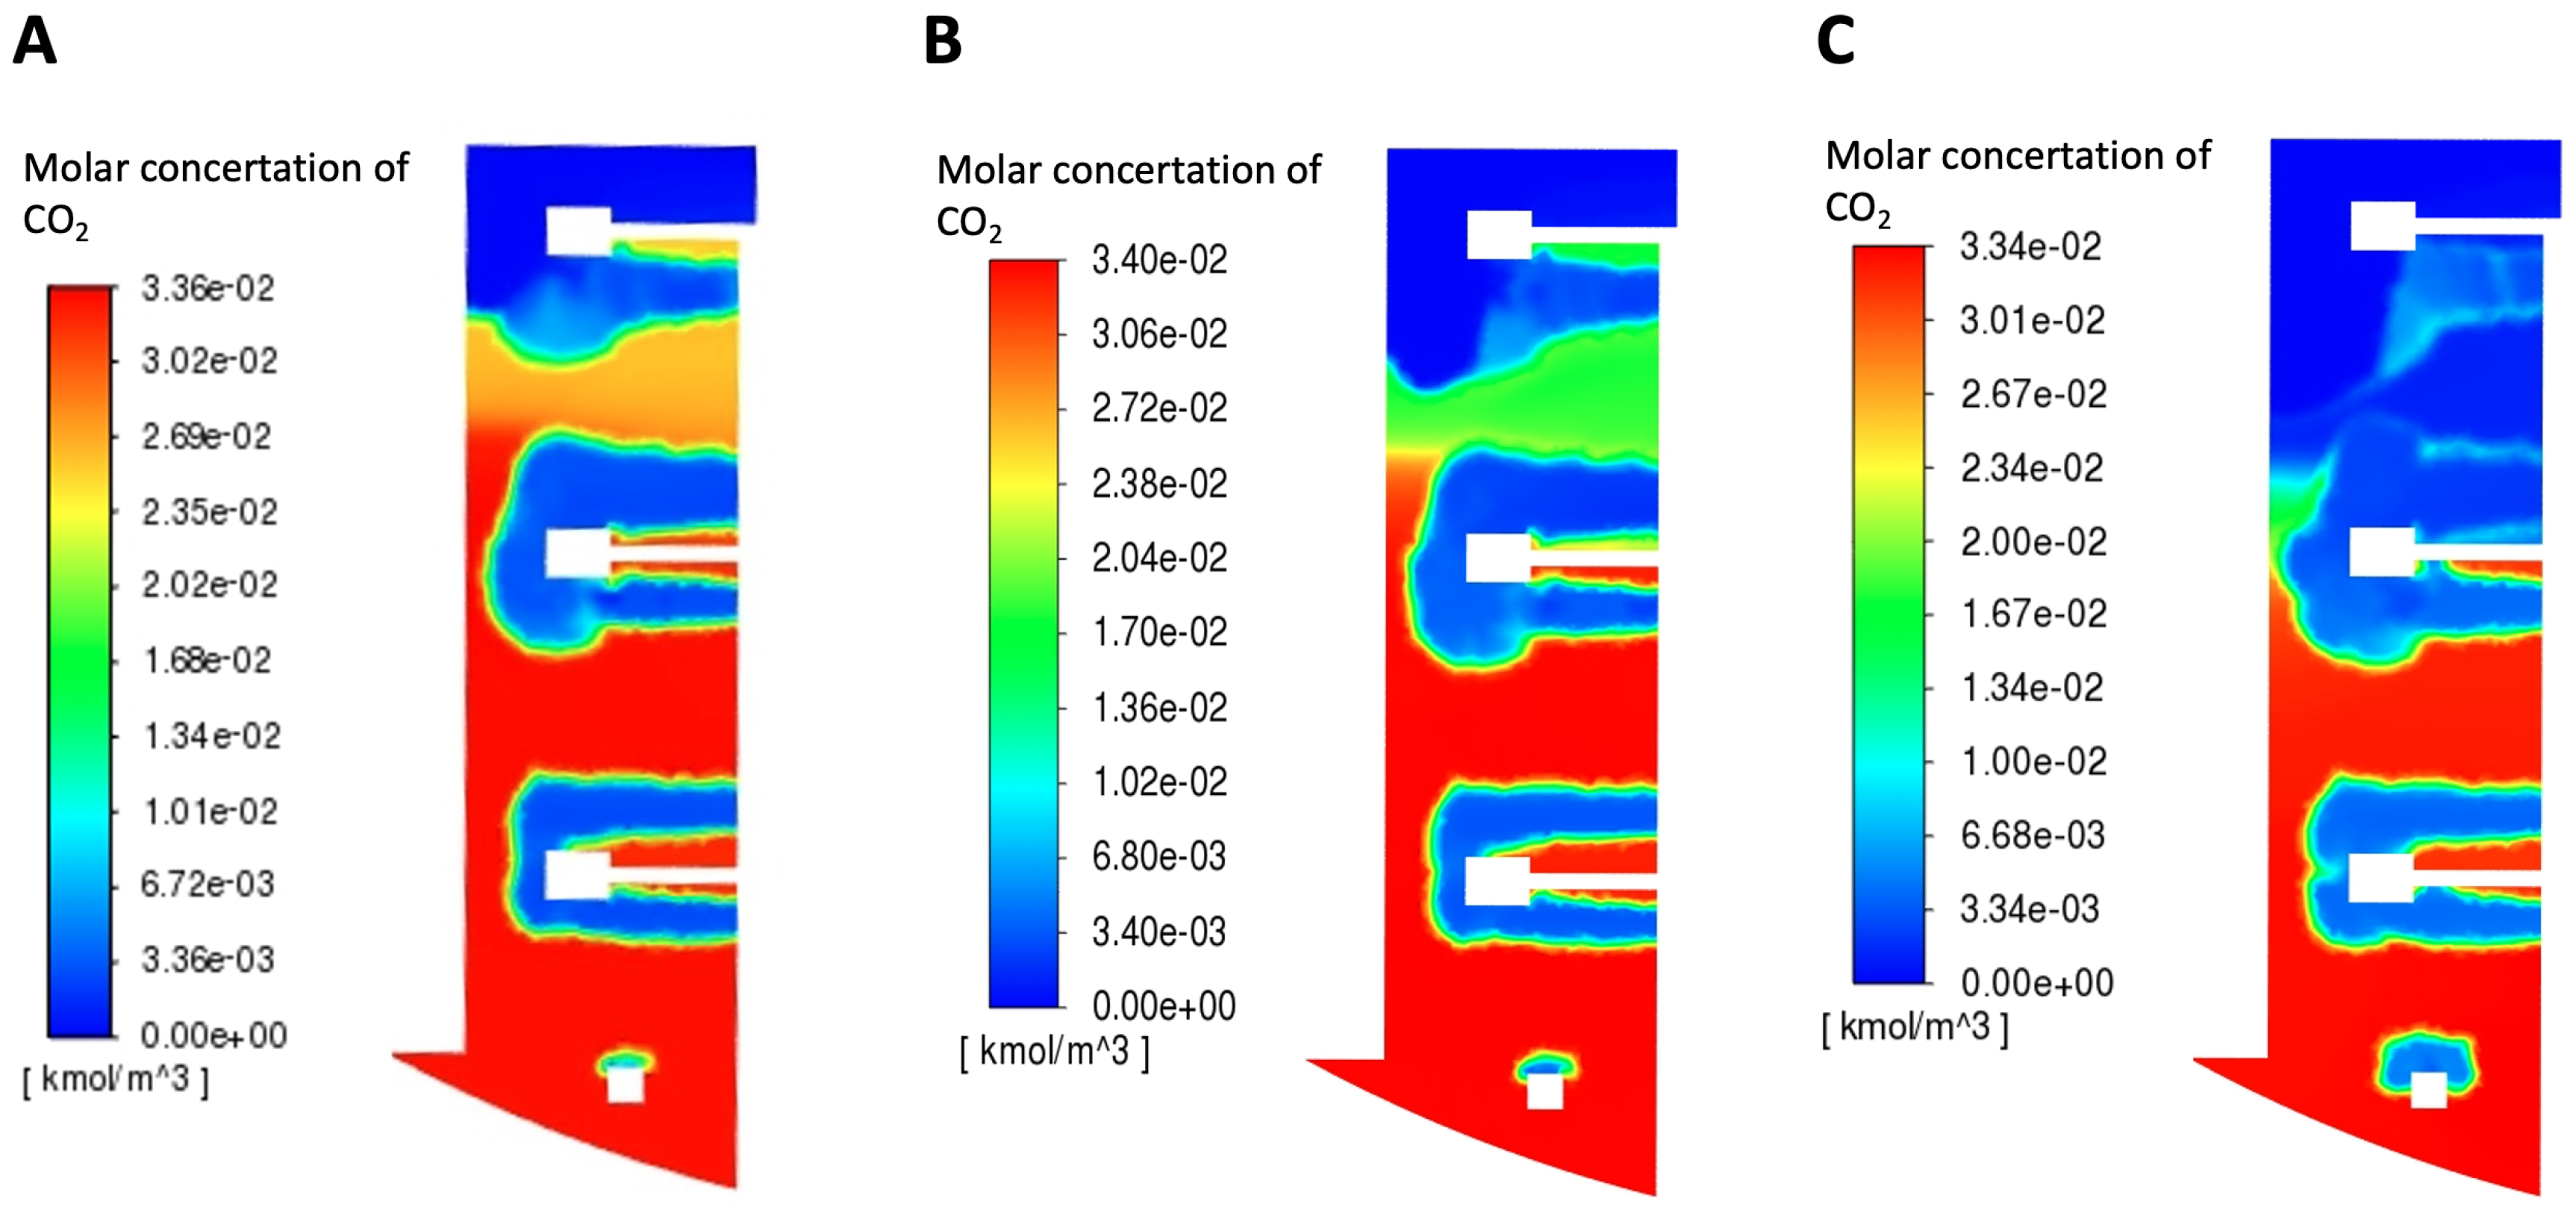
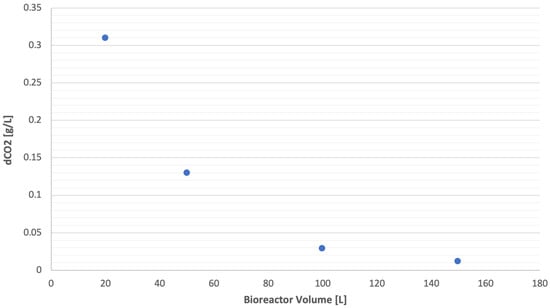
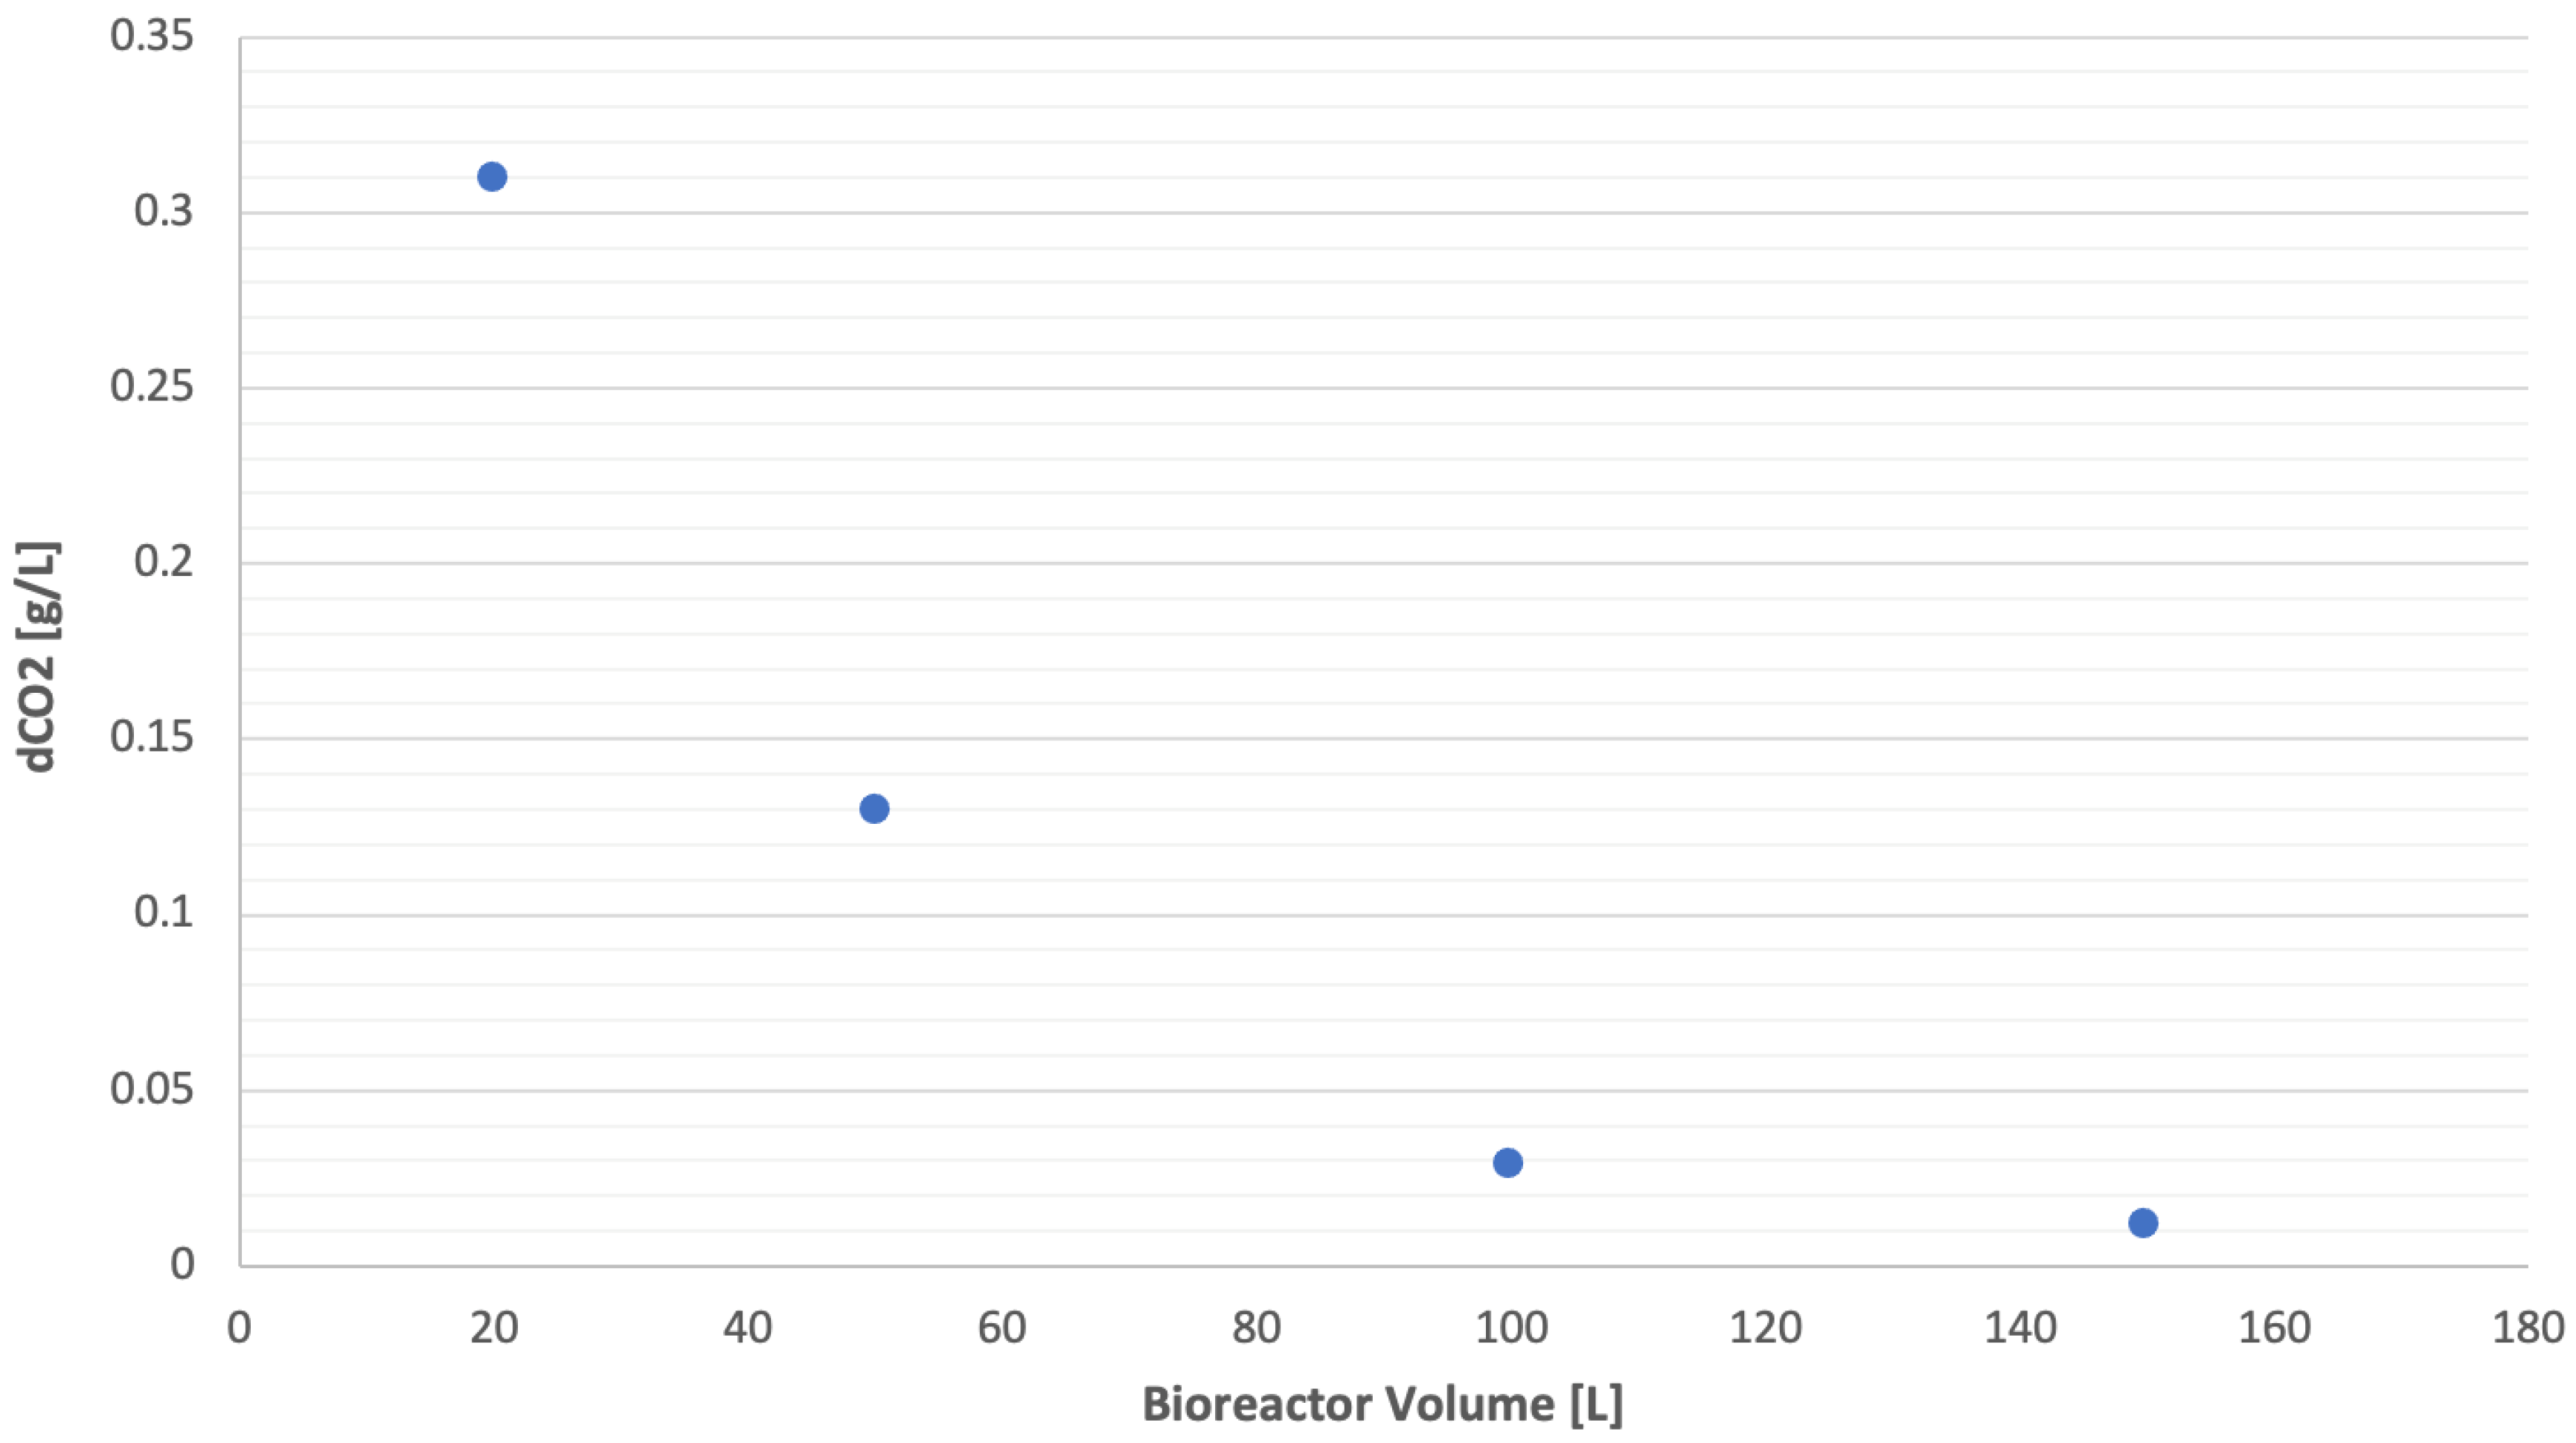
The velocity gradient inside the vessel was first investigated in order to better understand the turbulent environment and the quality of mixing inside the bioreactor. Figure 6B shows that the turbulence is mainly created from the impellers, with the air/carbon dioxide mixture entering the bioreactor contributing a little. The turbulence is more intense around and between the impellers, with the midsection and the bottom part of the vessel having the least amount of turbulence. This pattern for both the gas distribution and the velocity magnitude of the stirrers is confirmed by the other conducted for stirred aerated systems [10,40]. In order to explore the effect of the bioreactor scale on the concentration of dissolved CO2, CFD simulation with different bioreactor volumes (20 L, 50 L and 150 L) and a similar bioreactor geometry and condition (500 RPM, 0.07 vvm) were conducted. The molar concentration profile for each bioreactor volume is presented in Figure 7, with the dissolved CO2 concentration in g/L being summed up in Figure 8, where it is made clear that there is a definite correlation between the working volume of the bioreactor and the concentration of dissolved CO2. By increasing the liquid volume from 20 L to 100 L, a 90.6% decrease in the dissolved CO2 is observed, falling from 0.31 g/L to 0.029 g/L.
Figure 7.
Results of the CFD simulation for different bioreactor volumes, agitation speed 500 RPM and CO2 0.07 vvm: (A) 20 L (B) 50 L (C) 150 L.
Figure 8.
Dissolved CO2 concentration inside the bioreactor from CFD simulation with 20 L, 50 L, 100 L and 150 L bioreactor working volumes.
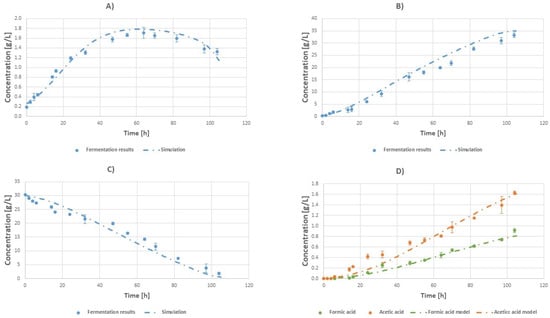
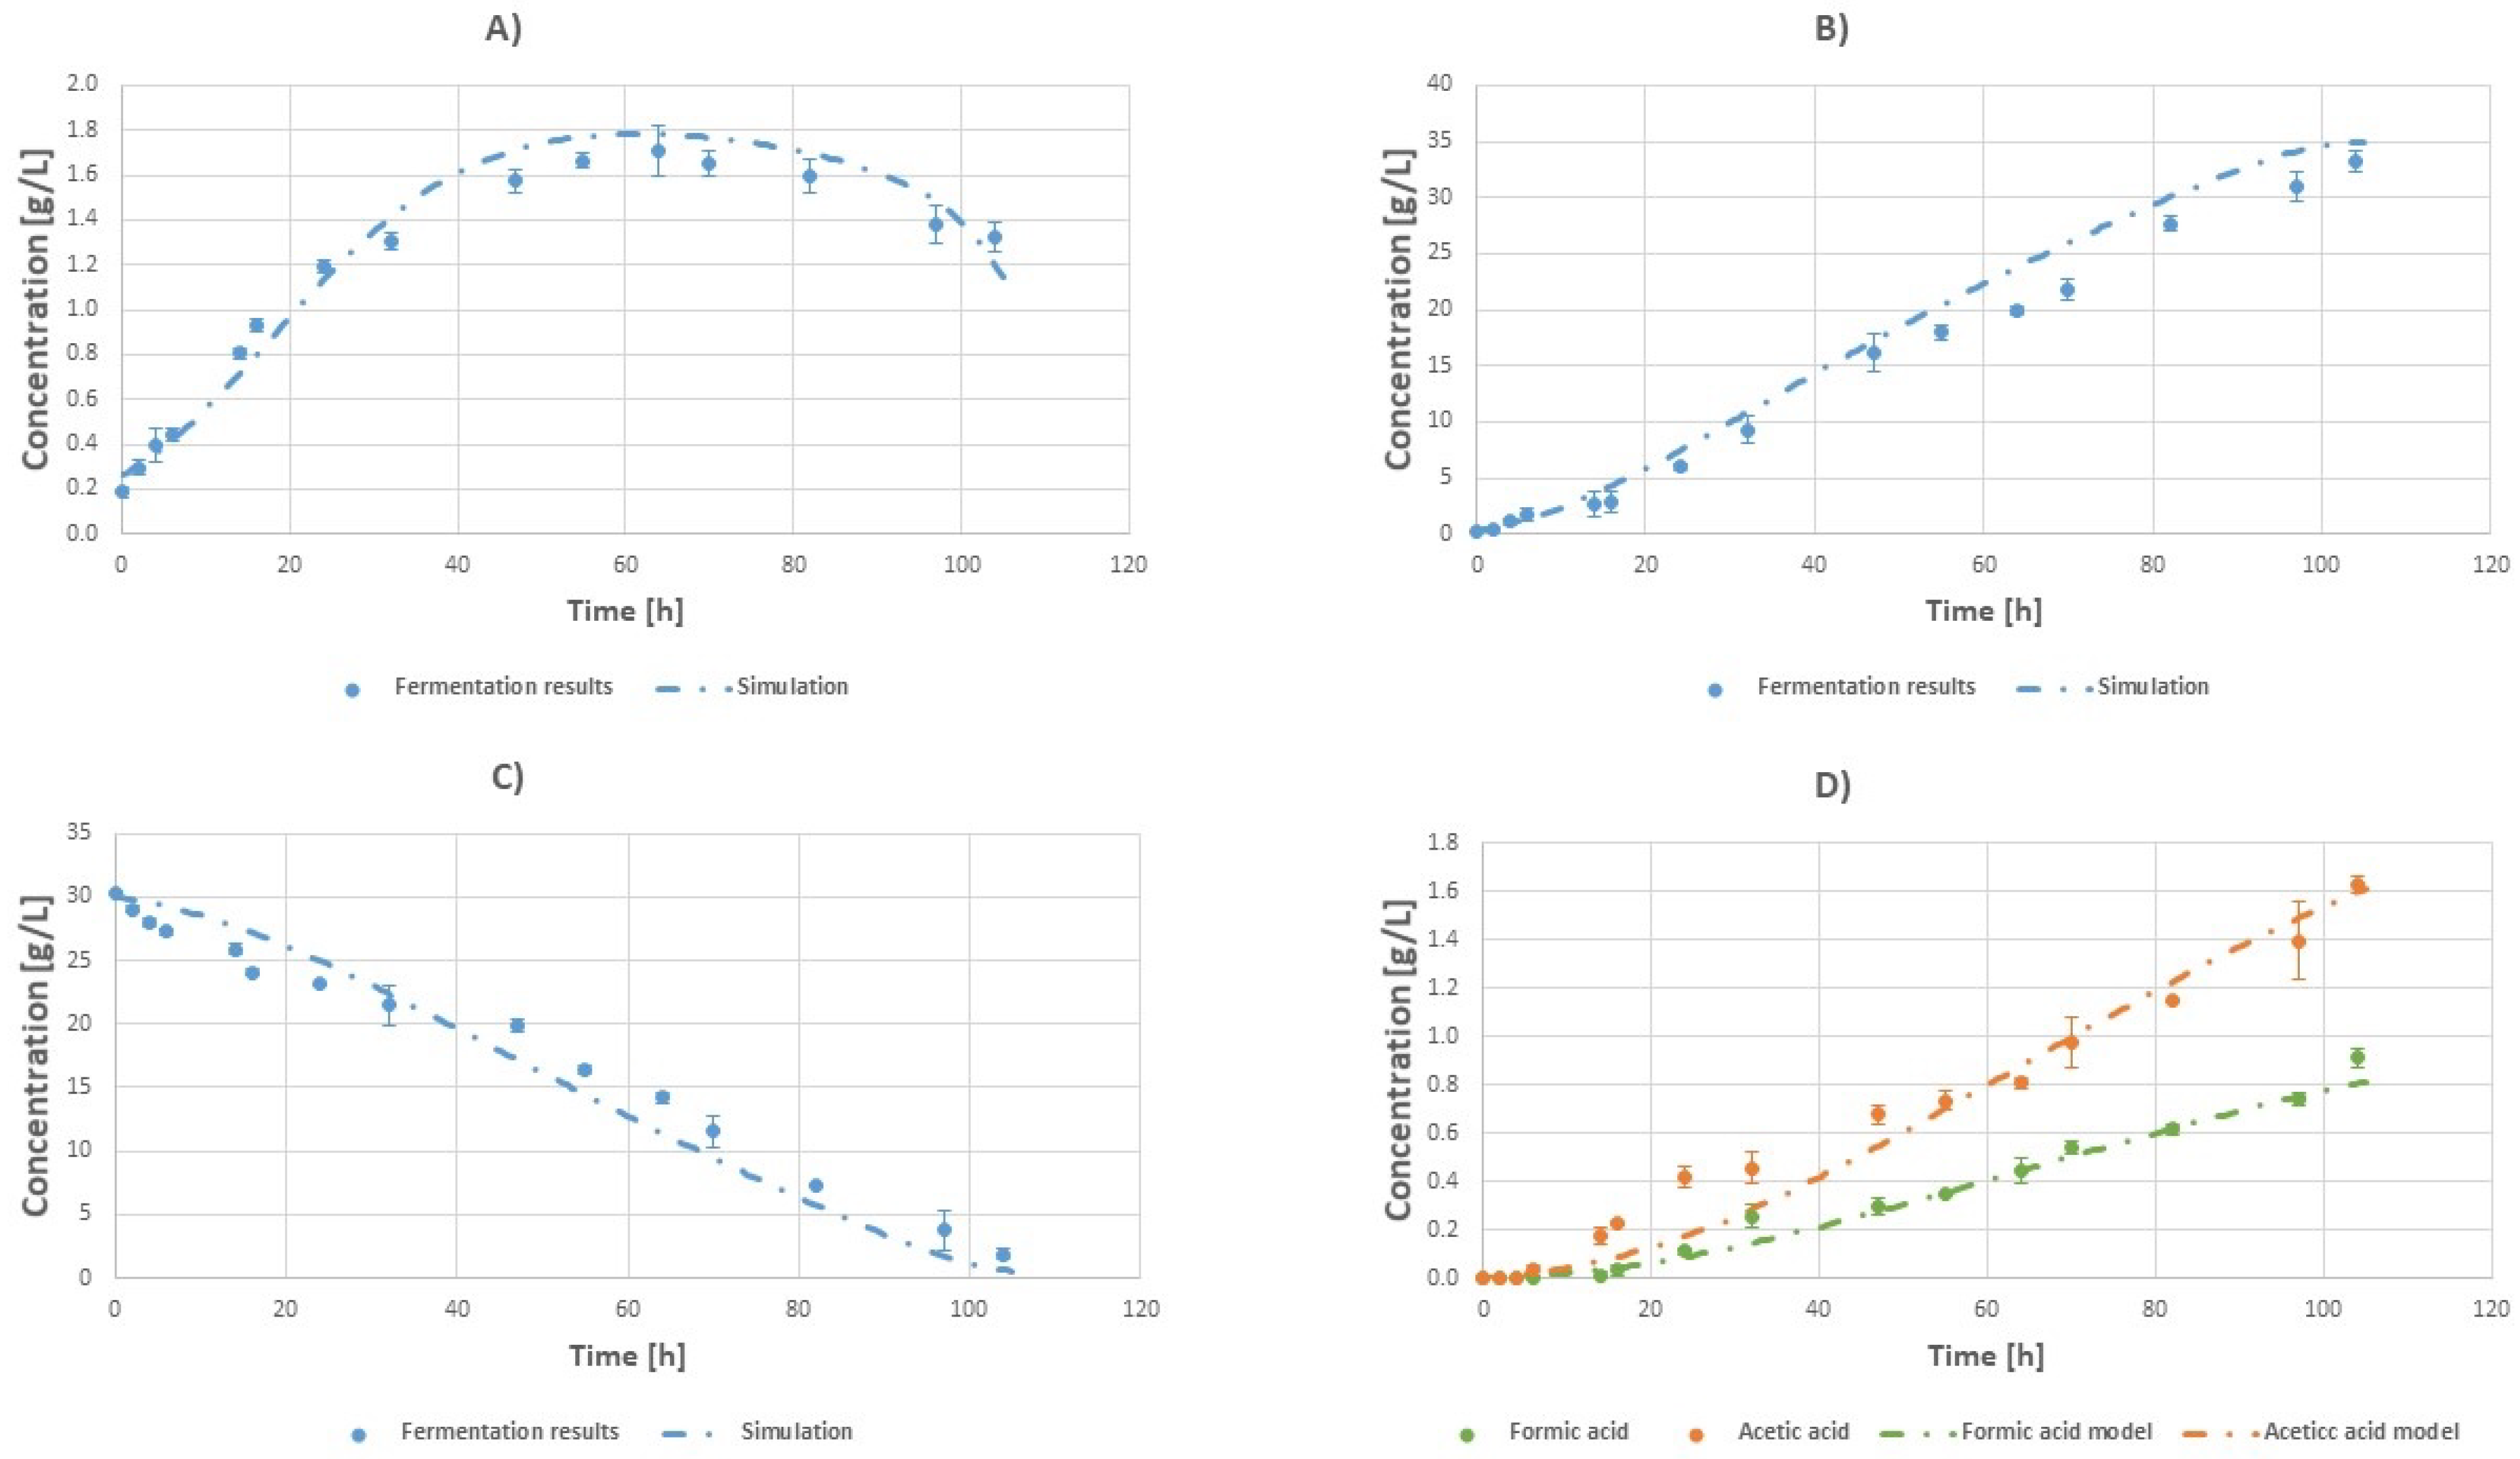
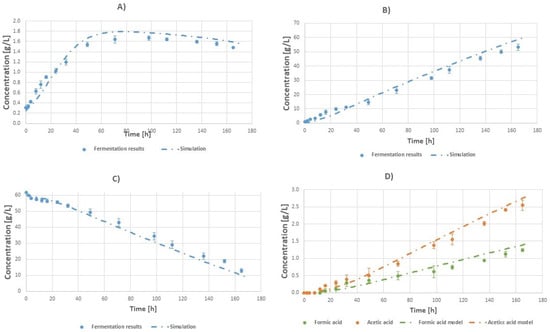
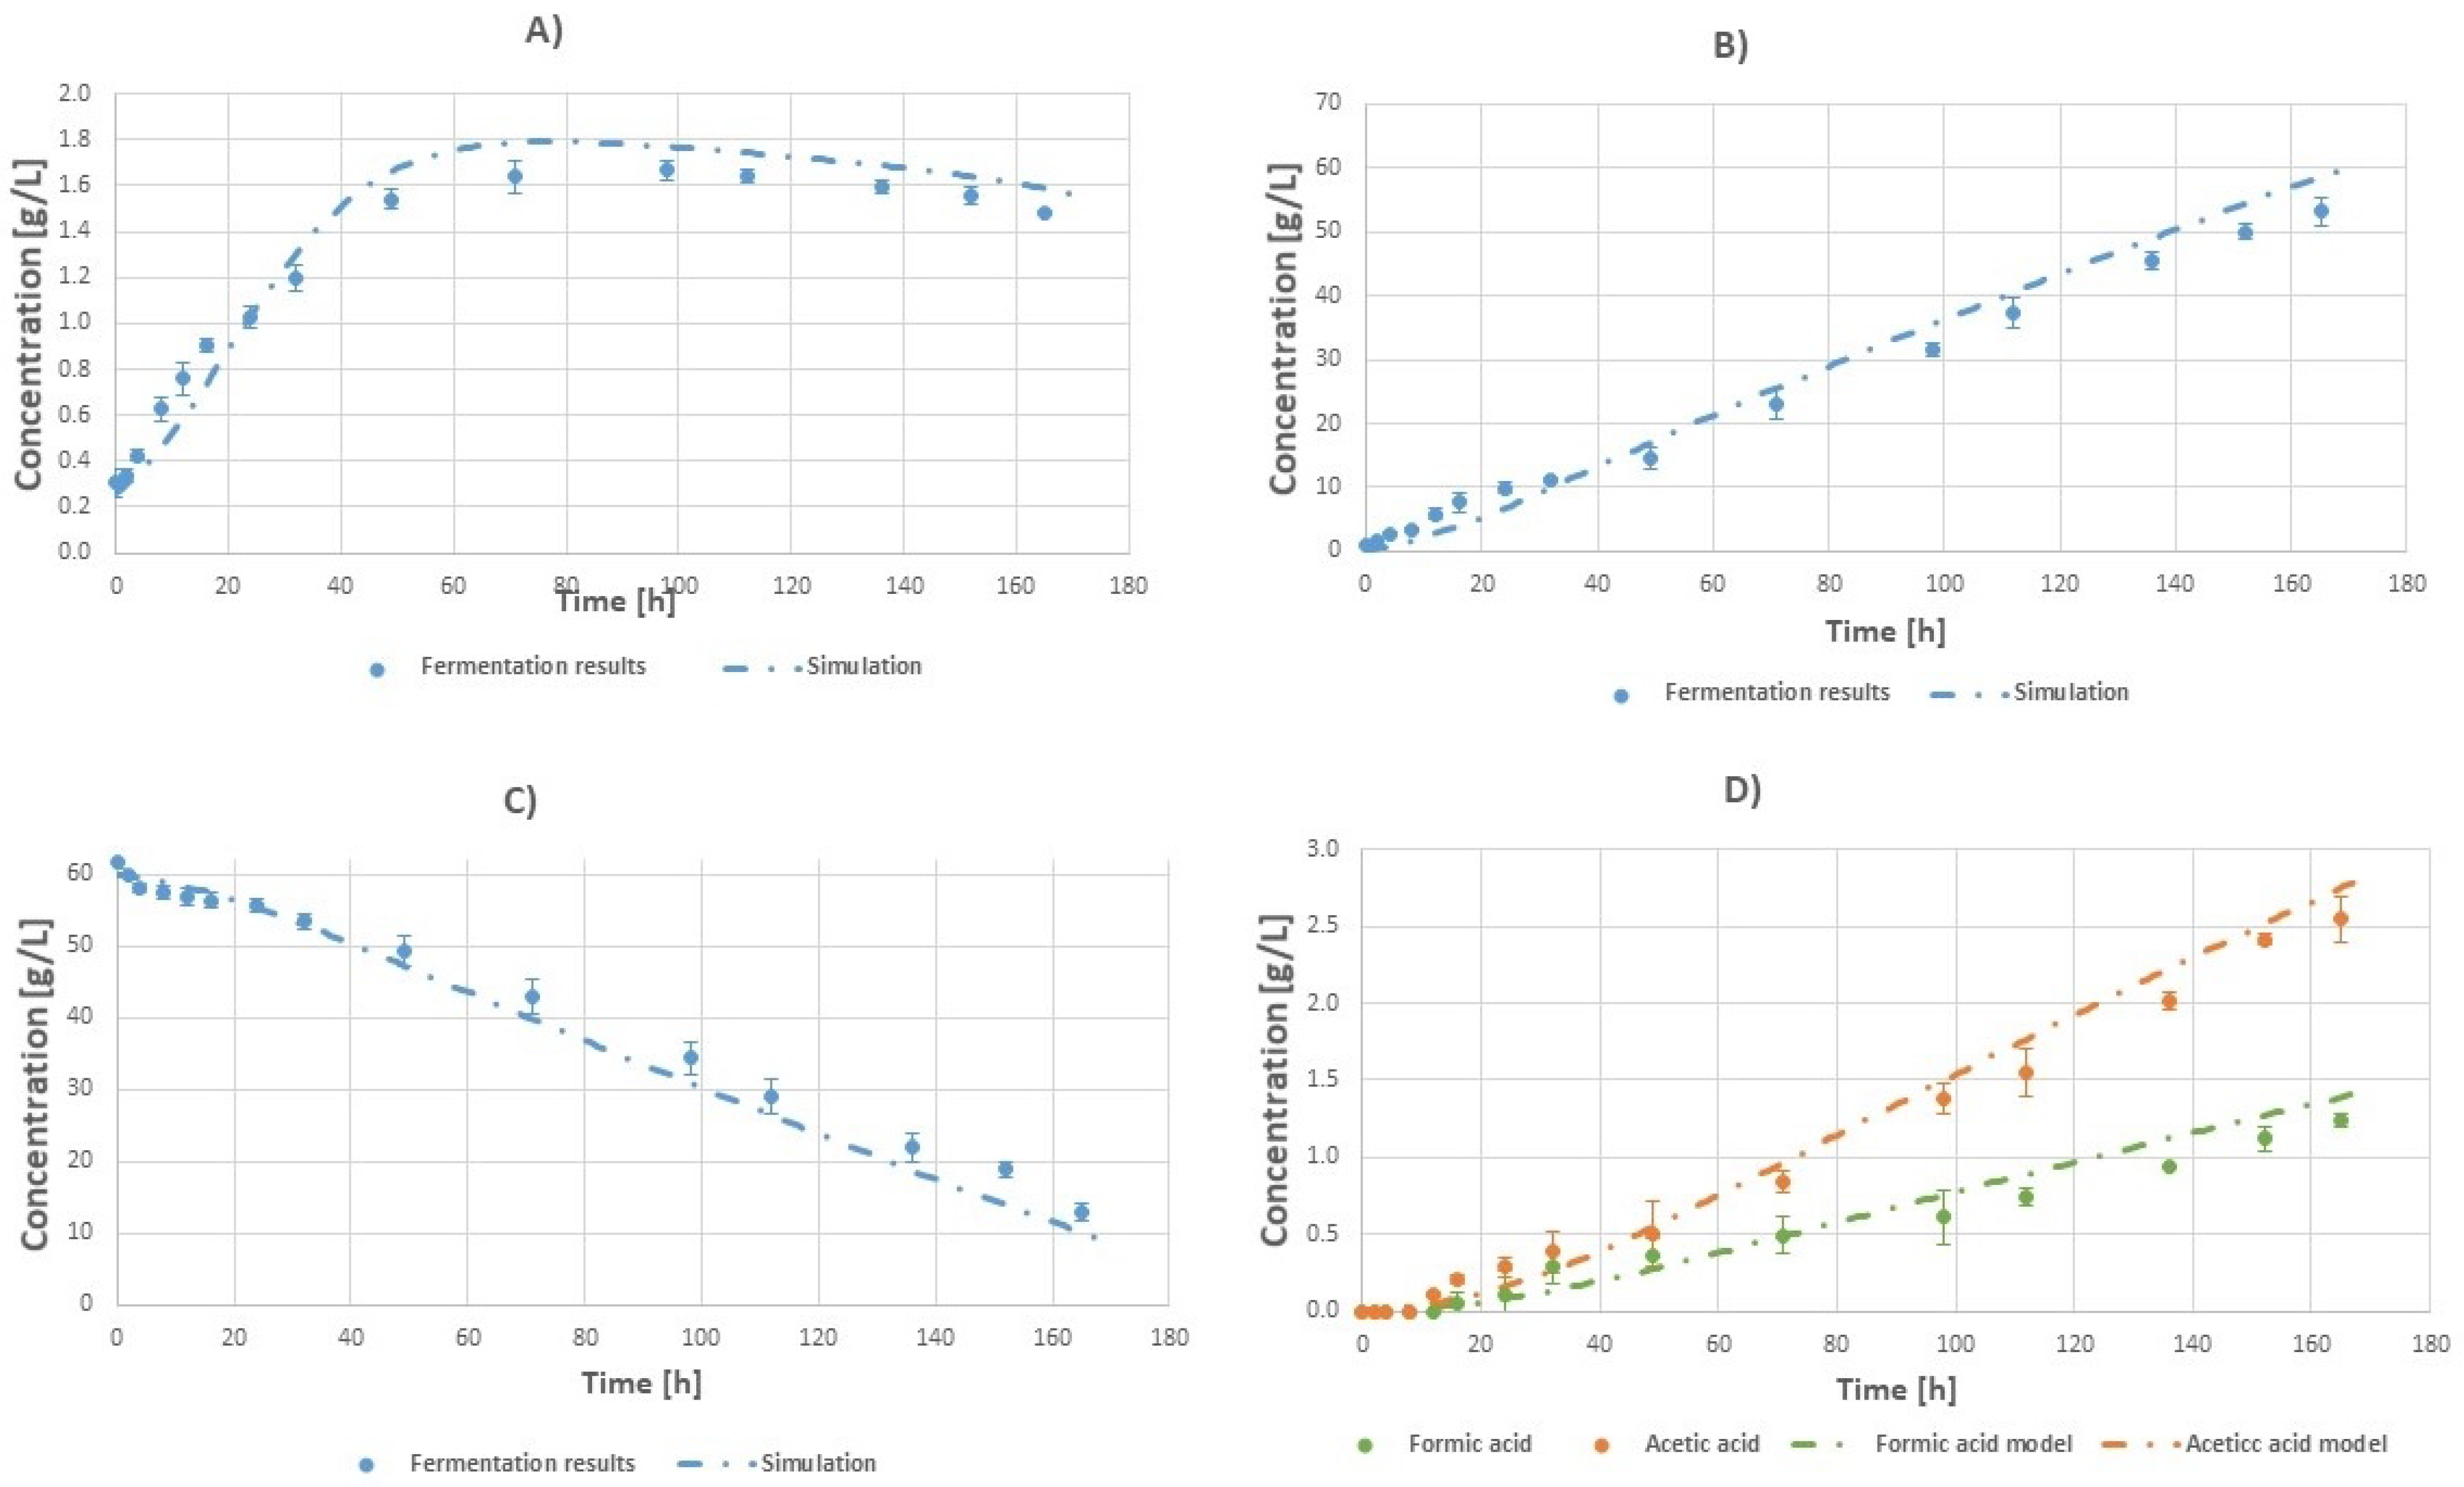
The average CO2 concentration when the CFD simulation for the 100 L vessel has reached a steady-state velocity flow regime was calculated to be 0.029 g/L, while for the bench-top reactors (both 10 and 18 L), the average CO2 was found to be approximately 0.5 g/L. The agitation speed was 500 RPM and the volumetric flow rate of CO2 was 0.07 vvm. The volumetric average concentration of CO2 was calculated with Ansys Fluent and then it was plugged into the bioprocess model. This approach was used since the bioprocess model is based on Monod kinetics, which considers bulk species concentrations. Comparisons between the experimental results and simulations for initial glycerol concentrations of 30 and 60 g/L can be seen in Figure 9 and Figure 10, respectively. It is clear that the diminished dissolved CO2 plays a crucial role in the lowered productivity and yield quantities. Further evidence that supports the role of diminished CO2 in the performance of systems with different working volumes is the increased acetic acid concentration (0.18 higher for the 30 g/L system and 0.25 higher for the 60 g/L system), compared to the lab-scale system. From the literature, it is found that the ratio between succinic acid and other metabolites (by-products) is immediately affected by the amount of CO2 consumed by the cells [23,41].
Figure 9.
Comparison between batch fermentation concentration profiles (points) and simulation results (dashed lines) at a working volume of 100 L with an initial glycerol concentration of 30 g/L 500 RPM and gas flow rate of 0.07 vvm (tfin = 100 h): (A) Biomass. (B) Succinic acid. (C) Glycerol. (D) Fermentation by-products: formic acid (green) and acetic acid (orange).
Figure 10.
Batch fermentation concentration profiles (points) and simulation results (dashed lines) at a working volume of 100 L with an initial glycerol concentration of 60 g/L 500 RPM and gas flow rate of 0.07 vvm (tfin = 166 h): (A) Biomass. (B) Succinic acid. (C) Glycerol. (D) Fermentation by-products: formic acid (green) and acetic acid (orange).
As it can be seen, the model is able to predict the concentration profiles inside the fermenter. The simulated profile somewhat overestimates the concentration profiles inside the bioreactor. However, this is expected since a simplified 2D model is used to perform the CFD studies, and a steady CO2 concentration throughout the course of the fermentation is assumed in the kinetic model.
In Table 3 a comparison of the performance of the lab-scale bench-top and pilot-scale bioreactors is shown. As can be seen, succinic acid productivity (which for each experiment is calculated using the experiment batch time) and yield are both lower for the pilot fermenter compared to the lab-scale one. For the initial glycerol 30 g/L, productivity is 0.32 times lower and the yield is 0.11 times lower. For the initial glycerol of 60 g/L, productivity is 0.32 times lower and the yield is 0.03 times lower.
The experiments conducted with working volume of 18 L have almost similar succinic acid productivity with the lab-scale experiments with the same initial conditions (0.44 and 0.47 g/L/h respectively), but the succinic acid yield is 13% lower. Compared with the pilot scale experiments, the 18 L bioreactor is 37.5% more productive with almost similar succincic acid yield. The bench-top experiment with a working volume of 10 L has the worst performance compared to both the bench-top 18 L experiment and the pilot scale experiment. One hypothesis for the reason for the deterioration in performance can be the geometry of the bioreactor. The bench-top bioreactor is half-filled to a volume of 10 L and there is possibly inadequate mixing.
Moreover, there is an increase in the final concentration of acetic and formic acid. More specifically, acetic acid is increased by 14% and formic acid by 23% compared with the lab scale for the 30 g/L fermentation. For the 60 g/L fermentation, acetic acid is increased by 13% and formic acid by 11%. The increase in the fermentation by-products further supports the idea that the concentration of dissolved CO2 is diminished due to the scaling-up of the process, since low CO2 concentrations promote the production of acetic and formic acid. A maximum theoretical yield of 1.28 can be achieved if all of the substrate is converted to succinic acid [23,25,42].
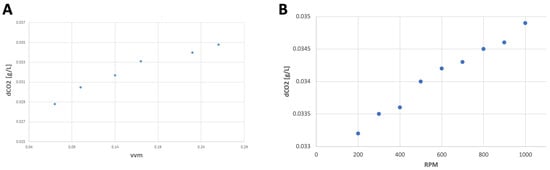
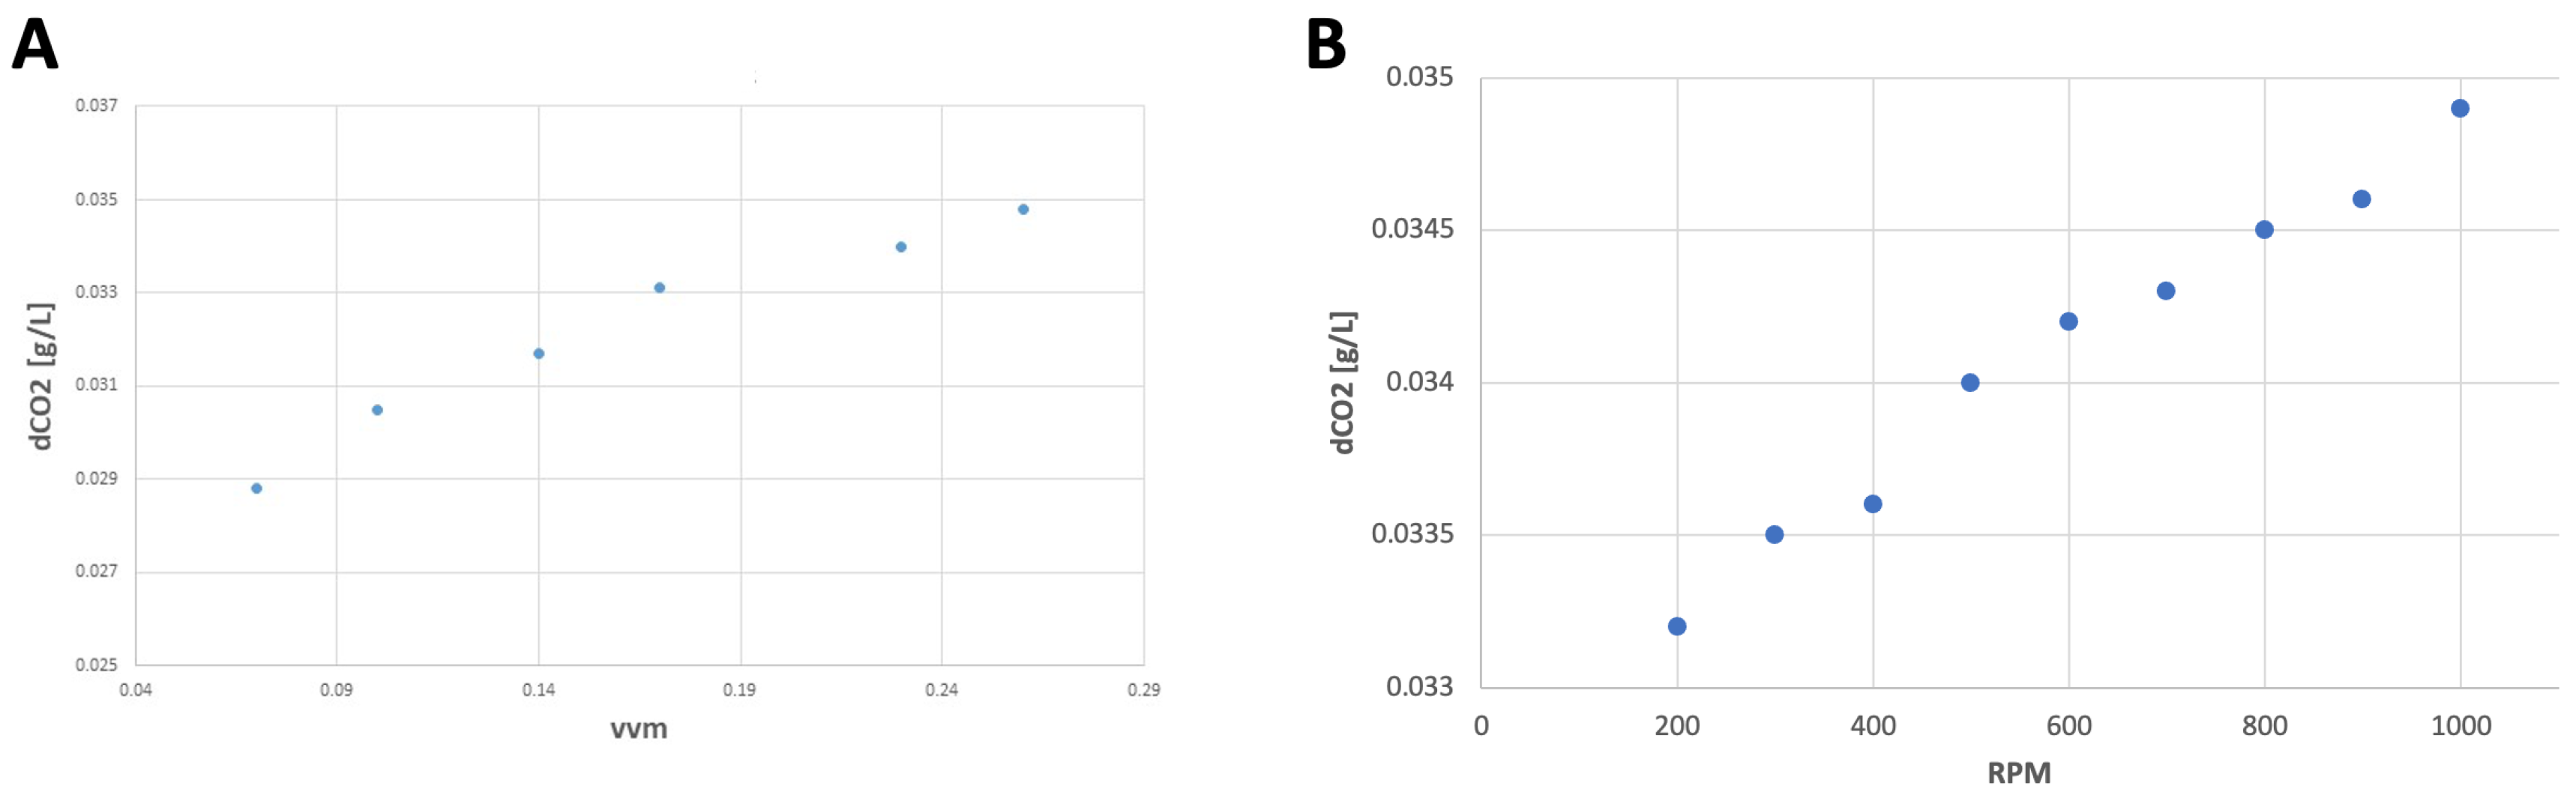
The CFD model was used to evaluate the effect of different agitation speeds and volumetric flow rates on the concentration of dissolved CO2. The gas flow rate was increased from 0.07 vvm to 0.23 vvm. Agitation speeds were raised up to 1000 RPM, however. When the agitation speed was increased, the change in the dissolved CO2 was negligible. On the other hand, the volumetric flow rate had a more significant influence on the dissolved CO2.
From Figure 11A, it is visible that increasing volumetric flow rate of gas inside the bioreactor will lead to an increase in the concentration of dissolved CO2 in the liquid phase of the bioreactor. More specifically, increasing the volumetric flow rate from 0.07 vvm to 0.23 vvm will result in a 14.7% increase in dissolved CO2. On the contrary, as seen in Figure 11B, increasing the agitation speed to 1000 RPM, effectively doubling it, will result in an increase in dissolved CO2 of only 2.6%.
Figure 11.
Relation of dissolved CO2 in the liquid phase of the bioreactor with: (A) gas flow rate with fixed agitation speed 500 RPM, (B) agitation speed with fixed gas flow rate 0.07 vvm.
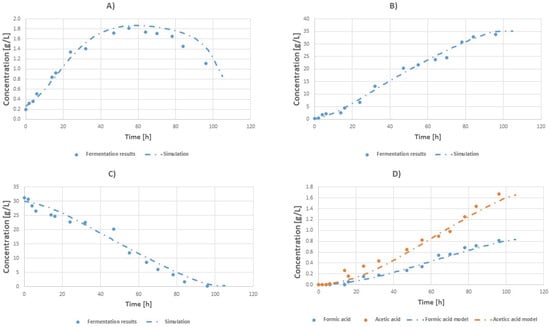
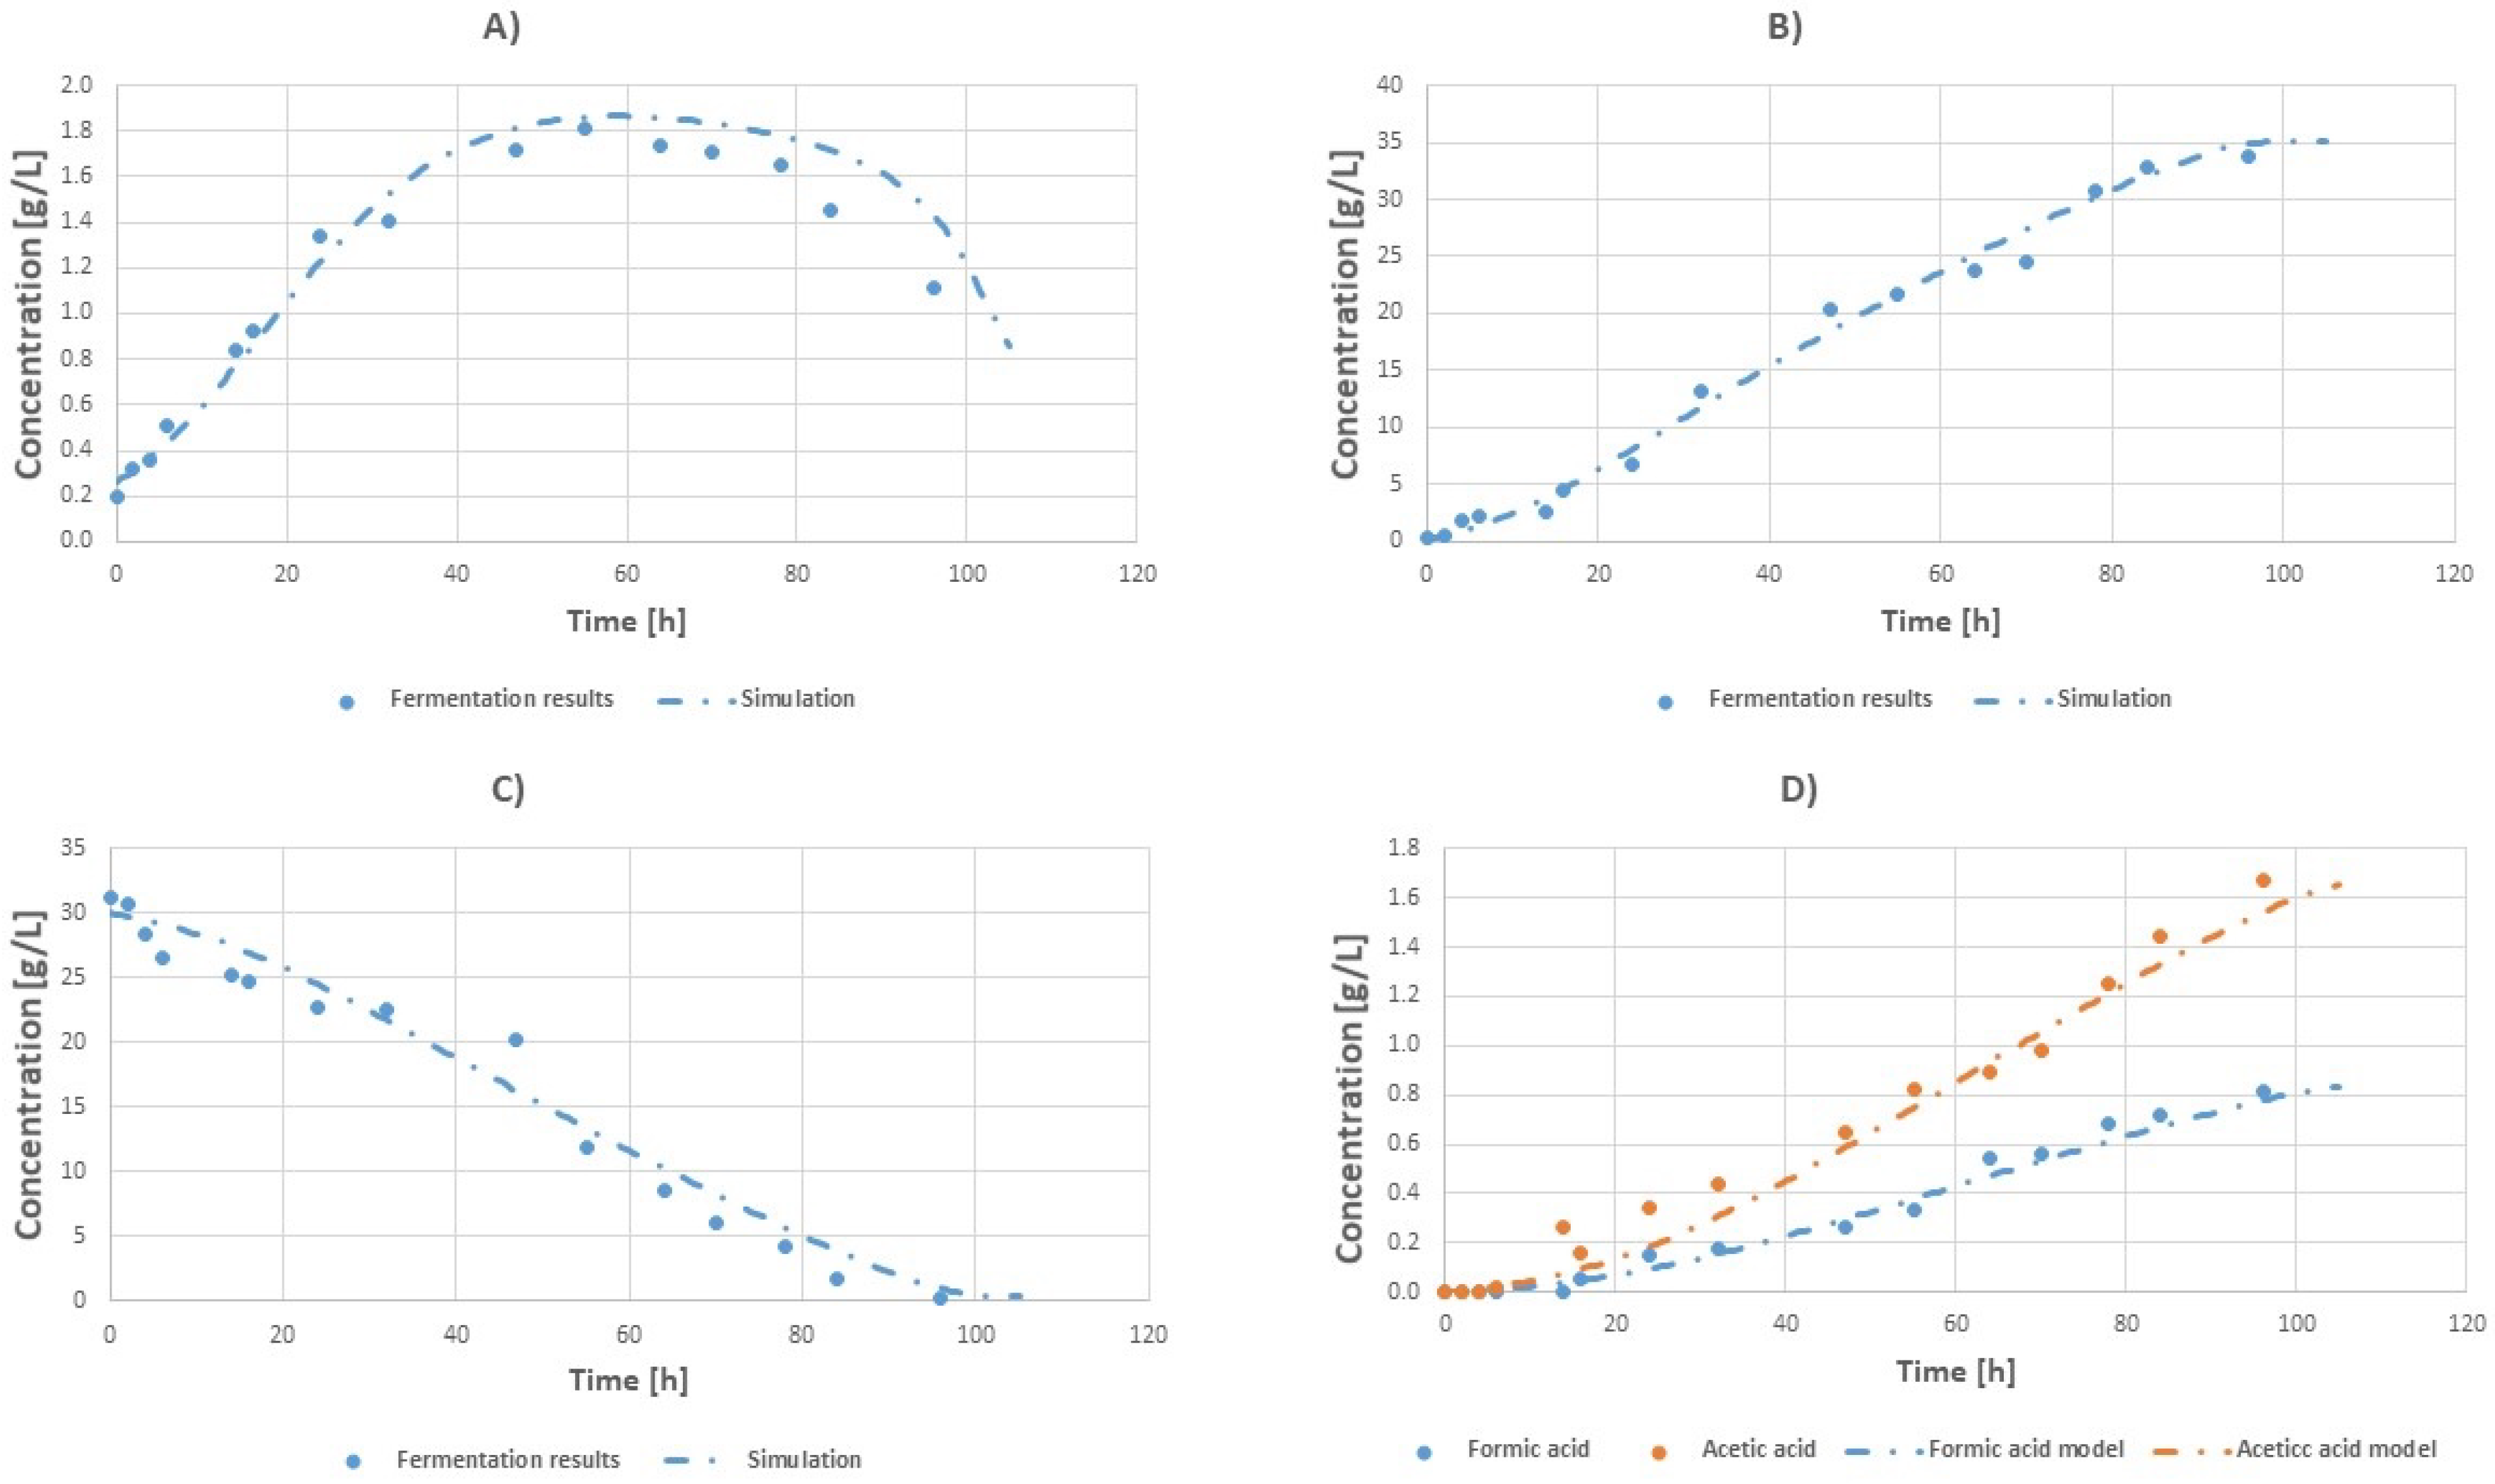
Based on the results of the in silico experiments and in order to verify the results of Figure 11A experimentally, a fermentation run was performed, using an increased flow rate of 0.23 vvm of inlet gas (0.22 vvm CO2 and 0.01 vvm of air), corresponding to dissolved CO2 of 0.04 g/L. The fermentation results can be seen in Figure 12.
Figure 12.
Batch fermentation concentration profiles (points) and simulation results (dashed lines) at a working volume of 100 L with an initial glycerol concentration of 30 g/L 500 RPM and gas flow rate of 0.23 vvm (tfin = 96 h): (A) Biomass. (B) Succinic acid. (C) Glycerol. (D) Fermentation by-products: formic acid (blue) and acetic acid (orange).
The increased amount of dissolved CO2 inside the bioreactor resulted in an increased final succinic acid concentration of 33.7 ± 0.11 g/L, a 4.3% increase compared with the experiments with a gas flow rate of 0.07 vvm, and correspondingly an increase of 3.5% in succinic acid yield to 1.12 and an 8.5% increase in succinic acid productivity to 0.35 . Furthermore, the final acetic and formic acid concentrations were 3.6% and 3% lower respectively.
4. Conclusions
In this study, succinic acid was successfully produced biochemically from glycerol at a range of scales: from the laboratory scale to a 100 L pilot scale. A CFD model was successfully used to simulate the concentration of CO2 in the liquid phase of the bioreactor, to assess the effect of mass transport on the overall productivity and yield of the system. Using a robust kinetic model coupled with CFD simulations, improved fermentation conditions were calculated that increased the concentration of dissolved CO2 in the bioreactor, subsequently leading to increased process productivity and yield, while simultaneously decreasing the concentration of the unwanted by-products. These results stress the importance of having an integrated modeling approach, which can greatly improve the efficiency and the scalability of a bioprocess [43]. With this approach, the negative mass transport effects during fermentation scale-up can be successfully mitigated.
Author Contributions
I.Z.: Conceptualization, Investigation, Methodology, Data curation, Writing—original draft, Writing—review and editing, Visualization. C.T.: Supervision, Methodology, Conceptualization, Investigation, Data curation, Writing—original draft, Writing—review and editing, Visualization. All authors have read and agreed to the published version of the manuscript.
Funding
This research was funded by the University of Manchester Presidential Doctoral Scholarship Award and the Biotechnology and Biological Sciences Research Council (BBSRC) UK, as part of the follow-on project BB/Z516090/1.
Data Availability Statement
The original contributions presented in this study are included in the article. Further inquiries can be directed to the corresponding author.
Acknowledgments
I.Z. would like to thank Stelios Triantafylou for his help in creating the CAD model of the bioreactor.
Conflicts of Interest
The authors declare no conflicts of interest.
References
- Xia, J.; Wang, G.; Lin, J.; Wang, Y.; Chu, J.; Zhuang, Y.; Zhang, S. Advances and Practices of Bioprocess Scale-up. In Bioreactor Engineering Research and Industrial Applications II; Bao, J., Ye, Q., Zhong, J.J., Eds.; Springer: Berlin/Heidelberg, Germany, 2016; pp. 137–151. [Google Scholar] [CrossRef] [Scilit]
- Vrábel, P.; van der Lans, R.G.J.M.; van der Schot, F.N.; Luyben, K.C.; Xu, B.; Enfors, S.O. CMA: Integration of fluid dynamics and microbial kinetics in modelling of large-scale fermentations. Chem. Eng. J. 2001, 84, 463–474. [Google Scholar] [CrossRef] [Scilit]
- Hewitt, C.J.; Nienow, A.W. The Scale-Up of Microbial Batch and Fed-Batch Fermentation Processes. In Advances in Applied Microbiology; Academic Press: Cambridge, MA, USA, 2007; Volume 62, pp. 105–135. [Google Scholar] [CrossRef] [Scilit]
- Achouri, O.; Bianco, F.; Trancone, G.; Race, M. A critical review of anaerobic biofilm reactors for the renewable biogas production from food waste. J. Environ. Chem. Eng. 2025, 13, 118239. [Google Scholar] [CrossRef] [Scilit]
- Schmalzriedt, S.; Jenne, M.; Mauch, K.; Reuss, M. Integration of physiology and fluid dynamics. Adv. Biochem. Eng. 2003, 80, 19–68. [Google Scholar] [CrossRef] [Scilit]
- Lara, A.R.; Galindo, E.; Ramírez, O.T.; Palomares, L.A. Living with heterogeneities in bioreactors: Understanding the effects of environmental gradients on cells. Mol. Biotechnol. 2006, 34, 355–381. [Google Scholar] [CrossRef] [Scilit]
- Larsson, G.; Törnkvist, M.; Wernersson, E.S.; Trägårdh, C.; Noorman, H.; Enfors, S.O. Substrate gradients in bioreactors: Origin and consequences. Bioprocess Eng. 1996, 14, 281–289. [Google Scholar] [CrossRef]
- Formenti, L.R.; Nørregaard, A.; Bolic, A.; Hernandez, D.Q.; Hagemann, T.; Heins, A.L.; Larsson, H.; Mears, L.; Mauricio-Iglesias, M.; Krühne, U.; et al. Challenges in industrial fermentation technology research. Biotechnol. J. 2014, 9, 727–738. [Google Scholar] [CrossRef] [Scilit] [PubMed]
- Bylund, F.; Collet, E.; Enfors, S.O.; Larsson, G. Substrate gradient formation in the large-scale bioreactor lowers cell yield and increases by-product formation. Bioprocess Eng. 1998, 18, 171–180. [Google Scholar] [CrossRef] [Scilit]
- Morchain, J.; Gabelle, J.C.; Cockx, A. A coupled population balance model and CFD approach for the simulation of mixing issues in lab-scale and industrial bioreactors. AIChE J. 2014, 60, 27–40. [Google Scholar] [CrossRef] [Scilit]
- Bezzo, F.; Macchietto, S.; Pantelides, C.C. General hybrid multizonal/CFD approach for bioreactor modeling. AIChE J. 2003, 49, 2133–2148. [Google Scholar] [CrossRef] [Scilit]
- Wang, G.; Haringa, C.; Noorman, H.; Chu, J.; Zhuang, Y. Developing a Computational Framework To Advance Bioprocess Scale-Up. Trends Biotechnol. 2020, 38, 846–856. [Google Scholar] [CrossRef] [Scilit]
- Bach, C.; Yang, J.; Larsson, H.; Stocks, S.M.; Gernaey, K.V.; Albaek, M.O.; Krühne, U. Evaluation of mixing and mass transfer in a stirred pilot scale bioreactor utilizing CFD. Chem. Eng. Sci. 2017, 171, 19–26. [Google Scholar] [CrossRef] [Scilit]
- Neubauer, P.; Cruz, N.; Glauche, F.; Junne, S.; Knepper, A.; Raven, M. Consistent development of bioprocesses from microliter cultures to the industrial scale. Eng. Life Sci. 2013, 13, 224–238. [Google Scholar] [CrossRef] [Scilit]
- Li, X.; Guan, X.; Zhou, R.; Yang, N.; Liu, M. CFD Simulation of Gas Dispersion in a Stirred Tank of Dual Rushton Turbines. Int. J. Chem. React. Eng. 2017, 15, 20160221. [Google Scholar] [CrossRef] [Scilit]
- Mancini, E.; Dickson, R.; Fabbri, S.; Udugama, I.A.; Ullah, H.I.; Vishwanath, S.; Gernaey, K.V.; Luo, J.; Pinelo, M.; Mansouri, S.S. Economic and environmental analysis of bio-succinic acid production: From established processes to a new continuous fermentation approach with in-situ electrolytic extraction. Chem. Eng. Res. Des. 2022, 179, 401–414. [Google Scholar] [CrossRef] [Scilit]
- Wang, G.; Haringa, C.; Tang, W.; Noorman, H.; Chu, J.; Zhuang, Y.; Zhang, S. Coupled metabolic-hydrodynamic modeling enabling rational scale-up of industrial bioprocesses. Biotechnol. Bioeng. 2020, 117, 844–867. [Google Scholar] [CrossRef] [Scilit] [PubMed]
- Hartmann, F.S.F.; Udugama, I.A.; Seibold, G.M.; Sugiyama, H.; Gernaey, K.V. Digital models in biotechnology: Towards multi-scale integration and implementation. Biotechnol. Adv. 2022, 60, 108015. [Google Scholar] [CrossRef] [Scilit]
- Neubauer, P.; Junne, S. Scale-down simulators for metabolic analysis of large-scale bioprocesses. Curr. Opin. Biotechnol. 2010, 21, 114–121. [Google Scholar] [CrossRef] [Scilit]
- Rigaki, A.; Webb, C.; Theodoropoulos, C. Double substrate limitation model for the bio-based production of succinic acid from glycerol. Biochem. Eng. J. 2020, 153, 107391. [Google Scholar] [CrossRef] [Scilit]
- Zacharopoulos, I.; Tao, M.; Theodoropoulos, C. Experimental and computational study of a packed-bed bioreactor for the continuous production of succinic acid. React. Chem. Eng. 2025, 10, 2490–2501. [Google Scholar] [CrossRef] [Scilit]
- Vlysidis, A.; Binns, M.; Webb, C.; Theodoropoulos, C. Glycerol utilisation for the production of chemicals: Conversion to succinic acid, a combined experimental and computational study. Biochem. Eng. J. 2011, 58–59, 1–11. [Google Scholar] [CrossRef] [Scilit]
- Binns, M.; de Atauri, P.; Cascante, M.; Theodoropoulos, C. Using control bias to identify initial targets for bioproduction improvement. New Biotechnol. 2025, 89, 130–140. [Google Scholar] [CrossRef] [Scilit] [PubMed]
- McKinlay, J.B.; Shachar-Hill, Y.; Zeikus, J.G.; Vieille, C. Determining Actinobacillus succinogenes metabolic pathways and fluxes by NMR and GC-MS analyses of 13C-labeled metabolic product isotopomers. Metab. Eng. 2007, 9, 177–192. [Google Scholar] [CrossRef] [Scilit] [PubMed]
- McKinlay, J.B.; Zeikus, J.G.; Vieille, C. Insights into Actinobacillus succinogenes fermentative metabolism in a chemically defined growth medium. Appl. Environ. Microbiol. 2005, 71, 6651–6656. [Google Scholar] [CrossRef] [Scilit]
- ANSYS, Inc. ANSYS FLUENT Theory Guide; ANSYS, Inc.: Canonsburg, PA, USA, 2013. [Google Scholar]
- Liu, K.; Phillips, J.R.; Sun, X.; Mohammad, S.; Huhnke, R.L.; Atiyeh, H.K. Investigation and Modeling of Gas-Liquid Mass Transfer in a Sparged and Non-Sparged Continuous Stirred Tank Reactor with Potential Application in Syngas Fermentation. Fermentation 2019, 5, 75. [Google Scholar] [CrossRef] [Scilit]
- Egedy, A.; Kummer, A.; Leveneur, S.; Varga, T.; Chován, T. CFD Modeling of Spatial Inhomogeneities in a Vegetable Oil Carbonation Reactor. Processes 2020, 8, 1356. [Google Scholar] [CrossRef] [Scilit]
- Alia, N.; John, V.; Ollila, S. Revisiting the single-phase flow model for liquid steel ladle stirred by gas. Appl. Math. Model. 2019, 67, 549–556. [Google Scholar] [CrossRef] [Scilit]
- Wang, H.; Jia, X.; Wang, X.; Zhou, Z.; Wen, J.; Zhang, J. CFD modeling of hydrodynamic characteristics of a gas–liquid two-phase stirred tank. Appl. Math. Model. 2014, 38, 63–92. [Google Scholar] [CrossRef] [Scilit]
- Delafosse, A.; Collignon, M.L.; Calvo, S.; Delvigne, F.; Crine, M.; Thonart, P.; Toye, D. CFD-based compartment model for description of mixing in bioreactors. Chem. Eng. Sci. 2014, 106, 76–85. [Google Scholar] [CrossRef] [Scilit]
- Xie, F.; Liu, J.; Wang, J.; Chen, W. Computational fluid dynamics simulation and particle image velocimetry experimentation of hydrodynamic performance of flat-sheet membrane bioreactor equipped with micro-channel turbulence promoters with micro-pores. Korean J. Chem. Eng. 2016, 33, 2169–2178. [Google Scholar] [CrossRef] [Scilit]
- Tuković, Ž.; Jasak, H. A moving mesh finite volume interface tracking method for surface tension dominated interfacial fluid flow. Comput. Fluids 2012, 55, 70–84. [Google Scholar] [CrossRef] [Scilit]
- GraceJ, R.; Wairegi, T.; NguyenT, H. Shapes and velocities of single drops and bubbles moving freely through immiscible liquids. Trans. Inst. Chem. Eng. 1976, 54, 167–173. [Google Scholar]
- Yamoah, S.; Martínez-Cuenca, R.; Monrós, G.; Chiva, S.; Macián-Juan, R. Numerical investigation of models for drag, lift, wall lubrication and turbulent dispersion forces for the simulation of gas–liquid two-phase flow. Chem. Eng. Res. Des. 2015, 98, 17–35. [Google Scholar] [CrossRef] [Scilit]
- Hikita, H.; Asai, S.; Tanigawa, K.; Segawa, K.; Kitao, M. The volumetric liquid-phase mass transfer coefficient in bubble columns. Chem. Eng. J. 1981, 22, 61–69. [Google Scholar] [CrossRef] [Scilit]
- Hughmark, G.A. Holdup and Mass Transfer in Bubble Columns. Ind. Eng. Chem. Process Des. Dev. 1967, 6, 218–220. [Google Scholar] [CrossRef] [Scilit]
- Keating, M. Accelerating CFD Solutions Several Recent Enhancements in ANSYS FlueNt Solver Capabilities Accelerate Convergence and Reduce Solution Time; ANSYS Inc.: Canonsburg, PA, USA, 2011; p. 2. [Google Scholar]
- Zacharopoulos, I.; Theodoropoulos, C. Continuous production of succinic acid from glycerol: A complete experimental and computational study. Bioresour. Technol. 2023, 386, 129518. [Google Scholar] [CrossRef] [Scilit]
- Ahmed, S.U.; Ranganathan, P.; Pandey, A.; Sivaraman, S. Computational fluid dynamics modeling of gas dispersion in multi impeller bioreactor. J. Biosci. Bioeng. 2010, 109, 588–597. [Google Scholar] [CrossRef] [Scilit]
- Binns, M.; Vlysidis, A.; Webb, C.; Theodoropoulos, C.; de Atauri, P.; Cascante, M. Glycerol metabolic conversion to succinic acid using Actinobacillus succinogenes. a metabolic network-based analysis. Comput. Aided Chem. Eng. 2011, 29, 1421–1425. [Google Scholar] [CrossRef] [Scilit]
- McKinlay, J.B.; Vieille, C. 13C-metabolic flux analysis of Actinobacillus succinogenes fermentative metabolism at different NaHCO3 and H2 concentrations. Metab. Eng. 2008, 10, 55–68. [Google Scholar] [CrossRef] [Scilit]
- Bounaas, M.; Haouichi, M.; Gattal, B.; Hamza, W.; Benalia, A.; Derbal, K.; Benzina, M.; Pizzi, A.; Trancone, G.; Panico, A. Optimization of NaOH Chemical Treatment Parameters for Biomass-Based Adsorbents in Cationic Dye Removal. Processes 2025, 13, 3932. [Google Scholar] [CrossRef] [Scilit]

Disclaimer/Publisher’s Note: The statements, opinions and data contained in all publications are solely those of the individual author(s) and contributor(s) and not of MDPI and/or the editor(s). MDPI and/or the editor(s) disclaim responsibility for any injury to people or property resulting from any ideas, methods, instructions or products referred to in the content. |
© 2026 by the authors. Licensee MDPI, Basel, Switzerland. This article is an open access article distributed under the terms and conditions of the Creative Commons Attribution (CC BY) license.