


Abstract
This paper presents a comparative analysis of direct expansion solar-assisted heat pumps (DX-SAHP) with and without photovoltaic cells (PVT-DX-SAHP). Two sets of experiments were conducted to validate the mathematical model: one with PVT-DX-SAHP and another with DX-SAHP. The mathematical model used in this study is based on physical equations using energy, mass, and entropy balance. The heat exchangers were modeled using the moving boundaries technique. The compressor and photovoltaic cells were modeled using a black box model with equations for the efficiencies of these components. The low-global-warming-potential (GWP) refrigerant R290 (propane) was used in this study. Two independent sets of experimental data were used to validate the model, with a mean absolute deviation of 4.8%. The results indicated that PVT-DX-SAHP had a higher season performance factor (SPF) and a lower total equivalent warming impact (TEWI) compared to DX-SAHP, with an average SPF increase of 81% and a TEWI reduction of 30%. The findings also showed that PVT-DX-SAHP had a 24% higher longer payback period than DX-SAHP.
1. Introduction
The environmental impacts caused by the emission of greenhouse gases, such as carbon dioxide, have become increasingly evident, resulting in drastic climate change, air pollution, and ecosystem degradation. The search for sustainable and energy-efficient alternatives is essential to mitigate these effects. In this context, heat pumps emerge as a promising solution. They are devices that transfer thermal energy from one environment to another, using a small amount of electricity to move the heat, rather than generating it directly. This results in significantly greater energy efficiency, reducing the need for fossil fuels and, consequently, carbon emissions.
A particular type of heat pump is the solar-assisted heat pump (SAHP). As indicated by Sezen and Gungor [1], the solar-assisted heat pump can be categorized into two distinct classifications: direct expansion (DX-SAHP, direct expansion solar-assisted heat pump) and indirect expansion (IX-SAHP, indirect expansion solar-assisted heat pump). The distinction between these classifications lies in the manner in which solar energy is transferred to the evaporator: in the direct expansion configuration, energy is transferred directly, whereas in the indirect expansion configuration, energy is transferred indirectly.
Another classification is possible in circumstances where a photovoltaic panel is integrated with a heat pump [1,2]. In such a scenario, two alternative options emerge: the direct expansion photovoltaic–thermal solar-assisted heat pump (PVT-DX-SAHP) and the indirect expansion photovoltaic–thermal solar-assisted heat pump (PVT-IX-SAHP).
In the field of SAHP systems, a variety of studies have been published in the literature. Zhang et al. [3] evaluated how refrigerant charge and structural parameters influence a DX-SAHP. Using distributed and lumped mathematical models, the authors show that 70–80% of the refrigerant accumulates in the condenser and collector. Optimal performance occurs with a refrigerant charge of 1.65–1.75 kg, a collector area of 6 m2, a 70 m condenser length, and a 9 mm condenser diameter. These conditions improve system efficiency while keeping costs feasible.
Scarpa and Tagliafico [4] investigated how a DX-SAHP can harvest not only solar energy but also latent heat from moist air. Experiments with a prototype show that condensation contributes 20–30% of the total collected energy during night or cloudy conditions, when solar input is minimal. Simulations confirm this gain and reveal that condensation heat depends mainly on the dew-point temperature. Even in daytime, additional energy remains significant, improving the overall heating performance.
Mohamed et al. [5] presented an experimental DX-SAHP system using R407C and unglazed aluminum collectors, including one indoor plate that recovers waste heat. Tests under quasi-static conditions show that the configuration increases evaporator efficiency by maintaining low evaporating temperatures and reducing system losses. Performance depends on the outdoor temperature, solar irradiance, inlet temperature, and mass flow rate. Results indicate that the system can outperform conventional heat pumps for domestic hot water and space heating, offering higher collector effectiveness and improved COP.
Huang et al. [6] examined a DX-SAHP with bare-plate evaporators under controlled ambient conditions. Experiments show that the COP rises from 2.12 to 2.26 as the temperature increases from 5 °C to 15 °C. With solar irradiance increasing from 0 to 500 W/m2, the COP improves from 2.07 to 2.36. Higher humidity enhances performance: raising relative humidity from 70% to 90% boosts the evaporative heat-exchange rate by 35% and increases the COP by 16.3% (from 1.78 to 2.07).
Kong et al. [7] experimentally evaluated a DX-SAHP hot-water system using variable-frequency control. The setup includes a frequency-conversion compressor, microchannel condenser, bare-plate collector/evaporator, and an electronic expansion valve. Year-round testing shows most average COP values exceed 3.0. Even under challenging conditions, i.e., 124 W/m2 solar radiation at 8.5 °C and 323 W/m2 at −3 °C, the system still achieves COPs of 2.81 and 2.58. Heating-time predictions match experiments within 20 min, confirming effective control and stable performance.
Ji et al. [8] designed and tested a finned-tube DX-SAHP to address the low efficiency and large footprint of bare-plate systems. Experiments show that higher ambient temperature, solar irradiation, and wind speed improve heating performance. Frosting affects the two designs differently: in the finned-tube system, the COP drops from 1.72 to 1.54 as the relative humidity rises from 50% to 90%, while in the bare-plate system, the COP increases by 16.3% when the humidity rises from 70% to 90%.
Kong et al. [9] evaluated a DX-SAHP water-heating system using R290 and micro-channel heat exchangers. Winter experiments with 350–410 g of refrigerant show strong performance across a wide range of environmental conditions: solar radiation from 20 to 59 W/m2, ambient temperatures from −3.0 to 12.2 °C, and wind speeds of 0.01–1.15 m/s. Heating 200 L of water from 7.2–15.3 °C to 37.7–54.9 °C, the system achieves COP values between 2.12 and 4.43, demonstrating efficient low-charge operation.
Resende et al. [10] developed and validated a dynamic moving-boundary model for the condenser of an R290 DX-SAHP used in residential water heating. Model predictions match 121 experimental step-response points with a maximum average deviation of 6.7%. Experiments show strong parameter sensitivity: the highest water temperature, 68.5 °C, occurs at a 30 °C inlet temperature and a 0.25 L/min flow rate, while the highest COP, 2.3, appears at a 10 °C inlet temperature and a 0.80 L/min flow rate. Increasing the compressor inlet pressure raises the outlet temperature by 17.8% and the COP by 55%.
Yang et al. [11] developed a dynamic model for a DX-SAHP to analyze its transient behavior under real operating conditions. Simulations show that increasing the ambient temperature by 5, 10, and 15 K raises the evaporating pressure by 3.63%, 5.56%, and 10.93%. A 30% rise in the compressor speed increases the condensing pressure by 1.60% and decreases the evaporating pressure by 7.79%. The condenser’s two-phase region expands by 4.10%, while the evaporator’s shortens by 0.097%, highlighting strong sensitivity to environmental and control variations.
Lu et al. [12] investigated a DX-SAHP system enhanced with a vapor-injection cycle and PVT modules. Winter tests at −1.13 °C and 164 W/m2 solar irradiation show that the system produced 0.51 kWh of electricity and 23.68 kWh of heat while consuming 7.24 kWh. The ambient-evaporating temperature difference ranged from 9.2–17.1 °C. On sunny days, PVT modules achieved 49.9% thermal and 7.51% PV efficiency, confirming strong hybrid performance.
Three PVT-DX-SAHP designs were compared by Song et al. [13]: a Fresnel photovoltaic (FPV) evaporator, a hybrid FPV plus thermoelectric generator (FPV/TEG-SAHP), and a traditional PVT-SAHP. Results show that FPV-SAHP achieves the highest electrical efficiency, total efficiency, and exergy efficiency. FPV/TEG performs slightly worse, while both concentrated systems outperform the traditional design. The study quantifies sensitivity to ambient and tank water temperatures across multiple irradiance levels, guiding optimal evaporator selection for residential DX-SAHP applications and providing practical design recommendations for engineers.
Yao et al. [14] presented an efficiency-factor-based design method for a direct-expansion PVT roll-bond module. Simulations compare four channel patterns at 10 mm width: hexagon and rectangle shapes show temperature uniformity of 0.038 °C, while grid and linear shapes yield lower dimensionless pressure losses of 0.109 and 0.230. Modified efficiency factors are 0.521, 0.564, 0.549, and 0.342 for hexagon, grid, rectangle, and linear shapes. The recommended channel width is 8 to 13 mm and the scaling ratio is from 0.8 to 1.2. This guides PVT evaporator design choices and performance.
A novel PVT-IX-SAHP and thermal panels in series to stabilize the evaporator inlet temperature and boost low-irradiance performance was proposed by Zhou et al. [15]. Experiments reported PV/T electrical, thermal, and overall efficiencies of 15.9%, 33.4%, and 49.3%, respectively; thermal panels reached 60.4% efficiency. The heat pump achieved a COP of 4.7 and maintained room temperature above 18 °C. The series configuration produced substantially more thermal energy than parallel layouts during the winter experimental testing period.
Li and Huang [16] proposed a hybrid PVT/air dual-source assisted heat pump water heater. Simulations show that at 0 °C and 100W/m2, S-A-AHP’s average COP is 29.7% higher than SAHP and 19.9% higher than ASHP; here, the heating time is 36.7% of SAHP and 83.7% of ASHP. Peak COP reaches 4.76 with PV electrical efficiency of 13.5% at 10 °C and 400 W/m2, improving stability and efficiency. The model reduces sensitivity to single environmental factors, enhancing year-round performance.
Sanz et al. [17] presented a year-long field study that evaluated a hybrid PVT-DX-SAHP with predictive control installed in a single-family house. Monitoring showed an 83% renewable energy share, 41% heat-pump self-consumption, and a 46% solar fraction. The integrated system significantly reduced grid dependence while enabling high on-site generation and use. Results demonstrate that predictive control and PVT-DX coupling can deliver robust renewable coverage and substantial energy autonomy in continental climates, with year-round performance gains.
Liu et al. [18] employed micro heat-pipe arrays, improving dual-source heat collection and PV output. Under 700 W/m2 and 32 °C, heat collection power rose to 26.63% from 614.49 to 778.13 W/m2, and heat collection efficiency increased by 25.76%. System COP improved by 7.94% from 4.28 to 4.62. The structural optimization of finned air ducts and refrigerant channels yielded notable thermal and electrical performance gains for DX-SAHP applications. These results support scalable deployment in residential and commercial heating.
Wei et al. [19] proposed and optimized a PVT-assisted dual-source heat pump with PCM using TRNSYS and machine-learning using surrogate model. Under the entropy-allocation optimum, the solar fraction reached 43.43%, where the COP was 4.06. Four key variables (PV/T area, PCM mass, ASHP capacity, and thermal storage volume) were identified for robust cold-climate deployment. These results guide cost-effective system configuration and policy decisions.
Li and Huang [16] conducted a simulation analysis of the operational performance of a PVT-DX-SAHP, an air-source heat pump (ASHP), and a dual-source system that uses an air source and PVT simultaneously. Under low environmental benefit conditions of ambient temperature of 0 °C and solar radiation intensity of 100 W/m2, the average coefficient of performance (COP) of the dual-source mode was 29.7% and 19.9% higher than those of SAHP and ASHP, respectively.
Cai et al. [20,21] compared a direct expansion dual-source air and solar heat pump with three setups: (i) an air evaporator and a solar evaporator in parallel; (ii) an air evaporator and a solar evaporator in serial with the first flow at the solar evaporator; (iii) an air evaporator and a solar evaporator in serial with the first flow at the air evaporator. The COP of the parallel setup was the highest, ranging from 4.50 to 4.58.
Huan et al. [22] designed a TRNSYS model for comparing a serial and a parallel IX-SAHP for a university bathroom in China, which was developed and validated through experimental measurements. Under the same heating load, the average COP of the serial IX-SAHP system was 3.23, and that of the parallel IX-SAHP system was 4.34.
Tzivanidis et al. [23] developed a TRNSYS model for comparing a serial IX-SAHP, ASHP, and thermal collector for a building of 100 m2 in area located in Athens (Greece). Using the minimum net present value criterion, the ASHP is the most suitable solution because of the low investment cost.
Despite the extensive body of research on SAHPs presented above and some literature reviews of solar-assisted heat pumps that were published over the last two decades [1,24,25,26,27,28,29,30], to the best of the authors’ knowledge, there is an absence of studies that directly compare DX-SAHP with PVT-DX-SAHP. The existing studies have focused exclusively on individual technologies. In that context, the purpose of this work is to make a comparison of DX-SAHP and PVT-DX-SAHP, considering energy efficiency, economic aspects, and environmental impacts using an experimentally validated mathematical model. In order to provide a comprehensive evaluation, it would be beneficial to analyze which technology demonstrates superior performance in different ambient conditions, with particular attention to considerations of energy, economic, and environmental impacts.
2. Characteristics and Experiments with Heat Pumps
Two sets of experimental results are used to validate the following model.
2.1. PVT-DX-SAHP
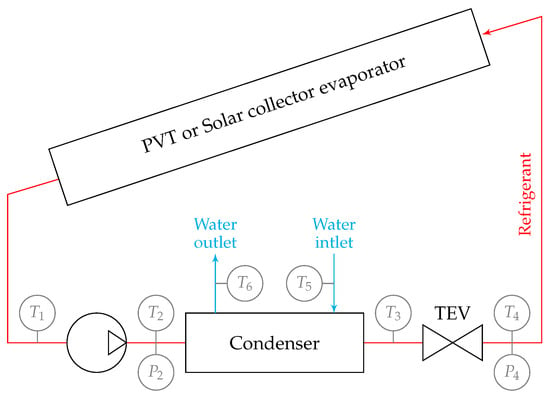
Figure 1 shows the schematic experimental setup of PVT-DX-SAHP used to validate the model. Operating on R134a, the PVT-DX-SAHP includes a hermetic reciprocating variable speed compressor (model VEGT8HB with an inverter EECON model VCC3-CO manufactured by Embraco in Joinville, SC, Brazil), a flat plate thermal evaporator, a counterflow coaxial helical coil condenser, a polycrystalline photovoltaic panel with 1.552 m2 (model KRPF-320W5B manufactured by Kript, in Belo Horizonte, MG, Brazil), and a thermal expansion valve or TEV (model TE2 manufactured by Danfoss, Nordborg, Denmark). Furthermore, the PV cells generate electrical energy through the photovoltaic effect, and a NEO 2000M-X micro-inverter (manufactured by Growatt, Santo André, SP, Brazil) transforms the direct current into an alternating current for the grid. The photovoltaic panel has a reference efficiency of 17.4% informed by the manufacturer. The other information required by the PVT model is not provided by the manufacturer; therefore, the values suggested by Xu et al. [31] are used.
Figure 1.
Schematic of PVT-DX-SAHP and DX-SAHP.
The evaporator or PVT pipe has a length of 17.28 m and inner and outer diameters of 4.77 mm and 6.35 mm. The condenser internal stainless steel pipe has inner and outer diameters of 8.32 mm and 9.52 mm, an external PVC pipe with 16 mm of inner diameter, a length of 7.5 m, and coil diameter of 0.25 m. The pipe between the PVT and compressor has a length of 1.79 m and an internal diameter of 4.7 7 mm. The pipe between the compressor and condenser has a length of 0.44 m and an internal diameter of 4.77 mm. The pipe between the condenser and TEV has a length of 0.37 m and an internal diameter of 7.94 mm. The pipe between the TEV and PVT has a length of 2.88 m and an internal diameter of 7.94 mm.
Seven T-type thermocouples with a maximum uncertainty of ±0.44 °C are used to indicate the temperature: four at the compressor inlet (T1), compressor outlet (T2), expansion valve inlet (T3), and expansion valve outlet (T4) for refrigerant temperature readings. At the condenser inlet (T5) and outlet (T6), two water temperature readings are taken. At the solar panel’s surface, one temperature measurement (T7) is obtained. Furthermore, the low pressure at the compressor inlet and the high pressure at the compressor exit are measured by two pressure transducers with an uncertainty of ±0.25 bar. The weather station model WA2081 measures the ambient temperature, dew point, atmospheric pressure, and wind speed with uncertainties of ±1 °C, ±3 hPa and ±1 m/s. An Eppley radiometer model 8–4.8 measures the solar irradiance with uncertainties of 5% of the measured value. A scale and stopwatch are used to measure the water flow rate. A Novus model DigiRail VA wattmeter measures the electrical power with uncertainties of 0.5% of the measured value.
In June 2025, experimental testing under steady-state conditions was conducted at UFMG, which is situated at coordinates 9°54′46″ S and 43°56′27″ W in Belo Horizonte, MG, Brazil. A mass of 375 g of R134a, frequency of 50 Hz, and superheating of 5 °C were used for testing. Table 1 displays the experimental data. The greatest COP uncertainty evaluated according to [32] was ±0.15, which represents 3.4% of the measured result, whereas the mean value was ±0.10. These experimental data were also published by Nogueira et al. [33].
2.2. DX-SAHP
The experiments with DX-SAHP, also presented in [34,35], were used to compare the experimental data in order to validate the model. The experimental data of DX-SAHP are also listed in Table 1. The schematic experimental setup for DX-SAHP is similar to the one presented in Figure 1 but with a solar collector instead of PVT. The compressor manufactured by Embraco, model FFU100HAK, which was used in the DX-SAHP, has a fixed frequency of 60 Hz.
The evaporator or solar collector measures 1.65 m2 in area and 1 mm in thickness. The evaporator tube measures 17.28 m in length, 8.73 mm in inner diameter, and 9.53 mm in outer diameter. A thermostatic expansion valve was used to maintain the superheat at the outlet of the evaporator around 7.4 °C. The condenser’s internal copper pipe has inner and outer diameters of 4.76 mm and 6.35 mm, respectively, and the external copper pipe has 11.11 mm of inner diameter, length of 7.5 m, and a coil diameter of 0.65 m.
K-type thermocouples, with maximum uncertainty of ±1.0 °C, were used to measure the same temperatures indicated in Figure 1 but in the DX-SAHP. The solar irradiance, wind velocity, ambient temperature, dew point temperature, and atmospheric pressure were also measured with uncertainty of 5%, 0.9 m/s, 1 °C, 2 °C, and 2 kPa. The greatest COP uncertainty evaluated according to [32] was ±0.14, which represents 5.7% of the measured result, whereas the mean value was ±0.13.
Table 1.
Experimental results for both PVT-DX-SAHP and DX-SAHP.
3. Mathematical Model
A mathematical model was developed based on the following presumptions in order to fully evaluate the system’s performances: (i) the heat pump system is in a steady state; (ii) the kinetic and potential energies of the refrigerant are insignificant; (iii) there is a minimal pressure drop at heat exchanges and in the tubes between components; (iv) superheat is constant; (v) fluid water cannot be compressed.
The COP served as a measure of energetic performance and was written as follows:
where the compressor’s electric consumption is , the water’s mass flow rate is , and the water’s specific heat at constant pressure is .
The choice of refrigerants was predominantly influenced by three critical environmental metrics: global warming potential (GWP), total equivalent warming impact (TEWI), and life cycle climate performance (LCCP). LCCP serves as an exhaustive metric to evaluate the overall lifetime emissions impact of a refrigerant on a system. Nonetheless, in practical applications, LCCP is more intricate than TEWI, and the extra emissions it encompasses contribute negligibly to the ultimate outcome. GWP is an essential metric for contrasting various refrigerants, yet it may occasionally exaggerate the environmental advantages of low-GWP refrigerants, as it fails to account for numerous other significant factors [36]. For this study, the selected methodology to gauge environmental performance was TEWI, presented in Equation (2). This parameter encompasses the global warming effects arising from both direct and indirect emissions, consisting of two main components: the direct consequence of refrigerant emissions throughout the equipment’s lifespan and the indirect influence of CO2 emissions from fossil fuel energy production during operation.
In this equation, Q is the annual energy heating demand, is the emission factor for the electricity consumed, and is the annual refrigerant leakage rate. The values of these parameters were chosen in accordance with the study of [36]. The season performance factor (SPF) is assessed by Equation (3) [37]. In Equation (3), the annual electricity consumption by the compressor and the annual electricity generated by the photovoltaic panel are represented by and . For the climate cities analyzed in this study, there is no need for auxiliary heating in the system, and the heat pump is sized to cover the heating demands for every day of the year.
By comparing the system’s payback period () with that of an electrical heater, the economic performance is presented as a payback period, expressed in Equation (4) [38]:
where I represents the initial investment difference between an electrical heater and a heat pump, represents the yearly inflation rate, S represents the annual savings, represents the electricity tariff, and represents the electrical heater’s efficiency.
The mean absolute relative deviation (MAD) and mean relative deviation (MD) were the two indices employed in the experimental validation. These indices are assessed as shown in Equations (6) and (7), which compare the COP determined by the model () with the experimentally measured () [39,40,41].
3.1. Photovoltaic–Thermal Collector Model
Many studies with PVT-DX-SAHP modeling were considered to select a PVT collector model [14,31,42,43,44,45,46,47,48,49,50,51,52,53]. The following presumptions guided the development of the PVT collector model, which forecasts electrical energy production and heat absorbed by the refrigerant: (i) the evaporator tube’s wall had zero thermal resistance from conduction; (ii) there was insignificant heat transfer at the evaporator’s margins; (iii) the bond tube and fin had zero thermal resistance; (iv) the boiling region’s vapor quality varied linearly with length. As determined by Xu et al. [31], the useful thermal energy of the PVT evaporator () is calculated using Equations (8)–(14).
In these equations, the solar irradiance gathered by the absorber is represented by , while the heat losses resulting from convective and radiation heat transfer between the PVT evaporator’s surface and the surrounding air are represented by and . is the electrical power produced from PV cells per unit of time. The effective absorptivity–transmittance product is . Solar irradiance is denoted by G, plate area by , plate surface temperature by , and ambient temperature by . represents the solar cells’ photovoltaic efficiency. The reference value for photovoltaic efficiency under standard conditions is , the temperature coefficient is , represents the convective heat loss coefficient [54], is the wind speed, and represents the heat loss coefficient by radiation [55].
The enthalpy variation is used to compute the thermal energy that the refrigerant absorbs:
where i is the refrigerant-specific enthalpy, is the refrigerant’s mass flow rate, and subscripts 1 through 4 correspond to the evaporator’s inlet and outlet. In order to apply the balance of energy, the refrigerant also passes through a copper tube that has been split into two regions: the superheated flow vapor area () and the flow boiling region (). Each region’s refrigerant energy balance is shown in Equations (16) and (17).
In these equations, the subscripts v and l are related to vapor- and liquid-phase properties. The length of regions and is written as in Equations (18) and (19), while the evaporator’s overall length () is fixed. Equations (20) and (21) are expressions used for the average refrigerant temperature () and the temperature of the photovoltaic panel ().
The subscript denotes a copper tube in these equations, is the refrigerant’s internal surface heat transfer area, R is the contact thermal resistance, is its convection heat transfer coefficient, is its boiling heat transfer coefficient, which is determined using [56], and is its vapor heat transfer coefficient, which is determined using the Dittus and Boelter equation [57].
3.2. Compressor Model
As Paula et al. [58] point out, a compressor may be modeled using a variety of methods, some of which are rather complex with 15 to 30 equations and an iterative algorithm to solve this equations obtained by the compression physical phenomena [59,60,61] or they use machine learning [62,63,64]. Manufacturers of hermetic compressors usually do not provide the geometric features, specs, or sufficient data required for more sophisticated versions. Furthermore, a refrigeration system’s compressor model is usually simplified with 3 to 5 non-iterative equations [65,66,67]. In this study, the compression process is assumed to be isentropic, and the following expressions are used to evaluate the mass flow rate () and compressor power () [68]:
where the suction density is , the frequency is F, the compressor displacement volume is , and and are the compressor inlet and outlet, respectively. In order to forecast the function of the computed values of volumetric efficiency () in Equation (26) and overall efficiency () in Equation (27), a regression utilizing the least squares method [69] based on the manufacture catalog values was employed to compute coefficients to . The compressor data are listed in Table 2. In Table 2, the coefficients for Equations (26) and (27) are also listed, with the MAD of the curve fit determined using the manufacturer’s data.
Table 2.
Compressor data.
3.3. Condenser Model
Many studies employ distributed heat exchanger models [70,71,72], and according to Duarte [73], these models demand a lot of computational work when compared to lumped models. Lumped models may also be used to rapidly evaluate system performance. According to certain research [74,75,76], however, the findings are limited. The moving boundaries approach, which is employed in this study, is an alternative method [10,77,78] that lies between the distributed and lumped models.
In order to apply energy balance equations, the coaxial condenser was separated into three regions: the liquid flow region (l), the condensation flow region (), and the desuperheating region (d). Row 1 of Table 3 shows the energy balance of the refrigerant in each location. Using the effectiveness-NTU approach, the condenser’s heat transfer rate was determined independently for each location. A concentric heat exchanger’s effectiveness () was assessed in accordance with [79] in Table 3, row 2. In Table 3, row 3 displays the water input temperature for each zone.
Table 3.
Condenser model [80].
Aside from that, and are equivalent to or , depending on which is smaller. The heat capacity rate of water and refrigerant was also stated as and . As stated in row 4 of Table 3, the number of transfer units (NTU) of a counterflow heat exchanger was computed in accordance with [79]. Equation (29) is the product of the heat transfer surface area (A) and the total heat transfer coefficient (U).
Each region’s length was determined using Equation (30). The inner diameter of the inner tube is denoted by , the outer diameter by , and the thermal conductivity by k in that equation. The correlations indicated in Table 3’s row 5 were utilized to calculate , whereas Dravid et al.’s [82] correlation was employed for if the flow was laminar, and the Dittus and Boelter correlation [57] was employed for turbulent flow. When choosing a correlation for condensation, Shah’s study [39] was taken into account. This compared correlations with experimental findings of pure refrigerants and mixes. Furthermore, Shah [81]’s correlation yielded findings that were acceptable under the flow circumstances that were present in the equipment simulations.
3.4. Expansion Device Model and Mass Calculation
The electronic valve or thermostatic valve is the expansion device needed for a PVT-DX-SAHP because of the wide changes in solar irradiance. The expansion valve, which was designed as an isenthalpic mechanism, was used to regulate the superheat at the evaporator outlet.
Using the correlation of Zivi [83] for void fraction (), the charge of the refrigerant was computed using Equation (31) for single-phase flow and Equation (32) for two-phase flow.
The numerical algorithm for the Simpson 1/3 rule, which was proposed by [69], was utilized to integrate Equation (32).
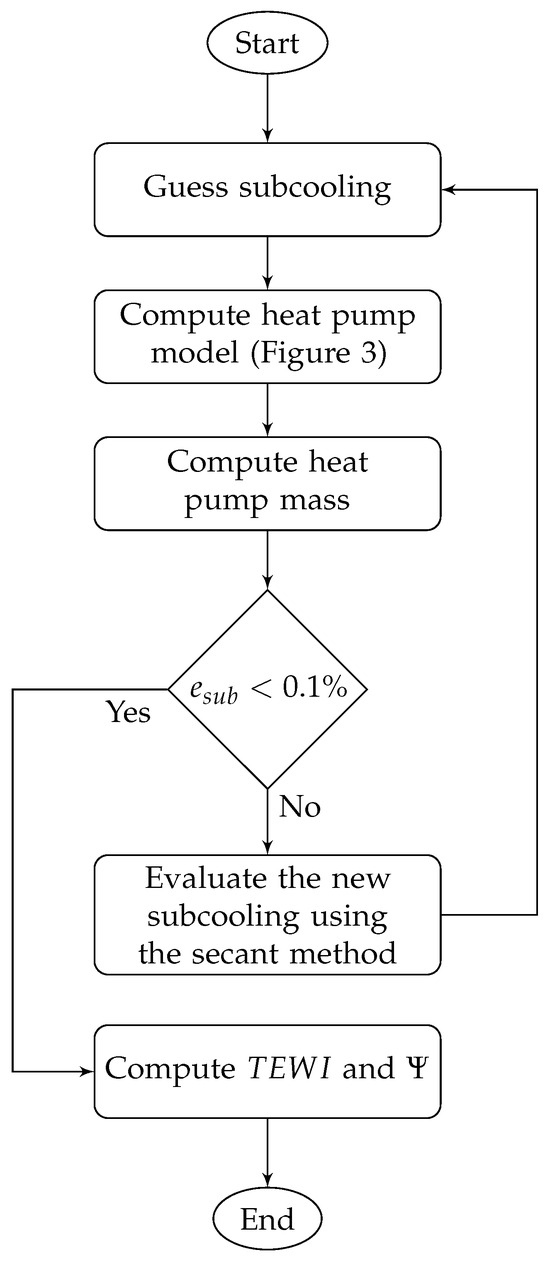
4. Algorithm and Simulation Data
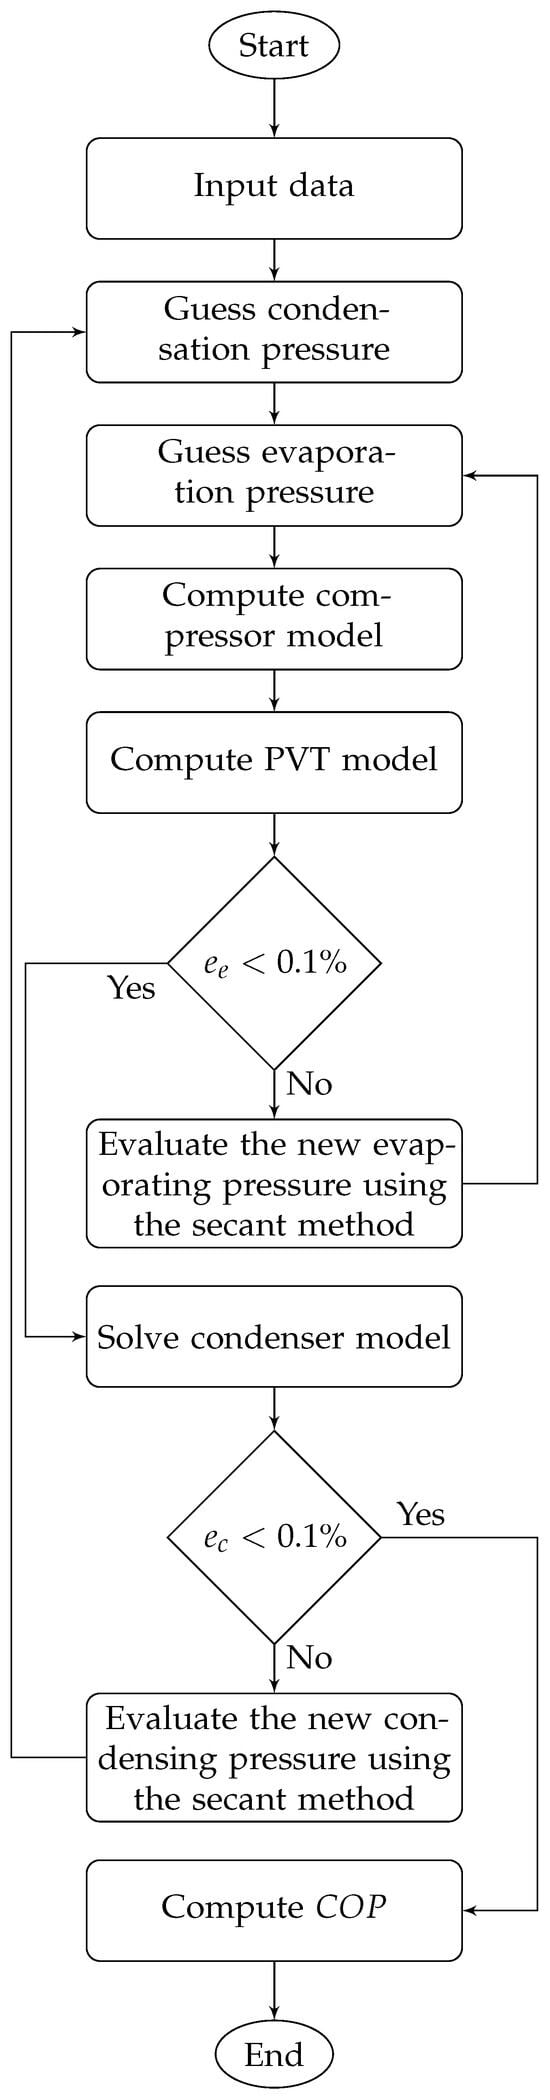
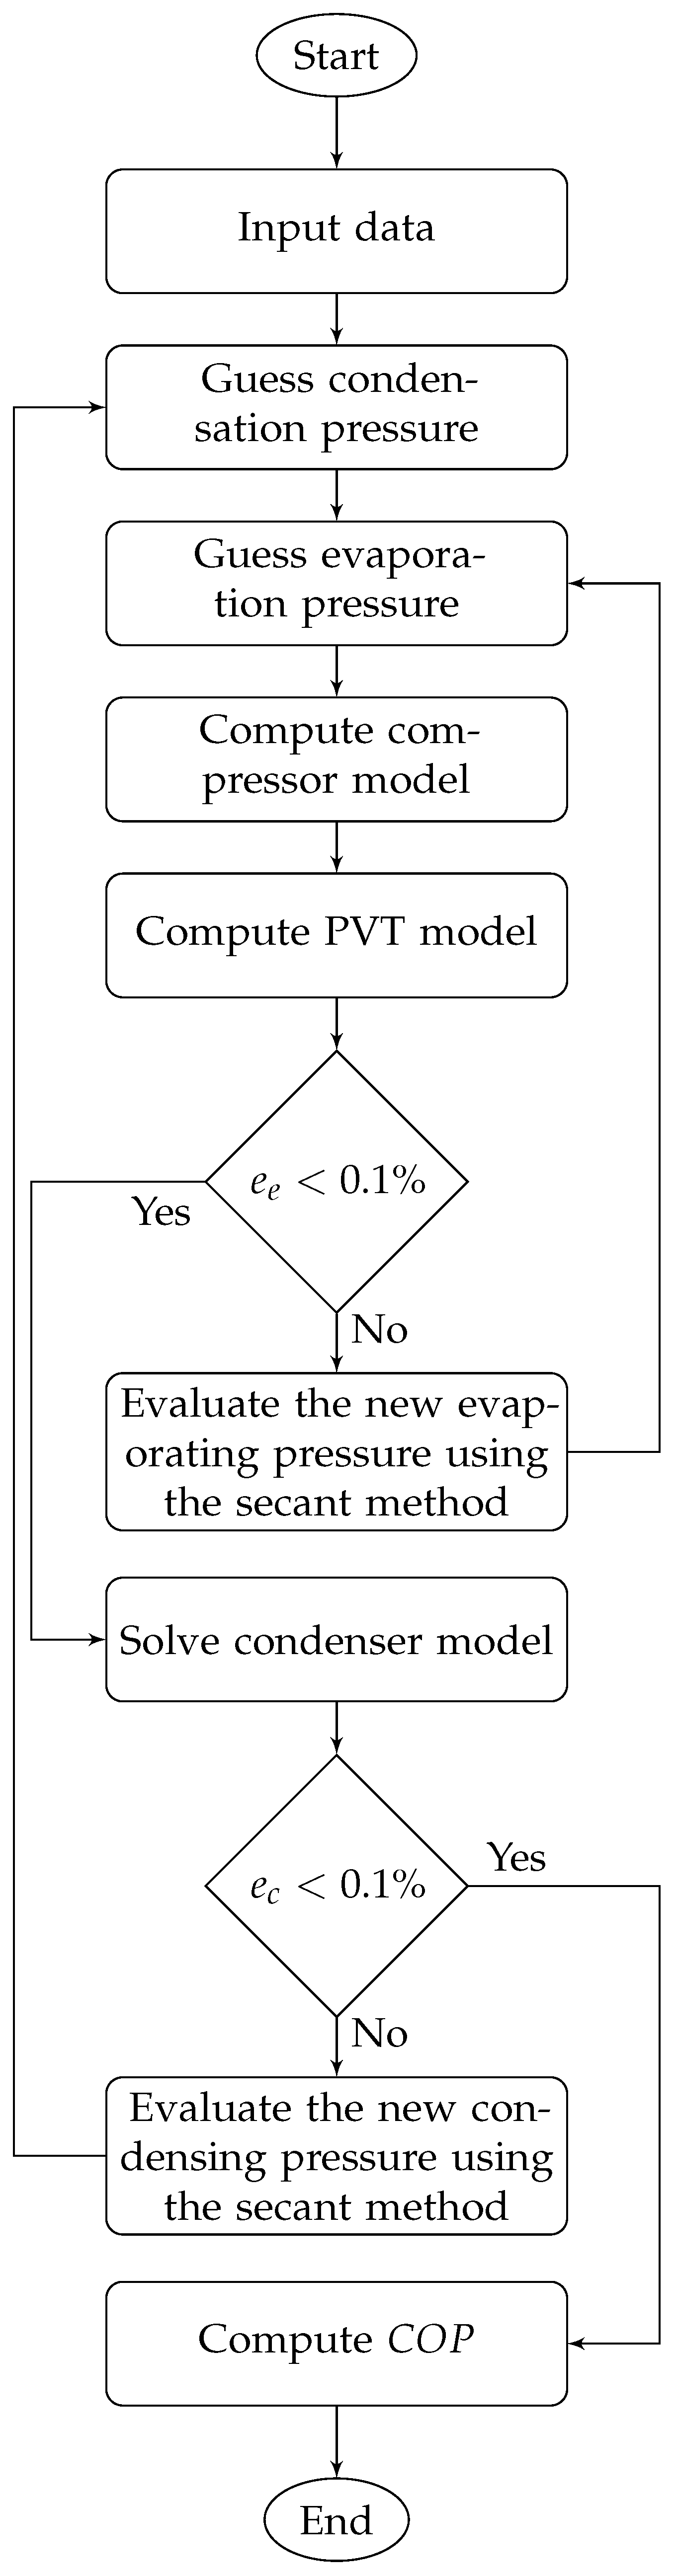
The Python 3.7 programming language was selected as the platform to answer the previously stated set of equations. The thermodynamics property was calculated by REFPROP 10 [84] using the Python library CoolProp 6.4 [85]. Figure 2 and Figure 3 show the algorithm of the numerical model. The evaporator error () was calculated by Equation (33), and the condenser error () was calculated by Equation (34). The real and calculated refrigerant masses were compared in order to assess the subcooling error ().
Figure 2.
Algorithm of the heat pump model with refrigerant mass calculation.
Figure 3.
Heat pump model algorithm.
In fact, the DX-SAHP model was validated considering only the flowchart in Figure 3, because in the experimental tests presented by [35], the refrigerant mass was not measured but rather the subcooling. Furthermore, as the DX-SAHP does not have a photovoltaic panel, the values for and R in Equations (14) and (21) were replaced with zero.
The R290 (propane) refrigerant was selected in light of the research presented by some scholars [9,10,36,75,86,87]. Many heat pump manufacturers employ R290 because it can operate at high evaporation temperatures [88,89]. A comparison of a PVT-DX-SAHP operating with low GWP refrigerants with R134a was carried out by Nogueira et al. [33], and R290 and R1234yf obtained the best results. The heat pumps in this study are small equipment with a small refrigerant charge that will be placed in an open, well-ventilated area despite their flammability. The compressor used is FMFT406U manufactured by Embraco, and the compressor data are listed in Table 2. This compressor was chosen because it has the closest cooling capacity to that used in the experimental tests of PVT-DX-SAHP.
Two approaches were used for the environmental parameters. In line with the research of Hawlader et al. [90], Deng and Yu [91], and Kong et al. [65], the first simulation took into account preset values for wind speed, air pressure, ambient temperature, and solar irradiance. Table 4 provides a description of these values. Additionally, a case study was conducted, taking into account the typical environmental circumstances of a particular city, in line with the research of Lazzarin [92], Reis et al. [93], and Chaturvedi et al. [94]. The environmental data for four distinct cities listed in Table 5 were utilized to conduct this case study. The climate data for the cities mentioned in the tables were obtained for 2024 from [95]. CO2 emission data from electricity production were obtained from [96] for the years 2020 to 2025 and are consistent with those also published by [97]. The inlet water temperature was assumed to be the same as the air temperature in both approaches.
The prices in Table 4 used for payback calculation were derived from the 2024 market for the Brazilian city of Belo Horizonte. According to Santos et al. [98], Brazil’s average power inflation rate is 10%. During the day, the price of power was thought to be constant. This figure shows the home power tariff with tax included at the end of 2024. The TEWI parameters in Table 4 were obtained from [36].
Table 4.
Standard inputs used in the simulations.
Table 5.
Data from selected cities.
5. Results
5.1. Modeling Validation
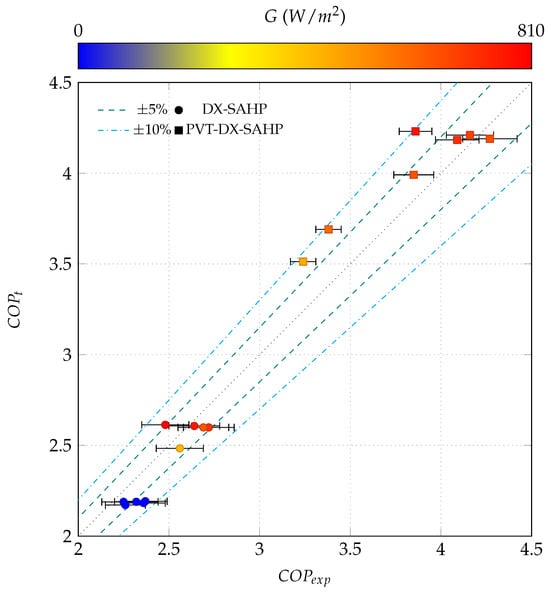
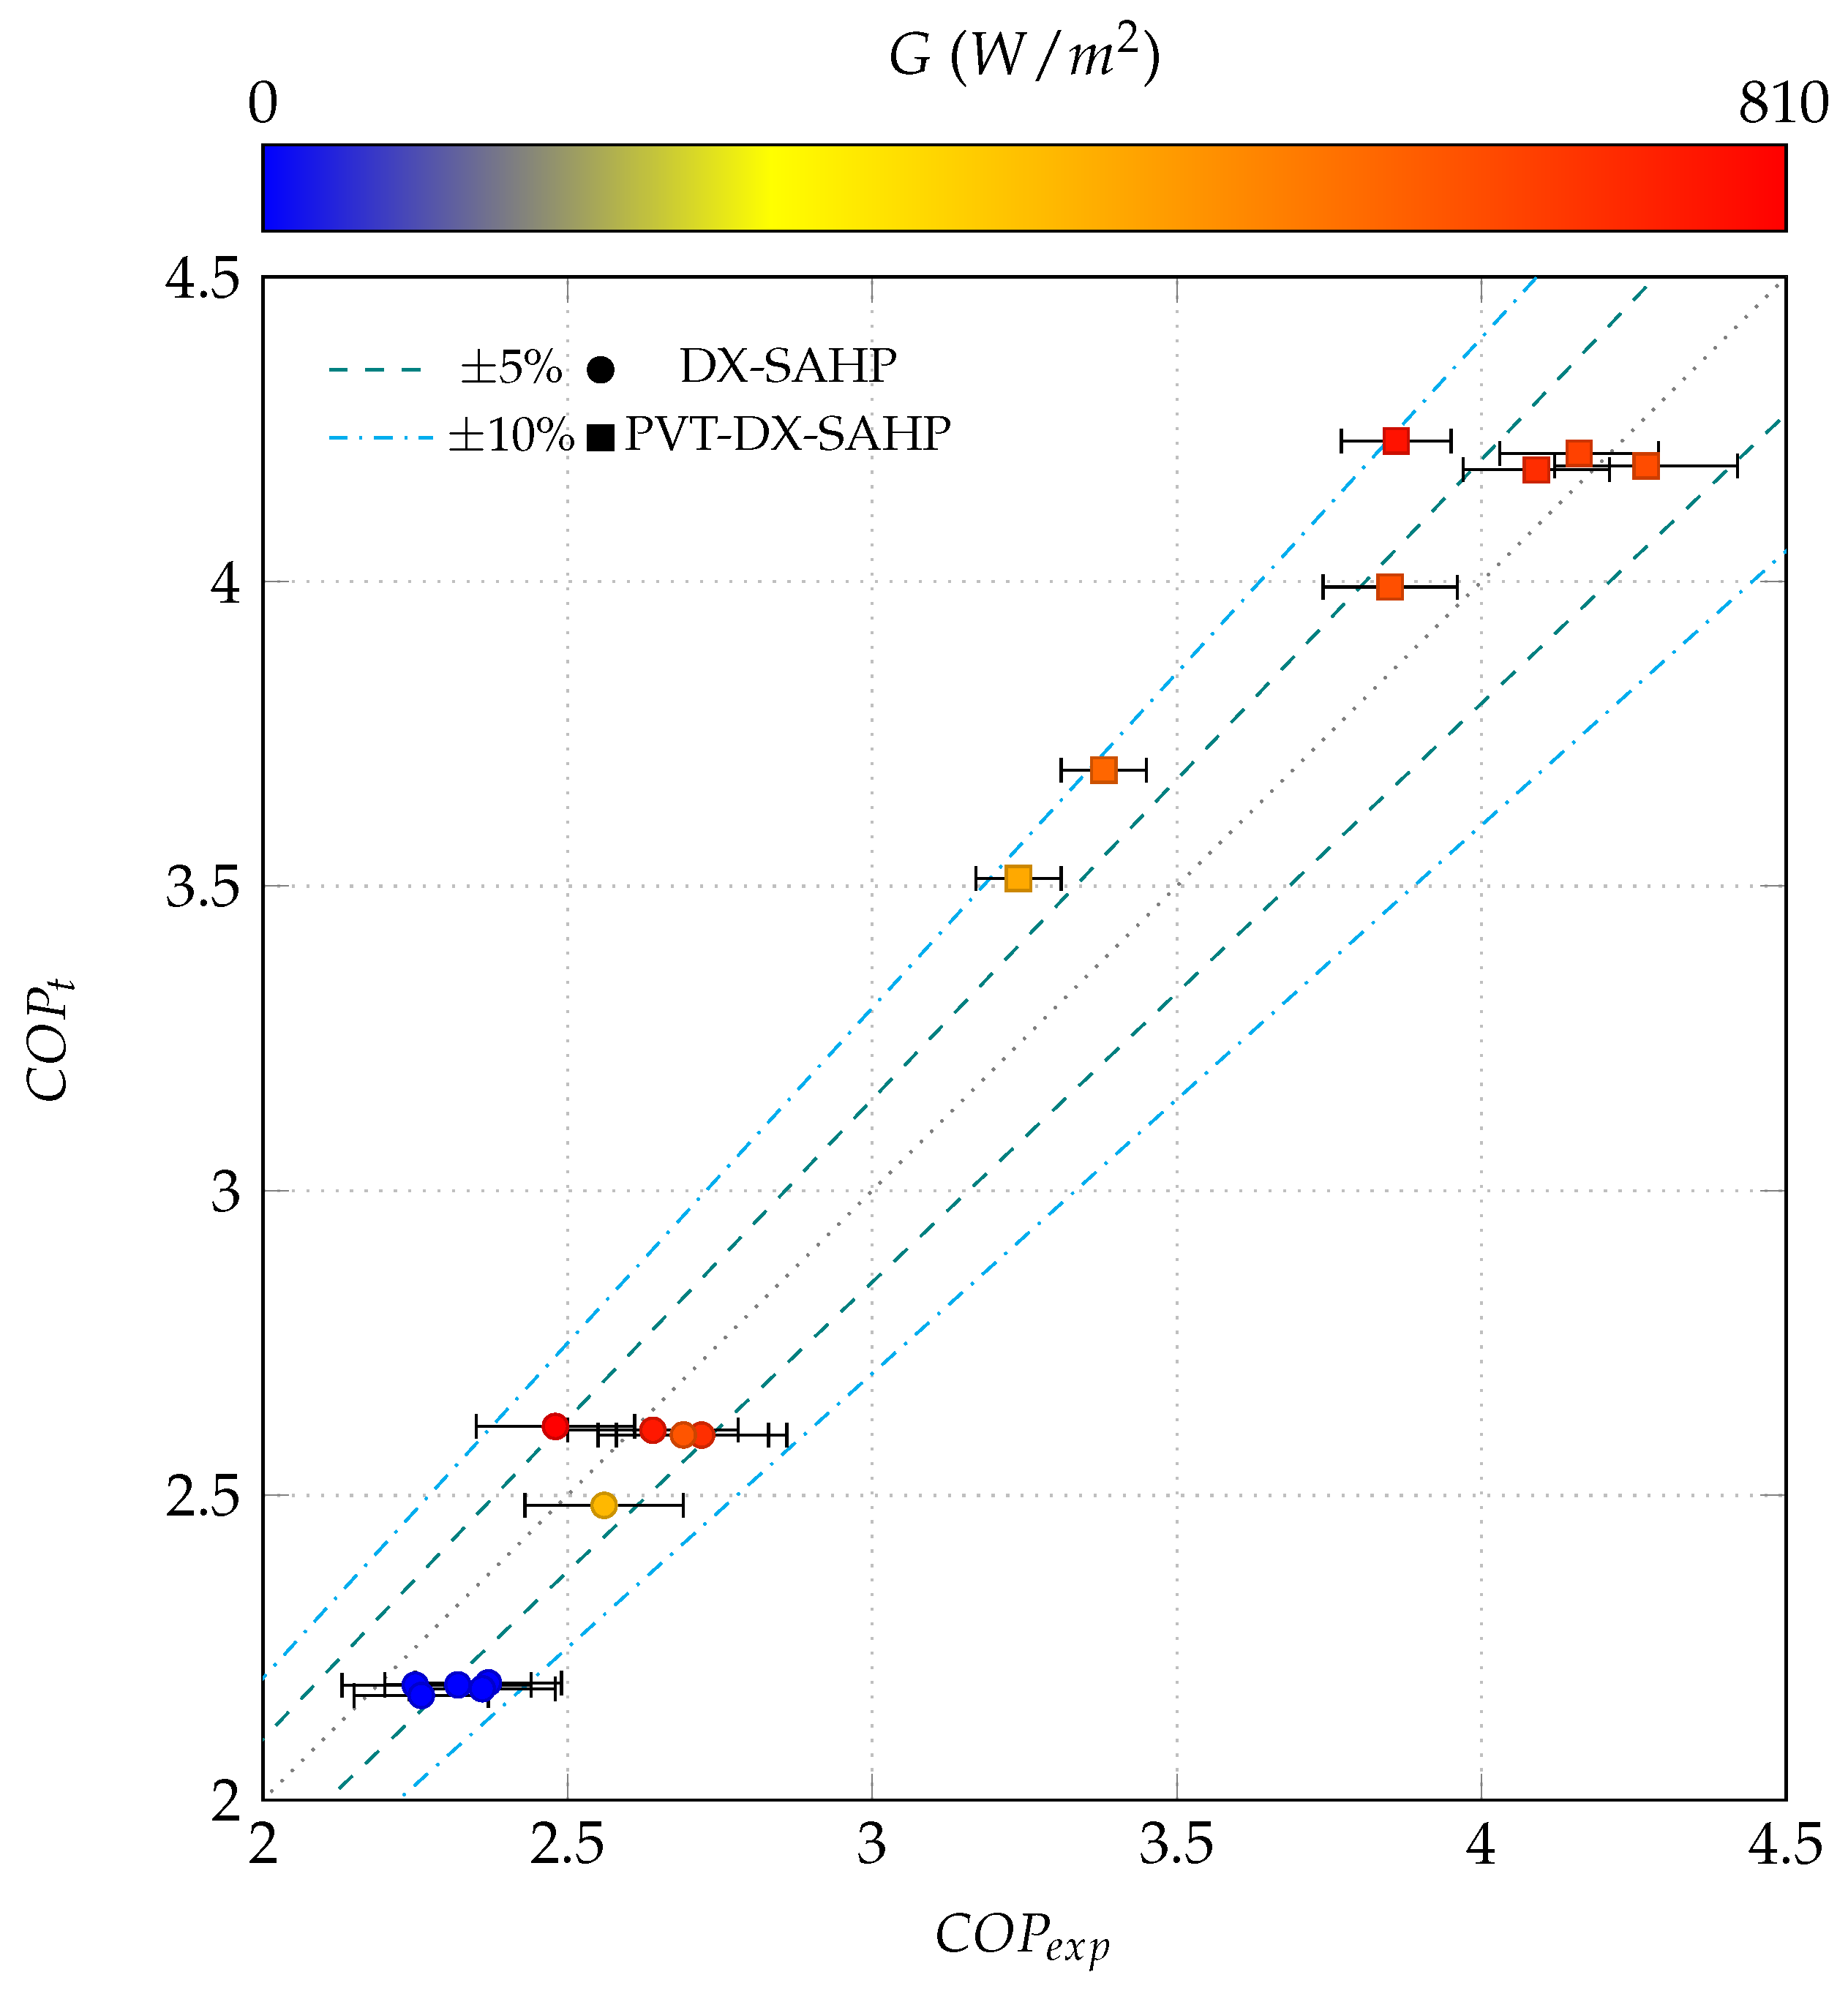
The comparison of experimental and theoretical COP is shown in Figure 4, with 94% of the data falling within the ±10% range. The MD, MAD, and maximum deviation for DX-SAHP were −3.4%, 4.5%, and 7.5%, and for PVT-DX-SAHP, these were 4.6%, 5.2%, and 9.6%, respectively. The MD, MAD, and maximum deviation in comparison to experimental and theoretical photovoltaic electric power were 8.8%, 8.8%, and 14%. Values often found in the literature are consistent with those aforementioned: Liang et al. [47] validated their model of PVT-SAHP with a maximum difference of 14.93% and 20.15% for COP and photovoltaic power, respectively; Shama et al. [53] presented the validation of a model of the PVT system taking into consideration two experimental tests and five different variables with a maximum error in the range of ±10%. Some authors reported an average discrepancy between the actual and theoretical COP of 4.2%, 5.5%, and 7.4% in the validation of the heat pump model [100,101,102].
Figure 4.
Comparison of the measured and theoretical COP for DX-SAHP and PVT-DX-SAHP.
The variation in COP between the two systems presented in Figure 4 can be attributed to two primary factors. The first is the compressor efficiency: the FFU100HAK compressor operates with an overall efficiency ranging from 43% to 58%, whereas the VEGT8HB compressor reaches values between 59% and 67%. Because the VEGT8HB is a variable-speed and higher-cost unit, a superior efficiency level is expected. The second factor is the reduced cooling capacity of the heat pump coupled with the PVT, which was tested at 50 Hz. This operating condition raises the evaporation temperature for the same level of solar irradiation but leads to a decrease in heating capacity.
The results presented in the following sections were obtained considering all the data (compressor parameters, condenser and evaporator geometry, etc.) of PVT-DX-SAHP.
5.2. Results of Standard Environmental Conditions
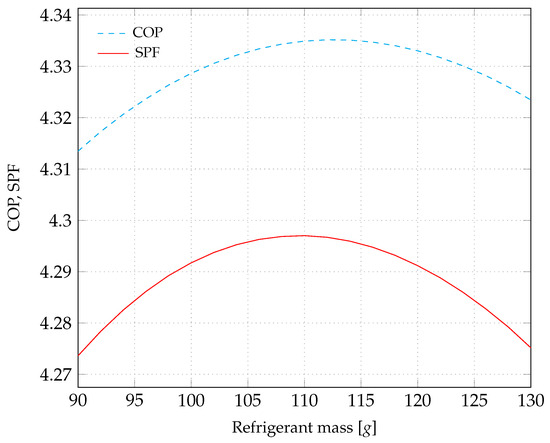
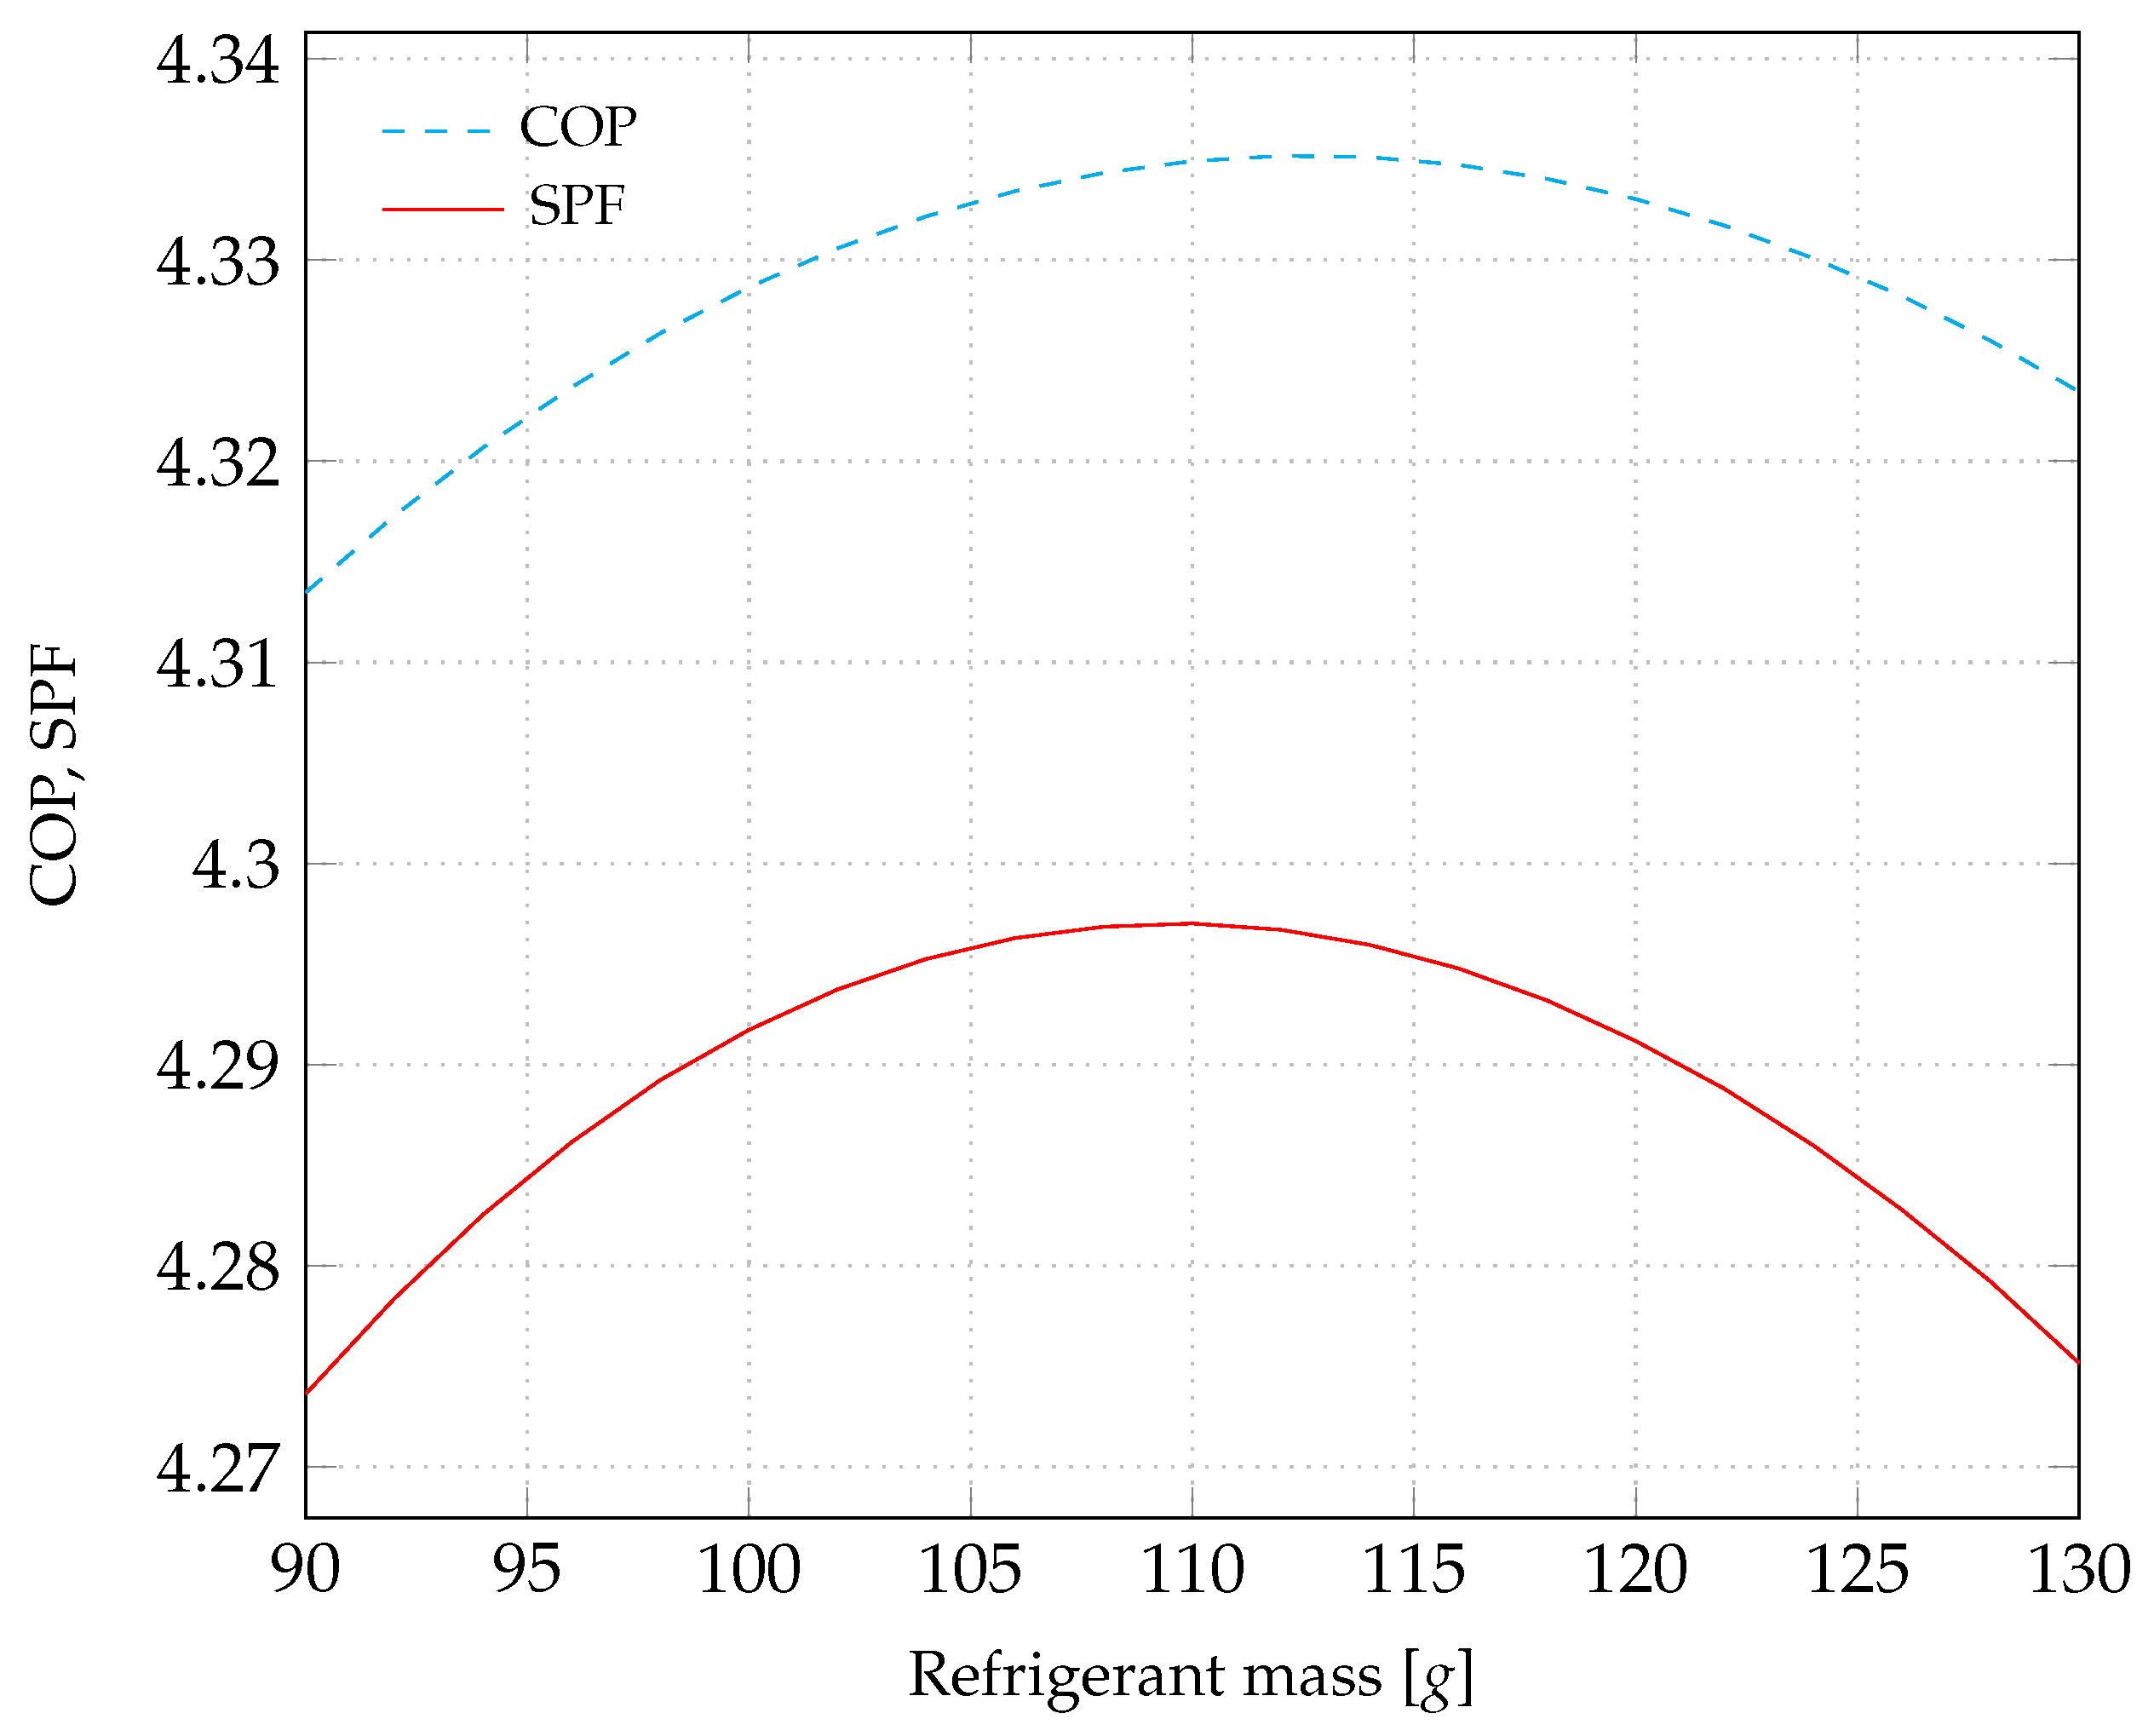
Since the model was validated with R134a, and R290 will be used in the simulations, it is important to choose a new refrigerant charge for the following simulations. In fact, some authors have demonstrated that there is a certain mass that maximizes the energy efficiency of a heat pump [66,103]. Figure 5 shows the variation in the COP of DX-SAHP and the SPF of PVT-DX-SAHP, considering that the mass of refrigerant varies between 90 and 130 g. The solar irradiance values were chosen so that the curves could have the same scale on the y-axis and yet the maximum points remained clear. In the systems analyzed in this study, a larger refrigerant charge leads to greater subcooling, as no liquid receivers are present. Under the condition of zero subcooling, any increase in subcooling raises the enthalpy change in the condenser without substantially affecting the enthalpy change across the compressor, thereby improving the COP. However, excessively high subcooling may drive the refrigerant outlet temperature below the condenser water inlet temperature, which is physically impossible. As a result, the system compensates by increasing the condensing pressure, ultimately lowering the COP. Other simulations were carried out with varying solar irradiance, and the maximum point remained between 105 and 120 g. The simulations from this point will be conducted considering 110 g of R290.
Figure 5.
COP of DX-SAHP for 500 W/m2 and SPF of PVT-DX-SAHP for 210 W/m2 with different values of R290 mass.
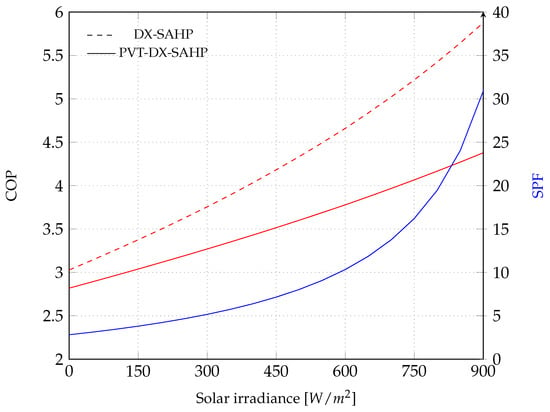
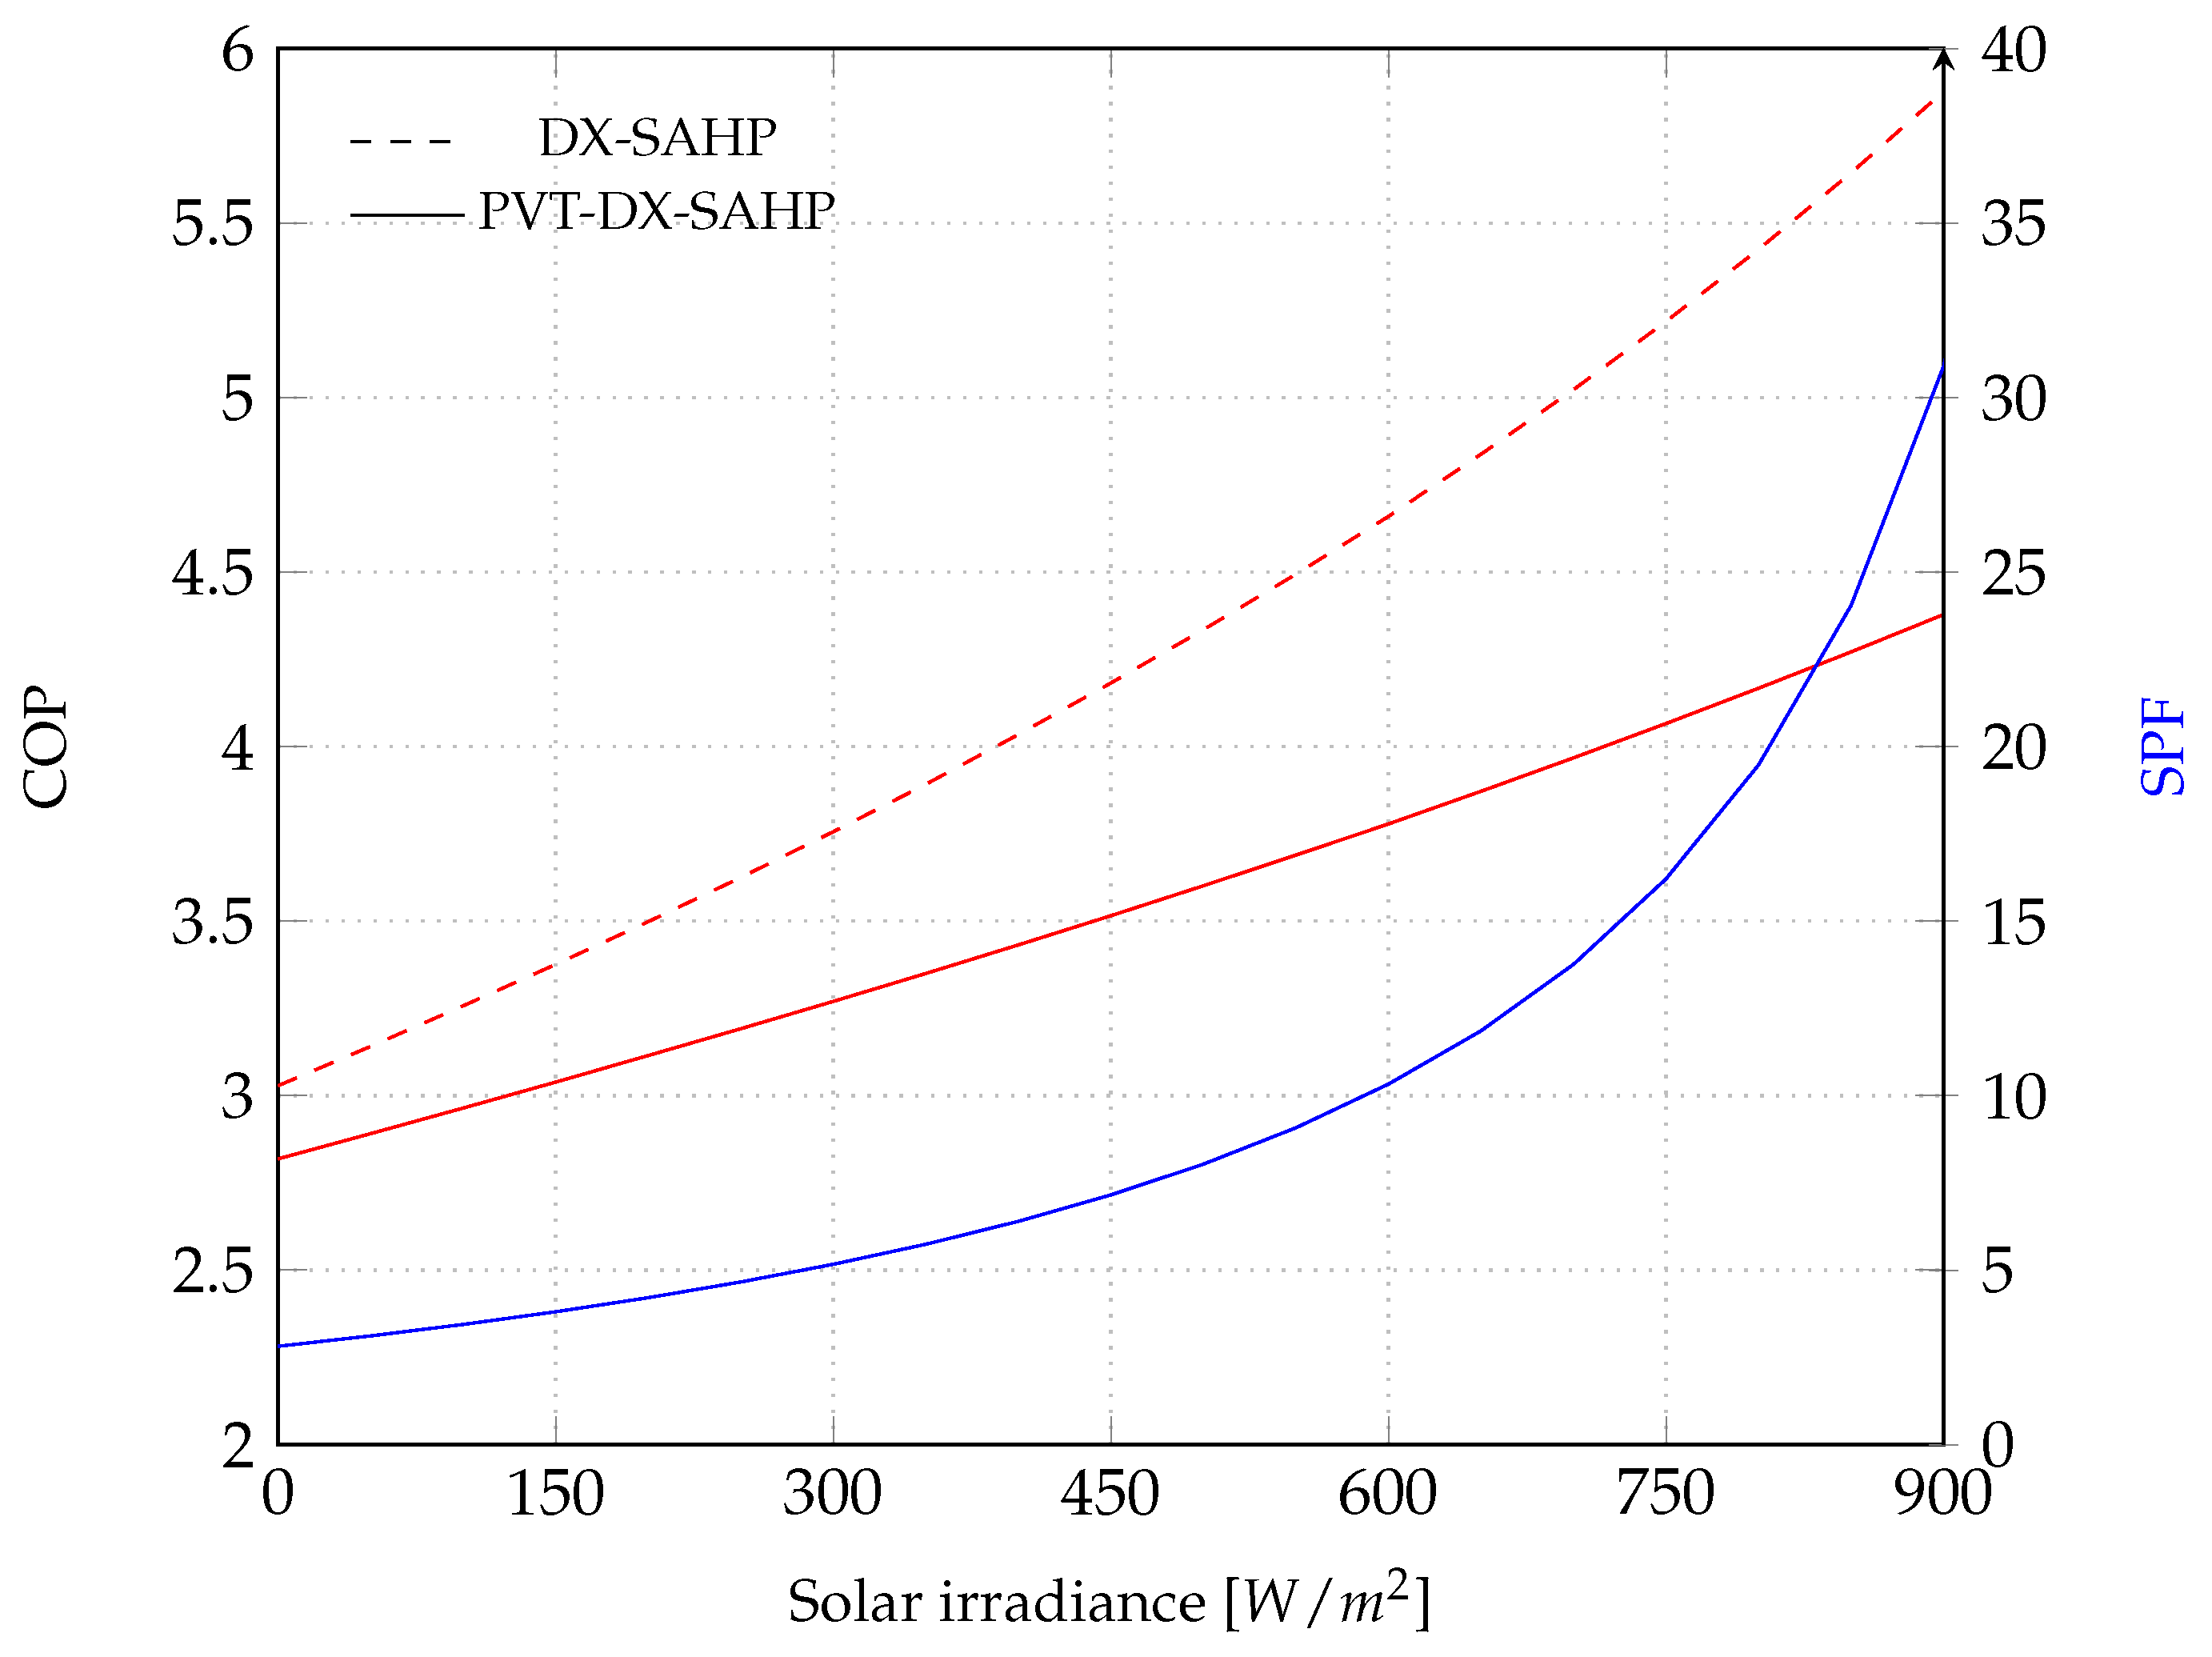
Figure 6 shows the variation in COP and SPF as a function of solar irradiance for both devices. The physical reasons for the increase in COP are the increase in solar irradiance, which raises the evaporation temperature. In the system with the photovoltaic panel, the increase in irradiance is also accompanied by an increase in the electrical power produced and, therefore, there is a smaller increase in the evaporation temperature and a less significant improvement in the COP compared to the system without the photovoltaic panel. There is a 94% increase in the COP of DX-SAHP when the irradiance increases from 0 W/m2 to 900 W/m2. Operation in the irradiance 0 W/m2 indicates the operation pf an air-source heat pump (ASHP). There is a 55% increase in the COP of PVT-DX-SAHP when the irradiance increases from 0 W/m2 to 900 W/m2, but the increase in the SPF is 996%. The slope of the SPF curve in Figure 6 increases as irradiance increases, as observed in the study of Zanetti et al. [52].
Figure 6.
COP and SPF in the function of solar irradiance.
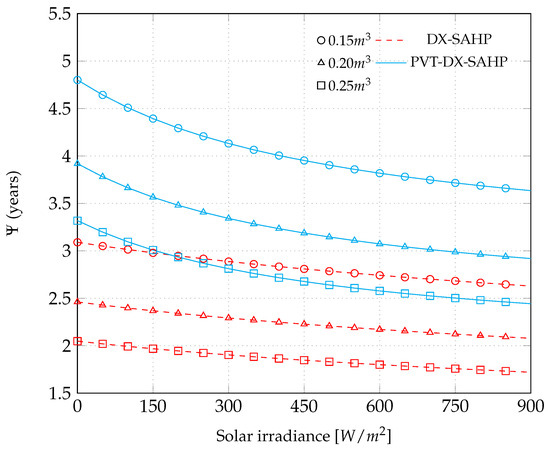
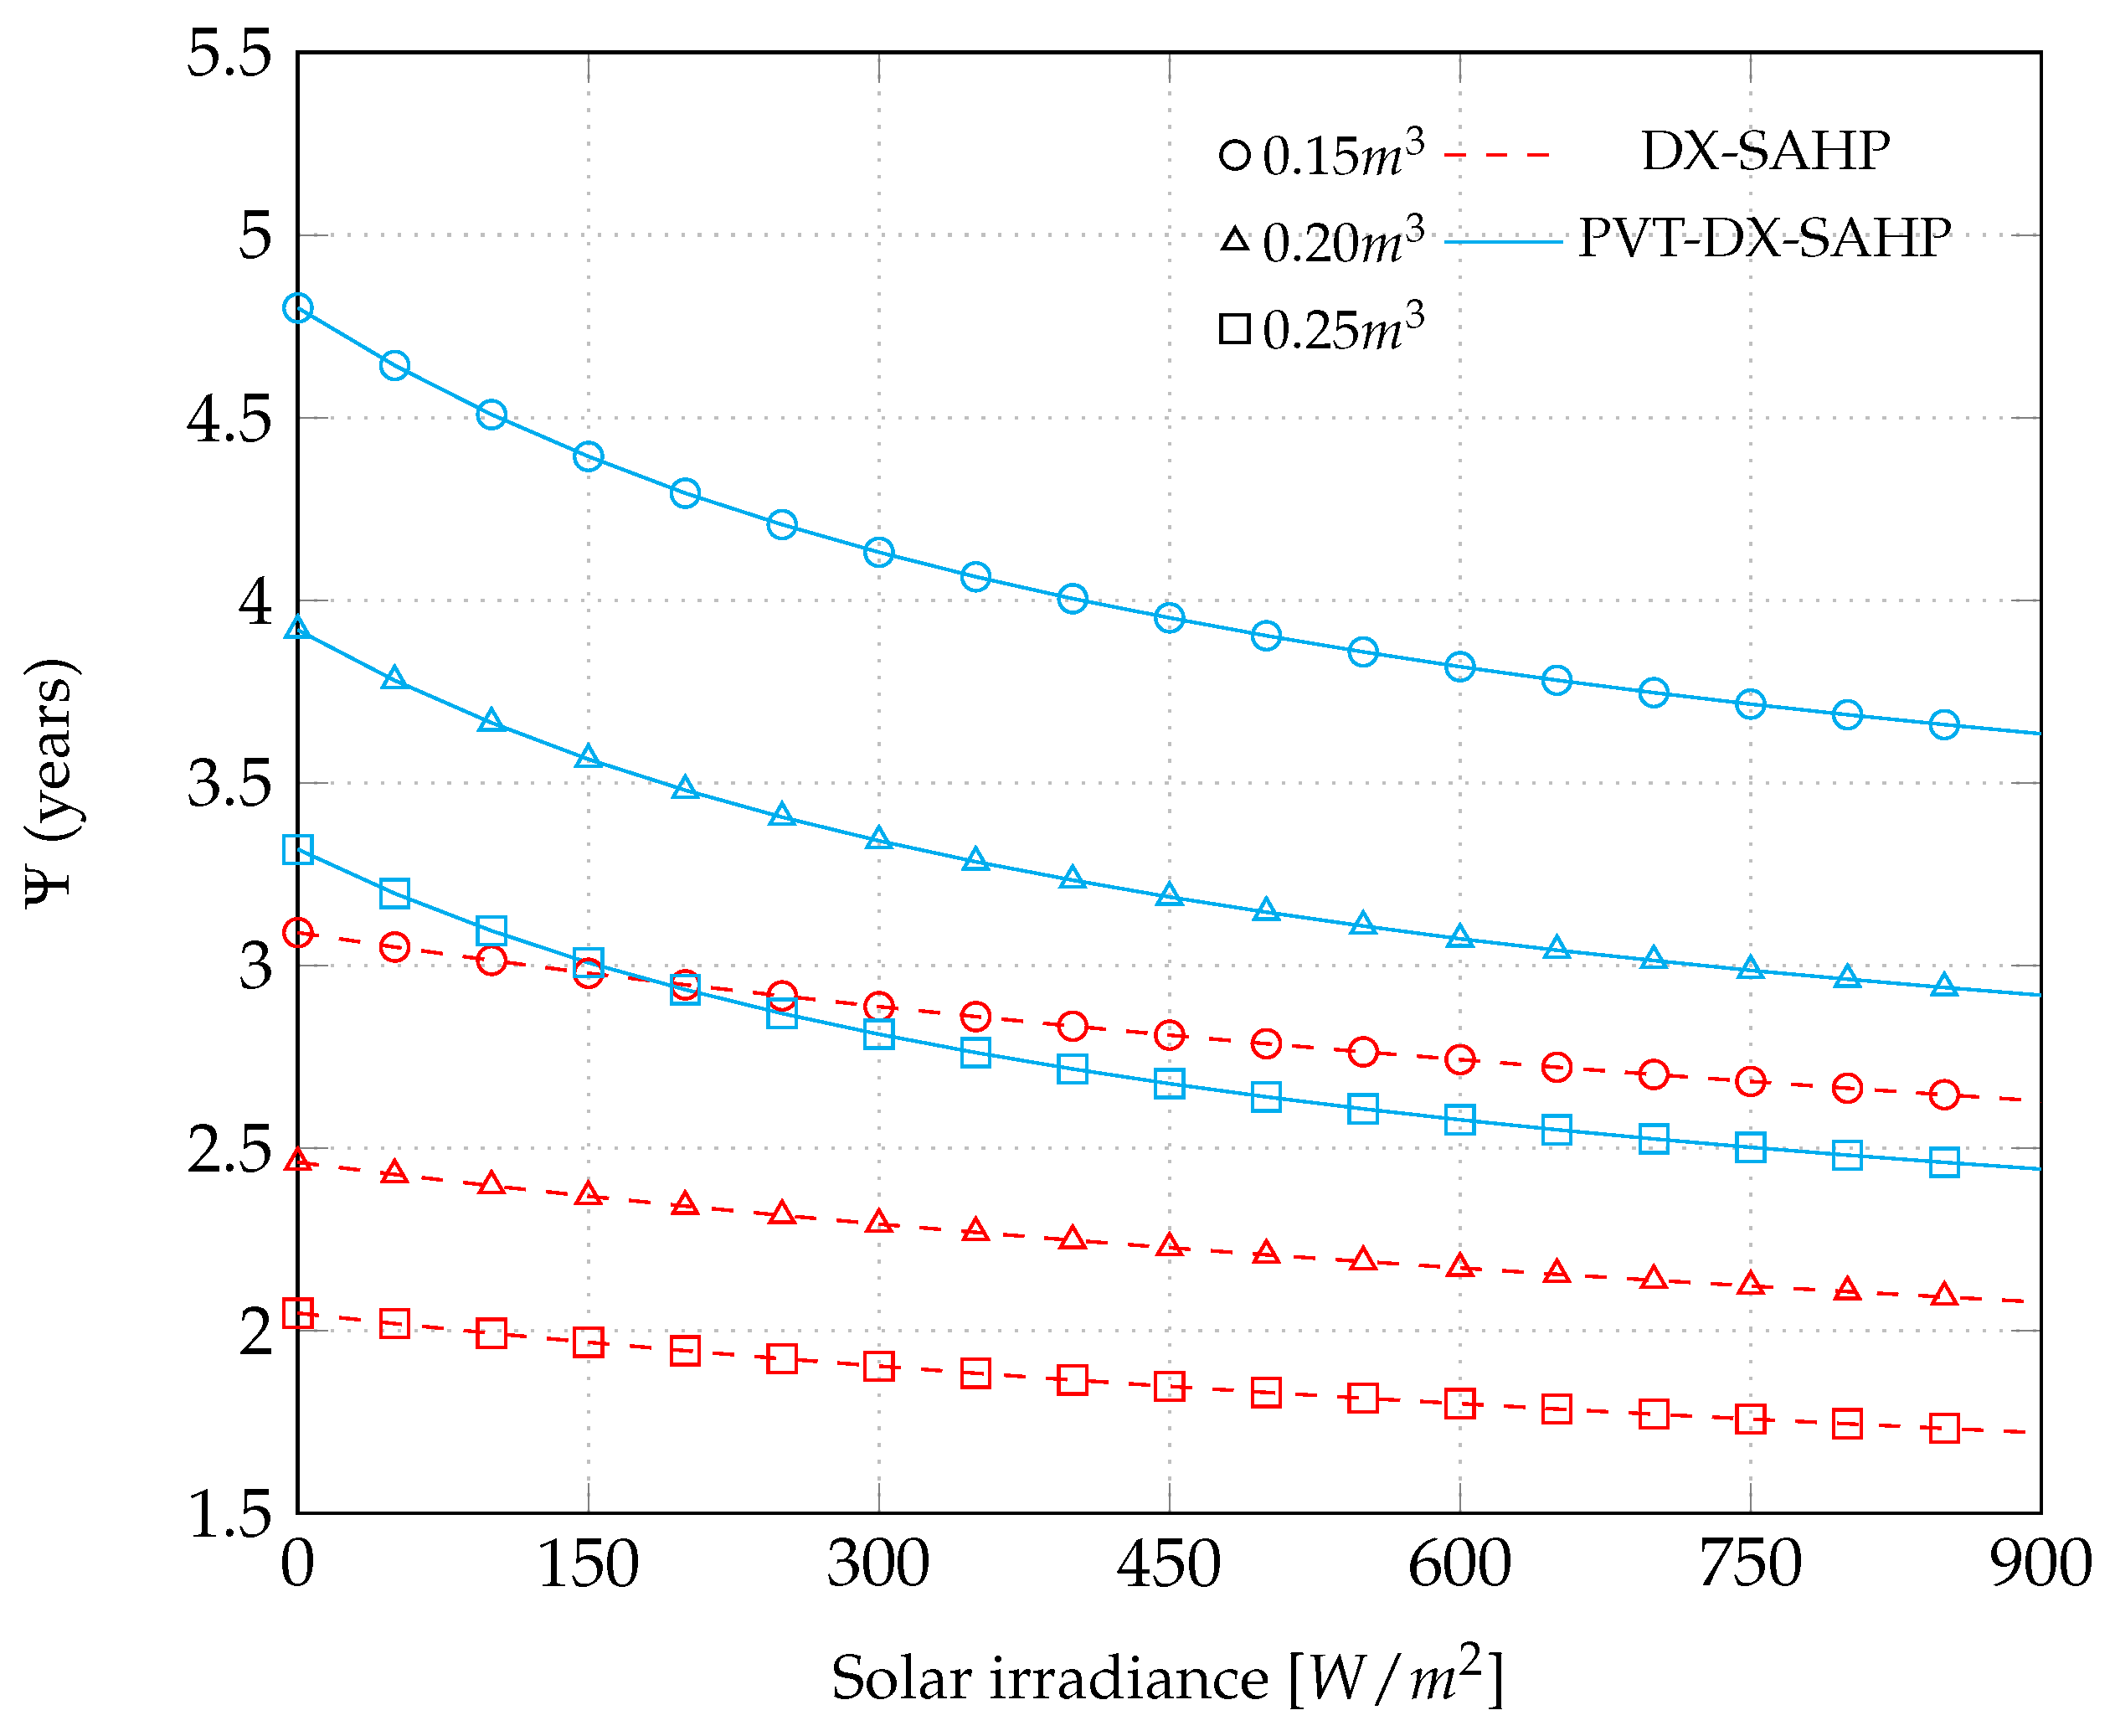
Figure 7 shows the variation in payback as a function of solar irradiance for both devices and different water tank sizes. There is a 16% decrease in the payback period of DX-SAHP when the irradiance increases from 0 W/m2 to 900 W/m2 for 0.2 m2. There is a 26% decrease in the payback period PVT-DX-SAHP when the irradiance increases from 0 W/m2 to 900 W/m2, but the payback period of PVT-DX-SAHP is 45% higher than the payback period of the DX-SAHP. The variation of ±0.05 m2 in the water tank size results in a ±19% mean variation in the payback period for PVT-DX-SAHP. For DX-SAHP, the reduction from 0.2 m3 to 0.15 m3 of water tank size results in a mean increase of 26% in the payback and the increase of the water tank from 0.2 m3 to 0.2 m3. Overall, 0.25 m3 results in a mean decrease of 17% in the payback period.
Figure 7.
Payback in the function of solar irradiance and water tank size for DX-SAHP and PVT-DX-SAHP.
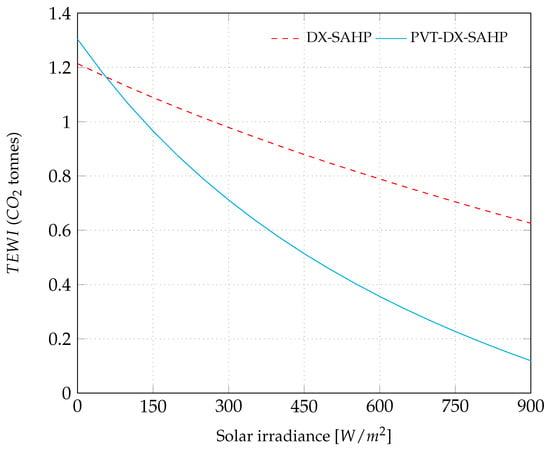
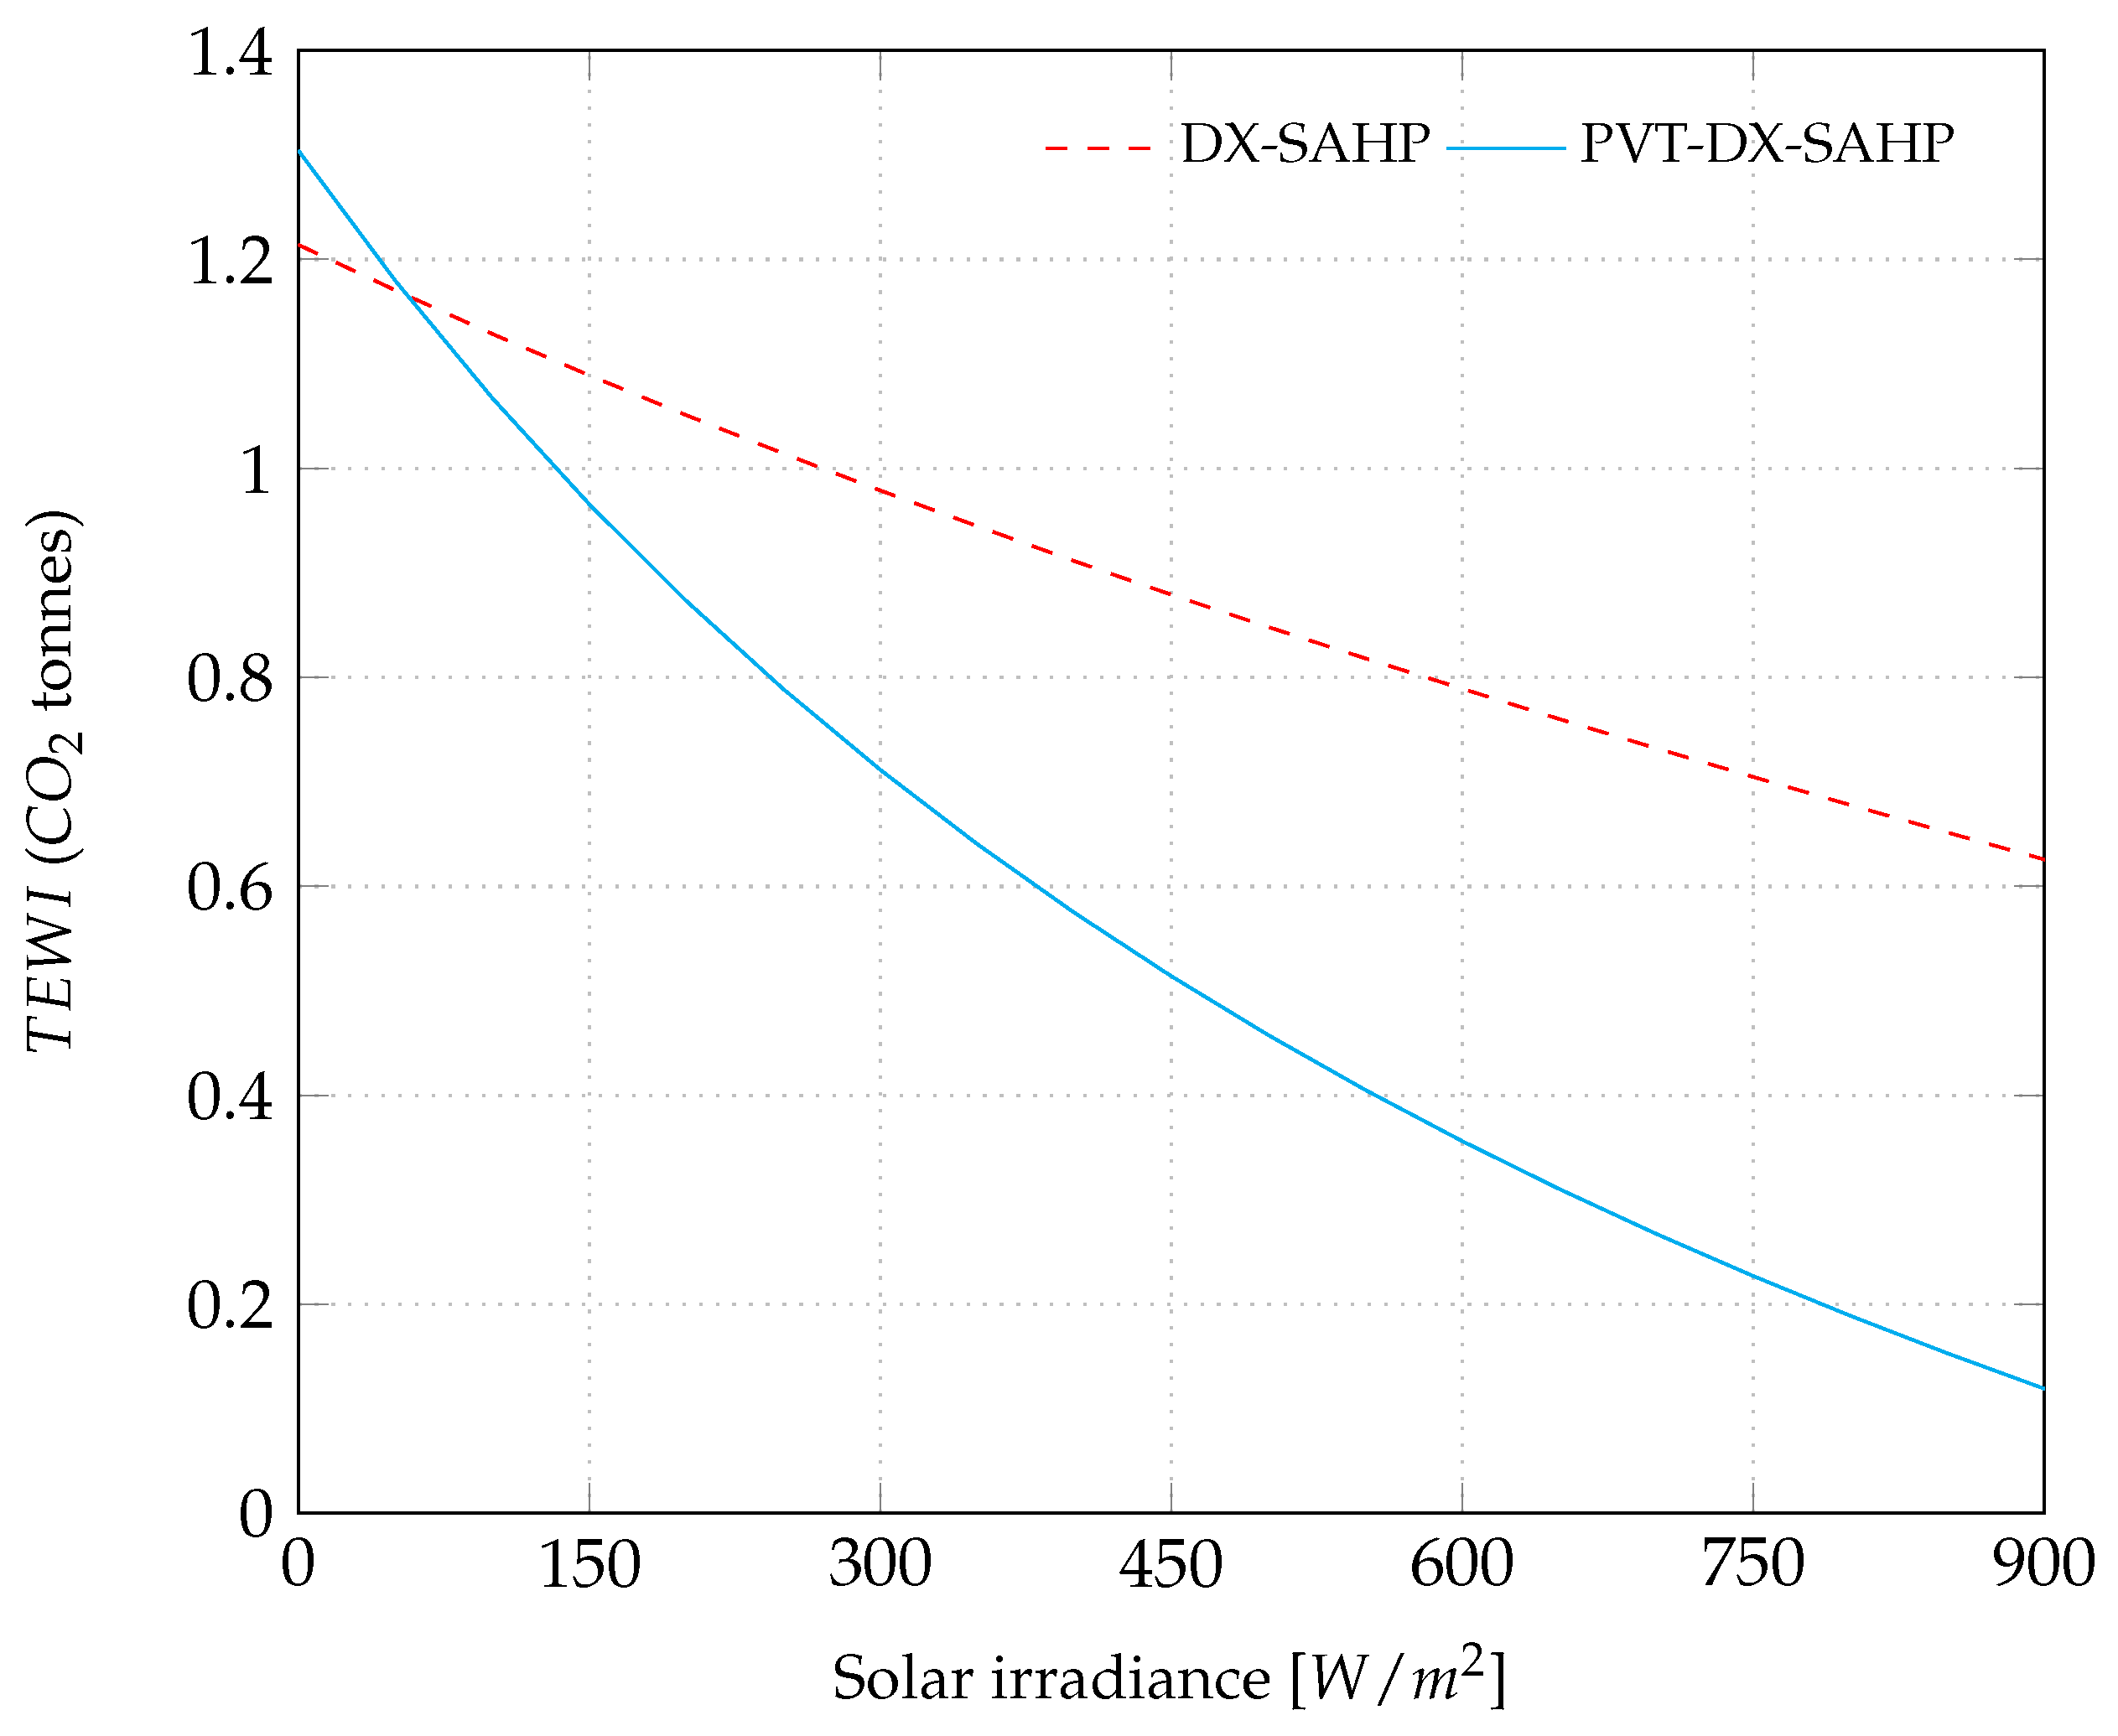
Figure 8 shows the variation in TEWI as a function of solar irradiance for both devices. There is a 48% decrease in the TEWI of DX-SAHP when the irradiance increases from 0 W/m2 to 900 W/m2 and a 90% decrease in TEWI for PVT-DX-SAHP. For zero solar radiation, the TEWI of the equipment without PVT is 7% better, while for 900 W/m2, the TEWI for equipment with PVT is 80% lower. The theoretical point where there are zero emissions for the PVT-DX-SAHP is around the 1000 W/m2 to 1100 W/m2 range. The TEWI for an electrical heater is 3.8 CO2 tons.
Figure 8.
TEWI in the function of solar irradiance for DX-SAHP and PVT-DX-SAHP.
5.3. Results with Environmental Conditions of Selected Cities
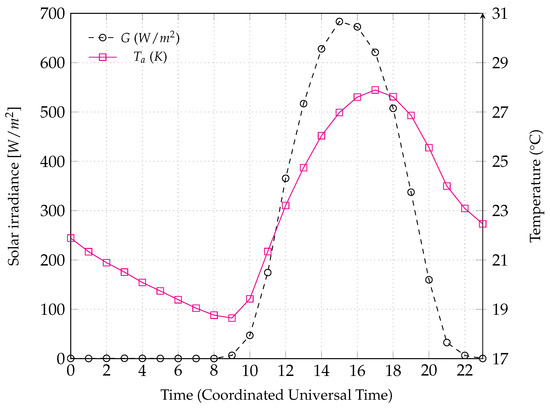
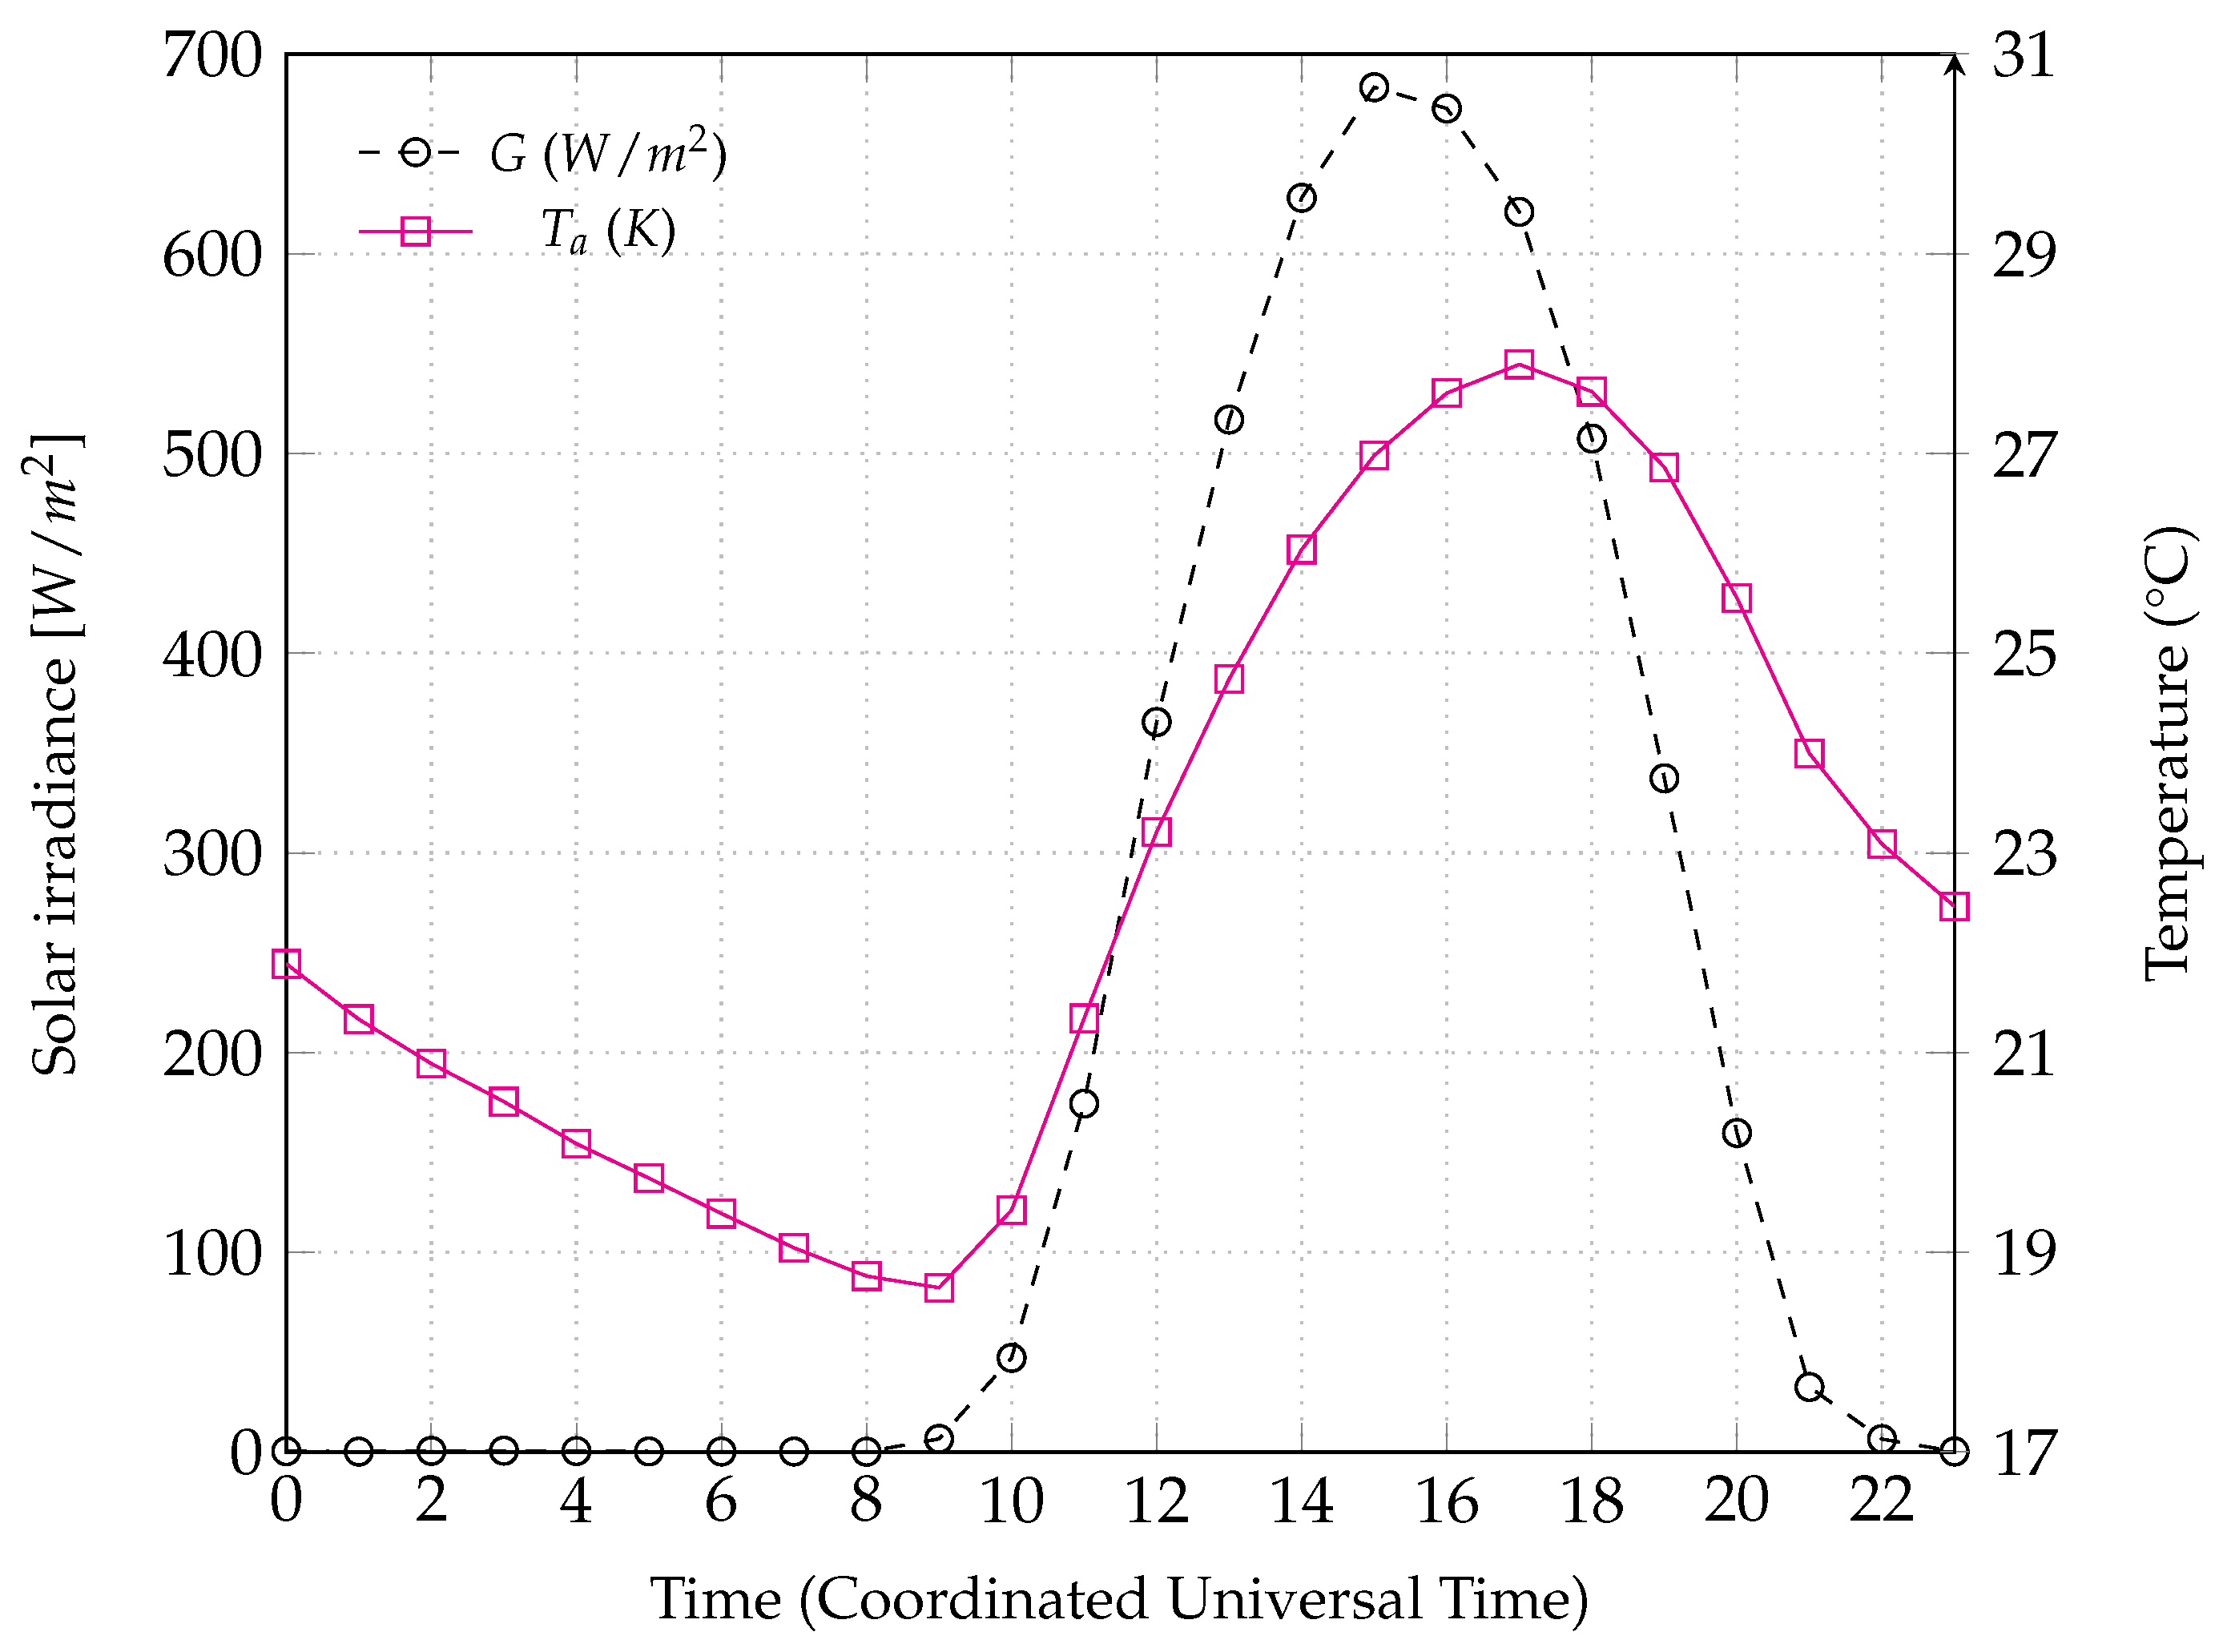
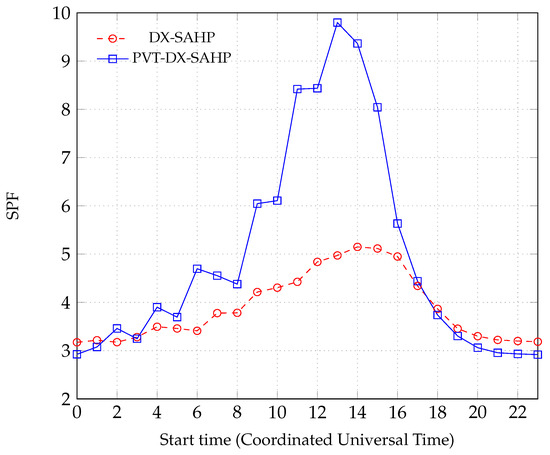
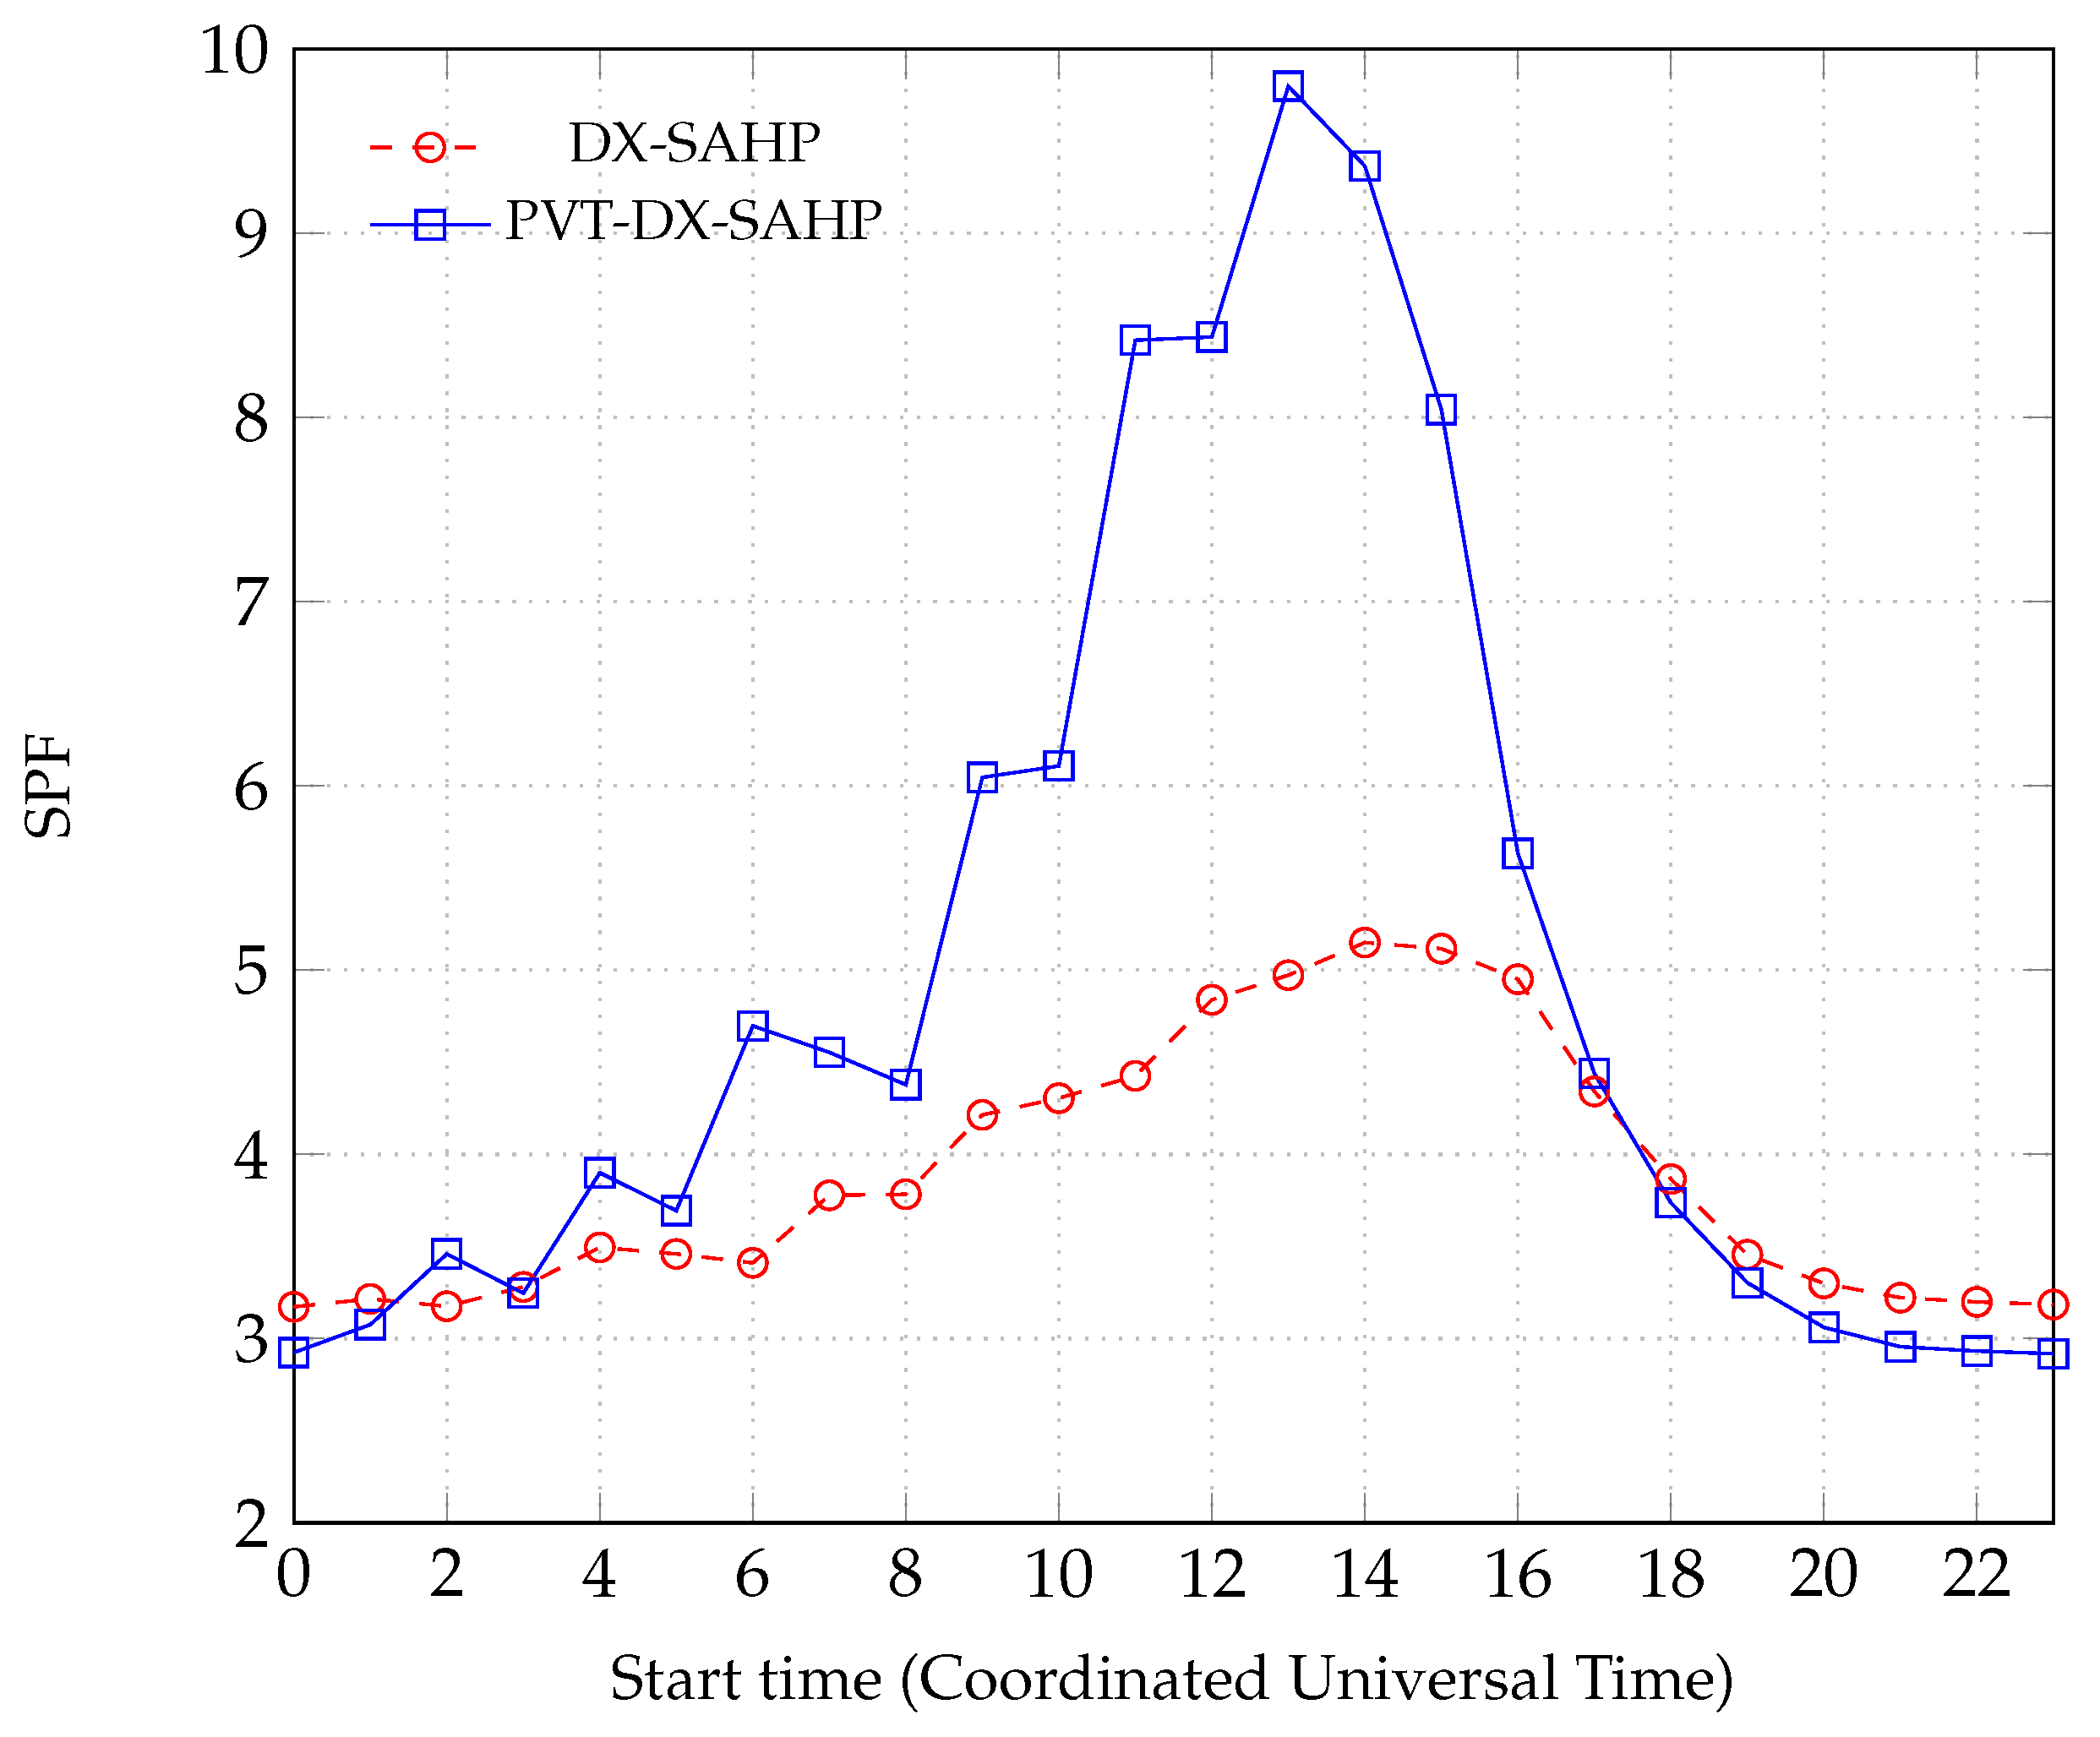
In the analysis considering the climate data of selected cities, a new optimization method was devised using the start time of the operation in the system as an independent variable. Figure 9 shows the annual averages of temperature and solar radiation for one of the selected cities, and Figure 10 shows the performance of the heat pump as a function of the start time of the operation. The best SPF result occurs when the heat pump operates at times of the highest radiation and temperature. At the maximum SPF point, the PVT-DX-SAHP takes 5.75 h to fill the 200 L water tank, and the DX-SAHP takes 3.3 h to fill the water tank. The heat pump with the photovoltaic panel operates with a lower heating capacity since part of the solar energy that reaches the PVT is used to produce electricity. Therefore, to maximize the performance of PVT-DX-SAHP, the operation should begin before DX-SAHP to take advantage of higher radiation and air temperatures during the day. Considering start times of 11 and 12 Coordinated Universal Time, despite there being a 110% increase in solar radiation at these times, the average radiation during the operating time increased by only 9.6%, and there was a reduction in the operating time of approximately one and a half hours, which is why the SPF of these two points are so close. In Figure 10, the best SPF for PVT-DX-SAHP is 90% higher than the best SPF for DX-SAHP.
Figure 9.
Annual average of solar irradiance and annual average air temperature in Belo Horizonte for each hour of the day.
Figure 10.
SPF for Belo Horizonte.
Table 6 and Table 7 show the results for the selected cities. The deviation in these results is presented in Table 8 and was calculated using the DX-SAHP results as a reference. The O SPF and payback period of PVT-DX-SAHP are, on average, 81% and 24% higher than those of DX-SAHP, but the TEWI is 30% lower. Both systems are viable for all cities since the paybacks are much lower than the life expectancy of the equipment. Some scholars found a similar payback in a range of 1.77–3.34 years depending on the environmental conditions for a DX-SAHP [38].
Table 6.
Results of optimized SPF, Φ, and TEWI for selected cities for DX-SAHP.
Table 7.
Results of optimized SPF, Φ, and TEWI for selected cities for PVT-DX-SAHP.
Table 8.
Deviation of the PVT-DX-SAHP results for selected cities calculated using the DX-SAHP results as a reference.
To assess the robustness of the payback results, we conducted an additional sensitivity analysis, varying both energy tariffs and the maintenance costs of the photovoltaic system. For this analysis, the tariff flags (green, yellow, and red 1 and 2) were considered, indicating the costs of electricity generation in Brazil, reflected monthly in the electricity bill. The green flag has no surcharge; yellow and red flags signal higher costs due to drought and the use of thermal power plants, with extra charges per kWh consumed of up to 9.2%. A variantion of ±10% in the electricity tariff results in a variation of ±0.25 years in the payback period for Belo Horizonte. Kumar and Tiwari [104] suggest 10% of the initial investment in PV devices for maintenance costs. Maintenance costs increased the payback period of 0.42 years, considering the Belo Horizonte data. Finally, to evaluate PV lifetime variations in polycrystalline silicon modules used in this study, a power degradation of 0.5% per year [105] was used in the simulation, resulting in payback variation that was lower than 0.01 years. Therefore, maintenance costs, electricity tariff fluctuations, and PV lifetime variations do not make the PVT-DX-SAHP system unfeasible.
6. Conclusions
Since the paybacks are significantly less than the equipment’s lifespan, both technologies are feasible for all cities. The comparative analysis between DX-SAHP and PVT-DX-SAHP systems highlights the superior energy efficiency and environmental benefits of integrating photovoltaic cells with direct expansion solar-assisted heat pumps. The PVT-DX-SAHP system demonstrated 81% higher SPF and 30% lower TEWI compared to the DX-SAHP system. Although the payback period for PVT-DX-SAHP was 24% longer, the environmental advantages and increased energy efficiency make it a compelling choice for sustainable heating solutions, particularly in regions with high solar irradiance.
Author Contributions
Conceptualization, F.N.C., T.F.P. and W.M.D.; methodology, F.N.C. and W.M.D.; software, F.N.C. and W.M.D.; validation, F.N.C. and W.M.D.; formal analysis, F.N.C., S.S. and W.M.D.; investigation, F.N.C. and W.M.D.; resources, A.A.T.M.; data curation, F.N.C. and W.M.D.; writing—original draft preparation, F.N.C., T.F.P. and W.M.D.; writing—review and editing, A.A.T.M. and S.S.; visualization, F.N.C. and W.M.D.; supervision, A.A.T.M. and W.M.D.; project administration, A.A.T.M. and W.M.D.; funding acquisition, A.A.T.M. and W.M.D. All authors have read and agreed to the published version of the manuscript.
Funding
This work was supported by the Foundation for Research Support of the State of Minas Gerais (FAPEMIG), the National Council for Scientific and Technological Development (CNPq) process 420215/2025-5, and the Federal University of Minas Gerais (UFMG), Brazil. This study was financed in part by the Coordenação de Aperfeiçoamento de Pessoal de Nível Superior—Brasil (CAPES)—Finance Code 001.
Data Availability Statement
The original contributions presented in this study are included in the article. Further inquiries can be directed to the corresponding author.
Acknowledgments
The authors thank the Centro Multiusuário de Termografia Científica (CEMTEC) for its support in the development of this work. During the preparation of this work the author used chat-GPT 5, quillbot V40, and Maritaca Sabiá-3.1 in order to text proofreading and paraphrasing the text. After using this tool/service, the authors reviewed and edited the content as needed and take full responsibility for the content of the publication.
Conflicts of Interest
The authors declare no conflicts of interest.
Abbreviations
The following abbreviations are used in this manuscript:
| ASHP | Air Source Heat Pump |
| DX | Direct Expansion |
| GWP | Global Warming Potential |
| IX | Indirect expansion |
| LCCP | Life Cycle Climate Performance |
| PV | Photovoltaic |
| PVC | Polyvinyl Chloride |
| PVT | Photovoltaic–Thermal |
| R290 | Propane |
| SAHP | Solar-Assisted Heat Pumps |
| SPF | Season Performance Factor |
| TEV | Thermal Expansion Valve |
| TEWI | Total Equivalent Warming Impact |
| TRNSYS | Transient Systems Simulation Program |
References
- Sezen, K.; Gungor, A. Comparison of solar assisted heat pump systems for heating residences: A review. Sol. Energy 2023, 249, 424–445. [Google Scholar] [CrossRef] [Scilit]
- Miglioli, A.; Aste, N.; Del Pero, C.; Leonforte, F. Photovoltaic-thermal solar-assisted heat pump systems for building applications: Integration and design methods. Energy Built Environ. 2023, 4, 39–56. [Google Scholar] [CrossRef] [Scilit]
- Zhang, D.; Wu, Q.; Li, J.; Kong, X. Effects of refrigerant charge and structural parameters on the performance of a direct-expansion solar-assisted heat pump system. Appl. Therm. Eng. 2014, 73, 522–528. [Google Scholar] [CrossRef] [Scilit]
- Scarpa, F.; Tagliafico, L.A. Exploitation of humid air latent heat by means of solar assisted heat pumps operating below the dew point. Appl. Therm. Eng. 2016, 100, 820–828. [Google Scholar] [CrossRef] [Scilit]
- Mohamed, E.; Riffat, S.; Omer, S. Low-temperature solar-plate-assisted heat pump: A developed design for domestic applications in cold climate. Int. J. Refrig. 2017, 81, 134–150. [Google Scholar] [CrossRef] [Scilit]
- Huang, W.; Ji, J.; Modjinou, M.; Qin, J. Effects of Ambient Parameters on the Performance of a Direct-Expansion Solar-Assisted Heat Pump with Bare Plate Evaporators for Space Heating. Int. J. Photoenergy 2017, 2017, 3082740. [Google Scholar] [CrossRef] [Scilit]
- Kong, X.; Sun, P.; Jiang, K.; Dong, S.; Li, Y.; Li, J. A variable frequency control method and experiments of a direct-expansion solar-assisted heat pump system. Sol. Energy 2018, 176, 572–580. [Google Scholar] [CrossRef] [Scilit]
- Ji, W.; Cai, J.; Ji, J.; Huang, W. Experimental study of a direct expansion solar-assisted heat pump (DX-SAHP) with finned-tube evaporator and comparison with conventional DX-SAHP. Energy Build. 2020, 207, 109632. [Google Scholar] [CrossRef] [Scilit]
- Kong, X.; Yang, Y.; Zhang, M.; Li, Y.; Li, J. Experimental investigation on a direct-expansion solar-assisted heat pump water heater using R290 with micro-channel heat transfer technology during the winter period. Int. J. Refrig. 2020, 113, 38–48. [Google Scholar] [CrossRef] [Scilit]
- Resende, S.I.M.; Diniz, H.A.G.; Machado, L.; de Faria, R.N.; de Oliveira, R.N. Dynamic modeling of an R290 direct-expansion solar-assisted heat pump: Performance analysis for efficient hot water production under different conditions. J. Build. Eng. 2025, 100, 111687. [Google Scholar] [CrossRef] [Scilit]
- Yang, B.; Zhang, X.; Liu, S.; Yu, X.; Guo, Z. Performance analysis of direct-expansion solar-assisted heat pump system. Int. J. Refrig. 2025, 180, 453–466. [Google Scholar] [CrossRef] [Scilit]
- Lu, S.; Liang, R.; Zhang, J.; Zhou, C. Performance improvement of solar photovoltaic/thermal heat pump system in winter by employing vapor injection cycle. Appl. Therm. Eng. 2019, 155, 135–146. [Google Scholar] [CrossRef] [Scilit]
- Song, Z.; Ji, J.; Cai, J.; Li, Z.; Yu, B. The performance comparison of the direct-expansion solar assisted heat pumps with three different PV evaporators. Energy Convers. Manag. 2020, 213, 112781. [Google Scholar] [CrossRef] [Scilit]
- Yao, J.; Chen, E.; Dai, Y.; Huang, M. Theoretical analysis on efficiency factor of direct expansion PVT module for heat pump application. Sol. Energy 2020, 206, 677–694. [Google Scholar] [CrossRef] [Scilit]
- Zhou, J.; Zhao, X.; Yuan, Y.; Li, J.; Yu, M.; Fan, Y. Operational performance of a novel heat pump coupled with mini-channel PV/T and thermal panel in low solar radiation. Energy Built Environ. 2020, 1, 50–59. [Google Scholar] [CrossRef] [Scilit]
- Li, Z.; Huang, X. Simulation analysis on operation performance of a hybrid heat pump system integrating photovoltaic/thermal and air source. Appl. Therm. Eng. 2022, 200, 117693. [Google Scholar] [CrossRef] [Scilit]
- Sanz, A.; Martín, A.J.; Pereda, A.; Román, E.; Ibañez, P.; Fuente, R. A Solar Dually PVT Driven Direct Expansion Heat Pump One-Year Field Operation Results at Continental Climate. Energies 2022, 15, 3205. [Google Scholar] [CrossRef] [Scilit]
- Liu, Y.; Quan, Z.; Du, B.; Bai, Z.; Zhao, Y.; Wang, H. Numerical analysis and optimization study of photovoltaic/thermal-air source evaporator based on micro heat pipe arrays. Sol. Energy 2024, 269, 112314. [Google Scholar] [CrossRef] [Scilit]
- Wei, L.; Xue, R.; Hao, W.; Wang, B.; Gong, P.; Wang, L. System modelling and multi-objective optimization of a photovoltaic-thermal assisted dual-source heat pump integrated with PCM. Energy 2025, 338, 138917. [Google Scholar] [CrossRef] [Scilit]
- Cai, J.; Li, Z.; Ji, J.; Zhou, F. Performance analysis of a novel air source hybrid solar assisted heat pump. Renew. Energy 2019, 139, 1133–1145. [Google Scholar] [CrossRef] [Scilit]
- Cai, J.; Zhang, F.; Ji, J. Comparative analysis of solar-air dual source heat pump system with different heat source configurations. Renew. Energy 2020, 150, 191–203. [Google Scholar] [CrossRef] [Scilit]
- Huan, C.; Wang, F.; Li, S.; Zhao, Y.; Liu, L.; Wang, Z.; Ji, C. A performance comparison of serial and parallel solar-assisted heat pump heating systems in Xi’an, China. Energy Sci. Eng. 2019, 7, 1379–1393. [Google Scholar] [CrossRef] [Scilit]
- Tzivanidis, C.; Bellos, E.; Mitsopoulos, G.; Antonopoulos, K.A.; Delis, A. Energetic and financial evaluation of a solar assisted heat pump heating system with other usual heating systems in Athens. Appl. Therm. Eng. 2016, 106, 87–97. [Google Scholar] [CrossRef] [Scilit]
- Ozgener, O.; Hepbasli, A. A review on the energy and exergy analysis of solar assisted heat pump systems. Renew. Sustain. Energy Rev. 2007, 11, 482–496. [Google Scholar] [CrossRef] [Scilit]
- Kara, O.; Ulgen, K.; Hepbasli, A. Exergetic assessment of direct-expansion solar-assisted heat pump systems: Review and modeling. Renew. Sustain. Energy Rev. 2008, 12, 1383–1401. [Google Scholar] [CrossRef] [Scilit]
- Omojaro, P.; Breitkopf, C. Direct expansion solar assisted heat pumps: A review of applications and recent research. Renew. Sustain. Energy Rev. 2013, 22, 33–45. [Google Scholar] [CrossRef] [Scilit]
- Mohanraj, M.; Belyayev, Y.; Jayaraj, S.; Kaltayev, A. Research and developments on solar assisted compression heat pump systems–A comprehensive review (Part A: Modeling and modifications). Renew. Sustain. Energy Rev. 2018, 83, 90–123. [Google Scholar] [CrossRef] [Scilit]
- Mohanraj, M.; Belyayev, Y.; Jayaraj, S.; Kaltayev, A. Research and developments on solar assisted compression heat pump systems–A comprehensive review (Part-B: Applications). Renew. Sustain. Energy Rev. 2018, 83, 124–155. [Google Scholar] [CrossRef] [Scilit]
- Shi, G.H.; Aye, L.; Li, D.; Du, X.J. Recent advances in direct expansion solar assisted heat pump systems: A review. Renew. Sustain. Energy Rev. 2019, 109, 349–366. [Google Scholar] [CrossRef] [Scilit]
- Quitiaquez, W.; Simbaña, I.; Isaza-Roldán, A.; Quitiaquez, P.; Nieto-Londoño, C.; Toapanta-Ramos, F. Revisión del estado del arte de sistemas DX-SAHP para la obtención de agua caliente sanitaria. Enfoque UTE 2020, 11, 29–46. [Google Scholar] [CrossRef] [Scilit]
- Xu, G.; Deng, S.; Zhang, X.; Yang, L.; Zhang, Y.; Zhang, Y. Simulation of a photovoltaic/thermal heat pump system having a modified collector/evaporator. Sol. Energy 2009, 83, 1967–1976. [Google Scholar] [CrossRef] [Scilit]
- BIPM.; IEC.; IFCC.; ILAC.; ISO.; IUPAC. Evaluation of Measurement Data—Guide to the Expression of Uncertainty in Measurement, Joint Committee for Guides in Metrology; Technical Report, Technical Report No. JCGM 100; Bureau International des Poids et Mesures (BIPM): Paris, France, 2008. [Google Scholar]
- Nogueira, F.; Maia, A.A.; Machado, L.; Duarte, W.M. Energetic, economic and environmental analysis of a direct expansion photovoltaic solar assisted heat pump with low-GWP refrigerants. Sol. Energy 2025, 302, 114042. [Google Scholar] [CrossRef] [Scilit]
- Duarte, W.M.; Paulino, T.F.; Pabon, J.J.G.; Sawalha, S.; Machado, L. Refrigerants selection for a direct expansion solar assisted heat pump for domestic hot water. Sol. Energy 2019, 184, 527–538. [Google Scholar] [CrossRef] [Scilit]
- Diniz, H.A.G. Estudo Comparativo da Eficiência Energética de Uma Bomba de Calor Assistida por Energia Solar Operando com Condensadores Por Imersão e Coaxial. Master’s Thesis, UFMG, Belo Horizonte, MG, Brazil, 2017. [Google Scholar]
- Makhnatch, P.; Khodabandeh, R. The role of environmental metrics (GWP, TEWI, LCCP) in the selection of low GWP refrigerant. Energy Procedia 2014, 61, 2460–2463. [Google Scholar] [CrossRef] [Scilit]
- Rees, S. Advances in Ground-Source Heat Pump Systems; Woodhead Publishing: Duxford, UK, 2016. [Google Scholar]
- Rabelo, S.N.; Paulino, T.F.; Machado, L.; Duarte, W.M. Economic analysis and design optimization of a direct expansion solar assisted heat pump. Sol. Energy 2019, 188, 164–174. [Google Scholar] [CrossRef] [Scilit]
- Shah, M.M. Improved correlation for heat transfer during condensation in mini and macro channels. Int. J. Heat Mass Transf. 2022, 194, 123069. [Google Scholar] [CrossRef] [Scilit]
- Rabelo, S.N.; Paulino, T.F.; Soares, C.P.; Duarte, W.M.; Machado, L.; Nunes, R.O. Mass flow characteristics of CO2 operating in a transcritical cycle flowing through a needle expansion valve in a direct-expansion solar assisted heat pump. J. Build. Eng. 2023, 67, 105963. [Google Scholar] [CrossRef] [Scilit]
- dos Santos, R.V.; Barbieri, P.E.L.; Duarte, W.M.; de Freitas Paulino, T. Comparative 4E analysis (energetic, exergetic, environmental and economic) between geothermal heat exchangers and cooling towers in large air conditioning systems in tropical climates. J. Build. Eng. 2025, 100, 111617. [Google Scholar] [CrossRef] [Scilit]
- Hu, H.; Wang, R.; Fang, G. Dynamic characteristics modeling of a hybrid photovoltaic–thermal heat pump system. Int. J. Green Energy 2010, 7, 537–551. [Google Scholar] [CrossRef] [Scilit]
- Chow, T.T.; Fong, K.; Pei, G.; Ji, J.; He, M. Potential use of photovoltaic-integrated solar heat pump system in Hong Kong. Appl. Therm. Eng. 2010, 30, 1066–1072. [Google Scholar] [CrossRef] [Scilit]
- Zhao, X.; Zhang, X.; Riffat, S.B.; Su, Y. Theoretical study of the performance of a novel PV/e roof module for heat pump operation. Energy Convers. Manag. 2011, 52, 603–614. [Google Scholar] [CrossRef] [Scilit]
- Ji, J.; Liu, K.; Chow, T.t.; Pei, G.; He, W.; He, H. Performance analysis of a photovoltaic heat pump. Appl. Energy 2008, 85, 680–693. [Google Scholar] [CrossRef] [Scilit]
- Ji, J.; He, H.; Chow, T.; Pei, G.; He, W.; Liu, K. Distributed dynamic modeling and experimental study of PV evaporator in a PV/T solar-assisted heat pump. Int. J. Heat Mass Transf. 2009, 52, 1365–1373. [Google Scholar] [CrossRef] [Scilit]
- Liang, R.; Wang, C.; Wang, P.; Zhao, L. Performance modeling and analysis of a PVT-HP system with the roll-bond plate as the evaporator during winter conditions. Appl. Therm. Eng. 2023, 224, 120102. [Google Scholar] [CrossRef] [Scilit]
- Zhang, S.; Guanb, X.; Guo, Z. Design and economic analysis of photovoltaic-double resource heat pump. Energy Procedia 2012, 16, 977–982. [Google Scholar] [CrossRef] [Scilit]
- Zhang, X.; Zhao, X.; Xu, J.; Yu, X.; Yu, X. Characterization of a solar photovoltaic/loop-heat-pipe heat pump water heating system. Appl. Energy 2013, 102, 1229–1245. [Google Scholar] [CrossRef] [Scilit]
- Tsai, H.L. Modeling and validation of refrigerant-based PVT-assisted heat pump water heating (PVTA-HPWH) system. Sol. Energy 2015, 122, 36–47. [Google Scholar] [CrossRef] [Scilit]
- Li, H.; Sun, Y. Operational performance study on a photovoltaic loop heat pipe/solar assisted heat pump water heating system. Energy Build. 2018, 158, 861–872. [Google Scholar] [CrossRef] [Scilit]
- Zanetti, E.; Azzolin, M.; Girotto, S.; Del Col, D. Performance and control of a CO2 dual source solar assisted heat pump with a photovoltaic-thermal evaporator. Appl. Therm. Eng. 2023, 218, 119286. [Google Scholar] [CrossRef] [Scilit]
- Sharma, D.K.; Vaishak, S.; Bhale, P.V.; Rathod, M.K. Analysis of water and refrigerant-based PV/T systems with double glass PV modules: An experimental and computational approach. Sol. Energy 2024, 268, 112296. [Google Scholar] [CrossRef] [Scilit]
- Kuang, Y.; Sumathy, K.; Wang, R. Study on a direct-expansion solar-assisted heat pump water heating system. Int. J. Energy Res. 2003, 27, 531–548. [Google Scholar] [CrossRef] [Scilit]
- Kong, X.; Zhang, D.; Li, Y.; Yang, Q. Thermal performance analysis of a direct-expansion solar-assisted heat pump water heater. Energy 2011, 36, 6830–6838. [Google Scholar] [CrossRef] [Scilit]
- Sun, L.; Mishima, K. An evaluation of prediction methods for saturated flow boiling heat transfer in mini-channels. Int. J. Heat Mass Transf. 2009, 52, 5323–5329. [Google Scholar] [CrossRef] [Scilit]
- Rohsenow, W.M.; Hartnett, J.P.; Cho, Y.I.; Ebadian, M.A.; Dong, Z.F. Handbook of Heat Transfer: Chapter 5—Forced Convection, Internal Flows; Mcgraw-Hill: New York, NY, USA, 1998; Volume 3. [Google Scholar]
- de Paula, C.H.; Duarte, W.M.; Rocha, T.T.M.; de Oliveira, R.N.; Maia, A.A.T. Energetic, Exergetic, Environmental, and Economic Assessment of a Cascade Refrigeration System Operating with Four Different Ecological Refrigerant Pairs. Int. J. Air-Cond. Refrig. 2021, 29, 2150025. [Google Scholar] [CrossRef] [Scilit]
- Roskosch, D.; Venzik, V.; Atakan, B. Thermodynamic model for reciprocating compressors with the focus on fluid dependent efficiencies. Int. J. Refrig. 2017, 84, 104–116. [Google Scholar] [CrossRef] [Scilit]
- Duarte, W.M.; Pabon, J.J.G.; Maia, A.A.T.; Machado, L. Nonisentropic phenomenological model of a reciprocating compressor. Int. J. Air-Cond. Refrig. 2019, 27, 1950039. [Google Scholar] [CrossRef] [Scilit]
- Meramveliotakis, G.; Kosmadakis, G.; Karellas, S. Methods based on a semi-empirical model for simulating scroll compressors with HFC and HFO refrigerants. Open Res. Eur. 2022, 1, 148. [Google Scholar] [CrossRef] [Scilit] [PubMed]
- Wan, H.; Cao, T.; Hwang, Y.; Chang, S.D.; Yoon, Y.J. Machine-learning-based compressor models: A case study for variable refrigerant flow systems. Int. J. Refrig. 2021, 123, 23–33. [Google Scholar] [CrossRef] [Scilit]
- Fonseca, V.D.; Duarte, W.M.; de Oliveira, R.N.; Machado, L.; Maia, A.A.T. Mass flow prediction in a refrigeration machine using artificial neural networks. Appl. Therm. Eng. 2022, 214, 118893. [Google Scholar] [CrossRef] [Scilit]
- Ferreira, G.H.D.P.; Martins, E.D.; de Moraes Ramiro, G.; Tomaz, J.G.L.; Roquette, P.H.O.; Duarte, W.M.; Maia, A.A.T. Prediction of compressor discharge temperature in transcritical CO2 refrigeration systems using Artificial Neural Networks. Appl. Therm. Eng. 2026, 283, 128981. [Google Scholar] [CrossRef] [Scilit]
- Kong, X.; Li, Y.; Lin, L.; Yang, Y. Modeling evaluation of a direct-expansion solar-assisted heat pump water heater using R410A. Int. J. Refrig. 2017, 76, 136–146. [Google Scholar]
- Kong, X.; Yan, X.; Yue, Z.; Zhang, P.; Li, Y. Influence of refrigerant charge and condenser area on direct-expansion solar-assisted heat pump system for radiant floor heating. Sol. Energy 2022, 247, 499–509. [Google Scholar]
- Santos, A.; Duarte, W.; Barbieri, P.; Machado, L.; Xu, T.; Paulino, T. Air Conditioning System Integrated with Thermal Energy Storage for Buildings in Tropical Climates. Processes 2024, 12, 2388. [Google Scholar] [CrossRef] [Scilit]
- Maia, A.; Koury, R.; Machado, L. Development of a control algorithm employing data generated by a white box mathematical model. Appl. Therm. Eng. 2013, 54, 120–130. [Google Scholar] [CrossRef] [Scilit]
- Chapra, S.C. Applied Numerical Methods with MATLAB for Engineers and Scientists; McGraw-Hill: New York, NY, USA, 2018. [Google Scholar]
- Laughman, C.R.; Qiao, H.; Aute, V.; Radermacher, R. A comparison of transient heat pump cycle models using alternative flow descriptions. Sci. Technol. Built Environ. 2015, 21, 666–680. [Google Scholar] [CrossRef] [Scilit]
- Paulino, T.F.; Oliveira, R.N.; Maia, A.A.T.; Palm, B.; Machado, L. Modeling and experimental analysis of the solar radiation in a CO2 direct-expansion solar-assisted heat pump. Appl. Therm. Eng. 2019, 148, 160–172. [Google Scholar] [CrossRef] [Scilit]
- Garcia, J.; Ali, T.; Duarte, W.M.; Khosravi, A.; Machado, L. Comparison of transient response of an evaporator model for water refrigeration system working with R1234yf as a drop-in replacement for R134a. Int. J. Refrig. 2018, 91, 211–222. [Google Scholar] [CrossRef] [Scilit]
- Duarte, W.M.; Paulino, T.F.; Tavares, S.G.; Cançado, K.N.; Machado, L. Comparative study of geothermal and conventional air conditioner: A case of study for office applications. J. Build. Eng. 2023, 65, 105786. [Google Scholar] [CrossRef] [Scilit]
- Li, W.; Chu, Y.; Xu, P.; Yang, Z.; Ji, Y.; Ni, L.; Bao, Y.; Wang, K. A transient model for the thermal inertia of chilled-water systems during demand response. Energy Build. 2017, 150, 383–395. [Google Scholar] [CrossRef] [Scilit]
- de Paula, C.H.; Duarte, W.M.; Rocha, T.T.M.; de Oliveira, R.N.; Maia, A.A.T. Optimal design and environmental, energy and exergy analysis of a vapor compression refrigeration system using R290, R1234yf, and R744 as alternatives to replace R134a. Int. J. Refrig. 2020, 113, 10–20. [Google Scholar] [CrossRef] [Scilit]
- Martins, L.V.; Braga, C.H.; Pabon, J.J.; Machado, L.; Duarte, W.M. Assessment of total equivalent warming impact (TEWI) of alternative refrigerants for retrofit of R22 in single split air conditioning system. J. Build. Eng. 2024, 88, 109085. [Google Scholar] [CrossRef] [Scilit]
- Esbrí, J.N.; Milián, V.; Mota-Babiloni, A.; Molés, F.; Verdú, G. Effect of mean void fraction correlations on a shell-and-tube evaporator dynamic model performance. Sci. Technol. Built Environ. 2015, 21, 1059–1072. [Google Scholar]
- Braga, C.H.; Martins, L.V.; Pabon, J.J.; Machado, L.; Duarte, W.M. Energetic, economic and environmental (3E) analysis of R290, R454C and R465A for drop-in split type air conditioning running on R22. Case Stud. Therm. Eng. 2025, 69, 105988. [Google Scholar] [CrossRef] [Scilit]
- Incropera, F.P.; DeWitt, D.P.; Bergman, T.L.; Lavine, A.S. Fundamentals of Heat and Mass Transfer; John Wiley & Sons: Hoboken, NJ, USA, 2007. [Google Scholar]
- Carvalho, F.N.; Pinto, G.H.M.; Machado, L.; Porto, M.P.; Maia, A.A.T.; Duarte, W.M. Performance evaluation of a direct expansion photovoltaic thermal solar assisted heat pump operating with refrigerants R134a and R290. In Proceedings of the 28th International Congress of Mechanical Engineering, Curitiba, Brazil, 9–14 November 2025. [Google Scholar]
- Shah, M.M. A general correlation for heat transfer during film condensation inside pipes. Int. J. Heat Mass Transf. 1979, 22, 547–556. [Google Scholar] [CrossRef] [Scilit]
- Dravid, A.N.; Smith, K.; Merrill, E.; Brian, P. Effect of secondary fluid motion on laminar flow heat transfer in helically coiled tubes. AIChE J. 1971, 17, 1114–1122. [Google Scholar] [CrossRef] [Scilit]
- Zivi, S.M. Estimation of steady-state steam void-fraction by means of the principle of minimum entropy production. J. Heat Transfer 1964, 86, 247–251. [Google Scholar] [CrossRef] [Scilit]
- Lemmon, E.W.; Bell, I.H.; Huber, M.L.; McLinden, M.O. NIST Standard Reference Database 23: Reference Fluid Thermodynamic and Transport Properties-REFPROP, Version 10.0; National Institute of Standards and Technology: Boulder, CO, USA, 2018.
- Bell, I.H.; Wronski, J.; Quoilin, S.; Lemort, V. Pure and Pseudo-pure Fluid Thermophysical Property Evaluation and the Open-Source Thermophysical Property Library CoolProp. Ind. Eng. Chem. Res. 2014, 53, 2498–2508. [Google Scholar]
- Ghoubali, R.; Byrne, P.; Miriel, J.; Bazantay, F. Simulation study of a heat pump for simultaneous heating and cooling coupled to buildings. Energy Build. 2014, 72, 141–149. [Google Scholar] [CrossRef] [Scilit]
- Botticella, F.; Viscito, L. Seasonal performance analysis of a residential heat pump using different fluids with low environmental impact. Energy Procedia 2015, 82, 878–885. [Google Scholar] [CrossRef] [Scilit]
- Palm, B. Hydrocarbons as refrigerants in small heat pump and refrigeration systems–a review. Int. J. Refrig. 2008, 31, 552–563. [Google Scholar]
- Chaichana, C.; Aye, L.; Charters, W.W. Natural working fluids for solar-boosted heat pumps. Int. J. Refrig. 2003, 26, 637–643. [Google Scholar] [CrossRef] [Scilit]
- Hawlader, M.; Chou, S.; Ullah, M. The performance of a solar assisted heat pump water heating system. Appl. Therm. Eng. 2001, 21, 1049–1065. [Google Scholar] [CrossRef] [Scilit]
- Deng, W.; Yu, J. Simulation analysis on dynamic performance of a combined solar/air dual source heat pump water heater. Energy Convers. Manag. 2016, 120, 378–387. [Google Scholar] [CrossRef] [Scilit]
- Lazzarin, R.M. Dual source heat pump systems: Operation and performance. Energy Build. 2012, 52, 77–85. [Google Scholar] [CrossRef] [Scilit]
- Reis, R.d.M.; Maia, A.A.; Machado, L.; Koury, R.N. Comparative study between a heat pump and an electrical resistance as energy support for a solar water heater. Adv. Mater. Res. 2014, 1016, 748–752. [Google Scholar] [CrossRef] [Scilit]
- Chaturvedi, S.; Gagrani, V.; Abdel-Salam, T. Solar-assisted heat pump—A sustainable system for low-temperature water heating applications. Energy Convers. Manag. 2014, 77, 550–557. [Google Scholar]
- INMET. Brazilian National Institute of Meteorology Website. 2024. Available online: https://bdmep.inmet.gov.br/ (accessed on 5 November 2025).
- Electricitymaps. 2025. Available online: https://app.electricitymaps.com/ (accessed on 1 November 2025).
- Ritchie, H.; Rosado, P. Electricity Mix. Our World in Data. 2025. Available online: https://ourworldindata.org/electricity-mix (accessed on 7 November 2025).
- Santos, J.; Cataldi, M.; Herzog, M.; Pereira, E. Comparação econômica entre o sistema de refrigeração fotovoltaico por compressão de vapor e chillers de absorção com coletores solares térmicos. In Proceedings of the CBENS 2018: VII Congresso Brasileiro de Energia Solar; ABENS: Porto Alegre, Brazil, 2018. [Google Scholar]
- ASHARE. ASHRAE Fundamentals Handbook, SI ed.; American Society of Heating and Air-Conditioning Engineers: Peachtree Corners, GA, USA, 2021. [Google Scholar]
- Abbasi, B.; Li, S.; Mwesigye, A. Investigation of the thermodynamic performance of a direct-expansion solar-assisted heat pump under very cold climatic conditions with and without glazing. Int. J. Refrig. 2024, 158, 329–344. [Google Scholar]
- Li, S.; Li, S.; Zhang, X. Comparison analysis of different refrigerants in solar-air hybrid heat source heat pump water heater. Int. J. Refrig. 2015, 57, 138–146. [Google Scholar] [CrossRef] [Scilit]
- Reis, H.O.; Paulino, T.F.; Machado, L.; Maia, A.A.; Duarte, W.M. Optimal high-pressure correlation for transcritical CO2 cycle in direct expansion solar assisted heat pumps. J. Build. Eng. 2024, 97, 110616. [Google Scholar] [CrossRef] [Scilit]
- Humia, G.M.; Machado, L.; de Freitas Paulino, T.; Maia, A.A.; Duarte, W.M. Solar irradiation and refrigerant charge effects on performance of direct expansion solar assisted heat pumps using CO2 transcritical cycle. Appl. Therm. Eng. 2025, 267, 125725. [Google Scholar] [CrossRef] [Scilit]
- Kumar, S.; Tiwari, G. Life cycle cost analysis of single slope hybrid (PV/T) active solar still. Appl. Energy 2009, 86, 1995–2004. [Google Scholar] [CrossRef] [Scilit]
- Raghuraman, B.; Lakshman, V.; Kuitche, J.; Shisler, W.; TamizhMani, G.; Kapoor, H. An overview of SMUD’s outdoor photovoltaic test program at Arizona State University. In Proceedings of the 2006 IEEE 4th World Conference on Photovoltaic Energy Conference; IEEE: New York, NY, USA, 2006; Volume 2, pp. 2214–2216. [Google Scholar]

Disclaimer/Publisher’s Note: The statements, opinions and data contained in all publications are solely those of the individual author(s) and contributor(s) and not of MDPI and/or the editor(s). MDPI and/or the editor(s) disclaim responsibility for any injury to people or property resulting from any ideas, methods, instructions or products referred to in the content. |
© 2026 by the authors. Licensee MDPI, Basel, Switzerland. This article is an open access article distributed under the terms and conditions of the Creative Commons Attribution (CC BY) license.