


Abstract
Songliao Basin hosts abundant shale oil and gas resources, yet the phase behavior of the fluids is still unclear since the confinement effect of the shale reservoir alters the adsorption effect on the pore walls. In this study, molecular dynamics (MD) simulations were employed to clarify this issue. A binary mixture was built to represent Gulong shale oil and the phase state properties under the confinement effect were evaluated. In addition, a series of pure alkane models were constructed to analyze the influence of hydrocarbon type, temperature, and mineral composition on phase behavior. The simulation results showed that the typical Gulong shale fluid remains liquid state in the nanopores. Owing to the confinement effect, both viscosity and density under nano space decrease sharply compared to those at bulk space. Therefore, field development should somewhat rely on high-pressure stimulation to create flow paths, followed by CO2 huff-and-puff technology to maintain production pressure. In addition, fluid composition, temperature, and mineral type are the primary factors governing the magnitude of the confinement effect.
1. Introduction
China holds vast unconventional oil and gas resources of about 28.3 billion tons, mainly located at the Songliao, Junggar, Bohai Bay, and Ordos basins. These resources are regarded as a strategic buffer for national energy security [1,2,3,4]. Gulong shale oil, which is well-known due to its high gas–oil ratio, abundant light hydrocarbons, low viscosity, and low density, has attracted extensive research interest. The fluid is largely confined to nanopores with throat radii ranging from 10 nm to 50 nm [5,6]; thus, conventional laboratory tests cannot accurately determine the in situ phase properties [7].
In recent years, molecular dynamics (MD) simulation has been widely applied in nanoscale research. Xue et al. [8] used MD simulations to study the adsorption behavior of different hydrocarbons (including asphaltenes) in shale oil mixtures within shale slits. Their findings indicate that injecting CO2 into the shale formations can facilitate shale oil extraction, particularly enhancing the recovery of medium components. Fang et al. [9] combined MD simulations with the composite stacking effect to investigate the occurrence state of shale oil. Their results reveal an uneven density distribution of octane within the reservoir, exhibiting multilayer adsorption. It is also found that the total adsorption amount of shale oil remains unchanged even though the pore size increases, mainly impacting the first adsorption layer. Zhang et al. [10] employed MD simulations to examine the adsorption behavior of shale oil in kerogen. They found that increasing temperature promotes a more uniform distribution of hydrocarbons, and the surface roughness of kerogen influences the overall adsorption capacity of shale oil components. Zhang and Lu [11] analyzed the transport properties and interfacial effects of shale oil components at nanoscale. They demonstrated that both elevated temperature and larger pore sizes can enhance shale oil transport efficiency, while increasing driving pressure only modifies interfacial effects with limited improvement in overall efficiency. Although scholars have conducted extensive research using molecular dynamics, studies on the confinement effects of nanopores on crude oil phase behavior remain scarce.
Nanopore can result in the confinement effect due to interfacial tension and fluid–solid coupling effects, primarily exhibiting a high adsorbed ratio of fluid [12,13]. An increased adsorption ratio alters the arrangement patterns and composition of fluid components, leading to deviations in fluid phase properties compared to those in the bulk phase. Therefore, it is imperative to clarify the influence of nanopore confinement effects on fluid phase behavior to provide theoretical support for the design of shale resource development strategies. In this study, the technology of molecular dynamics (MD) simulation was first employed to design a binary mixture fluid. Subsequently, the variation patterns of the phase behavior parameters within various pore channels were investigated. In addition, the variation characteristics of the saturation pressure of alkane molecules at nanoscale were examined. Lastly, the relationships between bubble point pressure, reservoir pressure, and initial saturation pressure were obtained, which lays a foundation for establishing a full-region phase behavior mathematical model.
2. Molecular Dynamics Model
2.1. Model Building
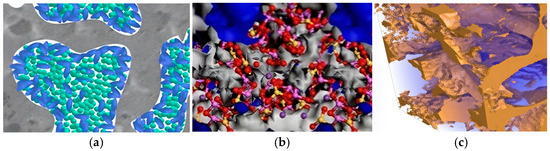
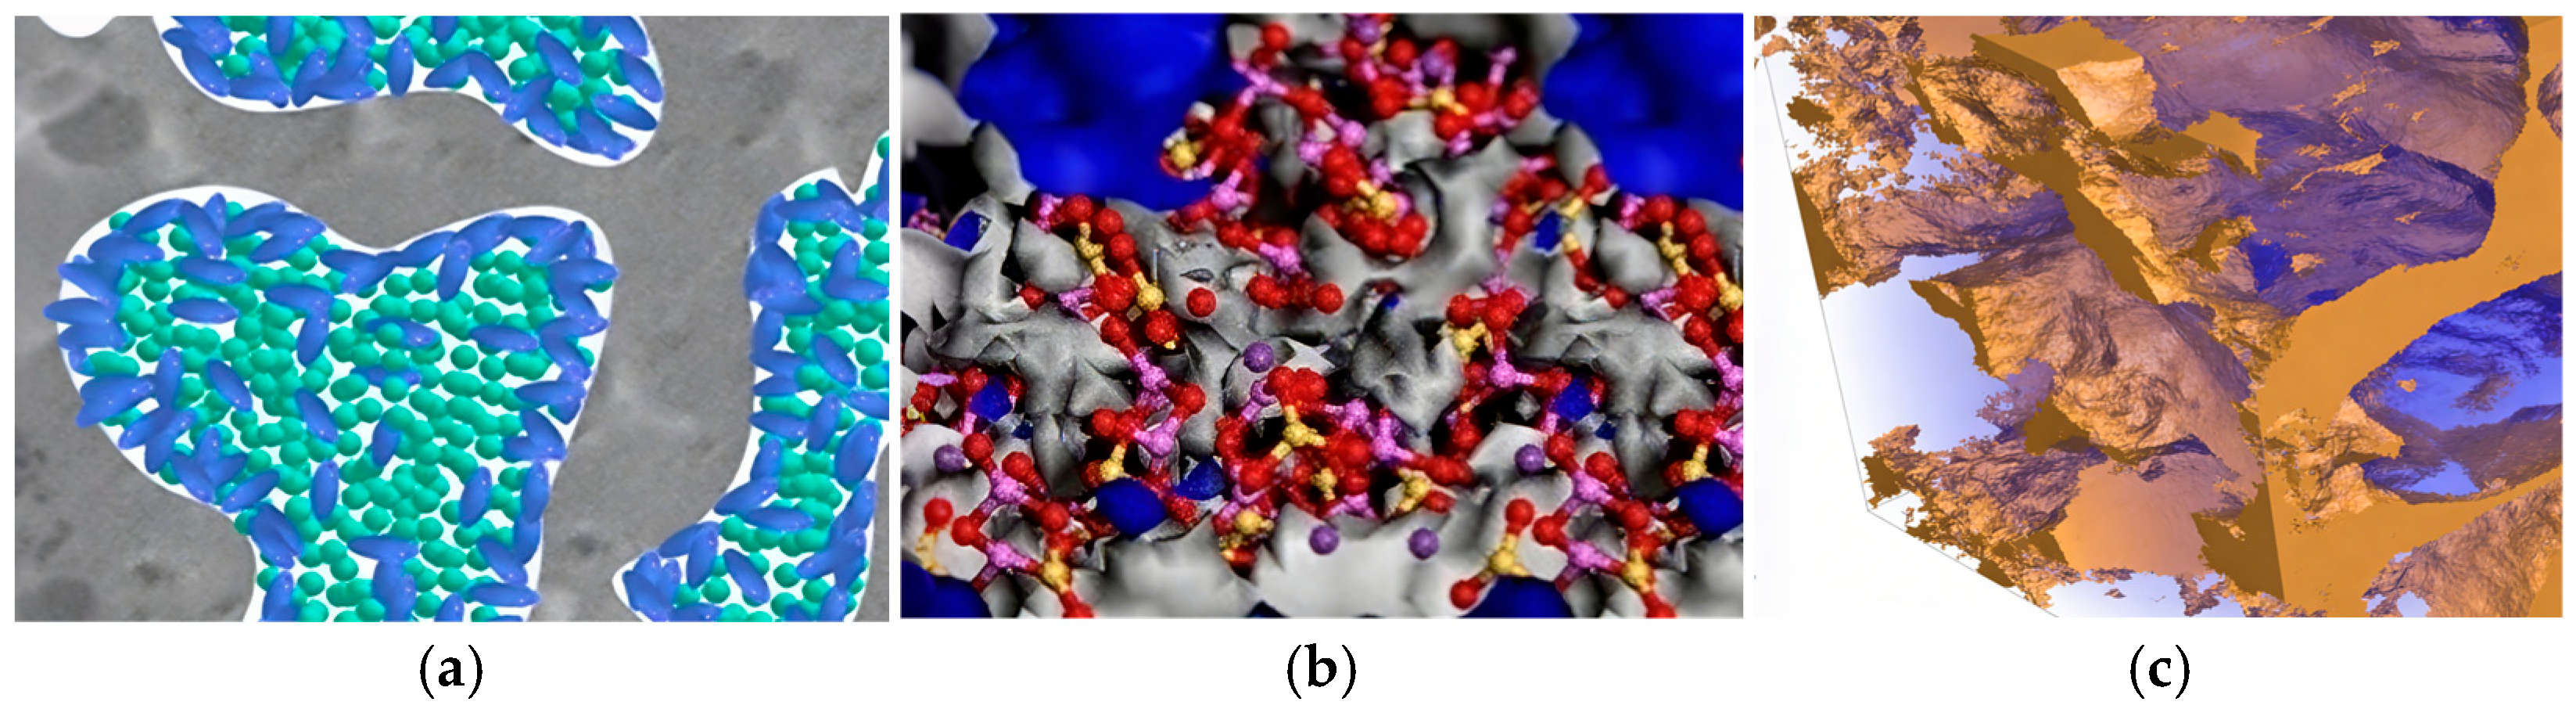
Based on Density Functional Theory (DFT), key parameters such as molecular bonds and atomic charges of Gulong shale oil were obtained. The study revealed that a binary mixture (CH4:C10H22 = 1:4) exhibits properties similar to Gulong shale oil. Therefore, a molecular cluster of this binary mixture was constructed to simulate Gulong shale oil. Although actual reservoir fluid contains complex heavy components (e.g., resins and asphaltenes), this binary mixture serves as a representative proxy model to capture the primary phase behavior mechanisms under confinement. Considering the effects of fluid–solid coupling and shale adsorption, a flexible molecular model was employed. The force field was described using a combination of Lennard–Jones and Coulombic potentials to evaluate intermolecular interactions and the influence of atomic vibrations on the crude oil (Figure 1).
Figure 1.
Schematic diagram illustrating the factors influencing oil–gas phase behavior. (a) Fluid solid interaction; (b) Desorption effect; (c) Geometric dimensions.
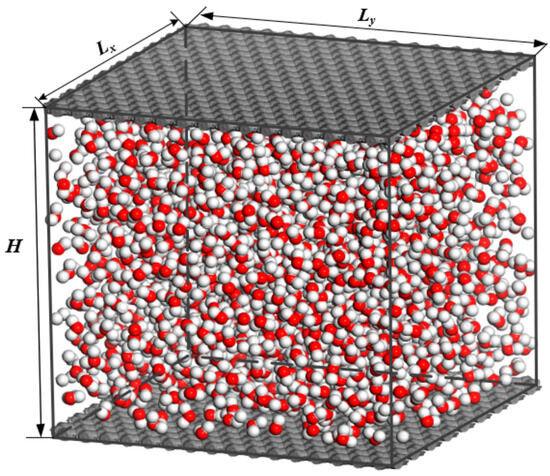
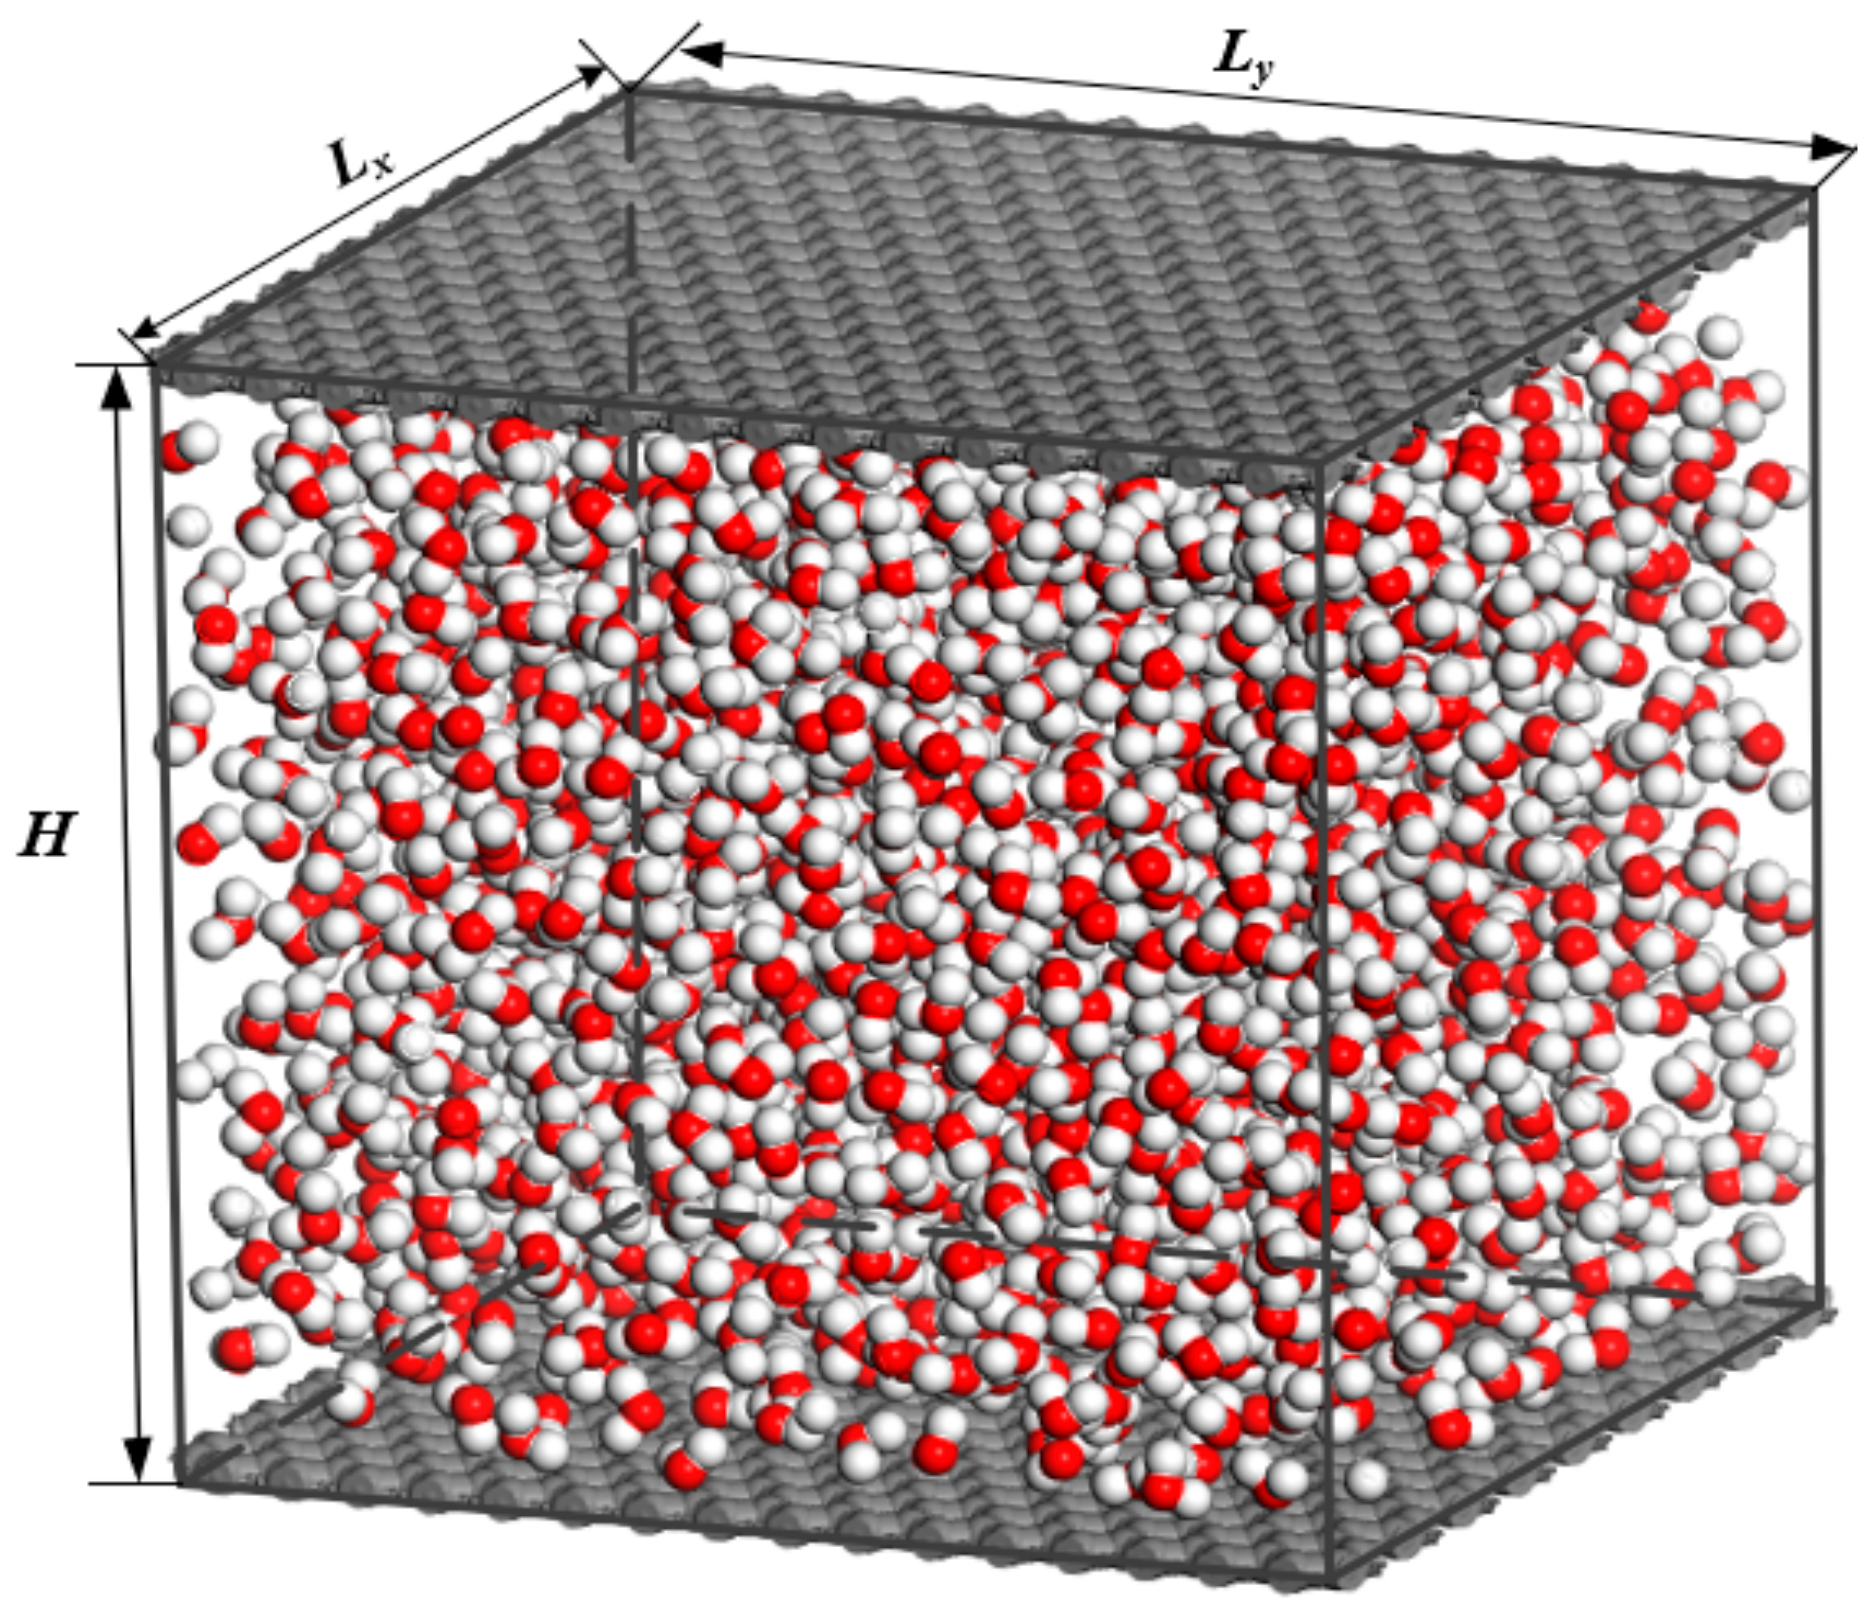
Given the extreme complexity of the chemical composition of shale organic matter, which makes its molecular-scale structural characterization challenging, researchers commonly use graphene to represent shale organic matter [14,15,16]. Accordingly, a seven-layer graphene structure was adopted to model the shale solid wall, with all layers maintained parallel to ensure that the wall thickness exceeds the cutoff radius of the force field. The constructed formation fluid was then embedded into a rectangular organic simulation box to establish a molecular model to represent the occurrence of alkanes within organic nanopores. By analyzing parameters such as mass distribution and energy profiles of oil and gas in various micro–nano channels, key fluid phase behavior parameters were obtained. A molecular-scale model that was used to illustrate the oil and gas phase state parameters is presented in Figure 2.
Figure 2.
Molecular-scale representation of oil–gas phase behavior parameters.
2.2. Simulation Implementation and Parameter Analysis
2.2.1. Simulation Setup and Protocols
All molecular dynamics (MD) simulations were performed using the Large-scale Atomic/Molecular Massively Parallel Simulator (LAMMPS, version 28 March 2023, Sandia National Laboratories, Albuquerque, NM, USA). The simulation system was first equilibrated in the NVT ensemble for 2 ns to ensure thermodynamic stability, followed by a production run of 10 ns with a time step of 1 fs. Temperature and pressure were controlled using the Nosé–Hoover thermostat and barostat. To handle intermolecular interactions accurately, the Particle–Particle Particle–Mesh (PPPM) method was employed for long-range electrostatic interactions, while a cutoff radius of 10 Å was applied for short-range van der Waals forces. To ensure the statistical reliability of the results and minimize the impact of thermal noise, each data point reported in this study represents the average of ten independent simulation runs.
Density
The density profile was calculated using the formula proposed by Wang [17]. Along the direction perpendicular to the solid wall surfaces, the micro–nanopore was divided into Ns units, each with a thickness of 0.02 nm. The position of the particles within each unit was determined using Equation (1).
For the nth unit, the average fluid density from time step Js to Je is given by ρ in Equation (2):
where A is the area of the element, is the thickness of the element, and Wi is the weight of particle i.
Viscosity
In MD simulation, viscosity can be calculated through various methods, including the Green–Kubo relation [18], non-equilibrium molecular dynamics (NEMD) [19], the Einstein relation [20], Stokes–Einstein [21], and the Poiseuille flow method. Given that shale oil is a complex multi-component fluid exhibiting non-Newtonian behavior, the NEMD method (Equation (3)) was selected for the viscosity calculation in this study.
where viscosity (η) is defined as the ratio of shear stress (τ) to shear rate ().
2.3. Model Validation
Based on this model, ten independent phase behavior simulations were conducted for the binary mixture fluid in macropores, and the average value was taken as the molecular simulation result of the fluid phase behavior parameters under this condition. Meanwhile, a high-pressure high-temperature (HPHT) fluid phase behavior experiment was performed using a crude oil sample of the same composition under identical parameters. As shown in Table 1, the experimental results exhibit a 92.64% agreement with the simulation data, demonstrating the reliability of the force field parameters used in the model. This confirms the applicability of the model for simulating oil and gas phase behavior in various micro- and nanoscale channels.
Table 1.
Comparison of saturation pressure experimental data (PVT) and molecular simulation results.
3. Results and Discussion
3.1. Influence of Nanopore Size on Key Phase State Parameters
3.1.1. Saturation Pressure
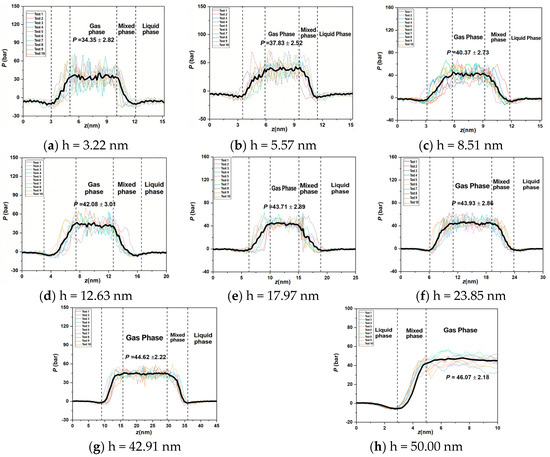
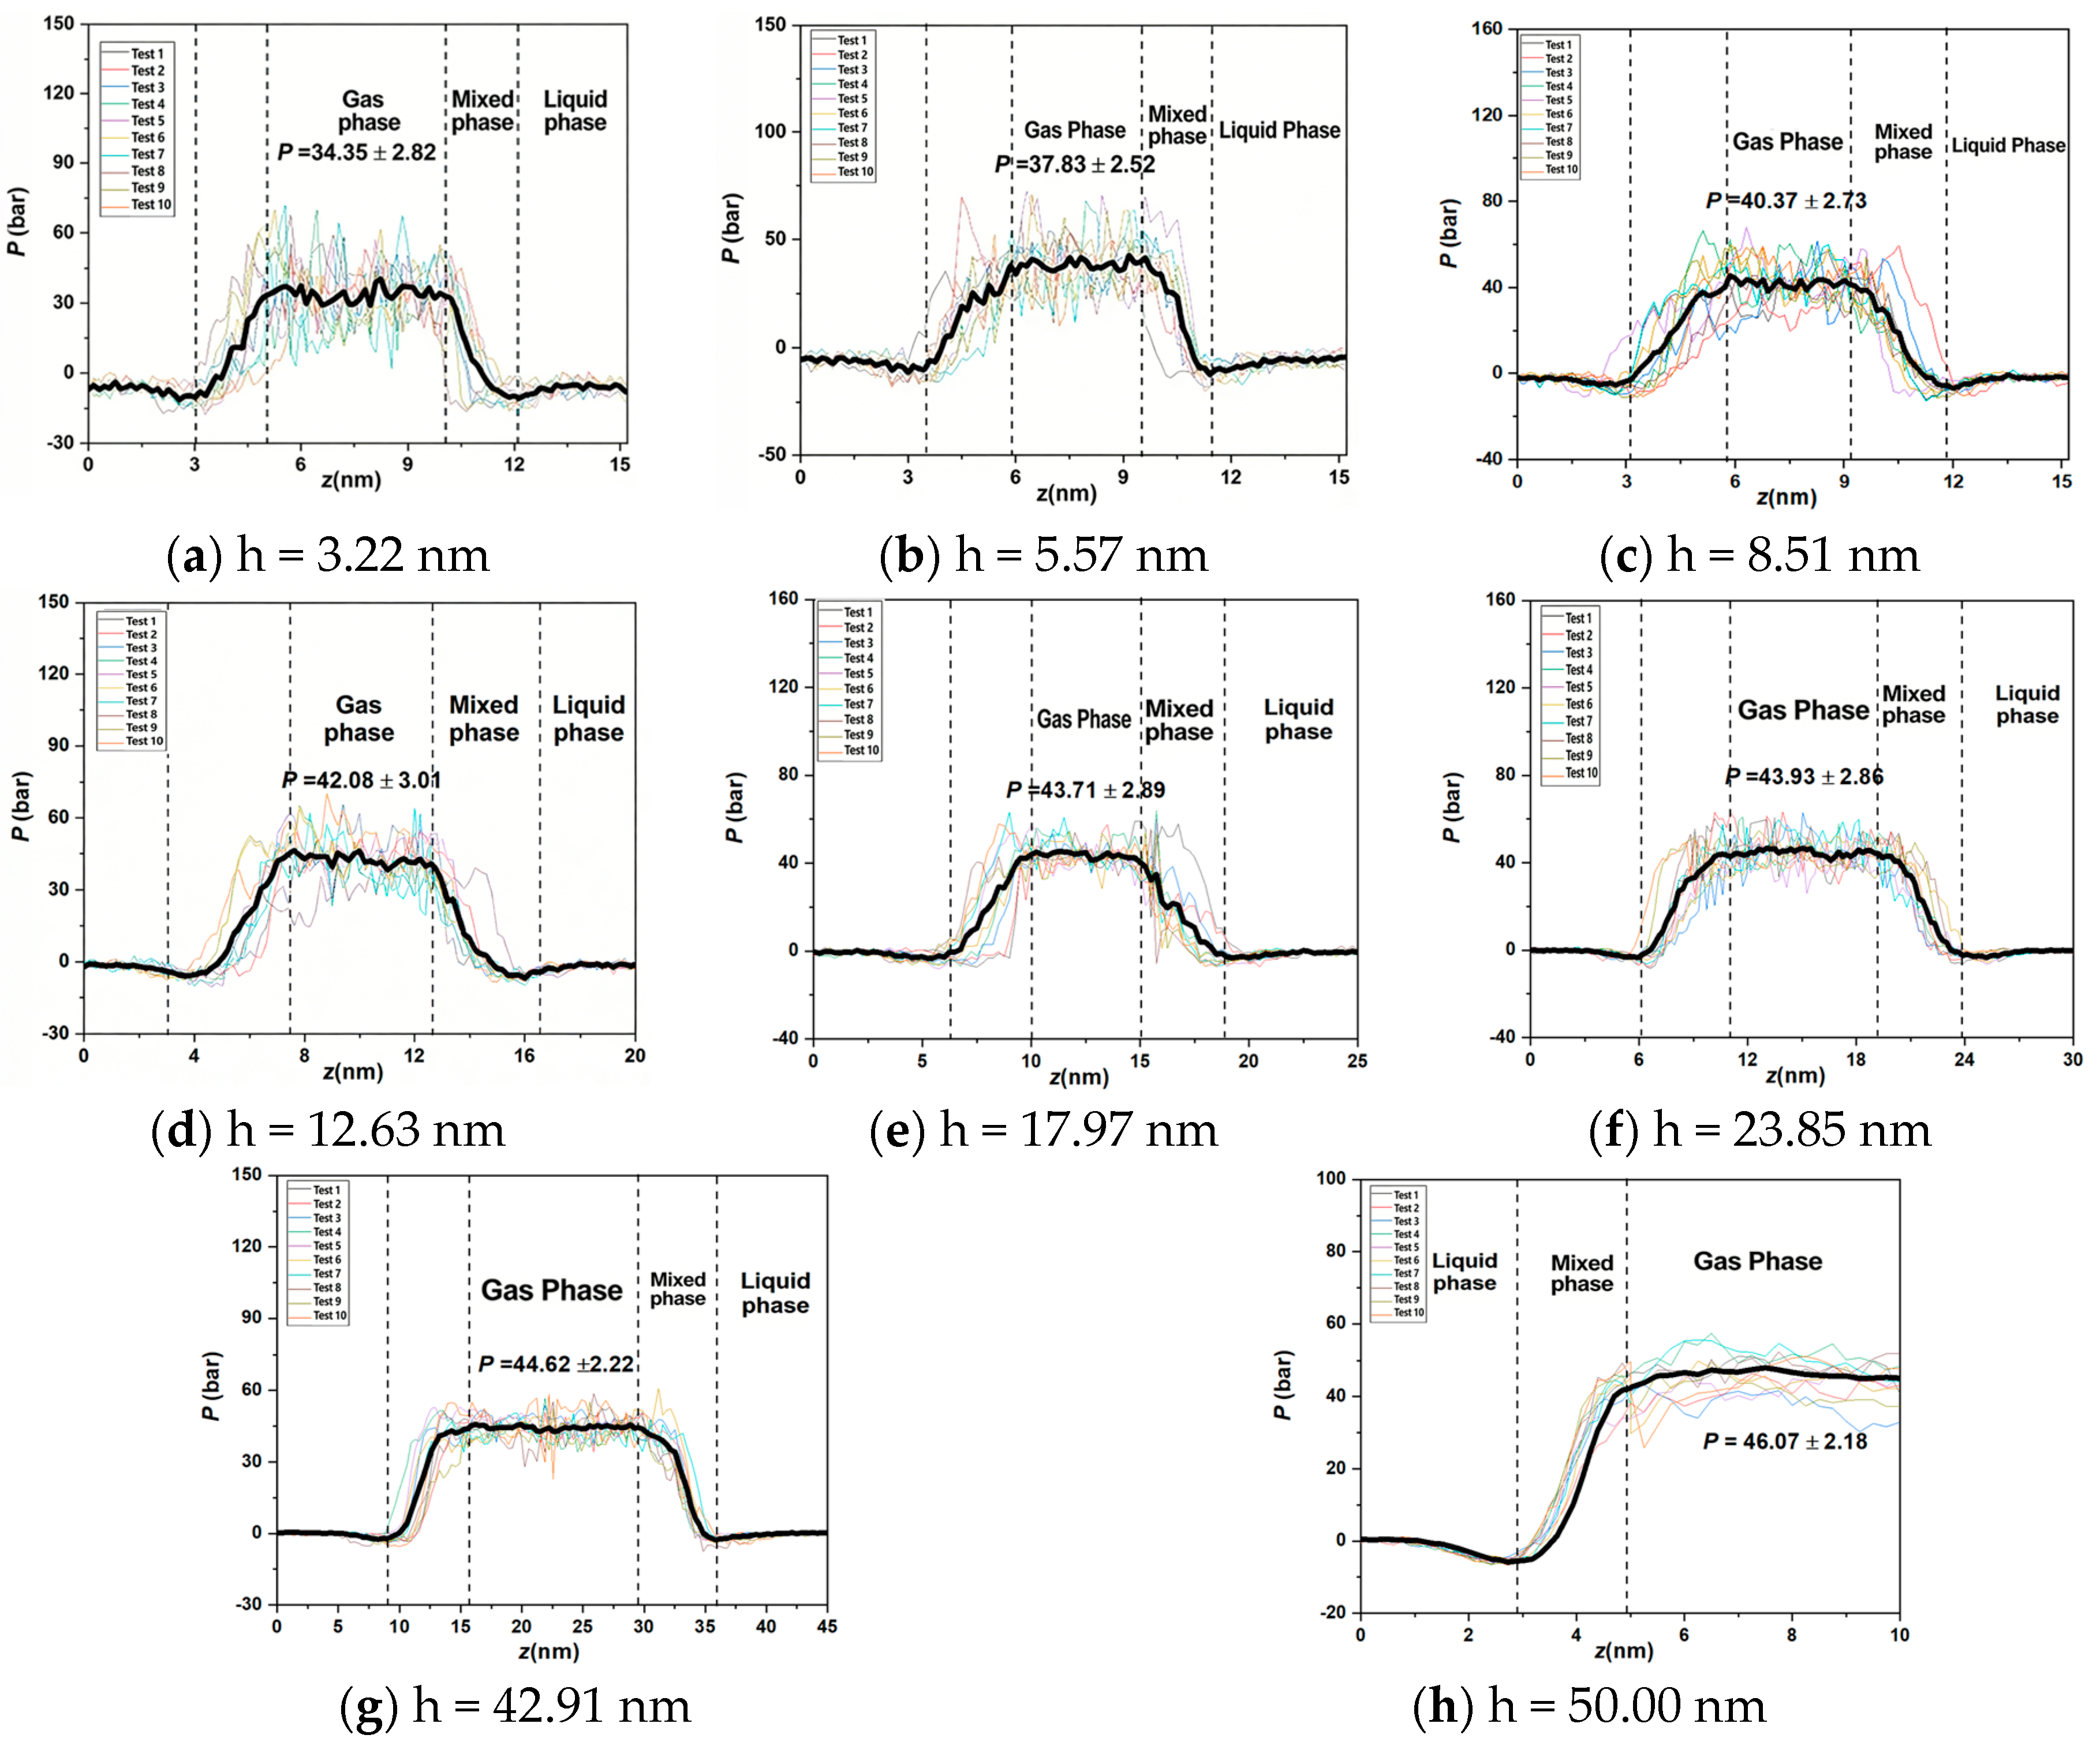
To investigate the influence of the confinement effect on phase behavior, simulations of the binary mixture fluid were performed in various micro- and nanoscale channels. In this section, only the saturation pressure simulation results for eight pore sizes that are no larger than 50 nm are shown in Figure 3 below. It can be found that the simulation curves obtained from pore channels in the range of 3.22 nm and 42.91 nm exhibit similar shapes, which have a noticeable abnormal trend compared to that in Figure 3h. This is possibly due to the confinement effect on nanopores.
Figure 3.
Characteristics of phase change for different pore radii, h = the pore-throat radius.
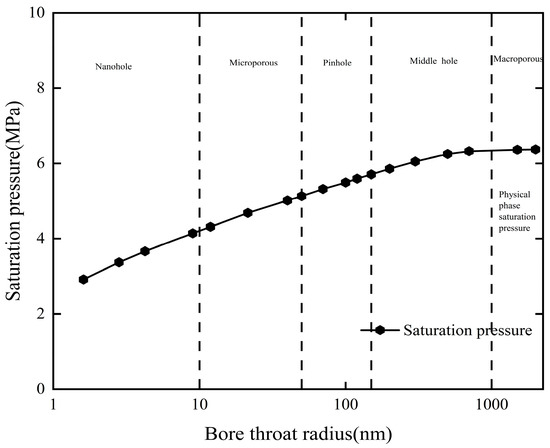
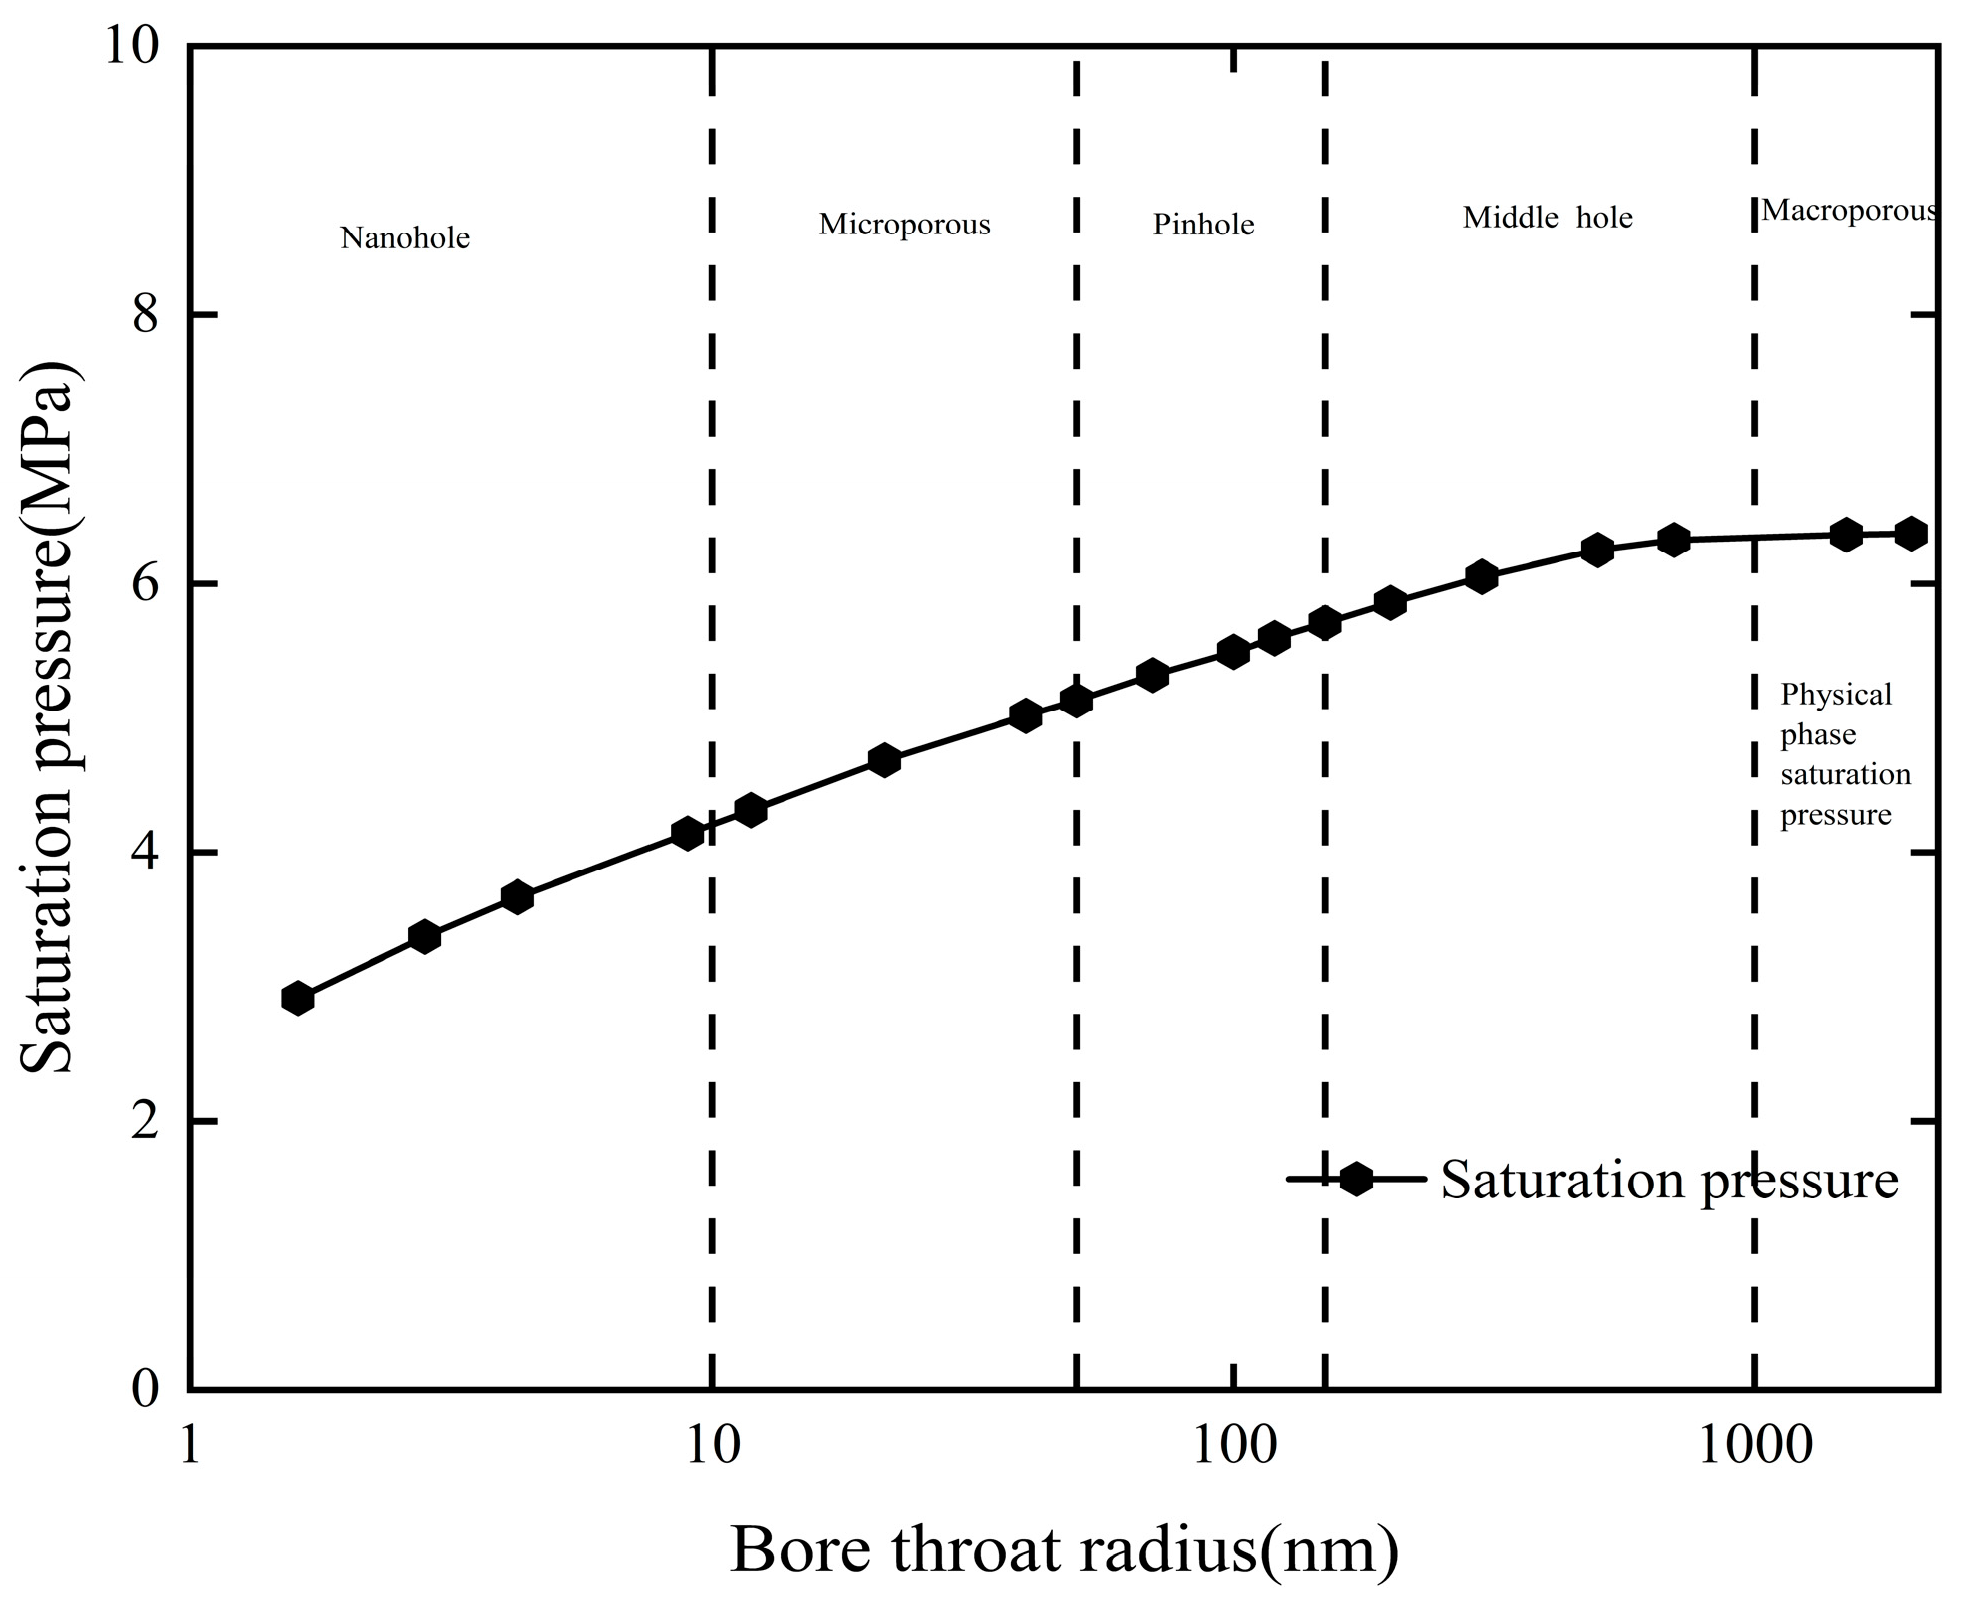
By utilizing simulation results from pore sizes ranging from 1 to 2000 nm, a correlation chart between pore radius and fluid saturation pressure was established, as shown in Figure 4. In nanopores (1–10 nm), the saturation pressure increased from 2.92 MPa to 4.30 MPa; in micropores (10–50 nm), it rose from 4.30 MPa to 5.13 MPa; in small pores (50–150 nm), it increased from 5.13 MPa to 5.71 MPa; and in mesopores (150–1000 nm), it climbed from 5.71 MPa to 6.36 MPa. At the scale of 10 nm, the bubble point pressure changed abruptly, with a deviation of up to 45%. Overall, as the pore radius decreases, the saturation pressure gradually decreases. By comparing the declining trends of saturation pressure across different pore sizes, it is observed that the confinement effect becomes progressively more pronounced. This leads to the conclusion that the smaller pore radius can lead to a larger magnitude of the confinement effect.
Figure 4.
Plate of pore radius versus fluid bubble point pressure.
Based on this finding, the previously reported laboratory-measured bulk-phase experimental results for Gulong shale oil from our research group were recalibrated. The authors had previously conducted related studies using microfluidic experiments, and detailed results can be found elsewhere [22]. The study revealed that the saturation pressure of Gulong shale is consistently lower than the reservoir pressure. Therefore, the Gulong shale oil exists primarily as a liquid within the reservoir, which is consistent with earlier conclusions, as shown in Table 2. It is further inferred that during future development, shale oil in mesopores and macropores will preferentially evolve into a two-phase state due to degassing, while the remaining hydrocarbon resources in the tight oil and nanopores will maintain a single-phase condition.
Table 2.
Fluid bulk-phase bubble point pressure in typical wells of Gulong Shale and bubble point pressure under pore-limiting domain effect (50 nm).
3.1.2. Density and Viscosity
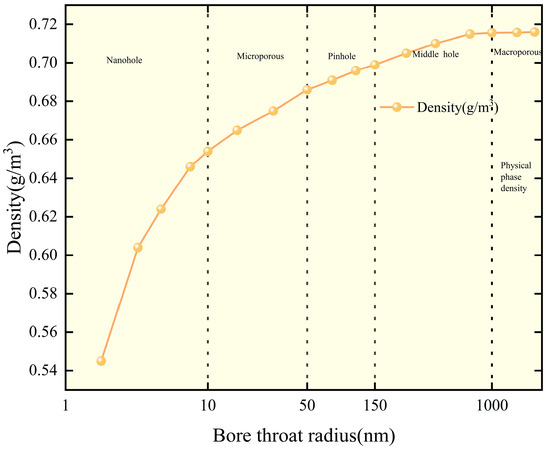
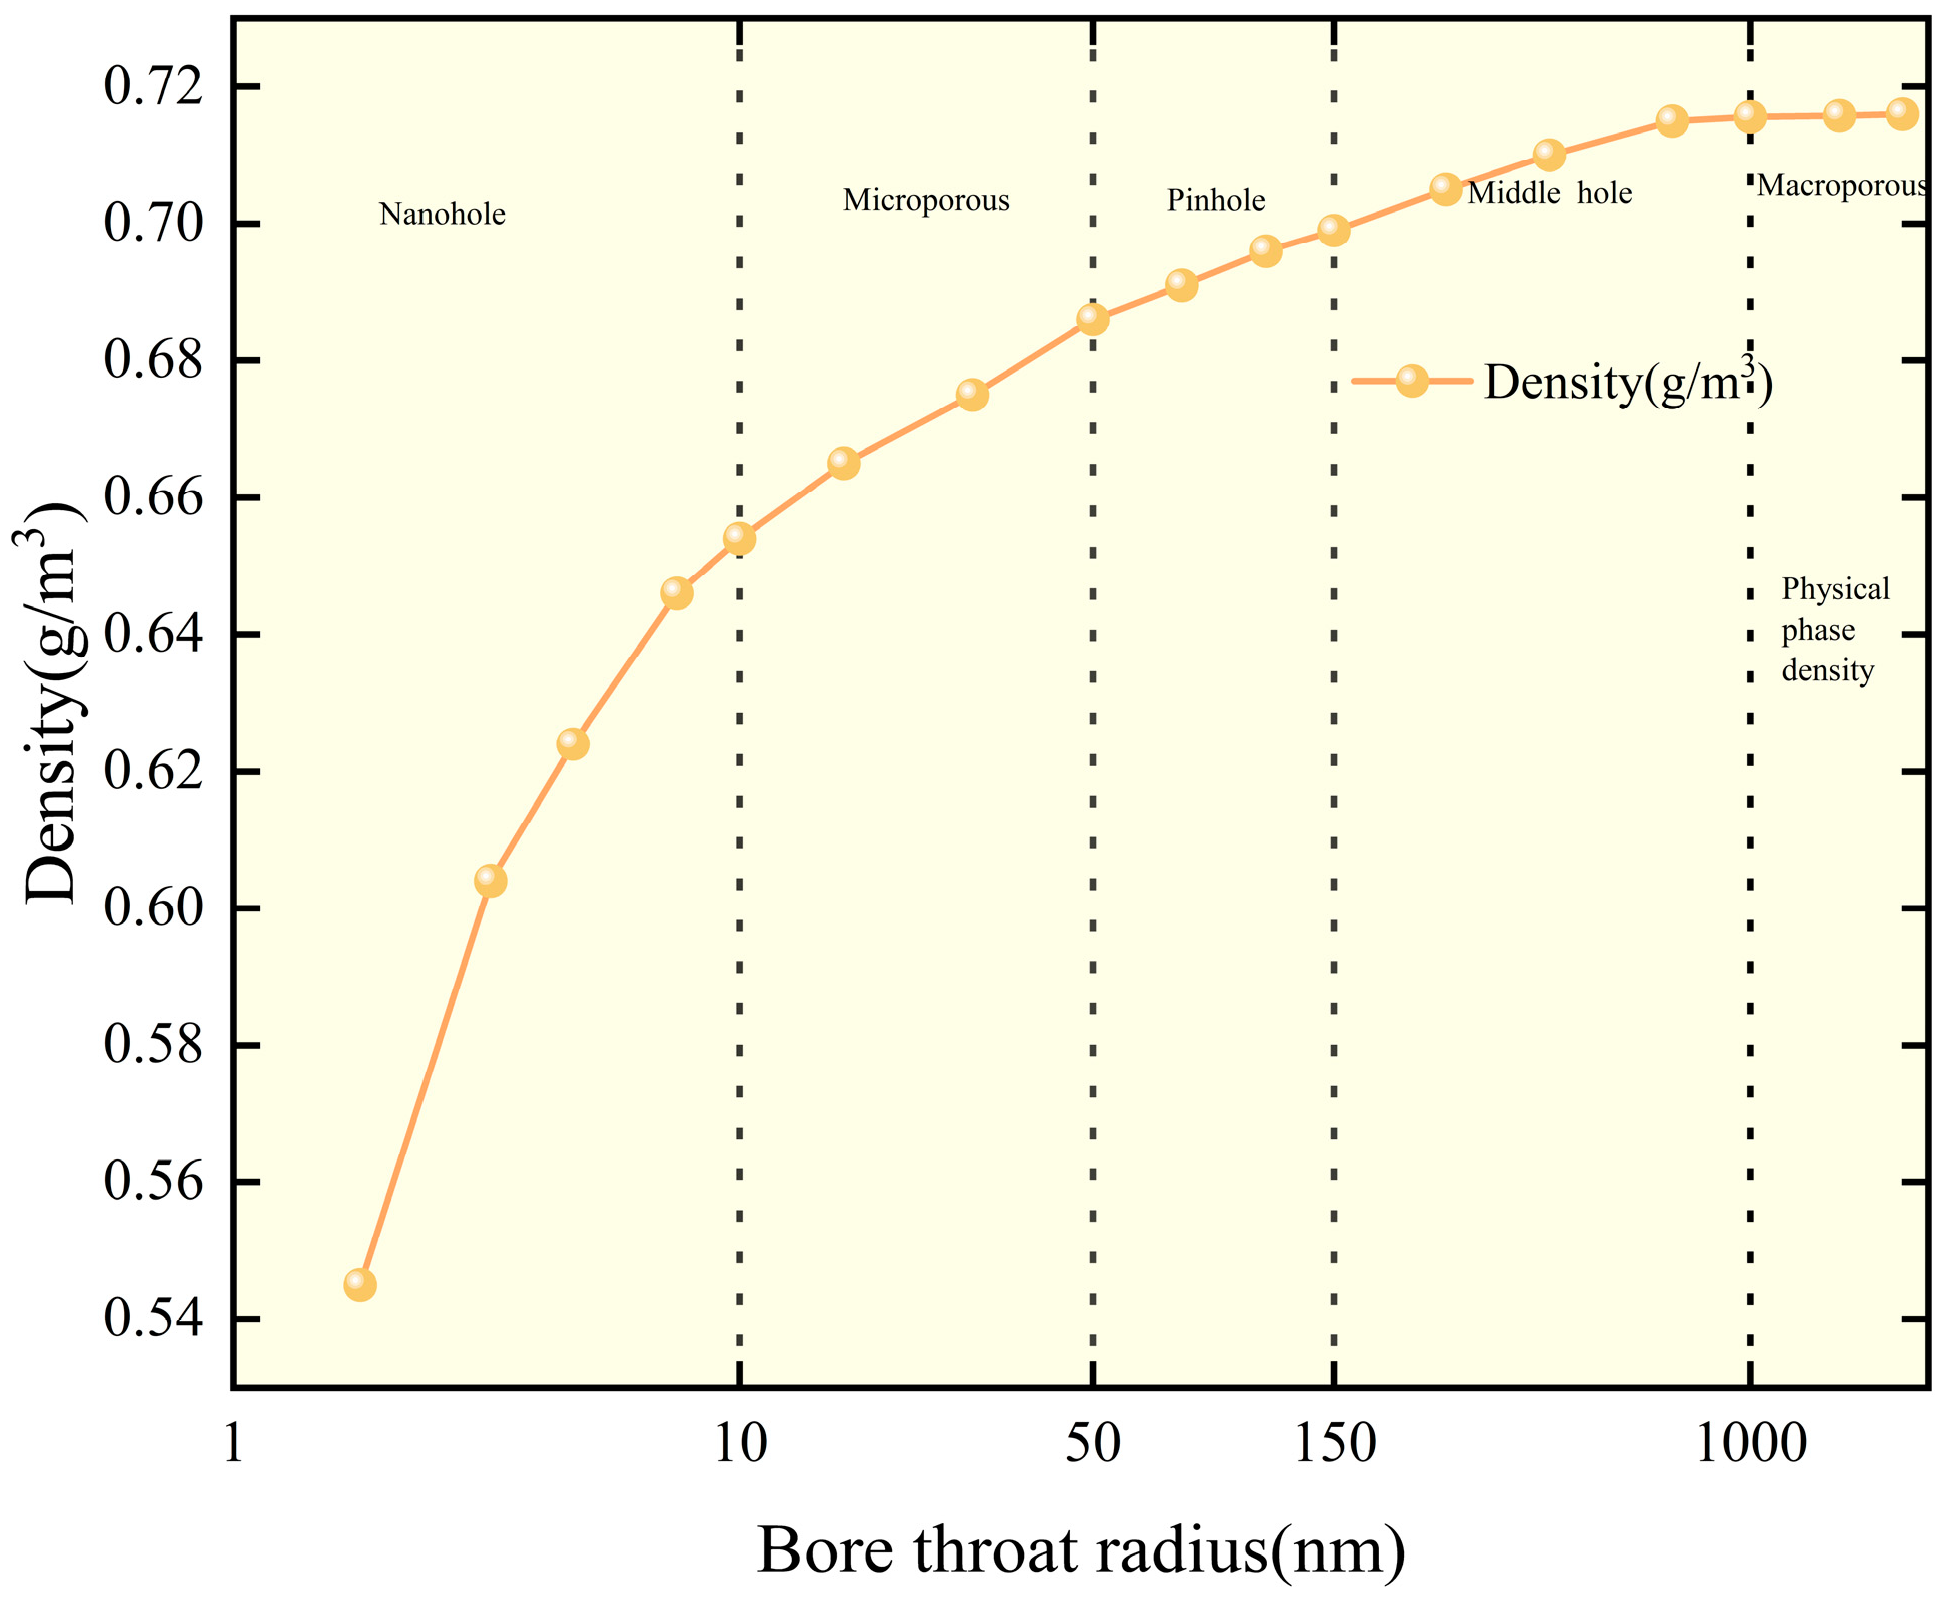
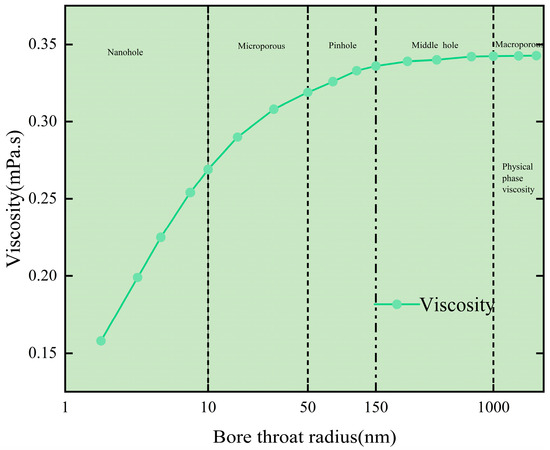
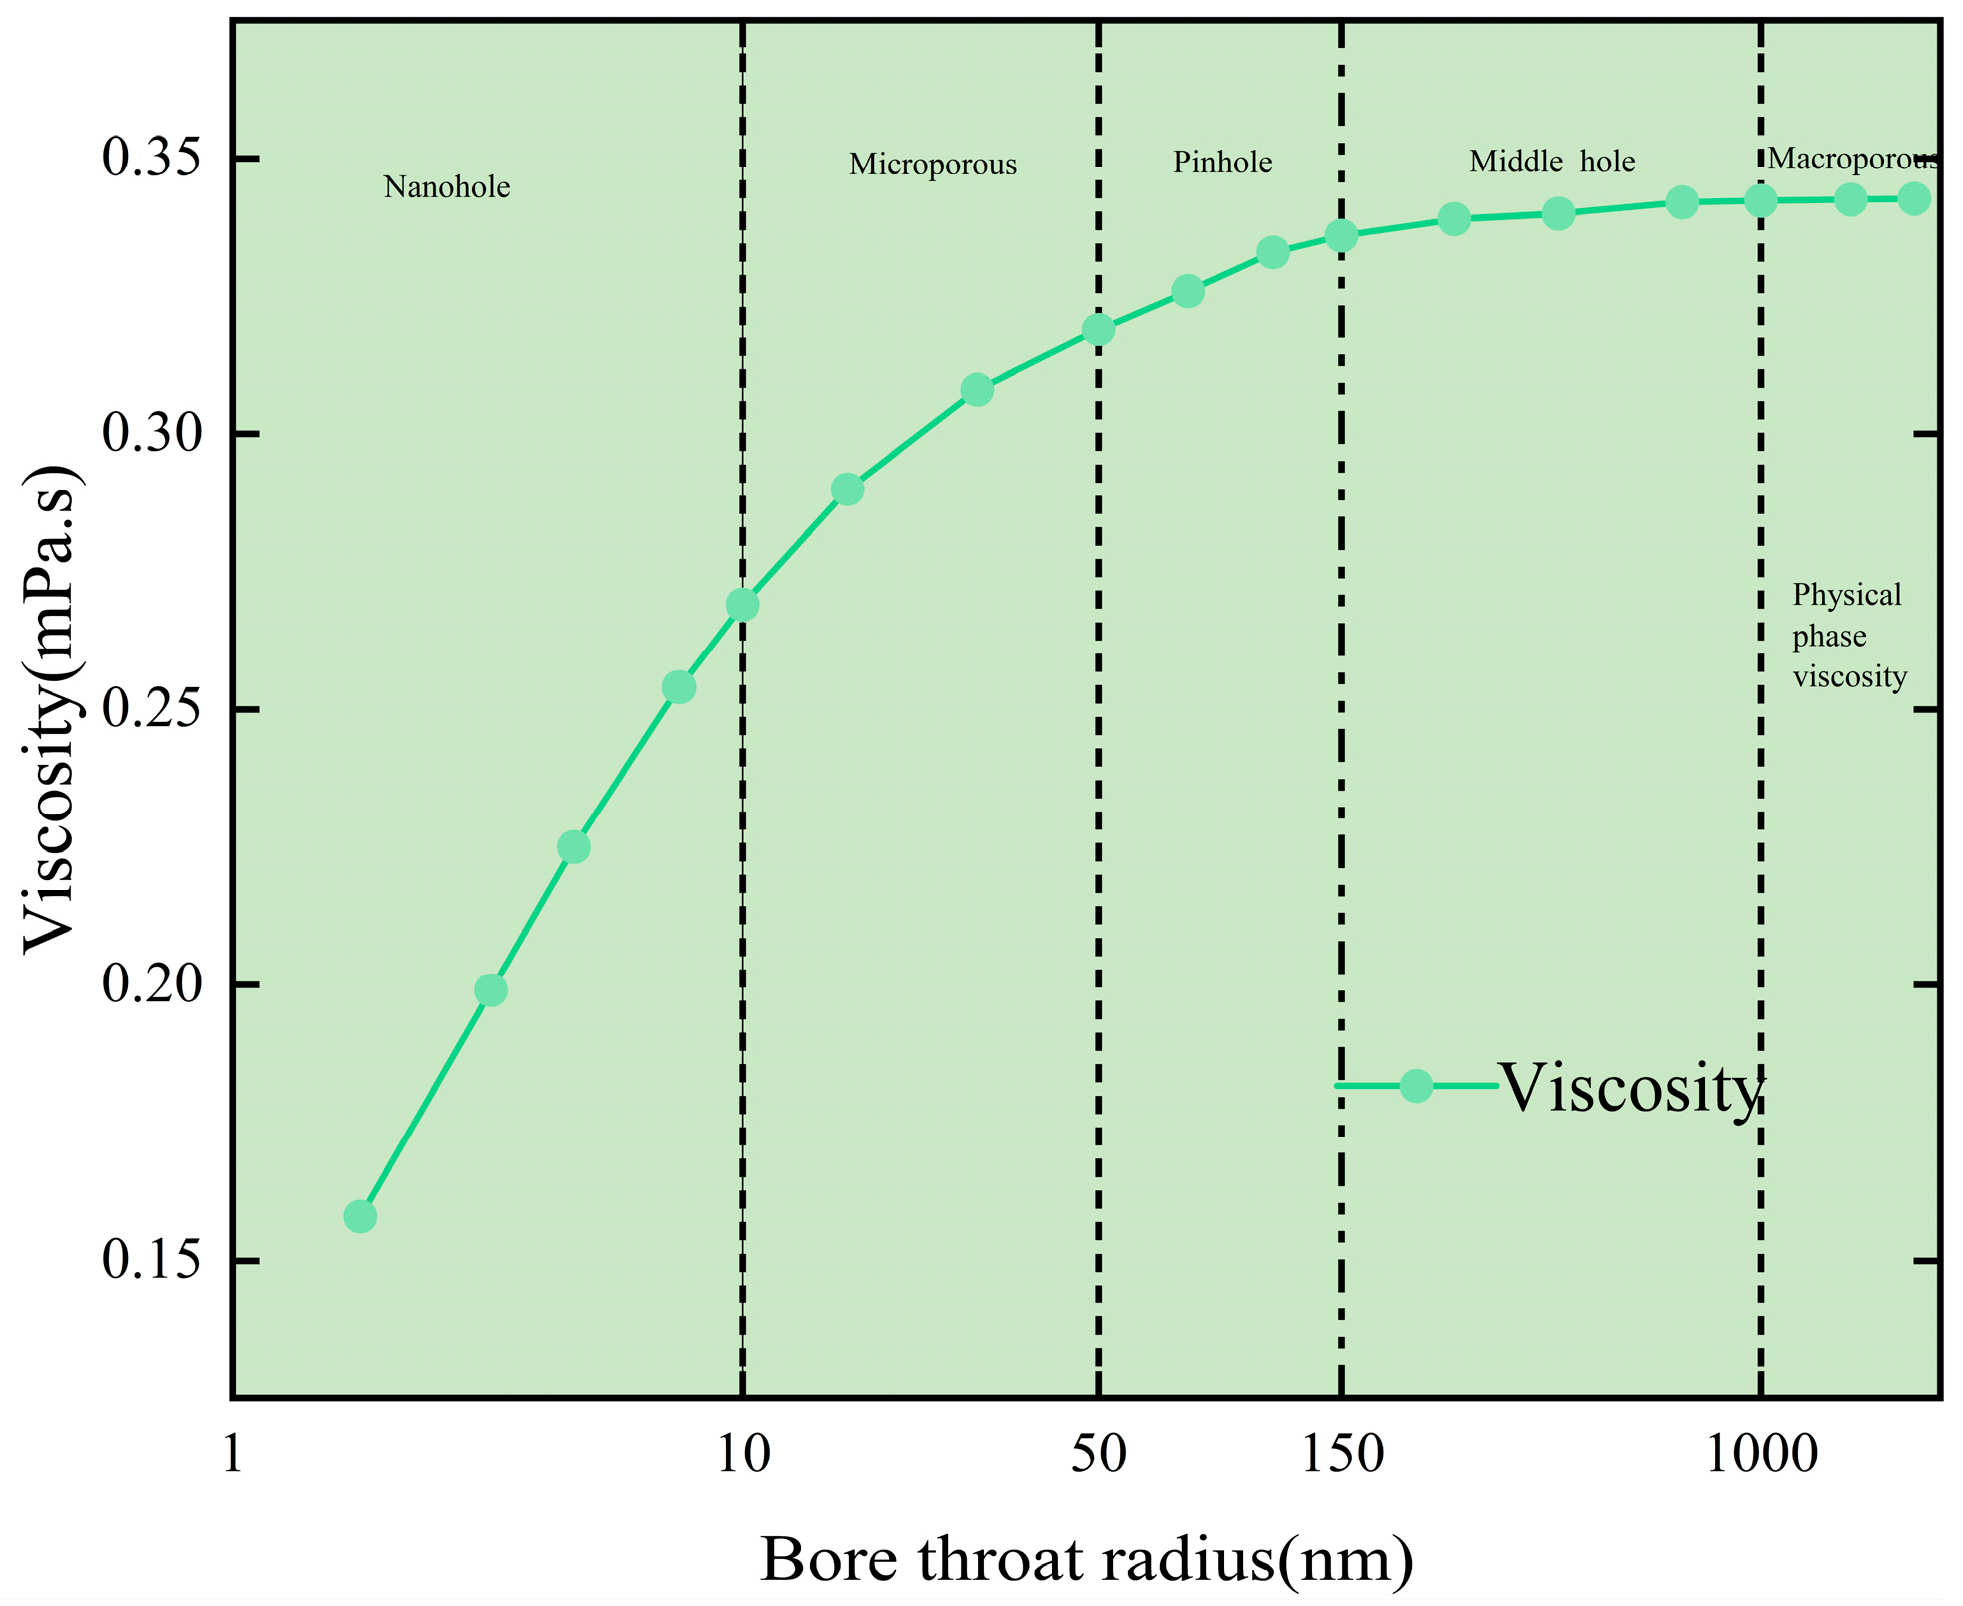
To investigate the impact of pore-scale confinement effects on the density and viscosity of formation fluids, an evaluation of crude oil density and viscosity was conducted at pore scale from 1 nm to 2000 nm. As shown in Figure 5 and Figure 6, both density and viscosity exhibit a positive correlation with pore size. The deviation in density reaches up to 23.88%, while that in viscosity is as high as 53.90%.
Figure 5.
Plate of pore radius versus fluid density.
Figure 6.
Plate of pore radius versus fluid viscosity.
Shale reservoirs are characterized by tight lithology, which hinders effective fluid migration. Hydraulic fracturing is typically employed to enhance fluid flow pathways. Once shale oil enters the main flow channels, the weakening of pore confinement effects leads to an increase in density and viscosity. Furthermore, the development of formation fluids involves a process of continuous pressure depletion. When pressure falls below the saturation pressure, light components of the shale oil can volatilize while heavy components can deposit, resulting in further increases in fluid density and viscosity, which adversely affect production efficiency. Additionally, previous research [23] has shown that shale has a stronger adsorption capacity for CO2 than CH4. Injecting CO2 can facilitate the desorption of light components from shale wall.
Based on the above analysis, this study recommends enhancing seepage channels in Gulong shale through high-pressure fluid stimulation and implementing CO2 injection for pressure-maintained production.
3.2. Influencing Factors of Phase State Parameters of Pure Hydrocarbons
3.2.1. Alkane Type
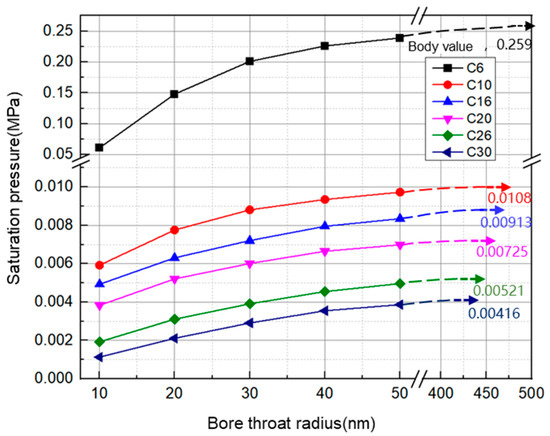
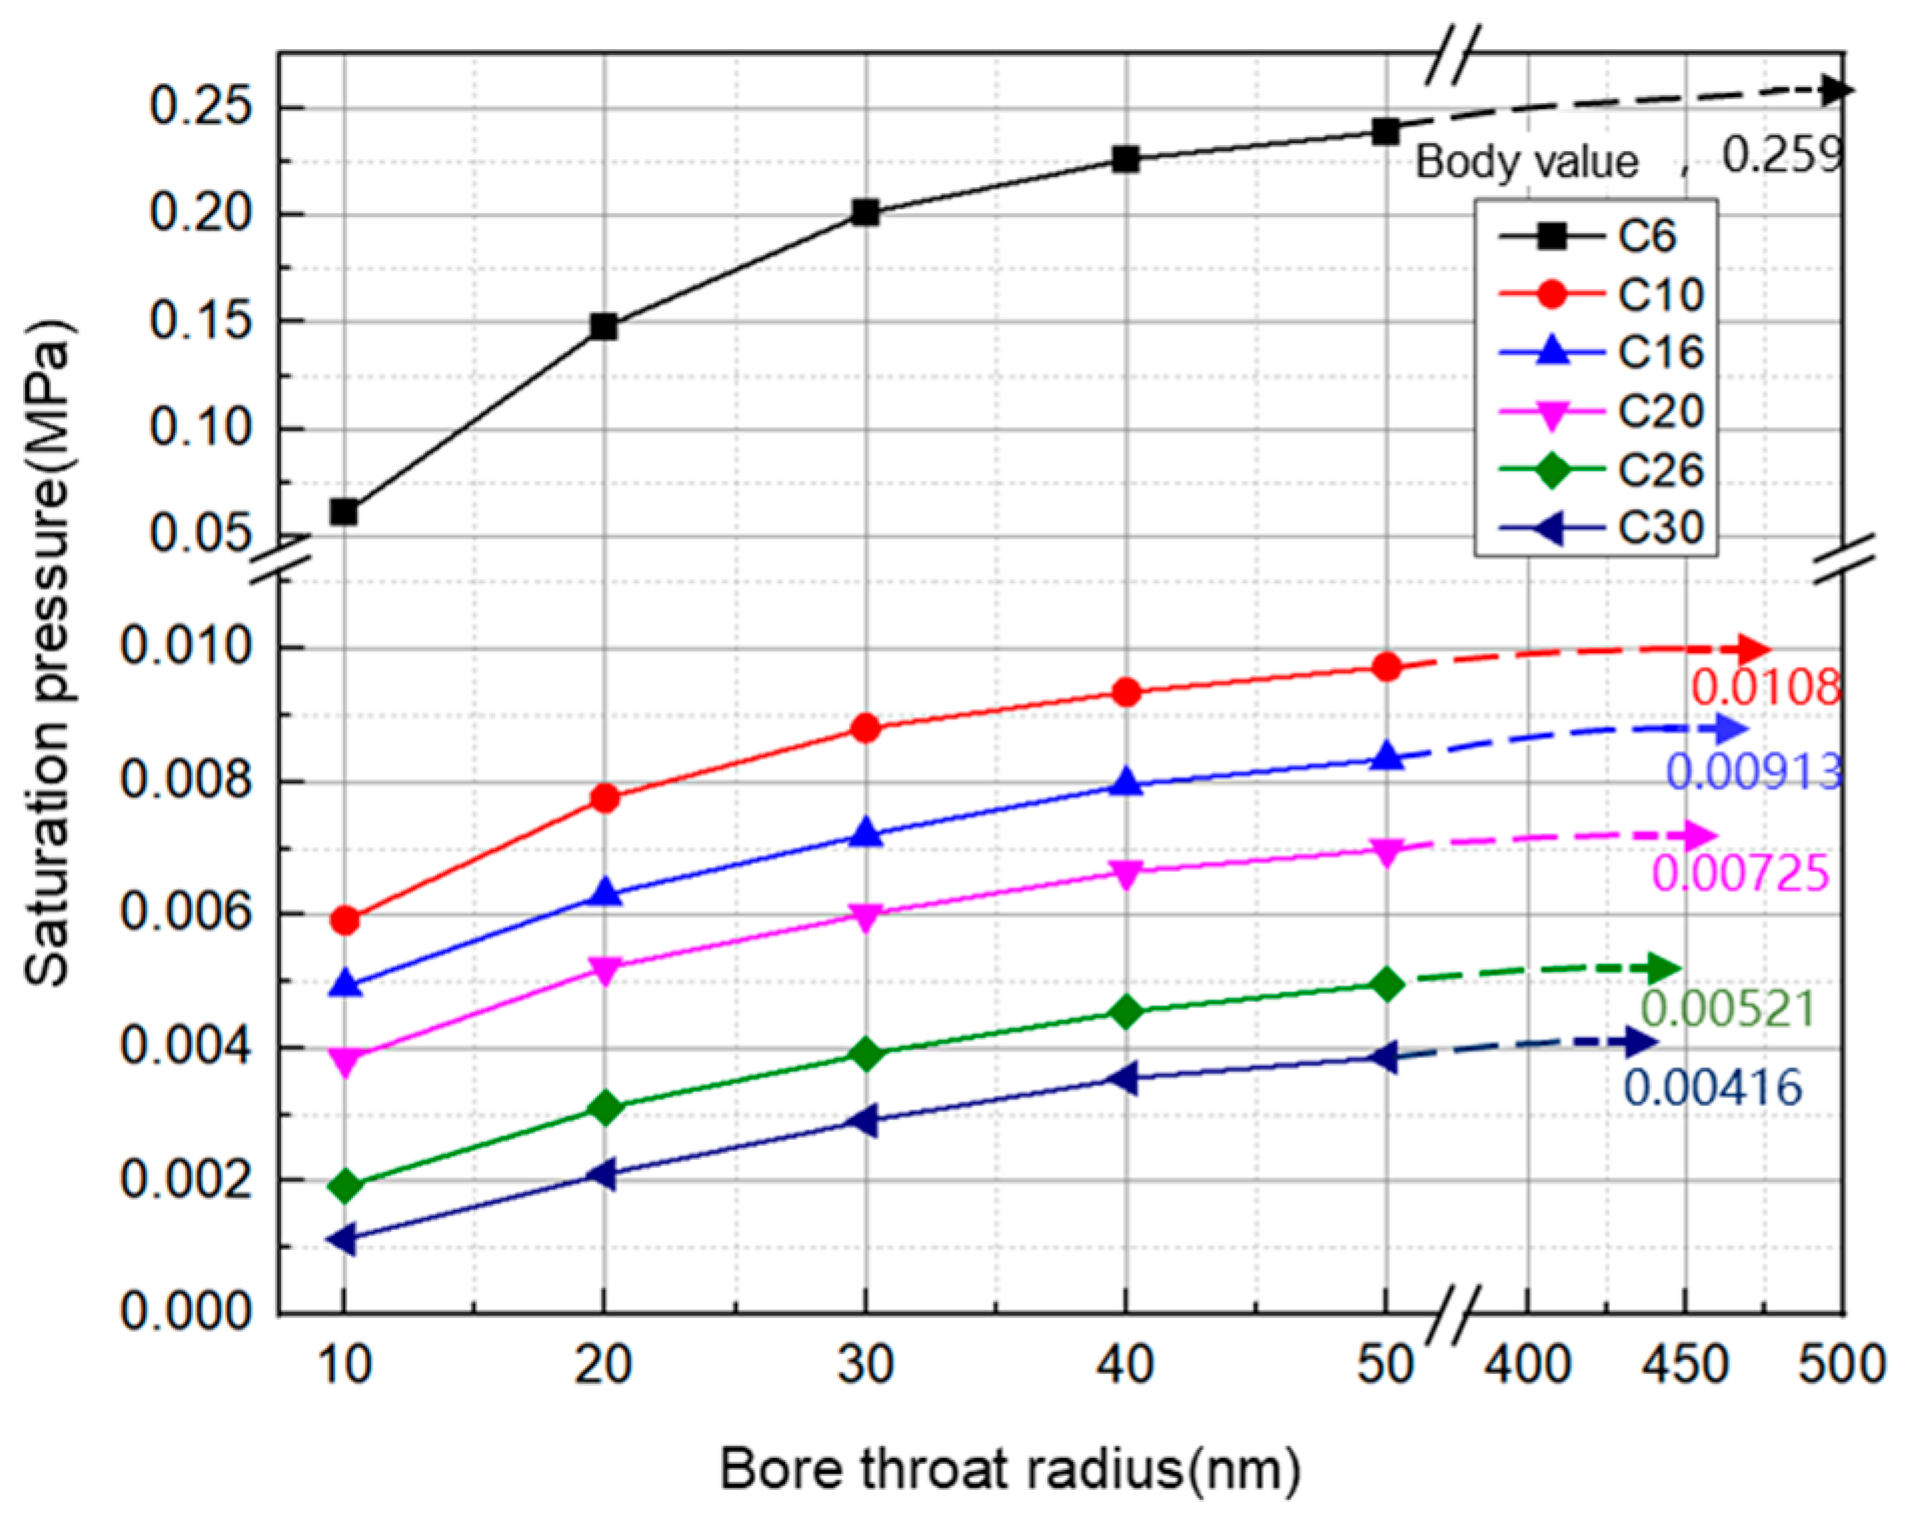
To clarify the influence of confinement effects on the saturation pressure of alkanes with different molecular weights, typical alkane molecules including C6H14, C10H22, C16H34, C20H42, C26H54, and C30H62 were modeled, and the simulation results are presented in Figure 7. Overall, the saturation pressure increases with increasing pore size, though the rate of increase gradually slows until it stabilizes at the bulk-phase value.
Figure 7.
Curve of alkane bubble point versus alkane type (100 °C).
The saturation pressure of C6H14 in nanopores is 63.06 Pa, compared to a bulk value of 259 Pa, representing a deviation of 75.65%. For C10H22, the values are 5.96 Pa in nanopores and 10.8 Pa in the bulk phase, with a deviation of 44.84%. Similarly, C16H34 alkane shows values of 4.92 Pa in nanopores and 9.13 Pa in the bulk phase (deviation: 46.17%); C20H42 alkane shows values of 3.85 Pa in nanopores and 7.25 Pa in the bulk phase (deviation: 46.88%); C26H54 alkane shows values of 1.94 Pa in nanopores and 5.21 Pa in the bulk phase (deviation: 62.83%); and C30H62 alkane shows values of 1.13 Pa in nanopores and 4.16 Pa in the bulk phase (deviation: 72.89%).
These results indicate that the confinement effect has a more pronounced influence on light and heavy components than on medium-weight components. At the molecular level, this also explains why a higher content of heavy components in crude oil leads to lower saturation pressure. It is because light components are more sensitive to pressure, while heavy components have stronger van der Waals forces on the wall.
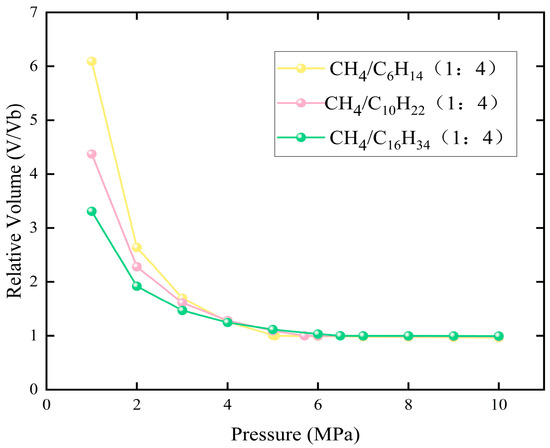
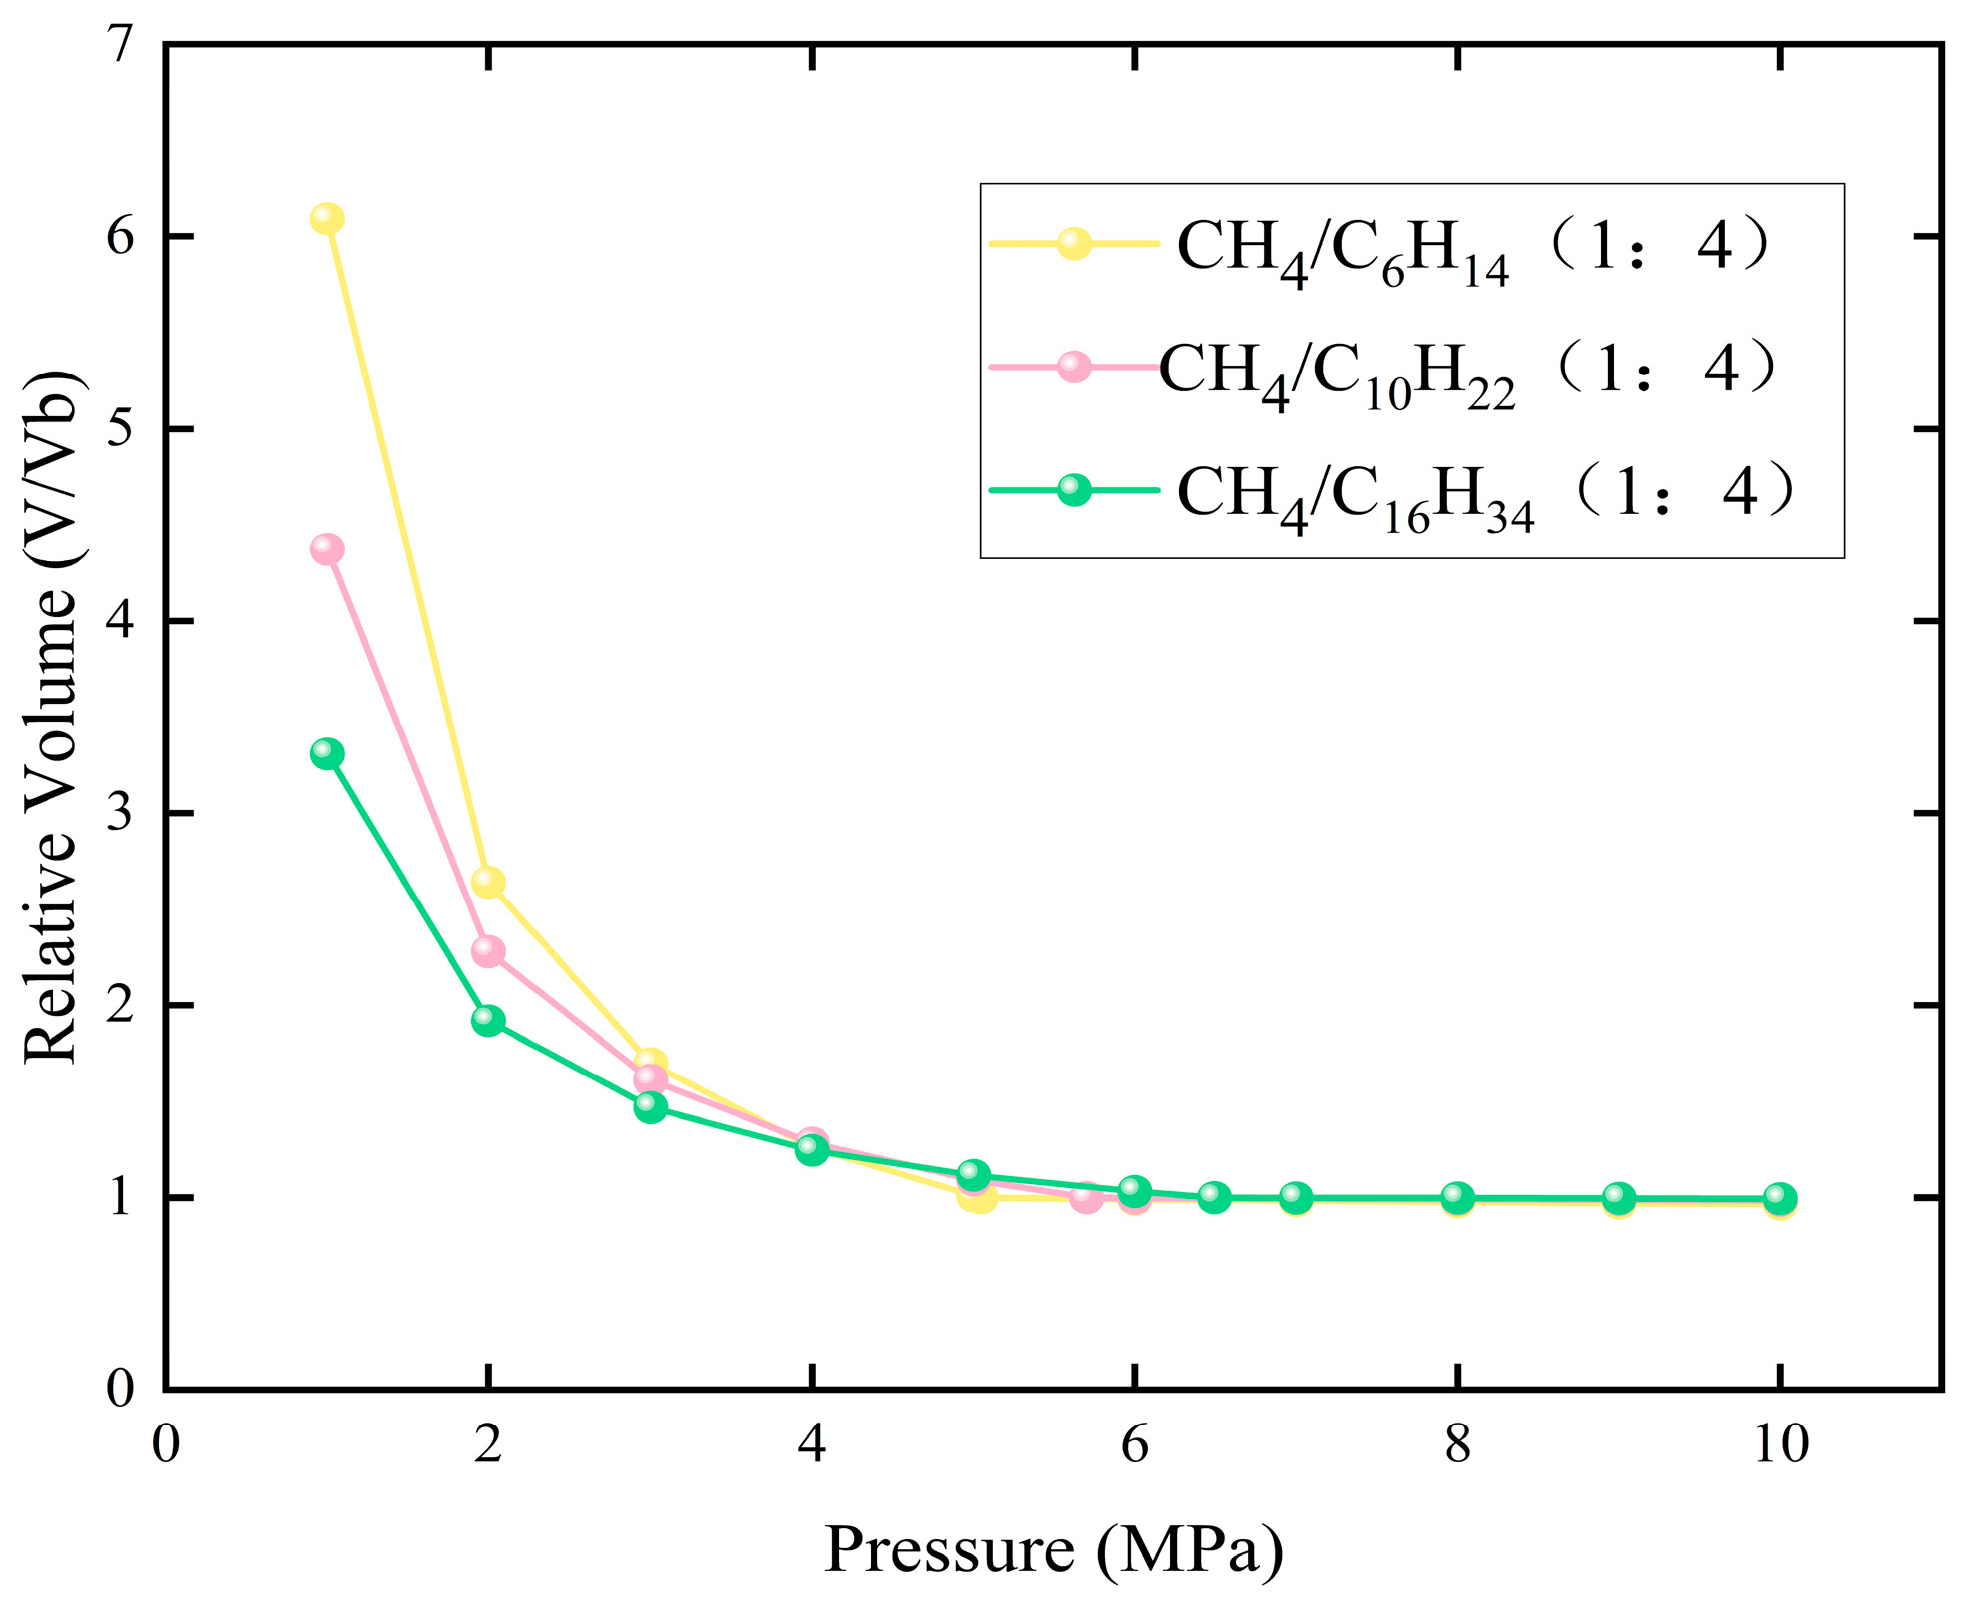
Based on these findings, three fluid mixtures—CH4/C6H14, CH4/C10H22, and CH4/C16H34—were prepared at a ratio of 1:4 for HPHT phase behavior experiments. The results are shown in Figure 8. At 100 °C, the saturation pressures were measured as 5.05 MPa for the CH4/C6H14 mixture, 5.70 MPa for the CH4/C10H22 mixture, and 6.49 MPa for the CH4/C16H34 mixture. These experimental results were consistent with the conclusions drawn from the molecular-level simulations.
Figure 8.
Relative volume vs. pressure curve of formation fluid (100 °C).
3.2.2. Temperature
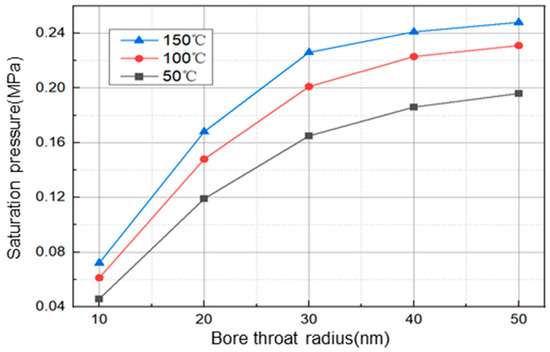
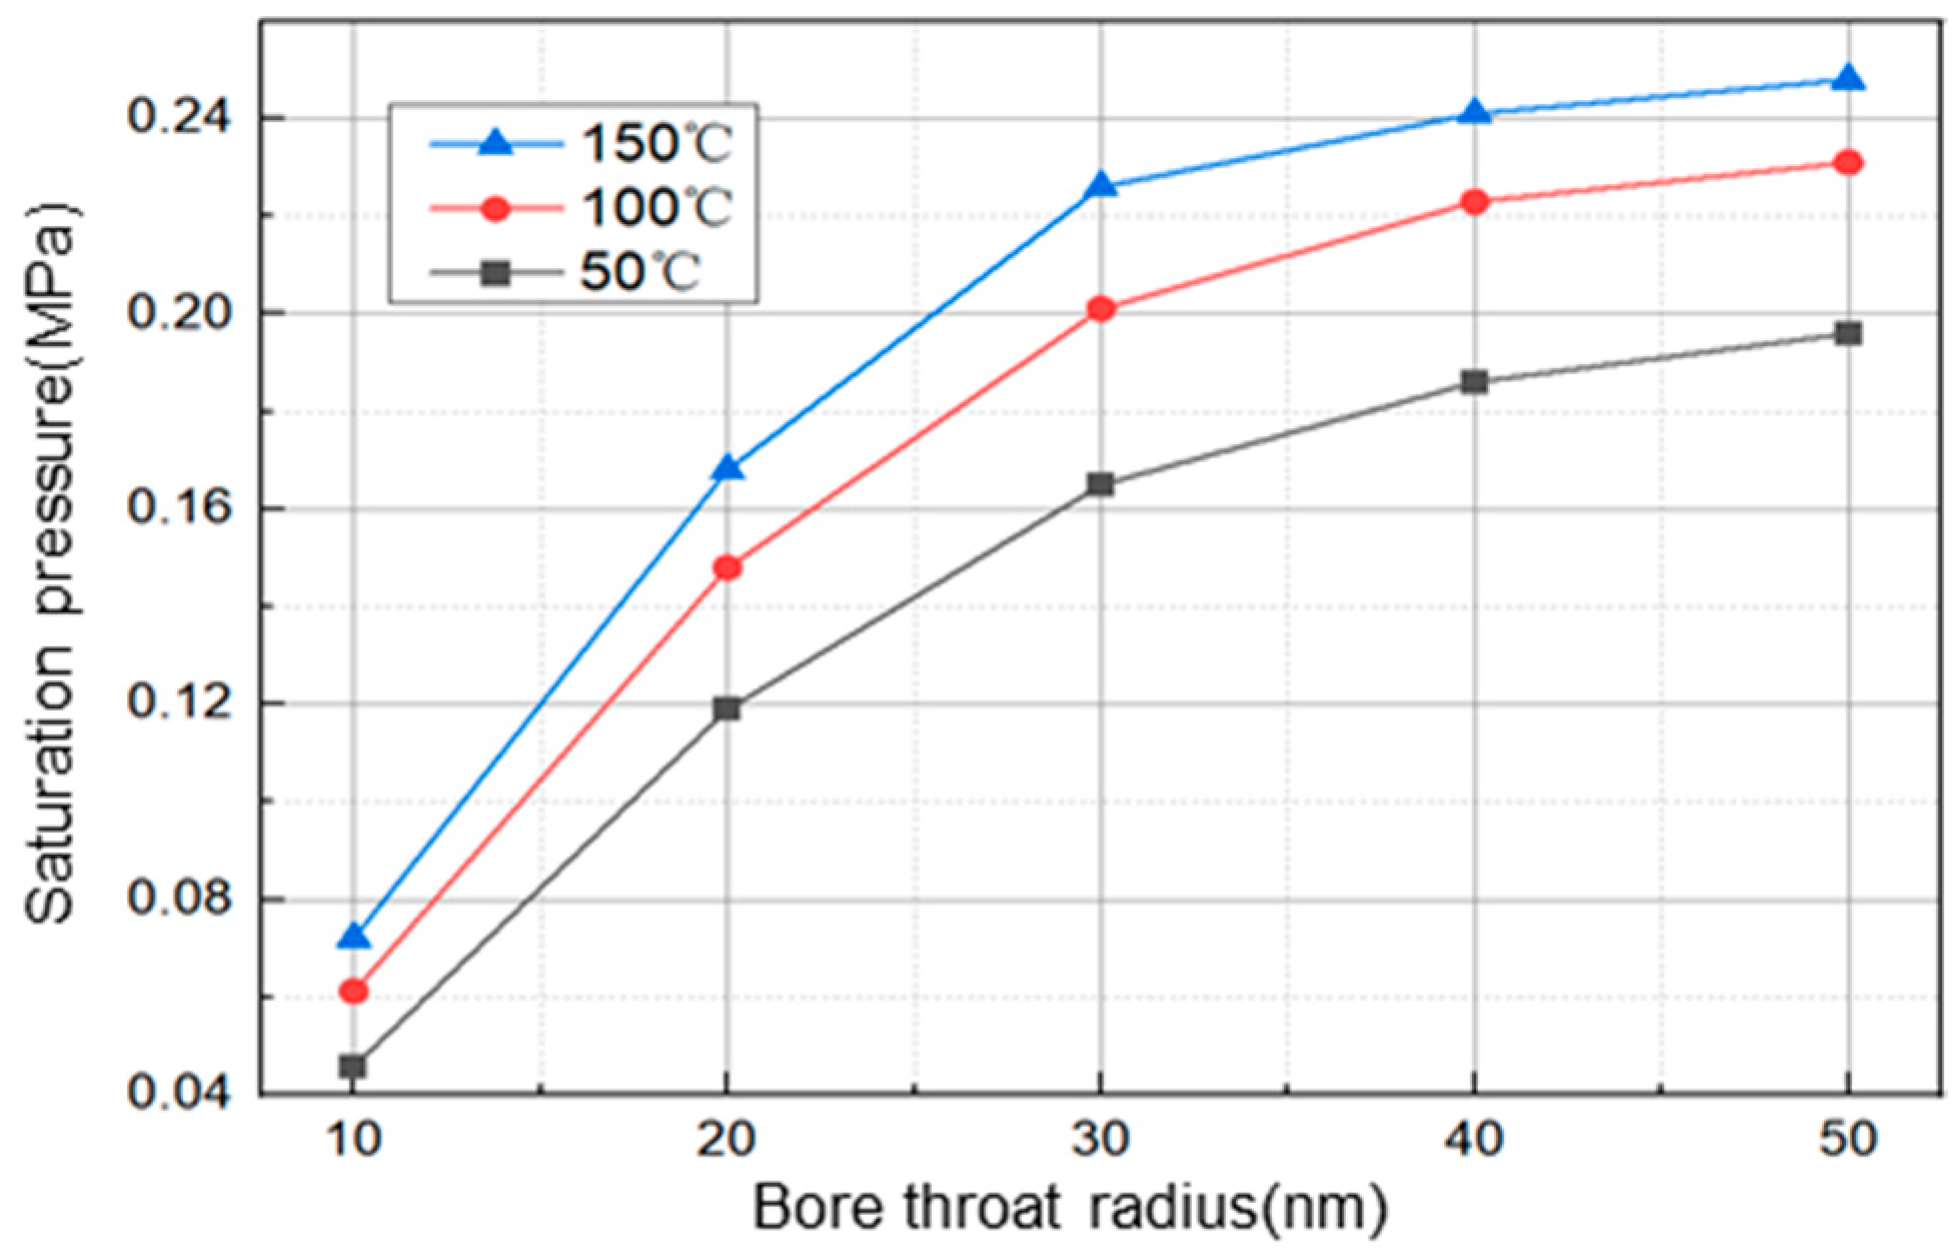
To investigate the influence of temperature on the saturation pressure of alkanes under the confinement effect, studies were conducted on C6H14 at 50 °C, 100 °C, and 150 °C, and simulation results are shown in Figure 9. It can be seen that the saturation pressure increased from 0.046 MPa (10 nm, 50 °C) to 0.248 MPa (50 nm, 150 °C).
Figure 9.
Alkane bubble point versus temperature curves at different temperatures.
Using the saturation pressure in a 50 nm pore as the reference, it was observed that the saturation pressure decreased by 77.23% at 50 °C, 73.26% at 100 °C, and 70.60% at 150 °C due to the confinement effect. These results indicate that the saturation pressure decreases with increasing temperature, suggesting that higher temperatures mitigate the impact of the confinement effect on saturation pressure.
3.2.3. Mineral Type
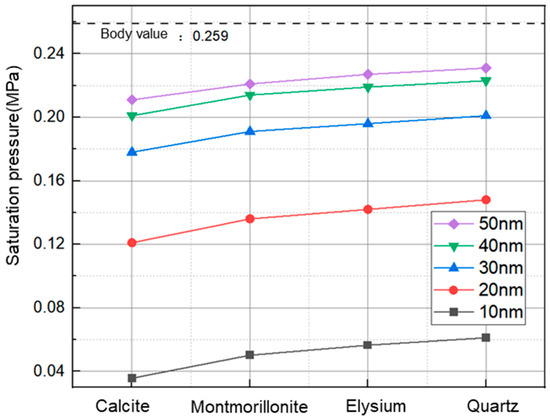
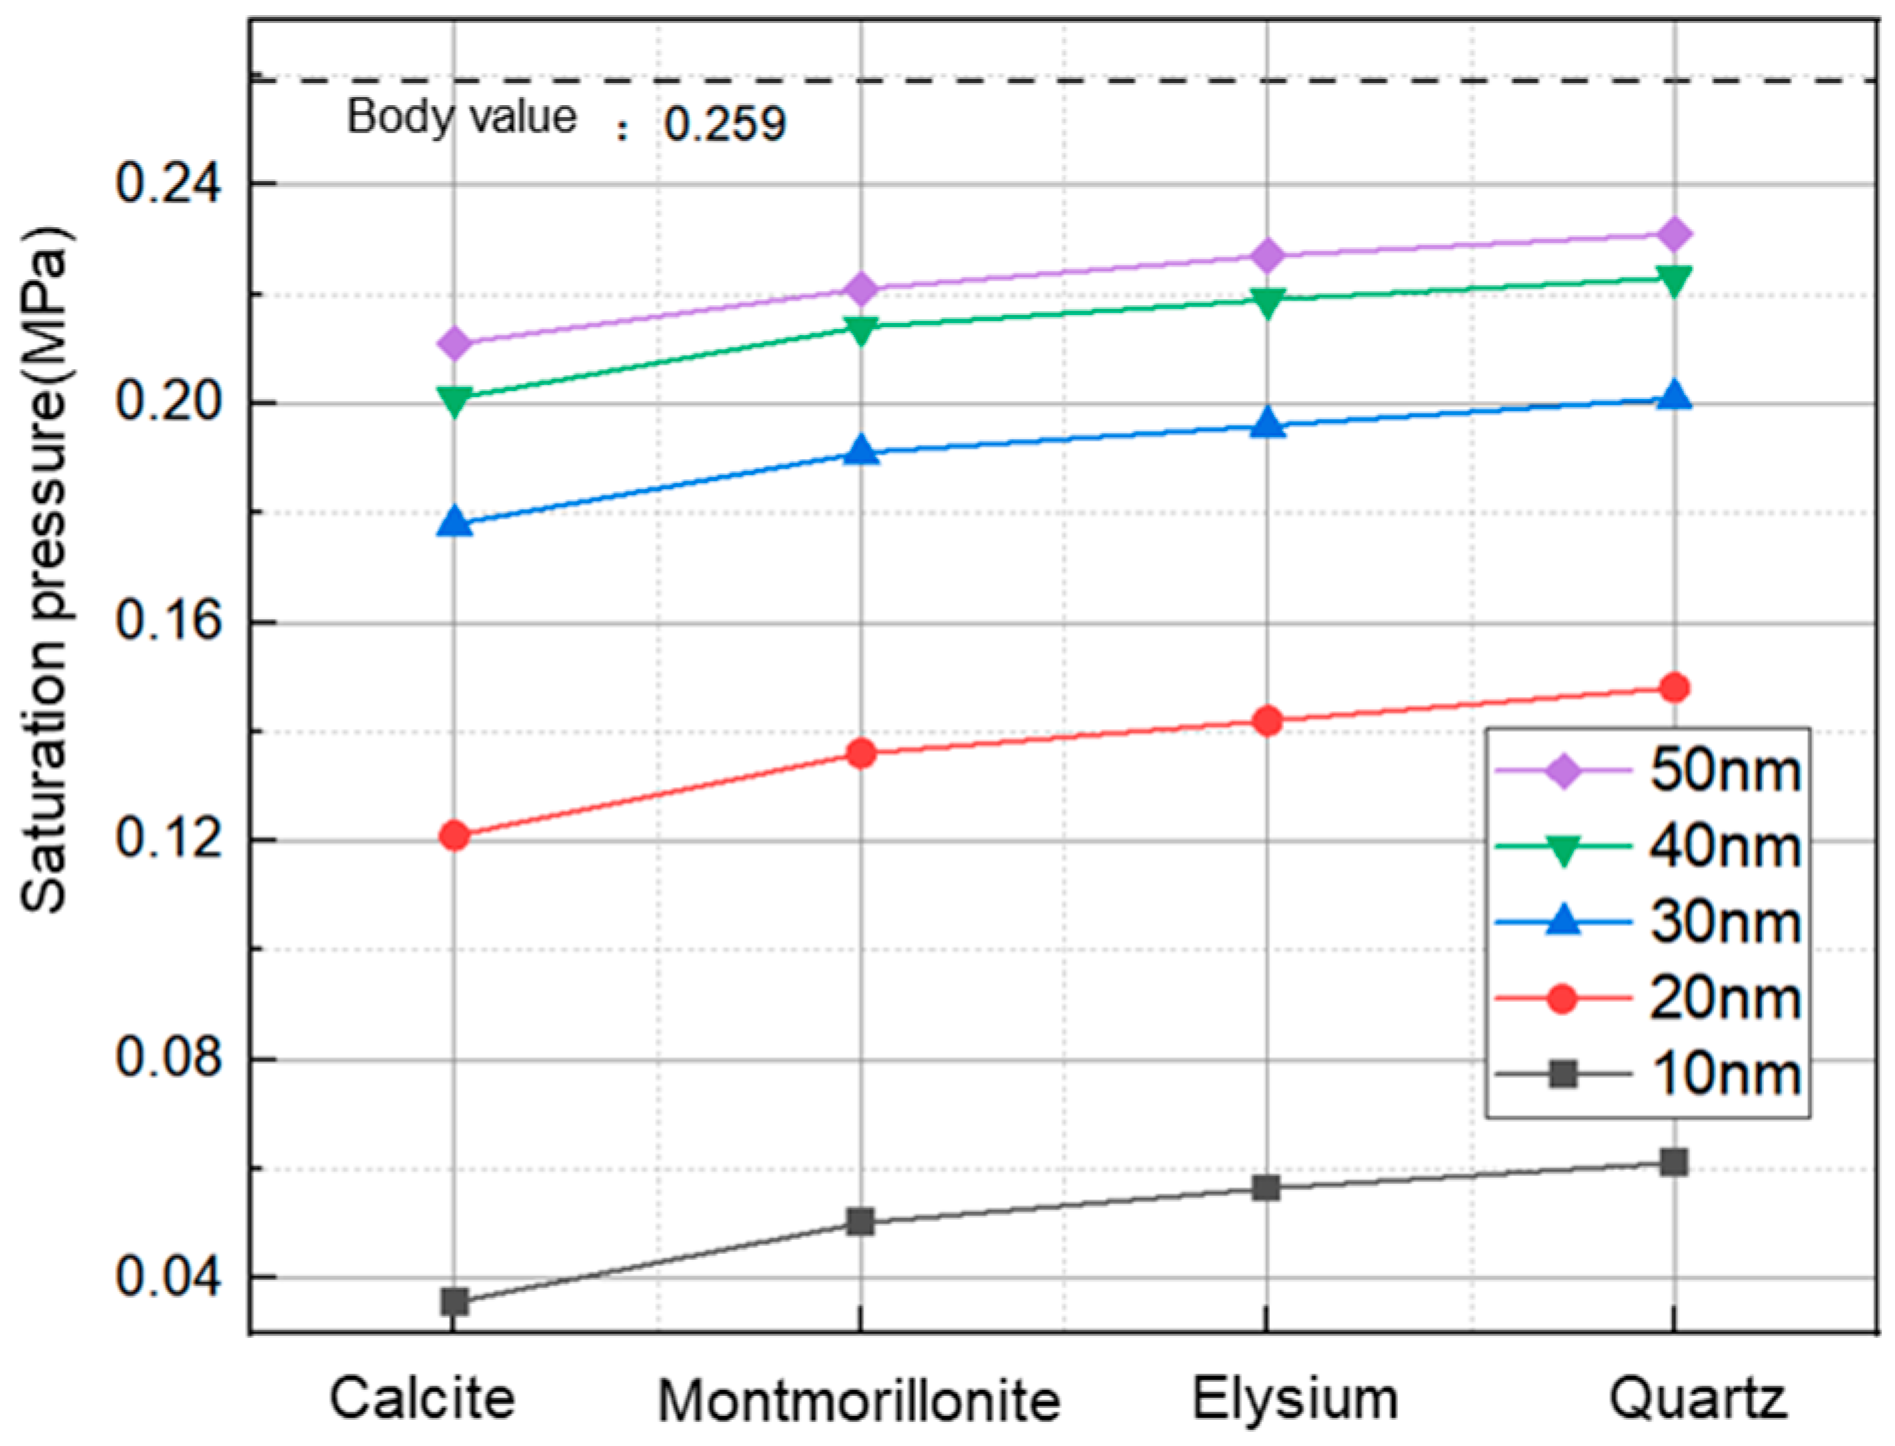
The mineral composition of shale reservoirs varies significantly, making it essential to clarify the influence of mineral types on the confinement effect. The clay minerals in the shale reservoir primarily include calcite, montmorillonite, illite, and quartz [24,25]. To investigate the influence of mineral type on saturation pressure, molecular simulations were performed at 100 °C across various pore sizes and mineral compositions.
According to the simulation results (Figure 10), the intensity of the confinement effect differs among minerals, though a generally consistent trend is observed. The fluid adsorption effect induced by confined pores increases in the following order: calcite, montmorillonite, illite, and quartz. The deviation rates of saturation pressure are 86.10% in calcite, 80.48% in montmorillonite, 77.78% in illite, and 75.89% in quartz.
Figure 10.
Curve of alkane bubble point versus mineral species (C6/100 °C).
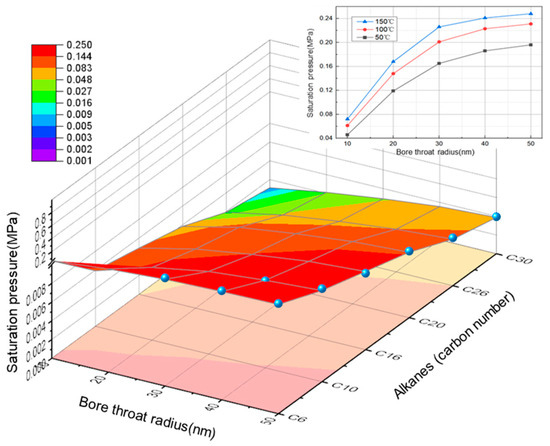
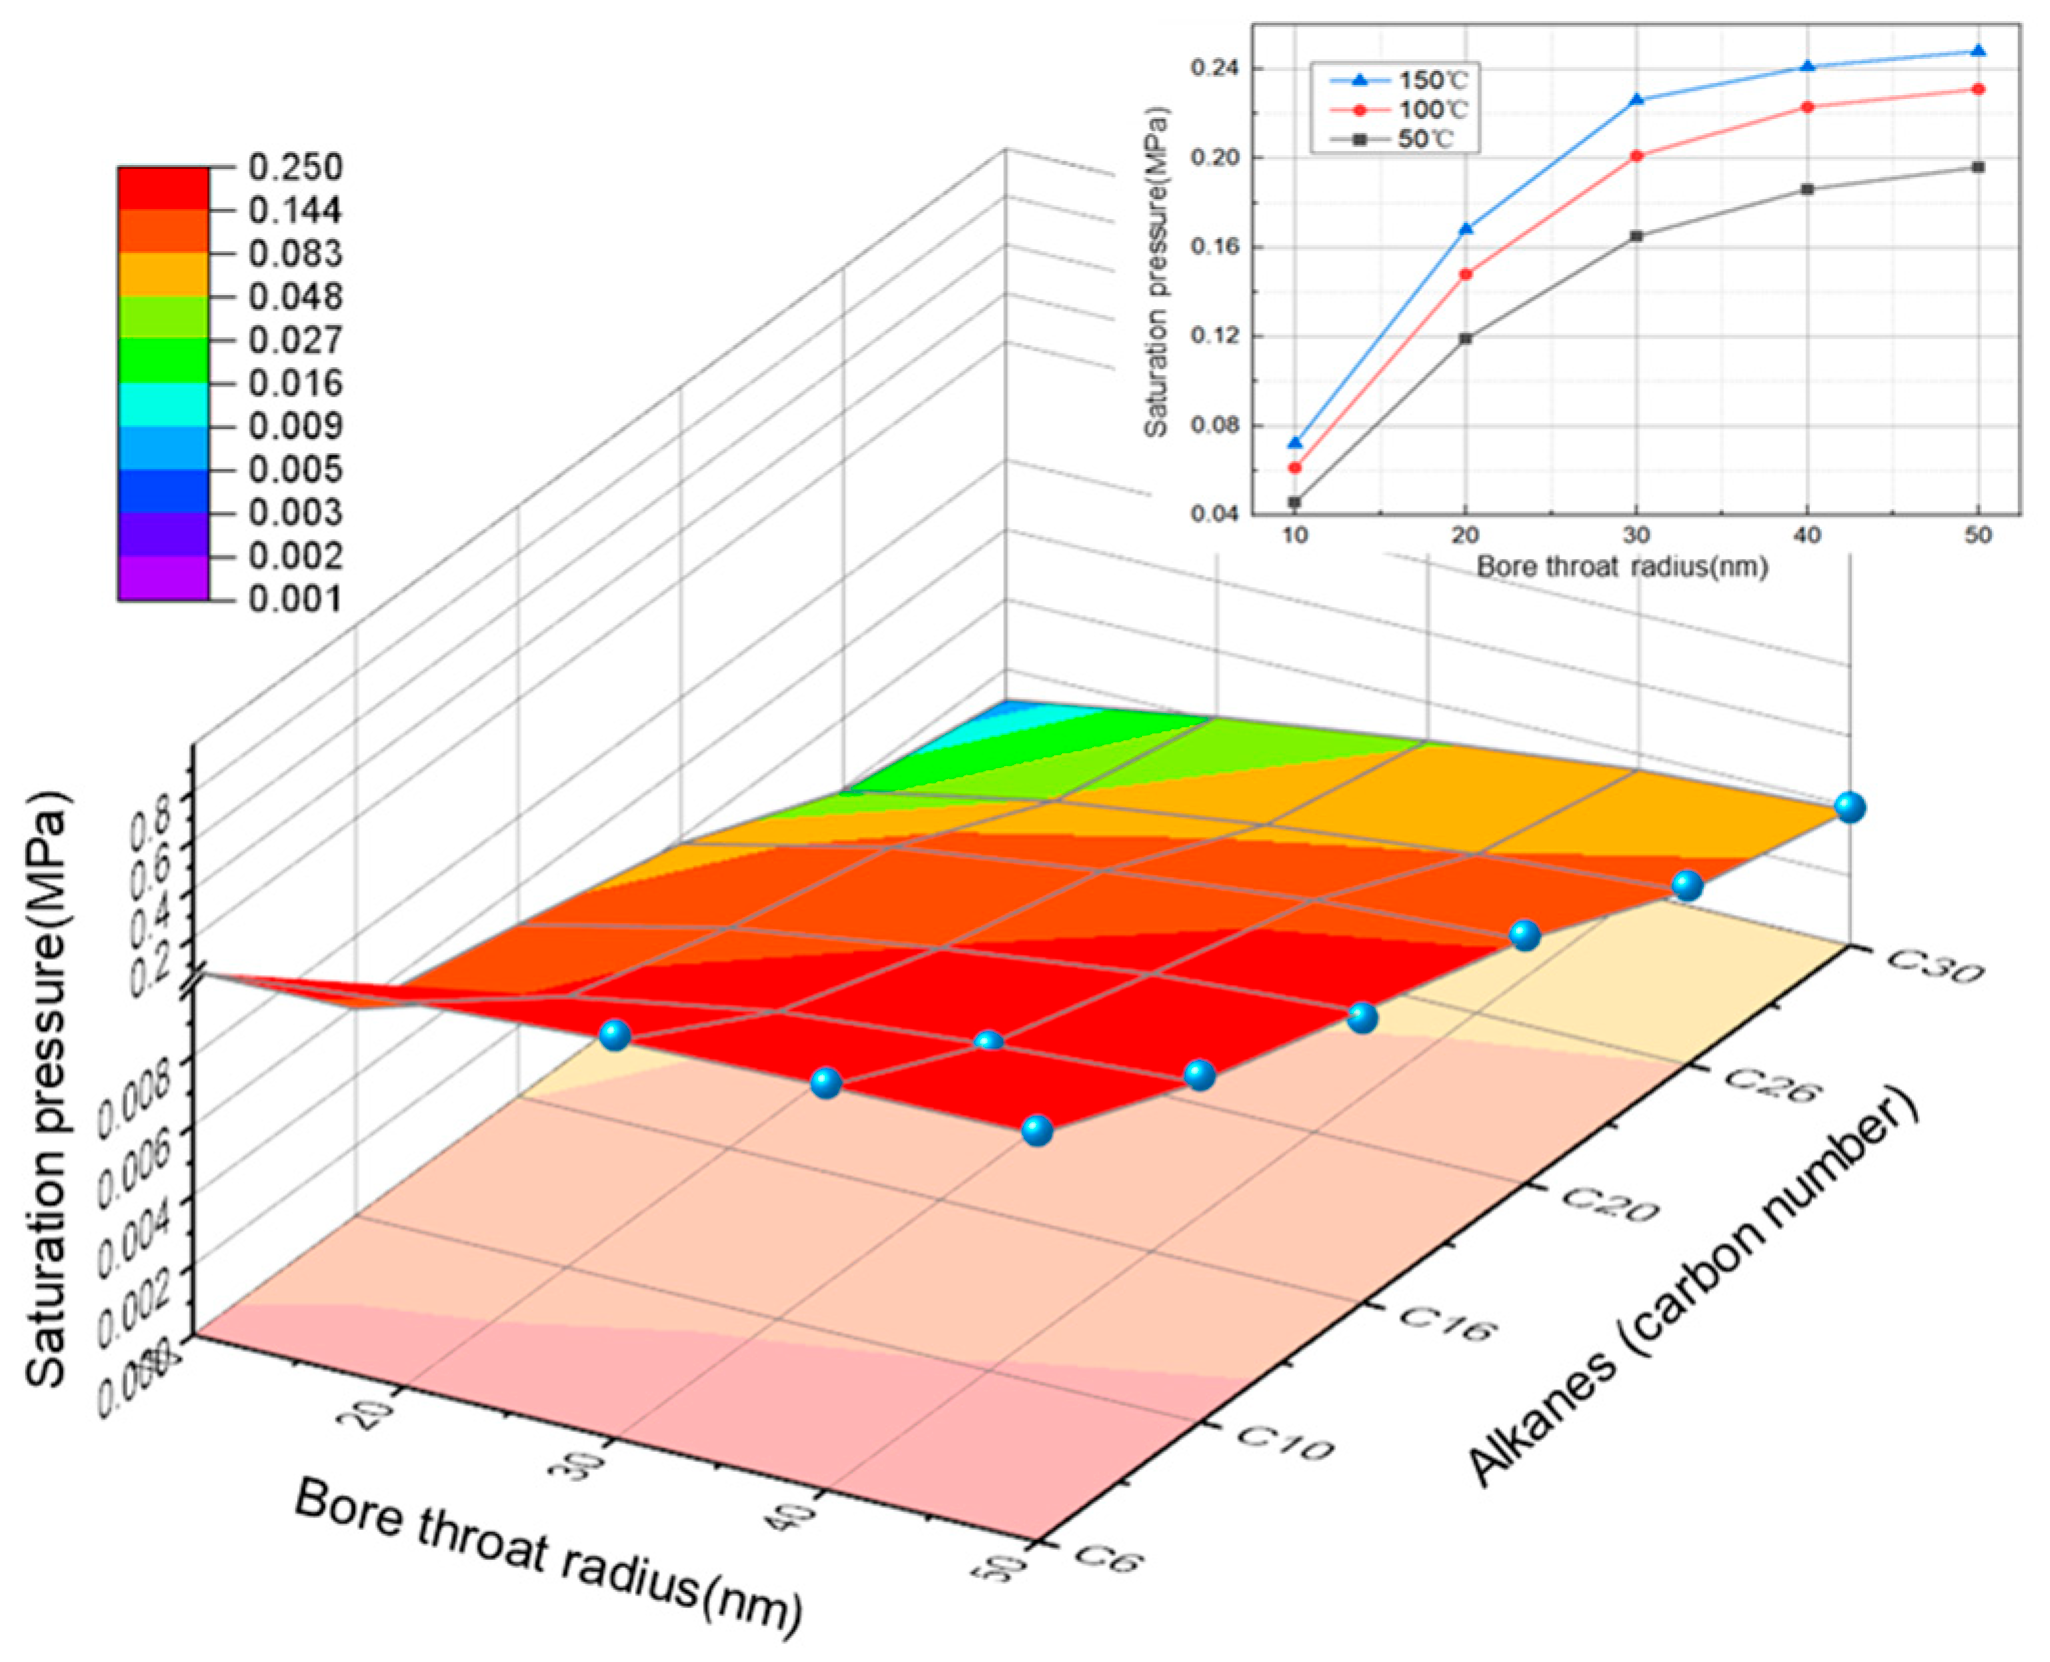
3.3. Multifactorial Alkane Saturation Pressure Prediction Model
Based on the aforementioned simulation results, a multi-scale saturation pressure model was developed as shown in Figure 11. Saturation pressure at temperatures ranging from 50 °C to 100 °C for a given pore size and alkane molecule can be determined by referring to the model. Since crude oil is a mixture of hydrocarbons, the authentic reservoir fluid saturation pressure can be obtained by incorporating the molar composition of the representative reservoir fluid from flash separation experiments. This model fills a gap in predicting alkane saturation pressure under the confinement effect by accounting for multiple influencing factors and is intended to provide a foundational tool for future research.
Figure 11.
Pattern of alkane–saturation pressure–pore-scale relationships.
3.4. Limitations of the Simplified Model
It should be noted that the molecular models used in this study involve certain simplifications. First, regarding the pore wall, graphene was employed to represent organic pores (kerogen), which are abundant in shale reservoirs. However, inorganic minerals also contribute significantly to pore volume. As shown in our sensitivity check in Section 3.2.3, the strength of fluid–wall interactions varies among minerals (quartz > illite > montmorillonite > calcite), which affects the magnitude of the saturation pressure shift. Therefore, the quantitative values reported in this study primarily reflect the behavior in organic nanopores. Second, the binary mixture (CH4/C10) cannot fully represent the complex phase separation behavior of multi-component crude oil, especially the competitive adsorption caused by aromatics or polar components. Consequently, the results in this paper should be interpreted as revealing the fundamental physical trends and mechanisms of confinement effects, rather than precise quantitative predictions for specific field engineering cases. Future studies will incorporate multi-component fluids and heterogeneous pore networks to further refine these conclusions.
4. Conclusions
- (1)
- The simulation results indicate that the confinement effect occurs in the Gulong shale reservoir and intensifies as pore size decreases. This generally leads to a significant reduction in the phase behavior parameters of formation fluids, including saturation pressure, density, and viscosity, although the specific magnitude of reduction varies with fluid composition and pore wall properties.
- (2)
- During production, Gulong shale oil flows into the main permeable channels. As reservoir pressure declines, the confinement effect would be weakened, resulting in the escape of light components and the deposition of heavy components, which can impair fluid mobility and reduce recovery efficiency. This study recommends enhancing shale seepage pathways through high-pressure fluid stimulation combined with CO2 injection for pressure maintenance.
- (3)
- The saturation pressure of pure alkane components exhibits a positive correlation with pore size and temperature. Under identical mineral type, temperature, and carbon number conditions, smaller pore size corresponds to lower saturation pressure. Similarly, lower temperature leads to reduced saturation pressure. The influence of mineral type on saturation pressure under the confinement effect follows this order: calcite < montmorillonite < illite < quartz.
- (4)
- Under consistent conditions of mineral type, pore size, temperature, and atomic carbon number, a higher concentration of heavy components in hydrocarbon mixture results in lower saturation pressure. The confinement effect has a more pronounced impact on both light and heavy components, while medium-weight components are relatively less affected.
Author Contributions
Conceptualization, Z.S. and K.Z.; methodology, K.Z., Y.Z. and Y.C.; software, Y.Z. and Y.C.; validation, Y.Z., Y.C. and W.Z.; formal analysis, Y.Z. and Y.C.; investigation, Y.Z., Y.C. and J.M.; resources, K.Z. and X.Z.; data curation, Y.Z. and Y.C.; writing—original draft preparation, Z.S., Y.Z. and Y.C.; writing—review and editing, K.Z., W.Z., J.M., X.Z. and M.H.; visualization, Y.Z. and Y.C.; supervision K.Z.; project administration, K.Z.; funding acquisition, K.Z. All authors have read and agreed to the published version of the manuscript.
Funding
This work was supported by the China National Science and Technology Major Project “Research on Integrated Regulation Technology for CO2 Miscibility Enhancement and Miscible Displacement” (Grant No. 2024ZD1406601) and the PetroChina Major Science and Technology Project “Research on New Methods and Technologies for Enhanced Oil Recovery” (Grant No. 2023ZZ04).
Data Availability Statement
The original contributions presented in this study are included in the article. Further inquiries can be directed to the corresponding author.
Conflicts of Interest
Author Xiaolin Zhou was employed by Engineering Technology Branch of CNOOC Energy Development Co., Ltd. Author Jian Ma was employed by Research Institute of Exploration and Development, PetroChina Huabei. Authors Ke Zhang, Yu Zhang, Yaoze Cheng, Jian Ma, Xiaolin Zhou, and Maomao Hong are employed by a funding entity of this research—PetroChina Company Limited. The authors declare that apart from this employment relationship, there are no other commercial or financial interests that could influence the outcomes of this study. The remaining author declares that the research was conducted in the absence of any commercial or financial relationships that could be construed as a potential conflict of interest.
References
- Jin, Z.J.; Zhu, R.K.; Liang, X.P.; Shen, Y.Q. Several issues worthy of attention in current lacustrine shale oil exploration and development. Pet. Explor. Dev. 2021, 48, 1471–1484. [Google Scholar] [CrossRef] [Scilit]
- Xu, N.; Wang, Y. Effect of Nanomaterials on Improving the Apparent Viscosity of Heavy Oil and the Environmental Evaluation of Reservoir Environment. Reserv. Sci. 2026, 2, 1–15. [Google Scholar] [CrossRef] [Scilit]
- Cao, L.; Lv, M.; Li, C.; Sun, Q.; Wu, M.; Xu, C.; Dou, J. Effects of Crosslinking Agents and Reservoir Conditions on the Propagation of Fractures in Coal Reservoirs During Hydraulic Fracturing. Reserv. Sci. 2025, 1, 36–51. [Google Scholar] [CrossRef] [Scilit]
- Li, M.; Liu, J.; Xia, Y. Risk Prediction of Gas Hydrate Formation in the Wellbore and Subsea Gathering System of Deep-Water Turbidite Reservoirs: Case Analysis from the South China Sea. Reserv. Sci. 2025, 1, 52–72. [Google Scholar] [CrossRef] [Scilit]
- Pang, Y.; Wang, Y.; Wang, R.; Zhang, Y.; Lu, H.; Huang, L. Production test analysis and productivity prediction of horizontal wells in Gulong shale oil reservoirs, Songliao Basin. Pet. Geol. Oilfield Dev. Daqing 2020, 39, 137–146. [Google Scholar]
- He, W.; Meng, Q.; Feng, Z.; Zhang, J.; Wang, R. In-situ accumulation theory and exploration &development practice of Gulong shale oil in Songliao Basin. Acta Pet. Sin. 2022, 43, 1–14. [Google Scholar]
- Lin, M.; Jiang, W.; Li, Y.; Yi, Z.; Zhang, Z. Several Questions in the Micro-Scale Flow of Shale Oil/Gas. Bull. Mineral. Petrol. Geochem. 2015, 34, 18–28. [Google Scholar]
- Xue, C.L.; Ji, D.L.; Cheng, D.; Wen, Y.T.; Luo, H.H.; Li, Y. Adsorption Behaviors of Different Components of Shale Oil in Quartz Slits Studied by Molecular Simulation. Acs Omega 2022, 7, 41189–41200. [Google Scholar] [CrossRef] [Scilit]
- Fang, Y.J.; Li, Z.X.; Yang, E.R.; Sha, M.Y.; Song, S.L. Molecular Dynamics Simulation Study on the Occurrence of Shale Oil in Hybrid Nanopores. Molecules 2024, 29, 312. [Google Scholar] [CrossRef] [Scilit]
- Zhang, Y.; Jiang, Y.; Wei, Q.; Huang, H.; Wang, T.; Xiong, H.; Wang, J.; Ren, Y.; Cui, X. Insight into adsorption behaviors of shale oil in kerogen slit by molecular dynamics. Fuel 2024, 374, 132432. [Google Scholar] [CrossRef] [Scilit]
- Zhang, A.; Lu, Y. Confined transport property of multi-polar mixed shale oil components induced by interfacial effects within kerogen nanopores. Fuel 2025, 393, 134985. [Google Scholar] [CrossRef] [Scilit]
- Zhang, M.; Liu, R.J.; Hu, J.H.; Zhang, Y. A Pore-Geometry-Based Thermodynamic Model for the Nanoconfined Phase Behavior in Shale Condensate Reservoirs. Lithosphere 2022, 2022, 1989358. [Google Scholar] [CrossRef] [Scilit]
- Dang, W.; Zhang, J.; Nie, H.; Wang, F.; Tang, X.; Jiang, S.; Wei, X.; Liu, Q.; Li, P.; Li, F.; et al. Microscopic occurrence characteristics of shale oil and their main controlling factors: A case study of the 3rd submember continental shale of Member 7 of Yanchang Formation in Yan’an area, Ordos Basin. Acta Pet. Sin. 2022, 43, 507–523. [Google Scholar]
- Ambrose, R.J.; Hartman, R.C.; Diaz-Campos, M.; Akkutlu, I.Y.; Sondergeld, C.H. Shale Gas-in-Place Calculations Part I: New Pore-Scale Considerations. SPE J. 2012, 17, 219–229. [Google Scholar] [CrossRef] [Scilit]
- Mosher, K.; He, J.J.; Liu, Y.Y.; Rupp, E.; Wilcox, J. Molecular simulation of methane adsorption in micro- and mesoporous carbons with applications to coal and gas shale systems. Int. J. Coal Geol. 2013, 109, 36–44. [Google Scholar] [CrossRef] [Scilit]
- Contreras-Camacho, R.O.; Ungerer, P.; Boutin, A.; Mackie, A.D. Optimized intermolecular potential for aromatic hydrocarbons based on anisotropic united atoms. 1. Benzene. J. Phys. Chem. B 2004, 108, 14109–14114. [Google Scholar] [CrossRef] [Scilit]
- Wang, S.; Feng, Q.; Zha, M.; Lu, S.; Qin, Y.; Xia, T.; Zhang, C. Molecular dynamics simulation of liquid alkane occurrence state in pores and fractures of shale organic matter. Pet. Explor. Dev. 2015, 42, 772–778. [Google Scholar] [CrossRef] [Scilit]
- Sarman, S.; Wang, Y.L.; Rohlmann, P.; Glavatskih, S.; Laaksonen, A. Rheology of phosphonium ionic liquids: A molecular dynamics and experimental study. Phys. Chem. Chem. Phys. 2018, 20, 10193–10203. [Google Scholar] [CrossRef] [Scilit]
- David, A.; De Nicola, A.; Tartaglino, U.; Milano, G.; Raos, G. Viscoelasticity of Short Polymer Liquids from Atomistic Simulations. J. Electrochem. Soc. 2019, 166, B3246–B3256. [Google Scholar] [CrossRef] [Scilit]
- Einstein, A. On the movement of small particles suspended in stationary liquids required by the molecular-kinetic theory of heat. Ann. Der Phys. 1905, 17, 549–560. [Google Scholar] [CrossRef] [Scilit]
- Yu, S.; Chu, R.Z.; Li, X.; Wu, G.G.; Meng, X.L. Nonequilibrium Molecular Dynamics Simulations of Coal Ash. Energies 2021, 14, 11. [Google Scholar] [CrossRef] [Scilit]
- Song, Z.L.; Zhang, K.; Zhang, Y.J.; Cheng, Y.Z.; Li, M.; Li, A. Study on Phase Behavior of Fluid in Gulong Shale Pores. J. Xi’an Shiyou Univ. 2025, 40, 41–48. [Google Scholar]
- Ma, X.J.; Xiang, Z.P.; Zhu, S.J.; Rui, H.Q.; Song, Z.L.; Hu, J.B. Influencing Factors of CO2/CH4 Competitive Adsorption in Shale Reservoirs of Sichuan Basin. Nat. Gas Explor. Dev. 2023, 46, 117–122. [Google Scholar]
- Zhao, W.Z.; Hu, S.Y.; Hou, L.H.; Yang, T.; Li, X.; Guo, B.C.; Yang, Z. Types and resource potential of continental shale oil in China and its boundary with tight oil. Pet. Explor. Dev. 2020, 47, 1–11. [Google Scholar] [CrossRef] [Scilit]
- Yong, R.; Yang, H.; Wu, W.; Yang, X.; Yang, Y.; Huang, H. Controlling factors and exploration potential of shale gas enrichment and high yield in Permian Dalong Formation, northern Sichuan Basin, SW China. Pet. Explor. Dev. 2025, 52, 285–300. [Google Scholar] [CrossRef] [Scilit]

Disclaimer/Publisher’s Note: The statements, opinions and data contained in all publications are solely those of the individual author(s) and contributor(s) and not of MDPI and/or the editor(s). MDPI and/or the editor(s) disclaim responsibility for any injury to people or property resulting from any ideas, methods, instructions or products referred to in the content. |
© 2026 by the authors. Licensee MDPI, Basel, Switzerland. This article is an open access article distributed under the terms and conditions of the Creative Commons Attribution (CC BY) license.