


Abstract
To effectively cope with the impact of coal quality changes on the operation of coal gasification units and ensure the stable and efficient operation of coal gasification units, an entrained-flow gasifier was modeled and simulated in this paper. Equilibrium reaction models, reaction kinetics models, and reaction zoning models based on various mechanisms were employed for the modeling. Simulation results for Xinjiang Zhundong Hongshaquan coal with different coal qualities were compared with the actual operation data of the plant using the root mean square deviation (RMSD) method. The deviations of the equilibrium reaction model, reaction kinetics model, and reaction zoning model were 1.14% and 1.09%, 0.65% and 0.61%, and 0.44% and 0.368%, respectively. The comparison results show that all three models can accurately simulate and predict the gasification process of Junggar coal when the coal quality changes. Then, the established models were used to study the influence of the changes in the main parameters of the gasification unit, such as coal slurry concentration and oxygen–coal ratio, on coal gasification. The results show that an increase in coal slurry concentration has a positive influence on the effective gas. The optimal oxygen–coal ratio in the coal studied in this paper is approximately 0.45, which provides strong theoretical support for the subsequent optimization of the coal gasification process and actual production operation.
1. Introduction
In China’s energy mix, coal resources are abundant, while petroleum resources are relatively scarce. As the core technology for the clean and efficient conversion of coal, coal gasification plays a critical role in the establishment of new energy systems [1,2]. With sustained economic development, there is a broad consensus across society on achieving rational and efficient utilization of coal resources to meet the growing energy demand [3]. Currently, entrained-flow gasification technology has become the mainstream approach in the coal gasification field, owing to advantages such as the high purity of gas products and high carbon conversion rates [4]. However, in actual industrial production, the stable operation of gasifiers faces numerous challenges. Fluctuations in coal quality and variations in process parameters, such as the flow rate and concentration of inlet materials, can affect the gasification reaction process, disrupt normal gasifier operation, and consequently lead to fluctuations in gas quality, gas production rate, and operational stability. To effectively address these issues, it is particularly necessary to develop accurate predictive models for coal gasification. This study focuses on coal from the Zhundong coalfield in Xinjiang, conducting simulation research on the entrained-flow coal gasification process through the independent development of equilibrium reaction, reaction kinetics, and reaction zone models. Through comparison with actual plant operational data to verify the accuracy of the model, this study ultimately provides theoretical support for the operational optimization of coal gasification units.
2. Coal Quality Analysis of Gasifier Feedstock
The research subject of this paper is Hongshaquan coal from the Zhundong Coalfield in Xinjiang. Two representative coal samples were selected as the feedstock for the coal gasification unit, and the coal quality analysis data are shown in Table 1.
Table 1.
Coal quality analysis data.
3. Gasifier Model Construction
3.1. Reaction Process in Entrained-Flow Gasification
The process burner delivers coal water slurry and oxygen into the gasifier at specific ratios and flow rates. Under the extreme conditions of high temperature (typically reaching 1300–1500 °C) and high pressure (generally 3–8 MPa) created in the gasifier combustion chamber, oxygen and coal rapidly undergo intense reactions. This gasification process is highly complex, involving a tightly coupled series of physical changes and chemical reactions [5]. First, the coal undergoes a drying stage under high-temperature conditions, removing both extrinsic and intrinsic moisture. This is followed by the pyrolysis stage, where the macromolecular structure of coal begins to break chemical bonds under thermal action, releasing volatile matter and forming semi-coke.
Subsequently, the volatile matter and semi-coke undergo combustion reactions with oxygen, releasing a significant amount of heat. This provides the necessary high-temperature environment for the subsequent gasification reactions. Simultaneously with the combustion reactions, gasification reactions also take place, primarily including the water–gas reaction between carbon and steam, the Boudouard reaction between carbon and carbon dioxide, etc., producing synthesis gas mainly composed of carbon monoxide (CO), hydrogen (H2), and carbon dioxide (CO2). These stages do not occur in isolation but are interwoven and mutually influential. The resulting syngas then enters the quench chamber, where it undergoes rapid cooling through direct contact with quench water. This process causes the water vapor in the syngas to condense quickly while also reducing the syngas temperature to meet the requirements of downstream processes. The cooled syngas is ultimately sent to subsequent units for further treatment and utilization.
3.2. Equilibrium Reaction Model for Gasifier
3.2.1. Reaction Mechanism of the Equilibrium Model
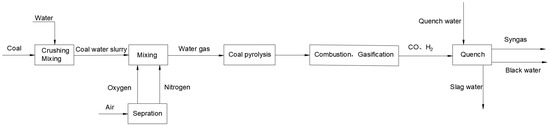
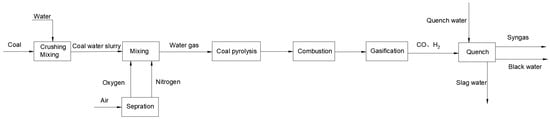
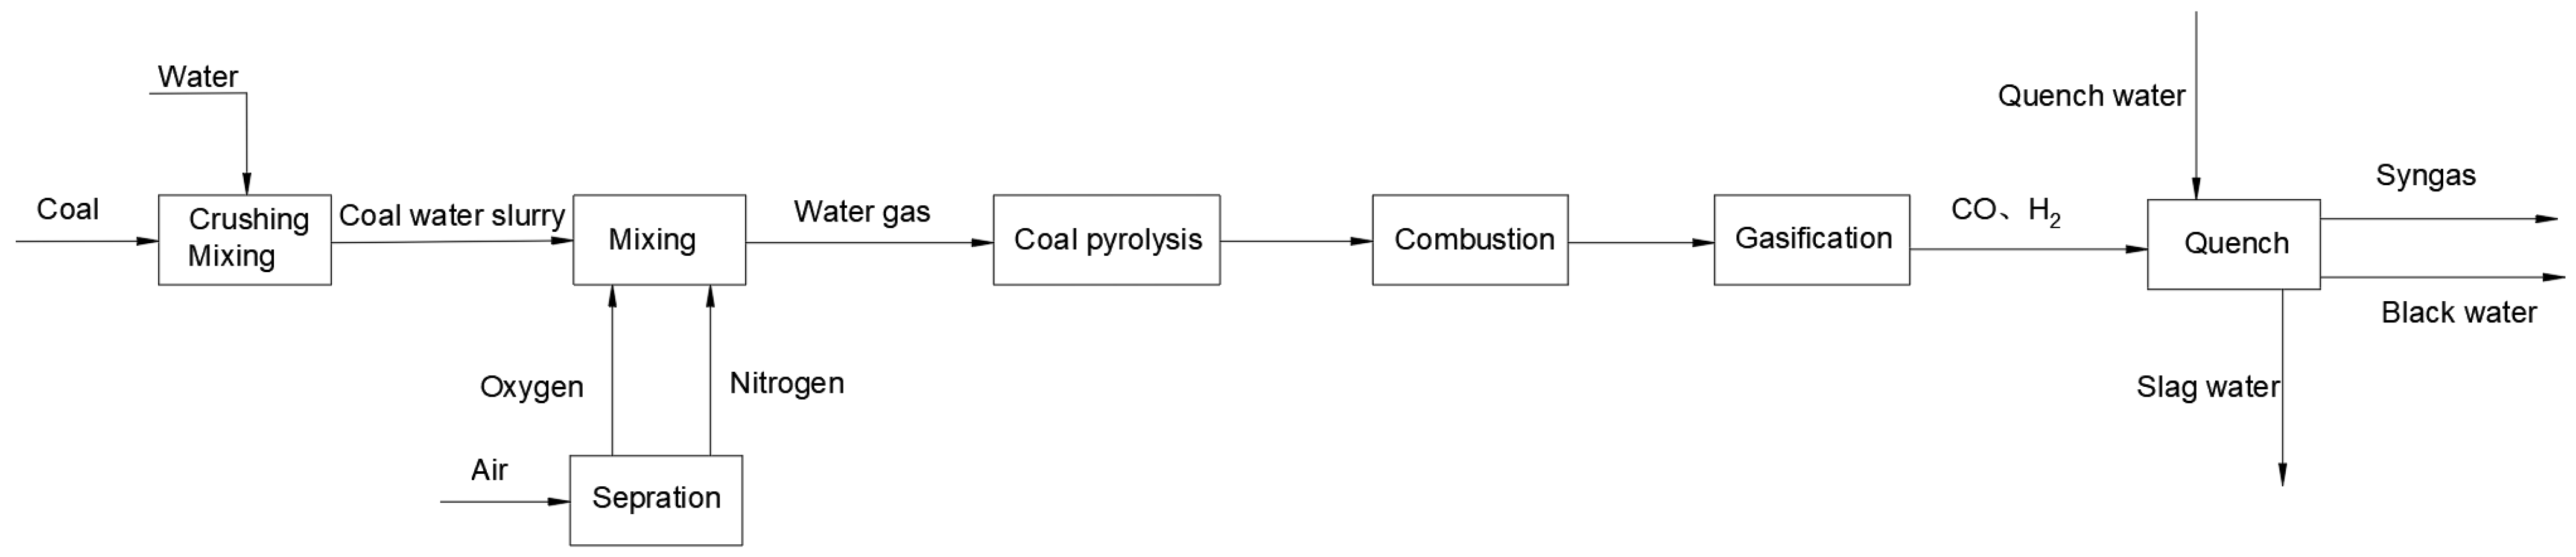
In entrained-flow gasifiers, the reaction temperature and pressure are both at elevated levels, resulting in extremely rapid reaction rates. Under such conditions, the reaction system can be approximately regarded as reaching equilibrium instantaneously, with the corresponding outlet gas also being in an equilibrium state [6,7,8]. Based on the above principles, it is possible to predict the products of gasification reactions even in the absence of gasification reaction kinetic parameters and information about the gasifier dimensions. From the perspective of the reaction process inside the gasifier, the entire process can be divided into the following stages: the coal pyrolysis stage, where coal decomposes under heat; followed by the combustion reaction stage of char and volatiles; then, the gasification reaction stage; and finally, the syngas is quenched, cooled, and transported out of the gasifier (the process flow is shown in Figure 1).
Figure 1.
Reaction mechanism process diagram of the equilibrium reaction models.
During coal pyrolysis, the Merrick model [9] was integrated into the RYield reactor block in Aspen Plus V12. Elemental analysis data of Zhundong Hongshaquan coal (Table 1) was input to calculate the yields of pyrolysis products (volatiles, char, and hydrogen).
During the coal pyrolysis process, the Merrick model [9] was employed to conduct an in-depth analysis of the proximate and ultimate analysis data of the coal, thereby accurately calculating the yields of various pyrolysis products. The Merrick model fully considers the influence of the inherent characteristics of coal types on pyrolysis reaction pathways and product distribution, enabling relatively accurate prediction of pyrolysis product generation trends and providing critical data support for subsequent process steps. As for the subsequent combustion and gasification reactions, due to their rapid occurrence under harsh high-temperature and high-pressure conditions, the outlet gas of the gasifier can be approximately regarded as being in an equilibrium state based on the principles of chemical kinetics and related theories of reaction engineering. This reasonable approximation effectively simplifies the research and analysis of complex reaction systems; provides an important theoretical basis for the optimized design of gasification processes and precise control of operating conditions; and contributes to improving the efficiency and stability of the entire coal gasification process.
3.2.2. Equilibrium Reaction Model Development Process
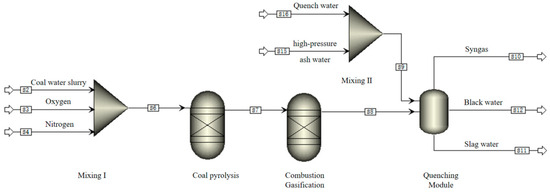
Based on the reaction mechanism described in Section 3.2.1, an equilibrium reaction model is established to simulate (model construction using ASPEN V12) the entire operation process of the gasifier. For the coal pyrolysis stage, the Merrick model [9] was integrated into the RYield reactor block of Aspen Plus V12. A yield reactor was used according to certain principles to determine the composition of pyrolysis products. The combustion and gasification reactions of char and volatiles can be approximated as being in equilibrium, without considering the effects of reaction kinetics. Therefore, a Gibbs reactor is employed to simulate the results of simultaneously achieving chemical and phase equilibrium. The quenching module is simulated using an adiabatic flash module. The specific modeling workflow is illustrated in Figure 2.
Figure 2.
Equilibrium reaction models.
3.2.3. Equilibrium Reaction Model Simulation and Validation
Actual plant operational data are used as the input for the equilibrium reaction model illustrated in Figure 2 for simulation. The specific input data are detailed in Table 2 and Table 3.
Table 2.
Parameters of Coal Sample 1 entering the gasifier.
Table 3.
Parameters of Coal Sample 2 entering the gasifier.
Based on the above input conditions, the simulated data of the syngas exiting the gasifier were obtained and compared with the actual plant operational data using root mean square deviation, as shown in Table 4.
Table 4.
Comparison of simulation results with factory data.
To provide an intuitive comparison of the deviation between the simulated data and the plant data, the root mean square deviation (RMSD) was used. The root mean square deviation is defined as follows:
where vi is the simulated value, wi is the plant data value, and n (n = 5) is the number of data points.
By substituting the data from Table 4 into Equation (1), the root mean square deviation between the simulated data and the actual plant data for Coal Sample 1 and Coal Sample 2 is calculated.
3.3. Gasifier Reaction Kinetics Model
3.3.1. Reaction Kinetics Principles in Gasifiers
According to the gasifier reaction process described in Section 3.1, coal water slurry and the gasifying agent enter the gasifier through the burner, forming a jet-type, non-catalytic, high-temperature, high-pressure partial oxidation process. This involves stages such as water evaporation, coal pyrolysis, combustion of volatiles and char, and gasification reactions, ultimately producing raw syngas that enters the quench chamber for cooling [10].
The reactions within the gasifier are categorized into homogeneous gas-phase reactions and heterogeneous gas–solid reactions. Homogeneous gas-phase reactions include gas-phase combustion reactions (2)–(4) and gas-phase gasification reactions in Equations (5) and (6):
H2 + 0.5O2 → H2O
CH4 + 2O2 → CO2 + 2H2O
CO + 0.5O2 → CO2
CO + H2O ↔ CO2 + H2
CH4 + H2O ↔ CO + 3H2
The reaction rates of homogeneous combustion reactions are calculated using the reaction rate formula [7], as detailed in reference [10], as follows:
where A represents the frequency factor, Ea represents the activation energy, R represents the molar gas constant, C2 and C1 represent the concentrations of the reactants, and Tg represents the gas reaction temperature.
The activation energy and pre-exponential factor data for the gas-phase combustion reaction are referenced from the values reported in the literature [11], which are specified as follows (Table 5):
Table 5.
Activation energy and pre-exponential factor data of gas-phase combustion reaction.
Referring to the content in reference [12], the kinetic expression for reaction Equation (5) is given by Equation (8):
where Ke5 represents the equilibrium constant for Equation (5).
Referring to the content in reference [13], the kinetic expression for reaction Equation (6) is given by Equation (10):
where Ke6 represents the equilibrium constant for Equation (6).
Heterogeneous gas–solid reactions include the gasification and combustion reactions of char, as shown in Equations (12)–(16).
Among them, the char combustion reactions are given by Equations (12) and (13):
The char gasification reactions are given by Equations (14) to (16):
C(s) + H2O → CO + H2
C(s) + CO2 → 2CO
C(s) + 2H2 → CH4
The reaction kinetics model and kinetic parameters for char combustion can be referenced from the literature, adopting the unreacted core model [13].
The symbols in Equations (17)–(22) are defined as follows: Rg-s denotes the gas-solid reaction rate; Y is the unreacted core size ratio; K is the chemical reaction rate constant; Kd is the gas–solid diffusion rate constant; Kash is the ash layer diffusion rate constant.
Based on the descriptions in references [10,14], the kinetics of char gasification reactions integrate factors such as particle mass transfer rates, interphase mass transfer of gases, and intrinsic reaction kinetics. The reaction rate expression for char gasification is given by Equation (23):
where Dn,r represents the diffusion rate of the gas phase, and Dn,k denotes the intrinsic reaction rate of char gasification. These parameters are calculated based on the relevant literature [10,15,16].
In this context, represents the gas-phase diffusion coefficient, taken as = 3.0 × 10⁻¹² sK−3/4.
The intrinsic reaction kinetics are modeled using the random pore model (RPM), as described in the literature [15,16]. The expression is given as follows:
Ψ represents the initial solid pore structure parameter, which can be calculated by Equations (2)–(26):
The radius of the solid coke particles changes continuously as the reaction proceeds. Its relationship with the conversion rate can be expressed by Equation (27):
dp,0 denotes the initial particle diameter, and β is a constant, taken here as 1 × 10⁻⁴ to enhance the convergence stability of Equation (27) at higher conversion rates.
3.3.2. Gasifier Reaction Kinetics Modeling
Based on the aforementioned gasification reaction process, the reactions within the gasifier can be divided into three zones: coal pyrolysis, the combustion reaction zone, the gasification reaction zone, and the quench zone. According to relevant theoretical studies [10,13,17,18,19], the reactions in the gasifier can be simplified as an ideal one-dimensional flow, neglecting radial parameter distribution. The resulting simulation flowchart is shown in Figure 3.
Figure 3.
Flow chart of reaction kinetics model mechanism.
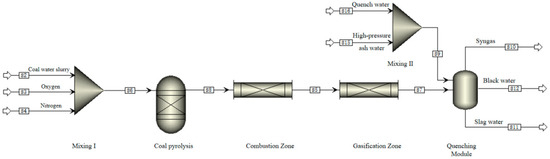
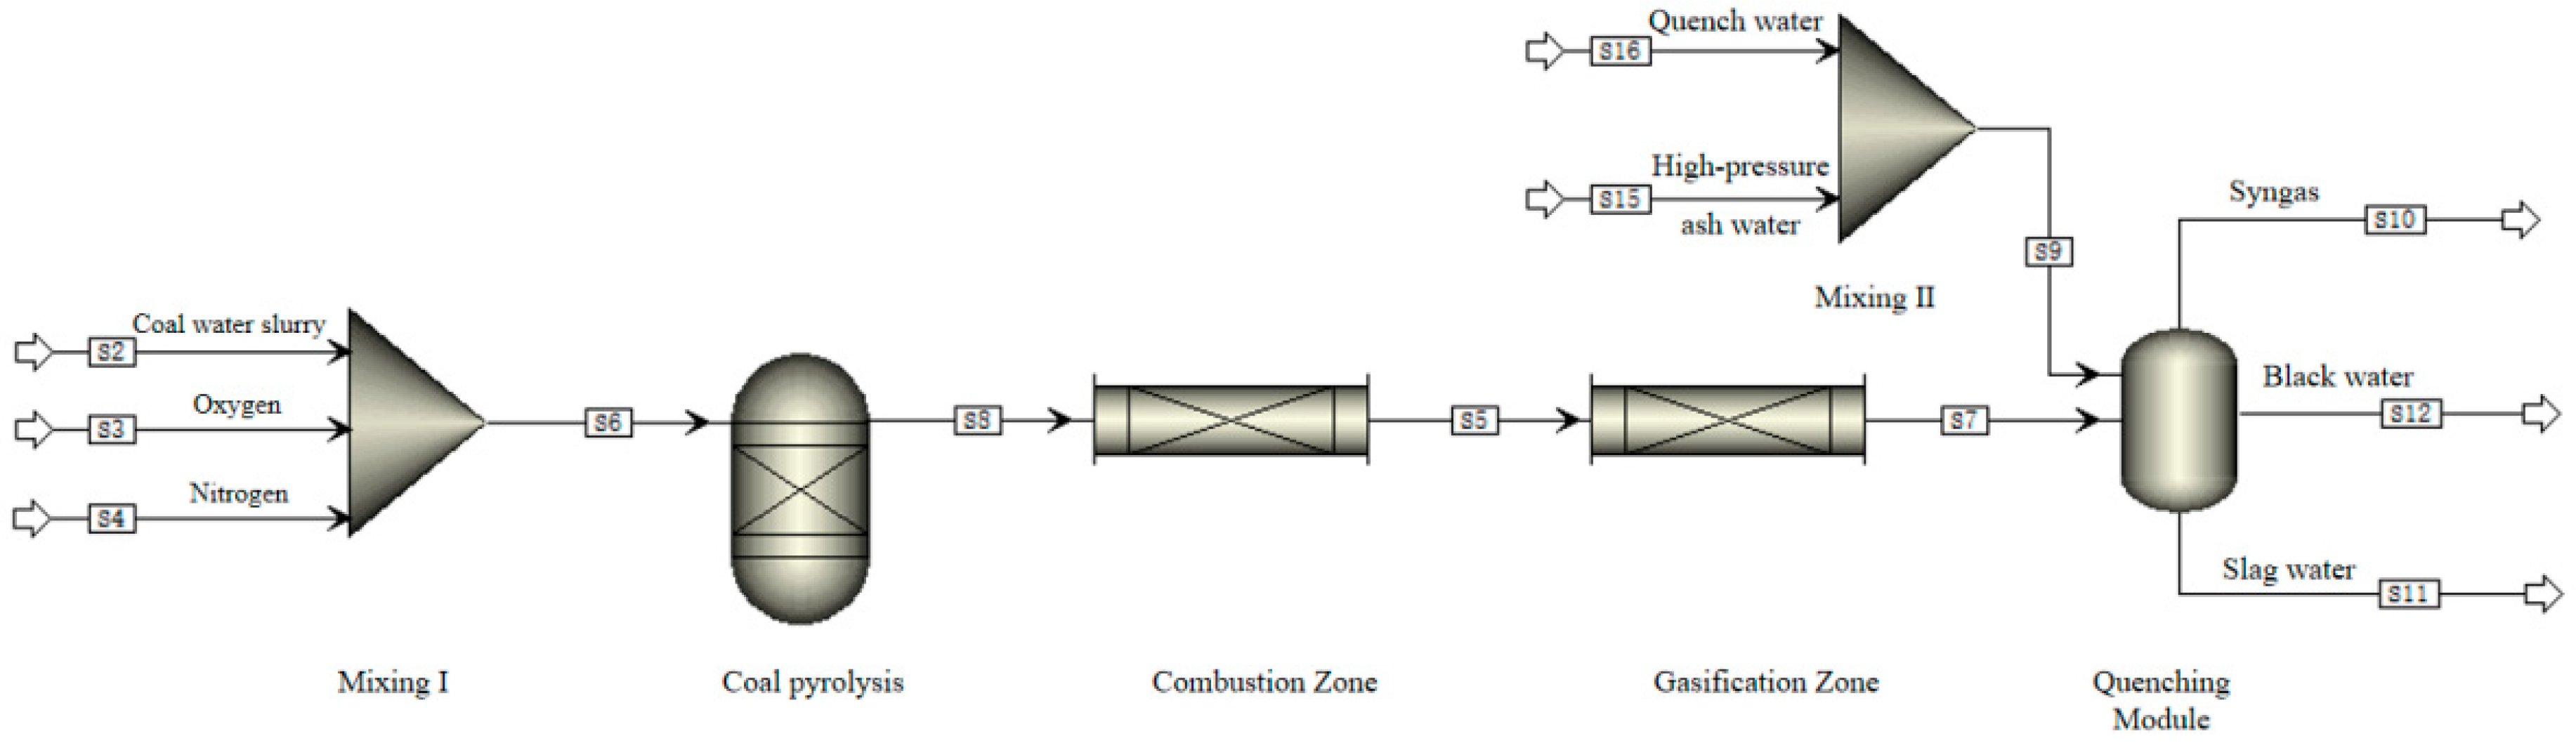
Based on the reaction kinetics mechanism described in Section 3.3.1, the model was constructed using ASPEN Plus V12. Coal pyrolysis was simulated and characterized using a yield reactor. The combustion reaction zone was modeled with a plug-flow reactor to represent the ideal one-dimensional flow process. Similarly, the gasification reaction zone was simulated using a plug-flow reactor to characterize the ideal one-dimensional flow process. The quench module is represented by an adiabatic flash model. The resulting reaction kinetics model is structured in Figure 4.
Figure 4.
Reaction kinetics model.
3.3.3. Simulation Results Validation
According to the reaction kinetics model described in Section 3.3.2, input data from Table 1, Table 2 and Table 3 are used. In addition to the aforementioned parameters, the reaction kinetics model also requires the reactor dimensions for each stage of the gasifier. Based on the study of the reaction process and the actual dimensions of the gasifier, the theoretical dimensional data for each reactor are provided in Table 6
Table 6.
Geometric dimensions of each reaction block.
Having obtained the simulation results based on the above input conditions, a root mean square deviation comparison with the plant data is shown in Table 7.
Table 7.
Comparison of simulation results with factory data.
3.4. Reaction Zone Model
3.4.1. Reaction Zone Model Mechanism
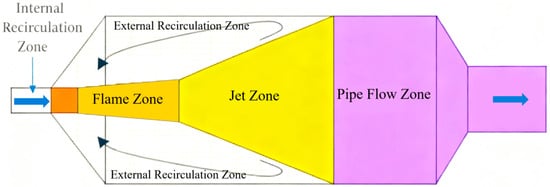
During actual operation, the internal flow field distribution in the gasifier is relatively complex and does not follow an ideal axial one-dimensional flow. Instead, there is a significant degree of material backflow, with severe material backmixing [20,21,22]. Therefore, to more accurately represent the gasification process in the gasifier, it is necessary to analyze the internal flow field. This paper references the flow field distribution in a single-nozzle GE gasifier established by Wu Yuxin et al. [14], based on the data in Table 2 and Table 3. Based on the flow field analysis results, the internal flow field distribution of the gasifier is shown in Figure 5.
Figure 5.
Flow field distribution diagram of a single-nozzle gasifier.
After the raw coal slurry and central oxygen pass through the single nozzle, the flow at the nozzle undergoes considerable mixing, forming an internal recirculation zone. The gas–solid two-phase fluid leaving the nozzle undergoes combustion reactions under high-temperature and high-pressure conditions, forming a flame zone, and develops into a jet zone under the action of the jet flow. When the expansion zone of the jet reaches the inner wall of the gasifier, part of the flow forms a large recirculation zone located on both sides of the jet zone. This area can be regarded as a uniformly mixed region, i.e., the external recirculation zone. The remaining material directly enters the pipe flow zone until it reaches the gasifier outlet.
3.4.2. Reaction Zone Model Development Process
After the raw materials enter the gasifier, coal pyrolysis occurs first. This process is extremely rapid and completes almost instantaneously. The combustion of volatiles and the homogeneous gas-phase reactions in gasification, as well as the heterogeneous gas-solid reactions, follow Equations (2)–(6) and (12)–(16). The kinetic parameters for these reactions are determined based on relevant studies and the literature [10,22,23,24,25,26,27,28,29,30,31]. According to the above process principles, the reaction zone model is established, and the workflow is shown in Figure 6.
Figure 6.
Flow field distribution flowchart of a single-nozzle gasifier.
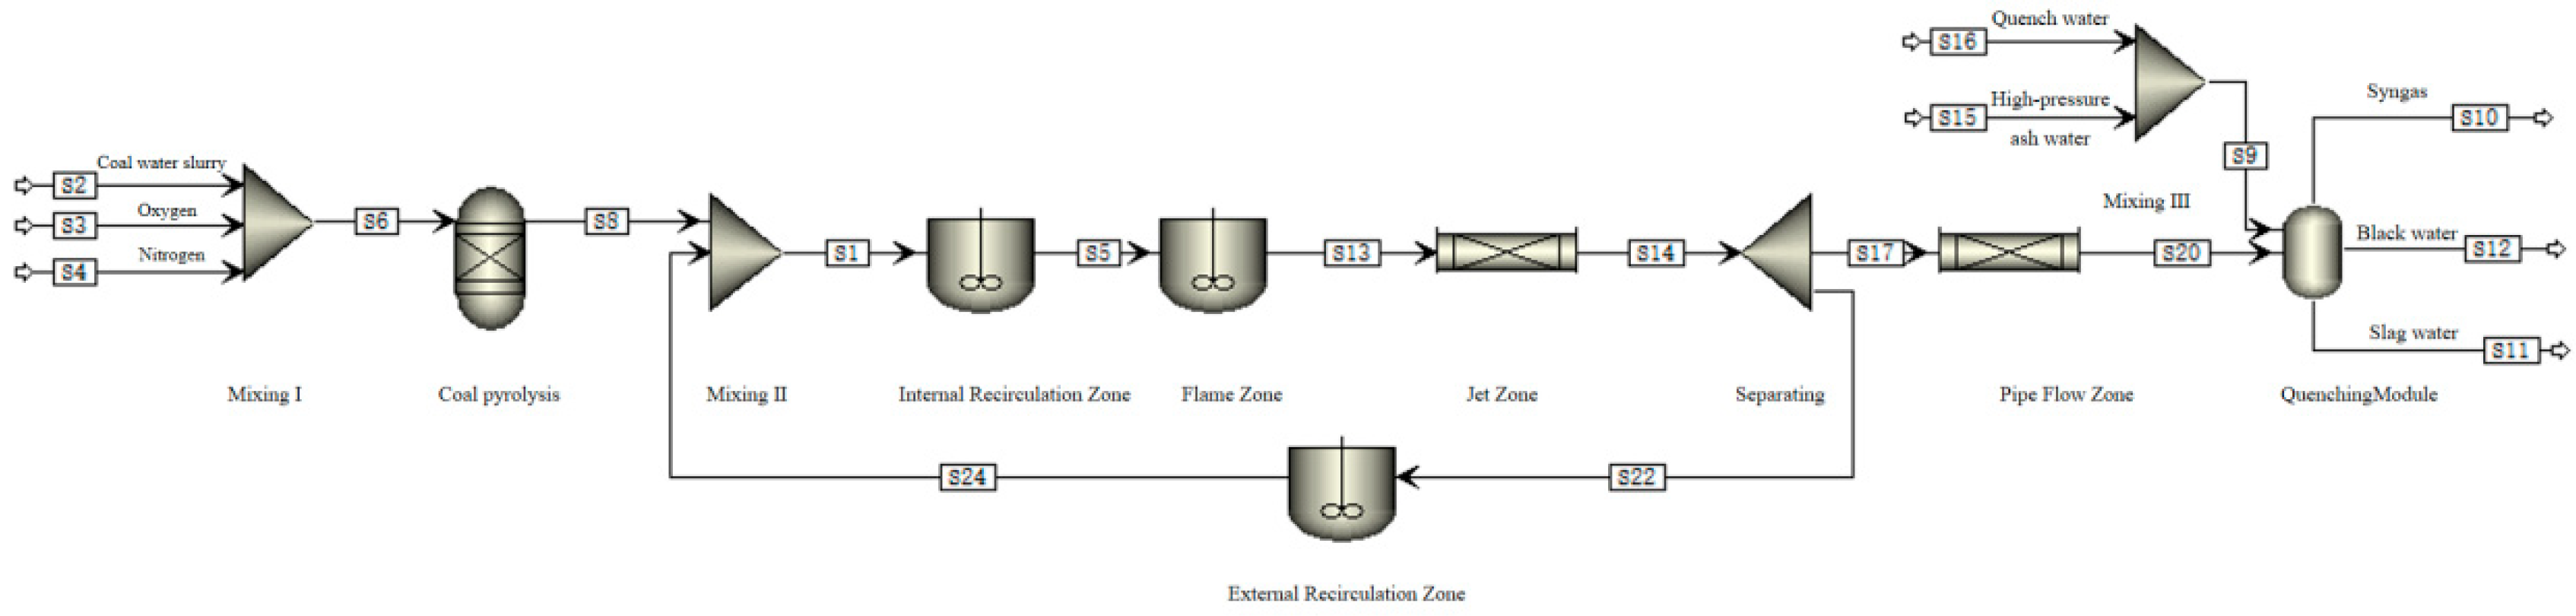
Based on the process principles illustrated in Figure 6 and combined with the relevant literature [14], a model is established. Coal pyrolysis is represented using a yield reactor. The internal recirculation zone and flame zone are characterized by a continuous stirred-tank reactor (CSTR) module. The jet zone and pipe flow, which approximate one-dimensional flow, are simulated using a plug flow reactor (PFR). The recirculation ratio of the external recirculation zone is derived according to the Thring–Newby theory [32], and the expression is as follows:
where Dgas and DC are the diameters of the burner and the gasifier body, respectively.
Based on the above process principles, the reaction zone model is established, as shown in Figure 7.
Figure 7.
Reaction zoning model.
3.4.3. Simulation Results Validation
Based on the reaction zone model described in Section 3.4.2, input data from Table 1, Table 2 and Table 3 are used. In addition to the aforementioned parameters, the reaction zone model also requires the dimensions of each reaction zone in the gasifier and the external recirculation ratio. For the dimensional data for each reaction zone, this paper references the flow field distribution in a single-nozzle GE gasifier established by Wu Yuxin et al. [14], derived from gasifier flow field analysis, and the actual dimensions of the gasifier are presented in Table 8. The external recirculation ratio, calculated based on Equation 18 and the actual dimensions of the gasifier, is determined to be 3.22.
Table 8.
Geometric dimensions of each reaction partition.
Having obtained the simulation results based on the above input conditions, a root mean square deviation comparison with the plant data is shown in Table 9.
Table 9.
Simulation results and factory data.
3.5. Simulation Results Analysis
The simulation results of the three aforementioned models were analyzed using root mean square deviation (RMSD) against plant operational data, and the comparative results are presented in Table 10 and Table 11.
Table 10.
RMSD of simulation results and factory data.
Table 11.
RMSD of reaction kinetics model and reaction zone model.
The data in Table 10 and Table 11 indicate that the three self-developed gasifier models constructed in this study exhibit relatively small errors compared to the actual data, and all can effectively predict the operational performance of the entrained-flow gasifier using Hongshaquan coal from the Xinjiang Zhundong Coalfield as feedstock.
4. Study of the Impact of Operating Condition Variations on Gasification
Now that the three aforementioned models have been validated with industrial data, this study further investigates the impact of the oxygen-to-coal ratio and coal water slurry concentration on gasification performance. In all simulations, only a single variable (either the oxygen-to-coal ratio or coal water slurry concentration) was altered.
4.1. Effect of Slurry Concentration on Syngas Composition
A coal water slurry gasifier essentially operates as a thermal balance furnace, with heat release primarily achieved through the two reactions mentioned above. The effective gas content in coal water slurry gasifiers is relatively low, generally maintained at around 80%, with CO2 content approaching 20%. This indicates a certain gap compared to the effective gas yield in pulverized coal gasification. The reason for this is the excessive water content carried by the coal slurry. The high moisture level wastes system heat, and to maintain the gasifier temperature, the system must increase oxygen supply, allowing carbon and oxygen to react and generate more carbon dioxide, thereby releasing additional heat to sustain thermal balance. To understand the actual impact of coal slurry concentration on the gasification unit, it is necessary to conduct studies using models.
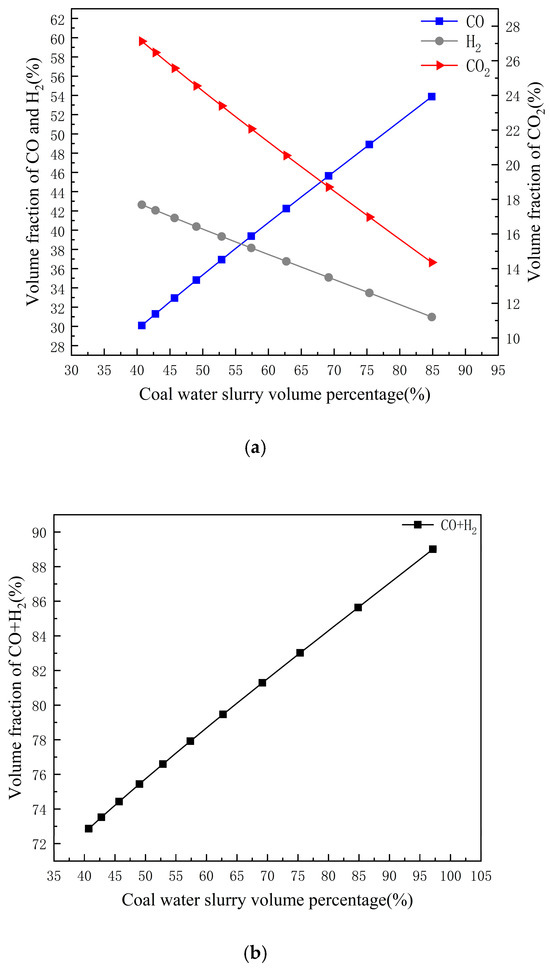
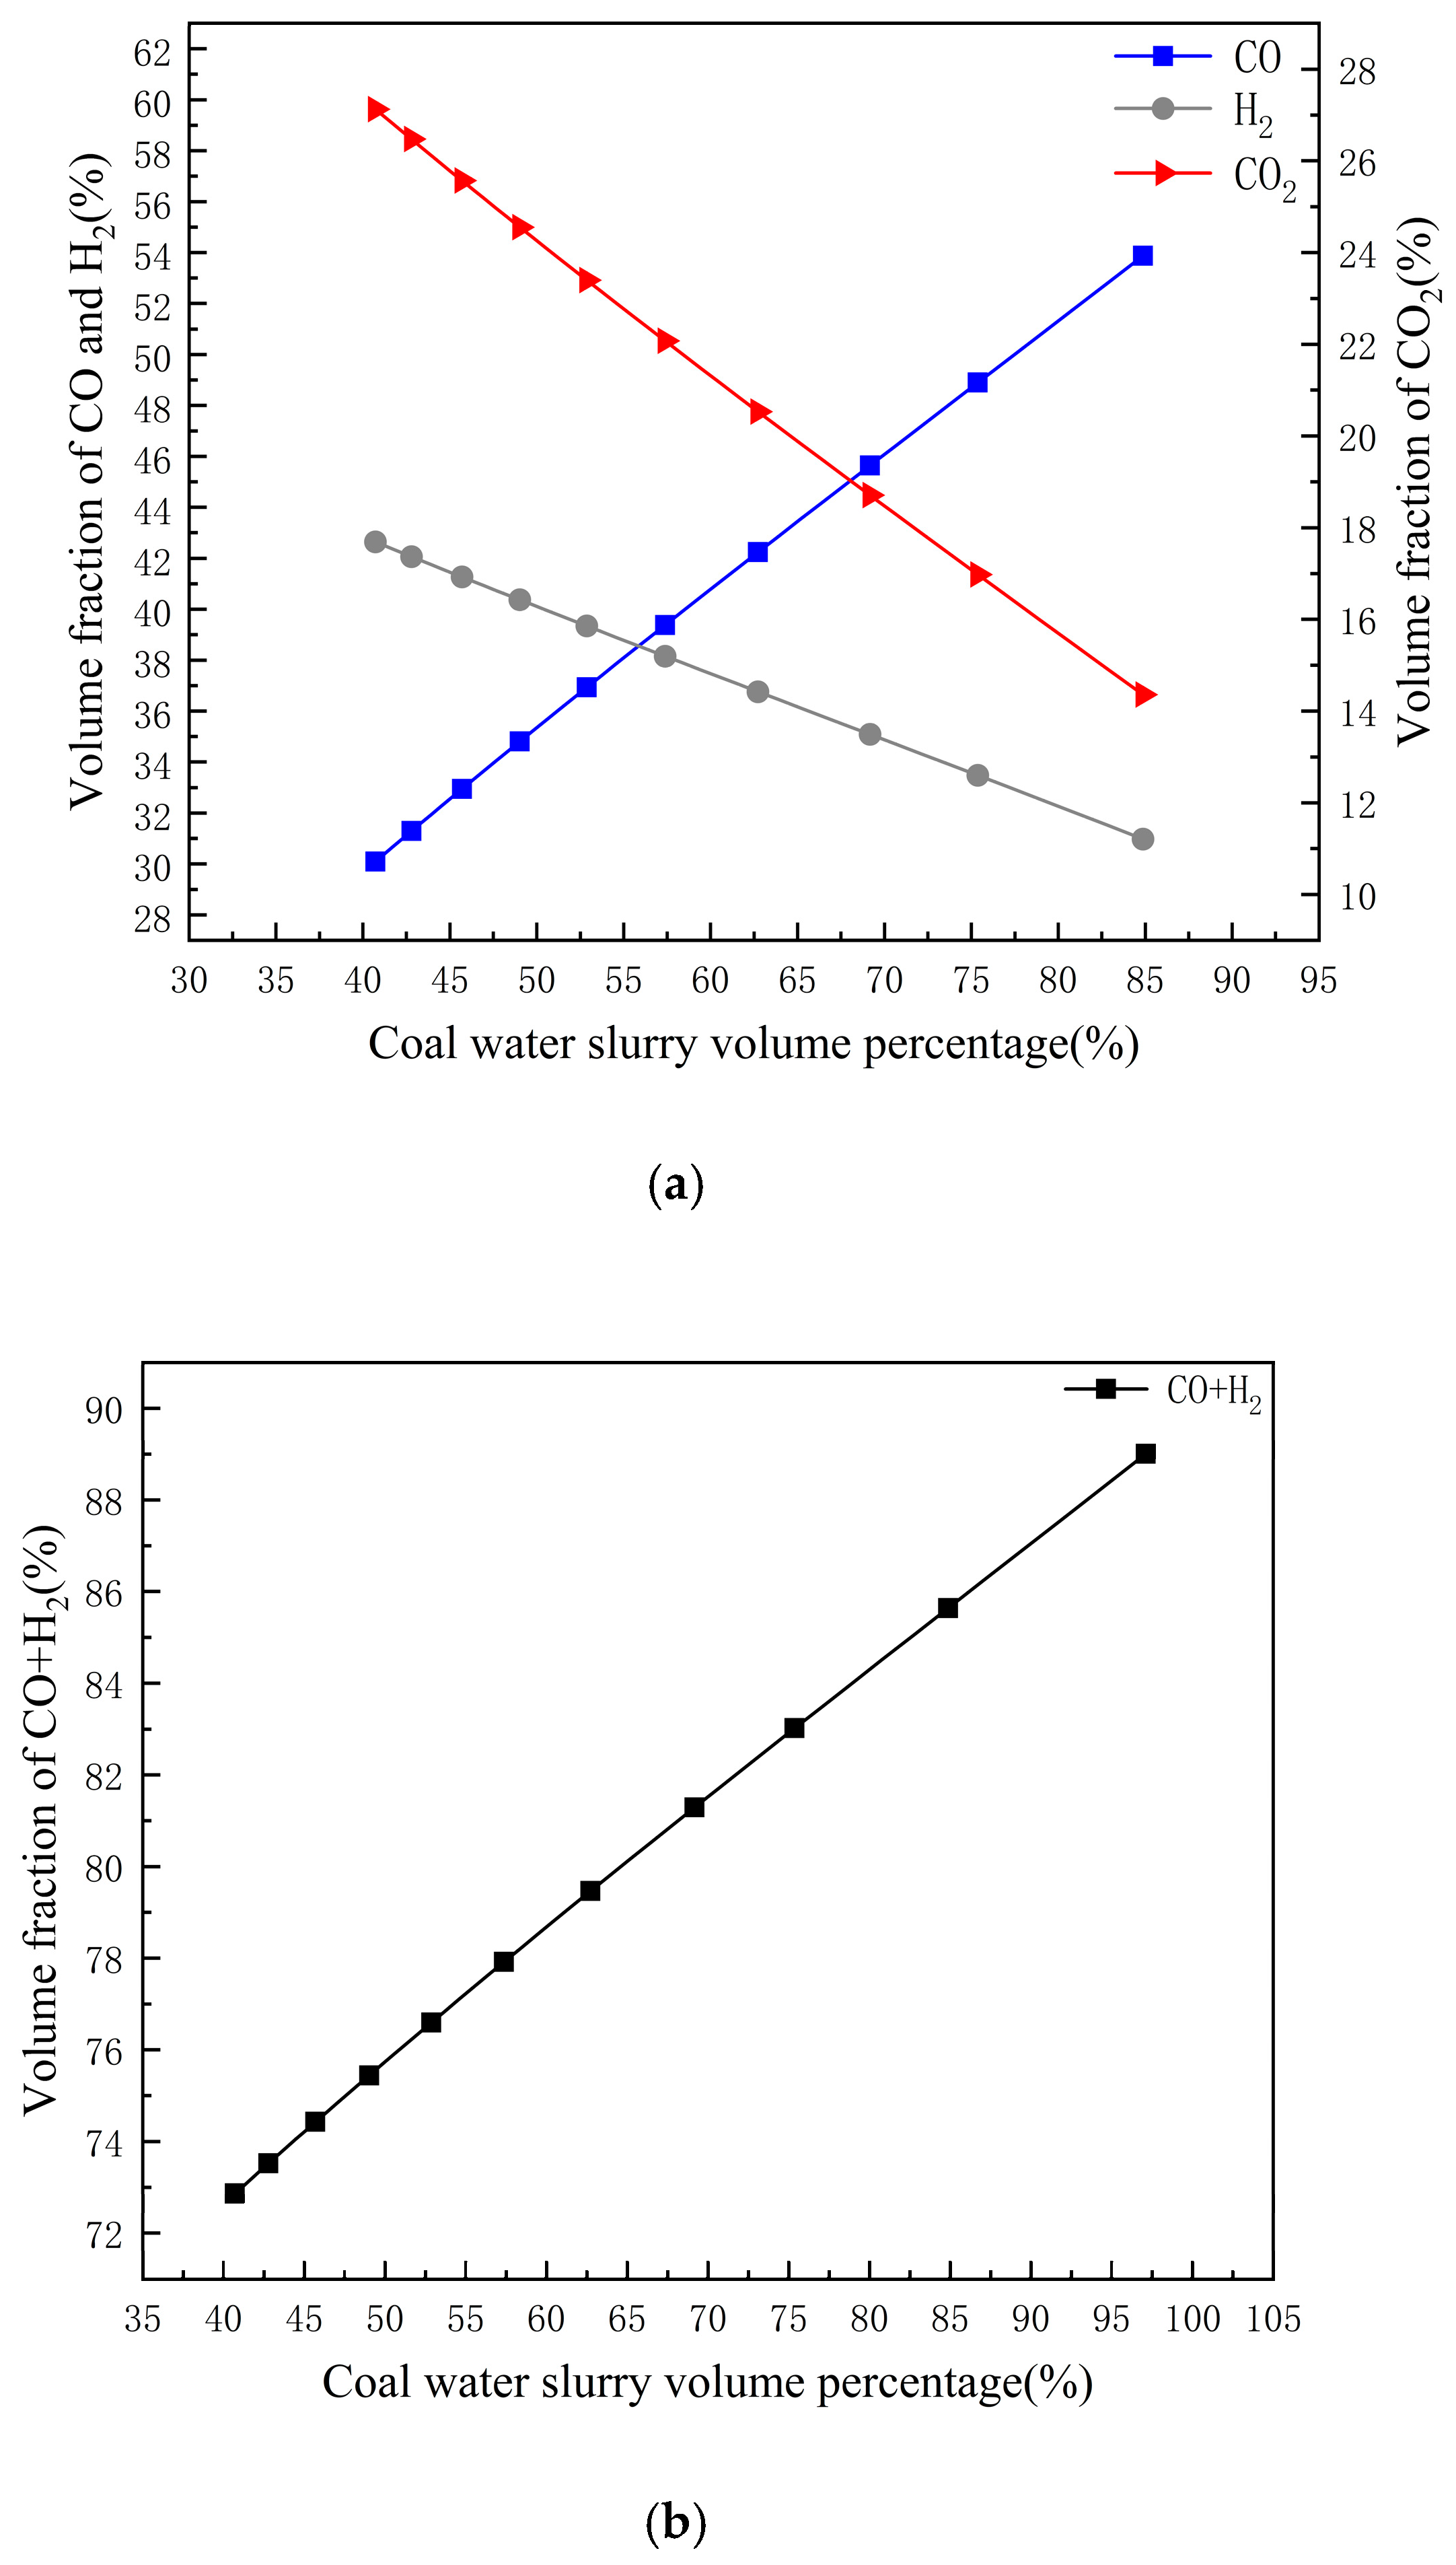
Under constant reaction temperatures, pressure, coal slurry consumption, and oxygen flow rates, the equilibrium model established above was used to simulate the effect of coal slurry concentration on gasification reaction products. As shown in Figure 8a,b, with the increase in coal slurry concentration, the volume fraction of CO shows an upward trend, while the volume fractions of CO2 and H2 exhibit a downward trend. The volume fraction of effective gas demonstrates an increasing trend.
Figure 8.
(a) Trends of different syngas components with variation in coal slurry volume fraction. (b) The variation trend of the effective gas integral number with the volume fraction of coal slurry.
4.2. Influence of Coal Slurry Concentration on Consumption
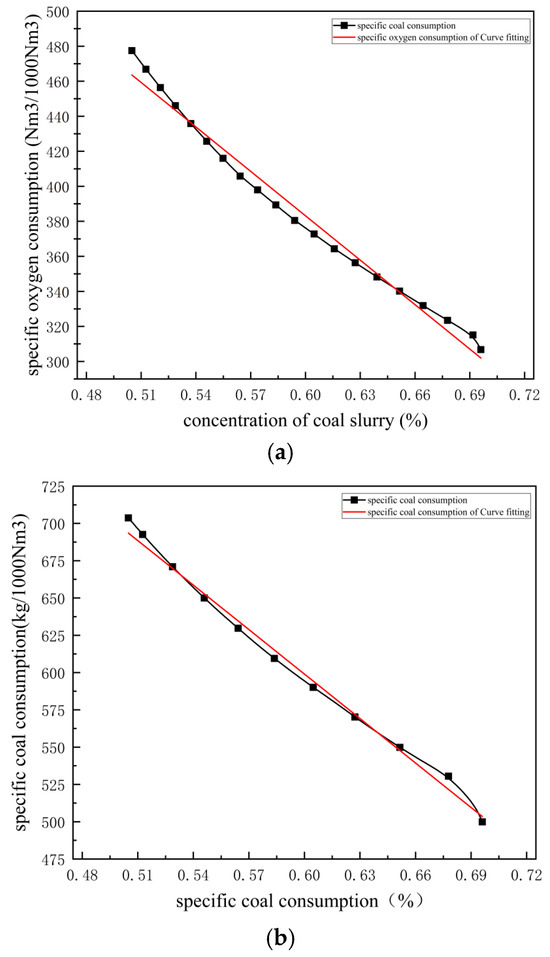
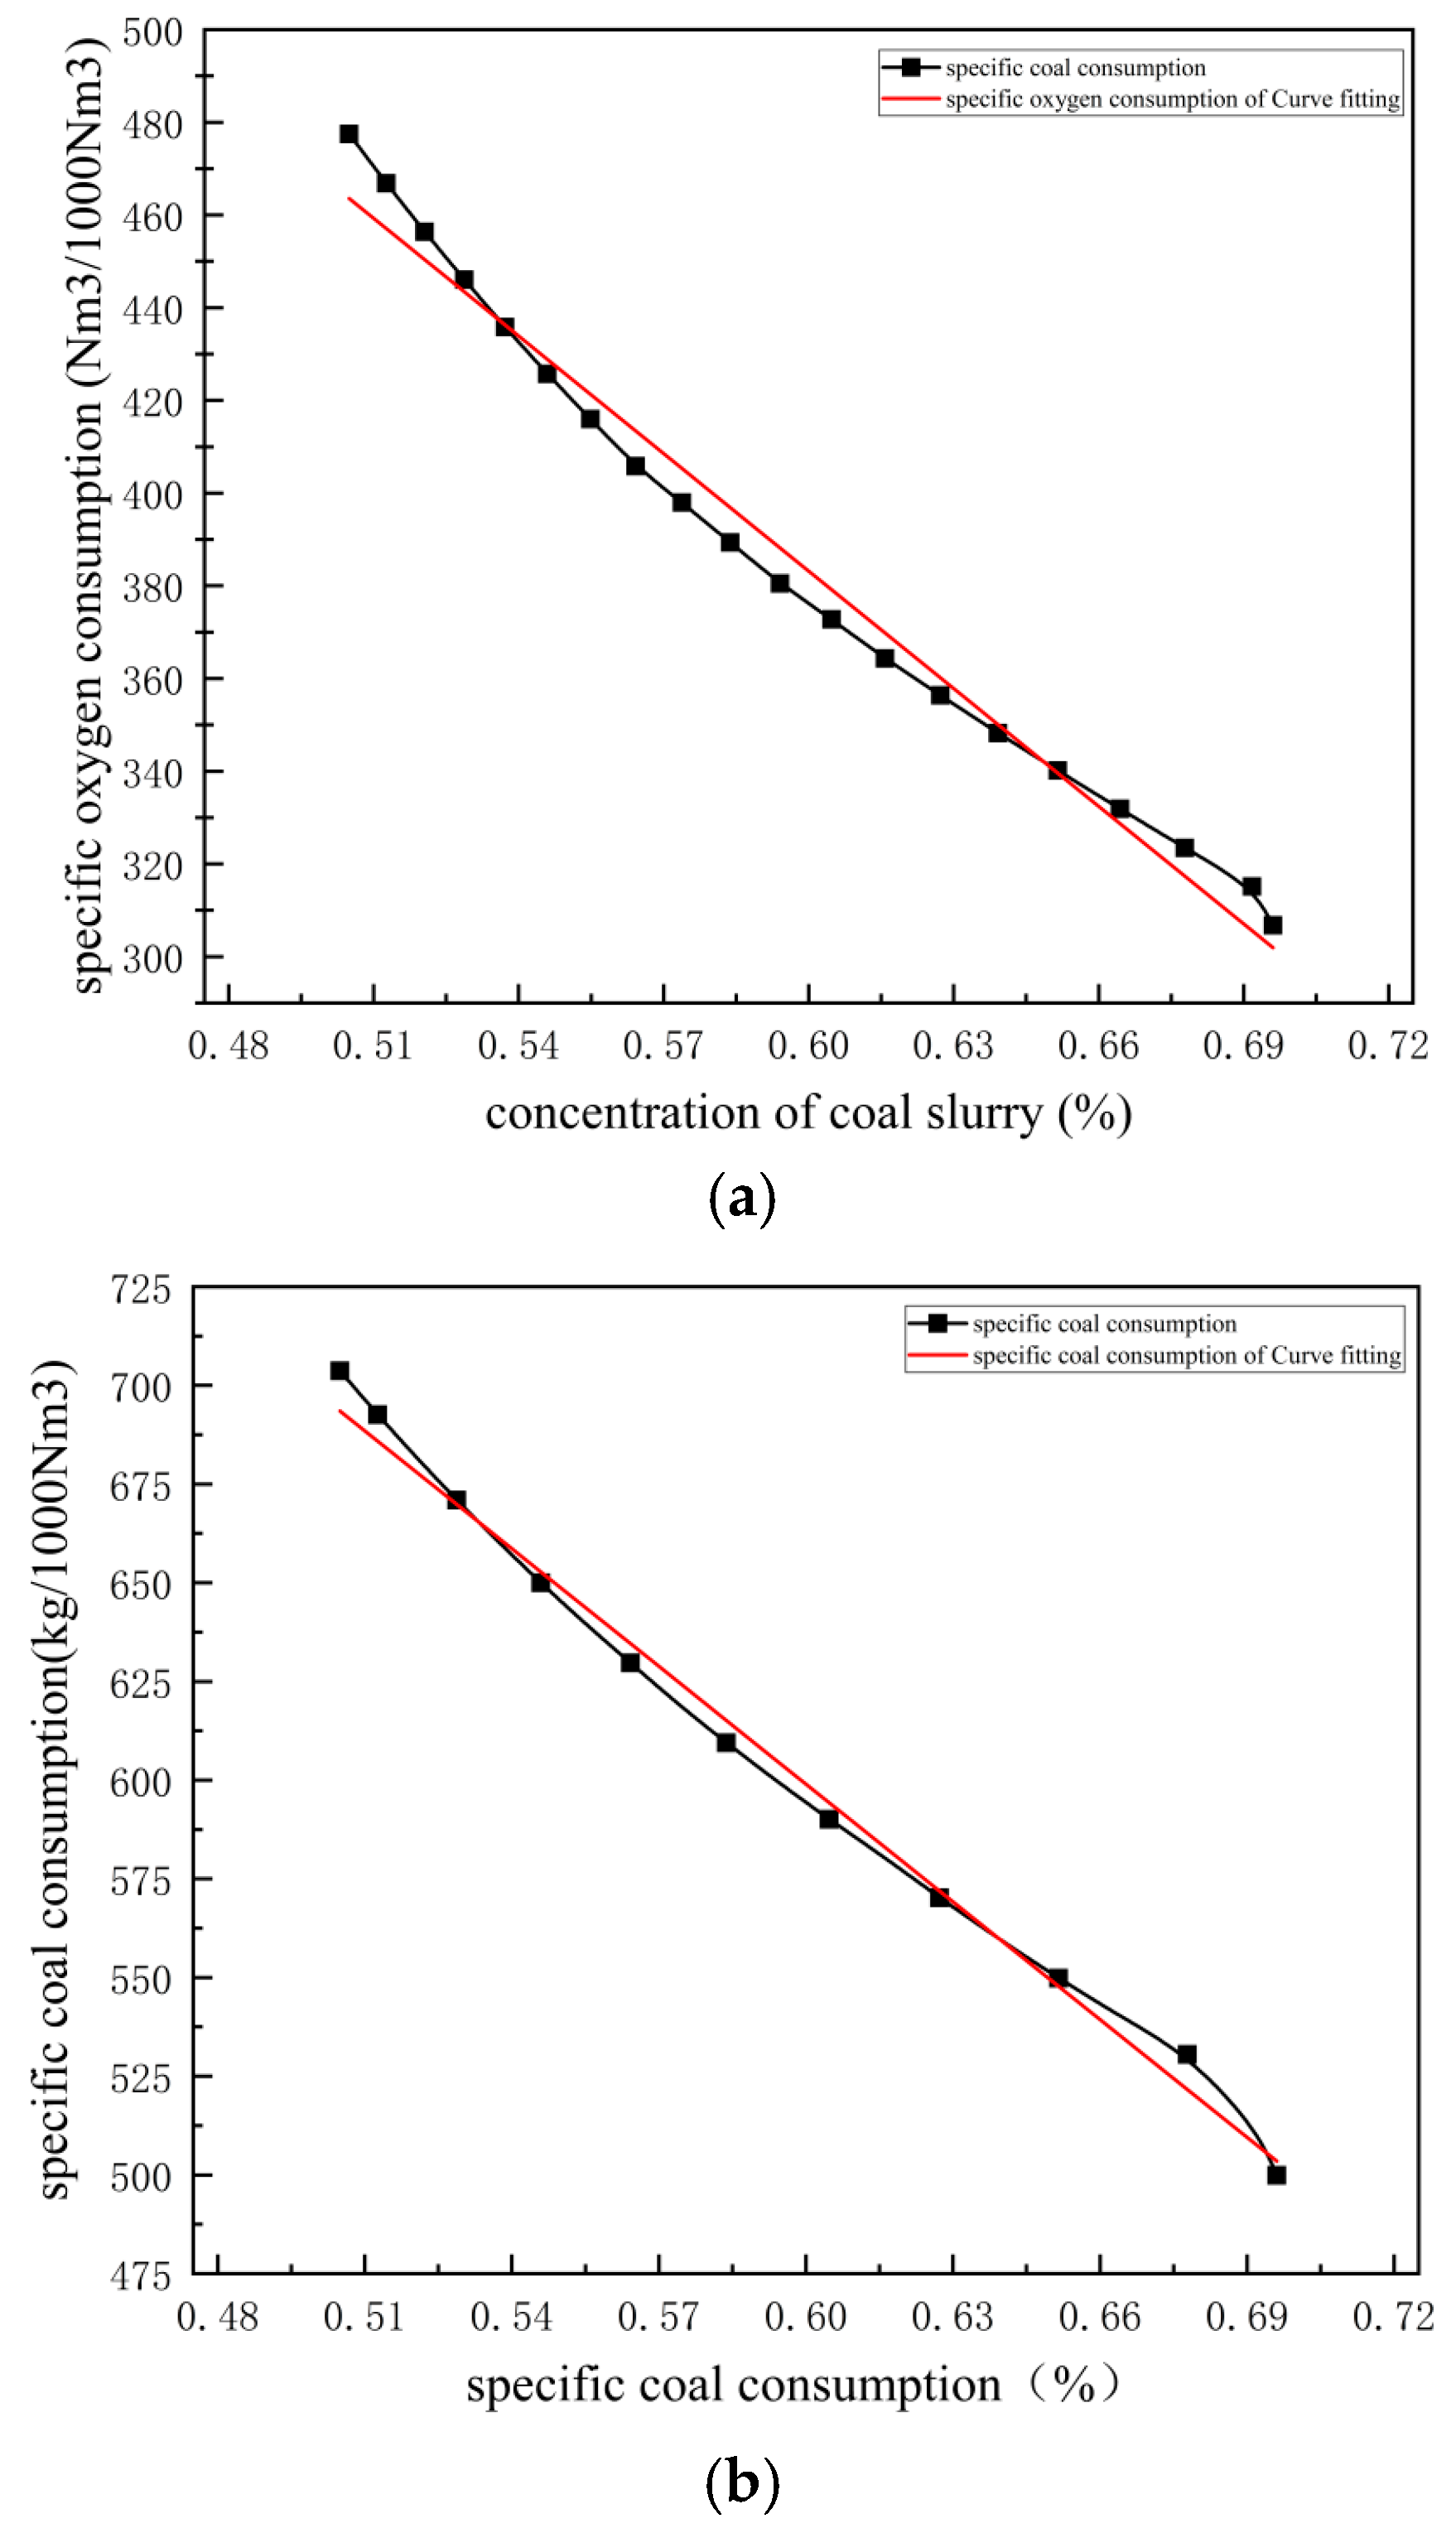
The water–coal slurry gasifier operates as a heat-balanced furnace, producing an effective gas composition of approximately 80% (by volume), with CO2 content nearing 20%. This contrasts with the effective gas ratio in pulverized coal gasification processes. The primary cause lies in excessive water content within the slurry, which wastes system heat. To maintain gasifier temperature, the system must increase oxygen supply to facilitate carbon–oxygen reactions, releasing additional heat to sustain thermal balance. Therefore, enhancing the slurry concentration represents the most critical pathway to reduce consumption in coal slurry gasification. Simulating the correlation between slurry concentration and consumption provides a foundation for economic comparisons during subsequent technological upgrades. Using the established equilibrium model, this study simulates specific coal consumption (kg of dry basis coal per 1000 Nm3 of effective gas) and oxygen consumption (Nm3 of oxygen per 1000 Nm3 of effective gas) under different slurry concentrations, followed by linear fitting, as shown in Figure 9a,b. Both specific coal consumption and oxygen consumption decrease with increasing slurry concentration. Linear fitting reveals that a 1% increase in slurry concentration reduces specific coal consumption by 9.94 kg and specific oxygen consumption by 8.45 Nm3.
Figure 9.
(a) The variation trend of specific oxygen consumption with coal slurry concentration. (b) The variation trend of specific coal consumption with coal slurry concentration.
4.3. Effect of Oxygen-to-Coal Ratio
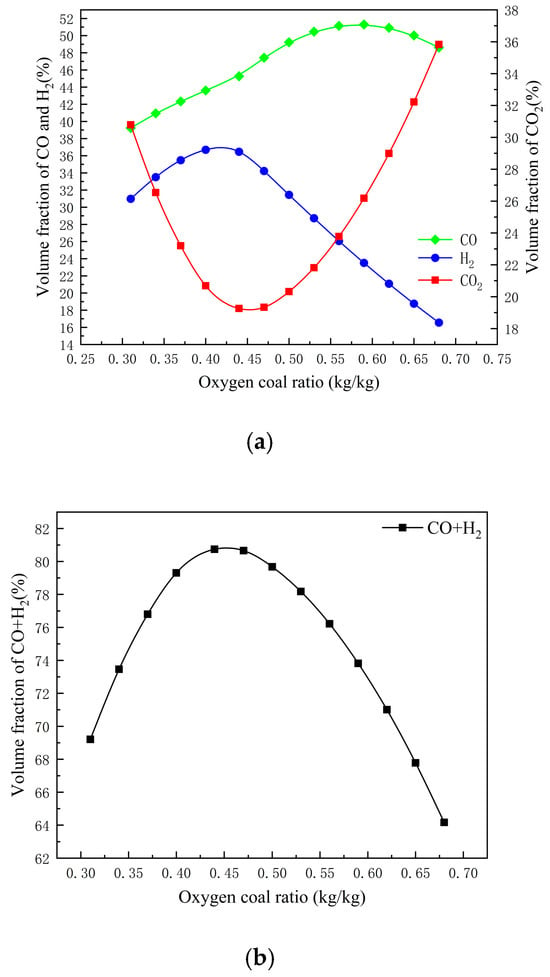
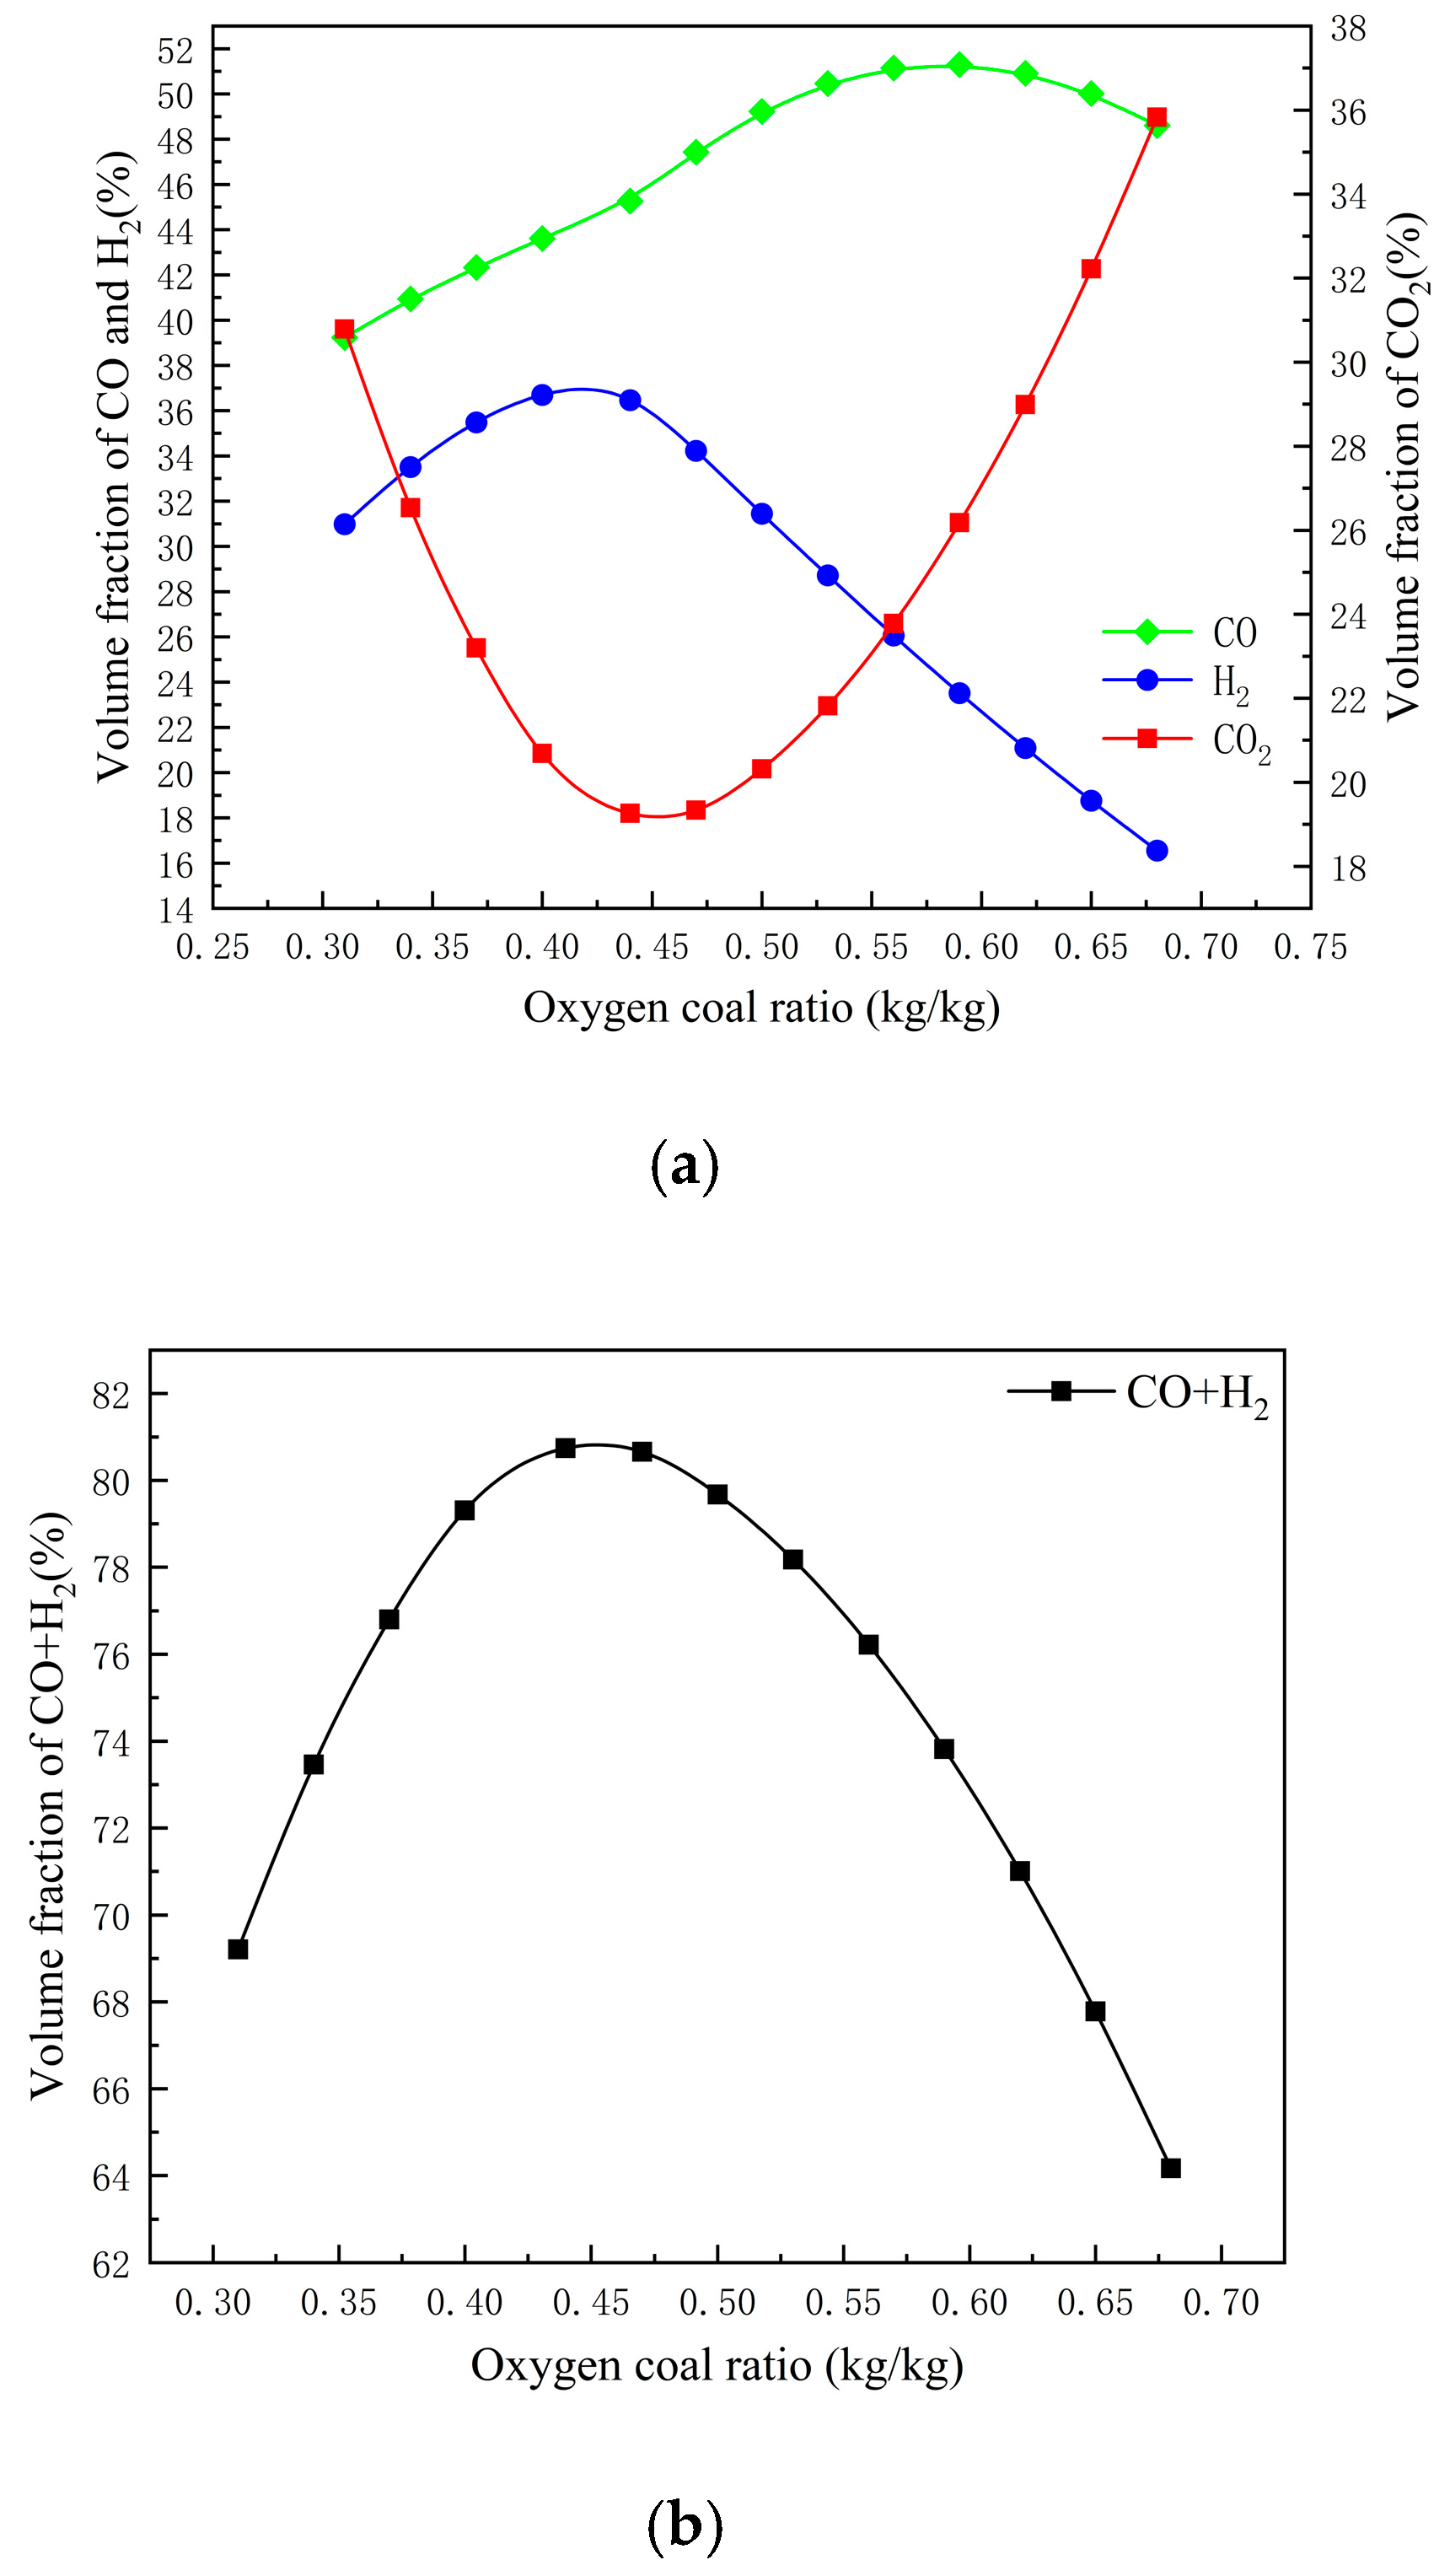
The oxygen-to-coal ratio is a core parameter controlling the operating temperature and carbon conversion rate in coal water slurry gasifiers. For synthetic ammonia plants, the primary control of the oxygen-to-coal ratio aims to maximize the yield of effective gas (CO + H2) while meeting the temperature requirements of the gasifier. Therefore, simulating the trend of effective gas composition changes with adjustments in the oxygen-to-coal ratio under a specific coal slurry concentration (input at the conventional concentration of 60%) holds significant importance for practical production. Figure 10a,b illustrate the variation in effective gas yield under different oxygen-to-coal ratios. As the oxygen-to-coal ratio (the ratio of oxygen mass to coal slurry mass) increases, the volume fraction of CO gradually rises, reaching a slow decline around an oxygen-to-coal ratio of 0.6. The volume fraction of H2 initially increases gradually and then decreases rapidly. The volume fraction of CO2 shows an initial sharp decline, followed by a significant rise. When effective gas (CO + H2) is analyzed collectively, its volume fraction first increases and then decreases with the gradual increase in the oxygen-to-coal ratio. The highest effective gas volume fraction of 80.7% is achieved when the oxygen-to-coal ratio is around 0.45.
Figure 10.
(a) The variation trend of different syngas components with the oxygen–coal ratio. (b) The transformation trend of the effective gas integral number with the oxygen–coal ratio.
5. Conclusions
This study focuses on a single-nozzle entrained-flow gasifier, using two types of Hongshaquan coal from the Xinjiang Zhundong Hongshaquan Coalfield as the research feedstock. By investigating the reaction process and mechanisms of the entrained-flow gasifier, three independent models—equilibrium reaction, reaction kinetics, and reaction zone models—were developed to simulate the coal gasification process. Based on the simulation results, the following conclusions are drawn:
(1) By comparing the model simulation results with actual operational data, the errors were found to be relatively small. Therefore, all three models are capable of predicting the operational process of the entrained-flow gasifier using Hongshaquan coal from the Xinjiang Zhundong Coalfield as feedstock.
(2) The equilibrium reaction model is based on the principle of Gibbs free energy minimization and assumes that the syngas at the gasifier outlet is essentially in an equilibrium state, consistent with the actual reactions occurring inside the gasifier. With only a small amount of equipment and process operating parameters, the gasification process can be simulated, and the simulation results show minor deviations from actual operational data (1.14% and 1.09%). It can predict the operational performance of the gasifier. However, this model also has limitations, such as an inability to calculate reaction progress or obtain product distribution.
(3) The reaction kinetics model assumes that the fluid flow within the gasifier follows an ideal one-dimensional process. By applying the kinetic principles of relevant reactions in the gasifier and inputting the actual geometric dimensions of the gasifier, it simulates the internal reaction processes. This model not only accurately predicts the outcomes of the gasification reactions (with deviations of 0.65% and 0.61% from actual operational data) but also calculates the reaction progress and obtains the axial distribution of the products.
(4) The reaction zone model, building upon the operational mechanism of the reaction kinetics model, fully accounts for the fluid flow characteristics within the gasifier. By partitioning the gasifier based on its flow field properties and representing each zone with corresponding reaction modules, this model most closely approximates actual operational conditions. It achieves the smallest deviation between simulation results and actual production data (with errors of only 0.44% and 0.368% for the two coal samples). In addition to calculating reaction progress, it also provides the two-dimensional distribution of key parameters inside the gasifier, thereby reflecting the actual operational conditions within the gasifier to the greatest extent.
(5) The equilibrium model among the three models was used to study the effects of coal water slurry concentration and the oxygen-to-coal ratio on gas composition. Under the condition that other input parameters remain unchanged, an increase in the coal water slurry concentration leads to a rise in the effective gas content (CO + H2). Additionally, by analyzing the impact of coal slurry concentration changes on gasification consumption, it was found that increasing the coal slurry concentration by 1% reduces coal consumption by 9.94 kg and oxygen consumption by 8.45 Nm3. When other inputs are held constant, and the coal slurry concentration is temporarily set at 60%, a gradual increase in the oxygen-to-coal ratio results in the effective gas content first increasing and then decreasing. The molar fraction of effective gas reaches its maximum value of 80.7% when the oxygen-to-coal ratio is approximately 0.45. The coal gasification reactor established in this study can accurately simulate the coal gasification reaction process and possesses significant practical value.
Author Contributions
B.Z.: Methodology, Investigation, Conceptualization. C.H.: Resources, Visualization, Validation. X.L.: Writing—Original Draft, Software. P.W.: Writing—Review and Editing, Supervision, Funding Acquisition. S.Y.: Writing—Review and Editing, Supervision. All authors have read and agreed to the published version of the manuscript.
Funding
This research was funded by the Key Research and Development Program of the Sub-project of the National Science and Technology Project “2023–2026 New Green Fertilizer Product Creation Project” (Grant No. NK202218050308). The funders had no role in the design of the study; in the collection, analyses, or interpretation of the data; in the writing of the manuscript; or in the decision to publish the results.
Data Availability Statement
The data used to support the findings of this study are available from the corresponding author upon reasonable request. The raw data include coal quality analysis reports, plant operational parameters, and simulation input/output files generated via Aspen Plus V12.
Conflicts of Interest
Authors Xudong Li and Pei Wu were employed by the Henan Xinlianxin Chemical Industry Group Co., Ltd. The remaining authors declare that the research was conducted in the absence of any commercial or financial relationships that could be construed as a potential conflict of interest.
Nomenclature
| Abbreviations | |
| GE | General Electric |
| Symbols | |
| A | Area |
| G | Gibbs free energy |
| h | Specific enthalpy |
| i | Current density |
| I | Current |
| L | Length |
| n | Molar flow rate |
| P | Power/pressure |
| T | Temperature |
| Ua | Air utilization factor |
| Uf | Fuel utilization factor |
| V | Voltage |
| Vohm | Ohmic loss |
| Vi | Simulated value |
| Wi | Factory data |
| Reaction rate of gas-phase combustion | |
| A | Pre-factor |
| Ea | Activation energy |
| R | Molar gas constant |
| C | Reactant concentration |
| Tg | Gas reaction temperature |
| Rg-s | Reaction rate |
| Kd | Gas–solid-phase diffusion rate constant |
| Kash | Gray layer diffusion rate constant |
| Diffusion rate of gas phase | |
| Intrinsic reaction rate of coke gasification | |
| Gas-phase diffusion coefficient | |
| Ψ | Initial solid pore structure parameters |
| dp,0 | Initial diameter of particles |
| Dgas | Burner diameter |
| DC | Diameter of gasifier body |
| Greek letters | |
| γ | Pre-exponential coefficient |
| η | Efficiency |
| β | Constant |
| Subscripts | |
| avg | Average |
| p | Pump |
| T | Turbine |
References
- Peng, S.P. China Coal Resource Exploitation and Environmental Protection. Sci. Technol. Rev. 2009, 27, 102–108. [Google Scholar]
- Ni, W.D.; Xue, Y.; Li, Z. Poly Energy System Based on Coal Gasification-Integrated Optimization and Sustainable Development of Resources, Energy and Environment. Eng. Sci. 2000, 2, 59–68. [Google Scholar]
- Consultant Committee of China State Major Fundamental Research Plan. Strategy Report on Energy Field in the 10th “Five-Year Plan”. Ministry of Science and Technology of the People’s Republic of China: Beijing, China, 2001. Available online: http://www.most.gov.cn/xxgk/zfwj/2001/ (accessed on 15 March 2024).
- Yu, Z.; Wang, P. Coal Gasification Technology; Chemical Industry Press: Beijing, China, 2010. [Google Scholar]
- Silaen, A.K. Comprehensive Modeling and Numerical Investigation of Entrained-Flow Coal Gasifier. Ph.D. Thesis, University of New Orleans, New Orleans, LA, USA, 2010. [Google Scholar]
- Williams, A.; Ni, Q. A simulation study on the performance of an entrained-flow coal gasifier. Fuel 1995, 74, 102–110. [Google Scholar] [CrossRef] [Scilit]
- Smith, W.R.; Missen, R.W. Chemical Reaction Equilibrium Analysis: Theory and Algorithms; Wiley: New York, NY, USA, 1982. [Google Scholar]
- Dai, Z.H.; Guo, X.L.; Gong, X.; Liu, H.; Wang, F.; Yu, Z. Pilot-trial and modeling of a new type of pressurized entrained-flow pulverized coal gasification technology. Fuel 2008, 87, 2304–2313. [Google Scholar] [CrossRef] [Scilit]
- Merrick, D. Mathematical models of the thermal decomposition of coal: 1. The evolution of volatile matter. Fuel 1983, 62, 534–539. [Google Scholar] [CrossRef] [Scilit]
- Kong, X. Modeling, Control, and Optimization of Industrial Entrained-Flow Coal-Water Slurry Gasifiers. Ph.D. Thesis, East China University of Science and Technology, Shanghai, China, 2014. [Google Scholar]
- Cen, K. Theory, Design, and Operation of Circulating Fluidized Bed Boilers; Electric Power Press: Beijing, China, 1998. [Google Scholar]
- De Souza-Santos, M. Comprehensive modelling and simulation of fluidized bed boilers and gasifiers. Fuel 1989, 68, 1507–1521. [Google Scholar] [CrossRef] [Scilit]
- Wen, C. Entrainment coal gasification modeling. Ind. Eng. Chem. Process Des. Dev. 1979, 18, 684–695. [Google Scholar] [CrossRef] [Scilit]
- Wu, Y.X.; Zhang, J.S.; Smith, P.J.; Zhang, H.; Reid, C.; Lv, J.F.; Yue, G.X. Three-dimensional simulation for an entrained flow coal slurry gasifier. Energy Fuels 2010, 24, 1156–1163. [Google Scholar] [CrossRef] [Scilit]
- Bhatia, S.; Perlmutter, D. A random pore model for fluid–solid reactions: I. Isothermal, kinetic control. AIChE J. 1980, 26, 379–386. [Google Scholar] [CrossRef] [Scilit]
- Bhatia, S.; Perlmutter, D. A random pore model for fluid–solid reaction: I.I. Diffusion and transport effects. AIChE J. 1981, 27, 247–254. [Google Scholar] [CrossRef] [Scilit]
- Vamvuka, D.; Woodburn, E.T.; Senior, P.R. Modeling of an entrained flow coal gasifier 1. Development of the model and general predictions. Fuel 1995, 74, 1452–1460. [Google Scholar] [CrossRef] [Scilit]
- Vamvuka, D.; Woodburn, E.T.; Senior, P.R. Modeling of an entrained flow coal gasifier 2. Effect of operating conditions on reactor performance. Fuel 1995, 74, 1461–1465. [Google Scholar] [CrossRef] [Scilit]
- Liu, G.S.; Rezaei, H.; Lucas, J.; Harris, D.; Wall, T. Modeling of a pressurised entrained flow coal gasifier: The effect of reaction kinetics and char structure. Fuel 2000, 79, 1767–1779. [Google Scholar] [CrossRef] [Scilit]
- Wang, F.; Dai, Z.; Gong, X.; Zhou, Z.; Yu, Z. Analysis and Simulation of the Shell Pulverized Coal Gasifier. J. East China Univ. Sci. Technol. Nat. Sci. Ed. 2003, 29, 202–205. [Google Scholar]
- Monaghan, R.F.D.; Ghoniem, A.F. A dynamic reduced order model for simulating entrained flow gasifier: Part I: Model development and description. Fuel 2012, 91, 61–80. [Google Scholar] [CrossRef] [Scilit]
- Monaghan, R.F.D.; Ghoniem, A.F. A dynamic reduced order model for simulating entrained flow gasifier: Part II: Model validation and sensitivity analysis. Fuel 2012, 94, 280–297. [Google Scholar] [CrossRef] [Scilit]
- Watanabe, H.; Otaka, M. Numerical simulation of coal gasification in entrained flow coal gasifier. Fuel 2006, 85, 1935–1943. [Google Scholar] [CrossRef] [Scilit]
- Dryer, F.; Glassman, I. High-temperature oxidation of CO and CH4. Symp. (Int.) Combust. 1973, 14, 987–1003. [Google Scholar] [CrossRef] [Scilit]
- Westbrook, C.K.; Dryer, F.L. Chemical kinetic modeling of hydrocarbon combustion. Prog. Energy Combust. Sci. 1984, 10, 1–57. [Google Scholar] [CrossRef] [Scilit]
- Jones, W.; Lindstedt, R. Global reaction schemes for hydrocarbon combustion. Combust. Flame 1988, 73, 233–249. [Google Scholar] [CrossRef] [Scilit]
- Bustamante, F.; Enick, R.; Killmeyer, R.; Howard, B.; Rothenberger, K.; Cugini, A.; Morreale, B.; Ciocco, M. Uncatalyzed and wall-catalyzed forward water-gas shift reaction kinetics. AIChE J. 2005, 51, 1440–1454. [Google Scholar] [CrossRef] [Scilit]
- Qian, F.; Kong, X.; Cheng, H.; Du, W.; Zhong, W. Development of a kinetic model for industrial entrained flow coal gasifiers. Ind. Eng. Chem. Res. 2013, 52, 1819–1828. [Google Scholar] [CrossRef] [Scilit]
- Mühlen, H.-J.; van Heek, K.H.; Jiintgen, H. Kinetic studies of steam gasification of char in the presence of H2, CO2, and CO. Fuel 1985, 64, 944–949. [Google Scholar] [CrossRef] [Scilit]
- Silaen, A.; Wang, T. Effect of turbulence and devolatilization models on coal gasification simulation in an entrained-flow gasifier. Int. J. Heat Mass Transf. 2010, 53, 2074–2091. [Google Scholar] [CrossRef] [Scilit]
- Brown, B.; Smoot, L.; Smith, P.; Hedman, P. Measurement and prediction of entrained-flow gasification processes. AIChE J. 1988, 34, 435–446. [Google Scholar] [CrossRef] [Scilit]
- Syred, N.; Beer, J. Combustion in swirling flows: A review. Combust. Flame 1974, 23, 143–201. [Google Scholar] [CrossRef] [Scilit]



Disclaimer/Publisher’s Note: The statements, opinions and data contained in all publications are solely those of the individual author(s) and contributor(s) and not of MDPI and/or the editor(s). MDPI and/or the editor(s) disclaim responsibility for any injury to people or property resulting from any ideas, methods, instructions or products referred to in the content. |
© 2026 by the authors. Licensee MDPI, Basel, Switzerland. This article is an open access article distributed under the terms and conditions of the Creative Commons Attribution (CC BY) license.