


Abstract
Against the backdrop of global carbon neutrality, energy-intensive industries represent the core source of carbon emissions in the industrial sector. Scientifically quantifying decarbonization pathways and evaluating the emission reduction effects of different policies are of great significance for delivering regional carbon peaking and carbon neutrality goals. This study proposes an integrated assessment framework based on the LEAP model, which integrates baseline accounting, scenario simulation, and emission reduction driver decomposition, incorporating both energy consumption-related and industrial process emissions. Combined with multi-source data integration to improve the reliability of emission accounting inputs, we conduct an empirical study on three typical energy-intensive sectors, namely iron and steel, cement, and chemicals, in Shandong Province, a major industrial province in China. Taking 2023 as the base year, three policy scenarios are set: the Business-as-Usual (BAU) scenario, the Low-Carbon Policy Scenario (CPS), and the Net-Zero Scenario (NZS), to quantitatively evaluate the evolution trajectory of carbon emissions, sector-specific decarbonization pathways, and emission reduction contributions from 2024 to 2060. The results show that total emissions of the three sectors increased from 325.93 million tonnes in 2022 to 344.17 million tonnes in the 2023 projection base year (+5.6%), with the chemical industry remaining the largest emission source. Under the BAU scenario, emissions rise to a broad high-level plateau of approximately 371 million tonnes around 2040–2050 and decline only slightly thereafter; although a shallow peak is formed, the post-peak reduction is insufficient to support deep decarbonization. Under the CPS and NZS scenarios, emission reductions of 74.1% and 97.1% can be achieved by 2060, respectively. Energy efficiency improvement is the core short-term driving force for emission reduction, while power decarbonization and CCUS technologies are key supports for deep decarbonization in the medium and long term. This study can provide methodological reference and empirical evidence for decarbonization pathway design and policy formulation of energy-intensive industries in similar regions.
1. Introduction
1.1. Research Background and Significance
Global warming has emerged as a severe challenge confronting human society, and mitigating greenhouse gas emissions to advance low-carbon transition represents a consensus-based initiative adopted by countries worldwide. As a core sector of energy consumption and carbon emissions, the industrial sector is one of the largest sources of global greenhouse-gas emissions, accounting for approximately 24% of direct global GHG emissions in 2019 and about 34% when indirect emissions from electricity and heat are included. Among industrial subsectors, energy-intensive industries including iron and steel, cement and chemical manufacturing feature prominent carbon lock-in characteristics throughout their production processes, rendering them critical yet intractable priorities for carbon abatement. For industrialized economies, energy-intensive industries not only underpin the supply of fundamental raw materials sustaining national economic growth, but also constitute major sources of carbon emissions [1]. Clarifying feasible decarbonization pathways, formulating differentiated emission reduction policies, and promoting regional low-carbon development while safeguarding the security of industrial supply have become core research issues at present.
As the world’s largest developing country and top carbon emitter, China has put forward the strategic goals of carbon peaking and carbon neutrality. The emission reduction performance of the industrial sector, particularly energy-intensive industries, directly governs the progress toward the dual carbon goals [2]. Distinct disparities across regions in industrial structure, resource endowments and technological maturity make generic decarbonization pathways poorly adaptable to local realities. There is an urgent demand to develop scenario analysis tools tailored to regional characteristics, quantify the emission reduction effects of diverse policy portfolios, and furnish scientific evidence for refined decarbonization decision-making.
1.2. Literature Review
1.2.1. Research on Carbon Emission Characteristics and Decarbonization Technology Pathways of Energy-Intensive Industries
Iron and steel, cement, and chemical industries constitute the core contributors to global industrial carbon emissions. Clarifying their emission characteristics and technical abatement potentials lays a foundation for designing decarbonization pathways. For the iron and steel sector, existing studies adopt life cycle assessment to quantify disparities in the full life-cycle carbon footprint between long-process and short-process steelmaking. Researchers identify fossil fuel combustion and electricity consumption as the predominant emission sources, while process emissions also account for a non-negligible share. Expanding the proportion of scrap steel electric arc furnace short-process steelmaking acts as a critical structural decarbonization pathway for the industry, yet its large-scale deployment is constrained by multiple factors including scrap steel resource supply, grid electricity cleanliness, and product applicability [3]. Scholars generally agree that conventional technologies such as energy efficiency improvement and coke dry quenching can hardly deliver deep decarbonization; breakthrough technologies including green hydrogen direct reduced iron (H2-DRI) and carbon capture, utilization and storage (CCUS) are indispensable to achieve near-zero emission targets [4,5]. From the perspective of policy incentives, market-oriented instruments such as carbon emission trading and green subsidies can reshape the economic competitiveness ranking of diverse decarbonization technologies, driving enterprises to shift toward low-carbon retrofits including hydrogen metallurgy and CCUS deployment [6]. Simulation outputs from dynamic computable general equilibrium (CGE) models further verify that the industry needs to undergo a phased transition from end-of-pipe treatment to fundamental process transformation, ultimately achieving carbon neutrality relying on green hydrogen and CCUS technologies [7].
Process emissions generated by limestone decomposition dominate carbon emissions of the cement industry, making its decarbonization far more challenging than fuel-dominated industrial sectors [8]. Empirical investigations targeting provinces including Hebei and Guangdong reveal that clinker output, energy intensity and energy mix serve as primary emission driving factors. Energy efficiency upgrading, alternative fuel utilization and supplementary cementitious material substitution such as slag can deliver staged emission reductions, yet deep cuts in process emissions necessitate the deployment of CCUS technologies [8,9]. Plant-level microdata-based scenario analyses indicate that capacity reduction, higher thermal substitution rates of alternative fuels and energy efficiency leapfrogging can halve emissions relative to the peak before 2040 [10]. Nevertheless, large-scale rollout of high-capture-rate CCUS remains a prerequisite in the medium and long term, and the deployment timeline directly determines cumulative emission volumes and carbon lock-in risks. Long-term dynamic simulations further demonstrate that industrial emissions will maintain a downward trend amid shrinking market demand. However, legacy process emissions will constitute a fundamental barrier to carbon neutrality under the no-CCUS scenario [11]. Furthermore, full-chain multi-dimensional measures covering transportation emission control and spatially optimized layout of CCUS facilities can further amplify emission reduction gains from production processes [12].
Compared with the iron and steel and cement sectors, the chemical industry features lengthy product chains and diversified process routes, leading to greater complexity in standardized carbon accounting and decarbonization pathway evaluation. Nevertheless, the methodological approaches developed for the steel and cement sectors, including emission accounting, scenario simulation, and multi-technology decarbonization assessment, may provide useful references for future decarbonization research on the chemical industry.
1.2.2. Identification of Driving Mechanisms and Carbon Peaking Status for Regional Industrial Carbon Emissions
Decomposition of provincial industrial carbon emission drivers, decoupling effect evaluation, and carbon peaking status judgment form the core basis for formulating regionally differentiated emission reduction policies. In terms of quantitative driver decomposition, most existing literature employs the Logarithmic Mean Divisia Index and Structural Decomposition Analysis to decompose carbon emission variations into scale effect, industrial structure effect, technical effect and energy mix effect. Empirical studies focusing on energy-intensive provinces such as Liaoning and Hubei demonstrate that economic expansion and industrial capacity growth remain the dominant forces pushing emissions upward. Declining energy intensity continuously delivers emission abatement benefits, whereas heavy industrialization offsets reduction effects, and the contribution of energy mix optimization remains limited at present [13,14]. From a trade perspective, expanding export volume and heavy-weighted trade structure significantly boost provincial industrial carbon emissions, and industrial technological heterogeneity exacerbates inter-regional emission imbalance via industrial chain transmission [15].
Regarding decoupling effects and peaking discrimination, quantile time-frequency analysis confirms a non-linear and regionally heterogeneous linkage between industrial output and carbon emissions. High-emission regions exhibit substantially higher emission response elasticity to economic shocks than low-emission regions, resulting in fundamentally different critical peaking thresholds [16]. Quasi-natural experimental research on carbon emission trading pilots indicates that market-based carbon policies can notably accelerate the carbon peaking process of energy-intensive industries by improving energy efficiency and stimulating low-carbon technological innovation [17]. Scenario simulation studies taking Shanghai and Henan as cases construct quantifiable carbon peaking discrimination frameworks, and highlight that peaking assessment must distinguish production-side and consumption-side emission liabilities to avoid misjudgments caused by emission outsourcing via industrial relocation [18,19]. In addition, policy evaluation based on the Policy Modeling Consistency Index suggests that several pilot provinces suffer from imbalanced allocation of administrative command-and-control instruments and market incentive tools, which distorts the actual carbon peaking timeline and status assessment results [20].
1.2.3. Carbon Peaking Pathway Simulation Methods and Integrated Application of Multi-Source Data
Scenario simulation acts as the core approach to quantify medium- and long-term decarbonization pathways and assess emission reduction effects of policies. The Long-range Energy Alternatives Planning (LEAP) model and dynamic CGE model represent the two most widely adopted analytical tools to date. Following the underlying logic of “activity level–technical structure–emission factor”, the LEAP model is a bottom-up techno-economic model capable of finely depicting emission trajectories under diverse technology portfolios. Scholars have extensively applied the LEAP model to demand forecasting, technology substitution and medium-long term multi-scenario simulation for steel and cement sectors, demonstrating its capability to assess emission trajectories and mitigation potentials under different decarbonization scenarios [21,22].
Built on general equilibrium theory, dynamic CGE models characterize price transmission and macroeconomic feedback of policies from an integrated energy-economy-environment perspective, compensating for the LEAP model’s limitation in capturing endogenous responses of the economic system. CGE simulations targeting the iron and steel industry and Shanghai both confirm that carbon pricing instruments including carbon tax and carbon trading can guide factor substitution and technological transformation via price signals, facilitating orderly carbon peaking and sustained emission declines in industrial sectors [7,19]. The two models feature complementary strengths, jointly forming the mainstream methodological system for industrial decarbonization pathway simulation.
In terms of data support, conventional carbon accounting and scenario simulation largely rely on aggregated macro statistical data, which fail to capture micro-level technological heterogeneity and spatial distribution patterns. In recent years, sector-level evaluations and plant-level microdata-based analyses have improved the resolution of carbon accounting and scenario assessment. These approaches enable more detailed identification of sectoral and facility-level emission patterns, supporting more targeted policy implementation [10,18]. Nevertheless, the integration of multi-source data into regional scenario simulation models remains in its infancy. Micro-level information such as inter-facility process disparities and industrial symbiosis effects has not been fully incorporated into model parameter calibration, undermining the accuracy of simulation outputs.
1.3. Research Gaps and Contributions of This Paper
Existing studies have laid a solid foundation for carbon emission analysis of energy-intensive industries, yet two major research gaps remain to be filled:
- First, most studies focus on the decarbonization pathways of individual sectors in isolation, lacking a comprehensive quantitative assessment of the overall emission trajectories across pillar industries such as iron and steel, cement, and chemicals. Such a narrow perspective often overlooks the heterogeneous characteristics as well as the distinct emission reduction potentials of these pillar industries.
- Second, while prior research has advanced our understanding of emission drivers, a prominent gap persists in long-term trend projection and policy effect quantification. For provinces with concentrated energy-intensive industries like Shandong in particular, sufficient empirical evidence on the long-term evolution of emissions driven by both energy combustion and complex industrial processes remains scarce.
To address the above limitations, this paper takes Shandong Province as a typical case to conduct empirical analysis on carbon emission trends of representative energy-intensive sectors. The three main contributions of this study are summarized as follows:
- First, we establish an integrated LEAP-based assessment framework that simultaneously incorporates energy-related combustion emissions and industrial process emissions across multiple energy-intensive sectors. By simulating the emission trajectories of the iron and steel, cement and chemical sectors from 2024 to 2060, this study provides robust empirical support for multi-sector emission trend analysis in heavy industry-dominated regions.
- Second, we enhance the completeness and reliability of historical data via a multi-source data integration approach to improve model input quality. Three gradient scenarios are designed, namely Business-as-Usual (BAU), Low-Carbon Policy Scenario (CPS) and Net-Zero Scenario (NZS), to quantitatively compare alternative emission pathways, and identify the emission peaking time window as well as the long-term emission level by 2060 under different policy scenarios.
- Third, going beyond straightforward projection, we decompose emission reduction drivers across different stages. We quantify the respective contributions of energy efficiency improvement, structural transformation, power decarbonization, and carbon capture, utilization and storage (CCUS) deployment. Combined with the findings of dynamic decoupling elasticity analysis, this study provides a quantitative foundation for formulating targeted carbon control policies for each development stage and each industrial sector.
1.4. Structure of the Paper
The rest of the paper is organized as follows. Section 2 presents the materials and methods, elaborating the carbon emission accounting method based on the LEAP model, the multi-source data fusion processing procedure, as well as the design ideas and parameter settings of gradient decarbonization scenarios. Section 3 presents the research results: it first analyzes the multi-dimensional characteristics of carbon emissions of energy-intensive industries in the baseline period, then presents the simulation results of decarbonization pathways under different scenarios, and finally carries out driving force decomposition of emission reduction and scenario comparison of power-system decarbonization pathways. Section 4 is the discussion, which verifies the rationality of the results by comparing with existing studies, explains the generalizability and promotion value of the research conclusions, and describes the research limitations and future expansion directions. Section 5 summarizes the core conclusions of the paper and puts forward differentiated policy implications for the low-carbon transition of energy-intensive industries.
2. Materials and Methods
2.1. Model Framework and Parameter Specification
This study adopts the Low Emissions Analysis Platform (LEAP 2024.6.0.3) model framework to construct a carbon emission accounting and scenario projection system for three major energy-intensive industries in Shandong Province: iron and steel, cement, and chemical industry. The model takes 2023 as the base year, covering a time span from 2010 to 2060, among which 2010–2023 is the historical calibration period and 2024–2060 is the scenario projection period. The model framework consists of two core modules: the energy consumption carbon emission accounting module and the industrial process carbon emission accounting module.
Model Architecture and Key Formulations
The LEAP-based accounting system is organized as a hierarchical technology tree with three levels: the sector level (iron and steel, cement, and chemicals); the technology/process level (e.g., blast furnace-basic oxygen furnace (BF-BOF) versus electric arc furnace (EAF) routes in iron and steel, clinker-based versus blended cement in the cement sector, and coal-based versus gas-based feedstock routes in the chemical industry); and the energy carrier level (seven energy carriers (raw coal, coke, natural gas, diesel, heavy oil, electricity, and heat)). Total CO2 emissions in year t are computed as:
where Ei(t) denotes the total CO2 emissions of sector i in year t; Ai(t) represents the sectoral activity level (physical output or value added); ei(t) is the sector-level aggregate energy intensity, defined as the total final energy consumption per unit of activity, regardless of fuel type; sf,i(t) denotes the share of fuel f in the total final energy consumption of sector i, satisfying and EFf is the corresponding emission factor of fuel f. Furthermore, Pi(t) represents the activity level associated with industrial process emissions, and εi denotes the corresponding process emission factor.
In this formulation, the energy consumption of fuel f per unit of sectoral activity is calculated as sf,i(t)ei(t). Accordingly, each fuel contributes to energy-related emissions through its consumption and corresponding emission factor, thereby avoiding double weighting of fuel consumption.
Technology switching is represented through time-varying activity shares. In the iron and steel sector, the EAF share of crude steel follows an exogenously specified diffusion path:
and the weighted emission intensity of steelmaking equals the share-weighted average of the BF-BOF and EAF route intensities. In the cement sector, clinker output is linked to cement output through a time-varying clinker-to-cement ratio that embeds the supplementary cementitious material (SCM) substitution rate:
with process emissions obtained as clinker output multiplied by the per-tonne clinker factor (0.52 tCO2). In the chemical sector, feedstock switching (natural gas and green hydrogen replacing coal) is modeled analogously through feedstock share parameters that alter both the energy intensity and the effective emission factor of the sector. In the electricity module, the future grid emission factor evolves along scenario-specific exponential decay paths:
where dp is the annual power decarbonization rate (2%, 5%, and 8% per year under BAU, CPS, and NZS, respectively), consistent with the settings in Table 1.
SEAF(t) = SEAF(2023) + ΔSEAF × (t − 2023)
Rclinker(t) = Rclinker(2023) × [1 − rsub(t)]
Table 1.
Core parameter settings of the three scenarios.
Detailed technology diffusion paths. To ensure full reproducibility, the key technology parameters are specified as follows. (i) EAF share: linear diffusion from 10% in 2023 to 40% in 2060 under CPS (ΔSEAF = 0.81 percentage points/year), and from 10% to 55% under NZS (1.22 pp/yr); intermediate-year values follow Equation (2). (ii) Hydrogen-based DRI: under NZS, the H2-DRI share of total iron production follows a logistic diffusion path reaching 35% in 2060, with an inflection point around 2040; the effective emission intensity of H2-DRI is set at 0.35 tCO2/t (including green hydrogen production), compared with 2.10 tCO2/t for the conventional BF-BOF route. (iii) Clinker substitution: the clinker-to-cement ratio declines linearly from 0.65 in 2023 to below 0.50 by 2050 under CPS and to 0.40 by 2060 under NZS, with SCM (fly ash, slag, limestone) filling the substitution gap; intermediate values are linearly interpolated between the specified anchor years. (iv) Natural gas replacing coal in chemicals: the gas-based feedstock share increases from 12% in 2023 to 60% in 2060 under CPS via a piecewise linear path (1.5 pp/yr during 2023–2035, 1.2 pp/yr during 2035–2060); under NZS, green hydrogen additionally replaces 30% of grey hydrogen by 2060. (v) CCUS: the capture rate is set at 90% for deployed facilities; the CCUS coverage rate (share of sectoral emissions/facilities covered by CCUS deployment) follows an S-curve reaching 28% (steel), 18% (cement), and 18% (chemicals) by 2060 under CPS, and 50% (steel), 40% (cement), and 40% (chemicals) under NZS; residual emissions after CCUS are computed as gross emissions × (1 − coverage rate × capture efficiency), where the product of coverage and capture efficiency gives the actual fraction of emissions captured.
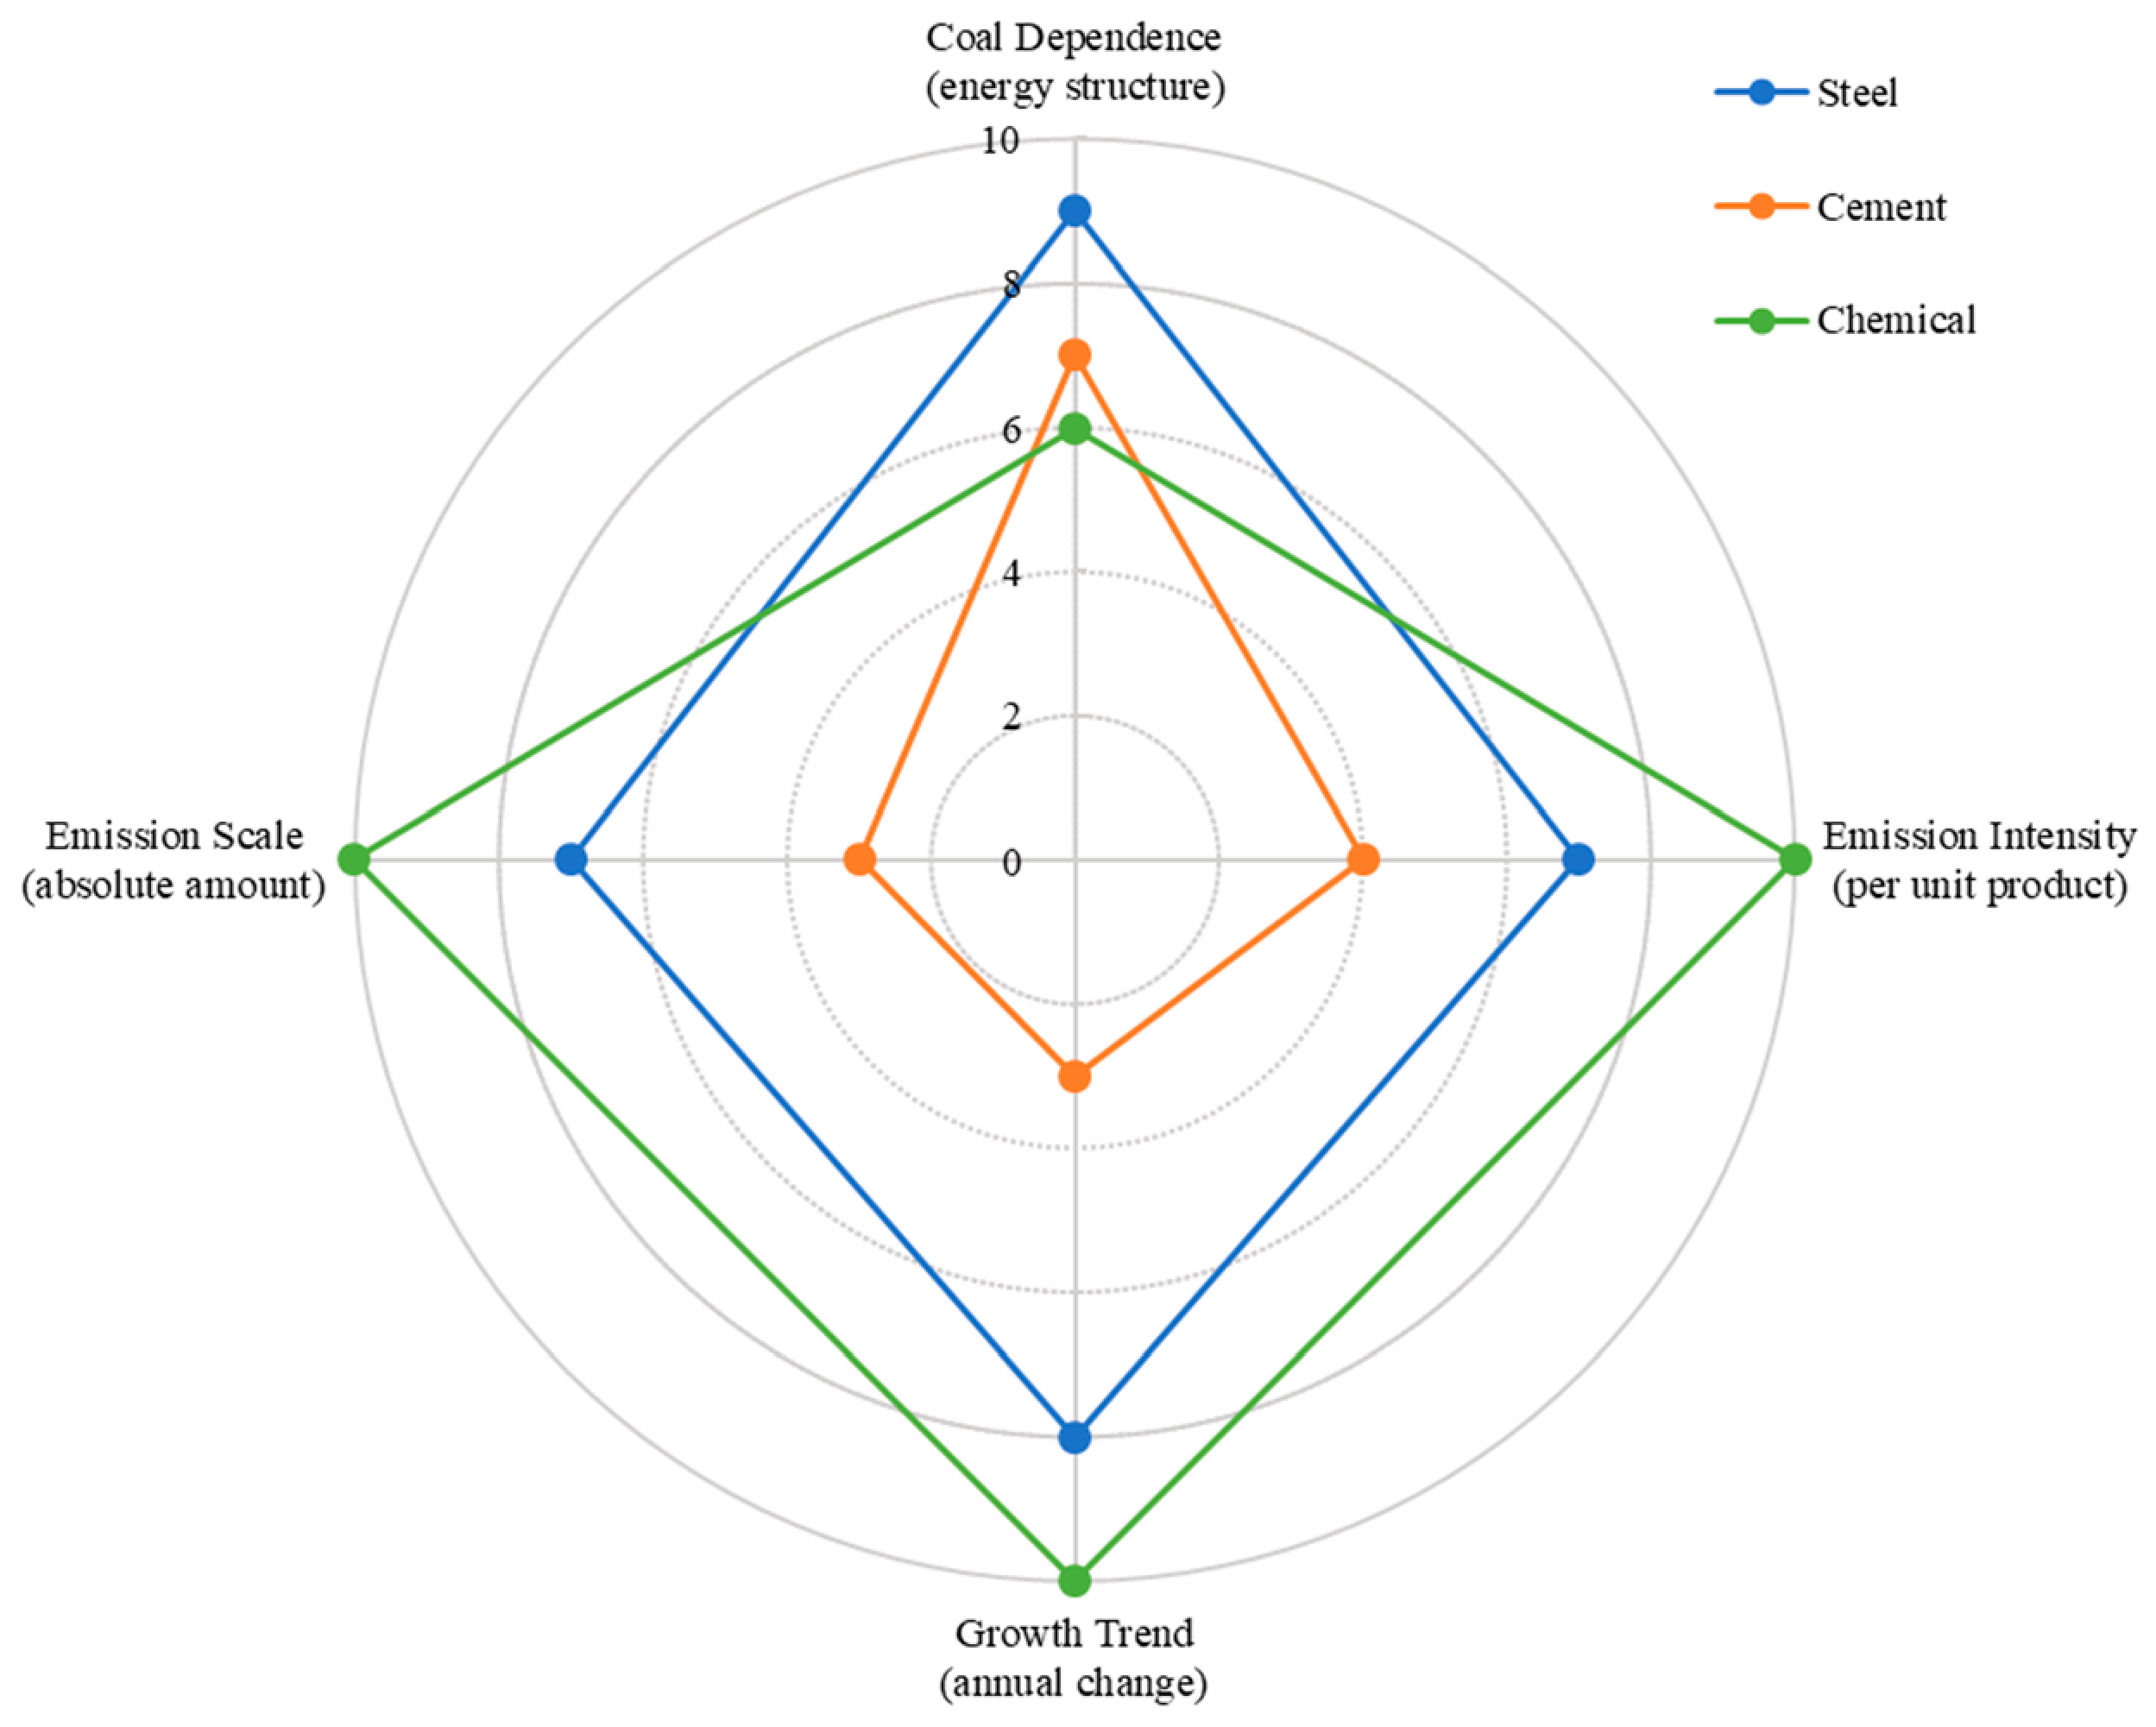
The five decarbonization measures considered in the scenarios act at different nodes of Equation (1): Output growth and output structure adjustment operate on Ai(t); energy efficiency improvement operates on ei(t); energy structure optimization (fuel switching) operates on sf,i(t); and power system decarbonization operates on the electricity emission factor. CCUS deployment is represented by an end-of-pipe capture coefficient, while process-related measures affect Pi(t) and εi. Because these measures enter Equation (1) at distinct multiplicative nodes, their combined effect is inherently multiplicative rather than additive, and interactions—for example, energy-efficiency improvements reduce electricity demand and therefore alter the marginal abatement attributable to power-system decarbonization-are captured endogenously by the model structure. For the four-dimensional carbon profiling assessment, each industry is evaluated on four dimensions: emission intensity (defined as CO2 emissions per unit of physical product, i.e., tCO2 per tonne of crude steel, cement, or major chemical product), energy structure (measured by coal dependence, i.e., the share of coal in total energy consumption), emission scale (absolute CO2 emissions in 2023), and growth trend (the recent annual change rate of sectoral emissions). Because the four dimensions are not directly commensurable (physical emission intensity differs across products with different chemical compositions), the scores are assigned as expert-based relative assessments on a 0–10 scale, grounded in the quantitative analysis presented in Section 3.1.1 and Section 3.1.2, where 0 indicates the lowest decarbonization challenge and 10 indicates the highest. The profiling is intended as a synthetic visual summary of relative sectoral characteristics rather than a precise quantitative index.
The energy consumption carbon emission module is developed in accordance with the 2006 IPCC Guidelines and the enterprise greenhouse gas accounting methods issued by the Ministry of Ecology and Environment (MEE) of China, covering seven energy carriers: raw coal, coke, natural gas, diesel, heavy oil, electricity, and heat. Emission factors of the fossil fuels are determined with reference to the 2006 IPCC Guidelines and the Provincial Greenhouse Gas Inventory Compilation Guidelines; electricity adopts the national average grid emission factor released by the MEE as the 2023 baseline, with its future dynamic evolution specified by Equation (4); and heat adopts the official factor released by the Department of Ecology and Environment of Shandong Province. All factor values and data sources are summarized in Table 1 to avoid duplication.
The industrial process emission module accounts for CO2 emissions from carbonate decomposition during cement clinker calcination and steel flux decomposition, as well as process emissions from ammonia synthesis in the chemical industry. The per-unit process emission factors are listed in Table 2; the underlying activity variables are clinker output, crude steel output, and the output of ammonia, respectively.
Table 2.
Parameter settings of main emission factors in the LEAP model.
2.2. Data Sources and Quality Control
This study adopts a multi-source data integration approach to combine three categories of data. The first category is official statistical data, including the Energy Volume of Shandong Provincial Statistical Yearbook, industrial product output data from the National Bureau of Statistics (NBS) of China, and the China Energy Statistical Yearbook, covering indicators such as industry-specific energy consumption, product output, gross industrial output value and industrial value-added from 2010 to 2023. The second category is industry data, derived from annual reports of the China Iron and Steel Association, China Cement Association, and China Petroleum and Chemical Industry Federation, which supplement specialized indicators such as enterprise quantity, capacity concentration and energy intensity. The third category is emission data, which takes the industry-specific carbon emission inventory of Shandong Province (2010–2022) from the China Emission Accounts and Datasets as the baseline calibration data source.
In terms of data quality control, enterprise structure data in the two economic census years of 2018 and 2023 are specially verified to ensure the consistency of the statistical caliber of industrial enterprises above designated size. For data missing in some years, the linear interpolation method is used for supplementation, with the missing rate controlled within 5%, which meets the model accuracy requirements. To test the robustness of this procedure, the interpolated values were cross-checked against adjacent-year averages and trend extrapolations; the resulting maximum deviations in sectoral base-year emissions were 0.32% (steel), 0.21% (cement), and 0.18% (chemical), with a total-emission deviation of 0.15%, indicating a negligible influence on the base-year accounting. To further verify that this small base-year uncertainty does not propagate materially into the medium- and long-term scenario projections, the full LEAP model was re-run under each of the three imputation methods (linear interpolation, adjacent-year average, and trend extrapolation), using the corresponding base-year emissions as the common starting point for all three scenarios. The key projection outputs are compared in Table 3.
Table 3.
Sensitivity of scenario projection results to the historical data interpolation procedure.
As shown in Table 3, the maximum deviation across the three interpolation methods does not exceed 0.20% for all reported projection indicators, and the CPS peak year (2025) is invariant. Even under the most divergent imputation assumption (trend extrapolation), the CPS 2060 emission level changes by only 0.13 Mt (88.92 vs. 89.05 Mt), and the CPS cumulative emission over 2024–2060 changes by only 0.01 Gt (7.17 vs. 7.18 Gt). These results confirm that the historical data interpolation procedure has a negligible influence not only on the base-year emission accounting but also on the medium- and long-term scenario projection results, demonstrating the robustness of the model outputs.
System boundary and consistency. The emission accounting boundary is defined consistently across the three sectors as the sectoral operational emissions (Scope 1 + Scope 2) of Shandong Province, comprising (i) fuel combustion emissions from the seven energy carriers and (ii) industrial process emissions from carbonate decomposition (cement clinker and steel fluxes) and feedstock conversion (ammonia). Scope 1 covers direct fuel combustion and industrial process emissions; Scope 2 covers indirect emissions from purchased electricity and heat, accounted using the regional grid and heat emission factors, while upstream emissions embodied in raw-material extraction and transportation, as well as downstream product-use emissions, are excluded from the boundary. The same boundary definition is applied to all three sectors and all scenarios, ensuring that scenario comparisons are internally consistent.
2.3. Scenario Design and Parameter Specification
2.3.1. Scenario Definitions
This study sets three scenarios to depict the carbon emission evolution pathways under different policy intensities and technical pathways. The Baseline Scenario (BAU) assumes that the current policy framework remains unchanged, technological progress follows the historical trend extrapolation, and no additional emission reduction policies are introduced. The Low-Carbon Policy Scenario (CPS) represents an intermediate pathway aligned with strengthened dual carbon goals, covering a policy mix of substantially improved energy efficiency standards, accelerated energy structure optimization, and moderate CCUS deployment. The Net-Zero Scenario (NZS) represents an ambitious decarbonization pathway under the 2060 carbon neutrality vision, including technological transformations such as large-scale hydrogen-based steelmaking, large-scale CCUS deployment, and a near-zero carbon power system.
The three-scenario design follows the gradient scenario paradigm widely adopted in long-term decarbonization pathway analysis. BAU serves as the counterfactual reference that isolates the effect of existing policies; CPS represents the policy-intensive pathway aligned with the national sectoral carbon peaking implementation plans and the Shandong Province carbon peaking action plan; and NZS delineates the technology-frontier pathway consistent with the 2060 carbon neutrality vision. This gradient design balances analytical transparency and policy relevance: adding intermediate scenarios would increase computational and communicative complexity without changing the marginal insights, while the scenario comparison in Section 3.3.2 supplements the gradient by illustrating the influence of power decarbonization rate differences.
The parameter settings in Table 1 are grounded in three categories of evidence: (i) national and provincial policy documents, including the Implementation Plan for Carbon Peaking in the Iron and Steel Industry, the Implementation Plan for Carbon Peaking in the Cement (Building Materials) Industry, the Implementation Plan for Carbon Peaking in the Chemical Industry, and the Shandong Province Carbon Peaking Implementation Plan, which determine the policy-driven output growth and intensity improvement ranges under CPS; (ii) historical trend extrapolation from the 2010–2023 statistical data assembled in Section 2.2, which anchors the BAU intensity decline rates; and (iii) technology-roadmap and integrated-assessment literature on hydrogen metallurgy, clinker substitution, feedstock switching, and CCUS deployment timelines, which informs the NZS technology diffusion assumptions [5,6,11,21,22,24,25].
2.3.2. Setting of Key Driving Factors
In terms of output growth, under the BAU scenario, the average annual growth rates of iron and steel, cement, and chemical industry output are 0.5%, −1.0%, and 1.5%, respectively. Under the CPS scenario, with strengthened capacity regulation policies, the growth rate of the iron and steel industry drops to 0.3%, and the reduction rate of the cement industry expands to −2.0%. Under the NZS scenario, the strictest industrial scale control is implemented: iron and steel output decreases by 0.5% annually, and cement output reduction reaches −3.5%, reflecting the deep decarbonization logic centered on demand reduction. For the chemical sector under CPS, a short-term commissioning adjustment is introduced for 2024–2025 to represent the production release of projects approved before the base year; accordingly, chemical emissions are allowed to increase temporarily during this transition period, while the long-run CPS output growth (+1.0%/yr) and intensity-reduction assumptions take full effect from 2026 onward.
In terms of energy intensity improvement, under the BAU scenario, the average annual intensity decline of the three industries ranges from 1.0% to 1.5%, continuing the historical trend of technological improvement. Under the CPS scenario, an annual decline rate of 2.5–3.5% is achieved through mandatory energy efficiency standards and promotion of best available technologies. Under the NZS scenario, accelerated efficiency improvement and best-available process technologies reduce energy intensity by 5.0–6.0% annually.
In terms of energy structure optimization, under the CPS scenario, the coal share decreases by 1.0–1.5 percentage points annually, and the power decarbonization factor decreases by 5% annually. Under the NZS scenario, the coal share decreases by 2.5–3.0 percentage points annually, and the decarbonization rate of the power system increases to 8% per year, realizing near-zero carbon power around 2050.
In terms of CCUS technology deployment, under the CPS scenario, the CCUS coverage rate follows the S-shaped diffusion trajectory specified in Section Model Architecture and Key Formulations, reaching 28% in the iron and steel industry and 18% in the cement and chemical industries by 2060. Under the NZS scenario, the CCUS coverage rate reaches 50% in the iron and steel industry and 40% in the cement and chemical industries, with deployment brought forward to 2028.
3. Results and Analysis
3.1. Analysis of Carbon Emission Characteristics in the Base Period (2010–2023)
3.1.1. Total Emissions and Sectoral Structure
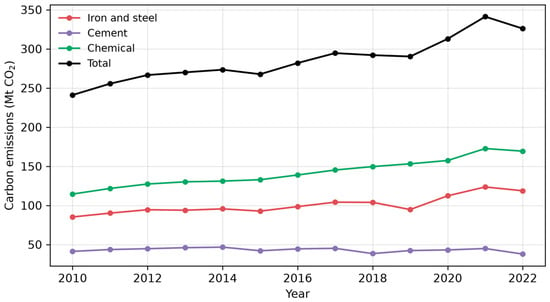
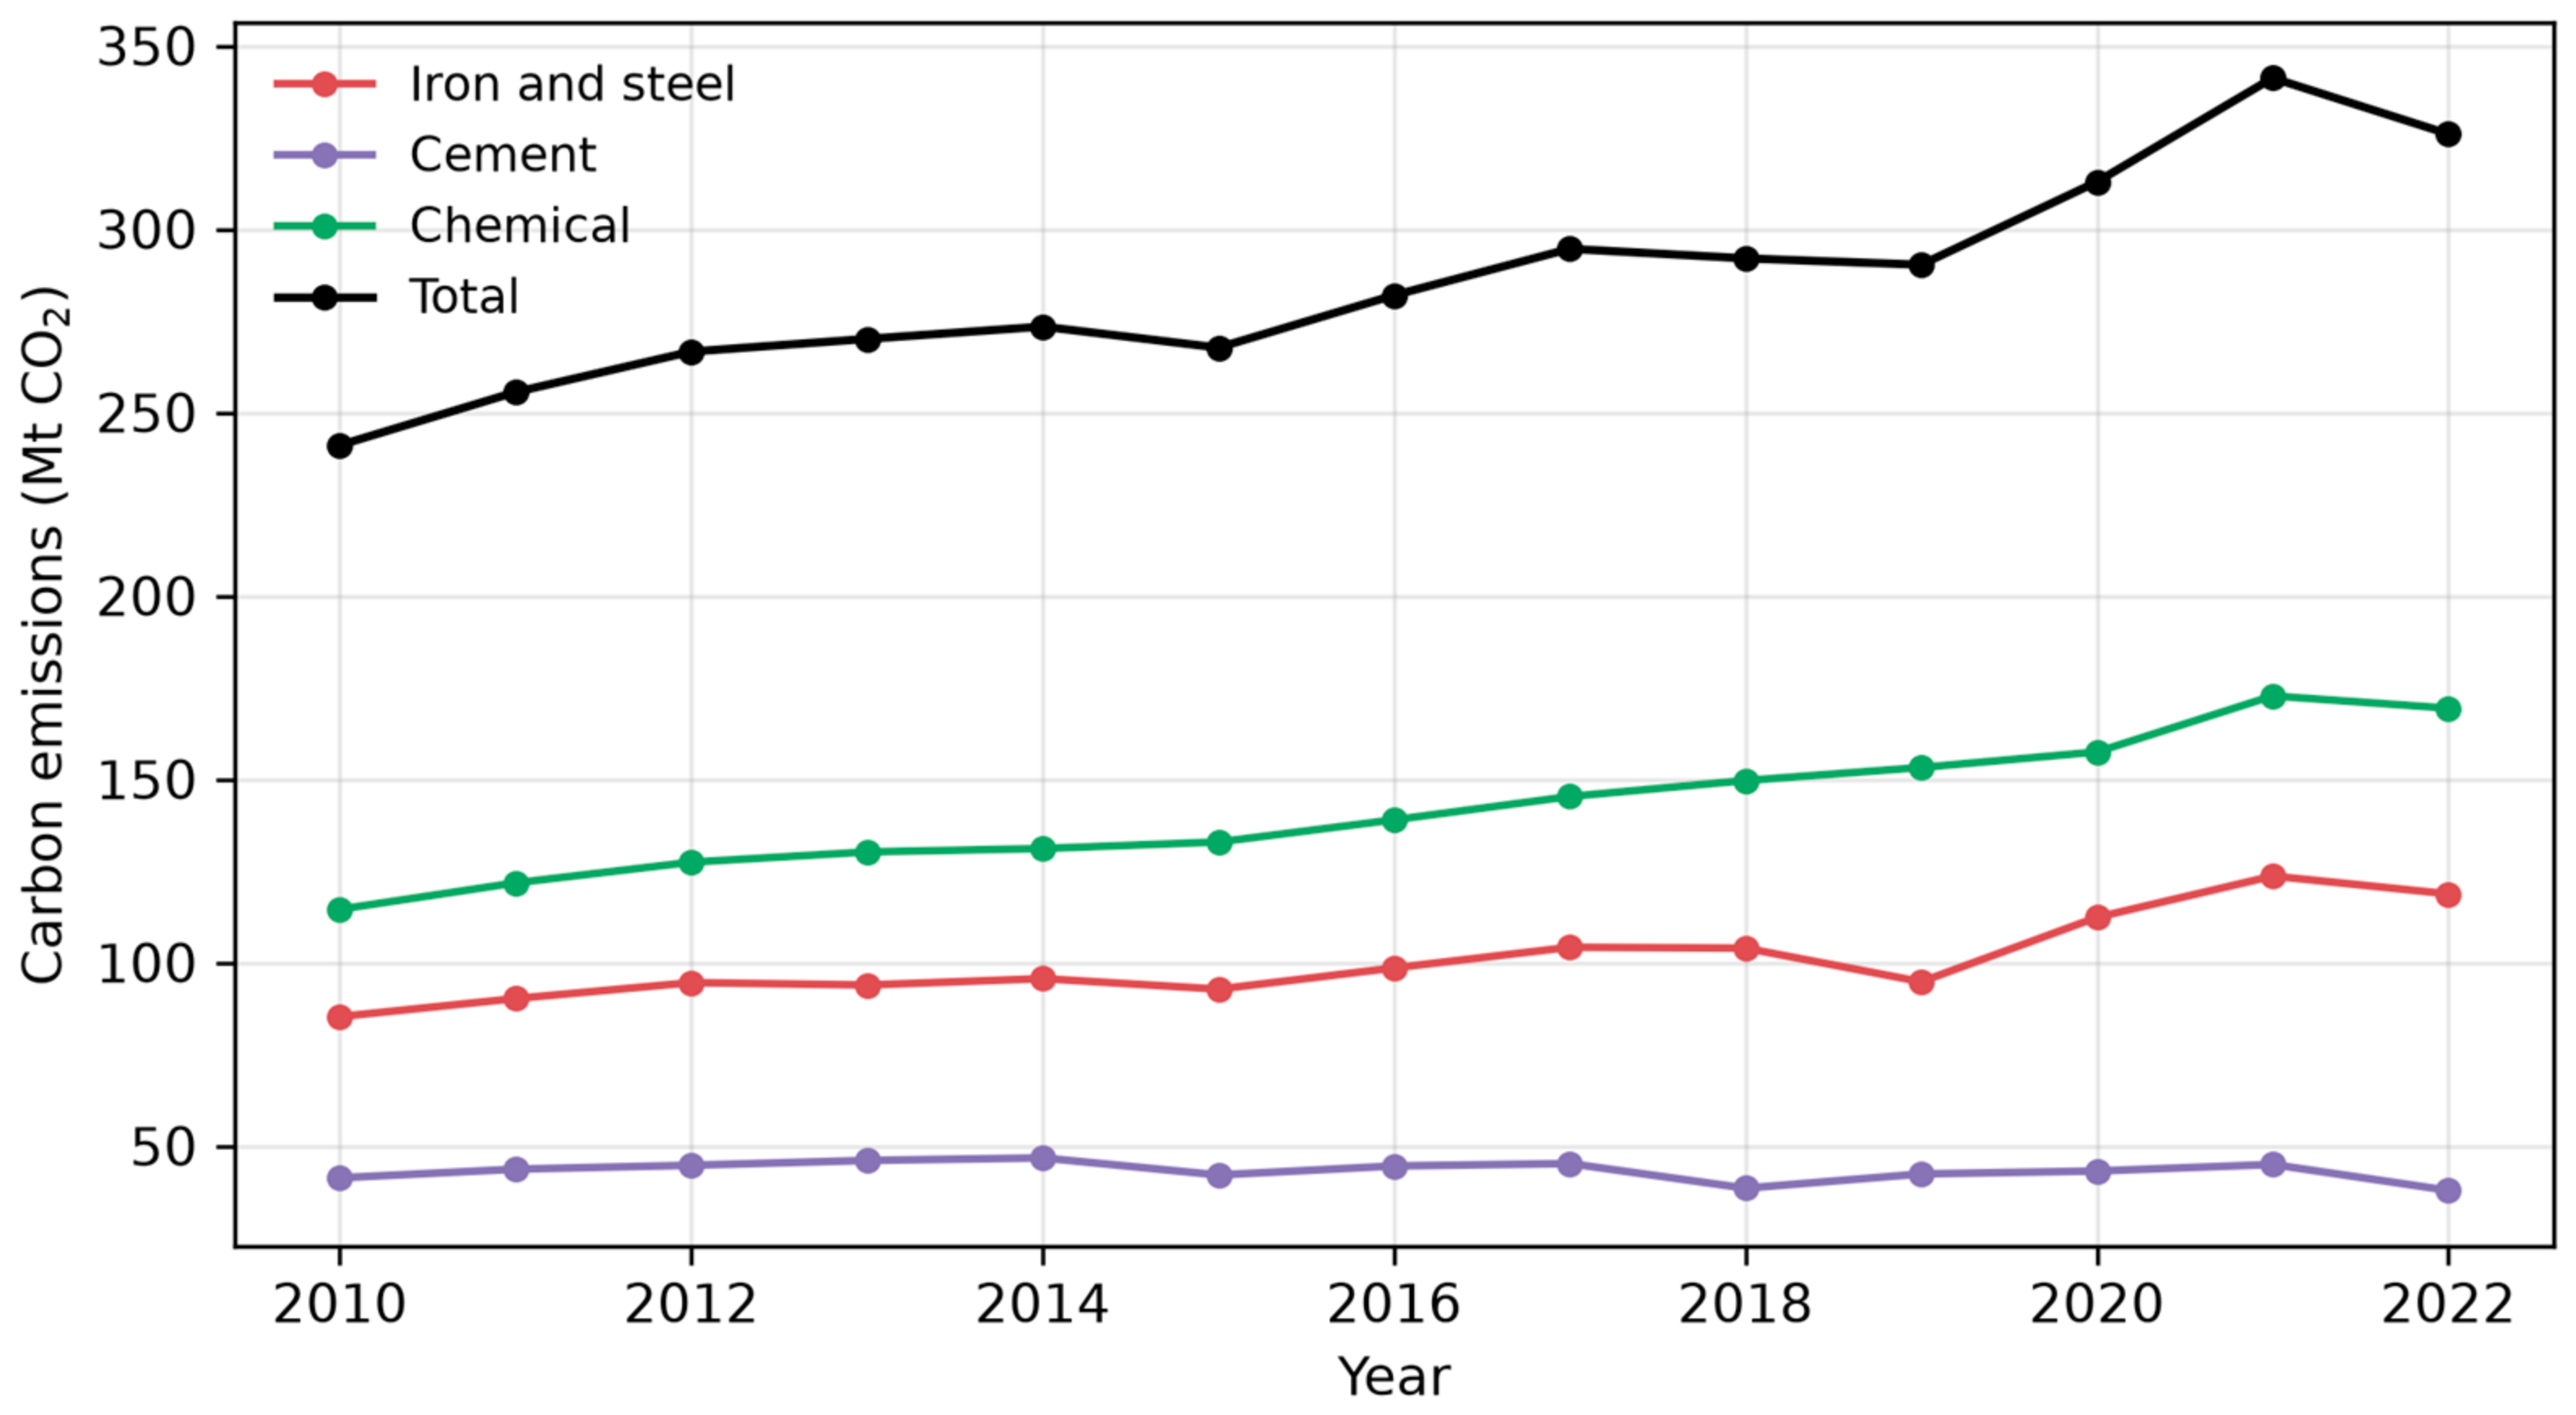
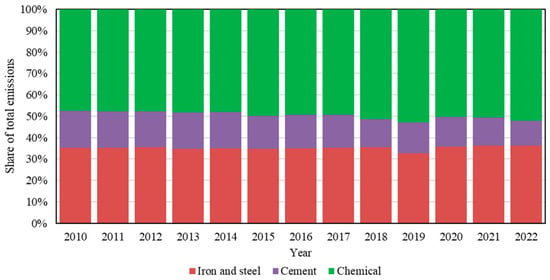
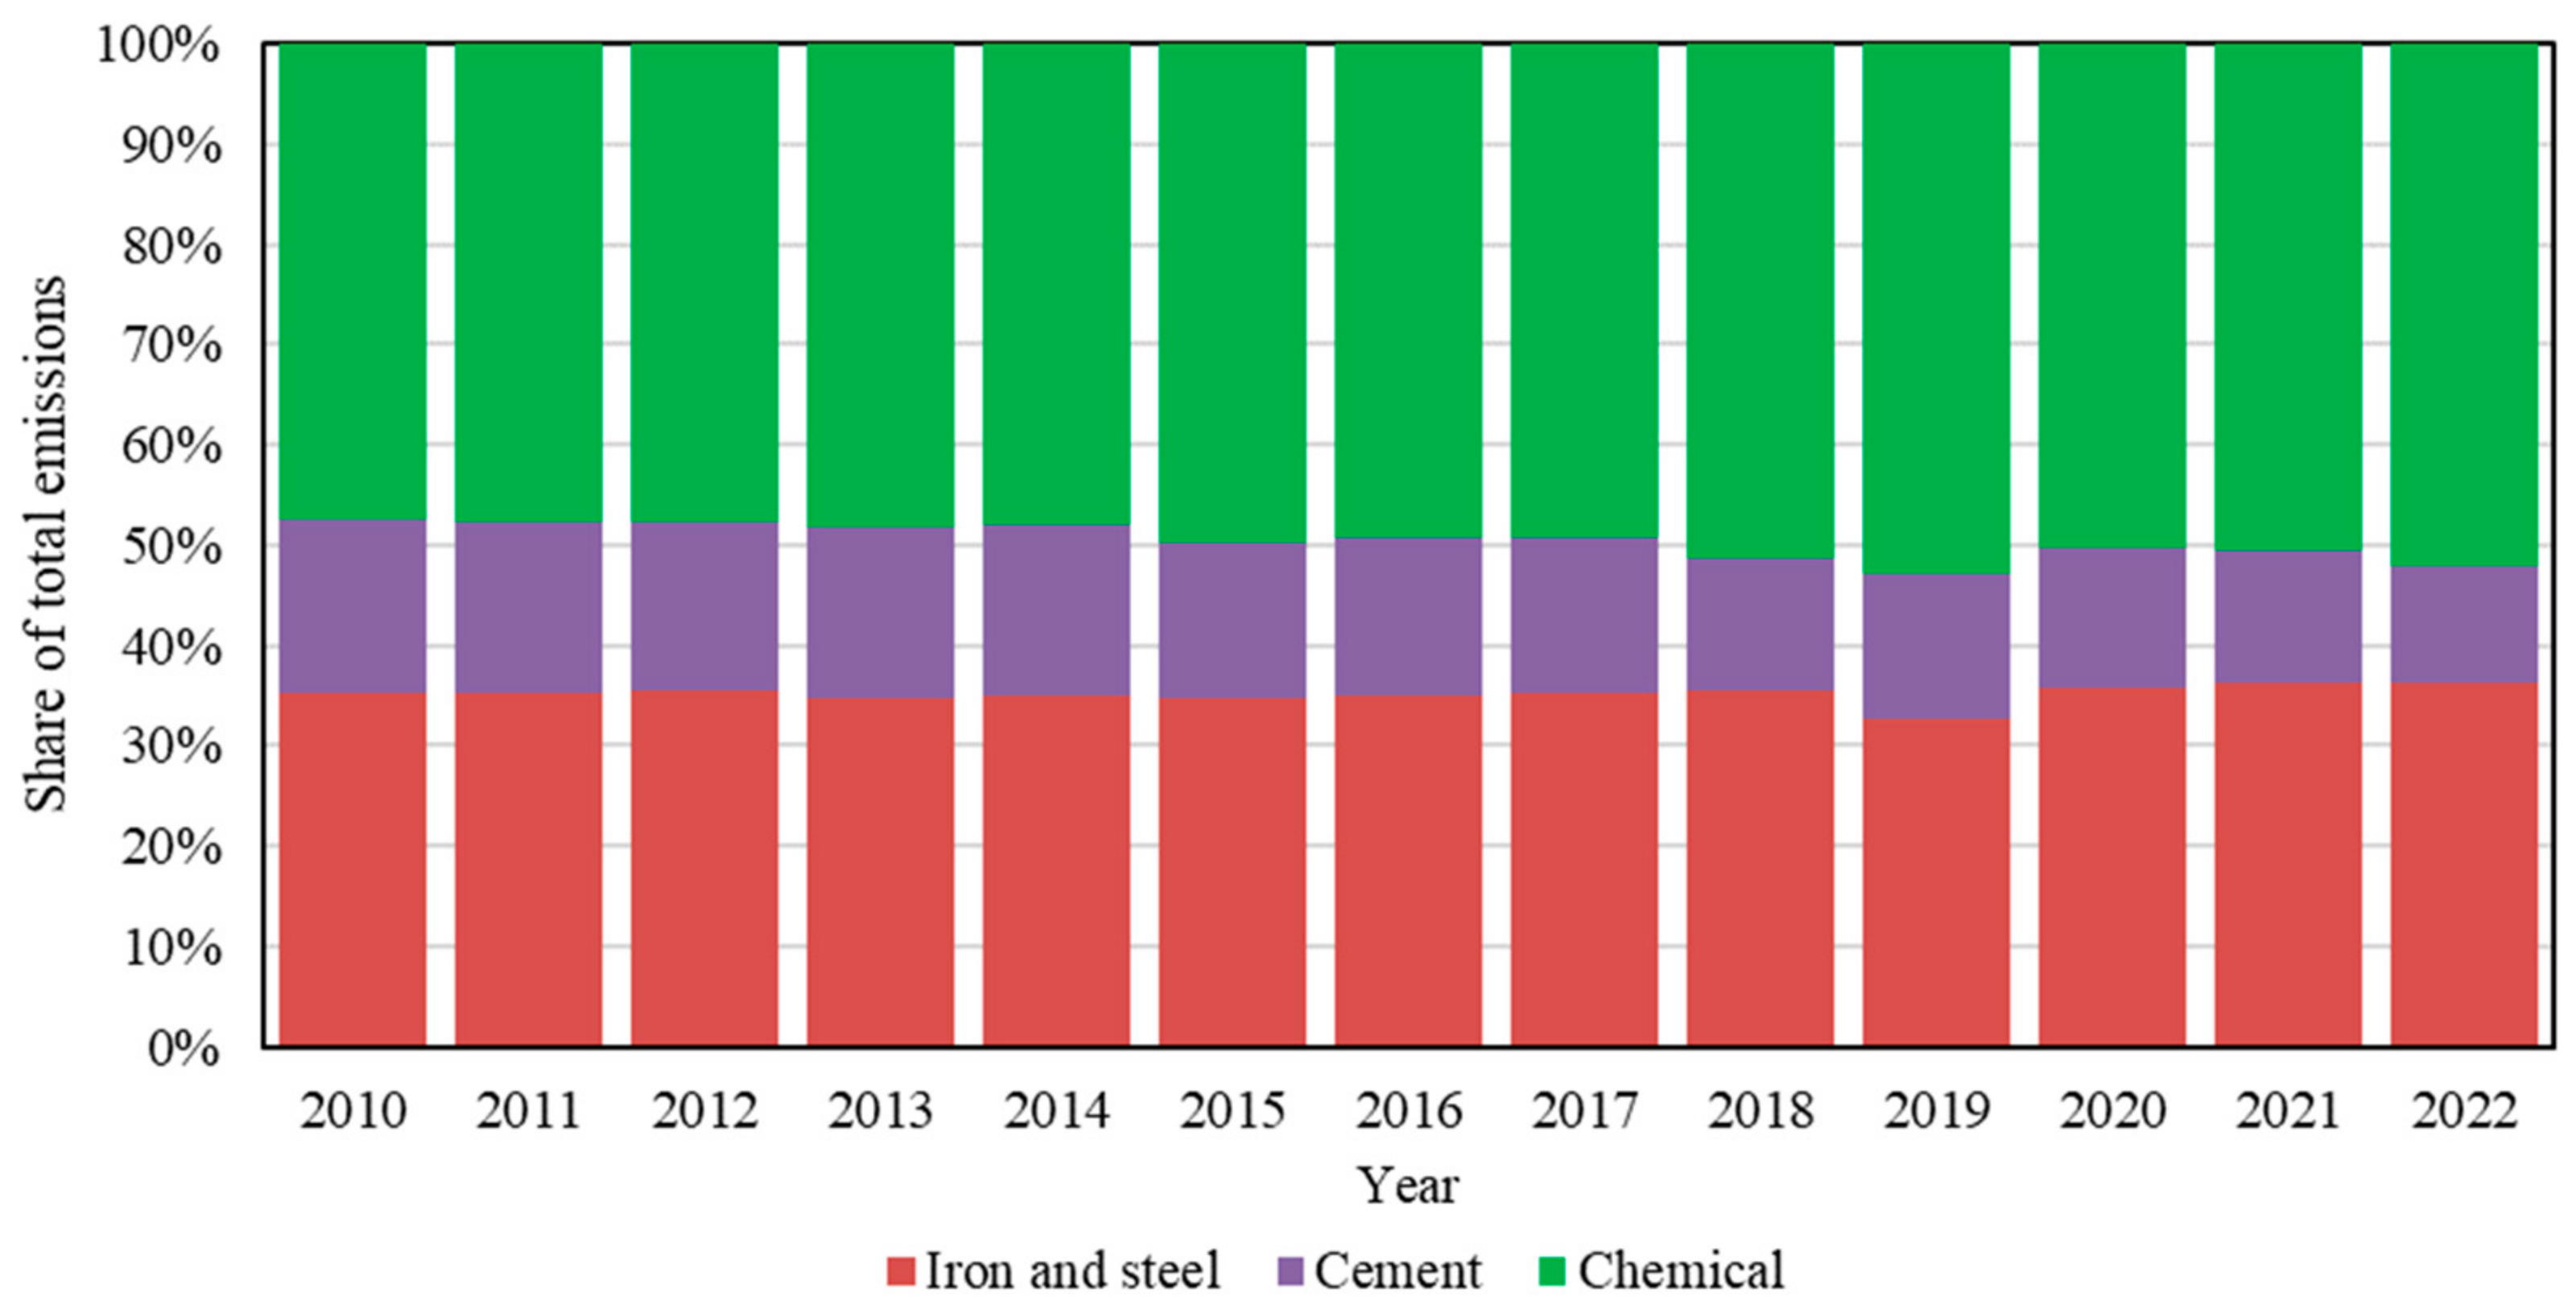
Based on the multi-source data fusion accounting results, the total carbon emissions of the three major energy-intensive industries in Shandong Province increased from 241.08 million tonnes in 2010 to 325.93 million tonnes in 2022, with an average annual growth rate of 2.6%, as shown in Figure 1. Among them, the chemical industry has consistently been the largest emission source, with emissions reaching 169.35 million tonnes in 2022, accounting for 51.9% of total emissions; the iron and steel industry emitted 118.72 million tonnes, accounting for 36.4%; and the cement industry emitted 37.86 million tonnes, accounting for 11.6%. Notably, the emission share of the chemical industry rose from 47.5% in 2010 to 51.9% in 2022, reflecting the significant impact of chemical capacity expansion on the regional carbon emission pattern.
Figure 1.
Historical carbon emission trends of three major energy-intensive industries in Shandong Province (2010–2022).
Relative to 2022, the total emissions of the three industries in the base year 2023 increased by 5.6%, from 325.93 to 344.17 million tonnes. Of this increment, the chemical sector grew by 12.2% in 2023, well above its 2010–2022 annual average of about 3.3% per year; this jump is mainly attributable to the commissioning of newly approved chemical capacity, the resumption of feedstock operations during the economic recovery of 2023, and a widened statistical coverage of enterprises above the designated size. To keep the projection baseline consistent with the latest statistics, this study uniformly adopts 2023 (344.17 million tonnes) as the base year, while data for 2022 and earlier years are used exclusively for historical trend analysis. The 2023 values therefore serve as the starting point of all three scenario projections.
Regarding statistical caliber consistency: the 2023 data are sourced from the Fifth National Economic Census, which expanded the coverage of enterprises above designated size compared with pre-2023 statistics. To ensure comparability with the 2010–2022 historical series, the 2023 enterprise-level records were back-calibrated to the pre-census statistical scope by excluding newly included enterprises that fell below the pre-2023 revenue threshold; of the chemical sector’s 12.2% year-on-year emission increase in 2023, approximately 2.1 percentage points are attributable to the residual statistical-caliber effect, while the remaining 10.1 percentage points reflect changes in production activity and energy consumption.
In terms of emission trends, the three industries show differentiated evolution characteristics. Carbon emissions from the iron and steel industry fluctuated significantly, rising continuously from 2016 to 2021, peaking at 123.58 million tonnes in 2021 and then falling back to 118.72 million tonnes in 2022, mainly driven by capacity regulation policies and crude steel output reduction. Emissions from the cement industry showed a clear downward trend, dropping from the peak of 46.72 million tonnes in 2014 to 37.86 million tonnes in 2022, a reduction of 19.0%, which demonstrates the emission reduction effect of off-peak production and capacity replacement policies in the cement industry. Emissions from the chemical industry continued to grow, increasing from 114.53 million tonnes in 2010 to 169.35 million tonnes in 2022, an increase of 47.9%, which is highly consistent with the development strategy of park-based and large-scale chemical industry in Shandong Province.
3.1.2. Evolution of Carbon Emission Intensity
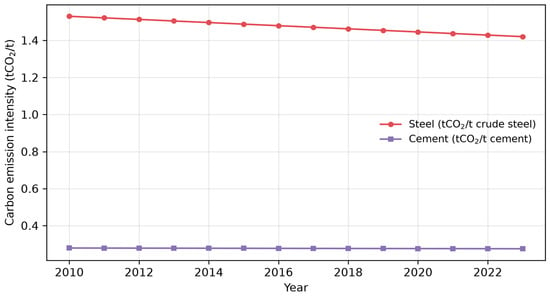
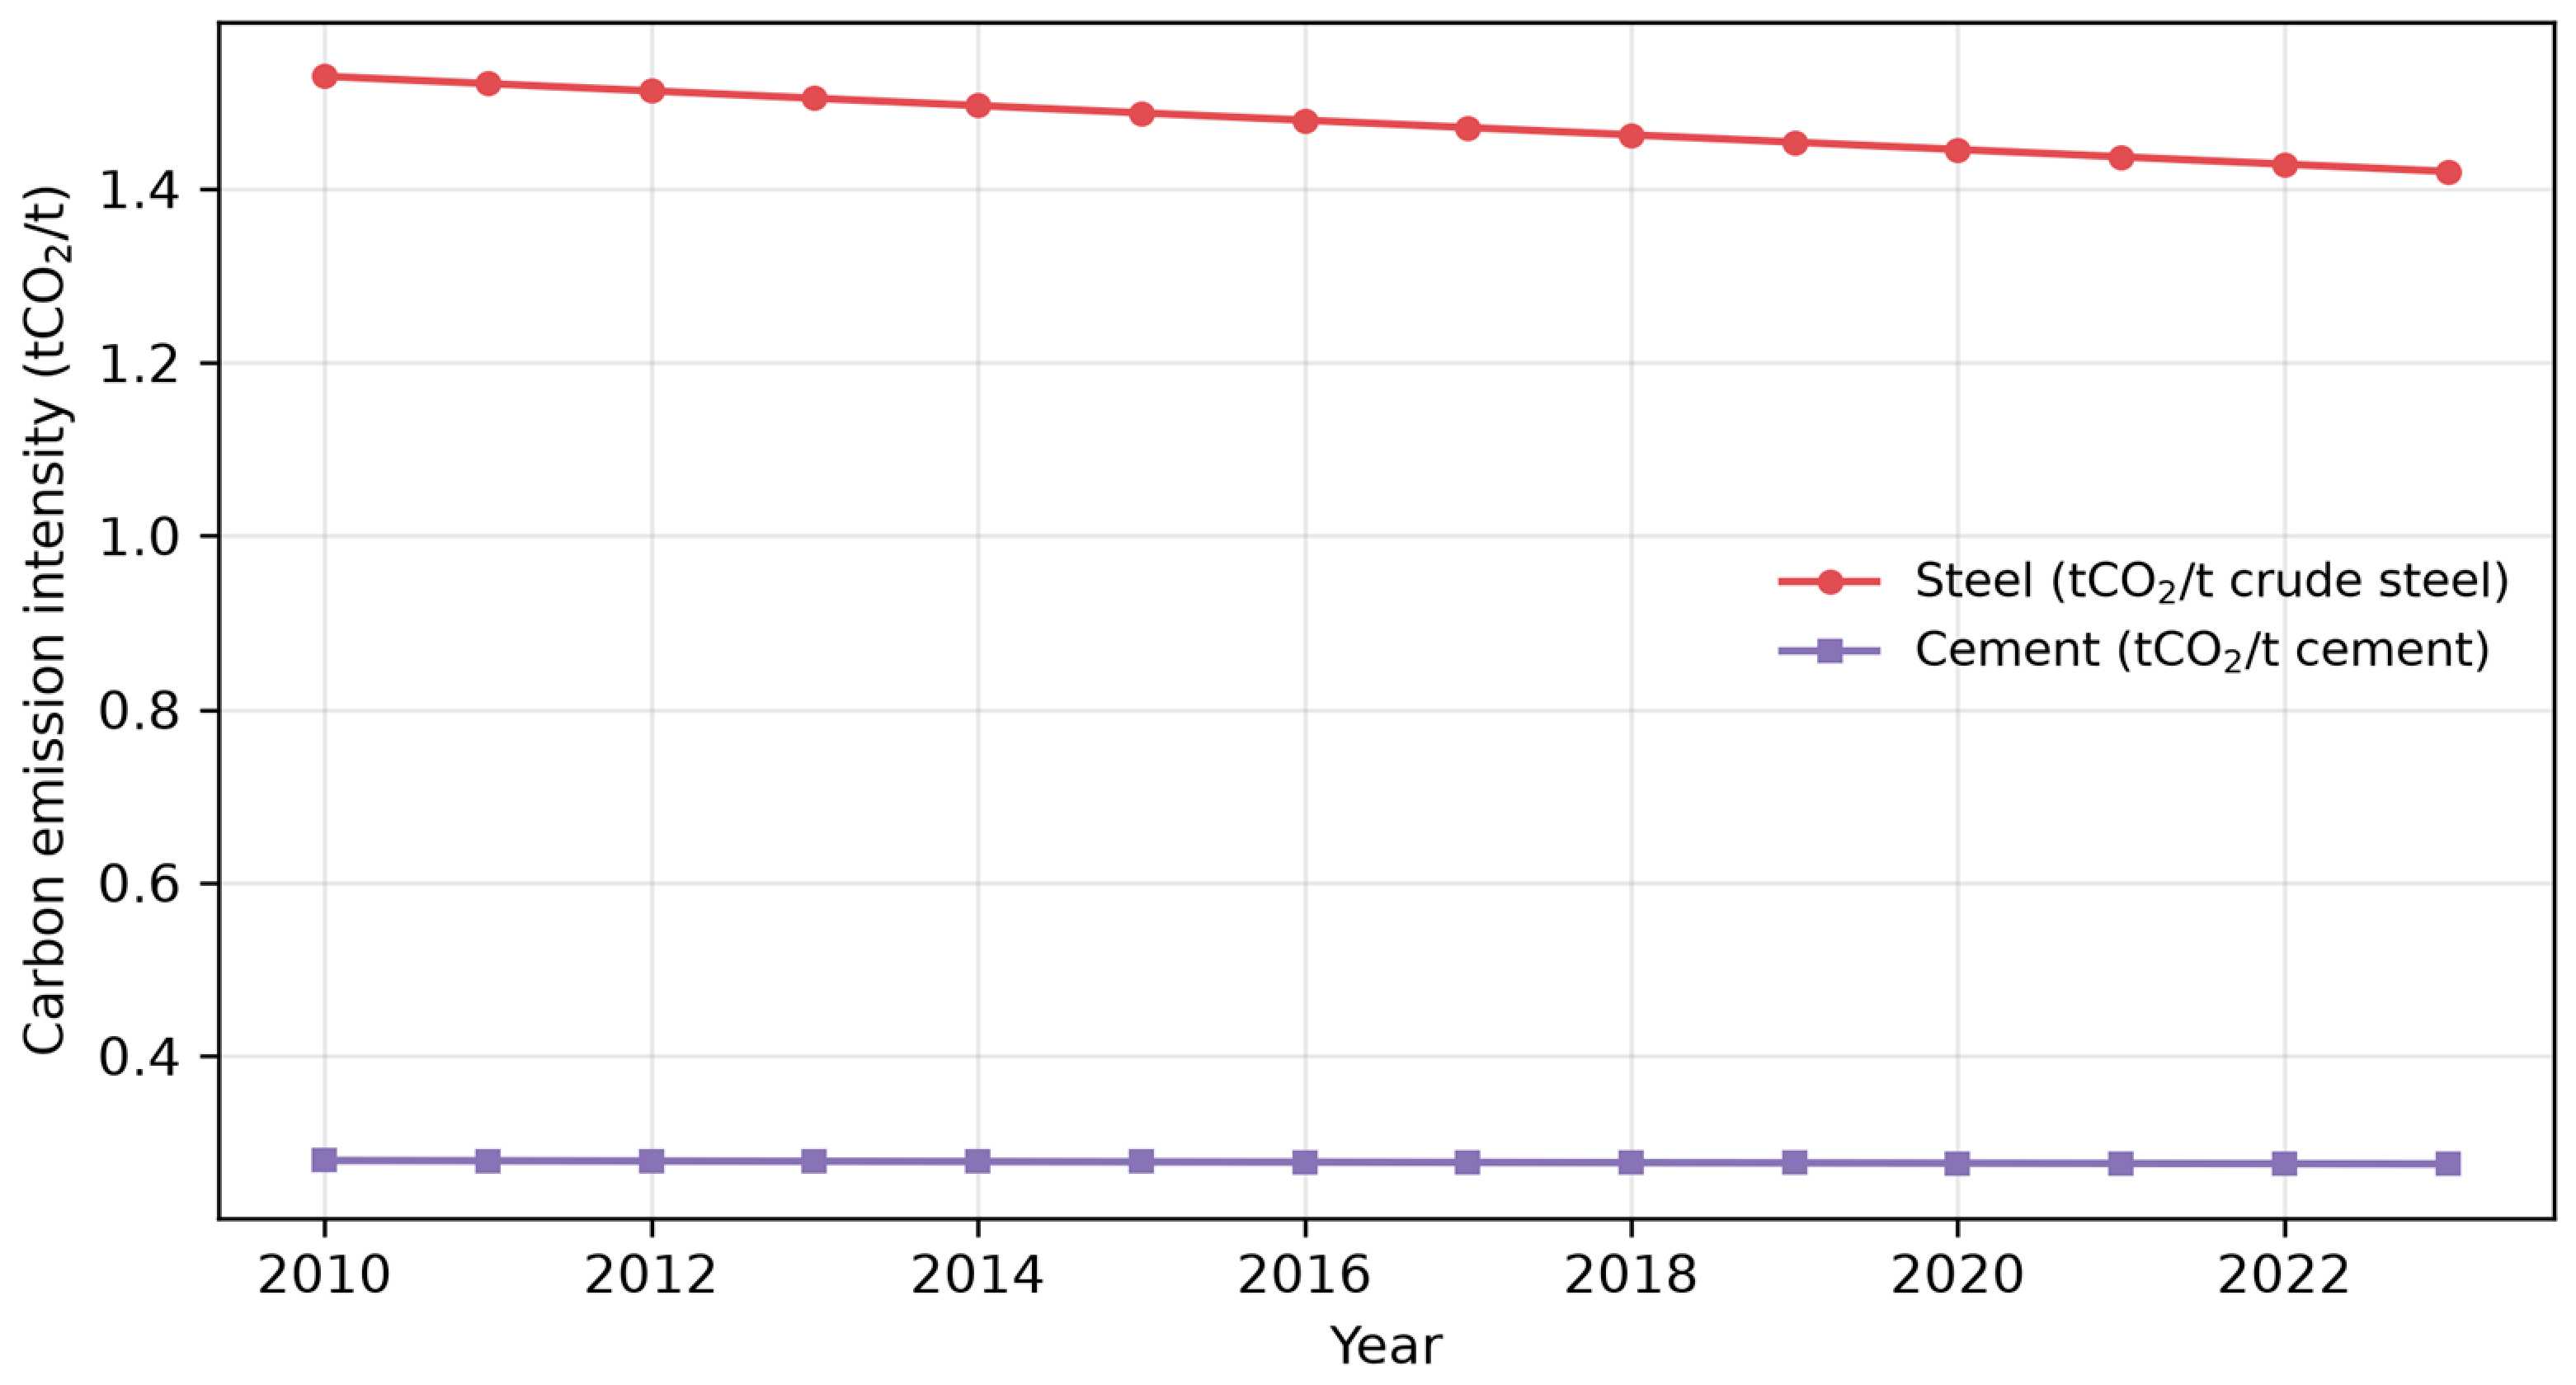
The analysis of carbon emission intensity reveals the trajectory of changes in industrial technical efficiency, as shown in Figure 2. In 2023, the carbon emission intensity per tonne of crude steel in the iron and steel industry was 1.420 tCO2, down 7.2% from 1.530 tCO2 in 2010, reflecting the continuous promotion of energy-saving technologies such as large-scale blast furnaces and oxygen-enriched coal injection. The carbon emission intensity per tonne of cement in the cement industry decreased from 0.280 tCO2 in 2010 to 0.276 tCO2 in 2023, as shown in Figure 3, remaining basically stable, mainly because the room for energy efficiency improvement in the cement industry has tended to be saturated.
Figure 2.
Changes in Carbon Emission Structure of Three Industries (2010–2022).
Figure 3.
Trends of carbon emission intensity in major industries (2010–2023).
In terms of carbon emission intensity per unit of output value, the iron and steel, cement and chemical industries recorded 1.461, 2.220 and 1.502 tCO2 per 10,000 yuan of output value in 2022, respectively. The cement industry has the highest carbon emission intensity per unit of output value, reflecting its typical characteristics of low product added value and high energy consumption intensity, making it a key target for future emission reduction efforts.
3.1.3. Energy Structure and Multi-Dimensional Carbon Profiling
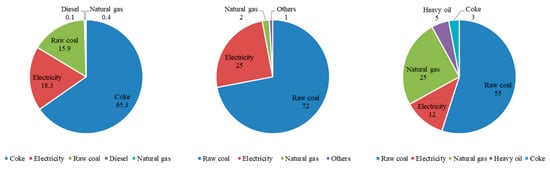
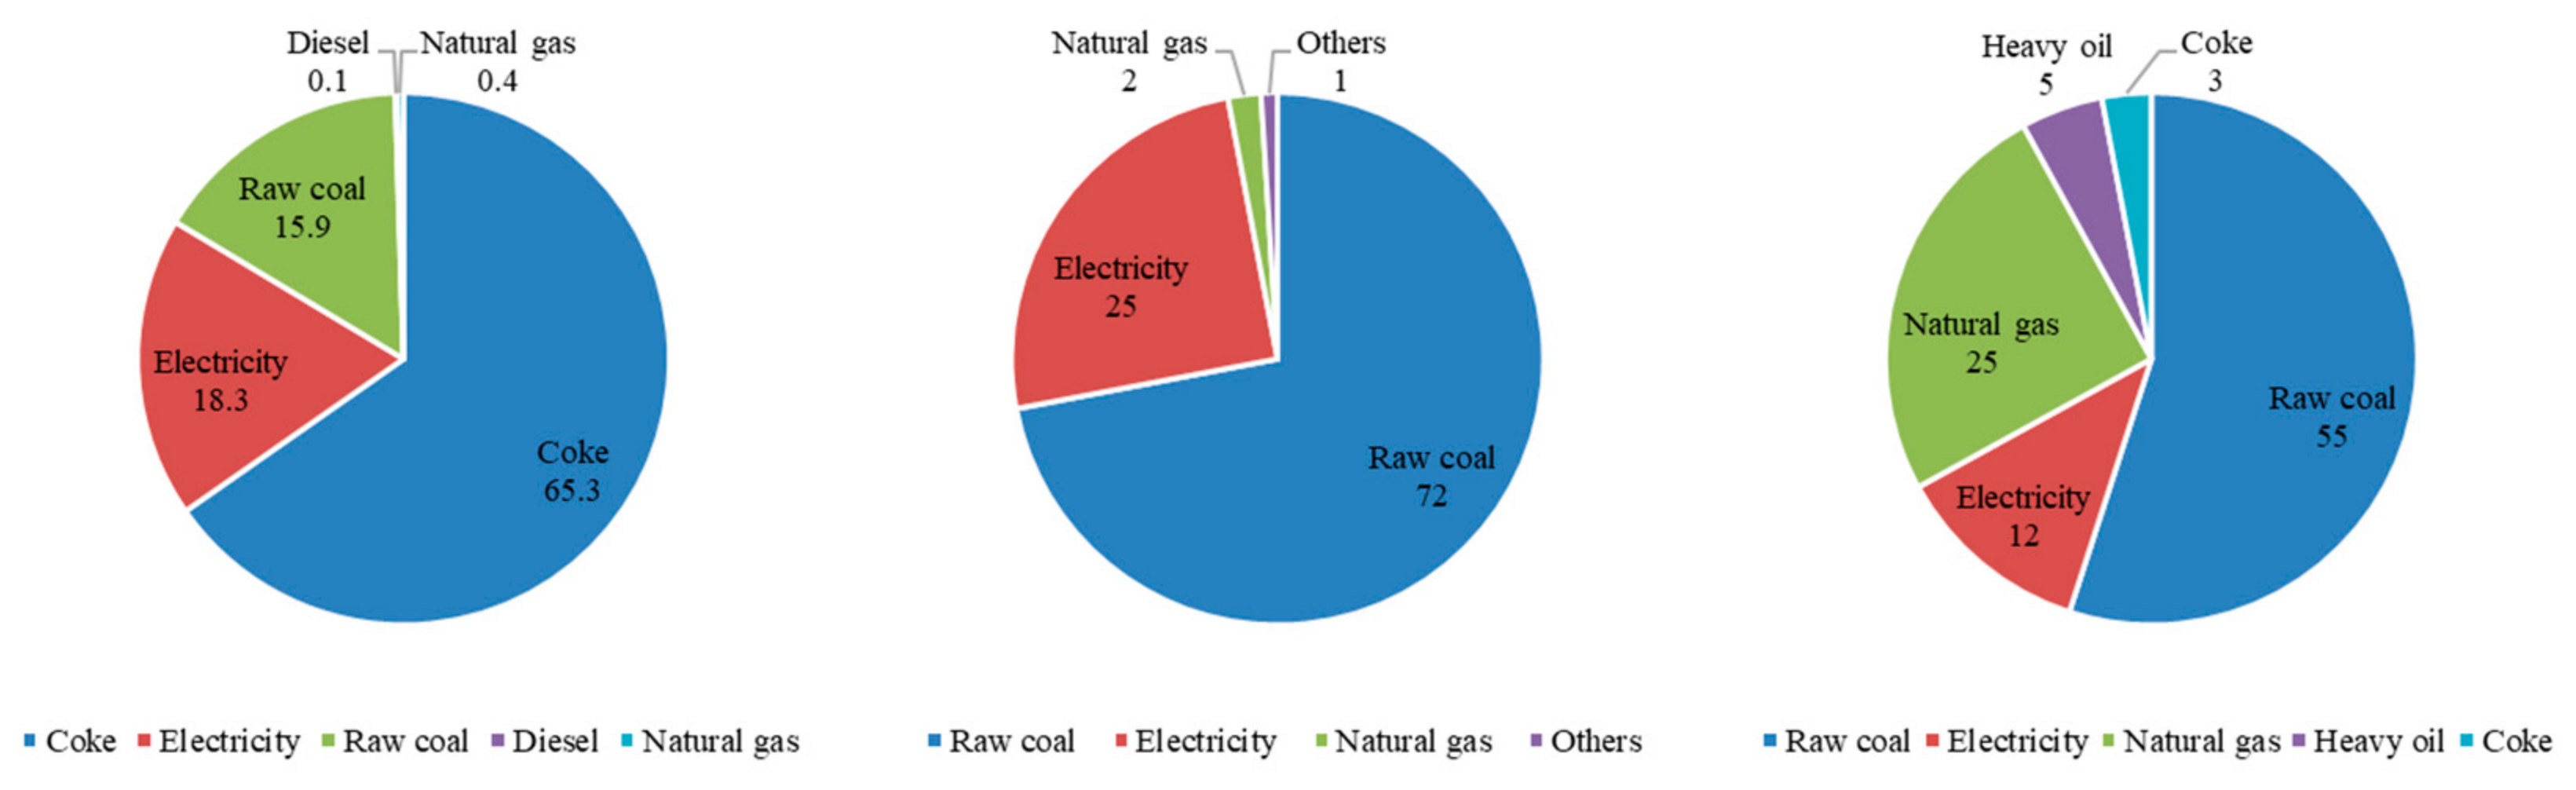
(1) Energy structure profiling The energy consumption structures of the three industries in 2023 show differentiated characteristics, as shown in Figure 4. In the iron and steel industry, coke accounts for as high as 65.3%, raw coal for 15.9%, and electricity for 18.3%. The high reliance on coke as a reducing agent and heat source determines that the core of decarbonization in this industry lies in process transformation. In the cement industry, raw coal accounts for 72% and electricity for 25%; the rigid demand for solid fuels in the high-temperature calcination process of cement kilns constitutes a bottleneck for emission reduction. In the chemical industry, raw coal accounts for 55%, natural gas for 25%, and electricity for 12%. There is considerable room for feedstock structure transformation, making it the industry with the greatest potential for natural gas and hydrogen substitution.
Figure 4.
Energy consumption structure of the three industries in 2023, From left to right: iron and steel, cement, and chemical industry.
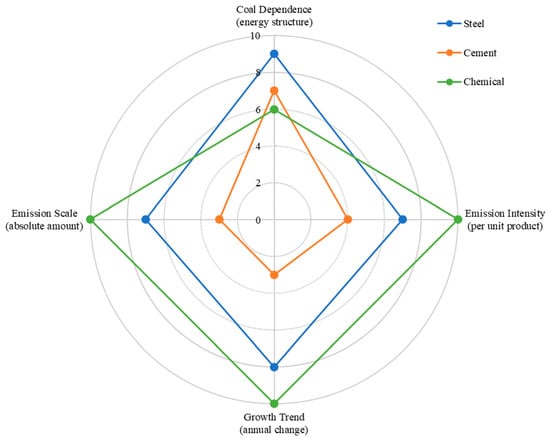
(2) Four-dimensional carbon profiling assessment A carbon profiling assessment system is constructed based on four dimensions: intensity, structure, scale and trend. The chemical industry scores the highest in both emission intensity and emission scale dimensions (9–10 points for both), making it a priority target for regional carbon emission management. Here, emission intensity refers to CO2 emissions per unit of physical product (tCO2 per tonne of product), for which the chemical sector ranks highest due to substantial process-related emissions from feedstock conversion. This is distinct from economic emission intensity (CO2 per unit of output value), for which the chemical sector performs relatively well because its products have high unit value; its coal dependence score is relatively moderate (6–7 points). The iron and steel industry scores the highest in the coal dependence dimension (9 points), and the high-carbon lock-in effect of coke consumption constitutes the main obstacle to decarbonization. The cement industry has relatively balanced and low scores across all dimensions, and its total emission scale is shrinking driven by declining output, making it the industry with the highest certainty of emission reduction. These scores are descriptive rather than model-calculated indicators. The four-dimensional carbon profiling assessment for 2023 is shown in Figure 5.
Figure 5.
Four-dimensional radar chart of carbon profiling assessment (2023).
3.1.4. Decoupling Analysis Between Carbon Emissions and Economic Growth
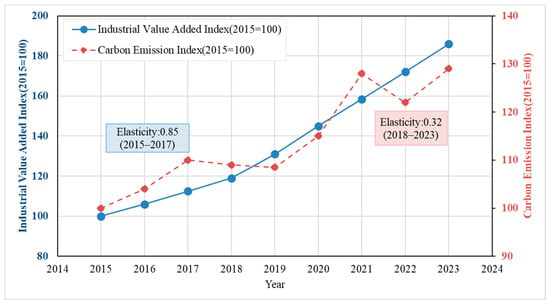
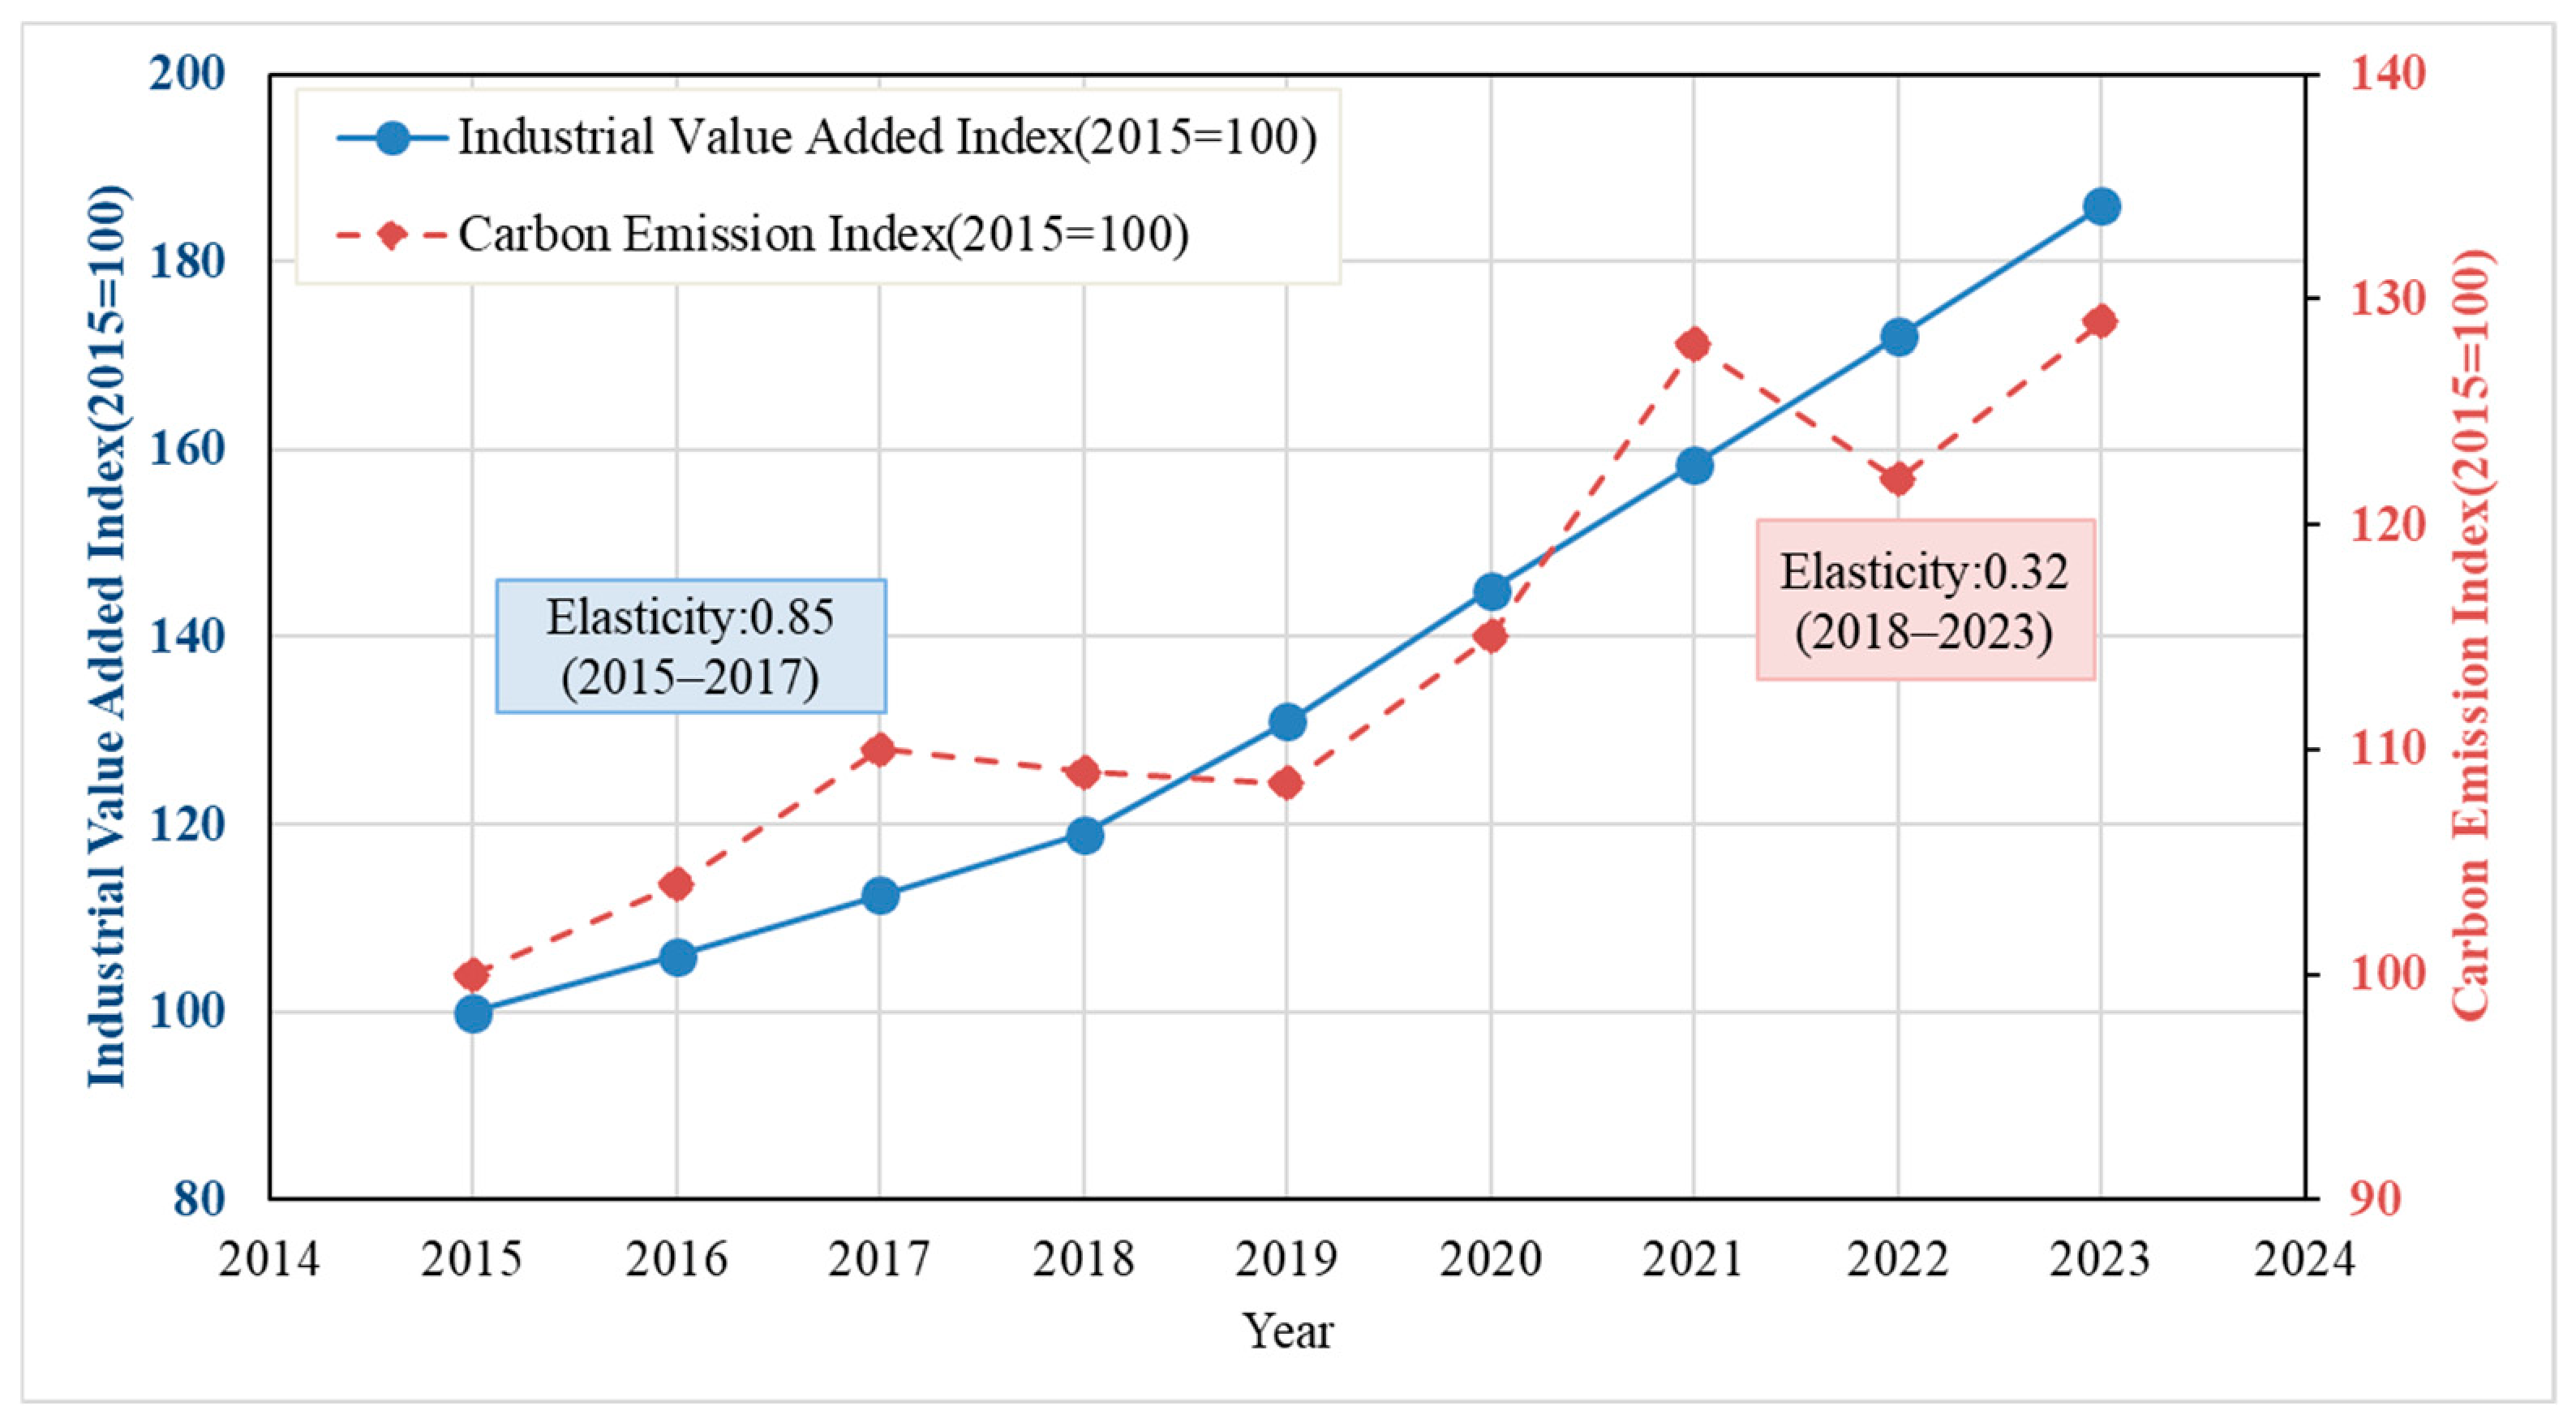
From 2015 to 2023, the industrial value added of the three industries maintained sustained growth, while carbon emissions in the same period rose from 267.67 million tonnes to 344.17 million tonnes, an increase of 28.6%. The elasticity coefficient of carbon emissions to industrial value-added growth dropped from 0.85 during 2015–2017 to 0.32 during 2018–2023, indicating that carbon emissions and economic growth have shown a relative decoupling trend, as shown in Figure 6. This decoupling process will further accelerate under the CPS and NZS scenarios: the elasticity coefficient is expected to decline further under the CPS scenario, and the NZS pathway is consistent with a transition toward absolute decoupling (negative elasticity coefficient). The declining trend from 0.85 to 0.32—both computed on a consistent industrial value-added basis—constitutes the key evidence of relative decoupling and serves as the basis for the scenario expectations.
Figure 6.
Decoupling analysis between carbon emissions and economic growth (2015–2023).
3.2. Simulation Results of Multi-Scenario Decarbonization Pathways
3.2.1. Projection of Total Carbon Emissions
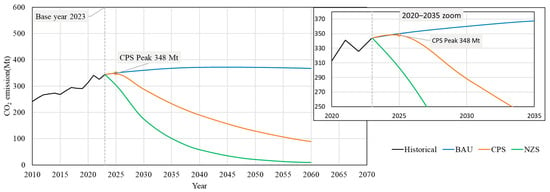
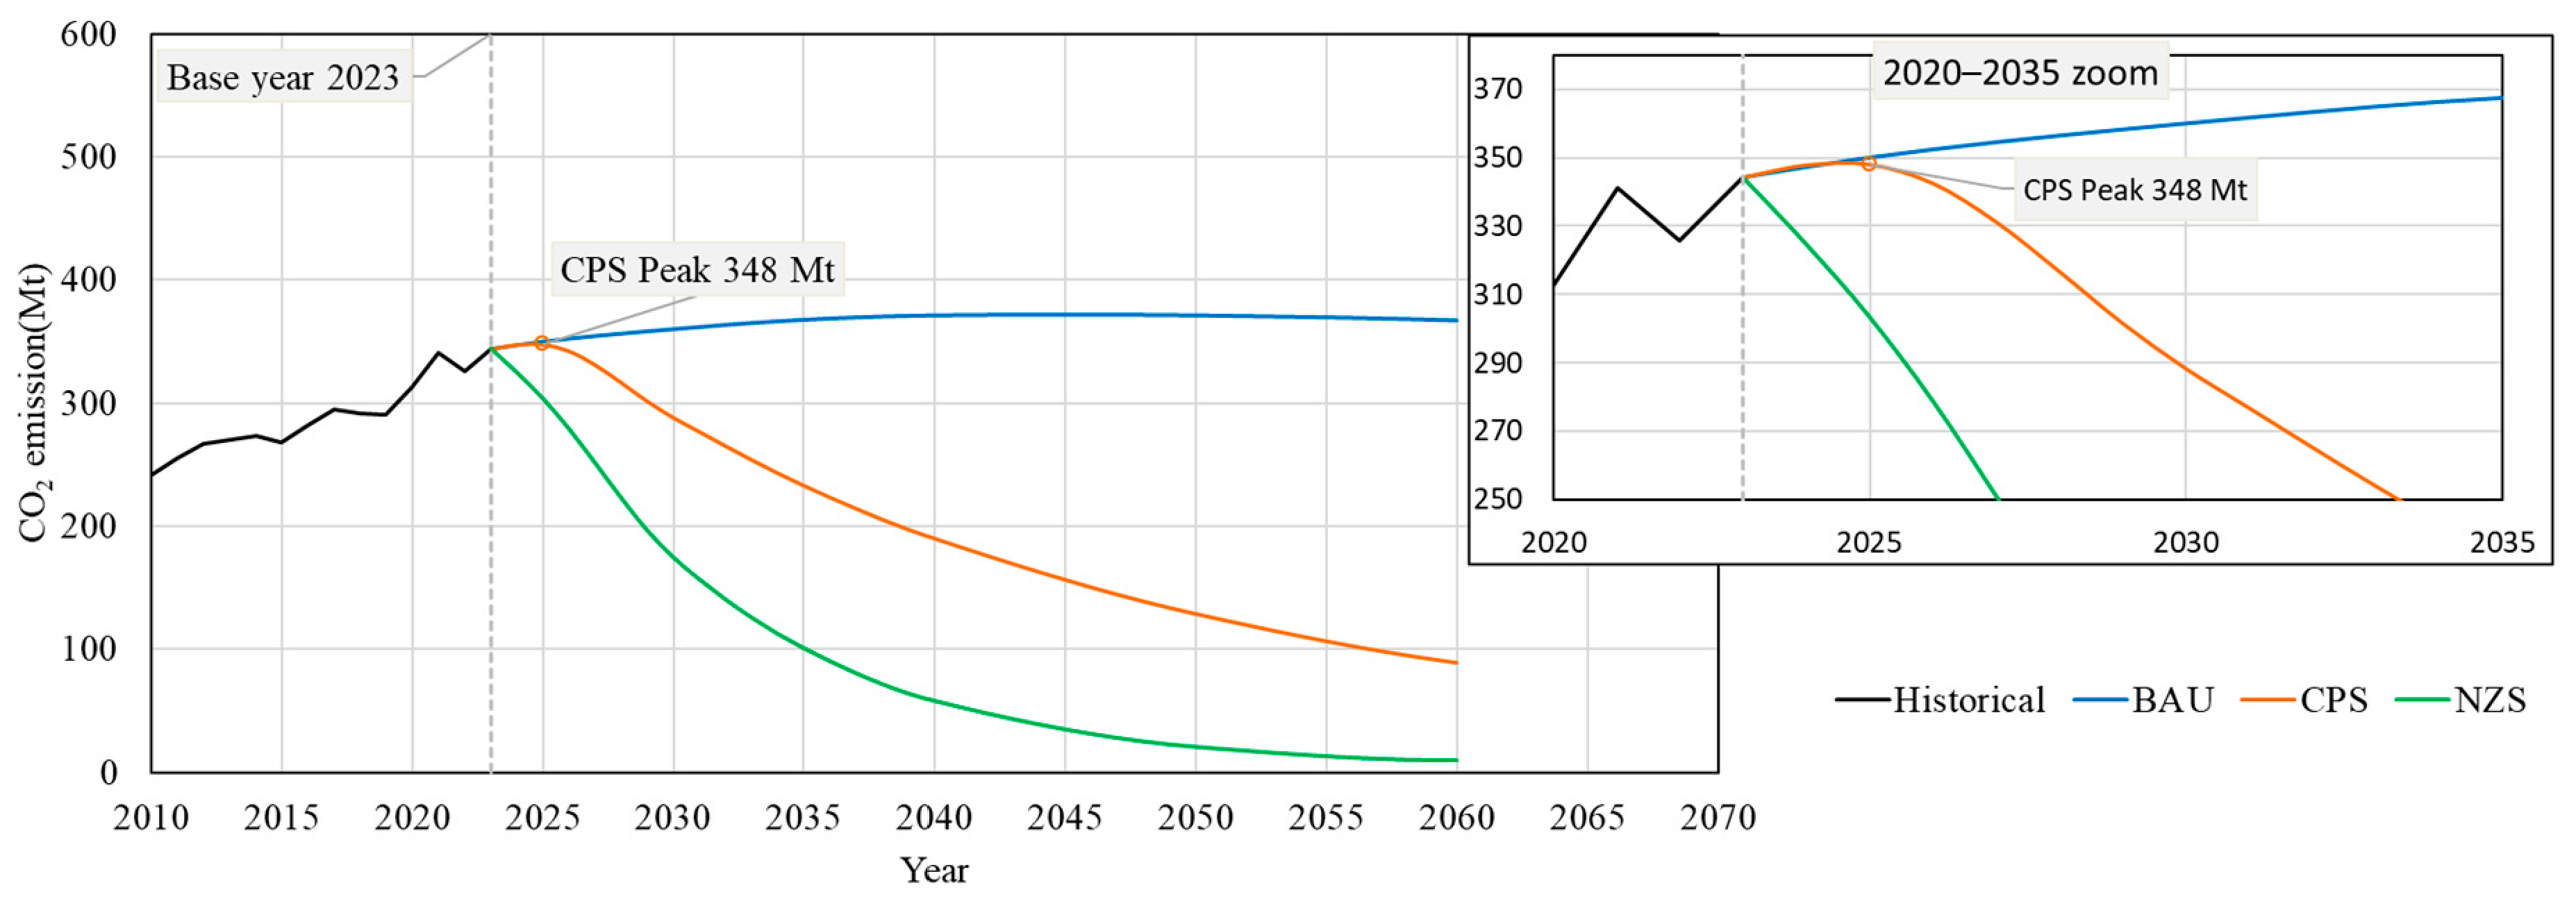
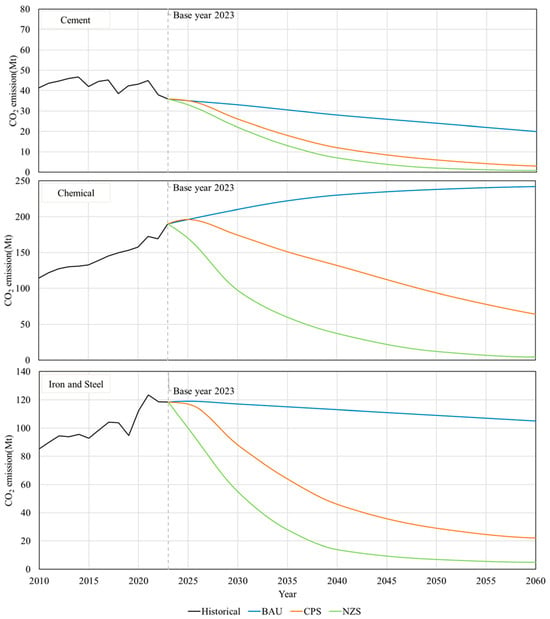
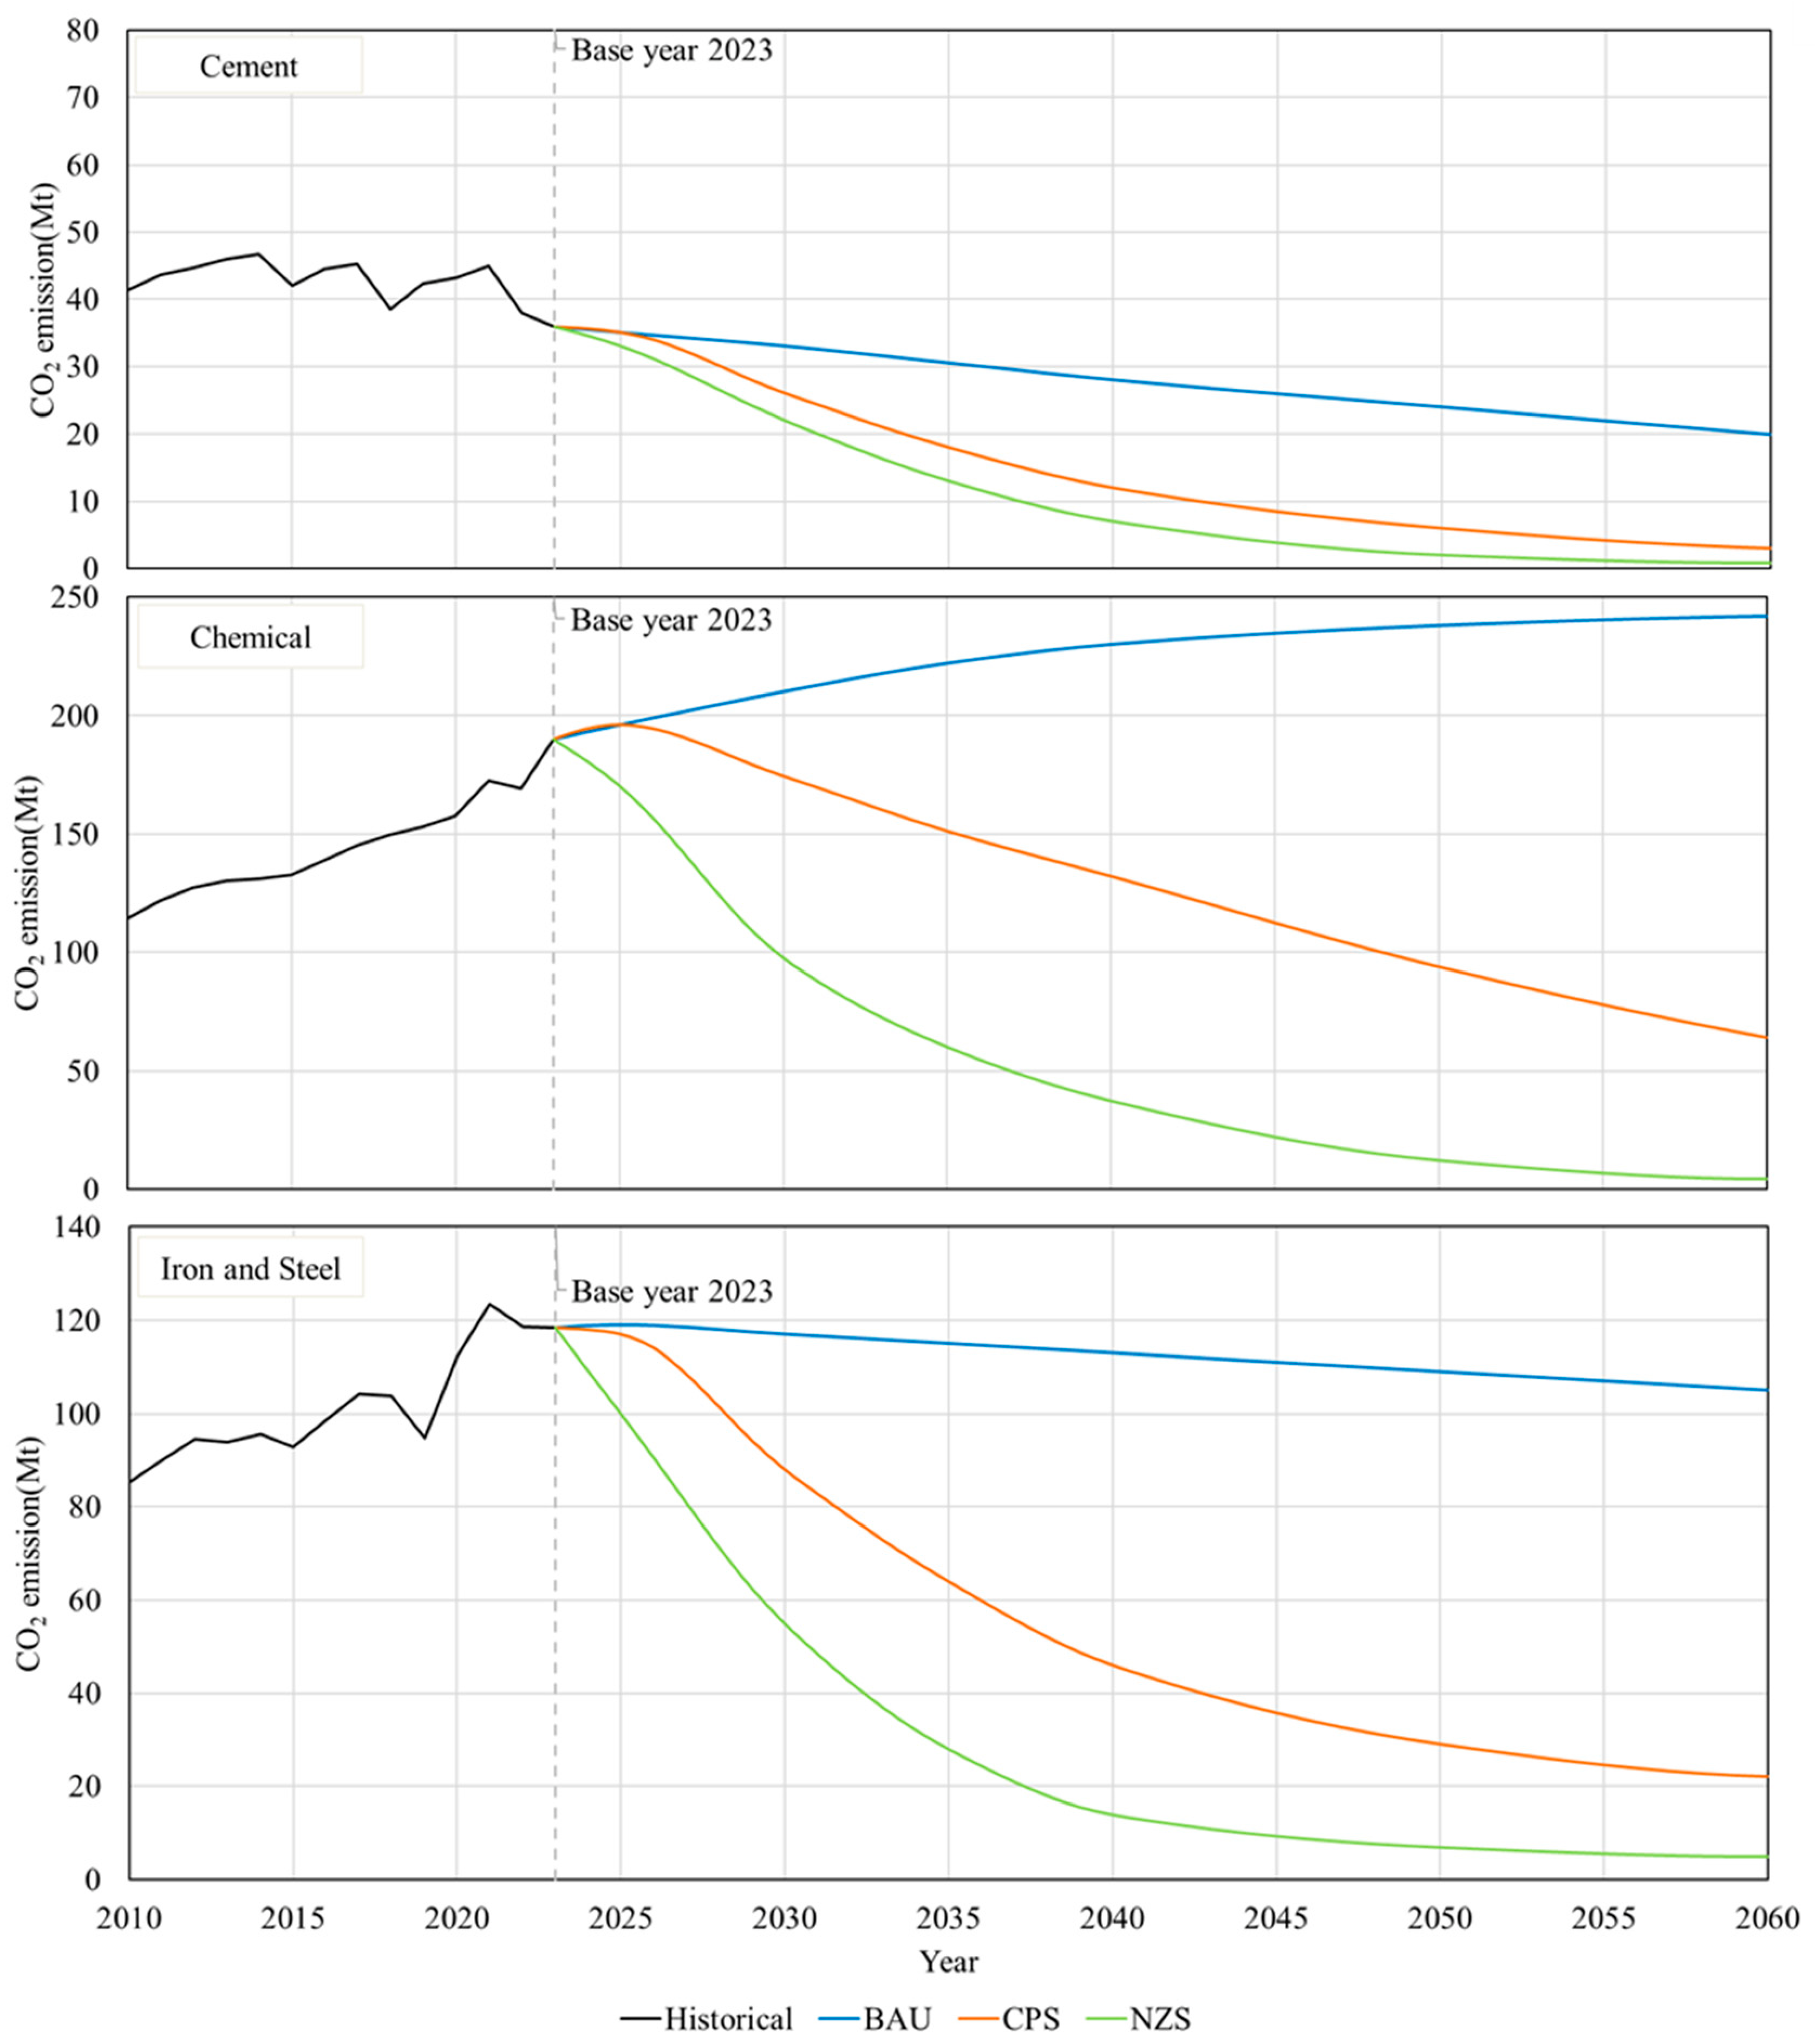
The simulation results of the recalibrated LEAP model show that carbon emission trajectories from 2024 to 2060 vary significantly across the three scenarios (Figure 7). Under the baseline scenario (BAU), the total carbon emissions of the three industries rise slowly from 344.17 million tonnes in 2023 to a broad plateau of about 371 million tonnes around 2040–2045 and remain at a high level, reaching 367 million tonnes in 2060—still 6.6% above the 2023 baseline. Although a shallow peak is formed around 2044, the limited post-peak decline is insufficient to support deep decarbonization. Under the low-carbon policy scenario (CPS), emissions peak at about 348 million tonnes in 2025, approximately 1.1% above the 2023 baseline. This short-lived peak reflects a transitional period in which newly approved chemical capacity commissioned during 2024–2025 temporarily increases sectoral emissions (chemical emissions rise from 189.93 Mt in 2023 to 196 Mt in 2025), while the full effect of CPS intensity-reduction and fuel-switching measures takes hold from 2026 onward. Thereafter, emissions decline rapidly, dropping to 288.35 million tonnes by 2030 and to 89.05 million tonnes by 2060—a 74.1% reduction compared with 2023. Under the net-zero scenario (NZS), emissions enter a monotonic decline from 2023 without a distinct peak plateau, falling to 174.65 million tonnes by 2030, 58.27 million tonnes by 2040 and further to 10.05 million tonnes by 2060, a reduction rate of 97.1%, approaching a near-zero emission pathway. Table 4 reports the projected emissions at six key nodes (2025, 2030, 2035, 2040, 2050, and 2060) for each sector and for the total under all three scenarios, enabling a direct cross-scenario comparison. The sectoral trajectories diverge markedly: under BAU, emissions remain nearly flat or drift slightly higher through 2060 in all three sectors (iron and steel 113 to 105 Mt, cement 28 to 20 Mt, chemicals 230 to 242 Mt), reflecting continued output growth without structural decarbonization; under CPS, all three sectors decline steadily, with chemicals remaining the largest emitter (132 Mt in 2040 and 64.05 Mt in 2060) because of sustained output growth, while iron and steel (46 to 22 Mt) and cement (12 to 3 Mt) fall faster; under NZS, the decline is far steeper, with every sector approaching near-zero levels by 2060 (iron and steel 5 Mt, cement 0.8 Mt, chemicals 4.25 Mt). The sector-level values in Table 4 are consistent with the aggregate trajectories shown in Figure 7 and underpin the cumulative-emission and driver-decomposition analyses that follow. The comparison of sector-specific projected carbon emission scenarios (2010–2060) is shown in Figure 8.
Figure 7.
Comparison of projected carbon emission scenarios for three major energy-intensive industries in Shandong Province (2010–2060).
Table 4.
Projected carbon emissions at key nodes under the three scenarios (million tonnes of CO2).
Figure 8.
Comparison of sector-specific projected carbon emission scenarios (2010–2060).
In terms of peaking time, under the BAU scenario, carbon emissions rise to a broad high-level plateau, reaching approximately 371.65 million tonnes around 2044, and decline only slightly thereafter. Although a shallow peak is formed, the limited post-peak decline is insufficient to support deep decarbonization. Under the CPS scenario, the emission peak occurs in 2025, with a peak value of approximately 348 million tonnes of CO2, only about 1.1% higher than the 2023 baseline, reflecting the significant restraining effect of strengthened policies. Under the NZS scenario, emissions enter a rapid decline channel starting from 2023, without going through an emission peak plateau period.
3.2.2. Sectoral Emission Mitigation Pathways
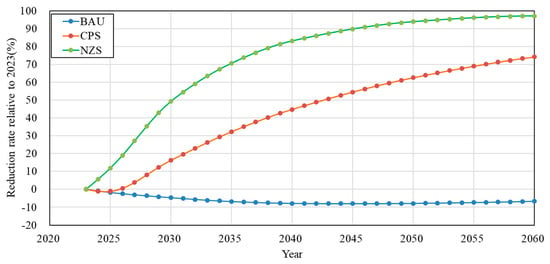
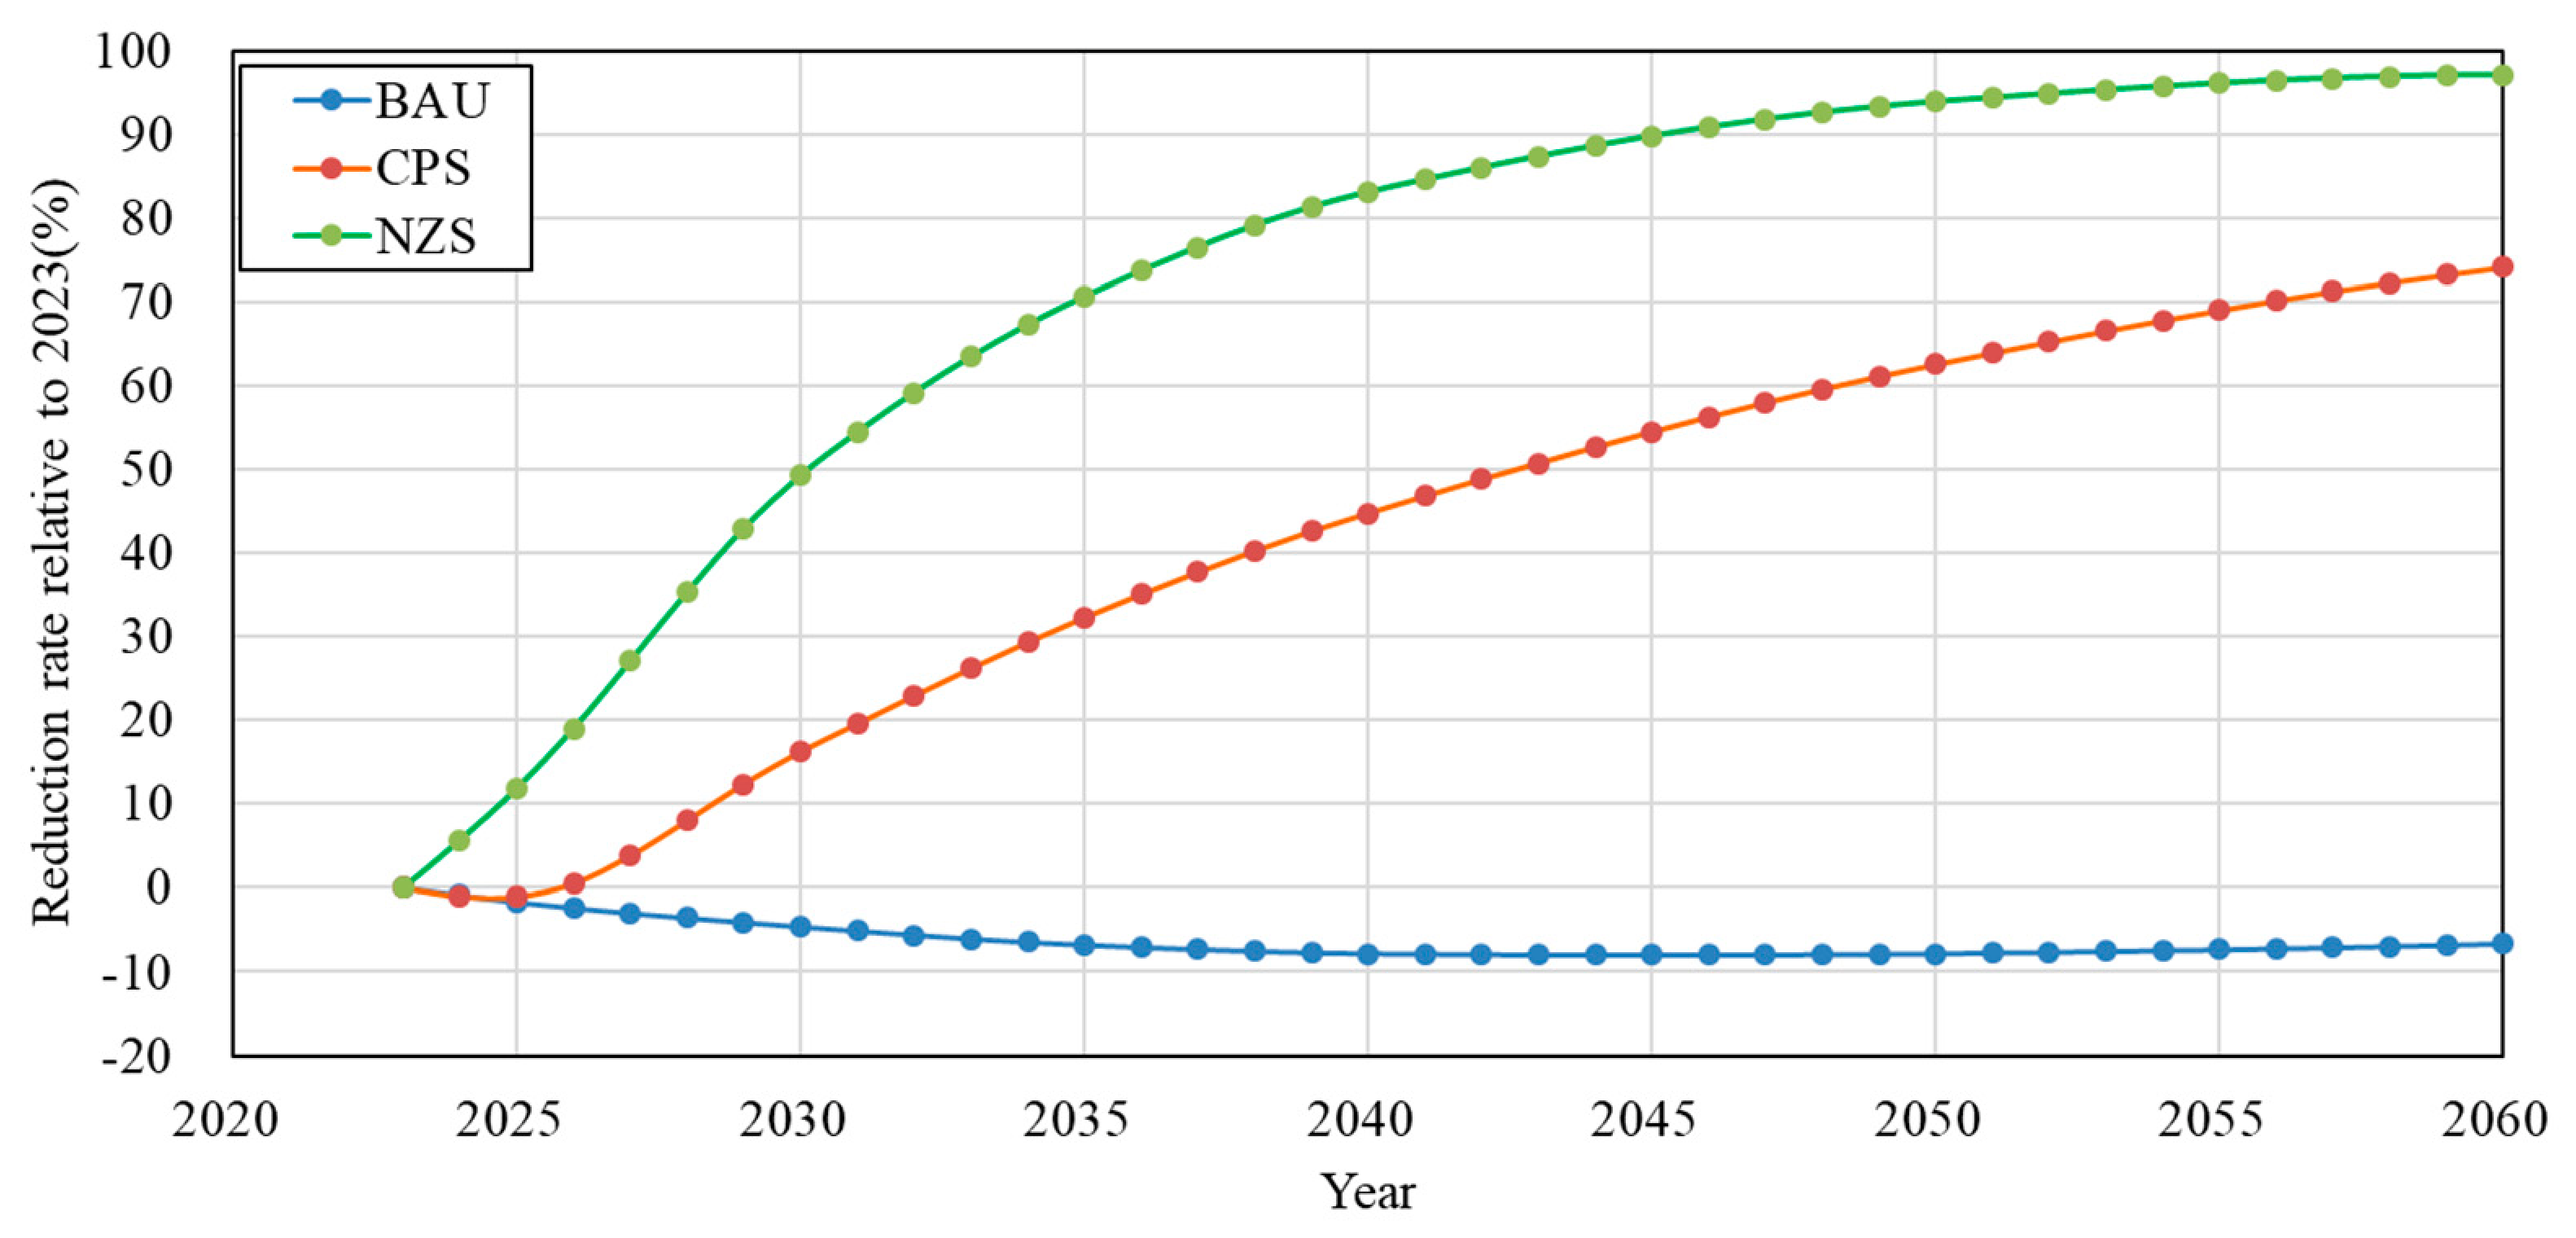
For the iron and steel industry under the CPS scenario, carbon emissions decrease from 118.42 million tonnes in 2023 to approximately 22 million tonnes in 2060. The emission reduction contribution mainly comes from the increased proportion of electric arc furnace (EAF) steel (rising from 10% in 2023 to 40% in 2060) (Figure 9), the demonstration and promotion of hydrogen-rich blast furnace smelting technology, and the full coverage of energy efficiency benchmark enterprises. Under the NZS scenario, emissions drop to approximately 5 million tonnes, and the incremental emission reduction comes from the large-scale application of hydrogen-based direct reduced iron (DRI) (accounting for 35% in 2060) and the large-scale deployment of CCUS in the iron and steel industry.
Figure 9.
Comparison of carbon emission reduction rates under the three scenarios (2025–2060).
Driven by both capacity reduction and energy efficiency improvement, emissions from the cement industry under the CPS scenario decrease from 35.82 million tonnes in 2023 to approximately 3 million tonnes in 2060. Under the NZS scenario, the proportion of cement clinker substitute materials increases to more than 50%, coupled with the popularization of oxy-fuel combustion coupled with carbon capture technology, emissions drop to approximately 0.8 million tonnes in 2060, but achieving this deep reduction requires substantial clinker substitution and large-scale deployment of carbon capture technologies.
The chemical industry faces the most severe emission reduction challenge due to the continuous growth of product output. Under the CPS scenario, emissions decrease from 189.93 million tonnes in 2023 to approximately 64 million tonnes in 2060, mainly through feedstock lightening, with the gas-based feedstock share increasing to 60%, together with energy-efficiency improvement, grid decarbonization, and moderate CCUS deployment. Under the NZS scenario, through green power-based hydrogen production, bio-based feedstock substitution and process intensification technologies, the chemical industry’s emissions drop to approximately 4 million tonnes in 2060.
3.2.3. Cumulative Emissions Analysis
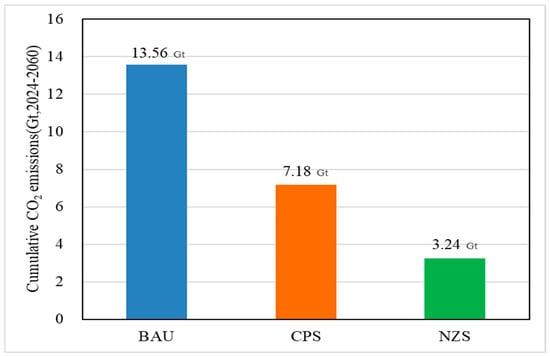
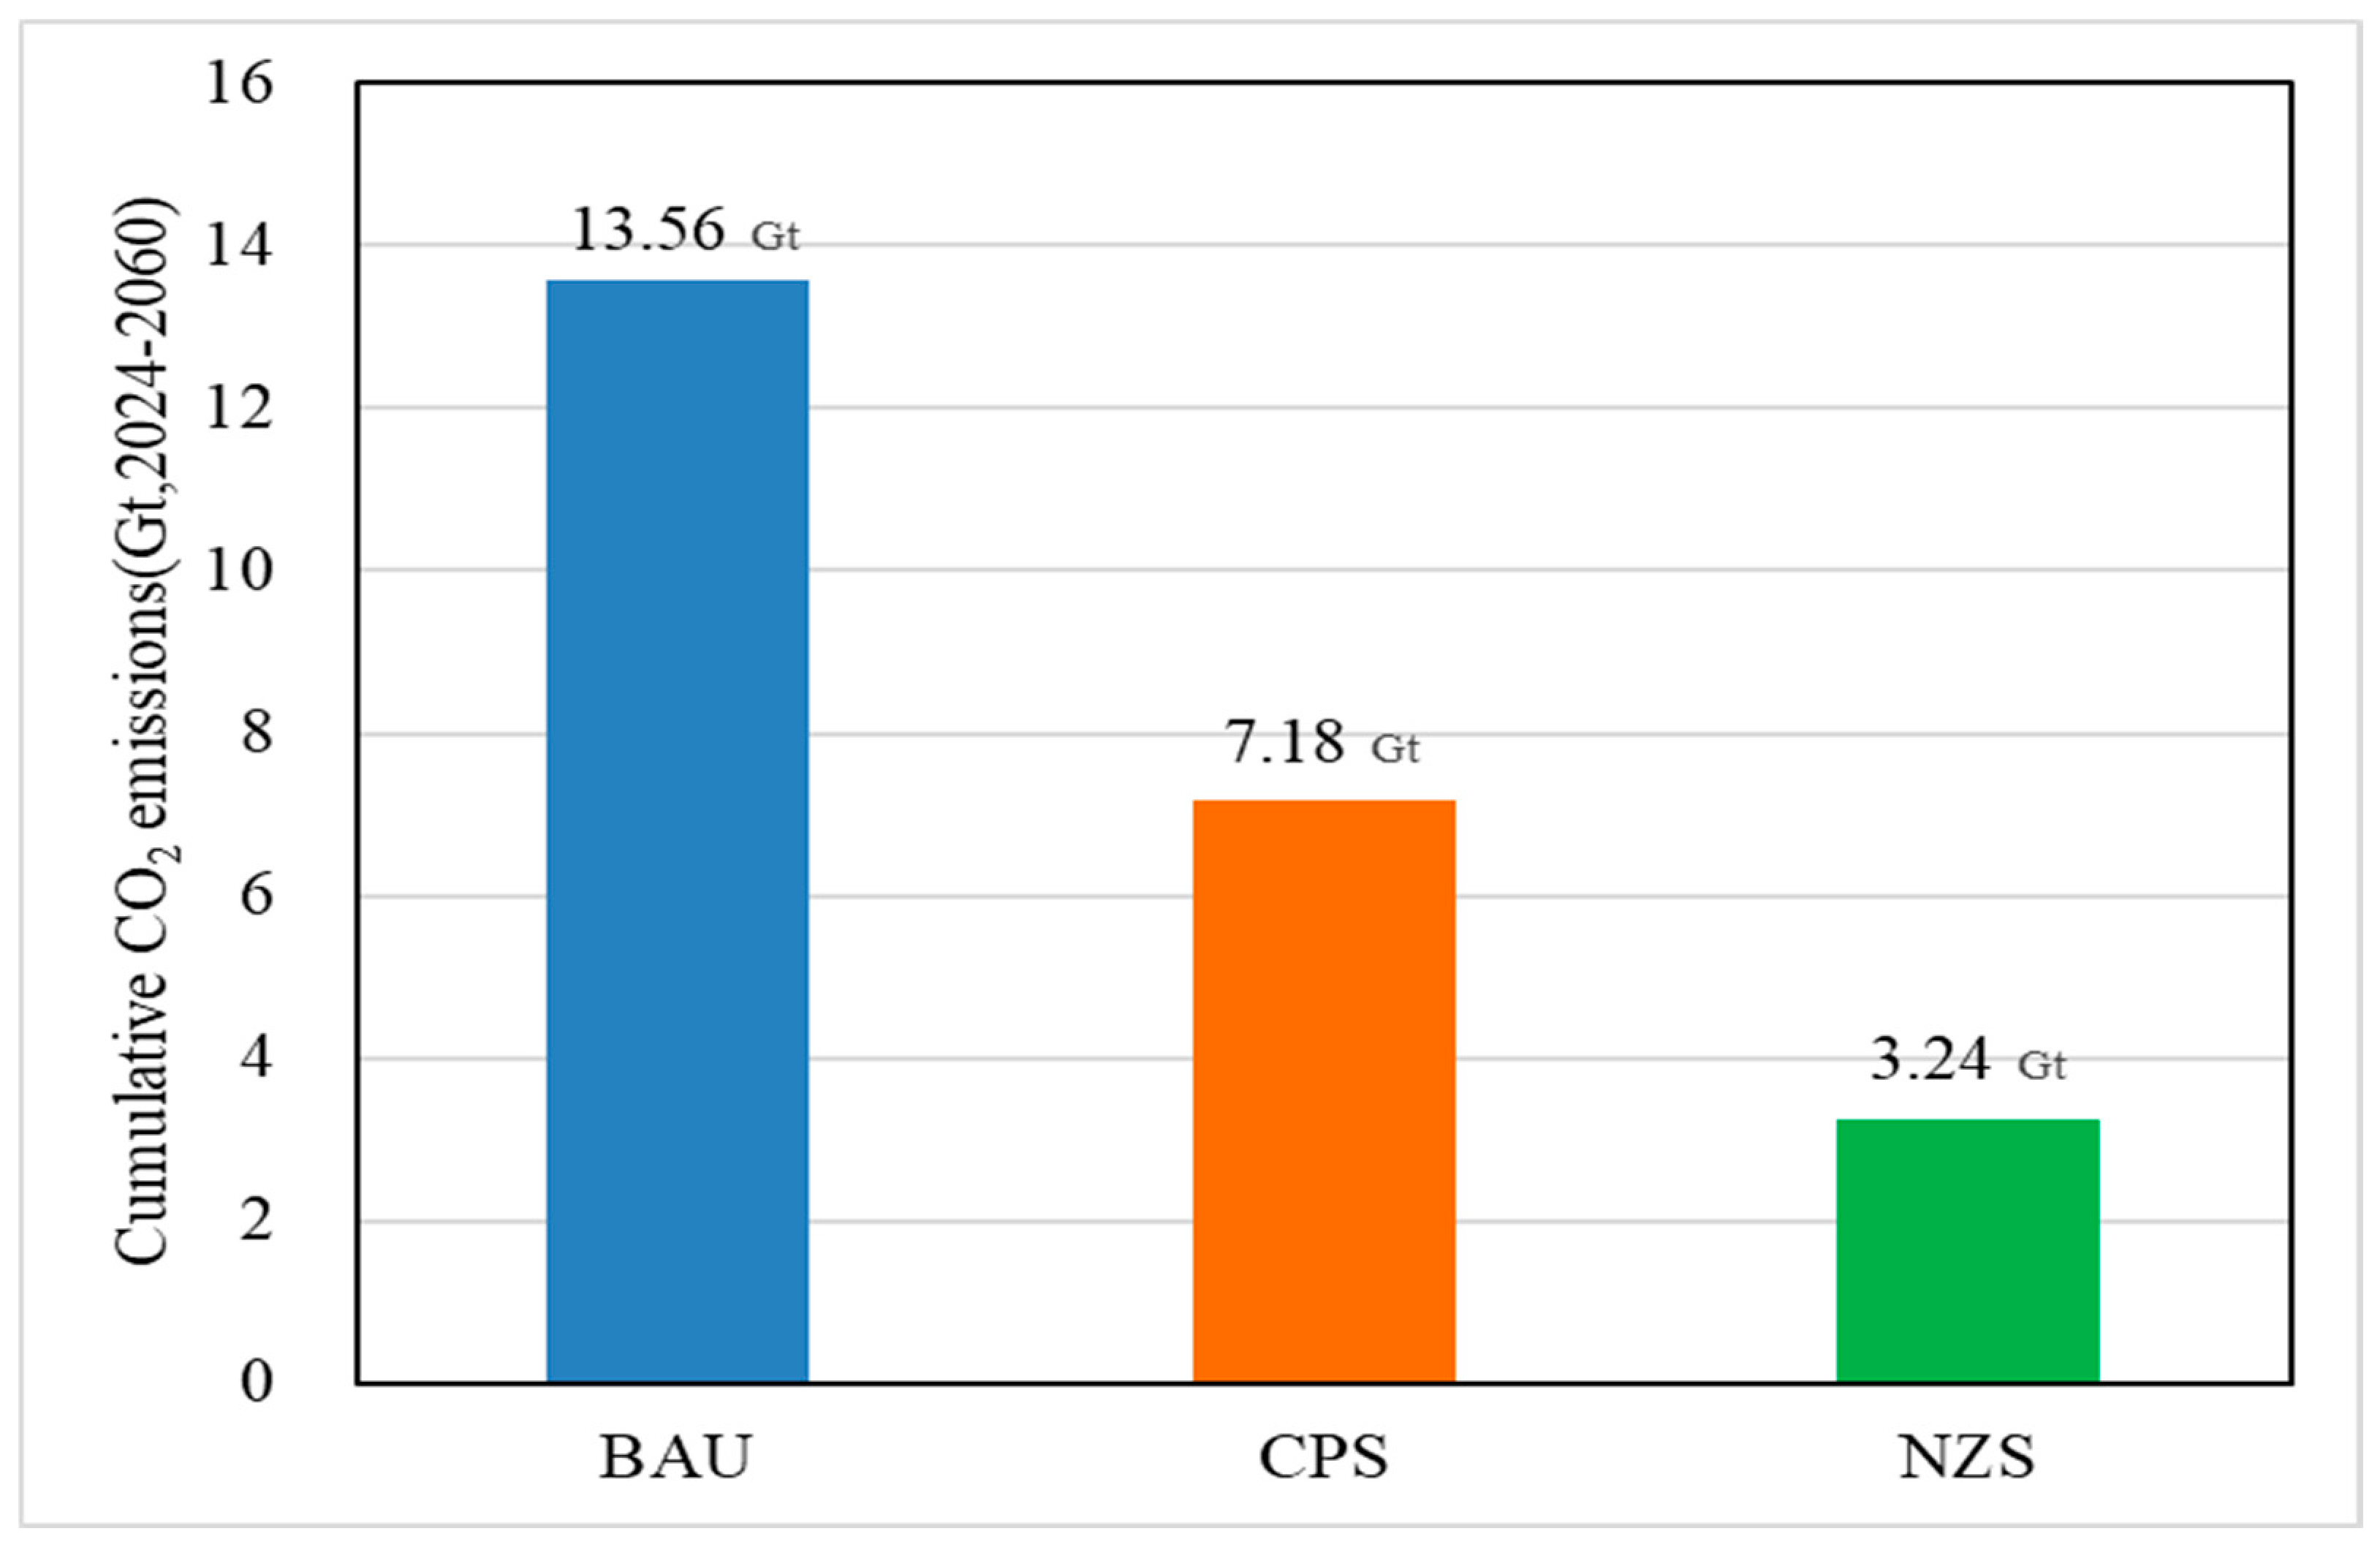
From 2024 to 2060, the cumulative carbon emissions of the three industries differ significantly under the three scenarios. The cumulative emissions are approximately 13.56 billion tonnes of CO2 under the BAU scenario, drop to about 7.18 billion tonnes under the CPS scenario, and are only about 3.24 billion tonnes under the NZS scenario (Figure 10). Compared with the BAU scenario, the CPS scenario achieves a cumulative emission reduction of 6.38 billion tonnes (47.1%), and the NZS scenario achieves a cumulative reduction of 10.32 billion tonnes (76.1%). The NZS scenario achieves the deepest cumulative emission reduction, with cumulative emissions approximately 76.1% lower than the BAU scenario, highlighting the urgency of accelerating the decarbonization process for the three energy-intensive industries.
Figure 10.
Cumulative carbon emissions under the three scenarios (2024–2060).
3.3. Decomposition of Emission Reduction Drivers and Scenario Comparison
3.3.1. Decomposition of Emission Reduction Drivers
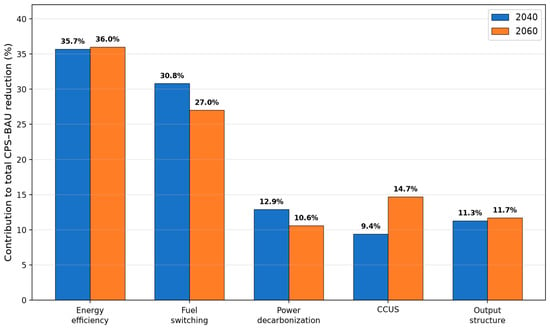
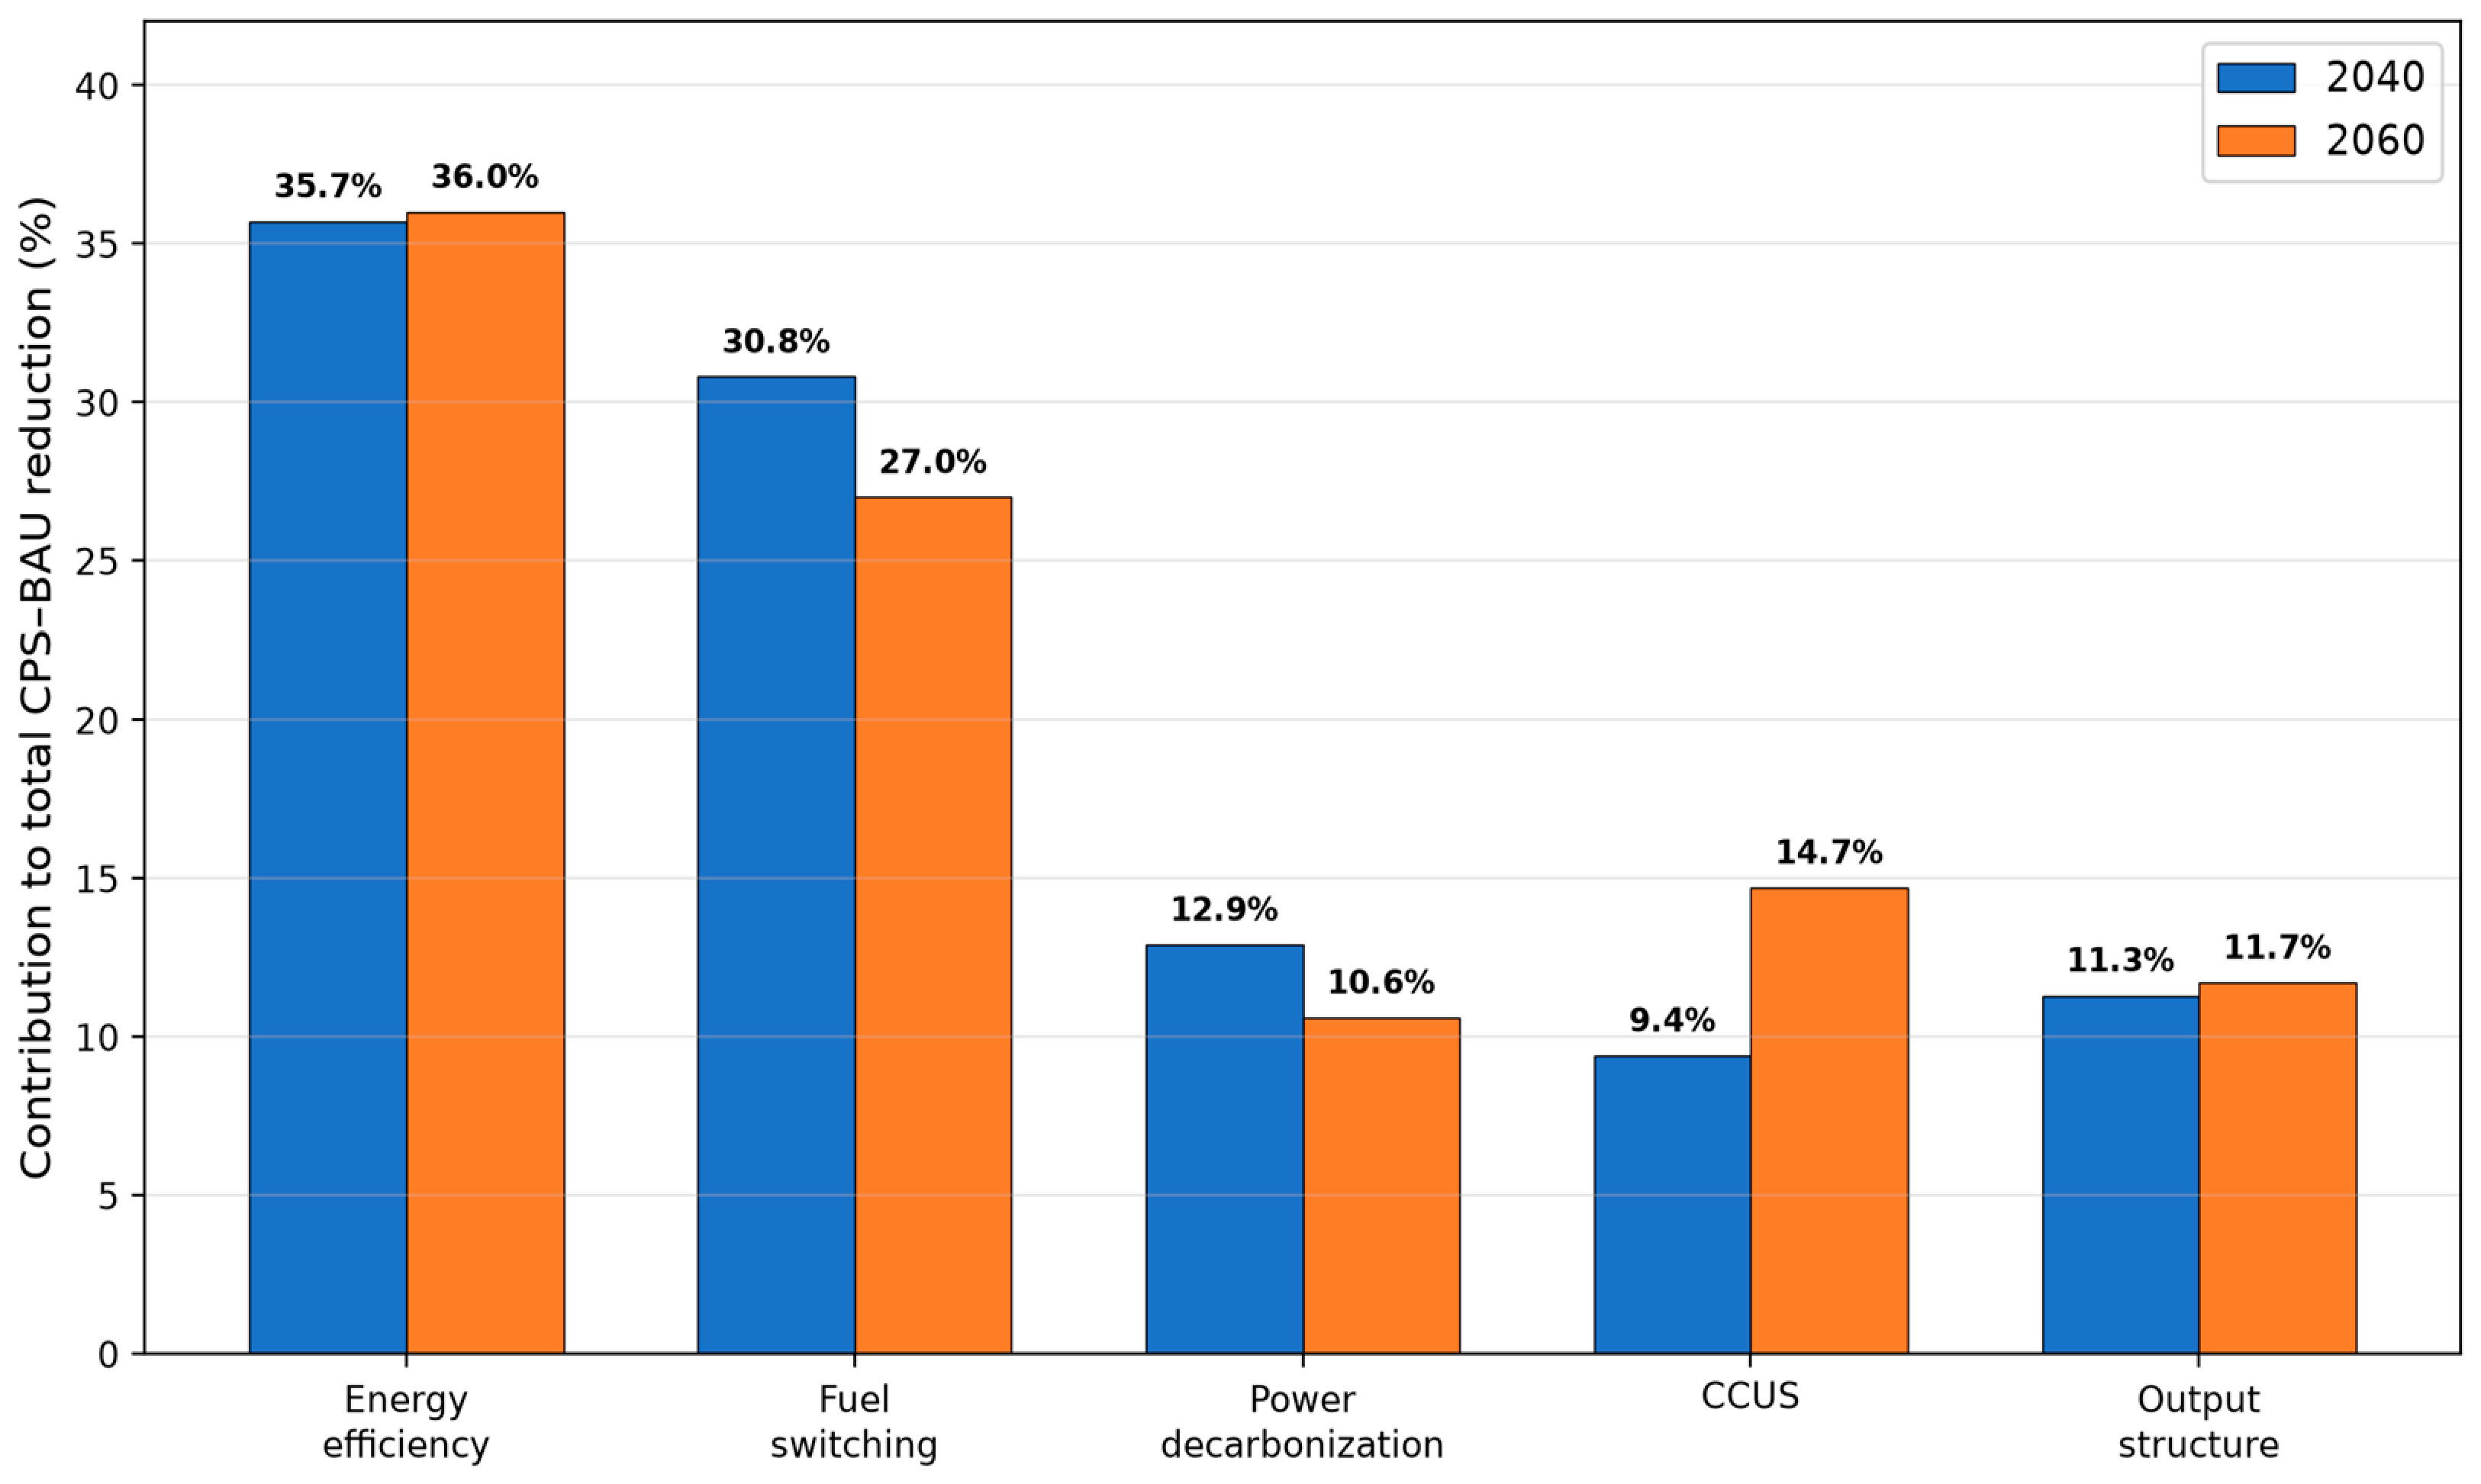
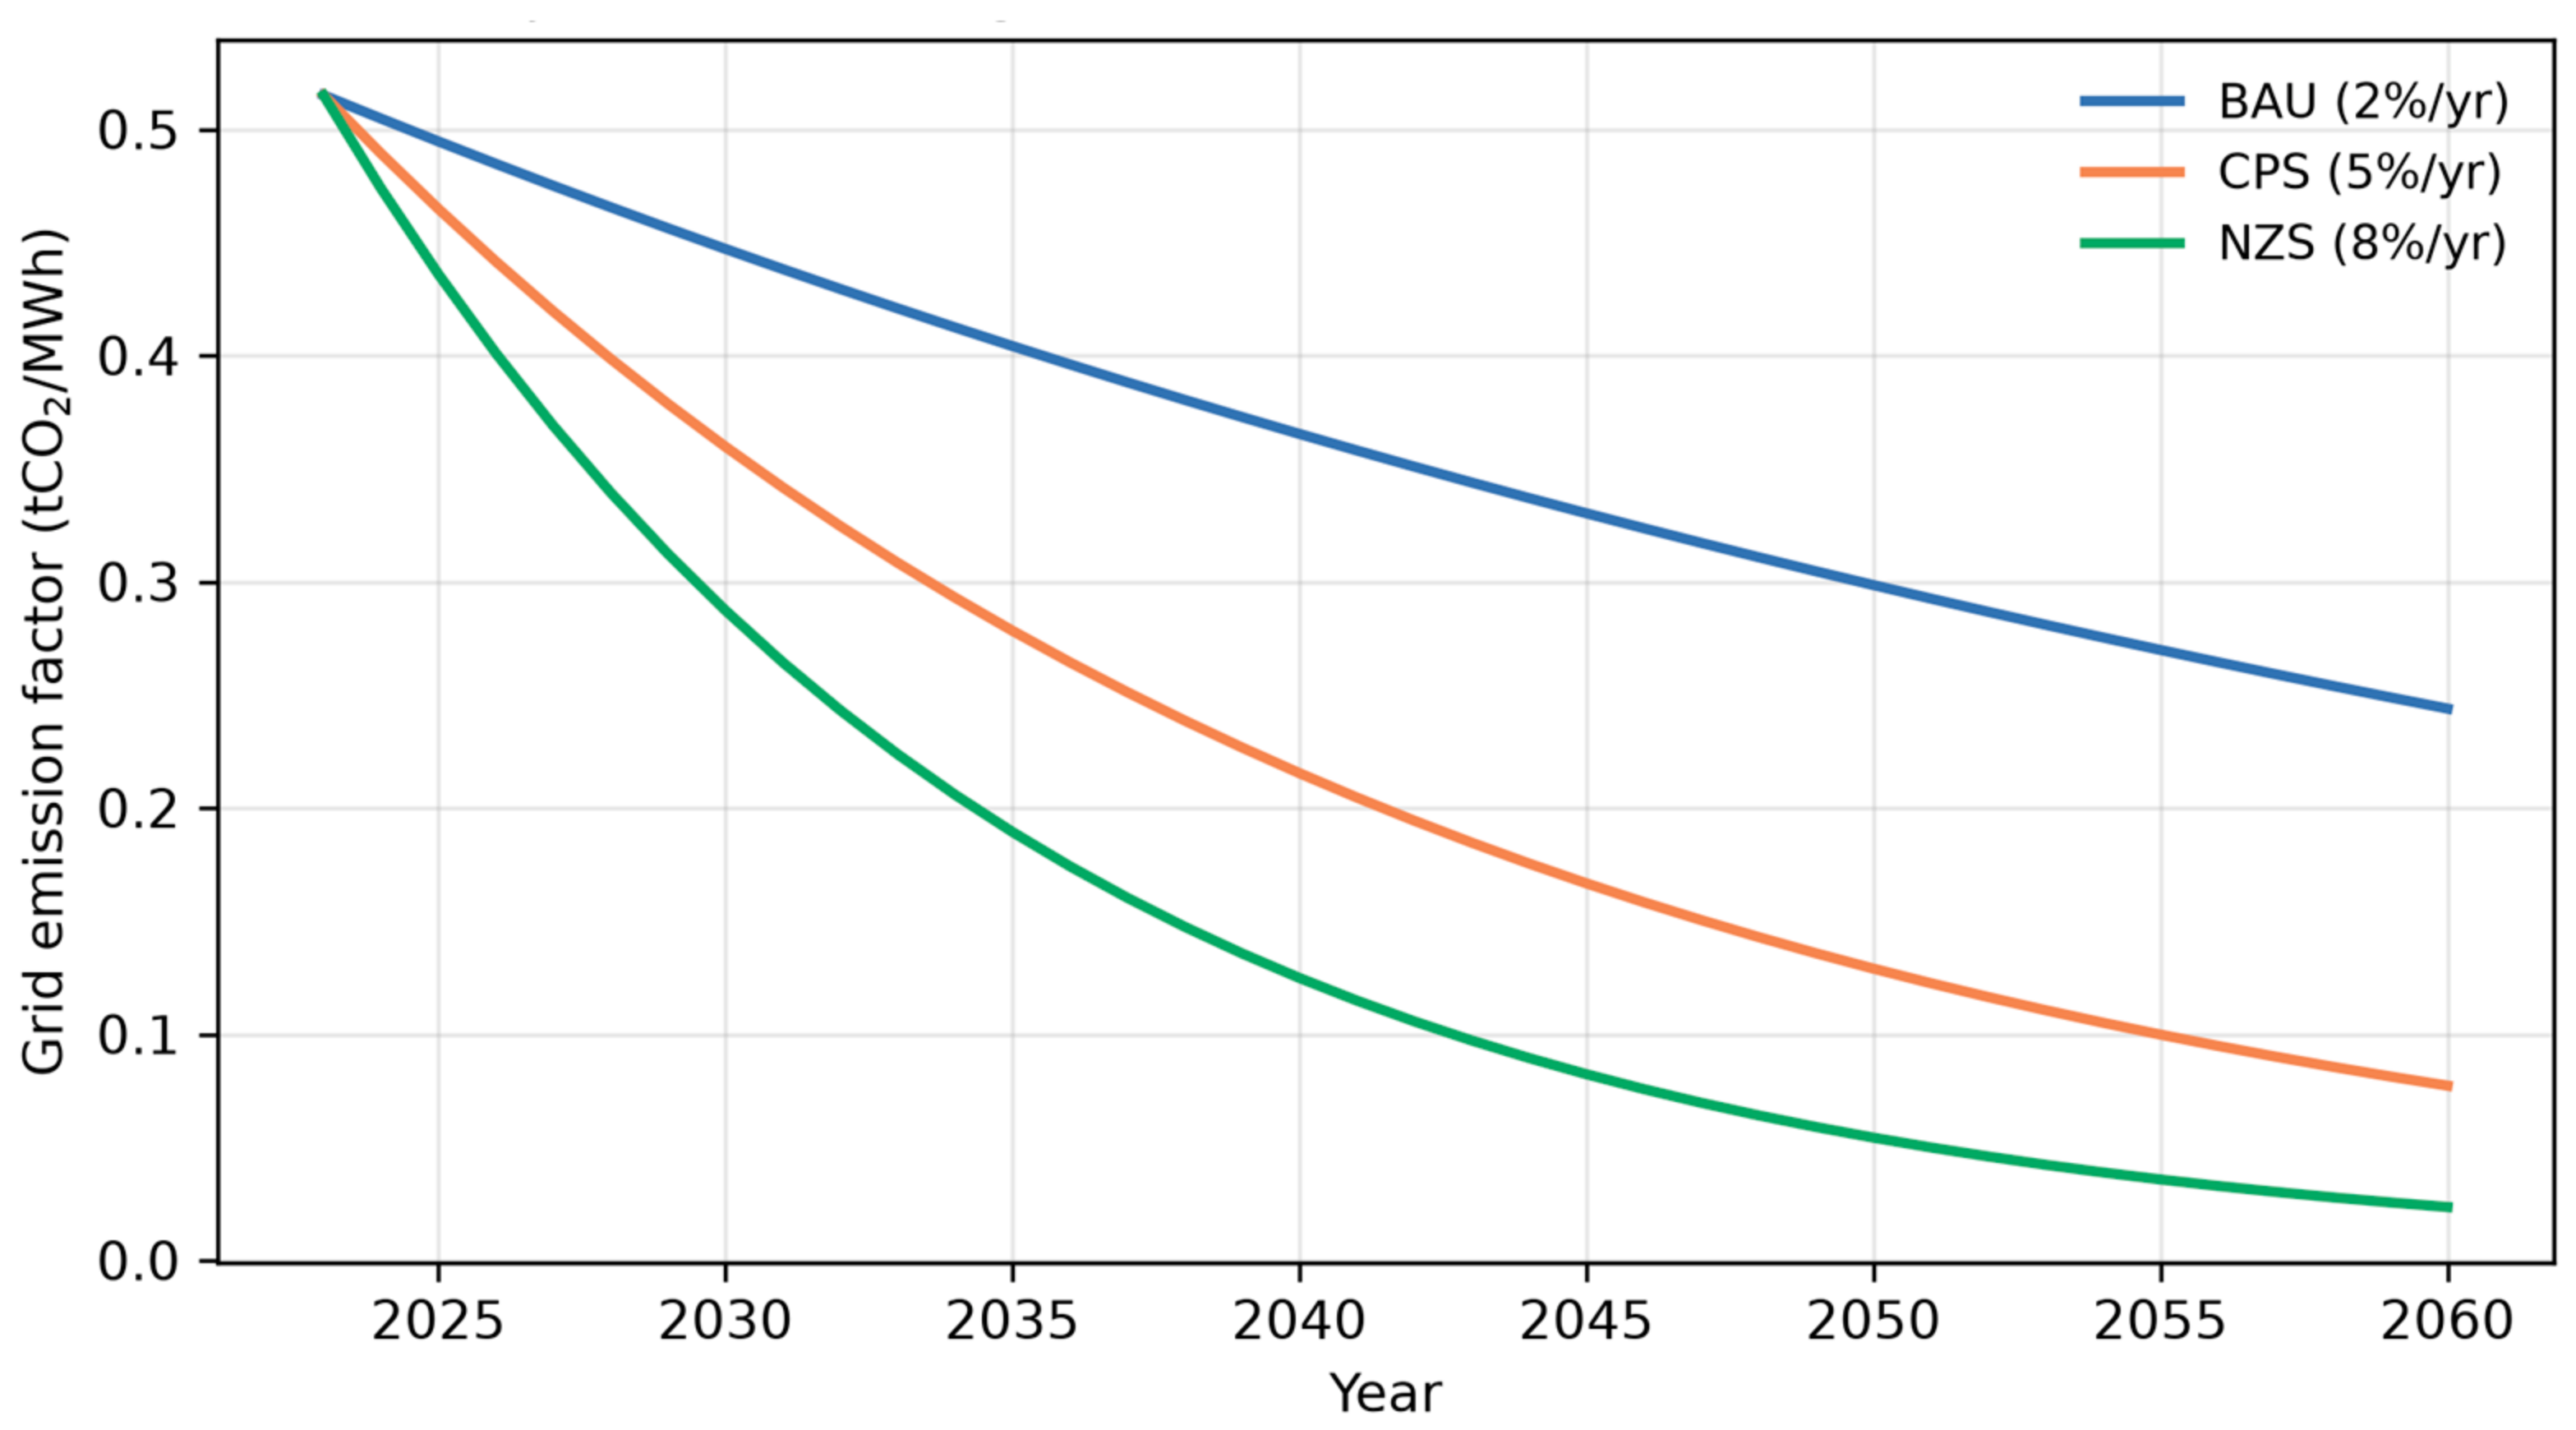
Taking the BAU scenario as the reference, the driving forces of the emission reduction effects of the CPS scenario are decomposed using the Shapley value method, which provides a unique, order-independent attribution of the total BAU–CPS emission gap among the five decarbonization measures. Specifically, the BAU–CPS emission gaps decomposed here correspond to the differences between the BAU and CPS columns of Table 3 at the two key nodes: in 2040 the total gap is 371.0 − 190.0 = 181.0 Mt, and in 2060 it is 367.0 − 89.05 ≈ 278.0 Mt; the Shapley contributions reported below partition these two gaps among the five measures. The results differ notably between the medium-term (2040) and long-term (2060) horizons. In 2040, energy efficiency improvement is the largest contributor, accounting for 35.7% of the total reduction (64.6 Mt), followed by fuel switching at 30.8% (55.7 Mt), power decarbonization at 12.9% (23.3 Mt), output structure adjustment at 11.3% (20.4 Mt), and CCUS at 9.4% (17.0 Mt). By 2060, the contribution structure shifts: energy efficiency remains the leading measure at 36.0% (100.1 Mt), while fuel switching declines to 27.0% (75.1 Mt) as near-term substitution opportunities saturate. CCUS more than doubles its share to 14.7% (40.8 Mt), reflecting its role as the key deep-decarbonization technology in the long run. Output structure adjustment remains stable at 11.7% (32.4 Mt), and power decarbonization contributes 10.6% (29.5 Mt). The power emission factor drops from 0.515 tCO2/MWh in 2023 to approximately 0.077 tCO2/MWh in 2060 under the CPS scenario.
Methodological note on Shapley decomposition. Because the five decarbonization measures enter the emission accounting equation at distinct multiplicative nodes (Equation (1)), their combined effect is multiplicative rather than additive, and interactions—such as energy-efficiency improvements reduce electricity demand and therefore alter the marginal abatement attributable to power-system decarbonization—are captured endogenously by the model structure. To obtain an order-independent additive attribution of the total CPS-versus-BAU abatement, we employ the Shapley value from cooperative game theory. For each measure m, its Shapley contribution is defined as the average marginal emission reduction achieved by adding m to every possible subset of the other four measures, averaged over all 5! = 120 permutations: , where v(S) denotes the BAU–CPS emission reduction achieved when the subset S of measures is activated. The Shapley values satisfy efficiency (Σ φ_m = total BAU–CPS reduction), symmetry, and dummy axioms, ensuring a unique and fair attribution that does not depend on an arbitrary measure ordering. Each measure is parameterized by its BAU and CPS settings (output growth rate, intensity decline rate, fuel-mix trajectory, grid decarbonization rate, and CCUS coverage rate), and the emission level for any subset of activated CPS measures is computed by applying the corresponding parameter set within the same LEAP framework. The five category labels—energy efficiency improvement, energy structure optimization (fuel switching), power system decarbonization, CCUS, and output structure adjustment—are applied consistently in the text and in Figure 11.
Figure 11.
Decomposition of CPS emission reduction drivers relative to BAU (additive, =100%).
3.3.2. Scenario Comparison of Power Decarbonization Rates
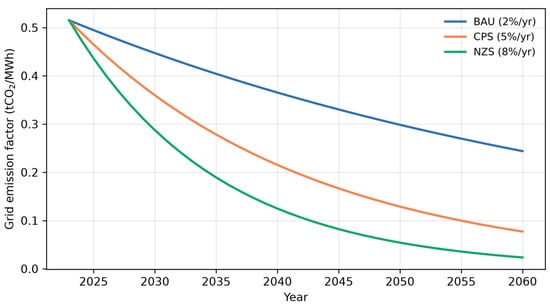
Changes in power emission factors have a significant impact on indirect emissions of the three industries. This study sets three power decarbonization rates: an annual decline of 2% under the BAU scenario, 5% under the CPS scenario, and 8% under the NZS scenario. The scenario comparison shows that faster grid decarbonization is associated with substantially lower indirect emissions (Figure 12); however, because output growth, energy efficiency, fuel mix, and CCUS deployment differ simultaneously across scenarios, the results should be interpreted as an integrated scenario effect rather than an isolated marginal effect of power decarbonization alone. With these rates, the grid emission factor declines to approximately 0.077 tCO2/MWh in 2060 under the CPS scenario. Under the NZS scenario, the power emission factor drops to approximately 0.024 tCO2/MWh in 2060, close to the level of near-zero carbon power, which is a prerequisite for large-scale electrification substitution in the iron and steel industry and green hydrogen production in the chemical industry.
Figure 12.
Trajectories of the grid emission factors under the three scenarios.
4. Discussion
4.1. Comparison with Existing Studies
The decarbonization pathways identified in this study are broadly consistent with the sectoral literature. For the iron and steel industry, the dominant near-term contribution of energy efficiency and the indispensability of hydrogen metallurgy and CCUS in the long term echo the life-cycle assessments and technology-roadmap analyses reviewed in Section 1.2.1. For the cement industry, the limited near-term abatement potential-reflecting the saturation of thermal efficiency improvement and the rigid process emissions from clinker calcination-is consistent with plant-level studies indicating that deep cuts hinge on clinker substitution and large-scale CCUS. For the chemical industry, the identified difficulty of decoupling emissions from output growth aligns with the evidence that feedstock structure transformation, rather than end-of-pipe treatment, constitutes the decisive lever. At the regional level, the relative decoupling observed for 2015–2023 corroborates driver-decomposition studies for energy-intensive provinces, while the elasticity coefficient estimated here (0.32 during 2018–2023) suggests a more advanced decoupling stage than the national industrial average, plausibly reflecting Shandong’s earlier and more aggressive capacity regulation policies.
4.2. Residual Emissions in the NZS Scenario
Under the NZS scenario, total emissions decline by 97.1% relative to the 2023 baseline by 2060, leaving residual emissions of approximately 10.05 million tonnes. Three categories of residual sources can be identified: (i) process emissions that are technically difficult to eliminate entirely, notably residual carbonate decomposition emissions from clinker production not captured by CCUS, owing to capture-rate limits and intermittent kiln operation, and residual process emissions from small and dispersed chemical facilities; (ii) combustion emissions from high-temperature processes where electrification or hydrogen substitution remains technically constrained or economically prohibitive by 2060; and (iii) emissions from energy uses not covered by the modeled abatement portfolio, such as incidental fuel use in mobile machinery within plant boundaries. The residual emissions therefore reflect a combination of technically unavoidable process emissions and sources not addressed by the current measure portfolio, rather than a full accounting of all conceivable mitigation options. Whether the residuals can be further abated through direct air capture, biomass energy with carbon capture and storage (BECCS), or enhanced material efficiency lies beyond the scope of the present model and is left for future research.
4.3. Limitations and Future Research
Three limitations should be acknowledged. First, missing observations in the historical series were supplemented by linear interpolation (missing rate below 5%); although robustness checks indicate a negligible influence on base-year accounting, more sophisticated imputation methods could further strengthen data reliability. Second, the scenario framework comprises three gradient scenarios; while this design is transparent and policy-relevant, additional sensitivity scenarios—for example, delayed CCUS deployment or accelerated electrification-would enrich the uncertainty characterization, for which the power decarbonization scenario comparison in Section 3.3.2 represents a first step. Third, the model adopts a top-down sectoral representation of technology diffusion without explicit cost optimization; coupling the LEAP framework with techno-economic optimization or CGE modules would allow endogenous technology choice and welfare analysis. Future extensions may also incorporate the coupling between industrial decarbonization and the evolving provincial power system, as well as green electricity and green certificate market instruments.
5. Conclusions and Policy Implications
5.1. Main Conclusions
This study contributes by integrating multi-source emission information, LEAP-based scenario analysis, and emission reduction driver decomposition for evaluating regional industrial decarbonization pathways. The main conclusions are summarized as follows:
In terms of emission pattern characteristics, the total carbon emissions of the three energy-intensive industries in the study area show a fluctuating upward trend, reaching 325.93 million tonnes of CO2 in 2022. The sectoral structure presents significant differentiation: the emission share of the chemical industry has continuously risen to 51.9%, making it the primary target of regional carbon emission control; emissions from the cement industry have entered a downward trajectory, with high certainty of emission reduction.
In terms of scenario-based emission reduction, carbon emission trajectories vary significantly under different policy intensities. Under the baseline scenario, emissions rise to a broad high-level plateau of about 371 million tonnes around 2040–2050 and remain at a high level of 367 million tonnes by 2060 (still 6.6% above the 2023 baseline); although a shallow peak/plateau is formed, the post-peak reduction is insufficient to support deep decarbonization. Under the low-carbon policy scenario, carbon peaking is achieved in 2025 at about 348 million tonnes, with an emission reduction rate of 74.1% by 2060; cumulative emissions over 2024–2060 are reduced by 47.1% (6.38 billion tonnes) relative to BAU. Under the net-zero scenario, emissions decline monotonically, with a reduction rate of 97.1% by 2060, essentially realizing near-zero emissions; cumulative emissions are reduced by 76.1% (10.32 billion tonnes) relative to BAU.
Regarding the emission reduction driving mechanism, the Shapley decomposition reveals that energy efficiency improvement remains the dominant contributor at both the medium-term (2040: 35.7%) and long-term (2060: 36.0%) horizons. Fuel switching provides the second-largest contribution (2040: 30.8%; 2060: 27.0%), while the relative importance of CCUS increases markedly toward 2060 (from 9.4% to 14.7%), highlighting its growing role in deep decarbonization. Output structure adjustment and power decarbonization provide stable complementary contributions across both horizons.
In terms of decoupling development trend, carbon emissions and economic growth of energy-intensive industries in the study area have shown a relative decoupling trend, with the emission elasticity coefficient dropping to 0.32 during 2018–2023. Driven by strengthened emission reduction policies, the decoupling process will further accelerate, and the NZS pathway is consistent with a transition toward absolute decoupling.
5.2. Policy Implications
Based on the research conclusions, the following policy recommendations are proposed for the low-carbon transition of energy-intensive industries:
Implement differentiated regulation by sector. For the chemical industry, priorities should be given to advancing the feedstock lightening transition, increasing the substitution ratio of natural gas and green hydrogen as feedstocks, and prioritizing the deployment of CCUS facilities relying on high-concentration emission sources. For the iron and steel industry, efforts should be made to accelerate the promotion of short-process electric arc furnace technology and deploy demonstrations of breakthrough technologies such as hydrogen-based metallurgy. For the cement industry, it is necessary to continuously reduce clinker production capacity and expand the application proportion of alternative raw materials and alternative fuels.
Build a multi-dimensional collaborative emission reduction system. A collaborative emission reduction system featuring “energy efficiency improvement + structure optimization + technological innovation” should be established. In the short term, energy efficiency benchmarking should be taken as the core to eliminate backward production capacity and promote best available technologies. In the medium term, the energy structure transition should be accelerated to increase the proportion of electrification and clean energy substitution. In the long term, disruptive technologies such as CCUS and hydrogen energy should be deployed to support the deep decarbonization target.
Strengthen the supporting role of the power system. The low-carbon transition of the power system should be accelerated to increase the proportion of renewable energy installed capacity and reduce the power emission factor, so as to provide clean power support for the electrification transformation of energy-intensive industries and green hydrogen production, and amplify the synergistic effect of power decarbonization on industrial emission reduction.
Establish a refined accounting system. The carbon emission accounting mechanism based on multi-source data fusion should be improved, with unified statistical calibers to enhance the accuracy and timeliness of emission data, so as to provide data support for the assessment of industrial emission reduction performance and dynamic policy adjustment.
Author Contributions
Conceptualization, Q.M., S.Z. and Y.Z.; methodology, X.G. and X.J.; software, S.Z.; validation, Q.M. and C.L.; formal analysis, X.J.; investigation, C.L.; resources, Q.M.; data curation, C.L.; writing original draft preparation, Q.M. and X.G.; writing—review and editing, S.Z.; visualization, S.Z.; supervision, Q.M.; project administration, S.Z.; funding acquisition, Q.M. All authors have read and agreed to the published version of the manuscript.
Funding
This work was supported by Science and Technology Project of State Grid Shandong Electric Power Company (520633250004: Research on Power Data Traceability and User-side Data Standardization for International Refined Carbon Certification).
Data Availability Statement
The original contributions presented in this study are included in the article. Further inquiries can be directed to the corresponding author.
Conflicts of Interest
Authors Qinggang Meng, Shengjie Zhang, Yunshuai Zhang, Xuewei Gong, were employed by the company State Grid Zibo Power Supply Company, Zibo 255000, China and Chen Li was employed by the State Grid Shandong Electric Power Company Marketing Service Center (Metrology Center), Jinan 255000, China. The authors declare that this study received funding from the Science and Technology Project of State Grid Shandong Electric Power Company (Grant No. 520633250004). The funder was not involved in the study design, collection, analysis, interpretation of data, the writing of this article or the decision to submit it for publication.
Abbreviations
The following abbreviations are used in this manuscript:
| BAU | Business-as-Usual |
| CPS | Low-carbon Policy Scenario |
| NZS | Net-Zero Scenario |
| LEAP | Long-range Energy Alternatives Planning |
| CCUS | carbon capture, utilization and storage |
| MEE | Ministry of Ecology and Environment |
| IPCC | Intergovernmental Panel on Climate Change |
| CGE | computable general equilibrium |
References
- IPCC. Climate Change 2022: Mitigation of Climate Change. In Contribution of Working Group III to the Sixth Assessment Report of the Intergovernmental Panel on Climate Change; Cambridge University Press: Cambridge, UK, 2022. [Google Scholar]
- Wang, S.; Wu, J.; Xiang, M.; Wang, S.; Xie, X.; Lv, L.; Huang, G. Multi-objective optimisation model of a low-cost path to peaking carbon dioxide emissions and carbon neutrality in China. Sci. Total Environ. 2024, 912, 169386. [Google Scholar] [CrossRef] [Scilit] [PubMed]
- Yue, Q.; Chai, X.; Zhang, Y.; Wang, Q.; Wang, H.; Zhao, F.; Ji, W.; Lu, Y. Analysis of iron and steel production paths on the energy demand and carbon emission in China’s iron and steel industry. Environ. Dev. Sustain. 2023, 25, 4065–4085. [Google Scholar] [CrossRef] [Scilit]
- Qiao, Y.; Wang, G. Recent status of production, administration policies, and low-carbon technology development of China’s steel industry. Metals 2024, 14, 480. [Google Scholar] [CrossRef] [Scilit]
- Arras, M.; Jeandey, T.-F.; He, Y.Z.; Gupta, P.; Li, Z.; Ma, L.W. Decarbonizing China’s iron and steel industry: Hydrogen-based mitigation pathway and techno-economic implications. Int. J. Hydrogen Energy 2025, 154, 149946. [Google Scholar] [CrossRef] [Scilit]
- Li, Y.; Li, J.; Sun, M.; Guo, Y.; Cheng, F.; Gao, C. Analysis of carbon neutrality technology path selection in the steel industry under policy incentives. Energy 2024, 292, 130550. [Google Scholar] [CrossRef] [Scilit]
- Liu, X.; Li, J.; Bai, C.; Peng, R.; Chi, Y.; Liu, Y. Optimum low-carbon transformation pathways of China’s iron and steel industry towards carbon neutrality based on a dynamic CGE model. Energy 2024, 313, 134023. [Google Scholar] [CrossRef] [Scilit]
- Zheng, W.; Yang, W.; Guo, L.; Wang, R. Analysis of carbon emission characteristics and influencing factors of cement industry in Hebei Province. Buildings 2025, 15, 1808. [Google Scholar] [CrossRef] [Scilit]
- Gao, X.; Liao, C.; Qi, X.; Zhang, Y. A scenario simulation of material substitution in the cement industry under the carbon neutral strategy: A case study of Guangdong. Sustainability 2023, 15, 5736. [Google Scholar] [CrossRef] [Scilit]
- Zhang, M.; Li, B.; Yang, H.; Zhang, M.; Li, D.; Zhu, X.; Lin, R.; Han, Y.; Zhang, A. Pathway toward carbon neutrality of cement industry: A comprehensive analysis based on microdata. Fuel 2026, 409, 137837. [Google Scholar] [CrossRef] [Scilit]
- Wang, P.-T.; Liang, X.-Y.; Wang, F.-Y.; Xu, M. Optimized deployment of carbon capture, utilization, and storage (CCUS) in China’s cement industry: A scenario-based analysis. Energy Sustain. Dev. 2026, 92, 101948. [Google Scholar] [CrossRef] [Scilit]
- Li, R.; Wei, Y.; Cai, W.; Liu, Y.; You, K.; Yu, Y. Tracking cement transportation carbon emissions in China: Historical assessment and future simulation. Environ. Impact Assess. Rev. 2025, 110, 107696. [Google Scholar] [CrossRef] [Scilit]
- Feng, D.; Yan, C. Driving factors and decoupling analysis of carbon emissions from energy consumption in high energy-consuming regions: A case study of Liaoning Province. Front. Environ. Sci. 2024, 12, 1406754. [Google Scholar] [CrossRef] [Scilit]
- Tu, H.; Xu, S.; Tu, P.; Xiao, X. Research on the decoupling effect and driving factors of industrial carbon emissions in Hubei Province. Sci. Rep. 2025, 15, 9868. [Google Scholar] [CrossRef] [Scilit] [PubMed]
- Shang, W.; Pei, G.; Meng, M.; Niu, D. Sensitivity and trend analysis of carbon emissions embodied in China’s international trade with input-output technique and nonhomogeneous exponential growth model. J. Renew. Sustain. Energy 2016, 8, 055902. [Google Scholar] [CrossRef] [Scilit]
- Jiang, W.; Guo, X.; Li, X.; Wang, X.; Liu, D. Unveiling the dynamic interplay of industrial carbon emissions: Insights from quantile time-frequency analysis. Sustainability 2025, 17, 8626. [Google Scholar] [CrossRef] [Scilit]
- Chen, J.; Feng, T.; Hu, J.; Zhou, X. Effects of carbon emission trading policy on the low-carbon transition of industrial energy: Evidence from China. Energies 2026, 19, 940. [Google Scholar] [CrossRef] [Scilit]
- Pan, L.; Zhang, T.; Li, W.; Li, Z.; Zhou, C. Sector-level evaluation of China’s CO2 emissions: Trend evolution and index ranking. J. Clean. Prod. 2021, 286, 125453. [Google Scholar] [CrossRef] [Scilit]
- Hu, H.; Zhao, L.; Dong, W. How to achieve the goal of carbon peaking by the energy policy? A simulation using the DCGE model for the case of Shanghai, China. Energy 2023, 278, 127947. [Google Scholar] [CrossRef] [Scilit]
- Wang, G.; Ju, L. Quantitative evaluation of China’s carbon peaking policies based on PMC Index Model: Evidence from the first batch of national carbon peak pilot provinces and regions. Sustainability 2025, 17, 1738. [Google Scholar] [CrossRef] [Scilit]
- Gu, Y.; Pan, C.; Liu, W.; Jiang, Z.; Huang, M.; Wang, W. Pathway to carbon neutrality in the iron and steel industry of China: A LEAP-China-IS model assessment. Environ. Pollut. 2025, 383, 126834. [Google Scholar] [CrossRef] [Scilit] [PubMed]
- Tan, C.; Yu, X.; Guan, Y. A technology-driven pathway to net-zero carbon emissions for China’s cement industry. Appl. Energy 2022, 325, 119804. [Google Scholar] [CrossRef] [Scilit]
- Ministry of Ecology and Environment of the People’s Republic of China. Annual Bulletin of China’s Ecological and Environmental Statistics 2023; Ministry of Ecology and Environment of the People’s Republic of China: Beijing, China, 2024.
- Sui, T.; Liu, D.; Lin, L.; Mo, L.; Li, L. Decarbonization technologies and application in China’s cement industry. ZKG Int. 2025, 78. [Google Scholar] [CrossRef] [Scilit]
- Gui, L.; Zhao, X.; Ren, H.; Ma, T. Deployment of China’s hydrogen production with loose or tight carbon-reduction paths. Energy Econ. 2026, 153, 109085. [Google Scholar] [CrossRef] [Scilit]

Disclaimer/Publisher’s Note: The statements, opinions and data contained in all publications are solely those of the individual author(s) and contributor(s) and not of MDPI and/or the editor(s). MDPI and/or the editor(s) disclaim responsibility for any injury to people or property resulting from any ideas, methods, instructions or products referred to in the content. |
© 2026 by the authors. Licensee MDPI, Basel, Switzerland. This article is an open access article distributed under the terms and conditions of the Creative Commons Attribution (CC BY) license.