


Abstract
CO2 pre-fracturing is a potential stimulation method for the Sulige tight sandstone gas reservoir, where low permeability and limited reservoir pressure constrain gas production. CO2 has attracted interest in tight-reservoir stimulation because of its low viscosity and high diffusivity, which may influence fluid flow and pressure propagation in the formation. However, the effects of CO2 injection volume and rate on fracture propagation and reservoir energization remain insufficiently quantified, making treatment parameter optimization difficult. In this study, a thermo-hydro-mechanical-damage (THMD) model based on continuum damage mechanics was developed to describe the coupled processes of fluid flow, stress evolution, heat transfer, and rock damage during CO2 pre-fracturing in the Sulige tight sandstone gas reservoir. The model was validated against FracproPT predictions of fracture half-length and field measurements of breakdown pressure, with relative errors of 5.88% and 6.56%, respectively. Numerical simulations were conducted at CO2 injection volumes of 25, 50, and 75 m3 and injection rates of 2, 3, and 4 m3/min to evaluate fracture geometry, damage, and pressure distribution. Four indicators—fracture half-length, damage area, fracture symmetry coefficient, and energized area increment—were integrated using the entropy weight method. Results indicate that larger injection volumes generally increased fracture half-length and damage area but also exacerbated fracture asymmetry. The energized area increment showed a non-monotonic trend, while an injection rate of 3 m3/min generally provided a favorable balance between fracture extension and symmetry. Scheme 8 (75 m3, 3 m3/min) achieved the highest comprehensive score of 0.8855, whereas scheme 5 (50 m3, 3 m3/min) was recommended for engineering applications because it provided substantial reservoir energization with lower CO2 consumption and comparable fracture extension. The results provide a quantitative basis for optimizing CO2 injection volume and rate in tight sandstone gas reservoirs.
1. Introduction
Tight sandstone gas is an important unconventional natural gas resource widely distributed in major sedimentary basins worldwide. In 2024, global tight gas production reached 577.4 billion m3, accounting for 14.2% of total natural gas production. China produced 67.6 billion m3 of tight gas in 2024, representing 11.7% of global tight gas production [1]. China’s tight gas resources are mainly concentrated in several major sedimentary basins, particularly the Ordos, Sichuan, and Songliao basins. The Sulige Gas Field, located in the Ordos Basin, is the largest tight sandstone gas field in China, with an annual production of 30.05 billion m3 in 2024, accounting for 44.5% of China’s total tight gas production [2].
Since 2000, the Sulige Gas Field has undergone more than two decades of development. With the continuous depletion of high-quality reservoirs, low-pressure and low-abundance gas reservoirs have gradually become dominant, resulting in a decline in the stable production capacity of gas wells after conventional hydraulic fracturing [3]. CO2 pre-fracturing was subsequently tested in the Sulige Gas Field, with CO2 injected ahead of the fracturing fluid to exploit the energy-enhancement effect associated with CO2 expansion [4]. Field tests demonstrated that CO2 pre-fracturing improved reservoir pressure maintenance and prolonged the stable production period of gas wells.
CO2 pre-fracturing combines CO2 pre-injection with subsequent conventional hydraulic fracturing. Compared with conventional hydraulic fracturing alone, CO2 pre-injection may promote rock damage and reservoir pressurization owing to its low viscosity and high diffusivity, making it a potential stimulation option for low-pressure formations. Although N2 and other gases have also been investigated for unconventional reservoir stimulation, the present study focuses on CO2 because it has been applied in pre-fracturing field trials in the Sulige tight sandstone gas reservoir, providing a field-specific basis for evaluating its effects on fracture propagation and reservoir energization. CO2 pre-fracturing may also offer opportunities for carbon capture, utilization, and storage (CCUS) [5,6]; however, the present study focuses on the short-term mechanical and hydraulic responses during CO2 injection and does not evaluate long-term geological CO2 storage.
CO2 pre-injection reduces formation breakdown pressure by 17.6–31.6% compared to conventional hydraulic fracturing [7,8]. True triaxial fracturing experiments reveal that pre-injecting CO2 into shale triggers massive acoustic emission events, primarily due to the extensive activation of bedding planes [9]. During the subsequent hydraulic fracturing phase, trans-layer fracturing dominates, with propagation behaviors characterized by branching, penetrating, and deflecting [7,8]. Owing to its low viscosity and high diffusivity, CO2 effectively penetrates the rock matrix to elevate formation pressure. This process consequently reduces the effective stress and minimizes the stress contrast, thereby driving the propagation of branch fractures [10]. CO2 pre-fracturing increased the proportion of shear fractures, forming a more complex fracture network and expanding the stimulated reservoir volume (SRV) of the Chang 7 shale by 2.07% [11]. International laboratory studies have also investigated the effects of CO2 properties on fracture initiation and propagation. Ha et al. combined laboratory experiments and phase-field simulations to examine liquid CO2 permeation, breakdown pressure, and cracking behavior, showing that rapid fluid permeation can promote pore-pressure buildup and distributed microcracking before major fracture propagation [12]. Ishida et al. compared hydraulic fracturing using supercritical CO2, liquid CO2, water, and viscous oil in granite specimens. Their results showed that fracturing with low-viscosity CO2 produced more tortuous cracks and secondary branches than fracturing with more viscous fluids, highlighting the influence of fluid properties on fracture morphology [13].
Furthermore, CO2–water–rock interactions can dissolve carbonate minerals such as dolomite in shale, thereby increasing porosity and permeability [14]. However, for shale reservoirs with high clay mineral content (such as the Gulong shale oil reservoir), clay swelling and migration reduce the connectivity of micropore throats, thus decreasing matrix permeability [15]. Additionally, experiments by Tang et al. showed that after 7 days of CO2–water–rock reaction, permeability increased by 300% under the dominance of dissolution, while after long-term reaction, clay mineral swelling led to a permeability decrease of up to 80% [16]. Therefore, the impact of CO2–water–rock reactions on shale porosity and permeability characteristics is closely related to the content of carbonate and clay minerals in the reservoir and the soaking time. Rock hardness and Young’s modulus decrease exponentially with well soaking time [14]. In clay-rich reservoirs, proppant embedding is significantly aggravated, reducing fracture conductivity [15].
CO2 pre-fracturing can effectively enhance formation energy. Lv et al. found that, compared with the injection of linear gel alone, CO2 pre-injection can increase the pressure of the core system by 24.1% [17]. Zhu et al. found through experiments that a CO2 pre-injection ratio of 20–30% and a shut-in time of 5 h provide a favorable energy-enhancement effect [18]. Long et al. conducted numerical simulations and found that a CO2 injection rate of 2 m3/min and a shut-in time of 4 d result in a relatively large CO2 swept area and a significant energy-enhancement effect within the stimulated zone [19]. Field applications in Chang 7 oil shale area showed that CO2 pre-fracturing increased wellhead pressure retention by 17.1% and initial oil production by 28.6% compared with adjacent wells [11].
Experimental studies on CO2 pre-fracturing were also conducted on conglomerate reservoirs. After CO2–water–rock interaction, the deformation resistance of conglomerate decreased, while its fracture toughness initially increased and then decreased [20]. CO2 pre-fracturing can reduce formation breakdown pressure by 5–36.0%, increase fracture fractal dimension by 0.17, and improve fracture complexity. However, compared to shale, the fractures formed after CO2 pre-fracturing in conglomerate are narrower and more tortuous, which is unfavorable for proppant addition [21,22].
Despite progress in CO2 pre-fracturing research on shale and conglomerate reservoirs, how CO2 injection volume and rate jointly affect fracture propagation and reservoir energization in low-pressure tight sandstone gas reservoirs remains insufficiently understood. In tight sandstone gas reservoirs, CO2–water–rock interactions can induce mineral dissolution, resulting in a 9.56% increase in porosity and a 52.6% increase in permeability. Meanwhile, the formation breakdown pressure decreases by 29.5%, while the fracture width increases by 0.05 mm and fracture complexity is enhanced. CO2 injection also increases the pressure of the core–fluid system, leading to a 6.0% increase in fluid flowback efficiency [4]. At an injection volume of 0.5 PV, the additional formation energy generated by CO2 injection can effectively enhance fluid flowback from micropores and mesopores [23].
Besides experimental studies, numerical simulations have also been performed to investigate CO2 pre-fracturing. Song et al. developed a three-dimensional coupled fracture propagation model for shale using GOHFER. The simulation results showed that a higher CO2 injection rate led to shorter fracture length and narrower fracture width [24]. Liu et al. conducted numerical simulations of fracture propagation during CO2 pre-fracturing in ultra-deep tight sandstone reservoirs using RFPA3D-HF. They found that optimizing the CO2 pre-injection volume could effectively improve the stimulation effect in reservoirs with a small horizontal stress difference [25]. Zhang et al. used CMG to predict the first-year cumulative production of CO2 pre-fracturing in Mahu conglomerate reservoirs. By considering CO2 oil displacement efficiency and overall costs, an optimal CO2 injection volume of 100 t per stage was determined [26]. Zhang et al. established a CMG-STARS model by incorporating fracturing-fluid imbibition and CO2–oil interaction mechanisms to evaluate their effects on oil recovery in tight sandstone reservoirs. The results indicated that asphaltene precipitation reduced oil recovery by 1.25%, whereas fracturing-fluid imbibition, CO2 energization, and hydraulic fracturing contributed 3.44%, 3.92%, and 23.06% to oil recovery, respectively [27]. Yan et al. investigated CO2 distribution and its impact on crude oil during CO2 energized fracturing in tight oil reservoirs using CMG-GEM. The simulation results showed that CO2 diffused approximately 4 m from the fracture surface into the matrix after a 15-day soaking period, and crude oil viscosity within 3 m of the fracture surface was significantly reduced due to CO2 effects [28]. Tian et al. developed a THMD coupled model to study CO2 pre-fracturing in shale oil reservoirs. The results show that thermal stress mainly affects fracture propagation within 5 m of the wellbore, while fluid pressure controls fracture growth farther away. The damage area first increased and then decreased with increasing CO2 injection volume, reaching a maximum of 629.9 m2 at 500 m3. Increasing the CO2 injection rate from 2 to 8 m3/min further increased the damage area by 21.6 m2 [29]. Beyond fracture propagation models, international research has also investigated the coupling between geochemical reactions and rock mechanics. Clavijo et al. developed a coupled phase-field and reactive-transport framework to investigate fracture propagation in poroelastic media, highlighting the potential influence of mineral reactions and reaction-induced porosity changes on fracture evolution [30]. Experimental investigations by Rathnaweera et al. further showed that CO2–brine–rock interactions can alter the mineralogical and mechanical properties of sandstone, with the direction and magnitude of the changes depending on the cementing minerals and injection conditions [31].
Although experimental and numerical studies have investigated CO2 pre-fracturing in shale, tight sandstone, and conglomerate reservoirs, the findings are based on different lithologies, mechanical properties, fracture characteristics, and in situ stress conditions. Consequently, the results cannot be directly generalized to the low-pressure Sulige tight sandstone gas reservoir. A consistent modeling and performance evaluation framework is therefore needed to assess the combined effects of CO2 injection volume and rate on fracture propagation and reservoir energization under the reservoir conditions considered in this study.
The stimulation mechanisms of CO2 pre-fracturing vary with reservoir lithology, rock mechanical properties, natural fracture characteristics, and in situ stress conditions. In tight sandstone gas reservoirs, the contribution of CO2-induced viscosity reduction to enhanced gas recovery is generally less significant than in liquid-rich hydrocarbon reservoirs. By contrast, reservoir energization is particularly relevant to low-pressure formations. In this study, reservoir energization refers to the increase and redistribution of reservoir pressure induced by CO2 injection, which expands the pressure-affected region around the stimulated fractures. For quantitative comparison among injection scenarios, the energized area is defined as the region where the reservoir pressure exceeds 35 MPa. This study-specific threshold is selected relative to the initial formation pressure of 31.3 MPa and is used as an operational criterion for comparing the simulated pressure-affected areas, rather than as a universal physical threshold.
The Sulige tight sandstone gas reservoir is characterized by low formation pressure and low permeability, making fracture extension and reservoir energization important considerations in stimulation design. In natural formations, hydraulic fracture propagation is influenced by in situ stresses, rock mechanical properties, bedding structures, and pre-existing natural fractures. The development and hydraulic behavior of natural fractures in tight sandstones depend on both mechanical conditions and diagenetic processes and cannot be inferred solely from the present-day stress state [32].
In the present study, the maximum and minimum horizontal principal stresses are 55.0 and 47.3 MPa, respectively, giving a horizontal stress difference of 7.7 MPa (approximately 8 MPa). These values define the stress conditions used in the numerical model but are not taken as evidence of limited natural fracture development or as a critical threshold for fracture branching. A dominant bi-wing hydraulic fracture is adopted as a simplifying representation of fracture propagation, while explicit natural fracture networks and fracture branching are not resolved. Accordingly, the model is intended to compare the responses to different CO2 injection scenarios under the specified conditions rather than reproduce the full fracture complexity of the field.
Existing numerical tools provide valuable capabilities for simulating hydraulic fracture propagation and CO2-related reservoir processes. However, different modeling approaches represent the relevant physical processes, constitutive relationships, and simulation outputs in different ways. Given the heterogeneity of subsurface formations, empirical correlations and experimentally derived parameters can help represent complex rock behavior that is difficult to resolve explicitly. However, their applicability and the associated uncertainty depend on the calibration data and reservoir conditions. The objective of the present study is not to eliminate such uncertainty or replace established numerical tools, but to establish a THMD coupled model for consistently evaluating fracture propagation and reservoir energization during CO2 pre-fracturing in the Sulige tight sandstone gas reservoir. The model is formulated to represent the interactions among rock deformation, fluid pressure, temperature, and damage evolution and to evaluate the effects of CO2 injection volume and rate within a consistent computational framework. This approach enables a controlled comparison of injection scenarios under specified reservoir and stress conditions, while recognizing that reservoir heterogeneity, natural fracture networks, and fracture branching are not fully represented. Although CO2–water–rock interactions may alter pore structure and permeability, these geochemical processes are not explicitly incorporated into the present model, which focuses on the coupled thermo-hydro-mechanical-damage responses during the simulated injection period.
Therefore, this study establishes a THMD coupled numerical model in COMSOL Multiphysics 5.6 using the finite element method to investigate the effects of CO2 injection volume and injection rate on fracture propagation and reservoir energization in the Sulige tight sandstone gas reservoir. The model describes the interactions among rock deformation, fluid pressure, temperature, and damage evolution through the governing equations and constitutive relationships. Specifically, pore pressure affects rock deformation through Biot’s effective stress theory, while damage evolution modifies the elastic modulus, porosity, and permeability. The resulting damage and pressure fields are analyzed to quantify fracture half-length, damage area, fracture symmetry coefficient, and energized area increment. These four indicators are integrated into a comprehensive performance evaluation index, with their respective weights determined using the entropy weight method. The injection scenarios are then ranked to identify parameter combinations that balance fracture extension, damage development, propagation symmetry, and reservoir energization. The results provide a numerical basis for CO2 pre-fracturing parameter optimization in low-pressure tight gas reservoirs.
2. Numerical Model and Methods
2.1. Numerical Model Establishment
2.1.1. Model Assumptions
To simulate the fracture propagation of CO2 pre-fracturing in tight sandstone gas reservoirs, A coupled thermo-hydro-mechanical-damage (THMD) model was established using COMSOL Multiphysics, as illustrated in Figure 1 [33,34]. The model captures the dynamic interaction among rock deformation, CO2 pore-pressure diffusion, heat transfer, and progressive brittle damage during the injection process.
Figure 1.
Schematic illustration of the THMD coupling framework.
To balance computational efficiency and physical accuracy, the following assumptions were adopted in the THMD model: (1) The sandstone reservoir was considered as a saturated porous elastic medium prior to damage initiation, and the coupling between pore pressure and rock deformation was described based on Biot’s effective stress theory. (2) Deformation occurs under the small-strain regime, which is applicable for simulating fracture initiation and propagation before significant macroscopic displacement occurs. (3) CO2 was considered as the injected fracturing fluid, with its density and viscosity defined as pressure- and temperature-dependent properties to account for fluid property variations during injection. (4) CO2 migration in the intact sandstone matrix was described by Darcy’s law, and the increase in permeability associated with damage evolution was considered to capture the enhanced flow capacity of fractured regions. (5) Geochemical effects, including mineral dissolution, precipitation, and long-term CO2–rock–brine reactions, were neglected because the simulation focused on the short-term hydraulic fracturing process. (6) Fracture initiation and propagation were represented by continuous damage evolution, without introducing predefined fracture geometries or propagation paths.
2.1.2. Governing Equations
- (1)
- Mechanical field
The mechanical equilibrium equation of the sandstone is expressed as [35]:
where σ is the total stress tensor and F is the body force, Pa. The strain tensor is derived from the displacement vector u:
∇⋅σ + F = 0
Considering pore pressure and thermal strain, the constitutive relation is written as [36]:
where G and K are the shear modulus and bulk modulus, Pa; λ is Lamé constant; αB is the Biot coefficient; p is the pore pressure, Pa; αT is the thermal expansion coefficient, 1/K; T and T0 are the real-time and initial temperatures, K.
σ = 2Gε + λtr(ε)I − αBpI − KαT(T − T0)I
- (2)
- Seepage field
The mass balance equation for fluid flow in the sandstone is given by [37]:
where ρf is the fluid density, kg/m3; Sf is the storage coefficient, 1/Pa, which can be calculated by Equation (5); k is matrix permeability, m2; μf is fluid viscosity, mPa·s; εv is the bulk strain; Qf is the source/sink term.
where φ is the rock porosity; χf is the fluid compressive coefficient, 1/Pa; Kd is the drained bulk modulus of sandstone, Pa.
- (3)
- Temperature field
For non-isothermal CO2 fracturing, the energy equation is [38]:
where Cf and Cr are the heat capacities of fluid and rock, J/(kg·K); λf and λr are the thermal conductivities of fluid and rock, W/(m·K); Q represents heat exchange between the rock and fluid or thermal source terms, W/m3. This equation accounts for conductive heat transfer in the rock-fluid system and advective heat transport caused by CO2 migration.
- (4)
- Damage field
Sandstone failure is evaluated using tensile and shear criteria. Tensile damage is activated when the maximum principal stress exceeds the local tensile strength [35]:
where σ3 is the minimum principal stress, Pa; σt is the tensile strength of the rock, Pa.
F1 = −σ3 − σt ≥ 0
If tensile failure is not triggered, shear failure is checked using a Mohr-Coulomb type criterion:
where σ1 is the maximum principal stress, Pa; σc is the tensile compressive of the rock, Pa; θ is the internal friction angle, °.
The damage formulation employs a scalar damage variable D to characterize the degradation of the rock’s mechanical properties, where D = 0 represents intact rock and D = 1 represents complete failure. In this study, regions with D > 0.9 are identified as highly damaged zones to characterize fracture propagation. Separate criteria are adopted for tensile and shear failure, and damage evolves according to the corresponding failure mode. However, the current formulation does not explicitly account for direction-dependent damage evolution or anisotropic stiffness degradation.
When F1 ≥ 0, tensile failure occurs in the rock, and the relationship between the damage variable D and strain ε is defined as follows [38]:
When F2 ≥ 0, shear failure occurs in the rock, and the damage variable is expressed as:
where ε is the strain; σtr and σcr are the residual tensile strength and residual compressive strength, Pa; εt0 and εc0 are the elastic-limit tensile strain and elastic-limit compressive strain, respectively; and εtu is the ultimate compressive strain.
The elastic modulus of damaged sandstone is degraded as:
where E0 and E denote the elastic modulus of the initial elastic modulus and the elastic modulus after damage, Pa.
E = (1 − D)E0
Damage also modifies the hydraulic properties. The permeability is updated by combining stress-dependent porosity variation and fracture-induced conductivity enhancement:
where φ0 and φr are the initial porosity and the residual porosity; k0 and k are the initial permeability and the permeability after damage, m2; σeff is average effective stress, Pa; αφ and αk are empirical coefficients. These updates represent the rapid increase in flow capacity once connected tensile or shear damage forms around the wellbore and fracture tip.
2.1.3. Model Setup and Solution
The geometry of the CO2 pre-fracturing model is illustrated in Figure 2. The computational domain was established as a square model with dimensions of 1000 m × 1000 m. The maximum and minimum horizontal principal stresses were assigned as 55.0 MPa and 47.3 MPa, respectively. The detailed geological, mechanical, and fluid parameters used in the simulation are summarized in Table 1.
Figure 2.
Schematic diagram of the CO2 pre-fracturing model.The arrows along the upper and lower boundaries indicate the applied maximum horizontal principal stress (σH), while those along the left and right boundaries indicate the applied minimum horizontal principal stress (σh). The circular marker indicates the location of the vertical well. The background texture schematically represents the sandstone reservoir and has no physical significance.
Table 1.
Parameters used in the CO2 pre-fracturing model.
The model geometry and boundary conditions were kept identical across all nine simulation schemes, with the maximum and minimum horizontal principal stresses maintained at 55.0 MPa and 47.3 MPa, respectively. To isolate the effects of CO2 injection volume and injection rate on fracture propagation and reservoir energization, only these two parameters were varied. Assuming a constant injection rate during the pre-fracturing stage, the injection duration for each scheme was calculated by dividing the prescribed CO2 injection volume by the corresponding injection rate.
The coupled governing equations were solved using the finite element method. Prior to simulation, the geometric configuration, in situ stress conditions, initial pore pressure, reservoir temperature, CO2 thermophysical properties, and sandstone mechanical parameters were initialized. The injection wellbore was specified as a mass-flow or pressure boundary, while the outer boundaries were constrained by prescribed stresses or normal displacement conditions according to the simulated test or reservoir configuration.
At each time step, the displacement, CO2 pressure, and temperature fields were solved first. The principal stresses and equivalent strain of each element were then extracted to evaluate tensile and shear failure. Once the failure criterion was satisfied, the corresponding damage variable was updated, and the elastic modulus, porosity, permeability, and thermal parameters were recalculated. The updated properties were passed to the next time step, allowing hydraulic fractures to initiate and extend automatically from the damaged zone. The calculation was repeated until the designed injection time or target injection volume was reached.
The calculation procedure was iteratively performed until the prescribed CO2 injection volume was reached. The resulting damage and pressure fields were then extracted to characterize fracture propagation and reservoir energization during CO2 pre-fracturing.
2.2. Model Validation
To evaluate the reliability of the developed THMD model, a two-step validation strategy was adopted. First, the fracture propagation capability of the proposed model was assessed by comparing the simulated fracture geometry with that predicted by FracproPT. Since FracproPT is a commonly used hydraulic fracturing simulator for conventional fracture geometry prediction, it was selected as a reference for model comparison.
However, FracproPT mainly focuses on conventional hydraulic fracturing processes and does not consider the coupled thermo-hydro-mechanical-damage responses induced by CO2 pre-injection. Therefore, only the hydraulic fracturing case without CO2 pre-injection was simulated using both approaches. The simulation parameters were identical for the two models, as listed in Table 1.
As shown in Figure 3, the fracture half-length predicted by FracproPT was 178.6 m, whereas the THMD model yielded a fracture half-length of 189.1 m. The relative deviation between the two results was 5.88%, indicating good consistency between the two simulations. This agreement confirms that the proposed THMD model can reasonably capture hydraulic fracture propagation behavior.
Figure 3.
Comparison of hydraulic fracture geometry predicted by FracproPT and COMSOL.
Furthermore, the proposed THMD model was validated against a field-scale CO2 pre-fracturing case from the Sulige tight sandstone gas field. The reservoir properties used in the field-scale validation were consistent with those listed in Table 1. This validation was conducted to assess the model’s capability to predict breakdown pressure during hydraulic fracturing following CO2 pre-injection. In the field case, the breakdown pressure during the hydraulic fracturing stage following CO2 pre-injection was 74.86 MPa (bottom-hole pressure), compared with the THMD model prediction of 69.95 MPa, yielding a relative error of 6.56%. The agreement between the numerical prediction and field measurement supports the model’s capability to predict fracture initiation during hydraulic fracturing following CO2 pre-injection. However, due to the lack of microseismic monitoring data or other field measurements of fracture geometry, the predicted fracture propagation behavior could not be independently validated against field observations. Accordingly, the present validation demonstrates consistency with FracProPT predictions of fracture half-length and agreement with field-measured breakdown pressure, while independent validation of fracture geometry under CO2 pre-fracturing conditions remains a subject for future work.
2.3. Simulation Design
To investigate the effects of CO2 pre-injection parameters on hydraulic fracture propagation and reservoir energization, a series of coupled simulations were conducted based on the established numerical model. The simulation process consisted of two sequential stages: CO2 pre-injection and subsequent hydraulic fracturing.
During the first stage, CO2 was injected into the reservoir before hydraulic fracturing to modify the initial reservoir pressure and stress conditions. Three CO2 injection volumes (25, 50, and 75 m3) and three injection rates (2, 3, and 4 m3/min) were considered, resulting in nine CO2 pre-injection schemes (Schemes 1–9). In addition, a reference case without CO2 pre-injection (Reference case) was established for comparison.
During the hydraulic fracturing stage, water was continuously injected under identical operating conditions for all cases to eliminate the influence of fracturing parameters and enable a direct comparison of the effects of CO2 pre-injection treatment. In addition, a reference case without CO2 pre-injection was established to evaluate the stimulation effectiveness of CO2-assisted hydraulic fracturing.
The detailed simulation matrix is summarized in Table 2. By systematically varying CO2 injection volume and rate, the coupled effects of CO2 pre-injection parameters on fracture propagation characteristics and reservoir pressure enhancement were quantitatively analyzed. The simulation results were further evaluated using multiple indicators related to fracture geometry, damage evolution, and reservoir energization characteristics.
Table 2.
Detailed simulation matrix for CO2 pre-fracturing.
2.4. Quantitative Evaluation Indicators
To quantitatively characterize the influence of CO2 pre-injection parameters on fracture propagation and reservoir energization, four evaluation indicators were selected from the damage and pressure fields, including fracture half-length, damage area, fracture symmetry coefficient, and increment of energization area.
- (1)
- Fracture half-length
The fracture half-length was used to characterize the extension capability of hydraulic fractures after CO2 pre-injection treatment. It was determined as the maximum distance between the fracture initiation point and the fracture tip along the fracture propagation direction:
where Lf represents the fracture half-length, m; xf is the fracture tip position, m; x0 is the fracture initiation position, m.
Lf = max(xf − x0)
A larger Lf indicates stronger fracture propagation capacity and a larger potential stimulated reservoir volume.
- (2)
- Damage area
The damage area was extracted from the tensile damage distribution obtained from the numerical simulation. The region with tensile damage exceeding the critical threshold was defined as the fracture-related damaged zone:
where Ad represents the damage area, m2; Ωd denotes the region satisfying the damage criterion.
Compared with fracture length alone, damage area can better reflect the overall disturbance range induced by CO2 pre-injection and hydraulic fracturing, including fracture extension and surrounding rock damage.
- (3)
- Fracture symmetry coefficient
The fracture symmetry coefficient was introduced to evaluate the geometric balance of the two fracture wings. It was calculated as:
where LL and LR represent the lengths of the left and right fracture wings, m.
The value of Cs ranges from 0 to 1. A value approaching 1 indicates a highly symmetric fracture geometry, whereas a lower value indicates stronger fracture deviation and asymmetric propagation.
- (4)
- Increment of energization area
The increment of energization area was introduced to quantify the additional reservoir pressure enhancement contributed by each 25 m3 increase in CO2 pre-injection volume. In this study, the energized area was operationally defined as the region where the reservoir pressure exceeded 35 MPa. The initial reservoir pressure was 31.3 MPa; thus, the selected threshold represents a pressure increase of 3.7 MPa (approximately 11.8%) relative to the initial state. This threshold was adopted as a practical criterion to delineate regions experiencing a discernible pressure elevation, rather than as a universal reservoir-engineering standard or a production-based critical pressure. Accordingly, the energized area is used as a comparative indicator to evaluate the spatial extent of reservoir pressure enhancement under different CO2 pre-fracturing conditions.
Unlike the cumulative energization area increase relative to the case without CO2 injection, the increment of energization area was calculated based on adjacent CO2 injection volumes under the same injection rate condition. This definition enables the evaluation of the marginal contribution of increasing CO2 injection volume while eliminating the influence of different injection rates.
For a fixed CO2 injection rate, the increment of energization area was calculated as:
where Ae (Vi,Q) represents the energization area obtained with a CO2 injection volume of Vi and injection rate Q, m2; Ae(Vi − 25,Q) denotes the energization area corresponding to the previous CO2 injection volume with the same injection rate, m2.
ΔAe = Ae(Vi,Q) − Ae(Vi − 25,Q)
Here, ΔAe represents the absolute difference in energized area between two adjacent CO2 injection-volume cases at the same injection rate, whereas the percentage enhancement ratio is calculated relative to the baseline case without CO2 pre-injection.
Accordingly, the calculation of ΔAe was performed as follows:
where Q represents the CO2 injection rate (2, 3, or 4 m3/min).
A larger ΔAe indicates a stronger incremental reservoir energization effect induced by the additional CO2 injection. This indicator reflects the efficiency of increasing CO2 pre-injection volume rather than the cumulative energization capacity, and therefore provides a more reasonable measure for optimizing CO2 injection volume.
Since the performance of CO2 pre-fracturing involves multiple aspects, including fracture extension, damage development, geometric stability, and reservoir pressure enhancement, no single indicator can fully describe the stimulation effectiveness. Therefore, these four indicators were integrated using the entropy weight method to achieve a comprehensive evaluation of different CO2 injection schemes.
3. Results and Discussion
The effectiveness of CO2 pre-fracturing is governed by the coupled effects of CO2 injection volume and injection rate, which jointly influence the pressure redistribution, effective stress alteration, and subsequent hydraulic fracture propagation. Therefore, the influence of individual injection parameters cannot fully describe the complex response of fracture development under CO2 pre-injection conditions. A comprehensive evaluation considering the interaction between CO2 injection volume and rate is required to reveal the stimulation mechanism.
To quantitatively evaluate the effects of CO2 pre-injection treatment, four evaluation indicators were extracted from the damage and pressure fields after the completion of hydraulic fracturing, including fracture half-length, damage area, fracture symmetry coefficient and pressure enhancement area within the enhanced-pressure region. These indicators characterize three key aspects of hydraulic fracturing performance: fracture extension capacity, fracture geometric stability, and reservoir energization characteristics.
Accordingly, the synergistic effects of CO2 injection volume and rate on hydraulic fracture characteristics and reservoir energization are analyzed from three perspectives: fracture geometry, fracture symmetry, and pressure enhancement characteristics.
3.1. Effect of Injection Parameters on Fracture Geometry
The final hydraulic fracture geometry after CO2 pre-injection treatment was evaluated based on the fracture half-length and damage area extracted from the damage field. These two indicators provide quantitative descriptions of fracture extension capacity and reservoir damage extent during the combined CO2 pre-injection and subsequent hydraulic fracturing processes.
Figure 4 presents the final damage field under different CO2 injection conditions. The distribution of damage zones reflects the influence of CO2 pre-injection treatment on the subsequent hydraulic fracture development. The variation in fracture geometry with CO2 injection volume and rate is further quantitatively analyzed in terms of fracture half-length and damage area in the following sections.
Figure 4.
Final damage field of hydraulic fractures under different CO2 pre-injection conditions.
3.1.1. Effect of CO2 Parameters on Fracture Half-Length
The variation in final fracture half-length under different CO2 pre-injection conditions is presented in Figure 5, and the corresponding fracture extension enhancement ratios relative to conventional hydraulic fracturing are summarized in Figure 6. Without CO2 pre-injection, the final fracture half-length reaches 189.12 m. After CO2 pre-injection treatment, the fracture propagation response exhibits a nonlinear dependence on both CO2 injection volume and injection rate, demonstrating that the stimulation effect is controlled by the coupled interaction between these two parameters.
Figure 5.
Synergistic effects of CO2 injection volume and rate on final hydraulic fracture half-length.
Figure 6.
Fracture extension enhancement ratio under different CO2 pre-injection conditions.
At a low CO2 injection volume of 25 m3, the final fracture half-lengths are 180.96, 181.34, and 188.75 m at injection rates of 2, 3, and 4 m3/min, respectively. These values are slightly lower than that of conventional hydraulic fracturing, with reductions of 4.31%, 4.11%, and 0.20%, respectively. This phenomenon does not necessarily indicate that CO2 pre-fracturing inhibits rock failure, but rather suggests that CO2-induced damage is not fully translated into effective fracture extension. Under low-volume CO2 injection, the induced pressure disturbance may be concentrated mainly around the near-fracture region, resulting in localized tensile damage and stress redistribution. During subsequent hydraulic fracturing, part of the injected hydraulic energy may be consumed in reopening and extending the pre-damaged zone rather than directly driving the fracture tip forward. In addition, the presence of compressible CO2 within the formation may affect pressure transmission through compression, displacement, and pressure redistribution, potentially reducing the effective pressure transmitted toward the fracture tip. The simulation results further show that fracture width increases after CO2 pre-injection, even when the fracture half-length decreases at an injection volume of 25 m3. This contrasting response indicates that enhanced fracture opening does not necessarily lead to greater longitudinal propagation. Consequently, increased local damage and fracture opening do not necessarily result in a longer fracture.
With increasing CO2 injection volume to 50 m3, the influence of injection rate becomes more evident. The fracture half-length increases from 184.43 m at 2 m3/min to 195.65 m at 3 m3/min, followed by a decrease to 188.90 m at 4 m3/min. The maximum fracture extension at 50 m3 CO2 and 3 m3/min represents a 3.45% increase compared with conventional hydraulic fracturing. This indicates that an appropriate combination of CO2 volume and injection rate can generate a favorable pressure-disturbed region before hydraulic fracturing, enabling the injected hydraulic energy to be more effectively converted into fracture propagation.
A further increase in CO2 injection volume to 75 m3 produces the largest fracture extension under the 3 m3/min injection rate, with a fracture half-length of 207.52 m, corresponding to a 9.73% increase compared with the untreated case. However, increasing the injection rate to 4 m3/min reduces the fracture half-length to 189.57 m. This suggests that excessive injection rate may not continuously enhance fracture propagation, even under high CO2 injection volume. A high injection rate may result in rapid CO2 accumulation near the injection zone and insufficient pressure diffusion, thereby weakening the beneficial effect of CO2 pre-conditioning on long-range fracture extension.
Overall, the fracture half-length results demonstrate that CO2 pre-fracturing exhibits an optimal stimulation window controlled by the synergistic interaction between injection volume and injection rate. Insufficient CO2 volume cannot generate an effective far-field pressure modification, whereas excessive injection rate may reduce the utilization efficiency of CO2-induced reservoir alteration. The maximum fracture extension is achieved at 75 m3 CO2 injection volume combined with a 3 m3/min injection rate, highlighting the importance of coordinated optimization of CO2 injection parameters.
3.1.2. Effect of CO2 Parameters on Damage Area
The damage area obtained from the final damage field provides an additional perspective for evaluating the stimulation effectiveness of CO2 pre-fracturing. Unlike fracture half-length, which mainly reflects the ability of fractures to propagate over long distances, the damage area represents the overall volume of rock affected by tensile failure and mechanical disturbance. Therefore, the combined analysis of fracture half-length and damage area can provide a more comprehensive understanding of reservoir stimulation characteristics.
The variation in damage area under different CO2 injection volume and rate conditions is shown in Figure 7, and the corresponding damage area enhancement ratios relative to conventional hydraulic fracturing are shown in Figure 8. Without CO2 pre-injection, the final damage area is 339.14 m2. Compared with conventional hydraulic fracturing, CO2 pre-fracturing generally increases the damaged region, indicating that CO2 injection modifies the near-fracture mechanical environment and promotes additional rock damage during subsequent hydraulic fracturing. However, the magnitude of damage expansion depends strongly on the coupled effects of CO2 injection volume and injection rate.
Figure 7.
Influence of CO2 injection parameters on final damage area after hydraulic fracturing.
Figure 8.
Damage area enhancement ratio under different CO2 pre-injection conditions.
For the 25 m3 CO2 pre-injection cases, the damage areas are 365.05, 374.36, and 351.70 m2 at injection rates of 2, 3, and 4 m3/min, respectively. Compared with the untreated case, the damage area increases by 7.64%, 10.39%, and 3.70%, respectively. Although the corresponding fracture half-lengths are lower than that of conventional hydraulic fracturing, the increase in damage area indicates that low-volume CO2 injection still induces additional rock failure around the fracture region. This difference between fracture extension and damage expansion suggests that the mechanical effect of CO2 pre-injection treatment is initially concentrated within the local damaged zone rather than being effectively converted into long-distance fracture propagation. At this stage, the injected CO2 mainly alters the local stress environment and promotes tensile damage initiation. However, because the affected pressure disturbance range is limited, the damaged region cannot provide sufficient guidance for continuous fracture-tip advancement. Therefore, low-volume CO2 injection mainly contributes to local damage accumulation rather than effective fracture extension.
With increasing CO2 injection volume to 50 m3, the damage area further increases to 390.33–399.52 m2. The maximum damage area under this condition occurs at 4 m3/min, reaching 399.52 m2, corresponding to a 17.80% increase compared with conventional hydraulic fracturing. The increased damage area indicates that a larger CO2 volume produces a wider pressure disturbance region and enhances the interaction between CO2-induced damage and subsequent hydraulic fracture propagation. However, the damage area does not exhibit the same variation trend as fracture half-length. For example, the largest fracture half-length at 50 m3 occurs at 3 m3/min (195.65 m), whereas the maximum damage area occurs at 4 m3/min. This discrepancy indicates that a higher injection rate can promote a larger damaged region, but it does not necessarily improve fracture extension efficiency. Excessive local damage generation may increase the fracture complexity and energy dissipation, limiting the conversion of injected energy into fracture-tip propagation.
At a CO2 injection volume of 75 m3, the damage area reaches the highest values among all cases, ranging from 384.86 to 402.14 m2. The maximum damage area is obtained at 2 m3/min, reaching 402.14 m2, which is 18.58% higher than conventional hydraulic fracturing. The results demonstrate that increasing CO2 injection volume effectively enlarges the reservoir region affected by mechanical disturbance. However, a higher damage area does not directly correspond to the maximum fracture half-length. The longest fracture occurs at 75 m3 and 3 m3/min, while the largest damage area occurs at 75 m3 and 2 m3/min. This indicates that fracture propagation and damage development are governed by different controlling mechanisms.
A lower injection rate allows sufficient time for CO2 diffusion and pressure redistribution, resulting in a broader damaged region. In contrast, an appropriate higher injection rate improves the pressure transmission efficiency during subsequent hydraulic fracturing and promotes fracture-tip extension. Therefore, the optimal conditions for damage expansion and fracture extension are not necessarily identical.
Overall, the damage area results demonstrate that CO2 pre-injection effectively enlarges the reservoir stimulation region, but the relationship between damage expansion and fracture extension is nonlinear. Increasing CO2 injection volume enhances the extent of rock damage, whereas injection rate determines whether the induced damage can be effectively transformed into fracture propagation. The comparison between fracture half-length and damage area reveals that evaluating CO2 pre-fracturing performance based only on fracture extension may underestimate the reservoir modification effect. Conversely, excessive damage development without efficient fracture propagation may reduce stimulation efficiency. Therefore, an appropriate balance between fracture extension and damage expansion is required for optimizing CO2 pre-fracturing parameters.
To further clarify the different responses of fracture propagation and damage development to CO2 injection parameters, the fracture half-length and damage area obtained under each injection condition are compared in Table 3. The comparison highlights the differences between the parameter combinations that favor longitudinal fracture extension and those that produce a larger damaged region.
Table 3.
Comparison of fracture half-length and damage area under different CO2 pre-injection conditions.
As summarized in Table 3, the injection rate associated with the maximum fracture half-length differs from that associated with the maximum damage area. At injection volumes of 50 and 75 m3, the maximum fracture half-length is obtained at 3 m3/min, whereas the maximum damage area occurs at 4 and 2 m3/min, respectively. At 25 m3, the maximum damage area occurs at 3 m3/min, although the fracture half-length remains below that of the reference case at all three injection rates. These results indicate that the spatial extent of rock damage and the longitudinal propagation of the hydraulic fracture respond differently to CO2 injection parameters. Fracture half-length primarily characterizes longitudinal extension, whereas damage area quantifies the area exceeding the prescribed damage threshold. The different optimal conditions therefore reflect the distinct nature of these two indicators and support their joint consideration in CO2 pre-fracturing parameter optimization. However, the present results do not establish a unique physical mechanism responsible for each non-monotonic trend.
The present study focuses on the short-term hydraulic fracturing process and does not explicitly account for geochemical interactions between injected CO2, formation water, and reservoir minerals. These interactions may begin during CO2 injection and potentially influence the local pore structure and fluid transport properties, particularly in the near-wellbore region. The dissolution of CO2 in formation water can promote the formation of acidic aqueous solutions, potentially enhancing the dissolution of reactive minerals. Conversely, secondary mineral precipitation may reduce pore connectivity and permeability. The net effect on permeability therefore depends on the mineralogical composition of the reservoir, water availability, pressure and temperature conditions, and reaction kinetics. Because these processes are not included in the current governing equations, their effects on permeability evolution and the associated feedback on pore pressure redistribution and fracture propagation cannot be quantitatively evaluated. Although the short duration of the simulated injection process may limit the extent of some geochemical alterations, the magnitude of their influence under the conditions considered here remains uncertain. A quantitative estimate of these effects would require reservoir-specific mineralogical and fluid-chemistry data, together with reaction-rate parameters and the corresponding reactive transport equations, which are not available in the present model. Therefore, the omission of geochemical reactions represents a limitation of the current model rather than a quantitative demonstration that such effects are negligible over the simulated timeframe. Accordingly, the predicted fracture geometry, damage distribution, and energized region should be interpreted within the scope of the adopted short-term hydro-mechanical-damage framework rather than as a comprehensive representation of coupled geomechanical and geochemical processes. Future studies should incorporate CO2 dissolution, mineral dissolution and precipitation, and their effects on porosity and permeability into a reactive transport framework to assess their contributions to near-wellbore alteration and the evolution of fracture propagation and reservoir energization.
3.2. Effect of Injection Parameters on Fracture Geometric Stability
The fracture half-length and damage area discussed in Section 3.1 characterize the extent of reservoir stimulation induced by CO2 pre-fracturing. However, an increase in fracture extension or damage area does not necessarily indicate improved overall stimulation performance. Hydraulic fracture propagation is governed by in situ stress conditions and rock mechanical properties, while bedding structures and natural fractures may further influence fracture geometry and complexity. In the present study, the reservoir is represented as an equivalent continuum without explicitly incorporating natural fracture networks. Accordingly, the dominant hydraulic fracture is idealized as propagating in a bi-wing configuration under the prescribed stress conditions. The horizontal principal stress difference of approximately 8 MPa defines the stress contrast adopted in the model rather than a critical threshold for suppressing branch fracture generation. Within this modeling framework, maintaining balanced bilateral fracture propagation is an important consideration in evaluating the geometric characteristics of CO2 pre-fracturing.
CO2 injection volume and rate influence the evolution of the pressure field and damage distribution, thereby affecting fracture extension and geometric stability. Variations in these injection parameters may lead to differences in the propagation of the two fracture wings, resulting in asymmetric fracture development. Such asymmetry can produce an uneven distribution of the stimulated region and reduce the effectiveness of reservoir contact. Therefore, the fracture symmetry coefficient is introduced as a quantitative indicator to characterize the geometric stability of fracture propagation under different CO2 injection conditions.
The fracture symmetry coefficient was calculated based on the ratio between the left and right fracture wing lengths obtained from the final damage field. A coefficient approaching unity indicates balanced bilateral fracture propagation, whereas a lower value represents intensified asymmetric extension. Figure 9 presents the variation in fracture symmetry coefficient under different CO2 injection conditions, and Figure 10 shows the corresponding reduction relative to conventional hydraulic fracturing.
Figure 9.
Variation in final hydraulic fracture symmetry coefficient under different CO2 pre-injection conditions.
Figure 10.
Reduction in the fracture symmetry coefficient (ΔCs) under different CO2 injection conditions. Note: Larger values indicate greater reductions in the symmetry coefficient, corresponding to more pronounced fracture asymmetry. Darker colors toward red represent larger reductions.
Without CO2 pre-injection, the fracture symmetry coefficient reaches 1.00, indicating nearly symmetric propagation of the hydraulic fracture. After CO2 pre-injection, the symmetry coefficient decreases under all conditions, demonstrating that CO2-induced pressure redistribution affects the subsequent fracture growth pattern. For 25 m3 CO2 injection, the symmetry coefficients remain within 0.95–0.97, with only minor reductions of 0.03–0.05 compared with conventional hydraulic fracturing. This suggests that a relatively small CO2 volume produces limited disturbance to the initial stress and pressure conditions, thereby maintaining stable fracture propagation.
When the CO2 injection volume increases to 50 m3, the influence of injection rate becomes more evident. The symmetry coefficients are 0.93, 0.99, and 0.87 at injection rates of 2, 3, and 4 m3/min, respectively. Notably, the combination of 50 m3 CO2 and 3 m3/min maintains a symmetry coefficient of 0.99, indicating that an appropriate injection rate can enhance fracture extension while preserving balanced bilateral growth. In contrast, excessive CO2 injection volume causes a significant deterioration in fracture symmetry. For 75 m3 CO2 injection, the symmetry coefficients decrease to 0.65, 0.85, and 0.28 at injection rates of 2, 3, and 4 m3/min, respectively. The substantially reduced symmetry under the 75 m3 and 4 m3/min condition indicates that excessive CO2 volume combined with a high injection rate promotes preferential fracture growth along one direction.
The reduction in fracture symmetry under high CO2 injection conditions is mainly associated with the enlarged pressure disturbance region generated during the CO2 pre-injection stage. With increasing CO2 volume, the affected reservoir region expands, resulting in more pronounced pressure redistribution before hydraulic fracturing. During subsequent hydraulic fracture propagation, the fracture tends to extend preferentially toward regions with more favorable stress and pressure conditions, leading to unequal growth of the two fracture wings. Meanwhile, a high CO2 injection rate accelerates pressure accumulation near the wellbore and limits pressure diffusion into the surrounding formation, which further intensifies the directional pressure imbalance and promotes asymmetric fracture propagation.
CO2 pre-injection exhibits a dual effect on fracture geometry in tight sandstone reservoirs. Moderate CO2 injection can enhance fracture extension while maintaining balanced bilateral propagation, whereas excessive injection volume or rate may induce unstable fracture growth and deteriorate fracture symmetry. These results demonstrate that maximizing fracture size alone is insufficient for evaluating CO2 pre-fracturing performance, because excessive fracture extension may occur at the expense of geometric stability. Therefore, the optimization of CO2 pre-injection parameters requires a comprehensive evaluation of fracture propagation characteristics and reservoir energization behavior.
3.3. Reservoir Energization Characteristics
The previous sections demonstrated that CO2 pre-injection alters fracture propagation behavior by modifying the initial pressure and stress conditions of the reservoir. Besides fracture geometry, the pressure redistribution induced by CO2 injection is another important factor controlling the effectiveness of CO2 pre-fracturing. Therefore, the reservoir energization characteristics were evaluated based on the pressure distribution obtained after the completion of hydraulic fracturing.
Figure 11 presents the final pressure fields under different CO2 pre-injection conditions. In this study, the energized region was defined as the area where the reservoir pressure exceeded 35 MPa after hydraulic fracturing. This threshold was selected to quantify the spatial extent of pressure enhancement caused by CO2 pre-injection treatment. The corresponding energized area was extracted as an indicator to evaluate the influence of CO2 injection parameters on reservoir-scale pressure redistribution.
Figure 11.
Final pressure field of hydraulic fracturing under different CO2 pre-injection conditions.
To assess the sensitivity of the calculated energized area to the pressure threshold, a sensitivity analysis was conducted for the case with a CO2 injection volume of 50 m3 and an injection rate of 3 m3/min, using thresholds of 33, 34, 35, 36, and 37 MPa. The corresponding energized areas were 6945.42, 5965.52, 5329.53, 4849.81, and 4465.60 m2, respectively (Figure 12). The energized area decreased monotonically with increasing pressure threshold, with a reduction of approximately 35.7% when the threshold increased from 33 to 37 MPa. Relative to the reference threshold of 35 MPa, increasing the threshold to 36 and 37 MPa reduced the calculated energized area by approximately 9.0% and 16.2%, respectively. These results demonstrate that the absolute energized area is sensitive to the threshold definition. The threshold of 35 MPa was retained because it is approximately 11.8% higher than the initial pore pressure of 31.3 MPa, providing a consistent operational criterion for identifying regions with a noticeable pressure increase.
Figure 12.
Sensitivity of the calculated energized area to the pressure threshold.
The variation in energized area under different CO2 injection conditions is shown in Figure 13. Without CO2 pre-injection, the energized area after hydraulic fracturing is 4295.62 m2. Compared with conventional hydraulic fracturing, all CO2 pre-injection cases exhibit larger energized areas, indicating that CO2 pre-injection effectively promotes pressure redistribution and expands the pressure-affected reservoir region.
Figure 13.
Effect of CO2 injection parameters on energized area.
For a CO2 injection volume of 25 m3, the energized areas are 4491.00, 4421.70, and 4401.79 m2 at injection rates of 2, 3, and 4 m3/min, respectively, corresponding to increases of 4.55%, 2.94%, and 2.47% relative to the case without CO2 pre-injection (Figure 14). The limited enhancement suggests that a small CO2 injection volume generates insufficient pressure disturbance to substantially expand the pressure-affected region. Although CO2 injection induces local pressure modification and damage development around the fracture zone, the influence range remains relatively limited.
Figure 14.
Enhancement ratio of energized area under different CO2 pre-injection conditions.
When the CO2 injection volume increases to 50 m3, the energized area increases significantly to 5147.37–5468.01 m2, corresponding to enhancements of 19.83–27.29% compared with conventional hydraulic fracturing. The maximum energized area is obtained at 50 m3 CO2 injection with an injection rate of 2 m3/min, reaching 5468.01 m2. The increased CO2 volume provides a larger amount of injected fluid and promotes pressure transmission before hydraulic fracturing, allowing the pressure disturbance to extend farther into the surrounding reservoir. However, the energized area decreases with increasing injection rate, following the order of 5468.01, 5329.53, and 5147.37 m2. This indicates that a lower injection rate facilitates CO2 migration and pressure diffusion, resulting in a larger pressure-affected region.
At the maximum CO2 injection volume of 75 m3, the energized area further increases to 5625.98–6495.30 m2, representing the largest values among all investigated cases. The maximum energized area is achieved at 75 m3 CO2 injection with an injection rate of 2 m3/min, reaching 6495.30 m2, which is 51.10% higher than that of conventional hydraulic fracturing. This result confirms that increasing CO2 injection volume can effectively enlarge the pressure-affected reservoir region. However, a larger energized area does not necessarily correspond to the optimal fracturing performance, because excessive CO2 injection may simultaneously intensify fracture asymmetry and reduce fracture geometric stability.
It is noteworthy that the conditions producing the maximum energized area and maximum fracture extension are different. According to the fracture propagation results discussed in Section 3.2, the longest fracture is obtained at 75 m3 CO2 injection with an injection rate of 3 m3/min, whereas the largest energized area occurs at 75 m3 CO2 injection with 2 m3/min. This difference indicates that fracture extension and reservoir energization are controlled by different mechanisms. Fracture propagation is primarily governed by fracture pressure transmission and crack growth during hydraulic fracturing, whereas reservoir energization is more closely associated with CO2 migration and pressure diffusion during the pre-injection stage.
With a fixed CO2 injection volume of 50 m3, increasing the injection rate from 2 to 4 m3/min resulted in non-monotonic variations in fracture propagation. The fracture half-length and symmetry coefficient initially increased and then decreased, whereas the energization area continuously decreased. These results indicate that an excessively high injection rate is unfavorable for improving reservoir energization in low-pressure tight gas reservoirs. At a constant CO2 injection rate of 3 m3/min, increasing the injection volume from 25 to 75 m3 increased the fracture half-length, damage zone area, and energization area by 14.4%, 5.6%, and 39.5%, respectively, while reducing the fracture symmetry coefficient by 0.20. Larger CO2 injection volumes promote fracture propagation and expand the energized reservoir region but may increase fracture asymmetry.
Overall, CO2 pre-injection enhances reservoir energization mainly by expanding the pressure-affected region. Increasing CO2 volume enlarges the pressure redistribution range, while injection rate controls the balance between CO2 diffusion and pressure accumulation. Therefore, CO2 pre-injection parameters should be optimized by balancing fracture propagation, damage evolution, fracture symmetry, and reservoir energization. An integrated optimization considering these factors is presented in Section 4.
4. Optimization of CO2 Pre-Injection Parameters
4.1. Multi-Objective Optimization Framework
The results presented in Section 3 demonstrate that CO2 pre-fracturing involves multiple response characteristics, including fracture extension, damage development, fracture propagation symmetry, and reservoir energization. These responses do not necessarily achieve their optimal values under the same injection conditions. For instance, increasing CO2 injection volume can enlarge fracture extension and expand the pressure-affected reservoir region, but excessive CO2 injection may also intensify fracture asymmetry and reduce propagation stability. Therefore, optimization based on a single evaluation indicator may not provide a comprehensive assessment of CO2 pre-injection fracturing performance.
To determine the optimal CO2 pre-injection parameters, a multi-objective evaluation framework was established based on the entropy weight method. Four evaluation indicators were selected: (1) fracture half-length (Lf), representing fracture extension capability; (2) damage area (Ad), representing the extent of rock damage induced by hydraulic fracturing; (3) fracture symmetry coefficient (Cs), representing fracture propagation stability; and (4) incremental energized area (ΔAe), representing the enhancement of the pressure-affected reservoir region induced by CO2 pre-injection.
These indicators collectively characterize CO2 pre-injection fracturing performance from three perspectives: fracture propagation, fracture geometry control, and reservoir energization. The optimization procedure based on the entropy weight method is shown in Figure 15.
Figure 15.
Flowchart of the entropy weight-based optimization framework for CO2 pre-injection parameters.
4.2. Entropy Weight Analysis of Evaluation Indicators
The entropy weight method was applied to quantify the relative contribution of each indicator based on the variation characteristics among different CO2 injection schemes. The calculated weights of the four evaluation indicators are summarized in Table 4.
Table 4.
Entropy weights of evaluation indicators.
The results indicate that fracture half-length and incremental energized area possess the highest weights, accounting for 70.7% of the total evaluation weight. This suggests that fracture extension capability and reservoir energization capacity contribute most significantly to the comprehensive evaluation of different CO2 pre-injection schemes. The relatively high weight of fracture half-length highlights the importance of promoting effective fracture propagation in tight sandstone reservoirs, whereas the substantial contribution of incremental energized area emphasizes the role of CO2 pre-injection in expanding the pressure-affected reservoir region.
Although the fracture symmetry coefficient exhibits the lowest entropy weight among the four indicators, it remains an important parameter in the optimization process. The relatively low weight of Cs results from its limited variation among different injection schemes rather than its negligible engineering significance. Excessive fracture asymmetry may lead to uneven fracture extension and increase the risk of uncontrolled fracture growth toward adjacent fractures or high-conductivity pathways. In such cases, the injected CO2 may migrate away from the intended stimulation region, reducing the effectiveness of reservoir energization. Therefore, fracture symmetry was retained as an essential indicator in the comprehensive evaluation to ensure a balanced assessment of fracture propagation and reservoir energization performance.
It should be noted that the entropy weights reflect the relative information contribution of each indicator across the evaluated schemes, rather than its intrinsic engineering importance or safety significance. Therefore, the relatively low weight assigned to Cs should not be interpreted as an indication that fracture asymmetry can be neglected. The comprehensive performance index is intended to rank the overall stimulation performance of the investigated schemes, rather than to serve as an independent safety criterion. In practical applications, schemes exhibiting unacceptable asymmetric fracture growth should be screened against site-specific operational and geological constraints before field implementation, irrespective of their comprehensive scores.
4.3. Comprehensive Evaluation and Optimal CO2 Pre-Injection Parameters
The entropy weight method was applied to integrate the four evaluation indicators into a comprehensive performance index (S). The calculated scores of the nine CO2 pre-injection schemes are presented in Figure 16a, and the distribution of S within the CO2 injection parameter domain is shown in Figure 16b.
Figure 16.
Multi-objective optimization results of CO2 pre-fracturing parameters: (a) Ranking of comprehensive performance for different CO2 pre-injection schemes; (b) Optimization map of CO2 injection volume and injection rate. Scheme 8 represents the maximum-performance scenario (75 m3 CO2 + 3 m3/min), whereas scheme 5 represents the recommended engineering option (50 m3 CO2 + 3 m3/min).
The comprehensive evaluation results demonstrate that CO2 injection parameters strongly influence the overall fracturing performance. The schemes with a CO2 injection volume of 25 m3 obtain relatively low comprehensive scores (0.1945–0.2271), indicating that insufficient CO2 injection provides limited improvement in fracture development and reservoir pressure redistribution. Increasing CO2 injection volume generally enhances the comprehensive performance by promoting fracture extension and enlarging the pressure-affected reservoir region.
Among all investigated schemes, scheme 8 (75 m3 CO2 injection volume and 3 m3/min injection rate) achieves the highest comprehensive score of 0.8855, representing the maximum-performance scenario under the investigated conditions. This result is mainly attributed to its favorable fracture propagation and reservoir energization characteristics. Specifically, scheme 8 produces a fracture half-length of 207.52 m, a damage area of 395.38 m2, and an incremental energized area of 840.94 m2. These results indicate that a high CO2 injection volume combined with an appropriate injection rate can enhance fracture extension and expand the pressure-affected reservoir region.
However, the highest comprehensive score does not necessarily identify the most suitable engineering option. In practical applications, CO2 consumption, supply costs, operational feasibility, and equipment capacity must also be considered. Scheme 5 (50 m3 CO2 injection volume and 3 m3/min injection rate) ranks second with a comprehensive score of 0.7277 and provides a more balanced response among the evaluated indicators. Compared with scheme 8, its fracture half-length decreases from 207.52 m to 195.65 m, a reduction in only 5.7%, while its fracture symmetry coefficient increases from 0.85 to 0.99, indicating more balanced bilateral fracture propagation. Meanwhile, scheme 5 achieves an incremental energized area of 907.83 m2, exceeding that of scheme 8. These results suggest that increasing the CO2 injection volume from 50 to 75 m3 primarily promotes further fracture extension, without a corresponding increase in the incremental energized area.
The field applicability of these schemes also depends on site-specific CO2 supply costs and the capacity of the available injection equipment. Scheme 8 requires 50% more CO2 than scheme 5, which may increase supply, transportation, and storage costs and impose additional demands on CO2 delivery and injection systems. Where CO2 availability or equipment capacity is constrained, scheme 5 may therefore be more practical to implement. These considerations are operational constraints rather than variables explicitly quantified in the present optimization model and should be evaluated against site-specific conditions before field implementation.
The distribution of the comprehensive performance index in Figure 16b further reveals the influence of CO2 injection parameters on overall fracturing performance. The high-performance region is mainly concentrated around an injection rate of approximately 3 m3/min, particularly for CO2 injection volumes of 50–75 m3. Both scheme 5 and scheme 8 achieve their highest comprehensive scores at this injection rate, indicating that 3 m3/min provides a favorable balance among CO2 migration, pressure redistribution, fracture extension, and fracture propagation stability. In contrast, increasing the injection rate to 4 m3/min does not continuously improve the comprehensive performance. Particularly for the 75 m3 CO2 injection condition, the comprehensive score decreases significantly to 0.3668, suggesting that excessive injection rates may induce unfavorable fracture propagation behavior and reduce the overall effectiveness of CO2 pre-injection treatment.
From an engineering perspective, increasing CO2 injection volume from 50 m3 to 75 m3 requires an additional 50% CO2 consumption, whereas the comprehensive score increases only from 0.7277 to 0.8855, corresponding to a 21.7% improvement. Meanwhile, the fracture half-length increases by only 11.87 m. Therefore, the additional benefit obtained by increasing CO2 injection volume from 50 m3 to 75 m3 is relatively limited compared with the increased CO2 requirement.
Consequently, scheme 8 (75 m3 CO2 injection volume and 3 m3/min injection rate) represents the maximum-performance scenario and is suitable when maximizing fracture extension and overall stimulation performance is the primary objective. Scheme 5 (50 m3 CO2 injection volume and 3 m3/min injection rate), although not the highest-scoring scheme, provides a more balanced combination of fracture propagation, reservoir energization, and CO2 utilization. Considering potential CO2 supply costs and site-specific equipment constraints, scheme 5 is recommended as the preferred engineering option for CO2 pre-fracturing in tight sandstone gas reservoirs, while scheme 8 remains the preferred choice when maximum stimulation performance can be achieved within the available operational capacity.
5. Conclusions
This study investigated the effects of CO2 injection parameters on fracture propagation and reservoir energization during CO2 pre-fracturing in low-pressure tight sandstone gas reservoirs. The main conclusions are as follows:
- (1)
- In the Sulige tight sandstone gas reservoir, the relatively large horizontal stress difference (8 MPa) dominates fracture propagation during CO2 pre-fracturing. The induced fractures maintain a typical bi-wing morphology and propagate preferentially along the maximum horizontal principal stress direction.
- (2)
- At a constant CO2 injection rate of 3 m3/min, increasing the injection volume from 25 to 75 m3 increased the fracture half-length, damage zone area, and energization area by 14.4%, 5.6%, and 39.5%, respectively, while reducing the fracture symmetry coefficient by 0.20. Larger CO2 injection volumes promote fracture propagation and expand the energized reservoir region but may increase fracture asymmetry.
- (3)
- With a fixed CO2 injection volume of 50 m3, increasing the injection rate from 2 to 4 m3/min resulted in non-monotonic variations in fracture propagation. The fracture half-length and symmetry coefficient initially increased and then decreased, whereas the energization area continuously decreased. These results indicate that an excessively high injection rate is unfavorable for improving reservoir energization in low-pressure tight gas reservoirs.
- (4)
- The entropy-weight-based evaluation showed that scheme 8 (75 m3 CO2 at 3 m3/min) achieved the highest comprehensive score (0.8855), representing the maximum-performance scenario. Scheme 5 (50 m3 CO2 at 3 m3/min) achieved a score of 0.7277 and provided a more balanced engineering option, with a fracture half-length of 195.65 m and an energized area increment of 907.83 m2. Considering CO2 consumption, supply costs, and site-specific equipment capacity, scheme 5 is recommended for engineering applications, whereas scheme 8 is preferred when maximizing overall stimulation performance is the primary objective.
- (5)
- The present THMD model neglects CO2–water–rock geochemical interactions and adopts a two-dimensional plane-strain assumption, which limits its representation of three-dimensional fracture geometry. Future work should incorporate geochemical effects and extend the model to three dimensions to improve the prediction of fracture propagation during CO2 pre-fracturing.
Author Contributions
Conceptualization and methodology, H.W. (Hongke Wang); methodology and writing—original draft, B.D.; writing—original draft and writing—review and editing, H.W. (Hua Wu); formal analysis, L.J.; software, G.L.; investigation, Z.W.; validation, J.J.; software, C.G.; investigation, Q.C. All authors have read and agreed to the published version of the manuscript.
Funding
This work was supported by the Postdoctoral Research and Development Program of CNPC Bohai Drilling Engineering Company Limited (Grant No. 2026B23F-02).
Data Availability Statement
The original contributions presented in this study are included in the article. Further inquiries can be directed to the corresponding authors.
Conflicts of Interest
The authors declare the following interests related to this work: Hua Wu is employed by the Postdoctoral Workstation of CNPC Bohai Drilling Engineering Company Limited; Guoliang Li is employed by PetroChina Changqing Oilfield Company; and Zhiwei Wu is employed by China Petroleum Technical Service Corporation Limited. The authors declare no conflicts of interest. The funder was not involved in the study design, collection, analysis, interpretation of data, the writing of this article or the decision to submit it for publication.
References
- National Energy Administration of China. China Oil and Gas Exploration and Development Report 2025. Available online: https://www.nea.gov.cn/20250829/f5a1c59132694e60bb93bc5ff2881f47/20250829f5a1c59132694e60bb93bc5ff2881f47_2116b5b723f2cd456c825213683c5072da.pdf (accessed on 29 August 2025).
- Yang, S.; Wang, L.; Wei, Q.; Zhao, J.; Wei, M.; Peng, L.; Zeng, Y.; Ruan, Y.; Jiang, L. Analysis of microscopic percolation and water production mechanism of tight sandstone gas reservoir in He 8 and Shan 1 section, the western of Sulige gas field. Mineral. Petrol. 2025, 45, 131–142. [Google Scholar] [CrossRef]
- Yu, H.; Wang, Z.; Li, J.; Zhu, Y. Key technological progress and breakthrough direction for the development of complex tight gas reservoirs in Changqing gas field, Ordos Basin. Acta Pet. Sin. 2023, 44, 698–712. [Google Scholar] [CrossRef]
- Zhao, Z.; Zhang, Y.; Huang, Y.; Zhang, X. The Mechanisms and Applications of CO2-Elevated Fracturing in Tight Sandstone Gas Reservoirs: A Comprehensive Investigation for Enhanced Oil and Gas Recovery. ACS Omega 2026, 11, 31443. [Google Scholar] [CrossRef] [Scilit] [PubMed]
- Xia, Y.; Li, L.; Wang, Z. Experimental and numerical study on influencing factors of replacement capacity and slickwater flowback efficiency using pre-CO2 fracturing in tight oil reservoirs. J. Pet. Sci. Eng. 2022, 215, 110697. [Google Scholar] [CrossRef] [Scilit]
- Wan, T.; Dong, Y.; Wang, L.; He, J.; Hou, B. Impact of CO2 Energized Fracturing on Fracture Morphology and Rock Properties Applied in Jimsar Shale Oil. Geoenergy Sci. Eng. 2026, 259, 214370. [Google Scholar] [CrossRef] [Scilit]
- Tian, G.; Wang, H.; Li, G.; Yang, B.; Zhao, C.; Zheng, Y. Experiment investigation on the fracture initiation characteristics of shale saturated with CO2 and brine. In Proceedings of the 56th U.S. Rock Mechanics/Geomechanics Symposium, Santa Fe, NM, USA, 26–29 June 2022. [Google Scholar] [CrossRef] [Scilit]
- Tao, L.; Qi, Y.; Wang, N.; Zhang, L.; Chen, W.; Cao, Y.; Cao, W. Research and Practice of CO2 Energized Volume Fracturing in Shale Oil Horizontal Wells of Ordos Basin. J. Phys. Conf. Ser. 2025, 3048, 012078. [Google Scholar] [CrossRef] [Scilit]
- Wu, H.; Wang, X.; Ge, H.; Song, J.; Hou, S.; He, J.; Wang, Z. Experimental study on fracture propagation characteristics of CO2 pre-fracturing in shale oil reservoir. In Proceedings of the 58th U.S. Rock Mechanics/Geomechanics Symposium, Golden, CO, USA, 23–26 June 2024. [Google Scholar] [CrossRef] [Scilit]
- Lu, Y.; Zhou, J.; Xian, X.; Tang, J.; Zhou, L.; Jiang, Y.; Xia, B.; Wang, X.; Kang, Y. Research progress and prospect of the integrated supercritical CO2 enhanced shale gas recovery and geological sequestration. Nat. Gas Ind. 2021, 41, 60–73. [Google Scholar] [CrossRef]
- Zhang, K.; Qi, Y.; Xue, X.; Tao, L.; Chen, W.; Wu, A. CO2 regional enhanced volumetric fracturing technology for shale oil horizontal wells in Ordos Basin. Pet. Drill. Tech. 2023, 51, 15–22. [Google Scholar] [CrossRef]
- Ha, S.J.; Choo, J.; Yun, T.S. Liquid CO2 fracturing: Effect of fluid permeation on the breakdown pressure and cracking behavior. Rock Mech. Rock Eng. 2018, 51, 3407–3420. [Google Scholar] [CrossRef] [Scilit]
- Ishida, T.; Chen, Y.; Bennour, Z.; Yamashita, H.; Inui, S.; Nagaya, Y.; Naoi, M.; Chen, Q.; Nakayama, Y.; Nagano, Y. Features of CO2 fracturing deduced from acoustic emission and microscopy in laboratory experiments. J. Geophys. Res. Solid Earth 2016, 121, 8080–8098. [Google Scholar] [CrossRef] [Scilit]
- Sun, L.; Wang, H.; Li, G.; Wang, B.; Stanchits, S.; Mao, Z.; Zhang, Y.; Cheremisin, A.; Zheng, Y.; Jin, J. Micromechanical damage and proppant embedment patterns of fracture surfaces in lacustrine shale CO2 pre-pad energized fracturing. Pet. Explor. Dev. 2025, 52, 1041–1052. [Google Scholar] [CrossRef] [Scilit]
- Lei, Z.; Meng, S.; Peng, Y.; Tao, J.; Liu, Y.; Liu, H. Evaluation of the adaptability of CO2 pre-fracturing to Gulong shale oil reservoirs, Songliao Basin, NE China. Pet. Explor. Dev. 2025, 5, 459–470. [Google Scholar] [CrossRef] [Scilit]
- Tang, W.; Zheng, X.; Liu, C.; Zhou, F.; Liu, X.; Zhou, H.; Wang, B.; Wang, X.; Hou, X. Shale permeability and microstructural alternation during CO2 pre-fracturing: A mechanistic study. Phys. Fluids 2024, 36, 046603. [Google Scholar] [CrossRef] [Scilit]
- Lv, Y.; Luo, M.; Zhang, M.; Wang, K.; Zhan, Y.; Zhang, S.; Zhao, C. Experimental Evaluation of Energy Enhancement and Fracturing Fluid Flowback Effect for CO2 Pre-Fracturing in Shale Reservoirs. J. Phys. Conf. Ser. 2024, 2834, 012073. [Google Scholar] [CrossRef] [Scilit]
- Zhu, J.; Wang, F.; Wang, J.; Li, Z.; Zhang, S. Investigation on Energy Enhancement of Shale Oil Imbibition Under Different Fracture Fluid Injection Methods—A Case Investigation of Jimsar Lucaogou Formation. Energies 2025, 18, 1412. [Google Scholar] [CrossRef] [Scilit]
- Long, Y.; Liu, B.; Sheng, G.; Guo, S.; Li, Q.; Duan, Y.; Zhang, Y.; Fang, H.; Zhang, L. A new simulation approach for fracture fluid leak off during pre-CO2 fracturing in shale reservoirs. Phys. Fluids 2025, 37, 081708. [Google Scholar] [CrossRef] [Scilit]
- Yang, L.; Liu, Z.; Lu, Y.; Chen, H.; Dong, Y.; He, M. Investigation of conglomerate softening effect induced by supercritical CO2-water-rock interaction via micro-scratch test. Adv. Geo-Energy Res. 2025, 18, 21–37. [Google Scholar] [CrossRef] [Scilit]
- Chen, H.; Abudusalamu, A.; Yang, Z.; Wang, Q.; Qiu, P.; Liu, N.; Zhong, J. Mechanism and development of CO2 pre-pad fracturing stimulation for tight conglomerate low-permeability condensate gas reservoirs. Sci. Rep. 2026, 16, 31409. [Google Scholar] [CrossRef] [Scilit] [PubMed]
- Zhou, H.; Yan, T.; Wang, B.; Zhou, F. Investigating rock properties and fracture propagation pattern during supercritical CO2 pre-fracturing in conglomerate reservoir. Adv. Geo-Energy Res. 2025, 17, 95–106. [Google Scholar] [CrossRef] [Scilit]
- Luo, K.; Gao, H.; Xie, Y.; Ma, Z.; Li, H.; Cheng, Z. Assessment of CO 2-energized fracturing methods: Their impacts on fracturing fluid flowback and CO2 geological storage in deep tight gas reservoirs. Adv. Geo-Energy Res. 2026, 19, 58–71. [Google Scholar] [CrossRef] [Scilit]
- Song, S.; Liu, X.; Fu, Y.; Zang, Y.; Wang, H.; Tian, F.; Shao, L.; Jia, Y.; Zhao, T.; Yin, Q. Numerical simulation study on factors affecting the pre-CO2 fracturing effect in shale oil reservoirs: A case study on Kong-2 member in Cangdong Sag, China. Therm. Sci. 2024, 28, 1053–1059. [Google Scholar] [CrossRef] [Scilit]
- Liu, L.; Ding, R.; Chen, E.; Zhang, C. Investigation of the CO2 pre-fracturing mechanism for enhancing fracture propagation and stimulated reservoir volume in ultra-deep oil reservoirs. Energies 2024, 18, 96. [Google Scholar] [CrossRef] [Scilit]
- Zhang, J.; Wang, J.; Li, Y.; Wang, T.; Shi, S.; Zhou, H.; Li, H.; Wang, B. Research on Mechanism and Parameter Optimization of CO2 Pre-pad Fracturing—Taking the Mahu Conglomerate Reservoir as an Example. In Proceedings of the 59th U.S. Rock Mechanics/Geomechanics Symposium, Santa Fe, NM, USA, 8–11 June 2025. [Google Scholar] [CrossRef] [Scilit]
- Zhang, L.; Yao, X.; Wen, R.; Li, L.; Zhang, Z.; Yang, H.; Yang, L. Study on rock–fluid interactions and influencing factors in the fracture during the CO2-energized fracturing and production process in tight sandstone oil reservoirs. Arab. J. Sci. Eng. 2025, 50, 21275–21298. [Google Scholar] [CrossRef] [Scilit]
- Yan, X.; Zuo, T.; Lan, J.; Jia, Y.; Xiao, C. Laboratory-to-field scale numerical investigation of enhanced oil recovery mechanism for supercritical CO2-energized fracturing. Energies 2025, 18, 515. [Google Scholar] [CrossRef] [Scilit]
- Tian, G.; Xia, Q.; Wang, H.; Cheng, X.; Wang, B. Fracture Propagation Patterns of Pre-CO2 Fracturing in Shale Oil Reservoirs. Drill. Fluid Complet. Fluid 2026, 43, 549. [Google Scholar] [CrossRef]
- Clavijo, S.P.; Addassi, M.; Finkbeiner, T.; Hoteit, H. A coupled phase-field and reactive-transport framework for fracture propagation in poroelastic media. Sci. Rep. 2022, 12, 17819. [Google Scholar] [CrossRef] [Scilit] [PubMed]
- Rathnaweera, T.; Ranjith, P.; Perera, M.; Ranathunga, A.; Wanniarachchi, W.; Yang, S.; Lashin, A.; Al Arifi, N. An experimental investigation of coupled chemico-mineralogical and mechanical changes in varyingly-cemented sandstones upon CO2 injection in deep saline aquifer environments. Energy 2017, 133, 404–414. [Google Scholar] [CrossRef] [Scilit]
- Olson, J.E.; Laubach, S.E.; Lander, R.H. Natural fracture characterization in tight gas sandstones: Integrating mechanics and diagenesis. AAPG Bull. 2009, 93, 1535–1549. [Google Scholar] [CrossRef] [Scilit]
- Dai, H.; Yin, T.; Wu, Y.; Ma, J.; Guo, W.; Li, X. Characterization of fracture extension and damage evolution in hot dry rock by cycle hydraulic fracturing (CHF): Application of CHF in enhanced geothermal systems. Energy 2025, 330, 137007. [Google Scholar] [CrossRef] [Scilit]
- Wu, X.; Li, Y.; Li, T.; Cui, G.; Tang, C. Numerical insights into thermal-hydraulic-mechanical-damage (THMD) fields evolution over hydraulic fracturing in hot dry rock. Int. J. Rock Mech. Min. Sci. 2025, 196, 106323. [Google Scholar] [CrossRef] [Scilit]
- Li, T.; Li, L.; Tang, C.; Zhang, Z.; Li, M.; Zhang, L.; Li, A. A coupled hydraulic-mechanical-damage geotechnical model for simulation of fracture propagation in geological media during hydraulic fracturing. J. Pet. Sci. Eng. 2019, 173, 1390–1416. [Google Scholar] [CrossRef] [Scilit]
- Zhang, Q.; Ma, D.; Wu, Y.; Meng, F. Coupled thermal-gas-mechanical (TGM) model of tight sandstone gas wells. J. Geophys. Eng. 2018, 15, 1743–1752. [Google Scholar] [CrossRef] [Scilit]
- Zhang, X.; Huang, Z.; Li, G.; Wu, X.; Wang, T.; Zhou, X. Enhancing reservoir stimulation and heat extraction performance for fractured geothermal reservoirs: Utilization of novel multilateral wells. Energy 2024, 291, 130410. [Google Scholar] [CrossRef] [Scilit]
- Zhang, B.; Guo, T.; Qu, Z.; Wang, J.; Chen, M.; Liu, X. Numerical simulation of fracture propagation and production performance in a fractured geothermal reservoir using a 2D FEM-based THMD coupling model. Energy 2023, 273, 127175. [Google Scholar] [CrossRef] [Scilit]
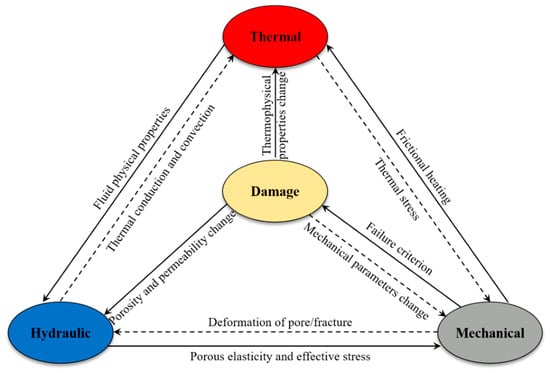
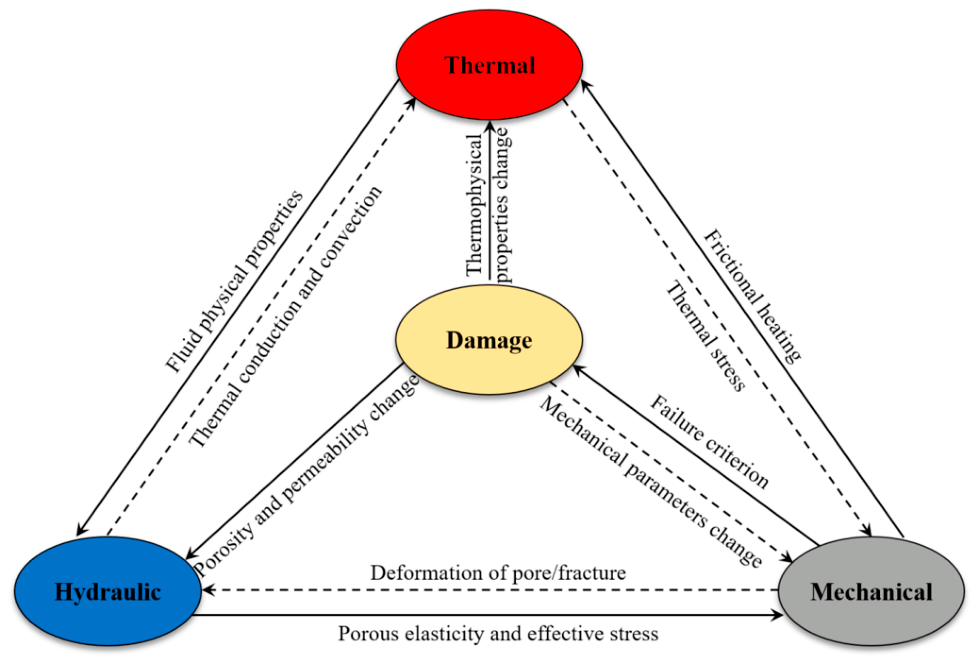
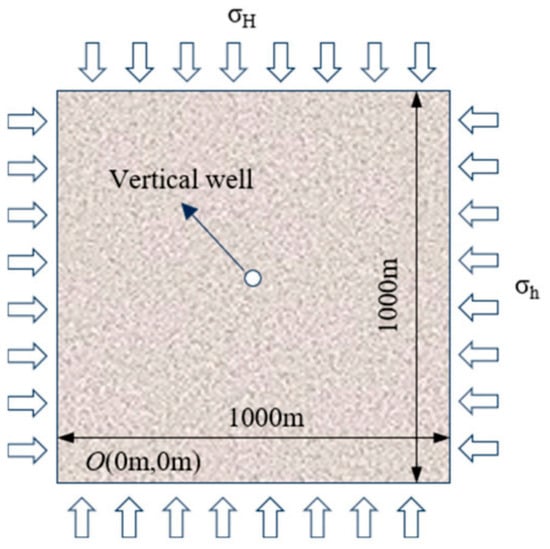
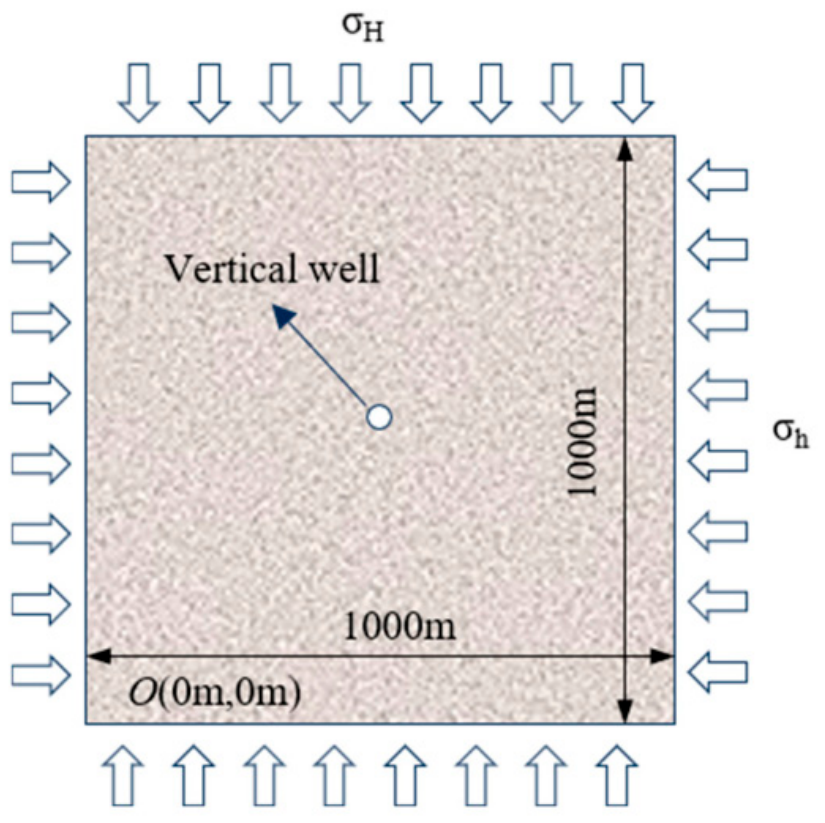
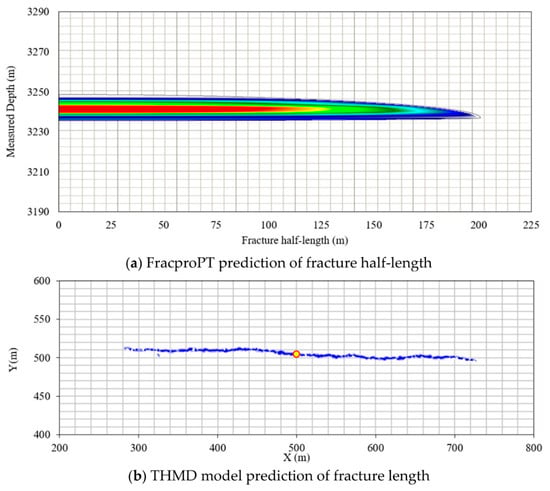
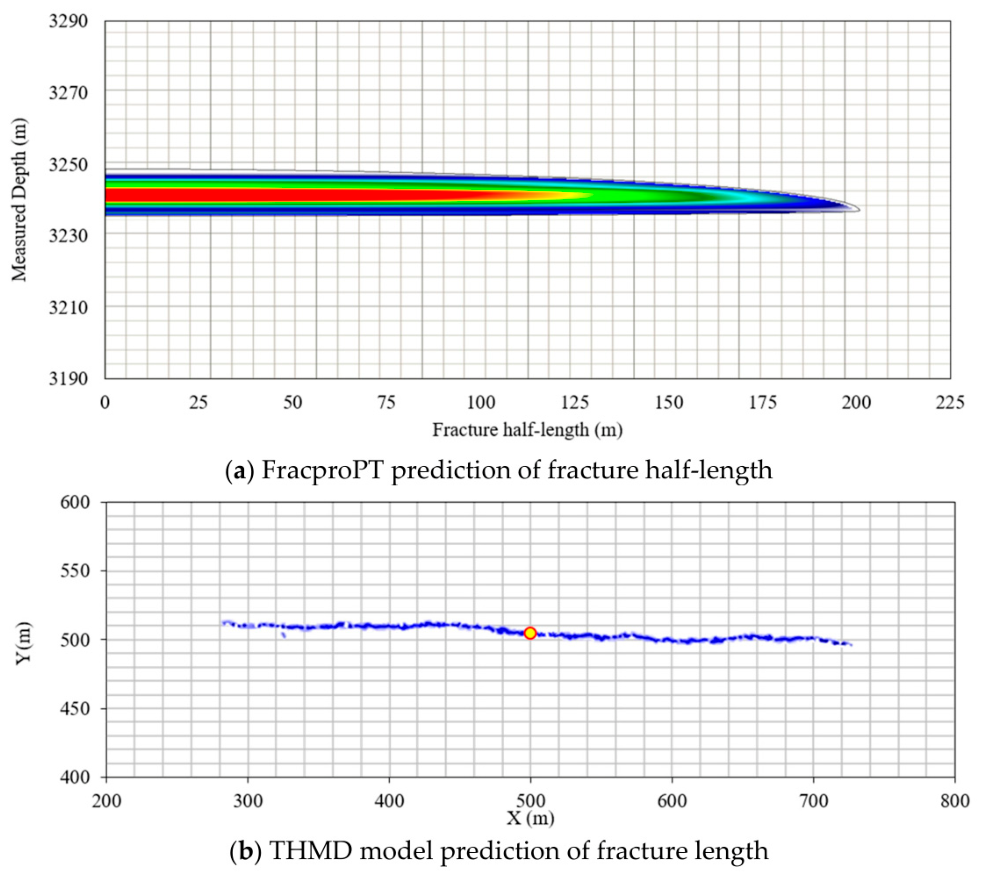
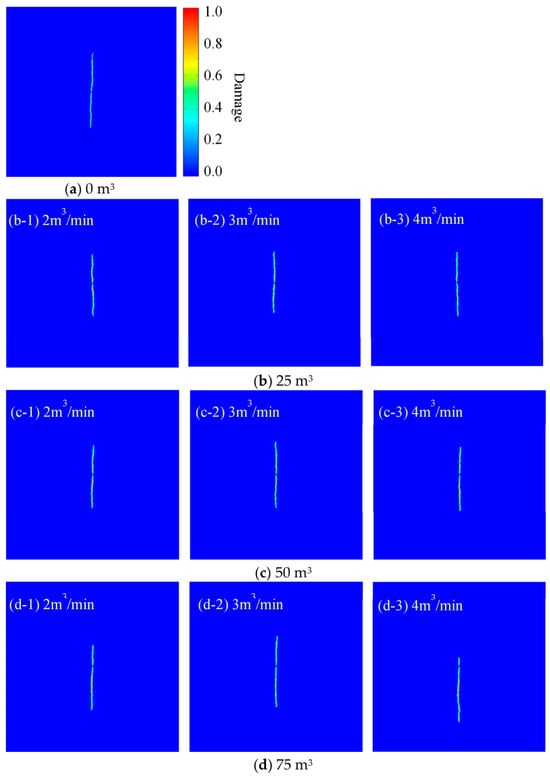
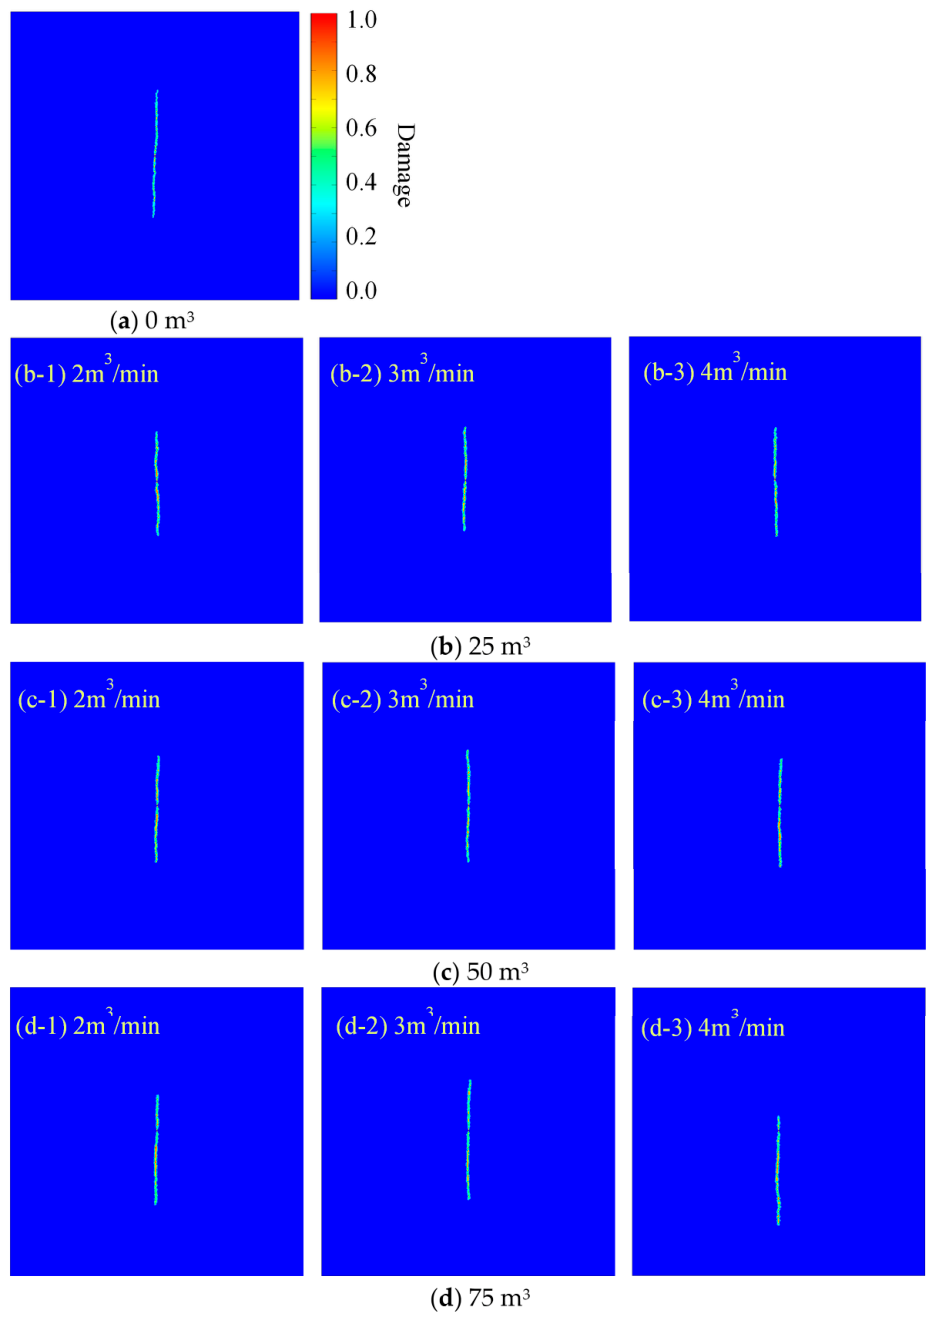
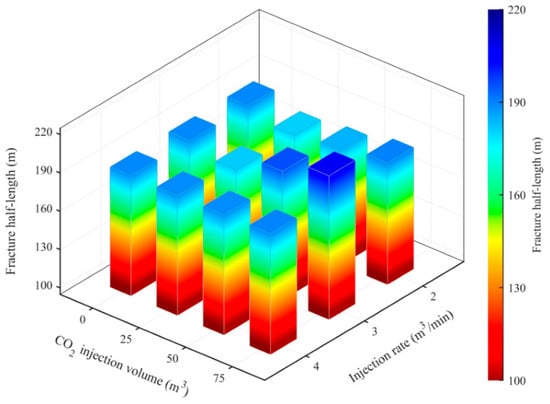
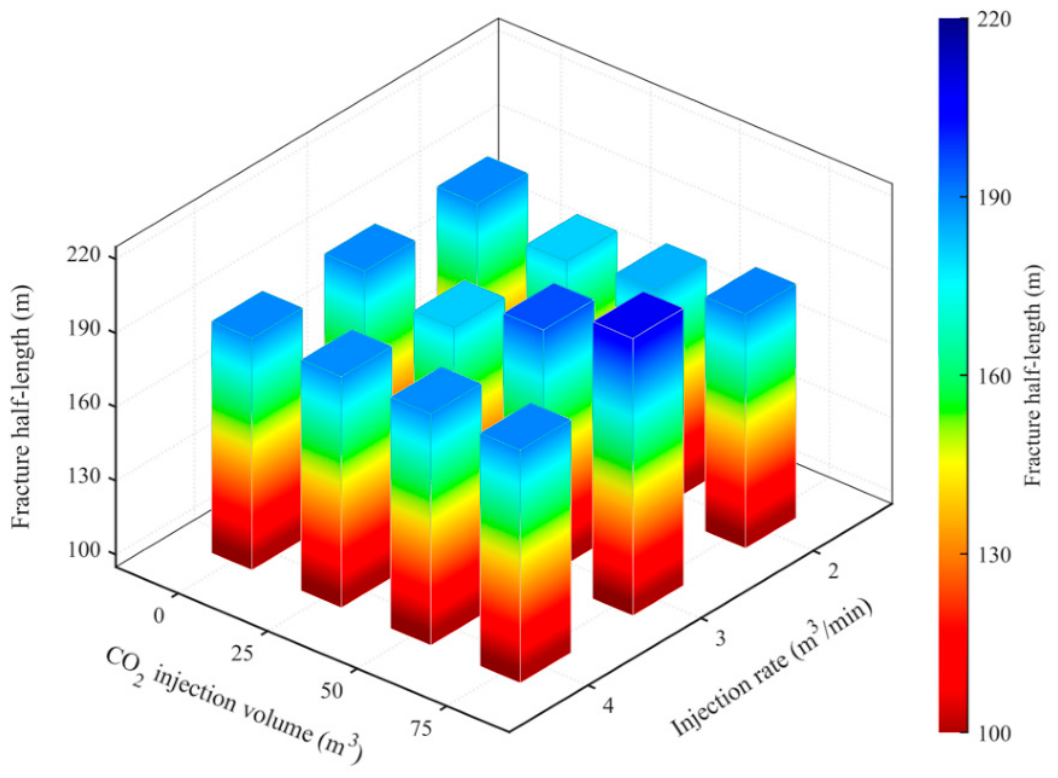
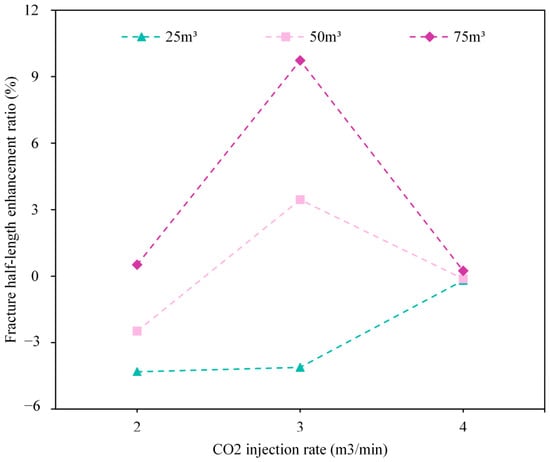
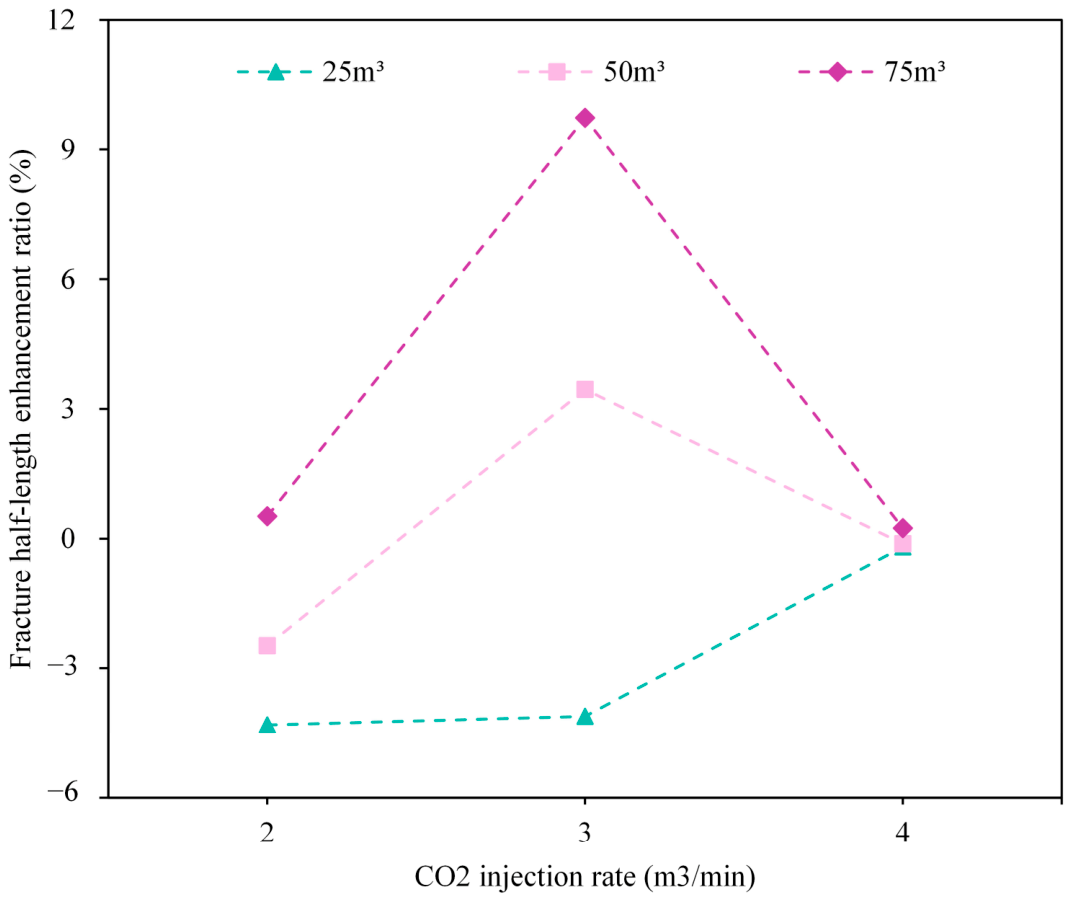
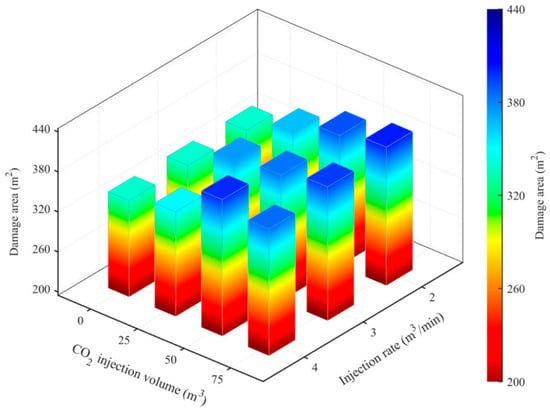
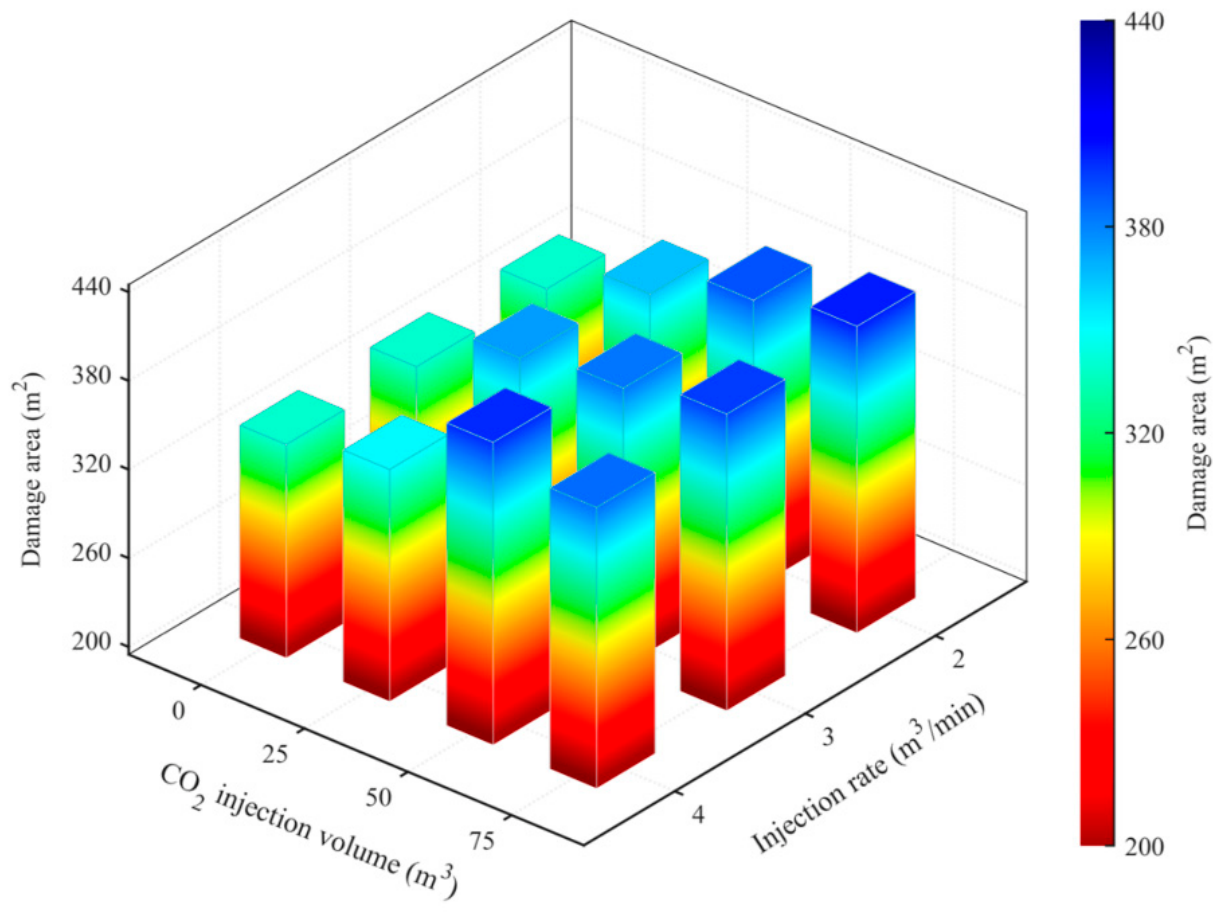
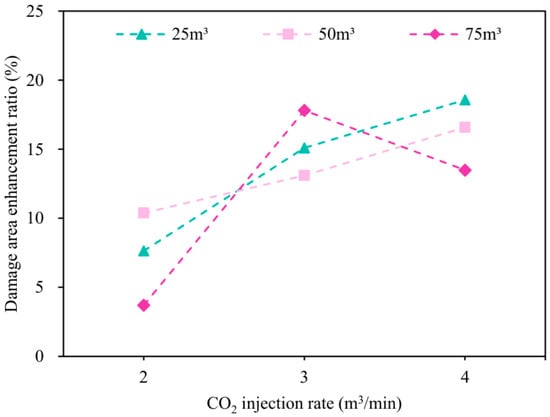
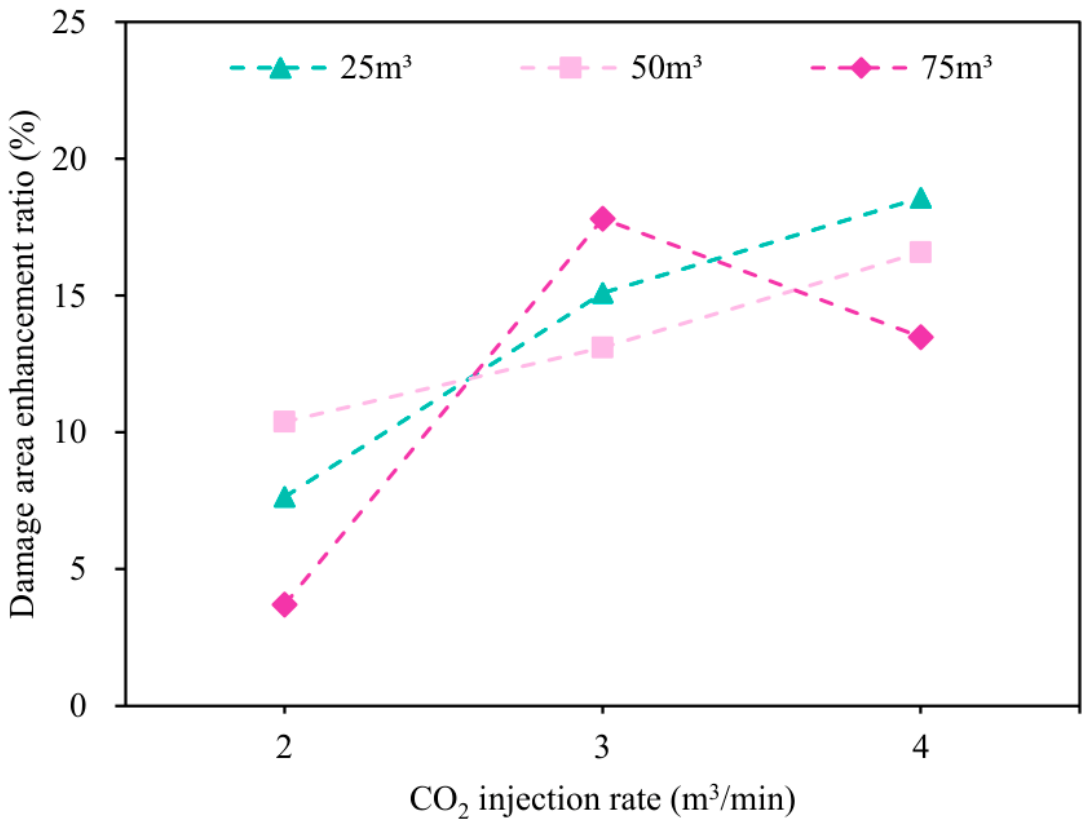
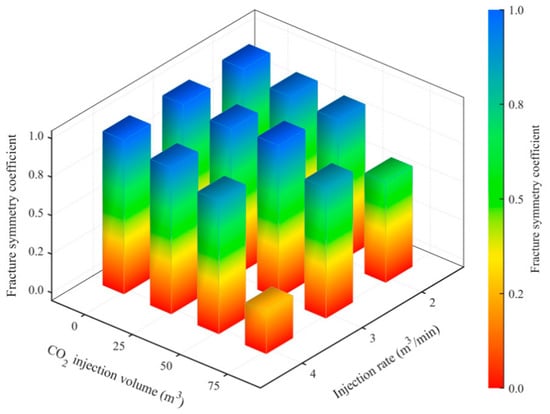
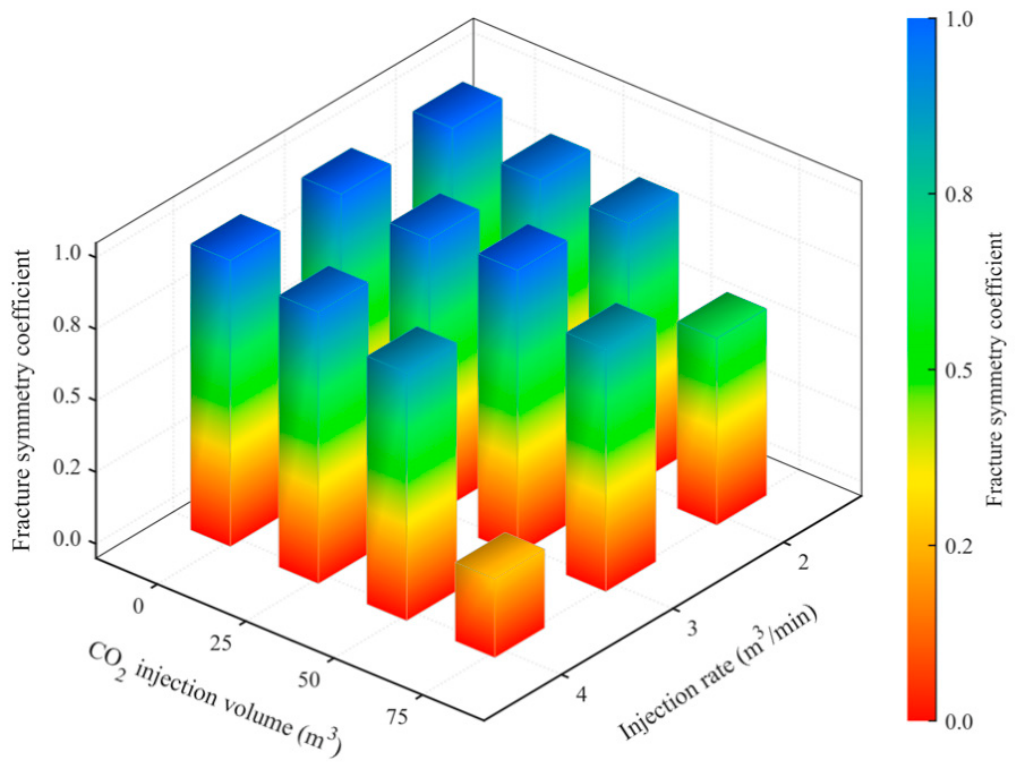
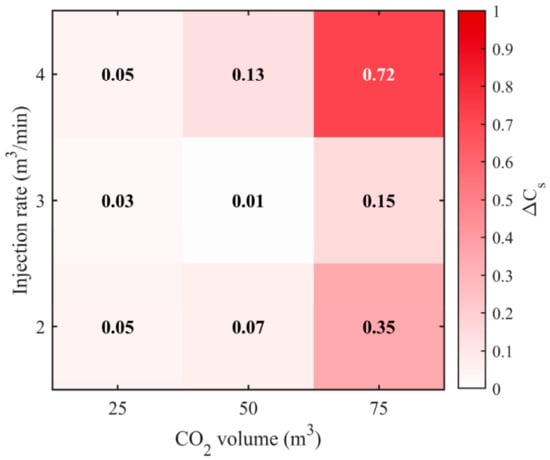
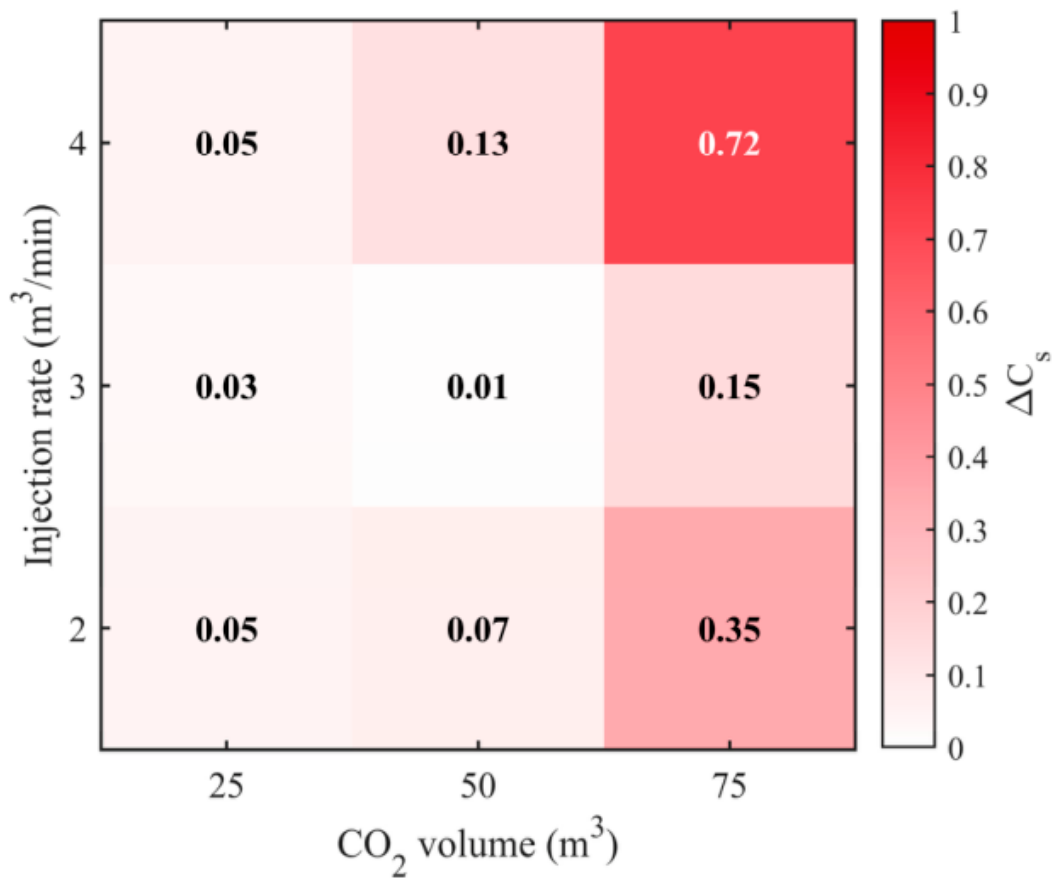
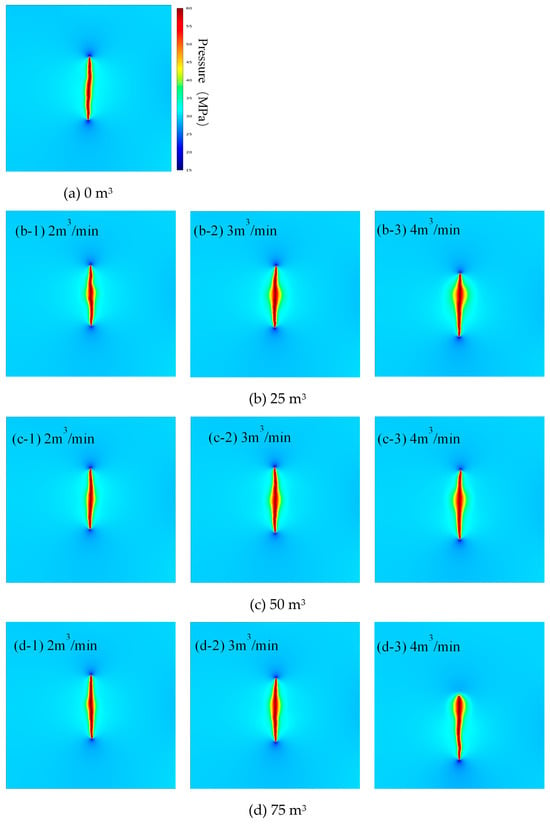
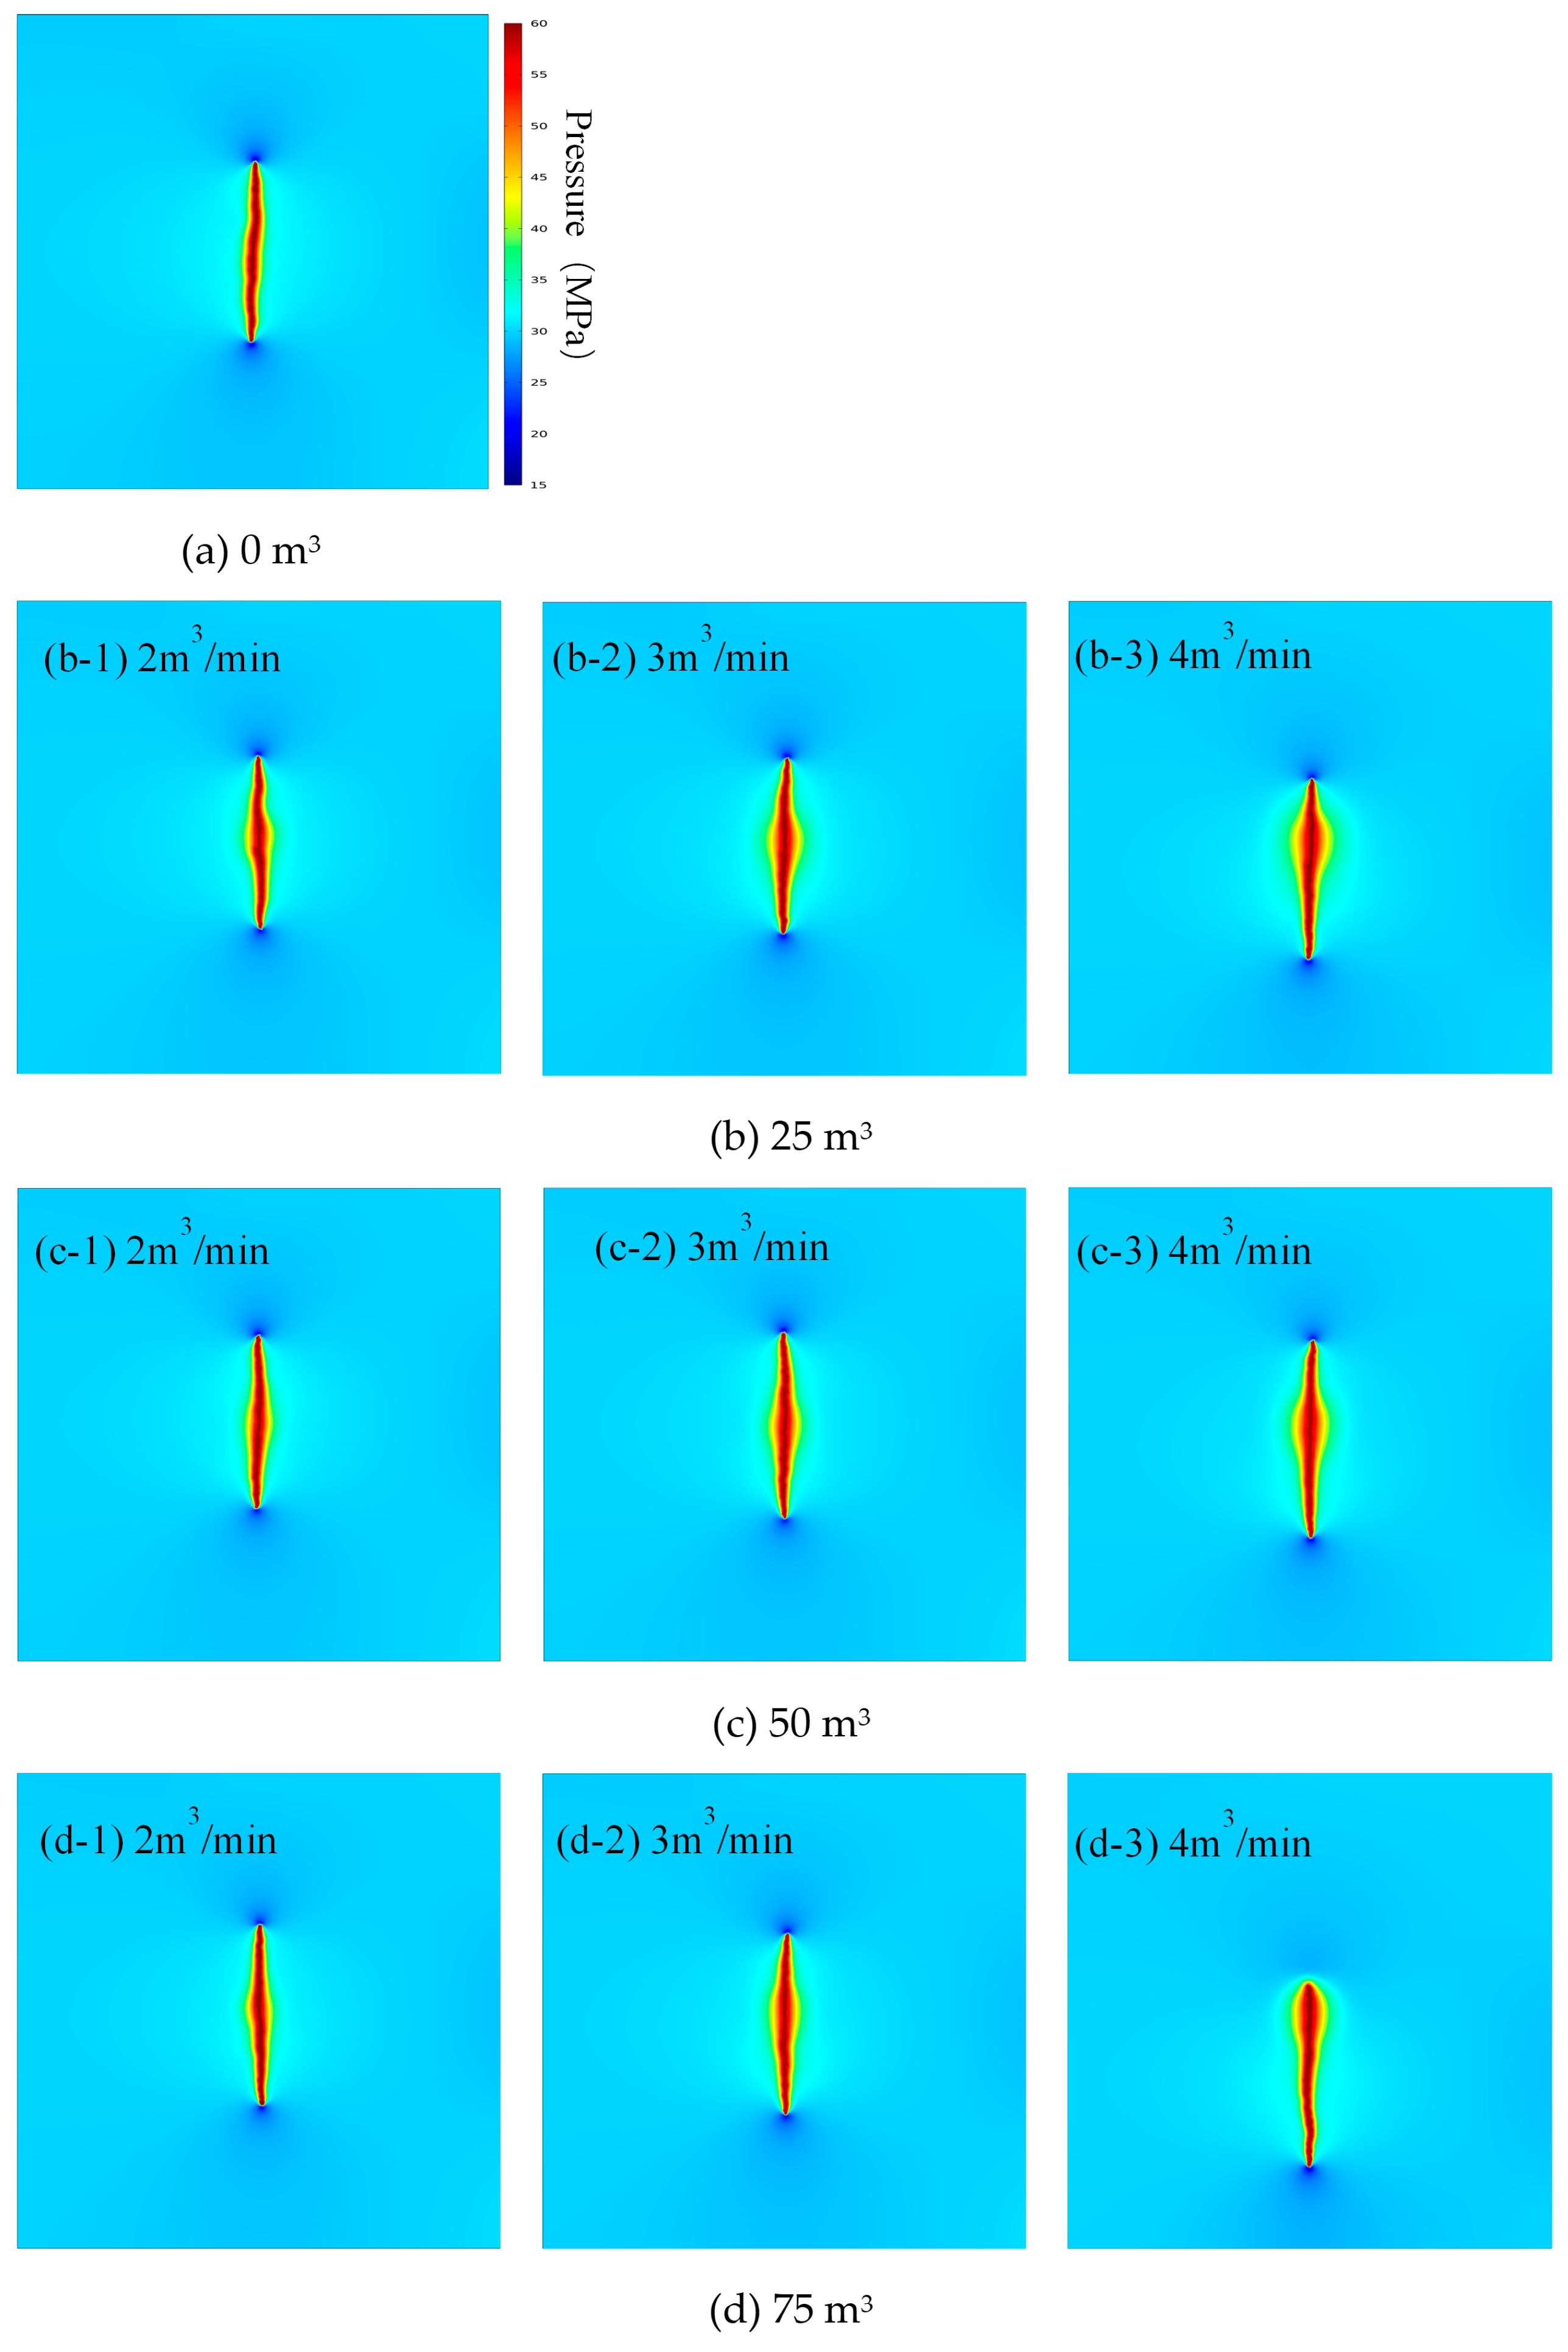
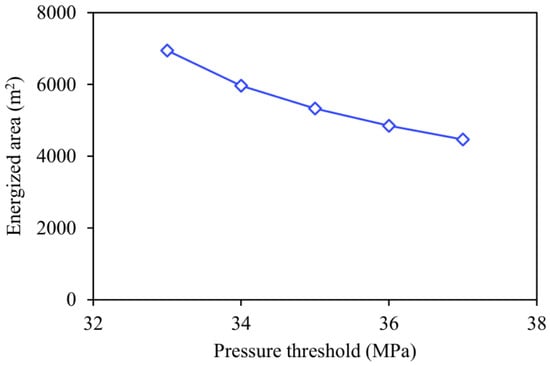
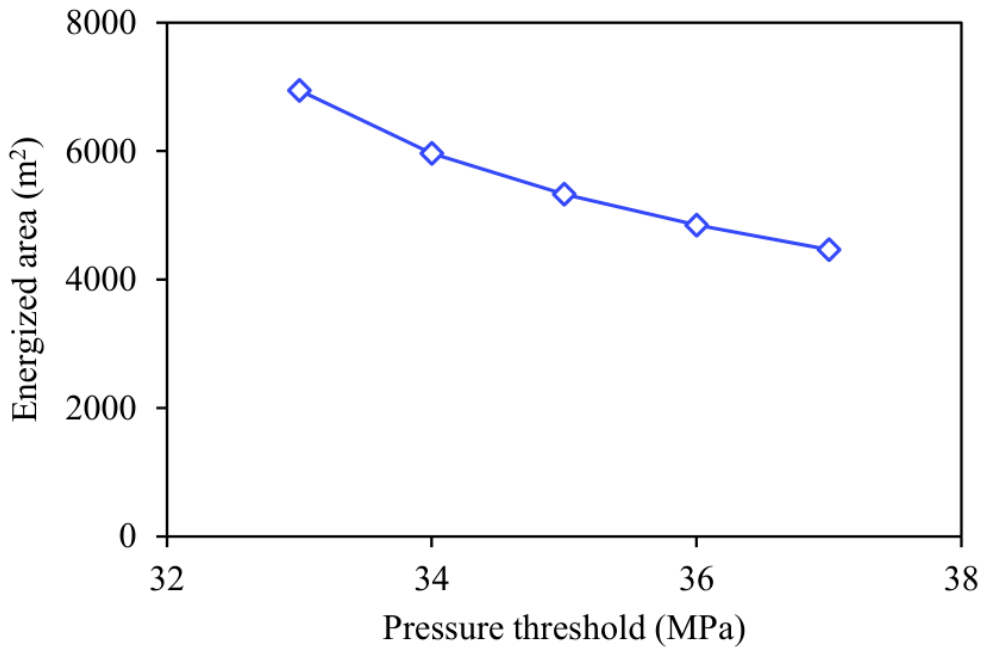
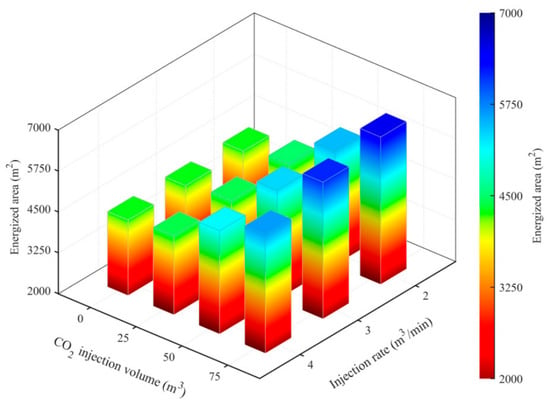
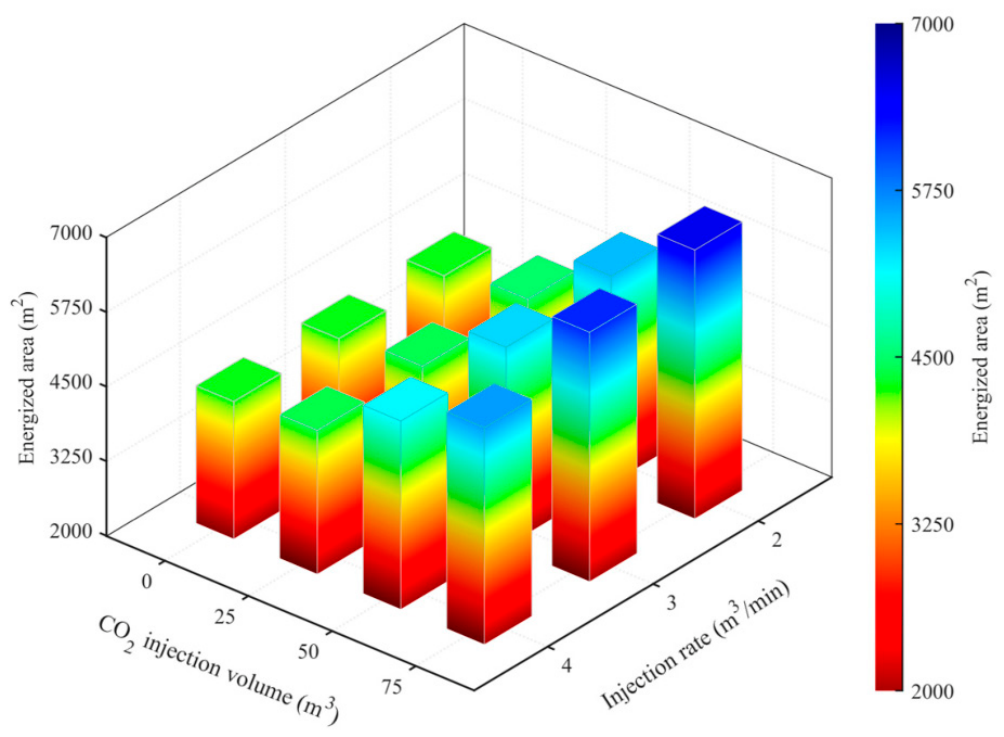
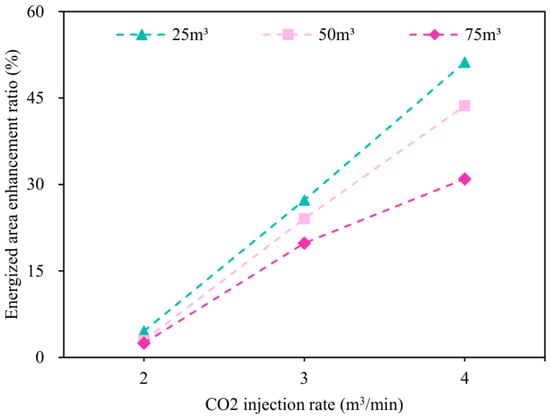
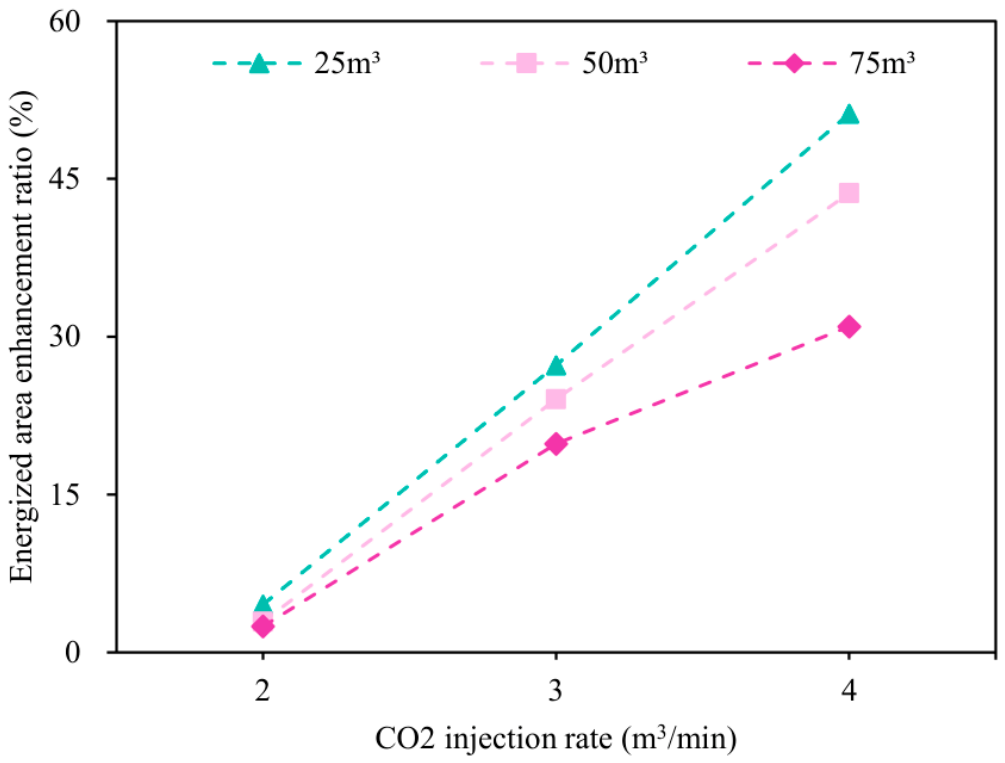
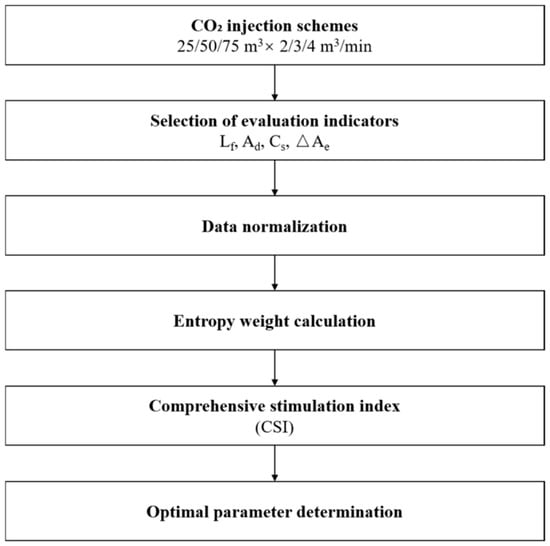
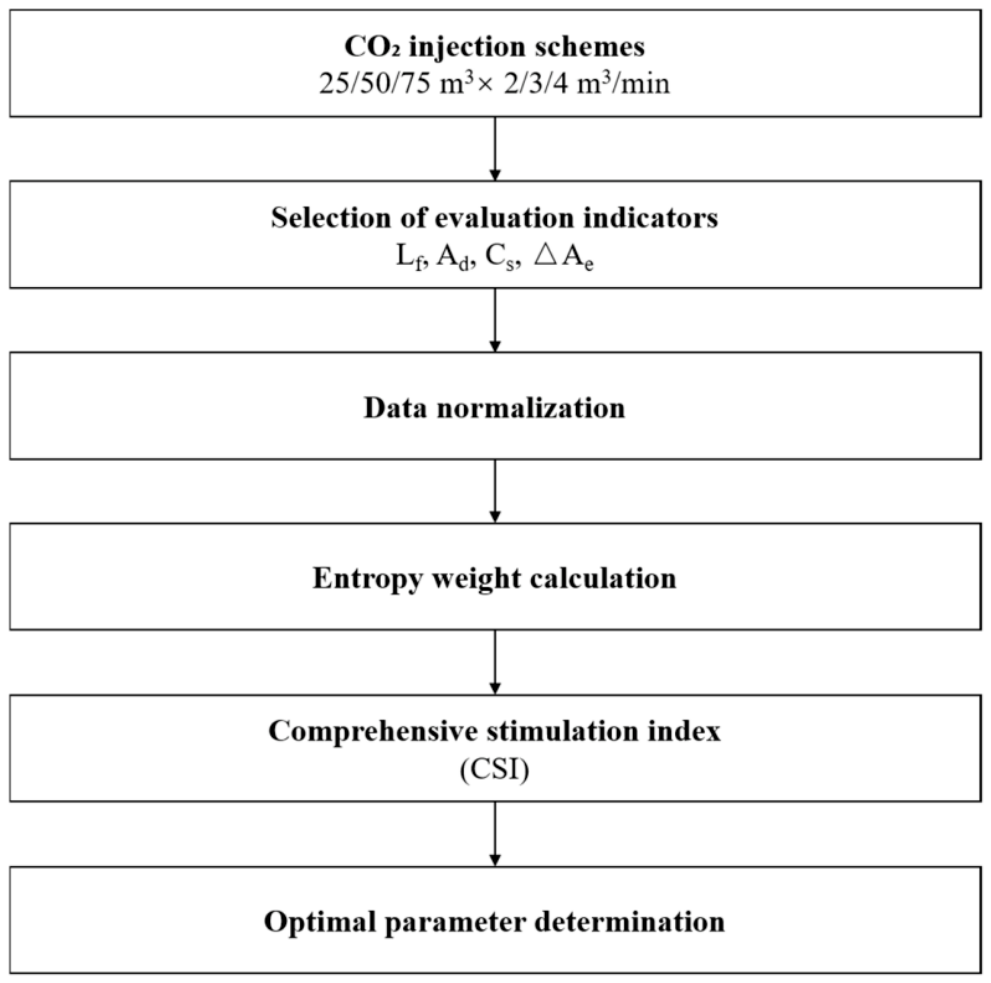
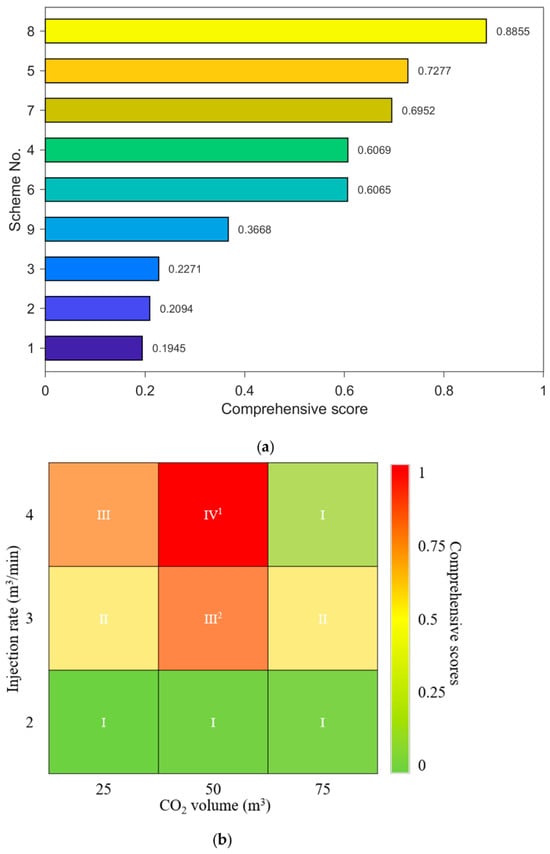
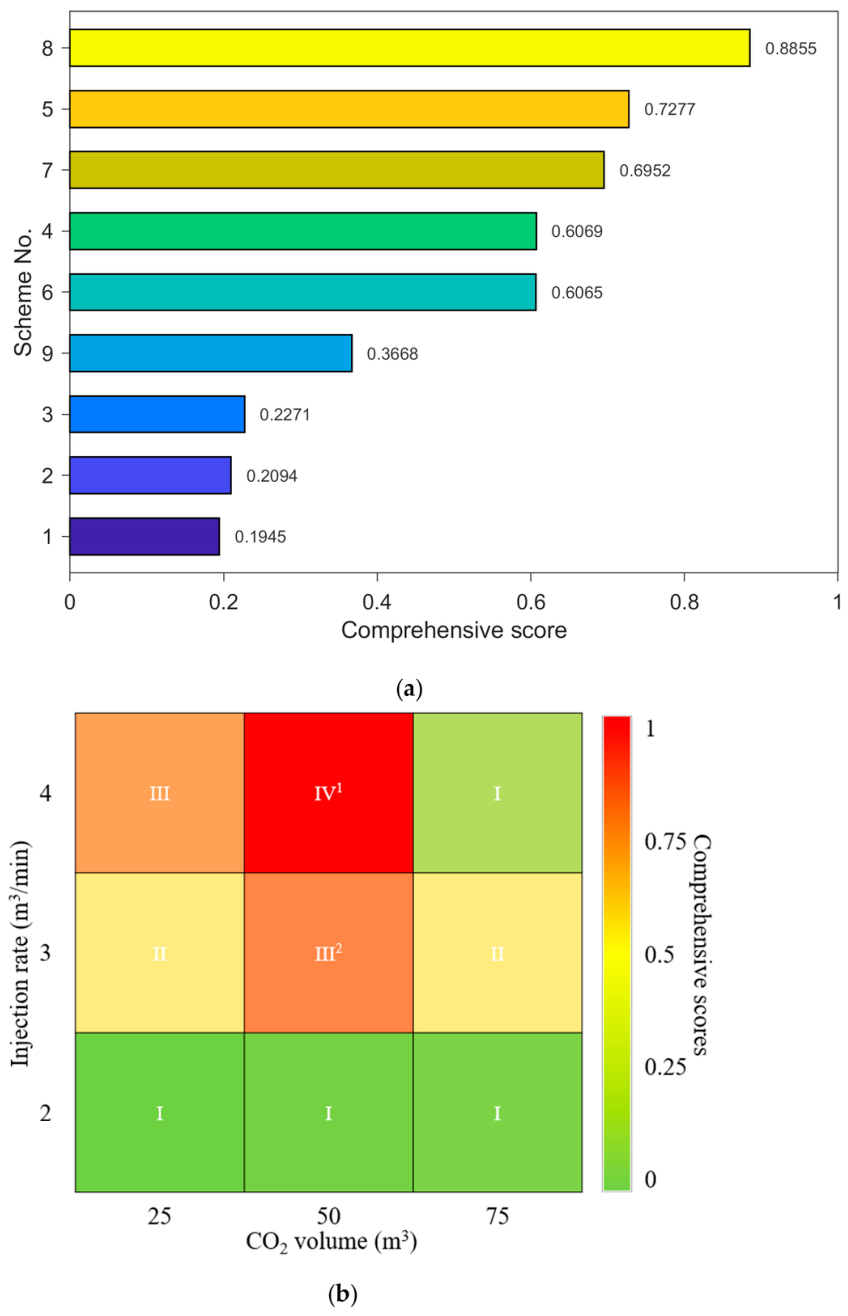

Disclaimer/Publisher’s Note: The statements, opinions and data contained in all publications are solely those of the individual author(s) and contributor(s) and not of MDPI and/or the editor(s). MDPI and/or the editor(s) disclaim responsibility for any injury to people or property resulting from any ideas, methods, instructions or products referred to in the content. |
© 2026 by the authors. Licensee MDPI, Basel, Switzerland. This article is an open access article distributed under the terms and conditions of the Creative Commons Attribution (CC BY) license.