


Abstract
Prolonged drought can induce shrinkage cracking in near-surface clay foundations, leaving persistent defects that may affect the uplift safety of underground structures before subsequent rainfall events. This study investigates how burial depth regulates the influence of two pre-existing surface cracks on the uplift bearing capacity and failure mechanism of a horizontal strip anchor plate in red clay. A two-dimensional plane-strain model was established in Optum G2 and validated against laboratory pull-out tests under crack-free conditions. Two burial-depth ratios, H/B = 3 and 8, were examined, and 360 cases were generated by varying normalized crack depth (h/B = 0.25–3), spacing (s/B = 0.25–3), and horizontal offset (d/B = 0–6). Under shallow burial, cracks readily intersect the potential sliding zone and the maximum capacity reduction reaches 81.6%, with pronounced transitions around s/B = 1 and d/B = 1. Under deep burial, the principal failure surface remains predominantly a deep elliptical arc and capacity reduction is generally below 15%. Burial depth therefore controls the spatial overlap between the environmentally damaged zone and the anchor-bearing zone. The results provide a mechanical basis for post-drought crack inspection, uplift-safety reassessment, and burial-depth selection. Hydraulic infiltration, suction, moisture evolution, and rainfall intensity are outside the present model.
1. Introduction
Prolonged high-temperature drought followed by intense rainfall is an extreme environmental scenario that warrants particular attention in shallow underground engineering. For near-surface cohesive-soil foundations that exchange heat and moisture strongly with the atmosphere, antecedent drought can impair soil integrity through sustained water loss, shrinkage, and cracking, leaving the foundation already damaged when subsequent loading occurs. Robinson and Vahedifard [1] discussed weakening mechanisms including desiccation cracking, strength changes, and ground settlement under multiyear extreme drought, and noted that similar processes may threaten soil-contact infrastructure. Zhang et al. [2,3,4] investigated discontinuity-related behavior and environmental damage in geomaterials. Tang et al. [5] further synthesized relationships among environmental conditions, shrinkage constraints, and crack evolution. Thus, even after a drought has ended, drying-induced cracks may continue to affect the subsequent foundation response, and anchorage-safety assessment requires clarification of how environmentally induced loss in soil integrity alters anchor-plate uplift resistance.
This issue is particularly relevant to intense rainfall following drought. Pre-existing cracks can act as preferential infiltration pathways and modify rainwater entry and pore-water-pressure development. Luo et al. [6] showed that dynamic changes in desiccation cracks affect preferential flow and moisture exchange between cracks and the soil matrix. Changes in the groundwater level and hydraulic gradient around underground structures also alter buoyant actions. Model tests by Ren et al. [7] showed that pore-pressure responses to rising water head are time-dependent and related to uplift-pressure development. Post-drought safety reassessment should therefore consider both resistance remaining after environmental damage and uplift demand induced by water-level changes. For structures using plate anchorage, evaluating crack effects on anchor capacity is a necessary step in understanding the resistance side of this hazard process.
The drying–wetting cracking characteristics of red clay provide a clear soil-specific context. Xie et al. [8] revealed links between crack development and strength-parameter changes in red clay under drying–wetting cycles. Péron et al. [9] showed that boundary restraint and moisture gradients can generate tensile-stress accumulation and induce cracking. Tang et al. [10] demonstrated that temperature, soil-layer thickness, and drying–wetting cycles influence crack geometry, while subsequent work revealed structural reorganization and crack-morphology changes under cyclic action [11]. Zeng et al. [12] found that the volumetric crack ratio correlates more strongly with red-clay unconfined compressive strength than the surface crack ratio. These findings indicate that drought-damage assessment should consider the spatial development of cracks into the soil mass. For a locally loaded anchor plate, whether crack position and depth intersect the principal load-bearing zone therefore requires further investigation.
Anchor embedment depth is a key geometric factor linking the environmentally cracked zone to the uplift failure zone. Cañizal et al. [13] identified different strip-anchor failure mechanisms at different embedment depths, demonstrating that embedment changes the volume of soil mobilized in uplift and associated slip paths. In a foundation affected by surface desiccation cracks, embedment additionally controls the relative positions of the anchor-bearing and cracked zones. When cracks enter a potential slip region, soil continuity and load-transfer paths may be disrupted. Whether increasing embedment reduces this effect depends on crack depth, lateral distribution, and their spatial relationship with the failure zone. Embedment selection after extreme environmental action should therefore compare intact and post-cracking capacities to identify conditions particularly sensitive to crack disturbance.
Numerical analysis provides a means of quantifying these spatial relationships. Sloan [14] systematically reviewed finite-element limit analysis for geotechnical stability problems. Makrodimopoulos and Martin [15] applied second-order cone programming to lower-bound limit analysis of cohesive–frictional materials. Ye et al. [16] investigated strip-anchor pull-out in strain-softening marine soils and analyzed effects of embedment, inclination, and softening on capacity and progressive failure. These studies advanced ultimate-load calculation and failure-mechanism identification, but do not directly resolve interaction between multiple environmentally induced surface cracks and the anchor-bearing zone. Under double-crack conditions, the soil between cracks and its position relative to the anchor may jointly influence uplift mechanisms, requiring unified comparison of crack configurations and embedment depth.
For process safety and prevention, crack research can also support decisions after damage is detected. Xu et al. [17] used distributed fiber-optic sensing to relate soil shrinkage strain to the spatiotemporal evolution of cracks and explored early detection. Pei et al. [18] proposed an early-warning model for desiccation cracking based on optical frequency-domain reflectometry monitoring. Such approaches can identify environmentally induced cracking, but mechanical analysis is still required to determine whether detected cracks materially affect anchorage capacity. For sites that have experienced prolonged drought, crack depth, spacing, and position relative to the anchorage system can therefore be used as inputs to safety reassessment before intense rainfall, connecting environmental monitoring and damage identification with anchorage-safety assessment and preventive embedment-depth design.
International studies provide additional context. Merifield et al. [19] investigated plate-anchor stability in undrained clay. Tiutkin et al. [20] examined the strain state of soil bases strengthened with vertical elements, and Petlovanyi and Sai [21] investigated limit-state development around underground voids in stratified rock. These studies demonstrate the relevance of geometry to deformation and instability, but their soil, reinforcement, or rock-mass assumptions differ from the present cracked red-clay anchor problem; they are not used to calibrate its crack dimensions or capacity.
Accordingly, this study examines how burial depth regulates the effects of pre-existing double cracks on strip-anchor uplift resistance. Compared with a single crack, a crack pair introduces the spacing between defects and an intervening soil region, while the pair offset changes its symmetry relative to the anchor. The focus is on how these geometric variables alter capacity and failure-zone morphology at two embedment ratios. Quantifying non-additivity relative to single-crack cases would require additional matched comparisons.
A horizontal strip anchor plate embedded in red clay containing two surface cracks is therefore investigated using a two-dimensional plane-strain Optum G2 model. Following validation under crack-free conditions, uplift responses are compared at H/B = 3 and 8. By varying crack depth, spacing, and horizontal position relative to the anchor, 360 cases are analyzed using ultimate uplift capacity and equivalent-strain distributions. The present study isolates the resistance-change stage after cracking: the two cracks are geometric idealizations and soil parameters and loading conditions are held constant. Temperature, water content, suction, seepage evolution, and the relationship between crack dimensions and a specific meteorological event are outside the present scope. The results provide a mechanical reference for post-drought anchorage-hazard identification and embedment selection, and a basis for future hydro-mechanical safety assessment under intense rainfall following drought.
2. Numerical Simulation Experiment
To systematically investigate the influence of burial depth on the uplift bearing capacity and failure mode of strip anchor plates with double surface cracks in red clay, this study conducted a numerical simulation using the Optum G2 geotechnical engineering software. This software combines finite element analysis (FEA) and limit analysis and is suitable for two-dimensional plane-strain problems. It can effectively handle the nonlinear behaviors and stress singularities in geotechnical mechanics.
In this study, a horizontal strip anchor plate (width B = 0.6 m, thickness 0.06 m) was used as the simulation object. The anchor plate was set as a rigid body. The soil constitutive model adopted the Mohr–Coulomb yield criterion and combined with the non-associated flow rule (expansion angle ψ = 0°) to accurately describe the shear failure and volume change. The size of the soil domain is 12 m wide and the depth of the anchor plate is +4.8 m. The load application method is to apply a uniformly distributed elastic-plastic multiplier load to the upper part of the anchor plate to limit rotation and horizontal displacement, thereby simulating the pure uplift state. Vertical and horizontal constraints are applied at the bottom, and horizontal constraints are applied at the sides. In addition, the anchor–soil interface is modeled with a smooth contact condition, and the friction reduction coefficient is set to 0, allowing separation during the drawing process. The grid adopts a 6-node Gaussian element, and a fan-shaped grid is arranged at the corner of the anchor plate to optimize the accuracy near the singular point. At the same time, an encryption zone is set around the anchor plate and the crack to improve the calculation accuracy. The grid outside the encryption area is automatically generated in an adaptive manner to ensure a balance between computational efficiency and accuracy.
In order to simulate the typical shrinkage cracks formed by red clay under extreme dry–wet cycles, two cracks perpendicular to the surface were introduced and the crack width was fixed at 0.01 m to ensure the stability of the calculation. The red clay parameters are set based on the indoor test results, as shown in Table 1.
Table 1.
Numerical simulation of soil parameters.
The parametric study uses the control variable method to systematically study the variation depth ratio (H/B = 3,8, representing shallow burial and deep burial, respectively), crack depth (h/B = 0.25, 0.5, 1, 1.5, 2,3), crack spacing (s/B = 0.25, 0.5, 1, 1.5, 3) and crack offset (d/B = 0, 0.25, 0.5, 1, 2, 6), generating a total of 360 working conditions. The ultimate bearing capacity is obtained by calculating the ultimate load, and the failure mode is analyzed using a von Mises equivalent strain cloud diagram.
3. Test Verification and Simulation Model Reliability Analysis
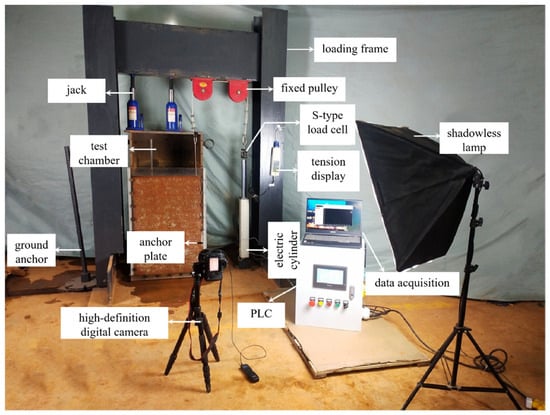
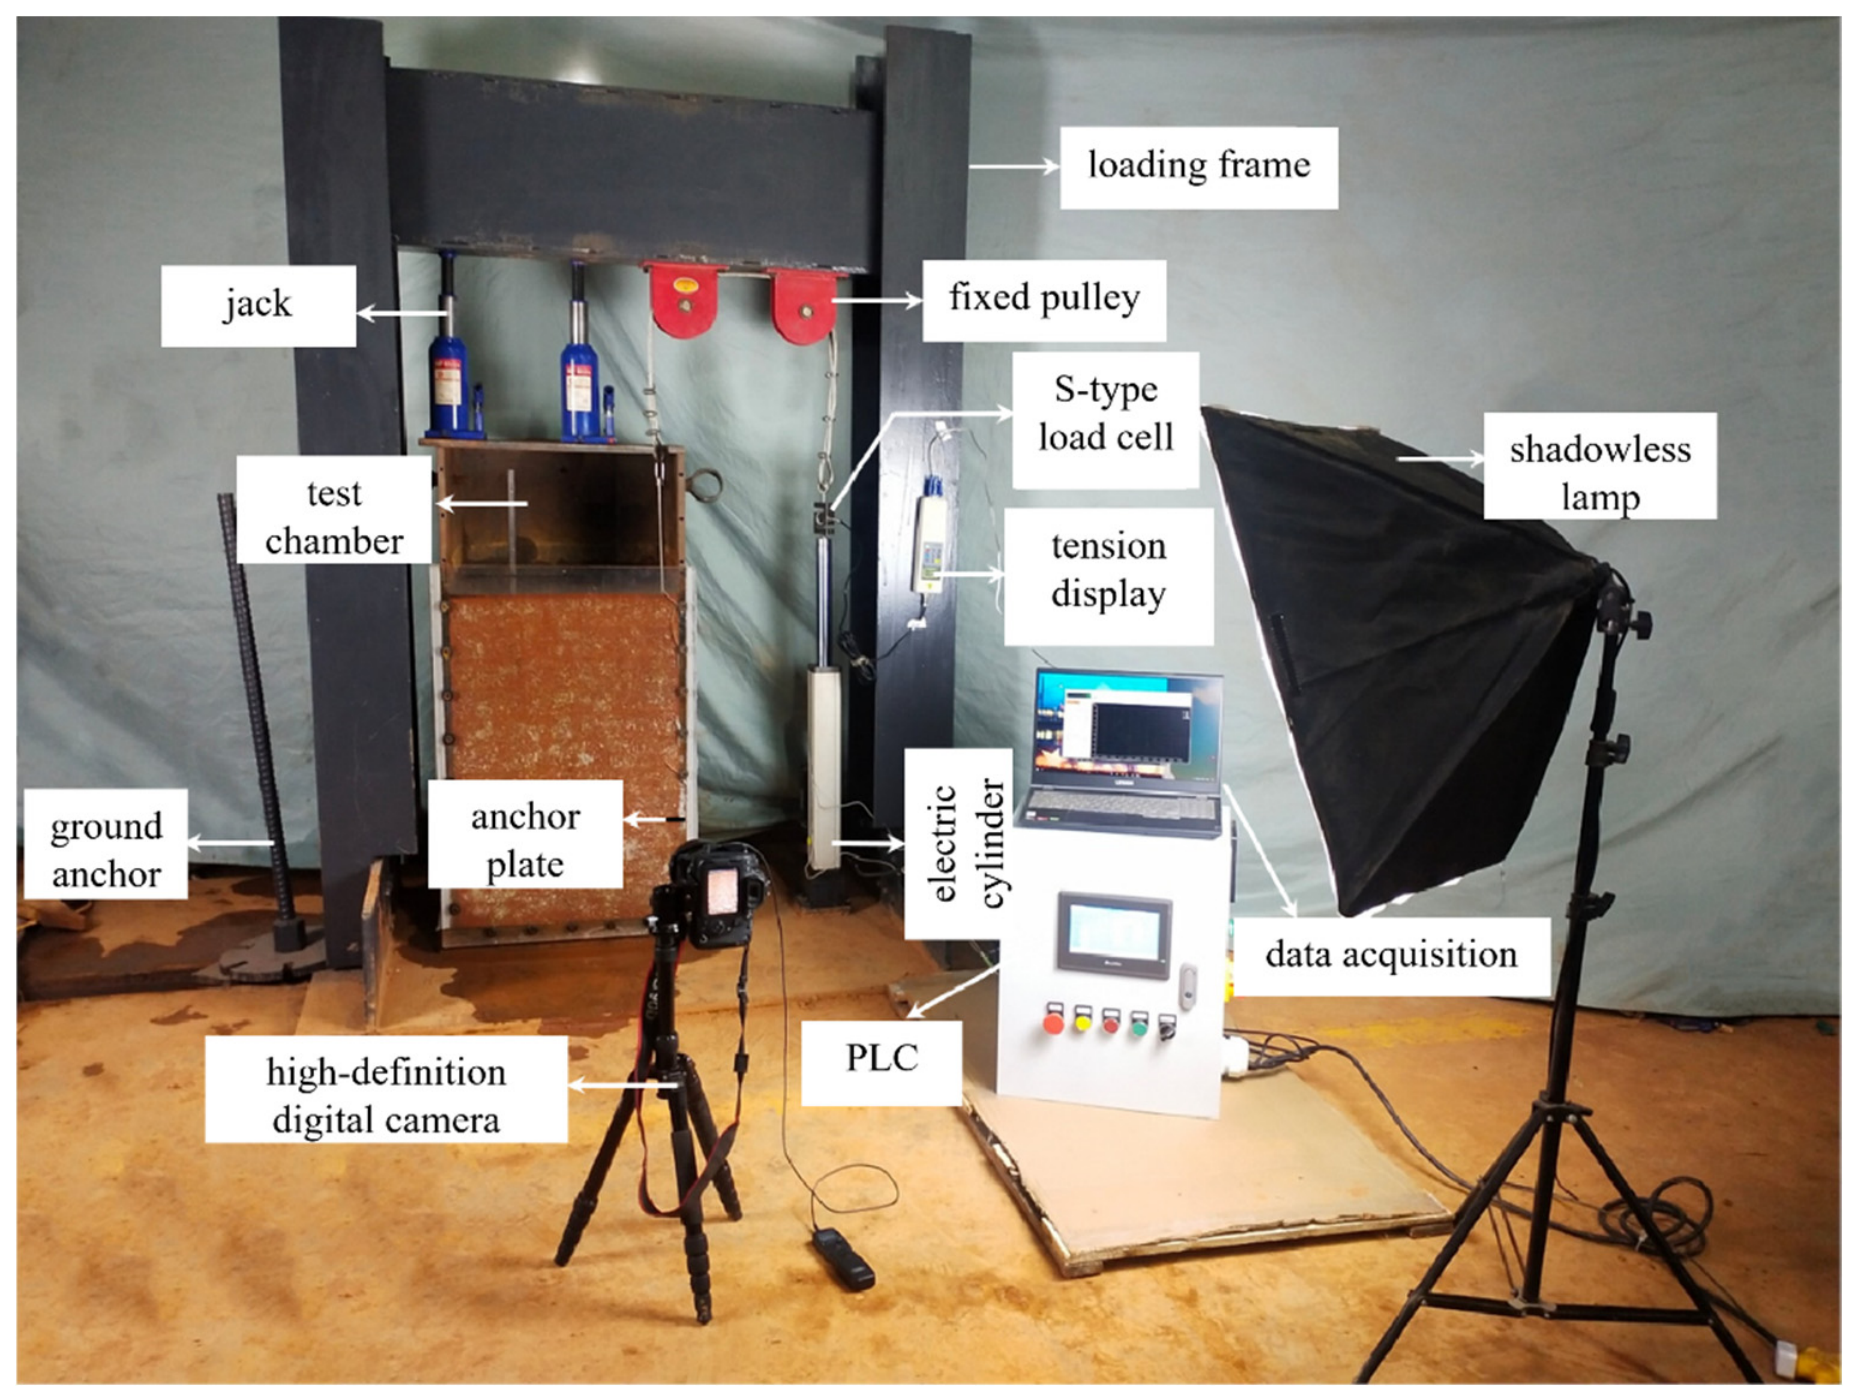
In order to verify the accuracy of the numerical model, the results of the indoor test and the numerical simulation test are compared under the condition of no crack. The indoor test uses a self-made model test device to perform the pull-out test on the strip anchor plate at different buried depth ratios (H/B = 2, 3, 4, 5, 6, 8, 10) in a saturated red clay foundation. The ultimate bearing capacity for the corresponding buried depth ratio is obtained, and all the working conditions are repeated by numerical simulation. The test device and numerical model are shown in Figure 1.
Figure 1.
Schematic of the Integrated Loading and Observation Test System.
The reported test-box dimensions are 500 × 500 × 1100 mm (length × width × height), with a 20 mm acrylic observation wall. A quarter-plate model of 304 stainless steel measures 210 × 30 × 10 mm; the corresponding full plate width is 60 mm. The soil beneath the plate is 240 mm thick, so the nominal H + 240 mm specimen depth ranges from 360 to 840 mm over H/B = 2–10, subject to the plate-level convention. The 500 × 500 mm plan dimensions are the reported box dimensions; independently surveyed clear dimensions are not given in the reference.
The reference soil was air-dried, broken down, and sieved through 10 mm openings, mixed at the optimum preparation water content of 22.1%, and conditioned under cover for 48 h. It was compacted in 60 mm layers to 90% of the maximum dry density of 1.73 g/cm3, followed by inundation for saturated testing. The preparation water content is not the measured final saturated water content. Uplift was imposed by a servo electric cylinder and pulley system at 0.01 mm/s. The HP-3K/S-type load measurement system had a 3 kN range, 0.1 N resolution, and stated accuracy of ±0.5%; displacement was monitored through the cylinder control system. Two tests were conducted at each embedment, with a third where necessary, and a representative curve was selected rather than a replicate mean.
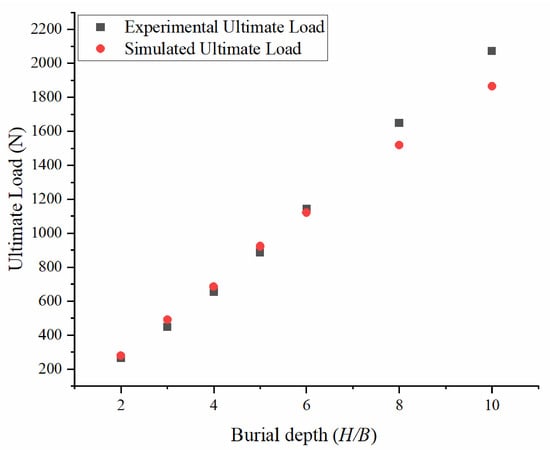
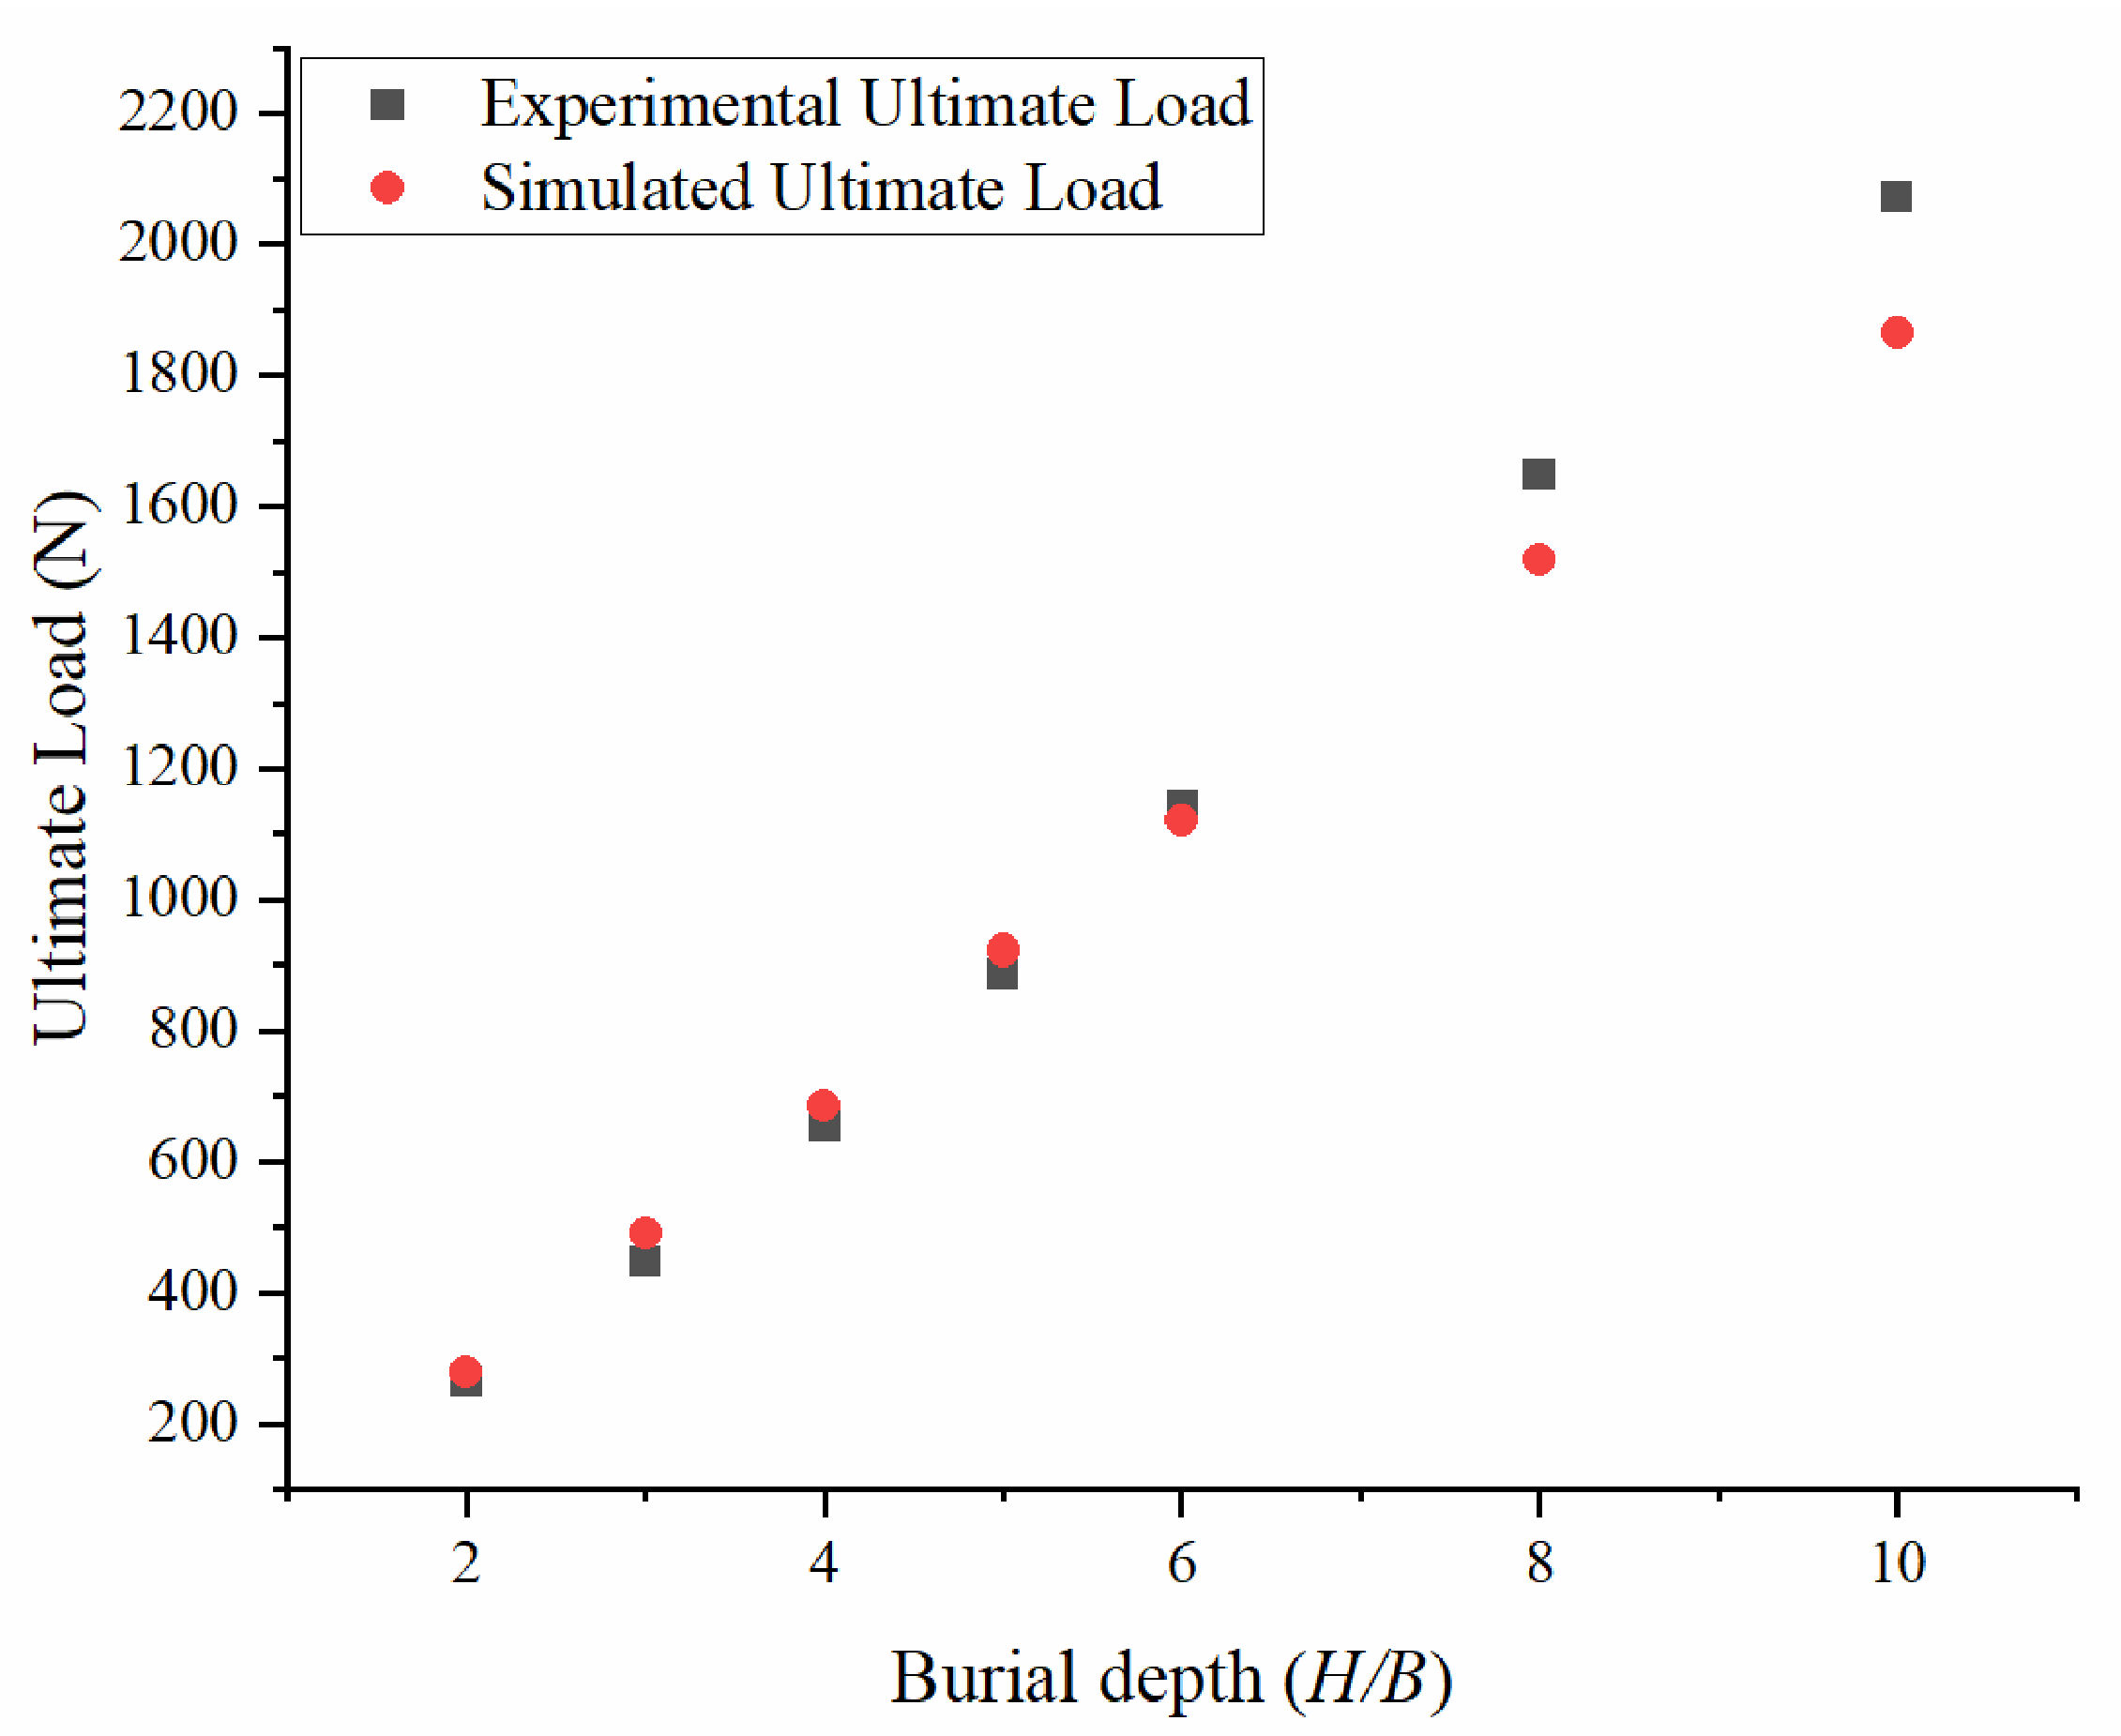
The variation in the ultimate bearing capacity with the buried depth ratio is shown in Figure 2. It can be seen that the numerical results not only accurately reproduce the overall trend of the nonlinear growth of the test data with increasing buried depth but also achieve a high degree of consistency in the numerical values, which confirms the reliability of the simulation results in this paper.
Figure 2.
Experimental and Simulation Data Comparison Chart.
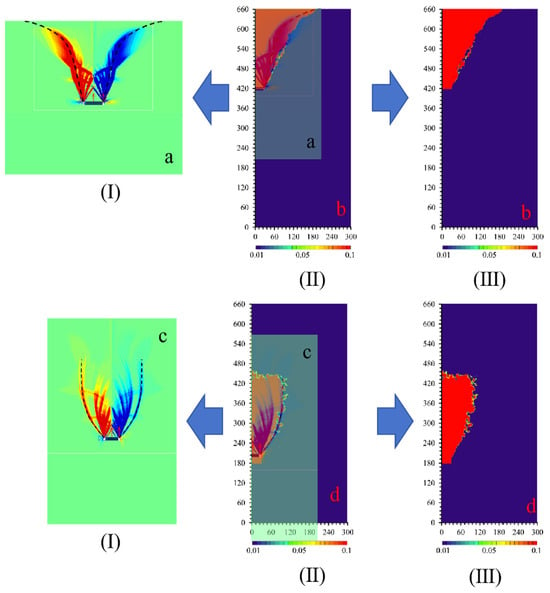
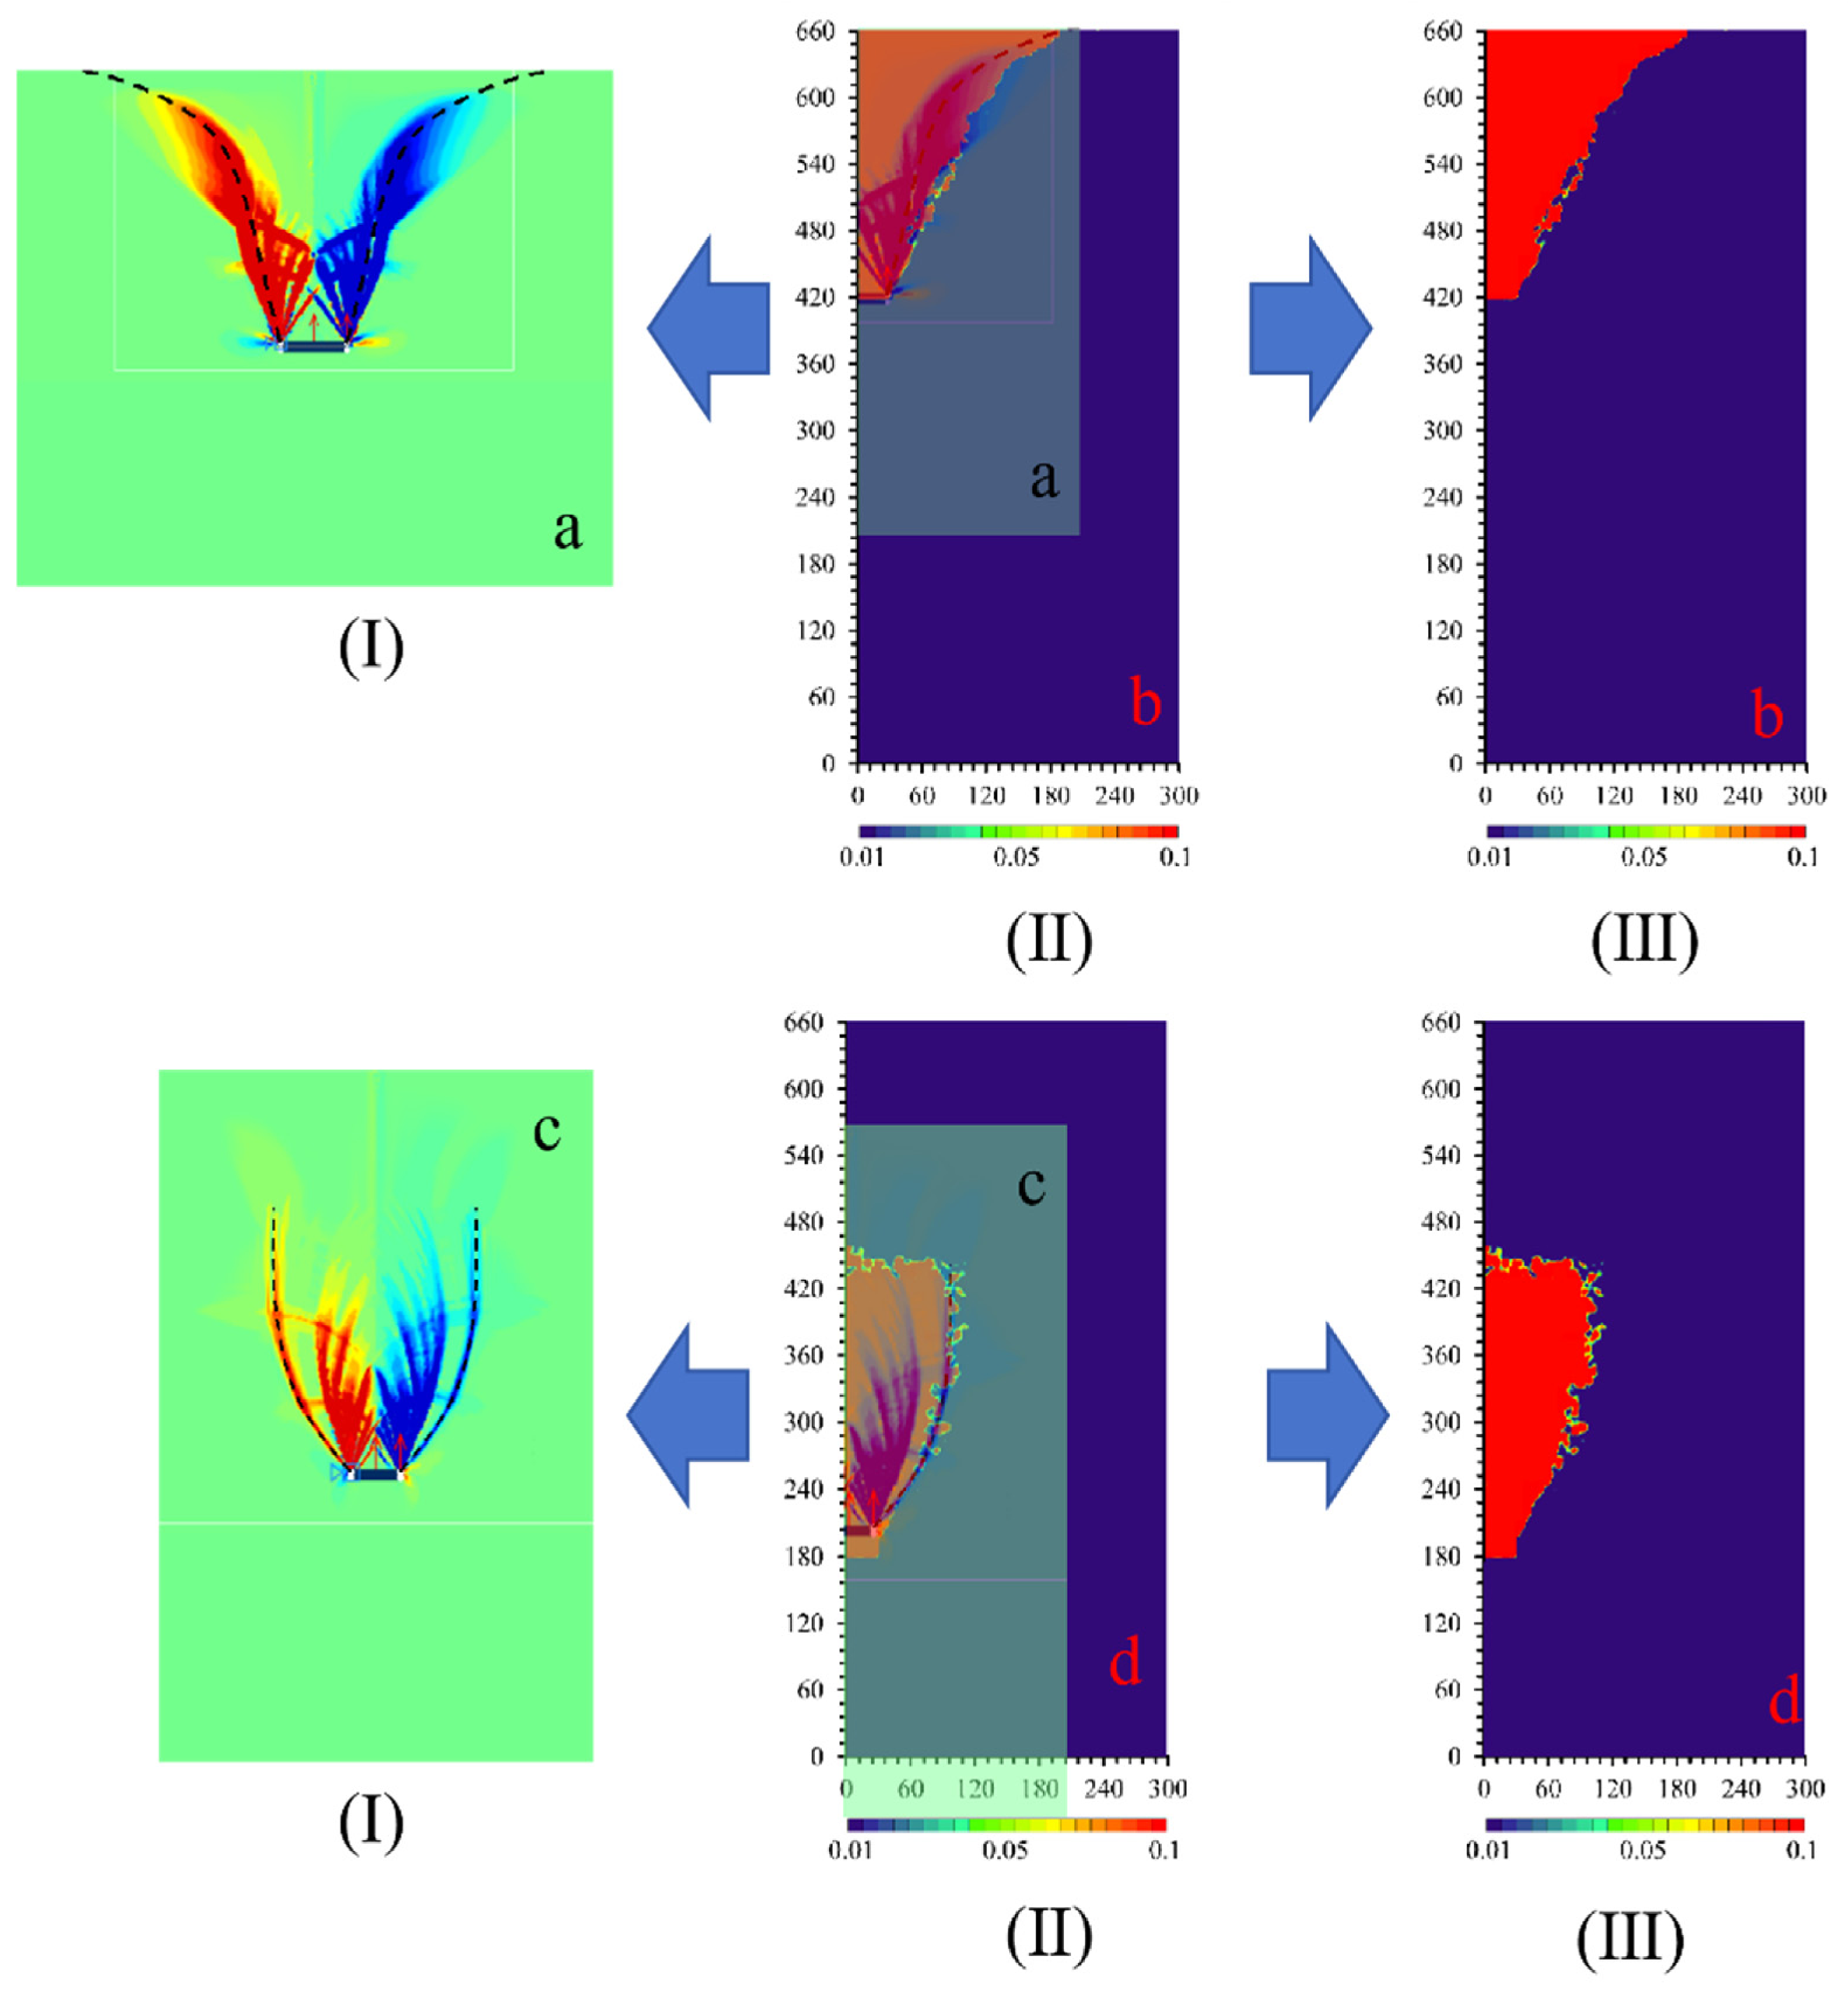
In order to further verify the model at the mechanical mechanism level, we carried out a qualitative comparative analysis of the strain cloud map. As shown in Figure 3, by selecting typical buried-depth conditions (such as shallow buried H/B = 3 and deep buried H/B = 8), the strain cloud diagram measured by the test is compared with the numerical simulation results. In this paper, the display interval of strain is set to 0.01~0.1. In geotechnical engineering, it is usually considered that the soil enters the failure strain category after strain ≥0.1, so the regional boundary of strain reaching 0.1 is regarded as the sliding surface. It is found that the main strain distribution patterns of the two results are highly consistent as shown in Figure 3a,b. The sliding surface extends downward from the loading point and diverges to both sides in an inverted outward curve shape, and the shape, curvature and inclination angle of the sliding surface basically coincide. In Figure 3c,d, both sliding surfaces are partially elliptical circumferential curves and the strain gradient directions are almost the same. The bottom range is also highly consistent with the boundary contour. The experimental cloud image shows a slight burr-like boundary due to the material’s microscopic inhomogeneity, while the simulated cloud image boundary is smoother and the envelope deviation between the two is very small. The above macroscopic limit load change scatter plot is consistent, and the microscopic strain field form is highly consistent, which together constitute a complete multi-scale verification closed loop, which fully proves that the numerical model is not only reliable in the overall bearing capacity prediction, but also can achieve high-fidelity reproduction in the strain field distribution mechanism.
Figure 3.
Comparison of simulated (a,c) and experimental (b,d) von Mises equivalent strain fields at shallow burial depth H/B = 3 (a,b) and deep burial depth H/B = 8 (c,d). The subplots in Rows (I–III) at the upper part of Figure 3 show the equivalent strain fields under the shallow burial condition (H/B = 3). Among them, Column (I) presents numerical simulation results, Column (II) shows the comparison between simulation and experiment, and Column (III) gives experimental test results. Subplot (a) is the simulation result, and subplot (b) is the experimental result. The subplots in Rows (I–III) at the lower part of Figure 3 show the equivalent strain fields under the deep burial condition (H/B = 8). Among them, Column (I) presents numerical simulation results, Column (II) shows the comparison between simulation and experiment, and Column (III) gives experimental test results. Subplot (c) is the simulation result, and subplot (d) is the experimental result.
Through the double verification of the macroscopic mechanical response (ultimate load) and microscopic strain field characteristics (cloud map distribution), a complete model verification closed loop is formed. This multi-scale and multi-dimensional verification method not only verifies the predictive ability of the numerical model for the overall bearing capacity of the structure but also ensures that it can accurately reflect the local mechanical behavior such as crack interaction.
4. Operating Condition Analysis
Based on model verification, this section adopts the macro-quantitative-meso-interpretation analysis path of and studies the parameter sensitivity and failure mechanism according to the buried-depth conditions (shallow buried H/B = 3 and deep buried H/B = 8). Firstly, the influence of crack spacing, depth and offset on the ultimate bearing capacity and the characteristic inflection point is quantitatively revealed by the parametric scatter diagram. Then, the von Mises equivalent strain cloud map is used to analyze the corresponding failure mode, strain zone evolution and crack interaction mechanism, which provides the microscopic mechanistic support for the macroscopic trend and sensitivity change in the data map, and realizes the mutual confirmation of the two and the selection of the cloud map is highly representative.
4.1. Analysis of Coupling Effect of Crack Parameters Under Shallow Buried Condition
The following analysis is expanded by spacing group, depth group, and offset group. Based on the analysis of the macroscopic scatter plot, the response law of the bearing capacity to the crack parameters can be basically divided into three categories. Therefore, the cloud images corresponding to these three typical depths (or spacing) are selected for analysis to reveal the evolution of the mesoscopic failure pattern underlying the macroscopic trend.
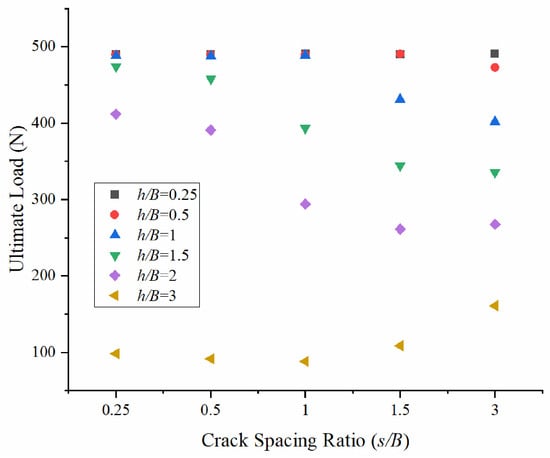
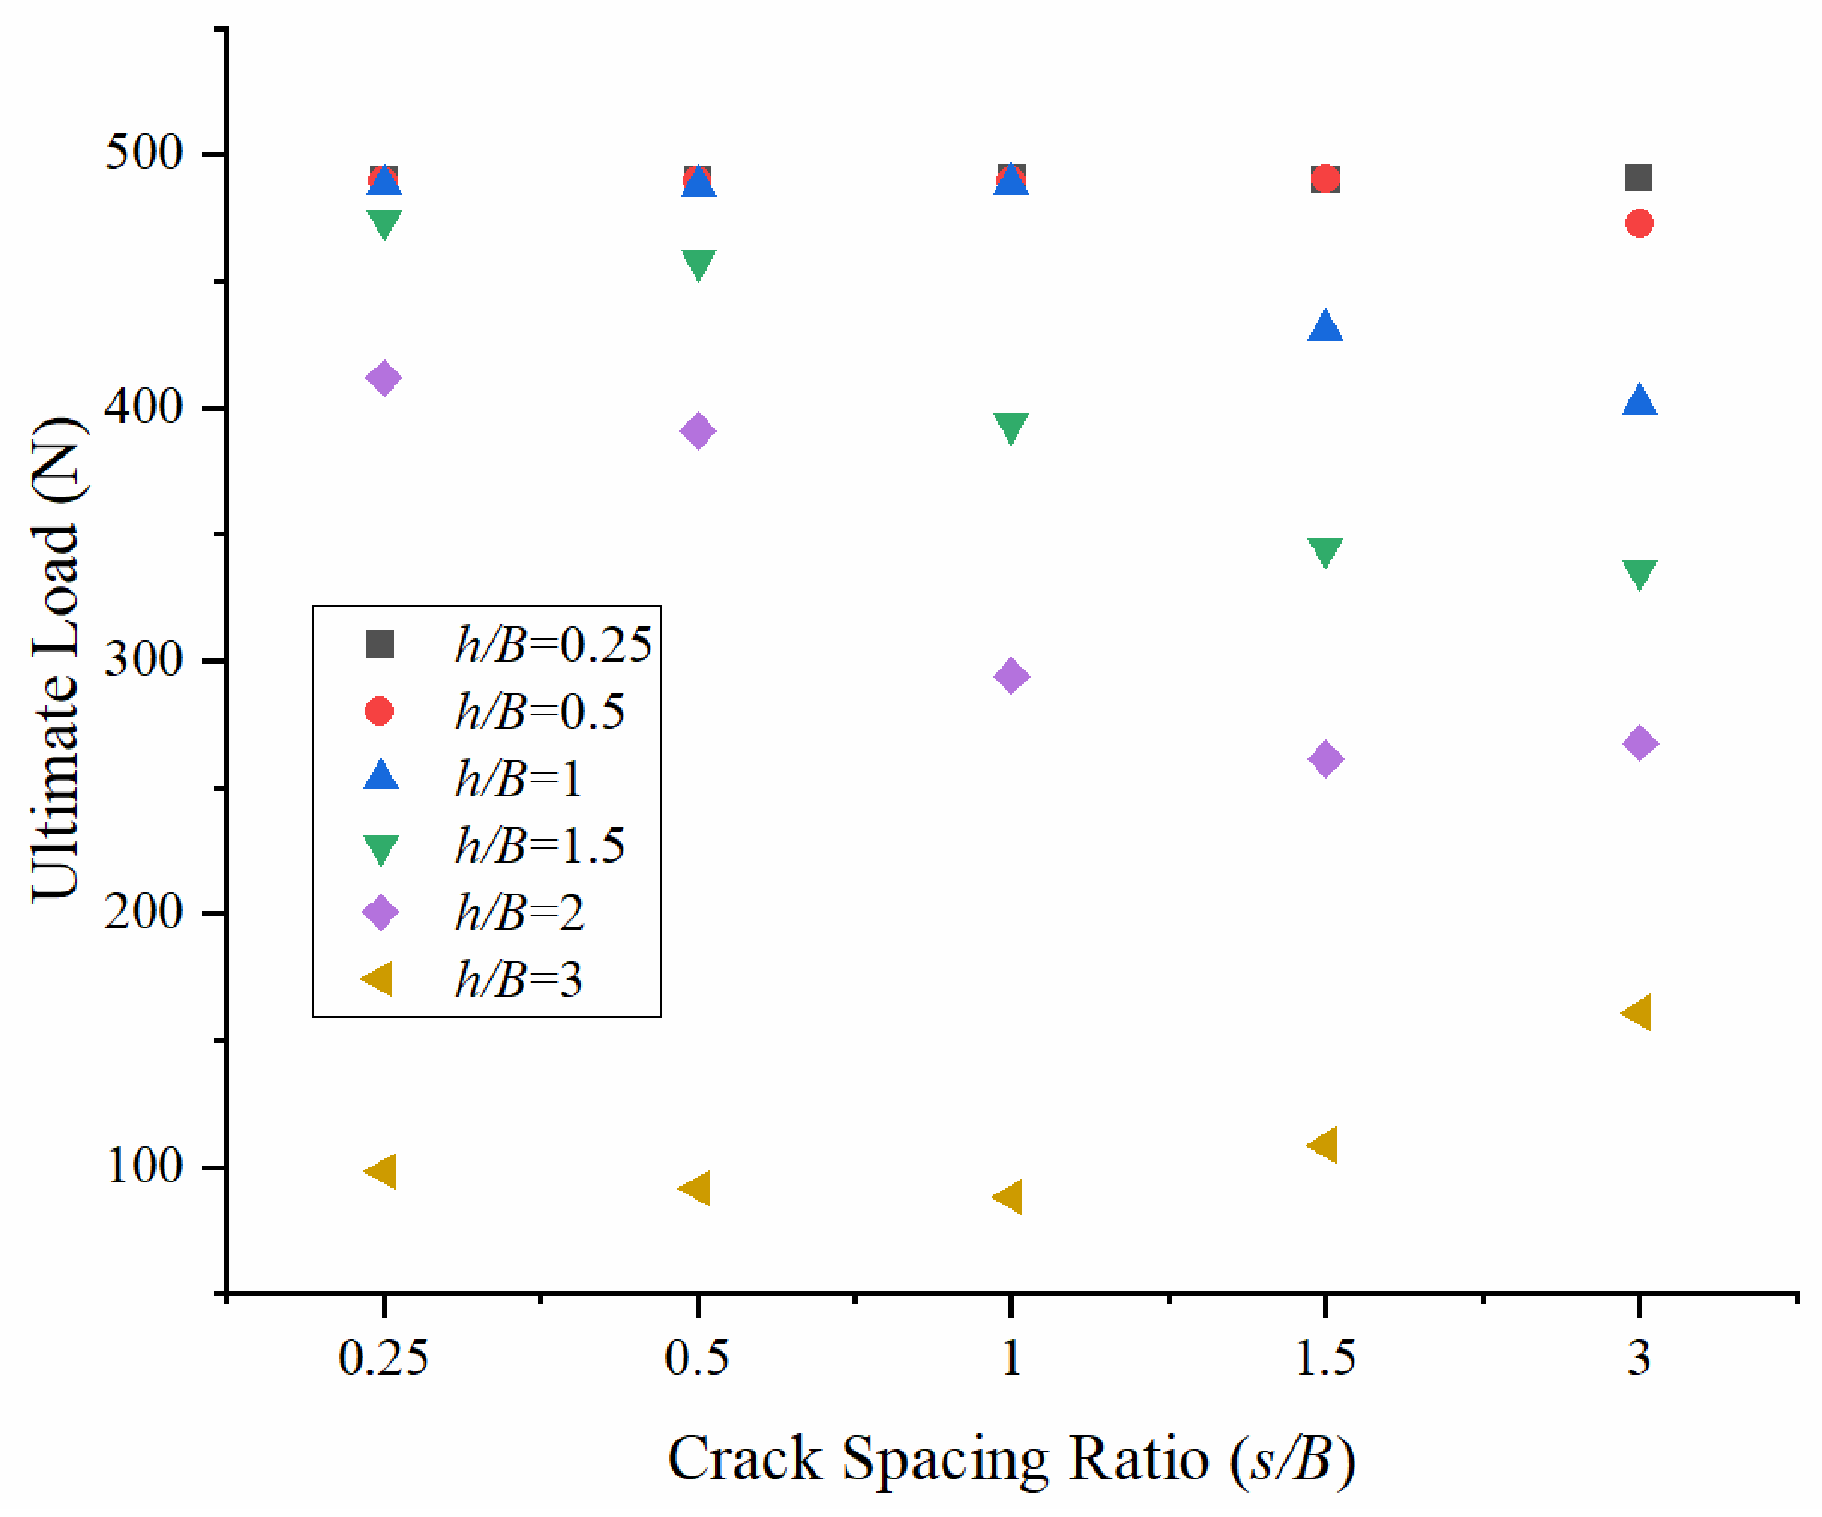
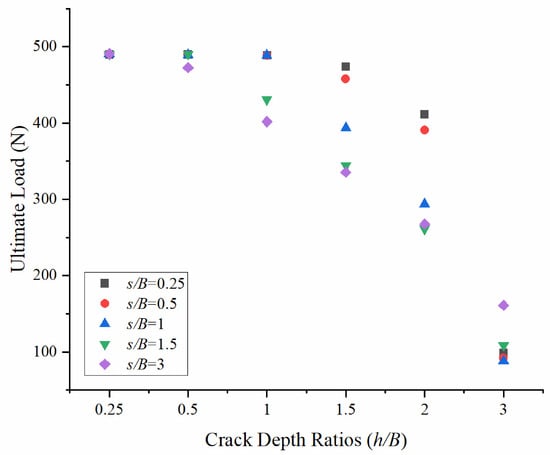
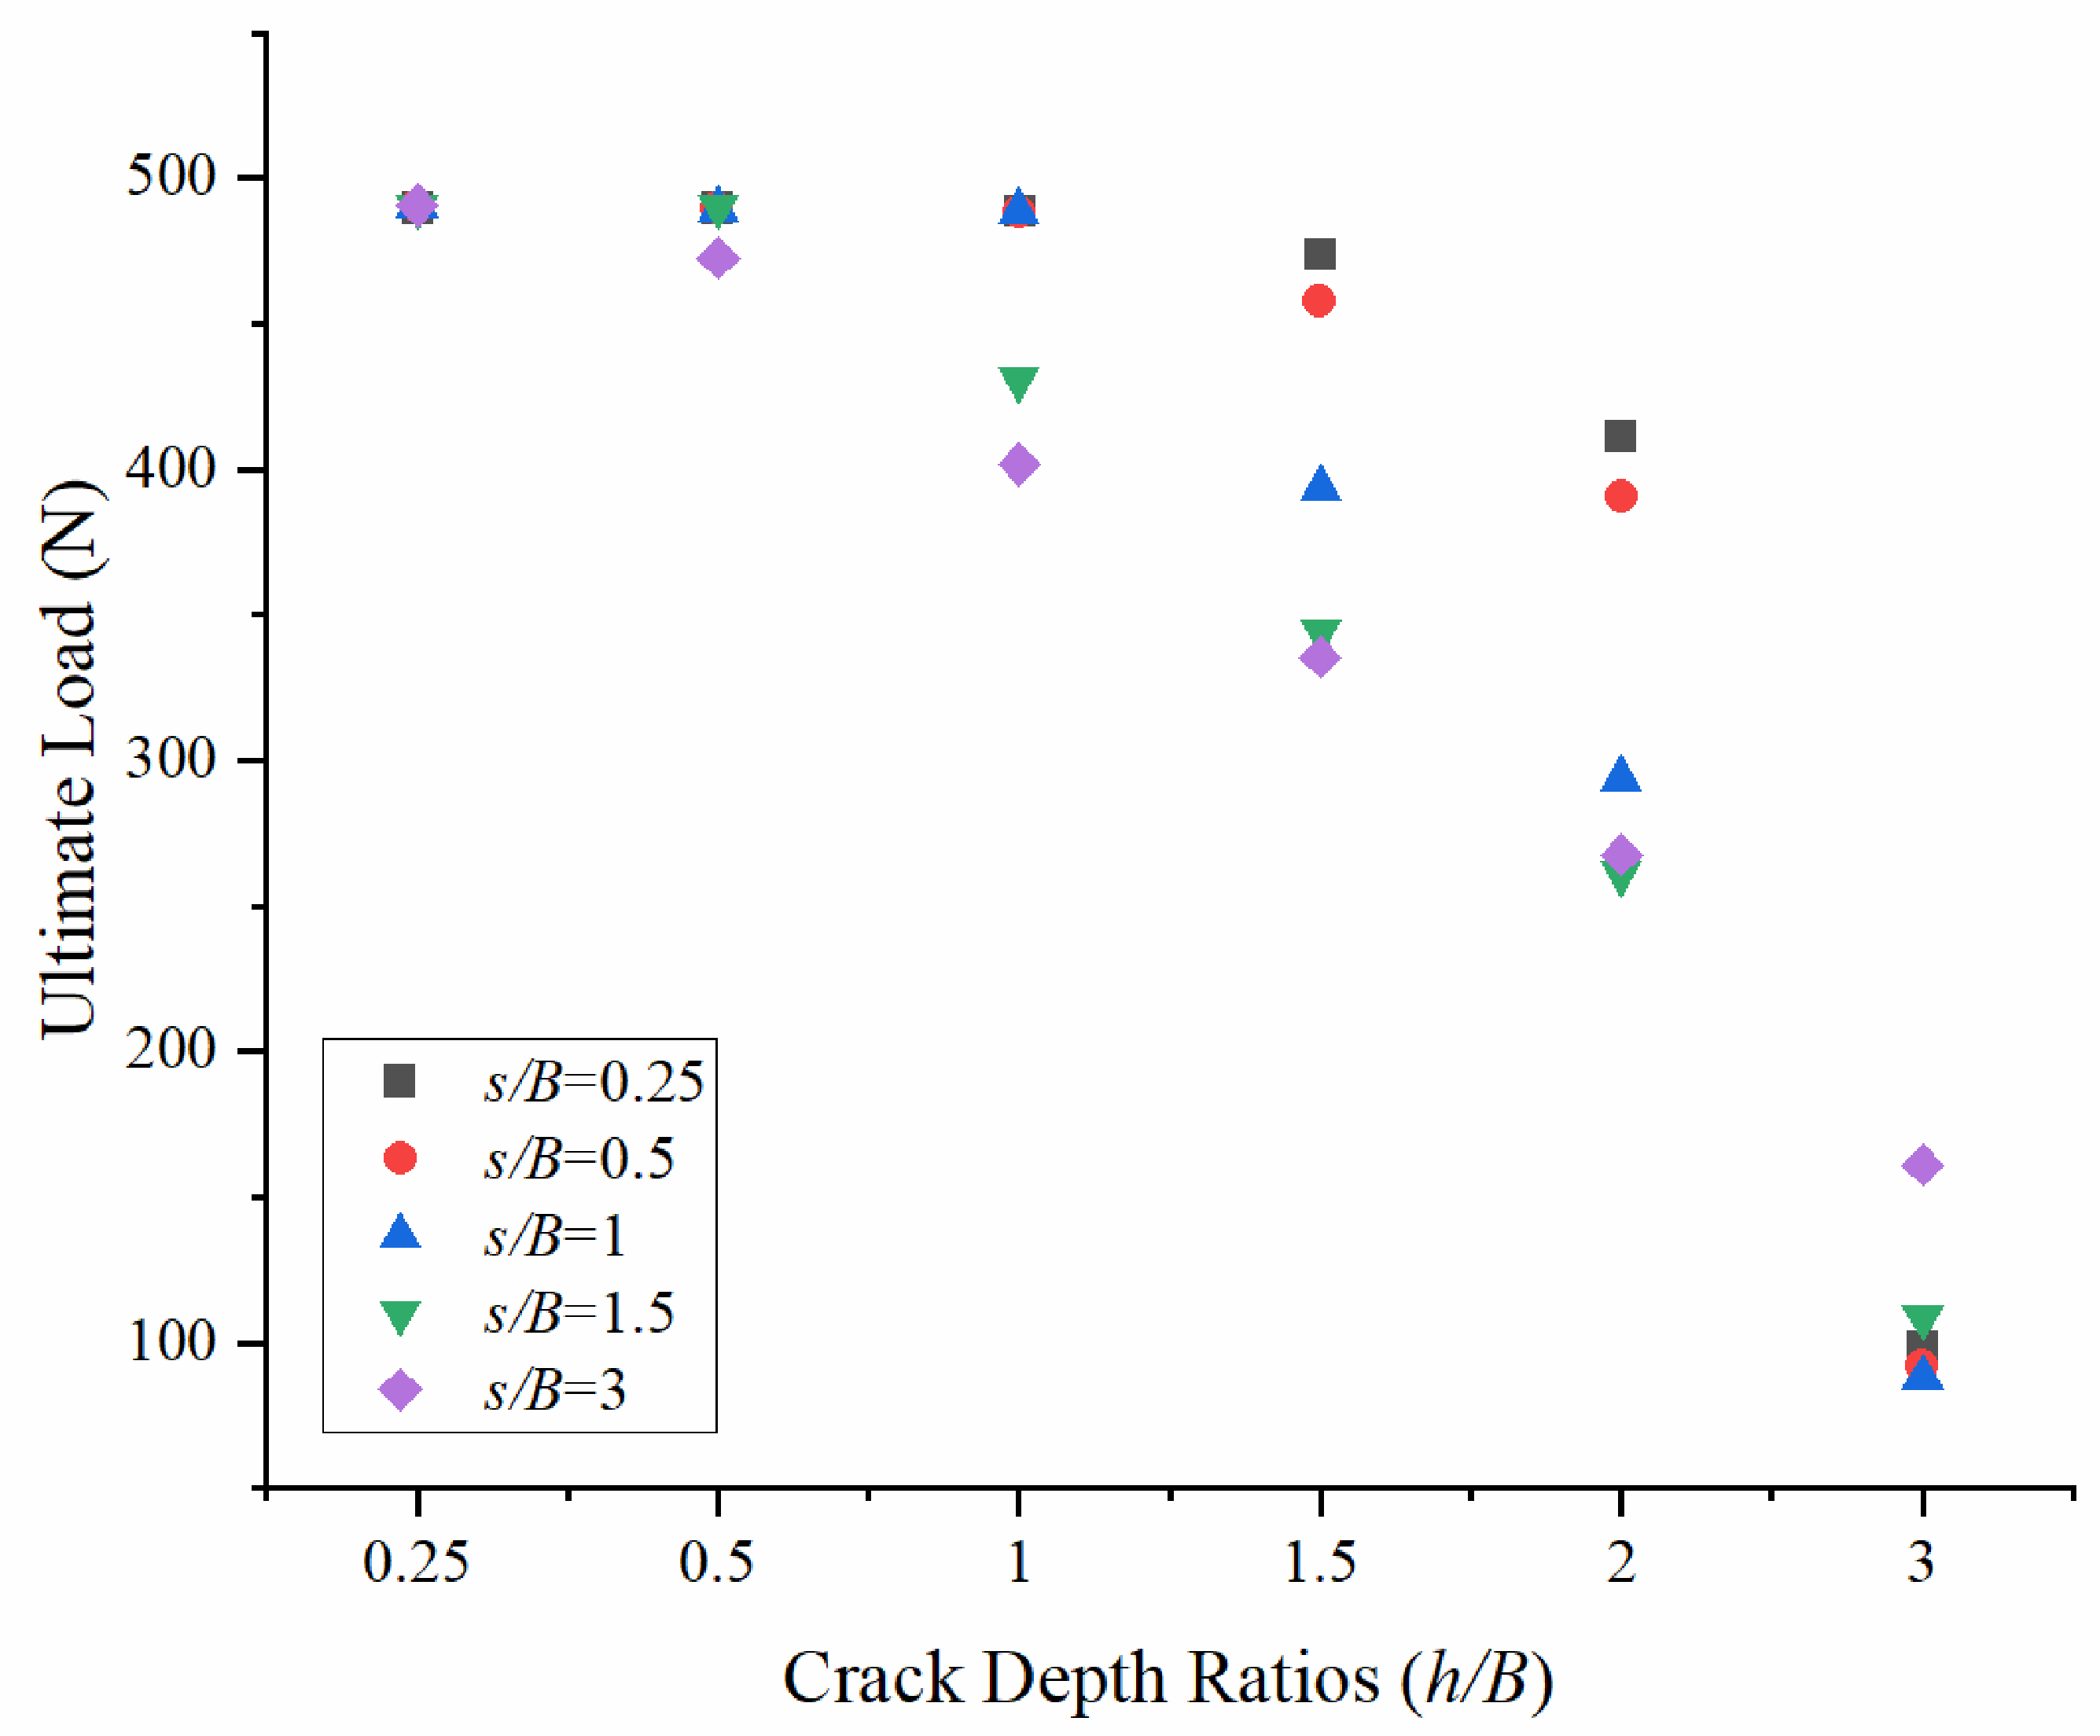
It can be seen from Figure 4 that, under the condition of shallow burial (H/B = 3), the ultimate bearing capacity of red clay as the crack spacing s/B changes can be divided into three categories according to the crack depth h/B: h/B ≤ 0.5, 1 ≤ h/B ≤ 2, h/B = 3. When h/B ≤ 0.5, the ultimate bearing capacity fluctuates in the range of 472 ~ 493 N with an increase in s/B, and the maximum fluctuation range is only 3.6%. When 1 ≤ h/B ≤ 2, it is negatively correlated with an increase in s/B, and the slope changes significantly at s/B = 1 (the decrease rate increases). When h/B = 3, the bearing capacity is significantly reduced to the range of 87~161 N, which is 81.6% lower than the previous group. The turning point is s/B = 1, which is negatively correlated when s/B ≥ 1 and positively correlated when s/B ≤ 1.
Figure 4.
Effect of Crack Spacing Ratio (s/B) on ultimate load under different Crack Depth Ratios (h/B).
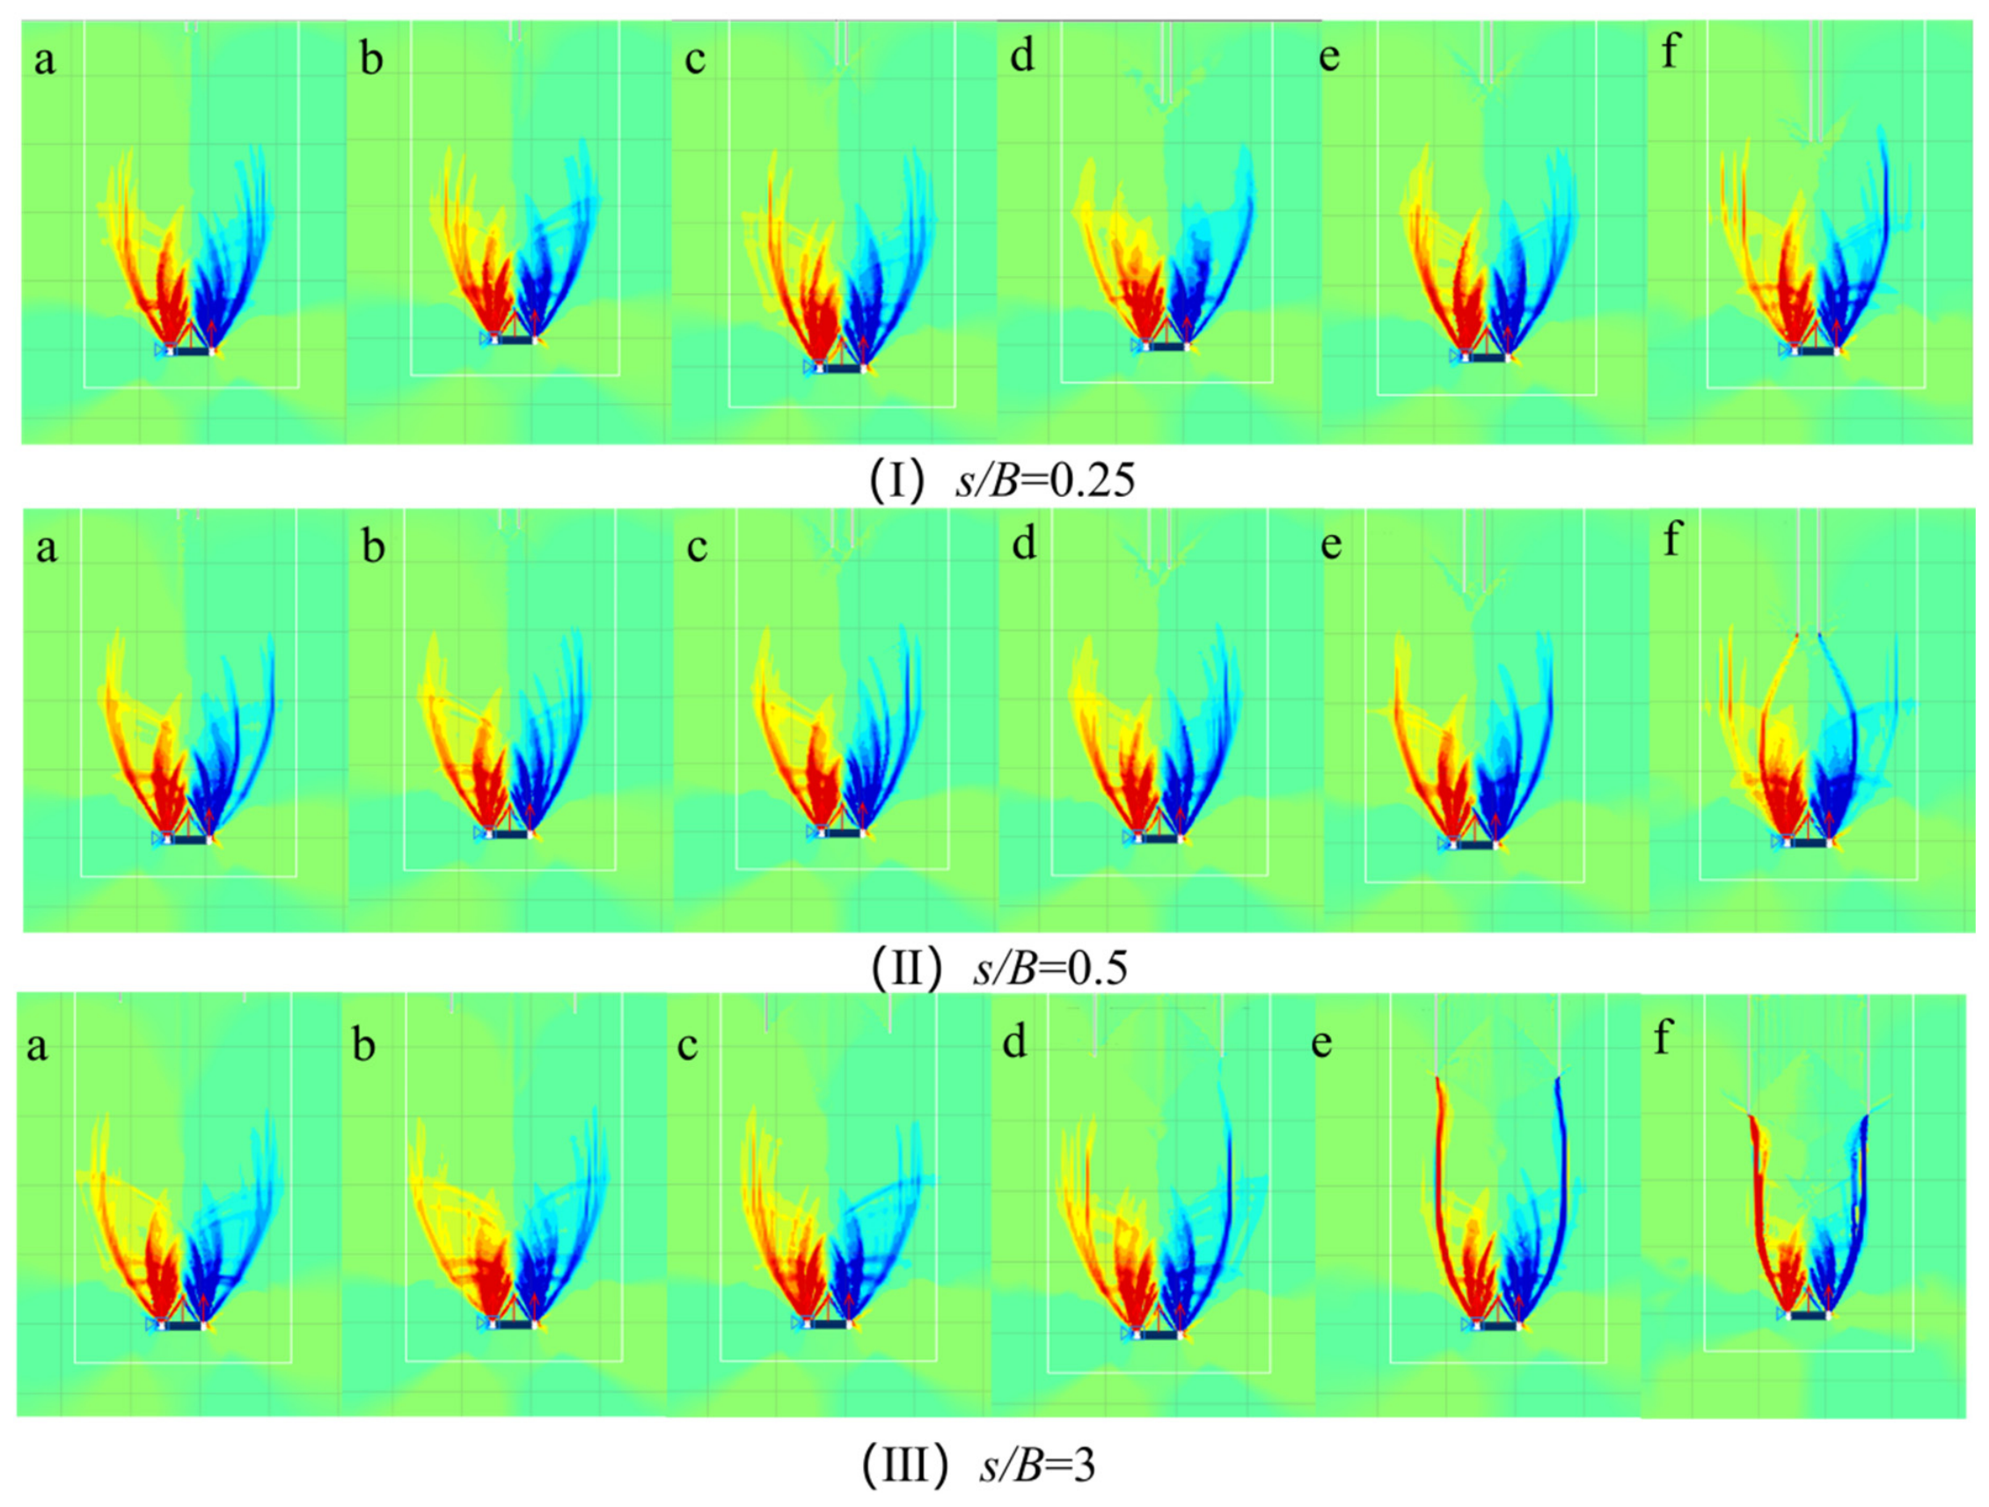
From Figure 5, it can be seen that the microscopic mechanism underlying the above macroscopic trend should be established at the same time for h/B ≤ 0.5 (subgraph I), no matter how s/B changes, the shape of the sliding surface is almost unchanged, all of which are complete inverted cambered arcs. There is no significant connection between the crack and the sliding surface, and the high-strain zone (≥0.1) is concentrated on the edge of the anchor plate, so the fluctuation of bearing capacity is very small in 1 ≤ h/B ≤ 2 (subgraph II), with the increase in s/B, the angle between the two sides of the sliding surface and the anchor plate increases continuously. When s/B = 0.25 and 0.5, there is no significant change in the shape of the sliding surface. At s/B = 1, cracks begin to connect with the sliding surface, forming a penetrating surface, thereby increasing in the rate of bearing capacity reduction. When h/B = 3 (subgraph III) and s/B ≤ 1, a long strip sliding surface is formed on both sides of the anchor plate. As the spacing increases, the crack gradually coincides with the sliding surface to form a penetrating surface, and the bearing capacity gradually weakens. When s/B ≥ 1, the cracks gradually leave the anchor plate, and the sliding surface begins to disappear. When s/B = 3, the penetrating surface almost completely disappears, and the bearing capacity begins to recover. The evolution of the three sets of cloud images strongly confirms the three types of macroscopic laws in Figure 4 and the mechanism of the turning point of s/B = 1.
Figure 5.
Equivalent Strain Contours under varying crack depth (h/B) and Crack Spacing Ratios (s/B = 0.25, 0.5, 1, 1.5, 3 for Subplots (a–e), respectively).
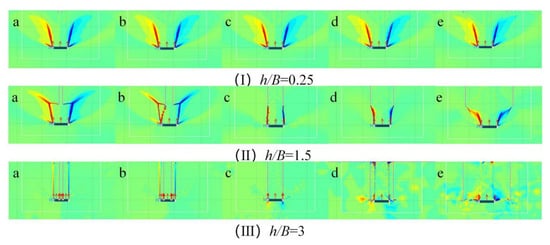
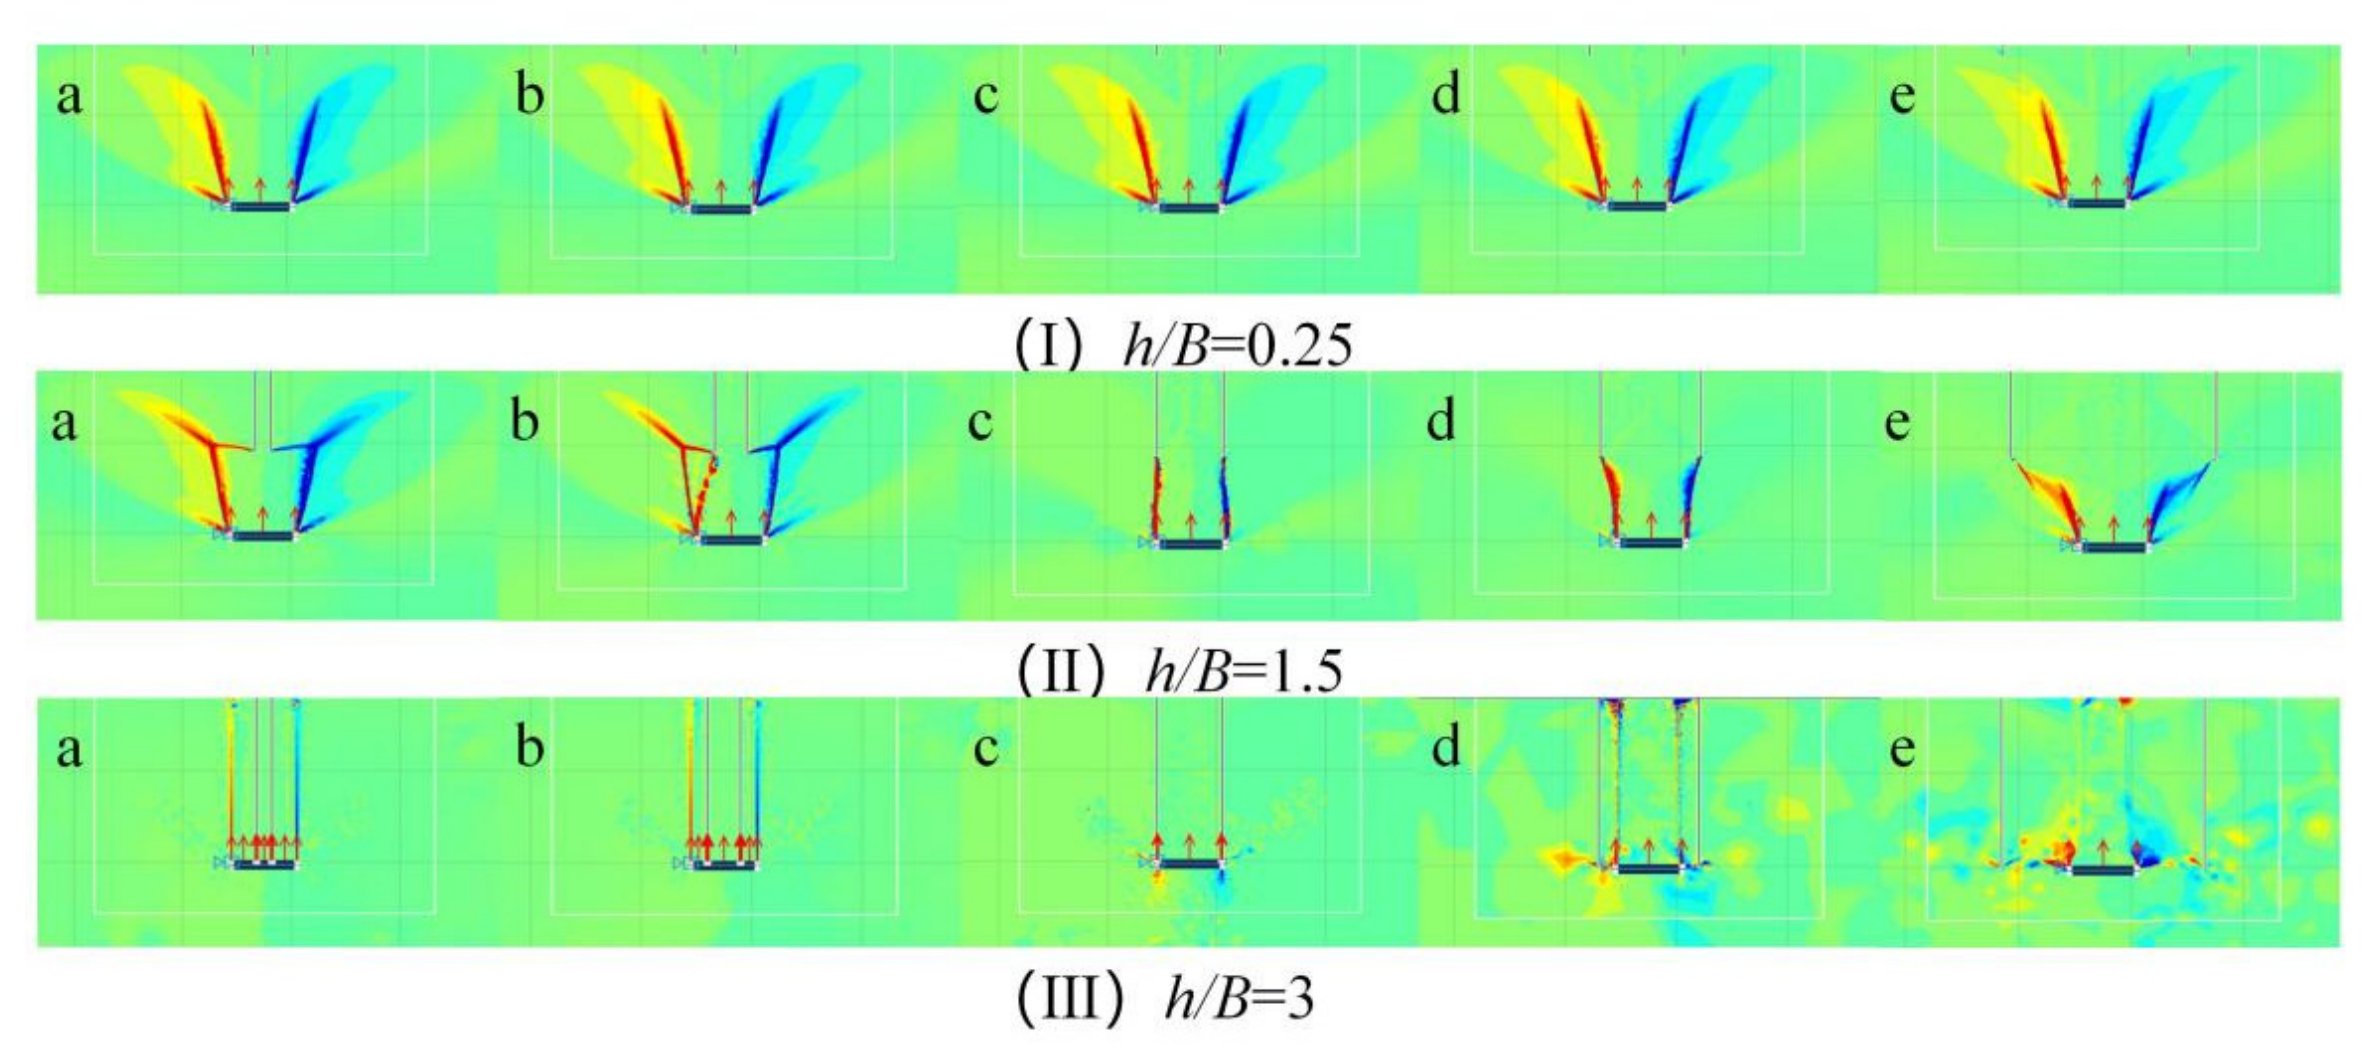
It can be seen from Figure 6 that the change in ultimate bearing capacity of red clay with increasing crack depth h/B under the shallow burial (H/B = 3) is divided into three categories according to the crack spacing s/B: the trend for s/B = 0.25 is consistent with that for s/B = 0.5, s/B = 1 is a separate group and the trend for s/B = 1.5 is consistent with that for s/B = 3. Among them, the curve for s/B = 1 decreases the fastest, and its slope is significantly higher than that of the other groups when h/B = 1~2. The significant differences among the three types of curves are concentrated in the range of h/B = 0.25~2, and all points basically coincide near 100 N when h/B = 3. Specifically, in the s/B = 0.25 and 0.5 groups, the decrease in h/B from 1 to 2 is small (about 16%, the bearing capacity decreases from about 490 N to about 410 N), and the curve is gentle; in the s/B = 1 group, the decrease was the most significant (h/B = 1~2 interval decreased by about 40%, from about 488 N to about 293 N), and the slope increased significantly at h/B = 1. In the s/B = 1.5 and 3 groups, the decrease was in the middle (h/B = 1~2 interval of about 37%, from about 430 N to about 267 N).
Figure 6.
Effect of Crack Depth Ratios (h/B) on ultimate load under different Crack Spacing Ratio (s/B).
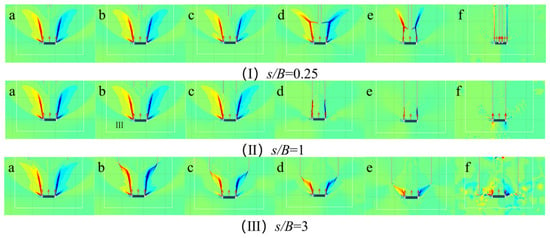
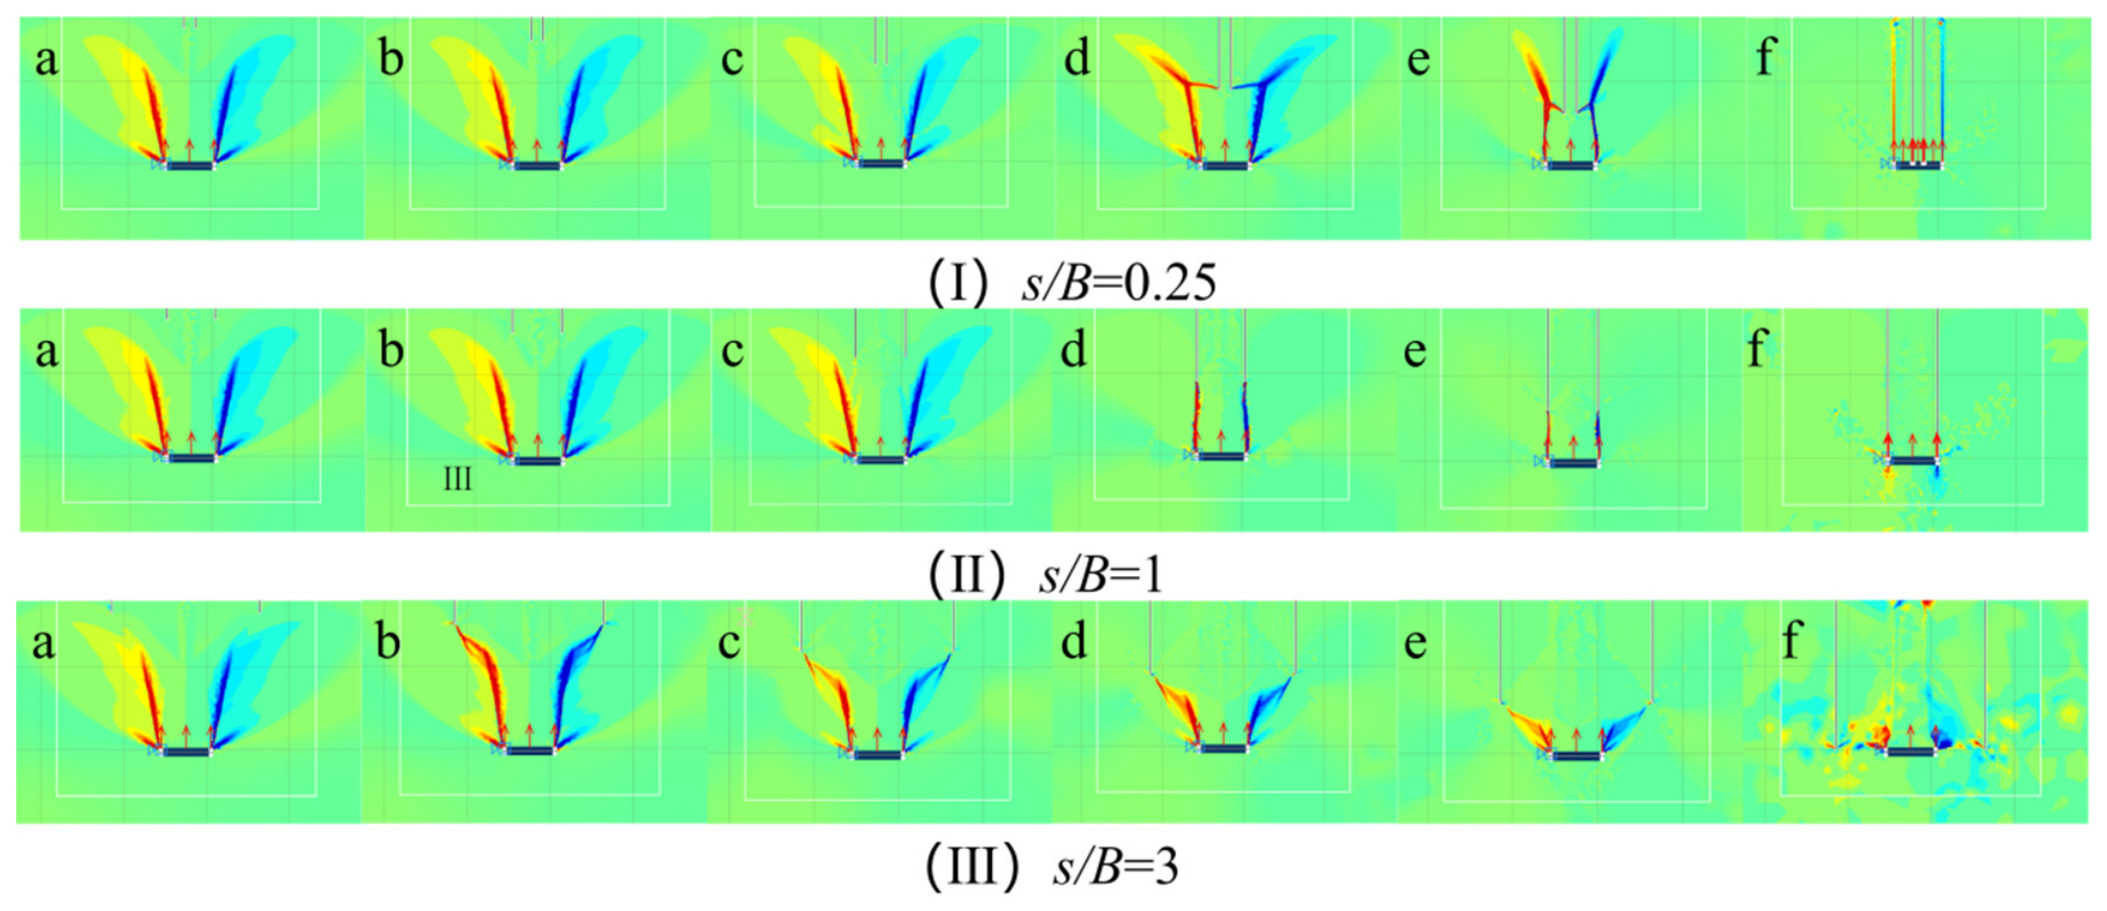
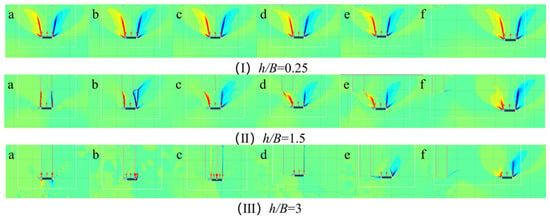
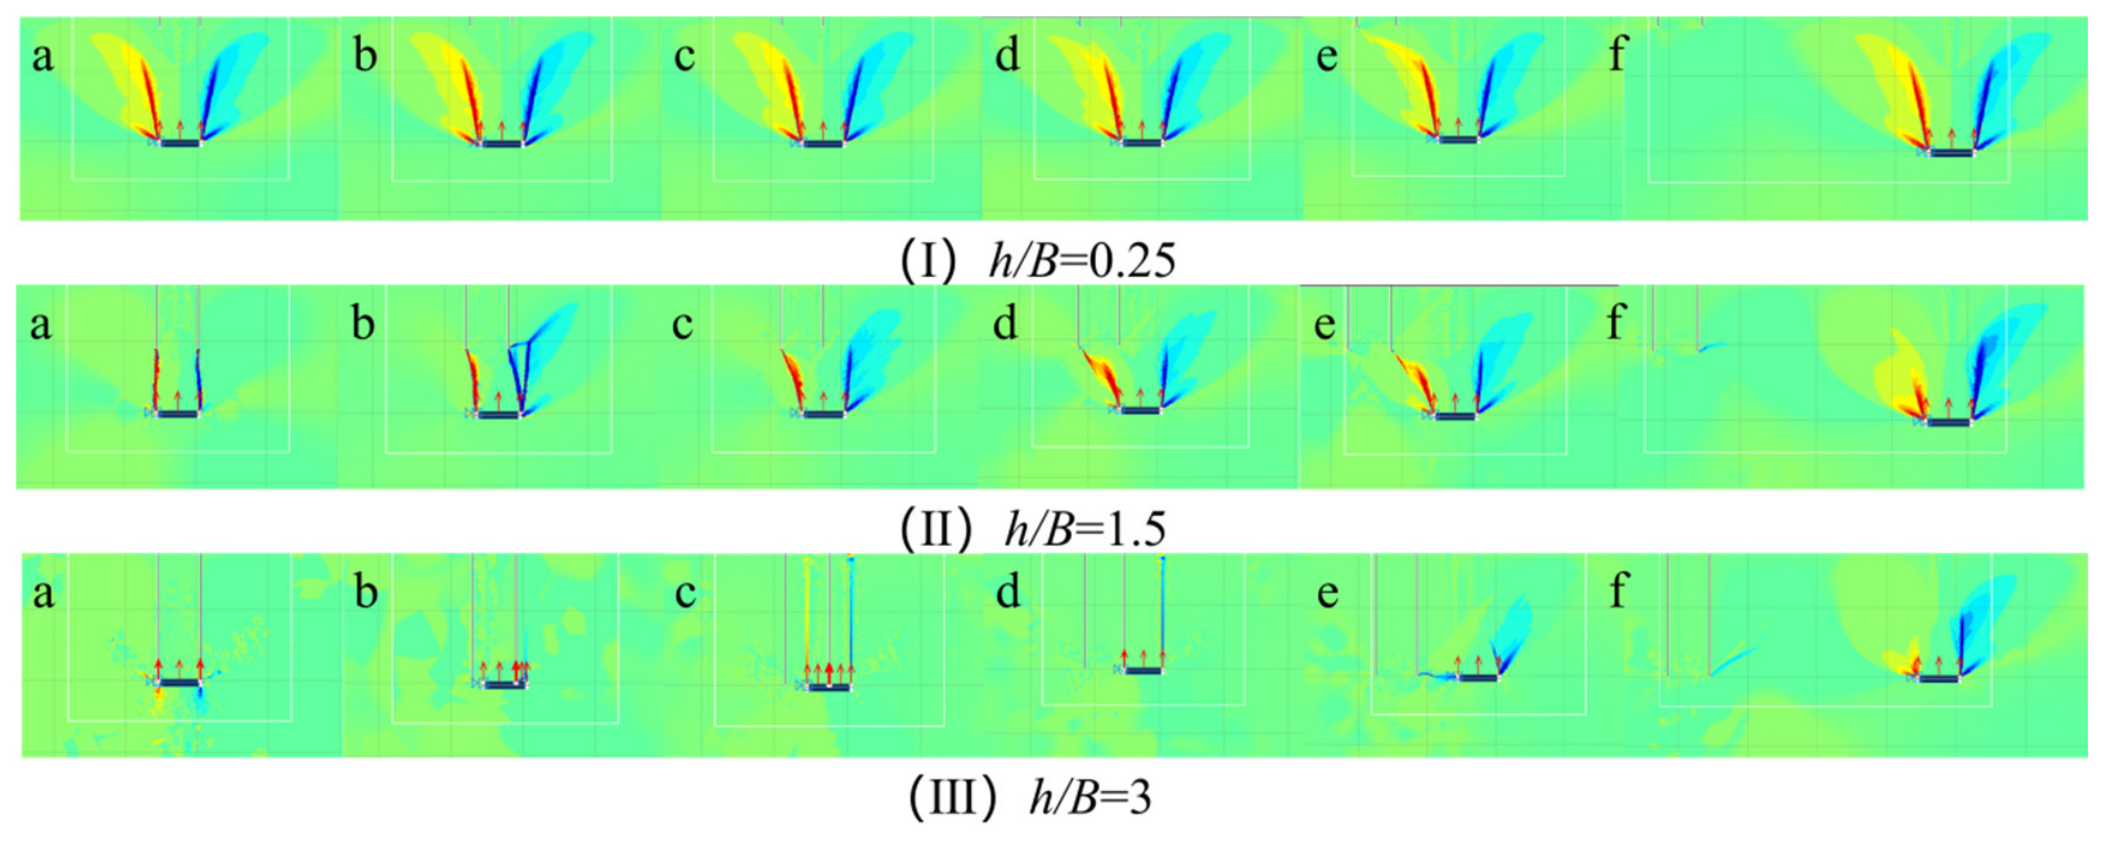
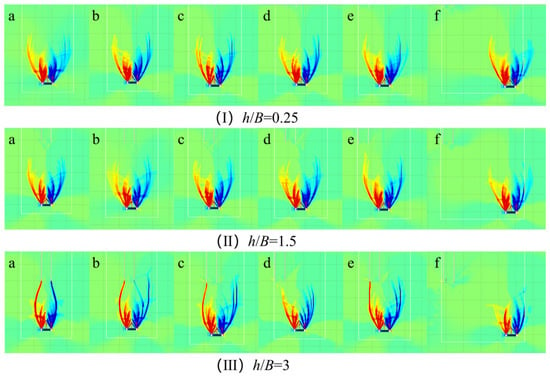
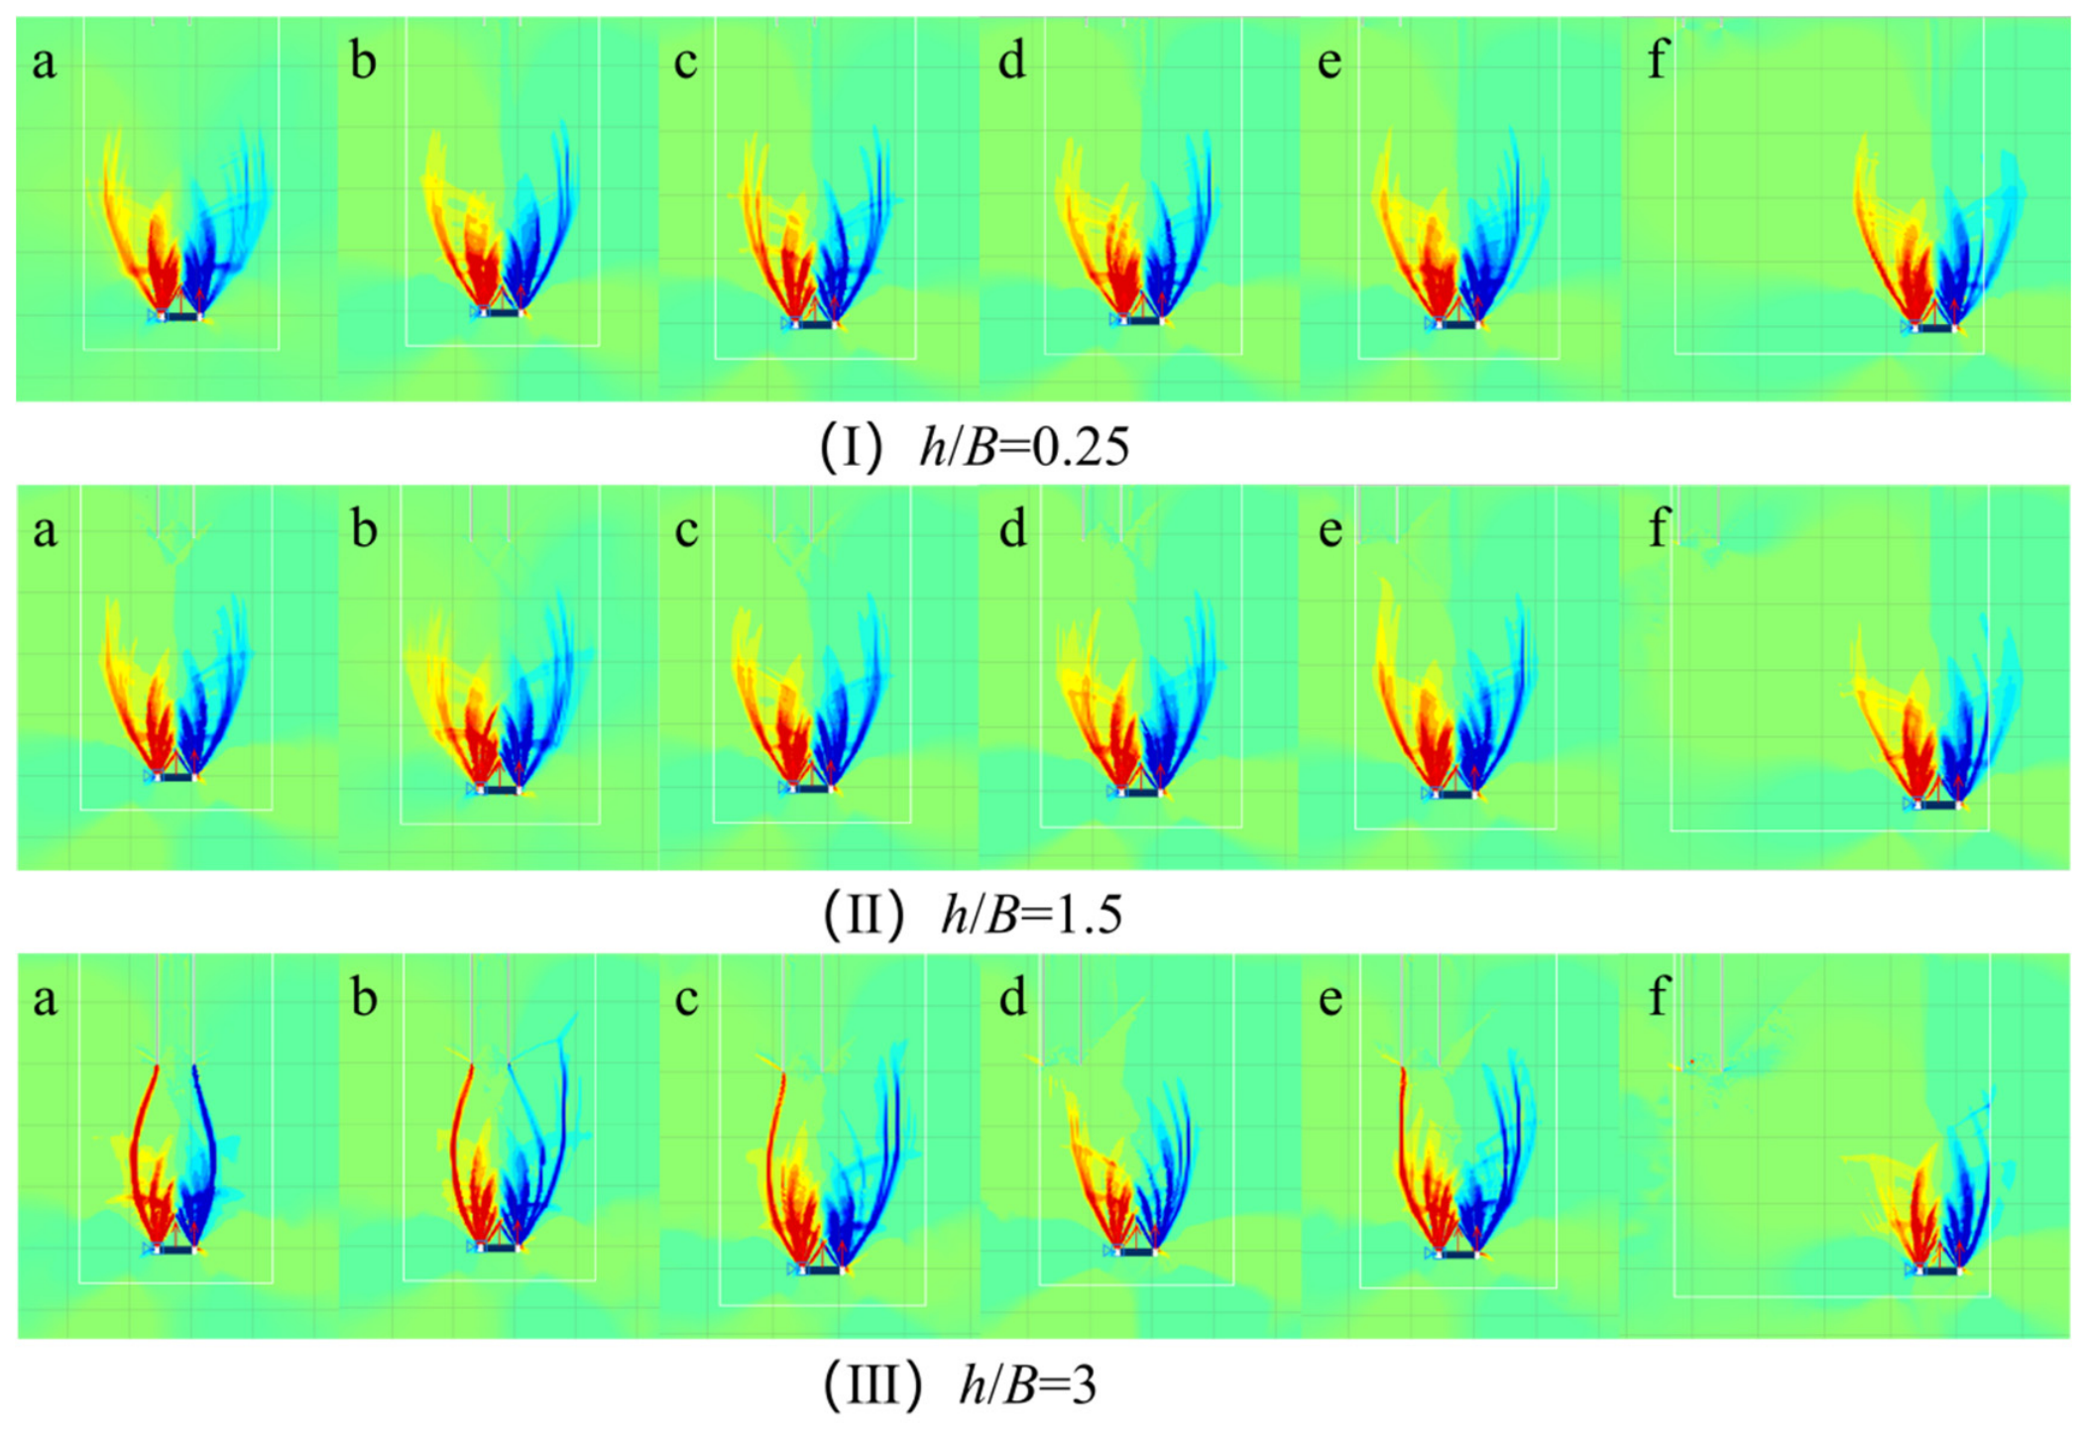
It can be seen from Figure 7 that the mesoscopic mechanism of the above macroscopic trend should be proved at the same time: for (I) h/B = 0.25 (corresponding to the small h/B stage), regardless of s/B (a~f), the sliding surface is a complete inverted outward arc, and there is no significant connection between the crack and the sliding surface. The high-strain zone (≥0.1) is concentrated at the edge of the anchor plate, so the bearing capacity fluctuates a little. In (II) h/B = 1.5 (corresponding to the middle h/B stage), the shape of the sliding surface gradually changes with an increase in s/B. When s/B = 0.25 and 0.5 (a,b), the sliding surface remains relatively complete. At s/B = 1 (c), the crack and the sliding surface begin to form an obvious penetration surface. The angle between the two sides of the sliding surface increases and the strain zone is divided, resulting in a significant acceleration in the decline rate of the bearing capacity. When s/B = 1.5 and 3 (d,e,f), only local short penetration occurs, and the radian is retained more. In (III) h/B = 3 (corresponding to the large h/B stage), the ranges of the transfixion surface of the three types of s/B tends to be close, the overall shape difference in the sliding surface is reduced, and the strength of the high-strain zone is greatly reduced, resulting in the basic coincidence of the curve points at h/B = 3 in the scatter plot. The evolution of the three sets of cloud images strongly confirms the three types of macroscopic laws in Figure 6 and the mechanism of s/B = 1 leading to decline and h/B = 3 coincidence.
Figure 7.
Equivalent Strain Contours under varying Crack Spacing Ratios (s/B) and Crack Depth Ratios (h/B = 0.25, 0.5, 1, 1.5,2, 3 for Subplots (a–f), respectively).
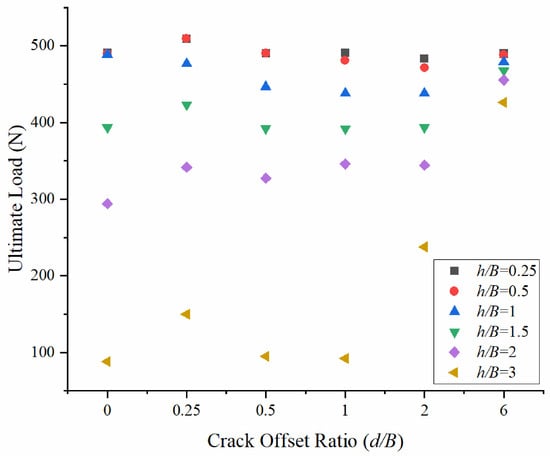
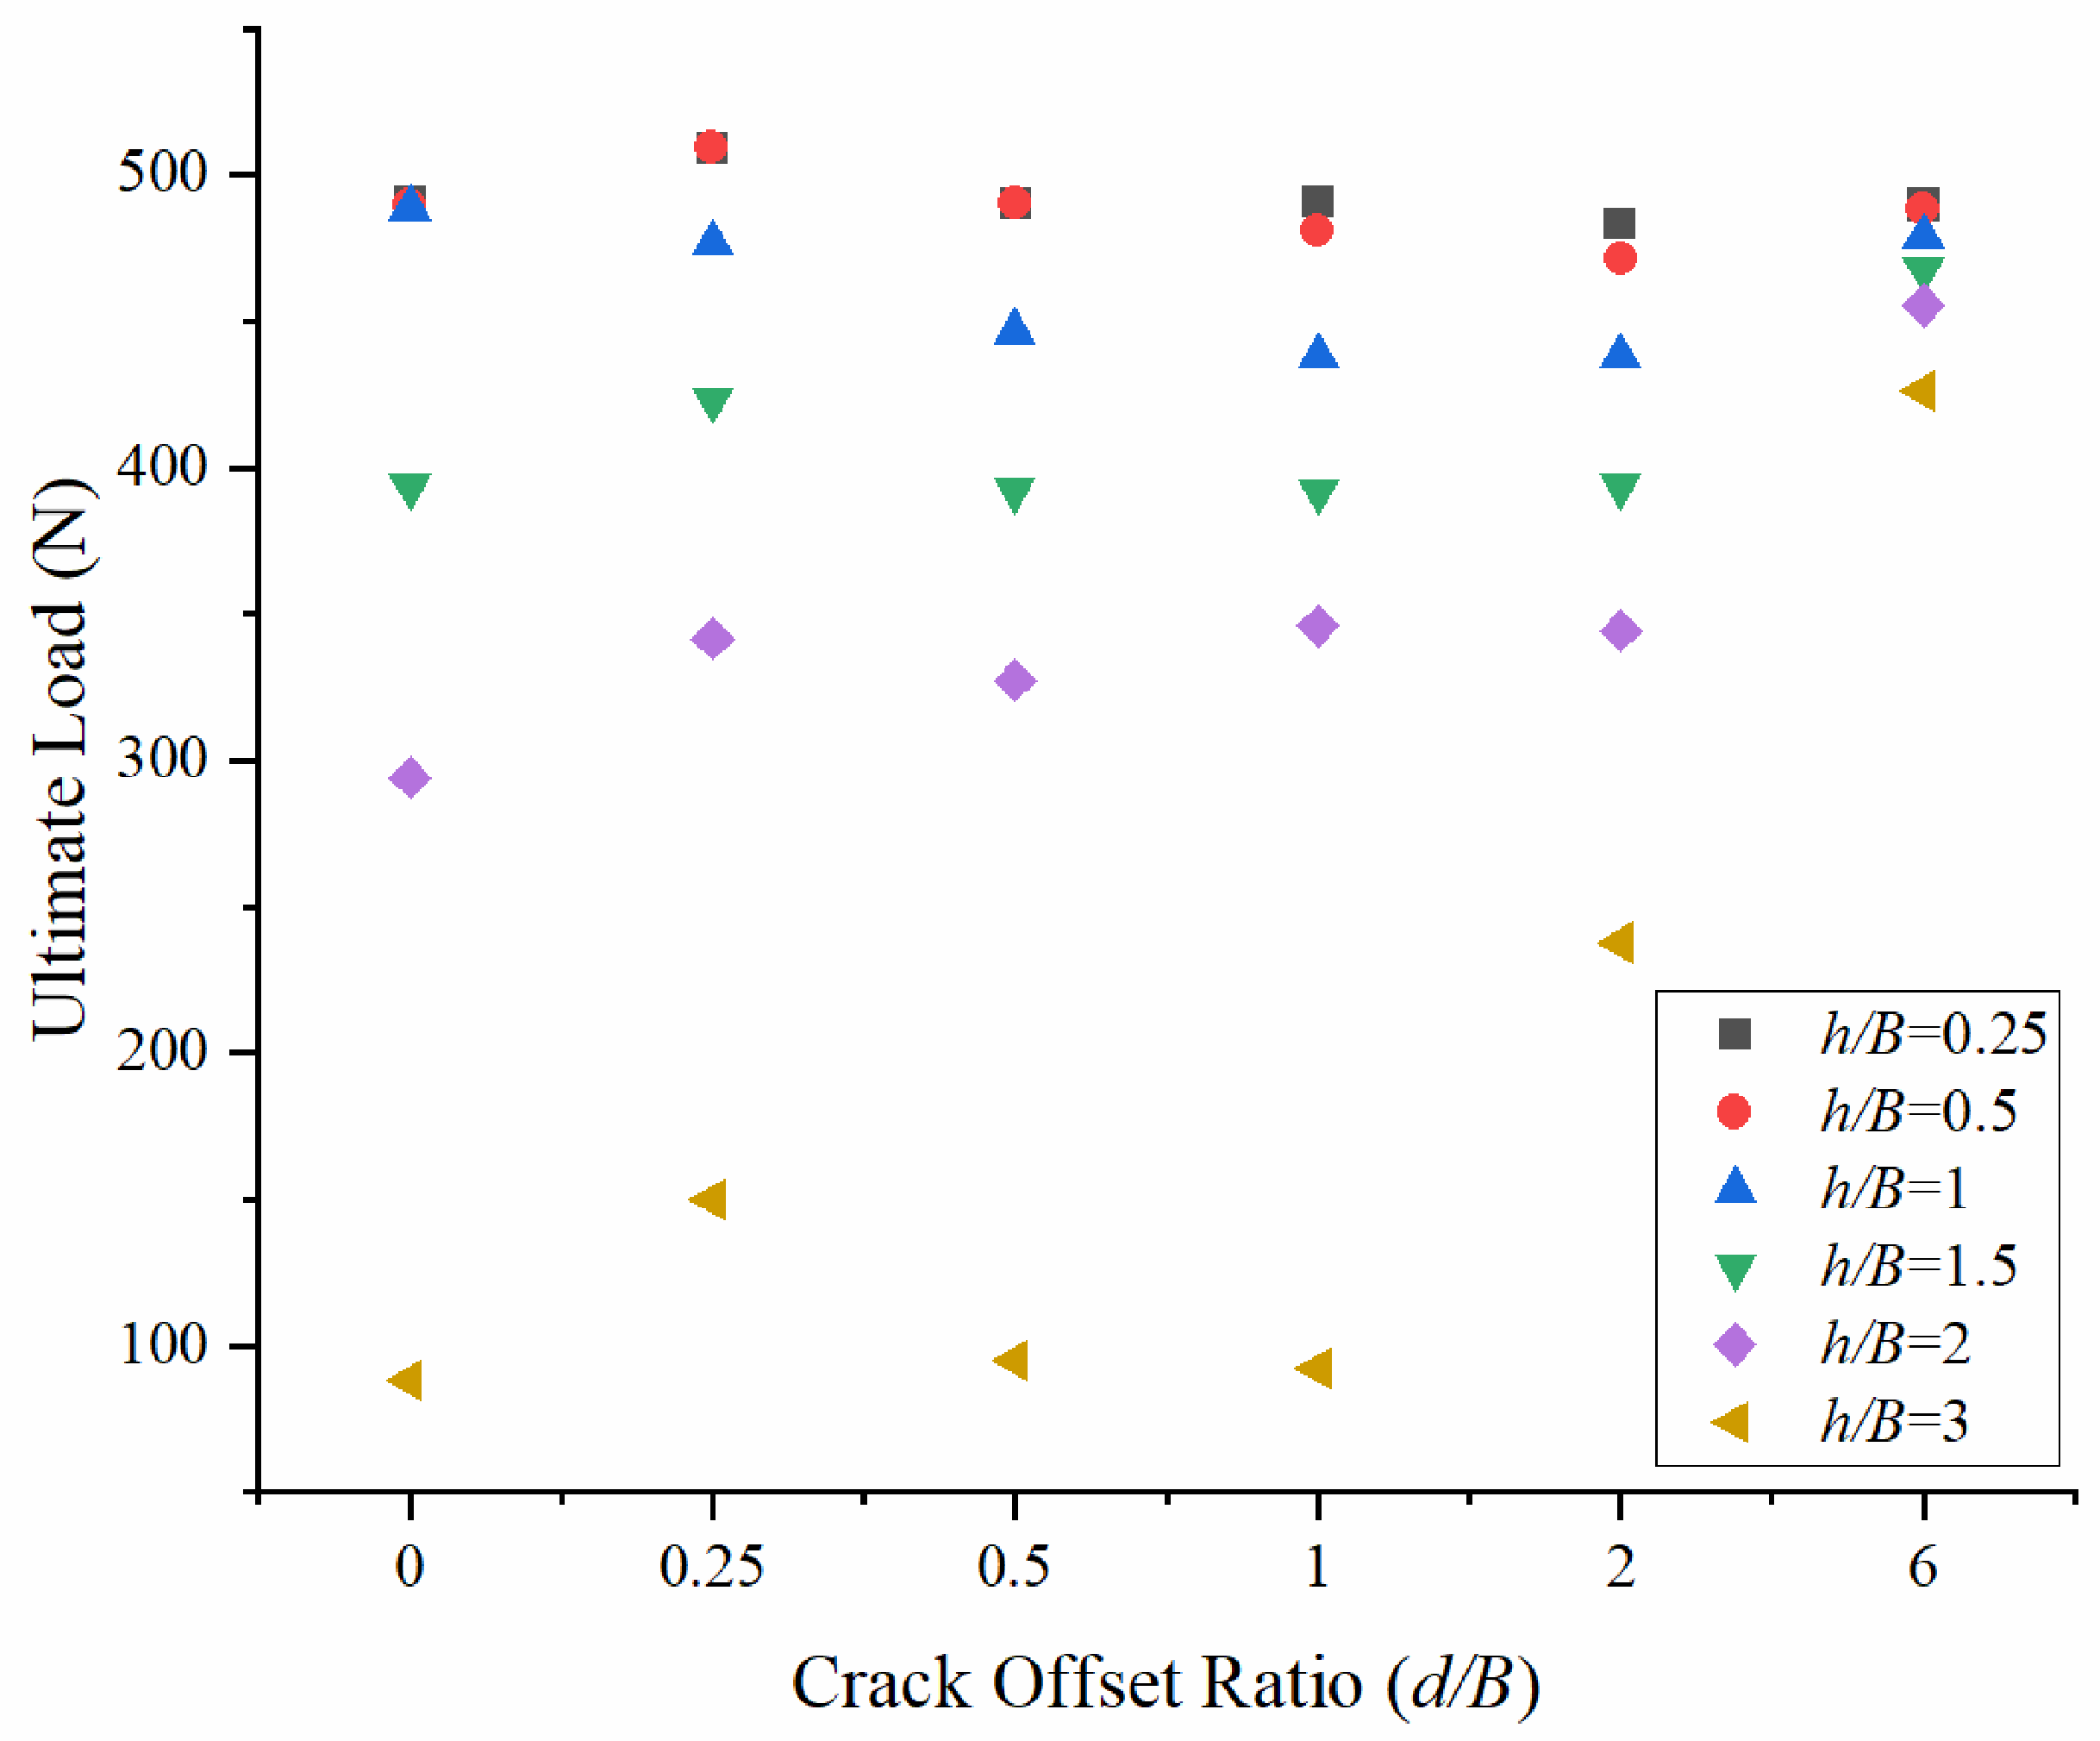
It can be seen from Figure 8 that the change in the ultimate bearing capacity of red clay with the increase in crack offset d/B under the condition of shallow burial (H/B = 3) is divided into three categories according to the crack depth h/B: h/B ≤ 0.5, 1 ≤ h/B ≤ 2, h/B = 3. When h/B ≤ 0.5, the bearing capacity with d/B is in the range of 488–509 N, increases sharply at d/B = 0.25, and is positively correlated at 1 < d/B; when 1 ≤ h/B ≤ 2, there is also a significant positive correlation with the increase in d/B when 1 < d/B, and the slope changes significantly at d/B = 1. The bearing capacity rises from about 345~438 N at d/B = 1 to about 478 N at d/B = 6. When h/B = 3, the bearing capacity is significantly reduced to the range of 92~149 N when d/B = 0~1, and it still increases with increasing d/B. The main turning point is d/B = 1, after which it increases to a stable value when d/B ≥ 2.
Figure 8.
Effect of Crack Offset Ratio (d/B) on ultimate load under different Crack Depth Ratios (h/B).
From Figure 9, it can be seen that the microscopic mechanism of the above macroscopic trend should be proved at the same time: for (I) h/B = 0.25 (corresponding to the small h/B stage), regardless of d/B (a~f), the sliding surface is a complete inverted cambered arc, the interaction between the crack and the sliding surface is very weak, and the high-strain zone is concentrated on the edge of the anchor plate, so the bearing capacity is less affected by the offset; when (II) h/B = 1.5 (corresponding to the middle h/B stage) and d/B = 0 (a), the double cracks are symmetrically distributed, the sliding surface and the crack form an obvious symmetrical penetrating surface, and the high-strain zone is seriously segmented. When d/B = 0.25~0.5 (b,c), the transfixion surface is only connected to one side, and the sliding surface becomes asymmetric extroversion. At d/B = 1 (d), the crack begins to break away from the influence zone of the sliding surface, and the sliding surface restores a complete arc shape. When d/B = 2~6 (e,f), the cloud diagram is highly consistent with the crack-free condition, and the strain concentration area is only near the corner of the anchor plate. In (III) h/B = 3 (corresponding to the large h/B stage), the overall range of the penetrating surface is reduced, the difference in the sliding surface morphology of the three types of d/B is reduced, and the strength of the high-strain zone is reduced, resulting in low bearing capacity but still rising with the offset. The evolution of the three sets of cloud images strongly confirms the three types of macroscopic laws in Figure 8 and the mechanism of the turning point of d/B = 1.
Figure 9.
Equivalent Strain Contours under varying crack depth (h/B) and Crack Offset Ratio (d/B = 0, 0.25, 0.5, 1, 2, 6 for Subplots (a–f), respectively).
4.2. Analysis of Coupling Effect of Crack Parameters Under Deep Buried Condition
Compared with the shallow buried condition (H/B = 3), the influence of crack parameters on the ultimate bearing capacity is significantly reduced under the deep buried condition (H/B = 8). This is because the overall scale of the sliding surface is larger and the buried depth is deeper when it is deeply buried. The interaction between the crack and the sliding surface is effectively suppressed, and the penetrating surface is difficult to fully develop, and the loss in bearing capacity is greatly reduced. The specific analysis is as follows:
It can be seen from Figure 10 that the variation in the ultimate bearing capacity of red clay with crack spacing s/B under deep burial (H/B = 8) can be divided into three categories: h/B = 0.25~1.5, h/B = 2 and h/B = 3. In the group of h/B = 0.25~1.5, the bearing capacity is generally stable when s/B ≤ 1 and shows a positive correlation trend after s/B > 1. With the increase in s/B, it rises slightly and remains at a high level of 1680 N. In the h/B = 2 group, the early stage (s/B = 0.25~1.5) was almost consistent with the above group, and then turned into a negative correlation, and the bearing capacity decreased significantly, about 1600 N; in the h/B = 3 group, the overall bearing capacity was higher at the beginning, but it began to drop sharply at s/B = 0.5, and then continued to decrease to the lowest level, about 1415 N.
Figure 10.
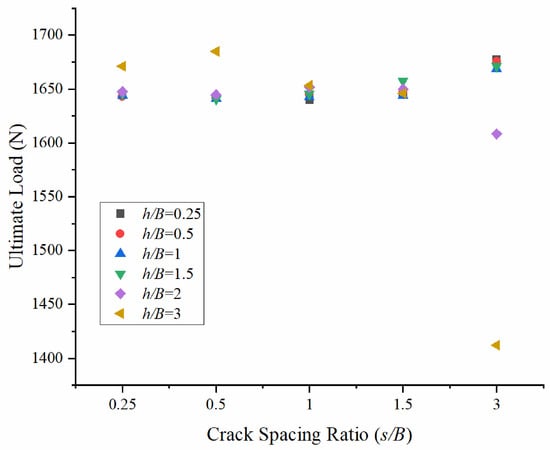
Effect of Crack Spacing Ratio (s/B) on ultimate load under different Crack Depth Ratios (h/B).
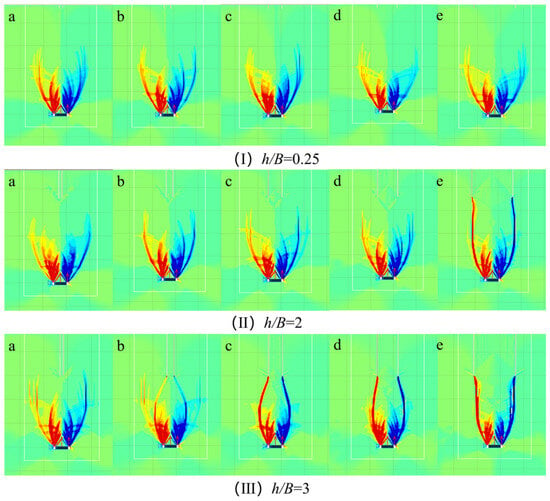
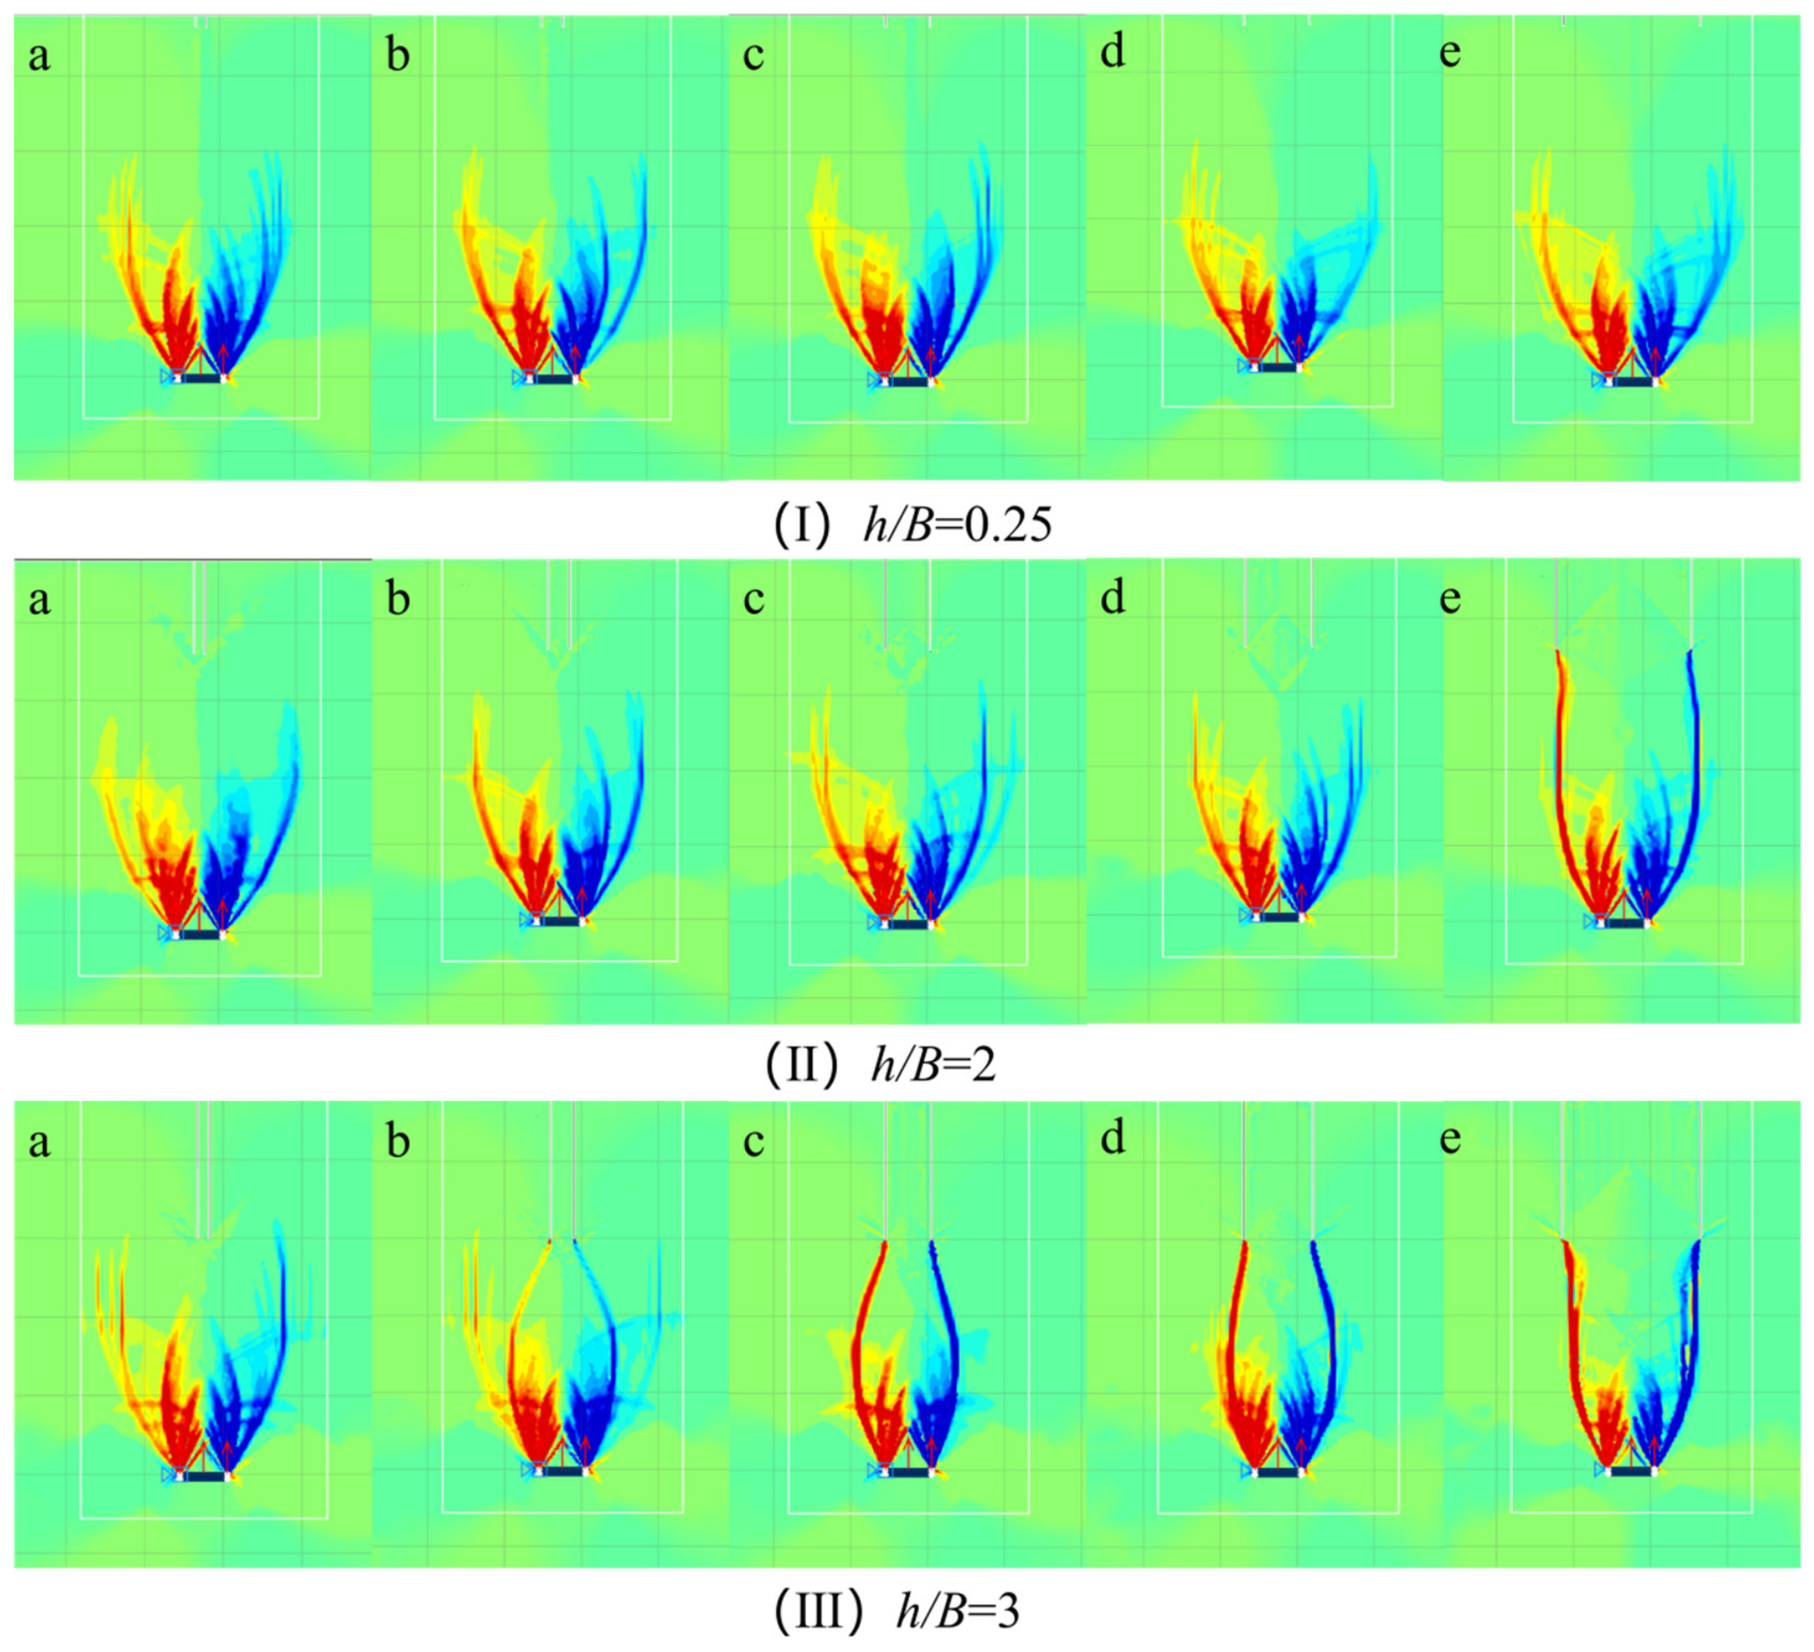
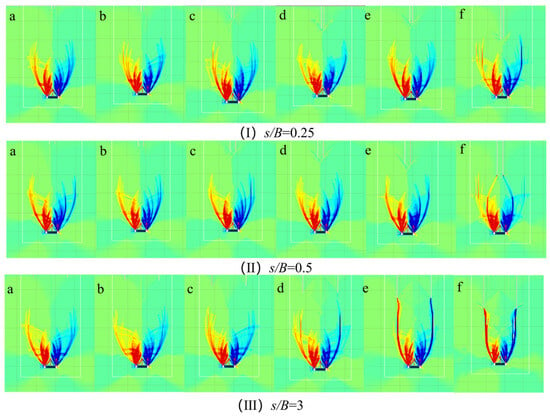
It can be seen from Figure 11 that the microscopic mechanism of the above macroscopic trend should be proved at the same time: for (I) h/B = 0.25, s/B = 0.25~1.5 (a~d), the sliding surface is a complete deep elliptical arc without obvious penetration, and the high-strain zone is concentrated in the deep below the anchor plate; at s/B = 3 (e), the upper deformation pattern changes. In (II), h/B = 2, s/B = 0.25~1.5, the sliding surface maintains high integrity. At s/B = 3 (e), the upper deformation bands are more visibly affected. In (III) h/B = 3, s/B = 0.25~1.5, it is still dominated by complete elliptical arcs. At s/B = 3 (e), the morphological degradation of the sliding surface is most significant, and the strength of the high-strain zone is most evident. These three rows compare crack-depth groups, whereas columns a–e represent s/B = 0.25, 0.5, 1, 1.5, and 3. There is no s/B = 2 case in this figure. The largest-spacing contours are qualitatively consistent with the larger load changes in Figure 10.
Figure 11.
Equivalent Strain Contours under varying crack depth (h/B) and Crack Spacing Ratios (s/B = 0.25, 0.5, 1, 1.5, 3 for Subplots (a–e), respectively).
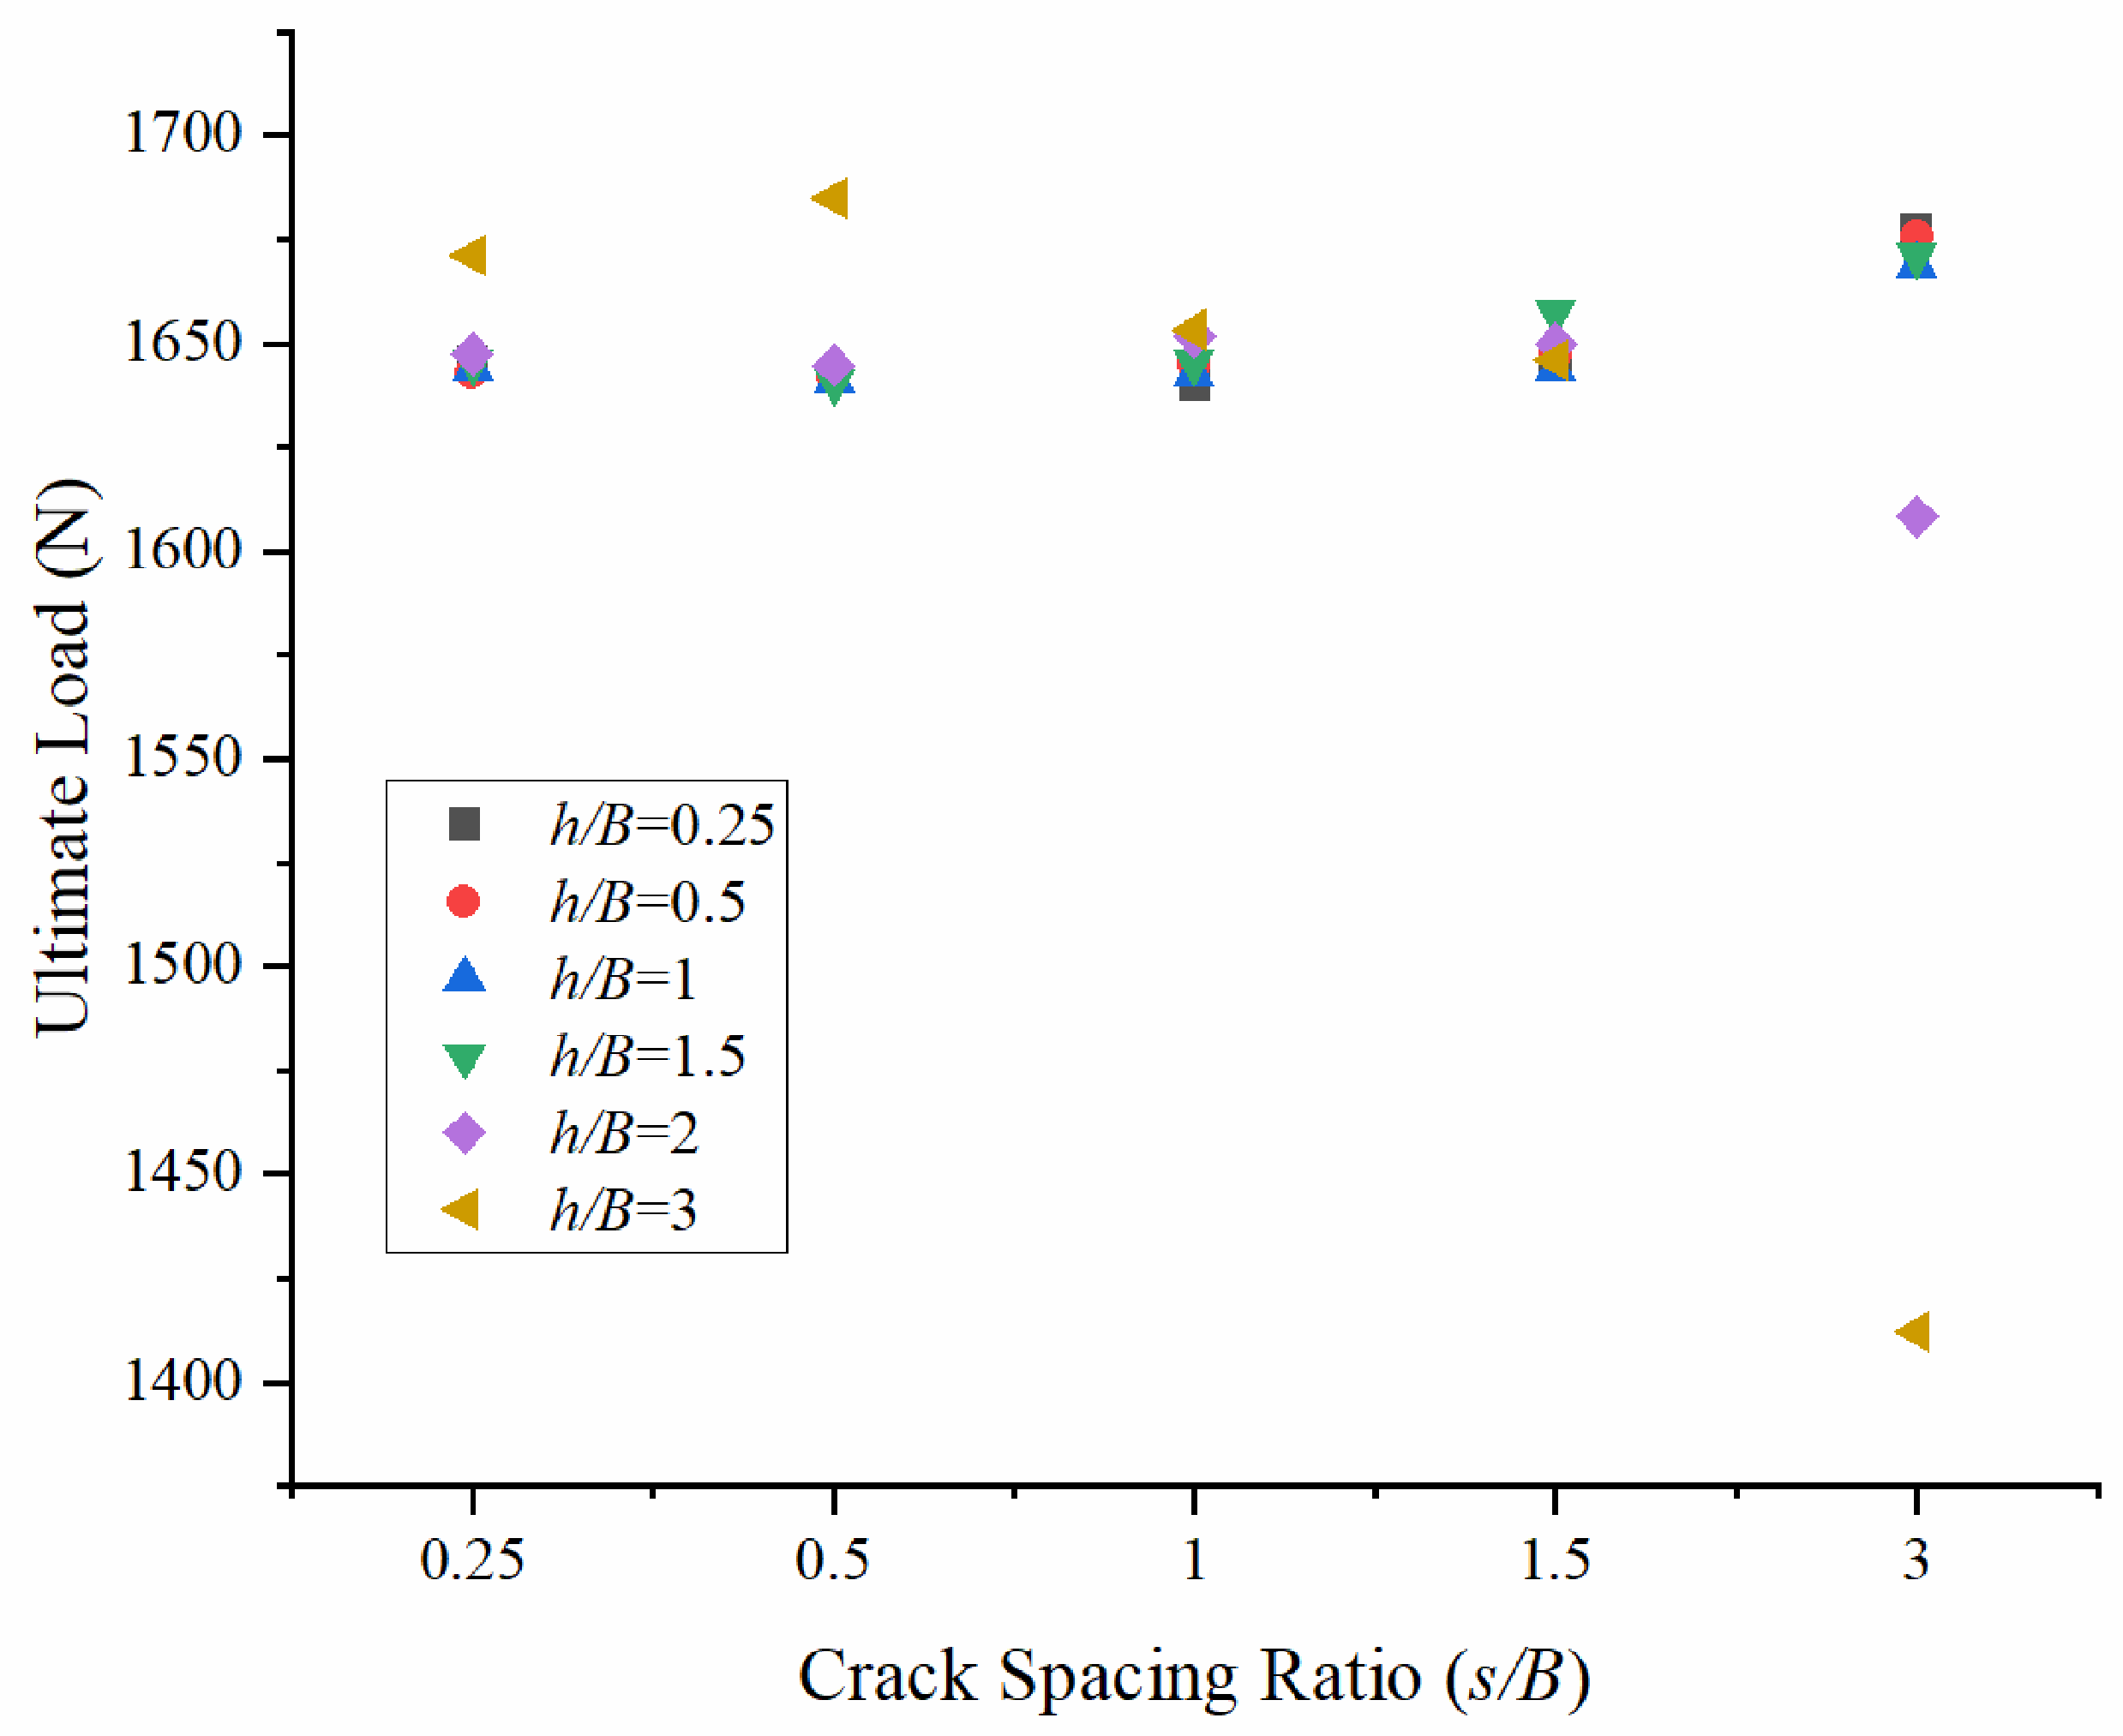
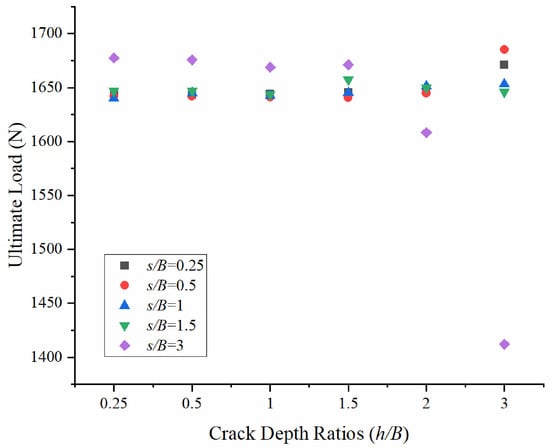
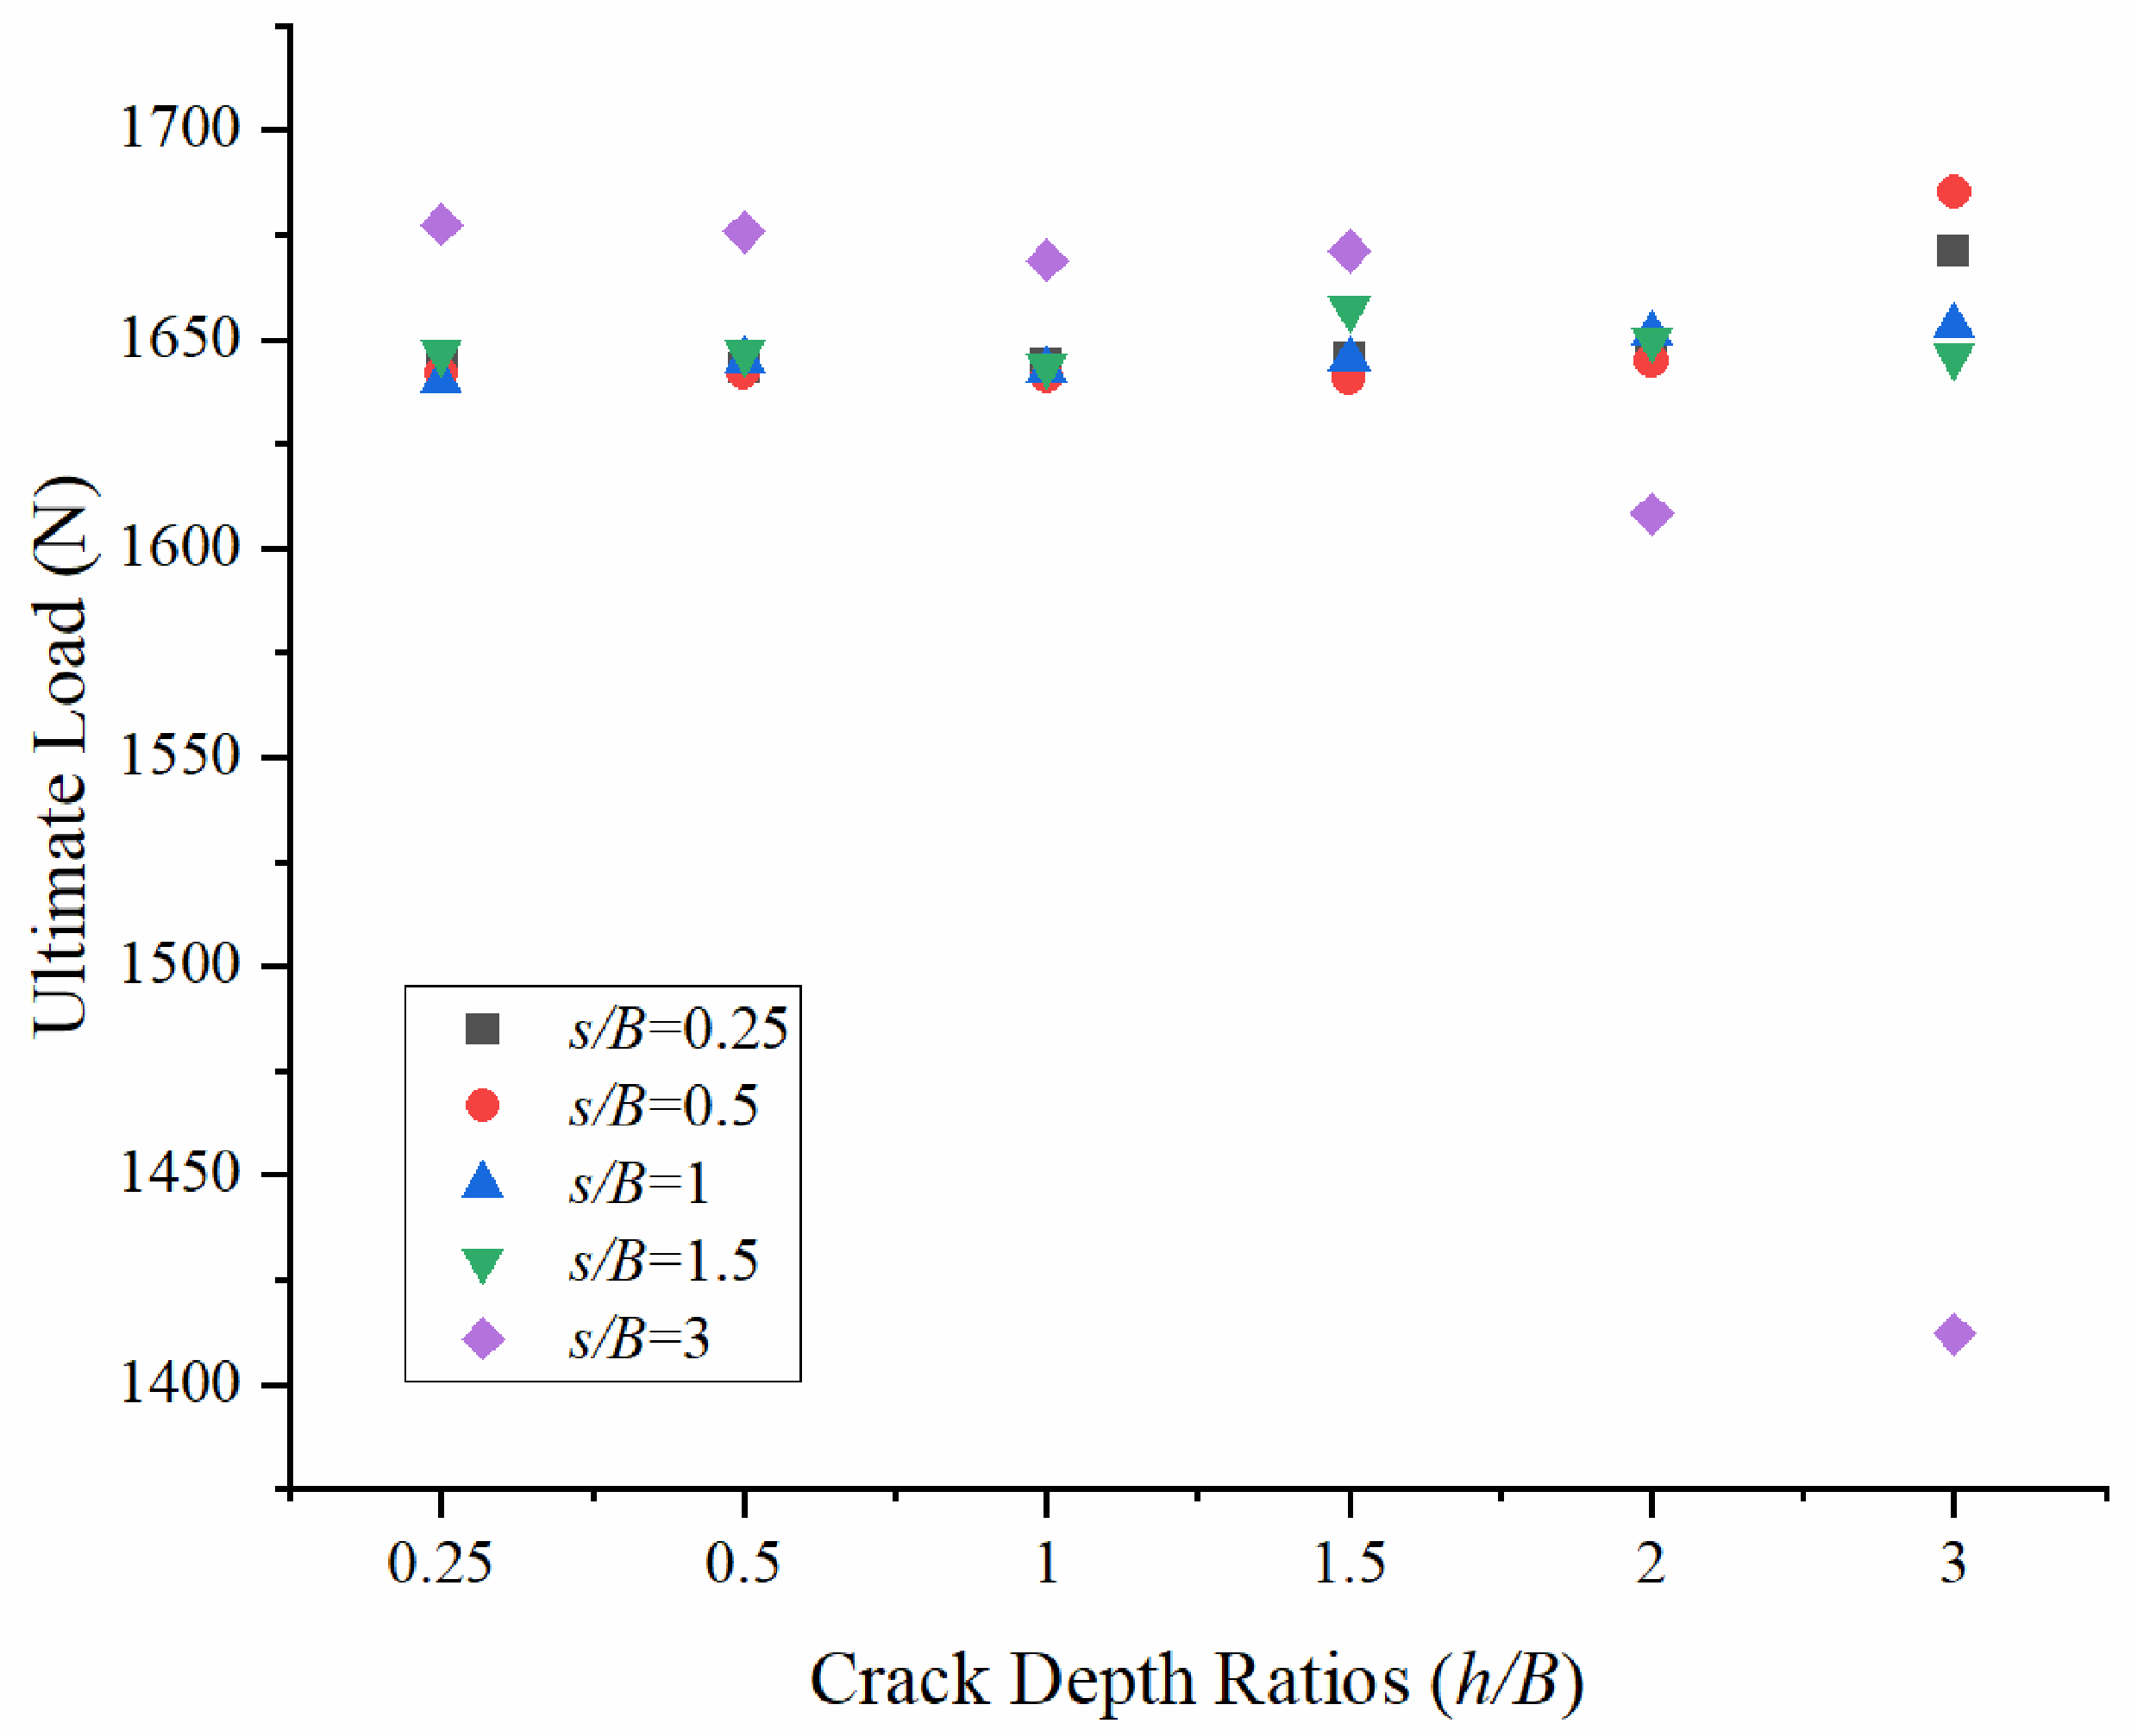
It can be seen from Figure 12 that the changes in ultimate bearing capacity of red clay with the increase in crack depth h/B under the condition of deep burial (H/B = 8) are divided into three categories according to the crack spacing s/B: s/B = 0.25 is consistent with 0.5, s/B = 1 is consistent with 1.5, and s/B = 3 is a separate group. In the s/B = 0.25 and 0.5 groups, h/B = 2 is an obvious turning point. When h/B ≤ 2, the bearing capacity fluctuates slightly in the range of 1640~1650 N (fluctuation range is about 10 N). After h/B = 2, it shows a significant upward trend, up to 1685 N; in the s/B = 1 and 1.5 groups, there was a slight decrease at h/B = 2 (a decrease of about 4 N), and the overall bearing capacity remained in the range of 1645~1685 N, which was completely different from the continuous negative correlation trend of shallow burial conditions. In the s/B = 3 group, h/B = 1 is the turning point. When h/B ≤ 1, the bearing capacity fluctuates slightly in the range of 1668~1677 N (fluctuation range of about 9 N) but is higher than that of other groups on a whole. After h/B = 1, it began to decrease significantly, falling to 1412 N, with a maximum decrease of about 265 N.
Figure 12.
Effect of Crack Depth Ratios (h/B) on ultimate load under different Crack Spacing Ratios (s/B).
It can be seen from Figure 13 that the microscopic mechanism of the above macroscopic trend should be proved at the same time: for (I) s/B = 0.25, h/B = 0.25 and 0.5 (a,b), the sliding surface is a complete deep elliptical arc, and the high-strain zone is stable and concentrated; after h/B = 2 (e), the shape of the sliding surface is more symmetrical, the strength of the high-strain zone increases slightly, and the corresponding bearing capacity increases. When s/B = 1 (II), the sliding surface at h/B = 2 shows local shrinkage or a slight decrease in radius, and the range of the penetration surface is slightly expanded, resulting in a slight decrease in bearing capacity. When s/B = 3 (III), before h/B = 1, the sliding surface is complete and the strength of the high-strain zone is higher. After h/B = 1, the penetrating surface is obviously developed, the sliding surface morphology degrades, and the strength of the high-strain zone is significantly reduced, which directly corresponds to the law that the bearing capacity decreases after the turning point at h/B = 1. The evolutionary characteristics of the three groups of cloud images highly confirm the macroscopic differences among the three groups in Figure 12, especially the rise of s/B = 0.25~0.5 after h/B = 2, the slight decline of s/B = 1~1.5 after h/B = 2, and the turning down of s/B = 3 at h/B = 1.
Figure 13.
Equivalent Strain Contours under varying Crack Spacing Ratios (s/B) and Crack Depth Ratios (h/B = 0.25, 0.5, 1, 1.5,2, 3 for Subplots (a–f), respectively).
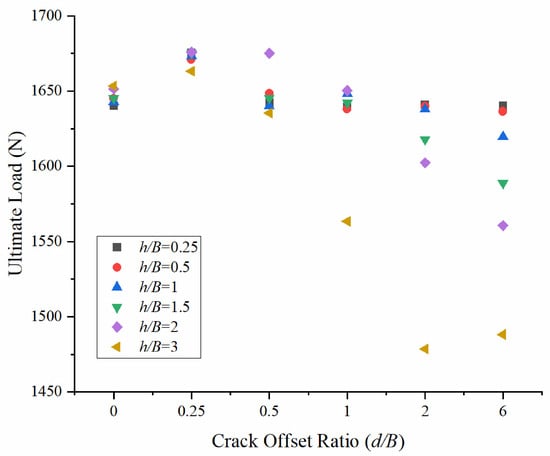
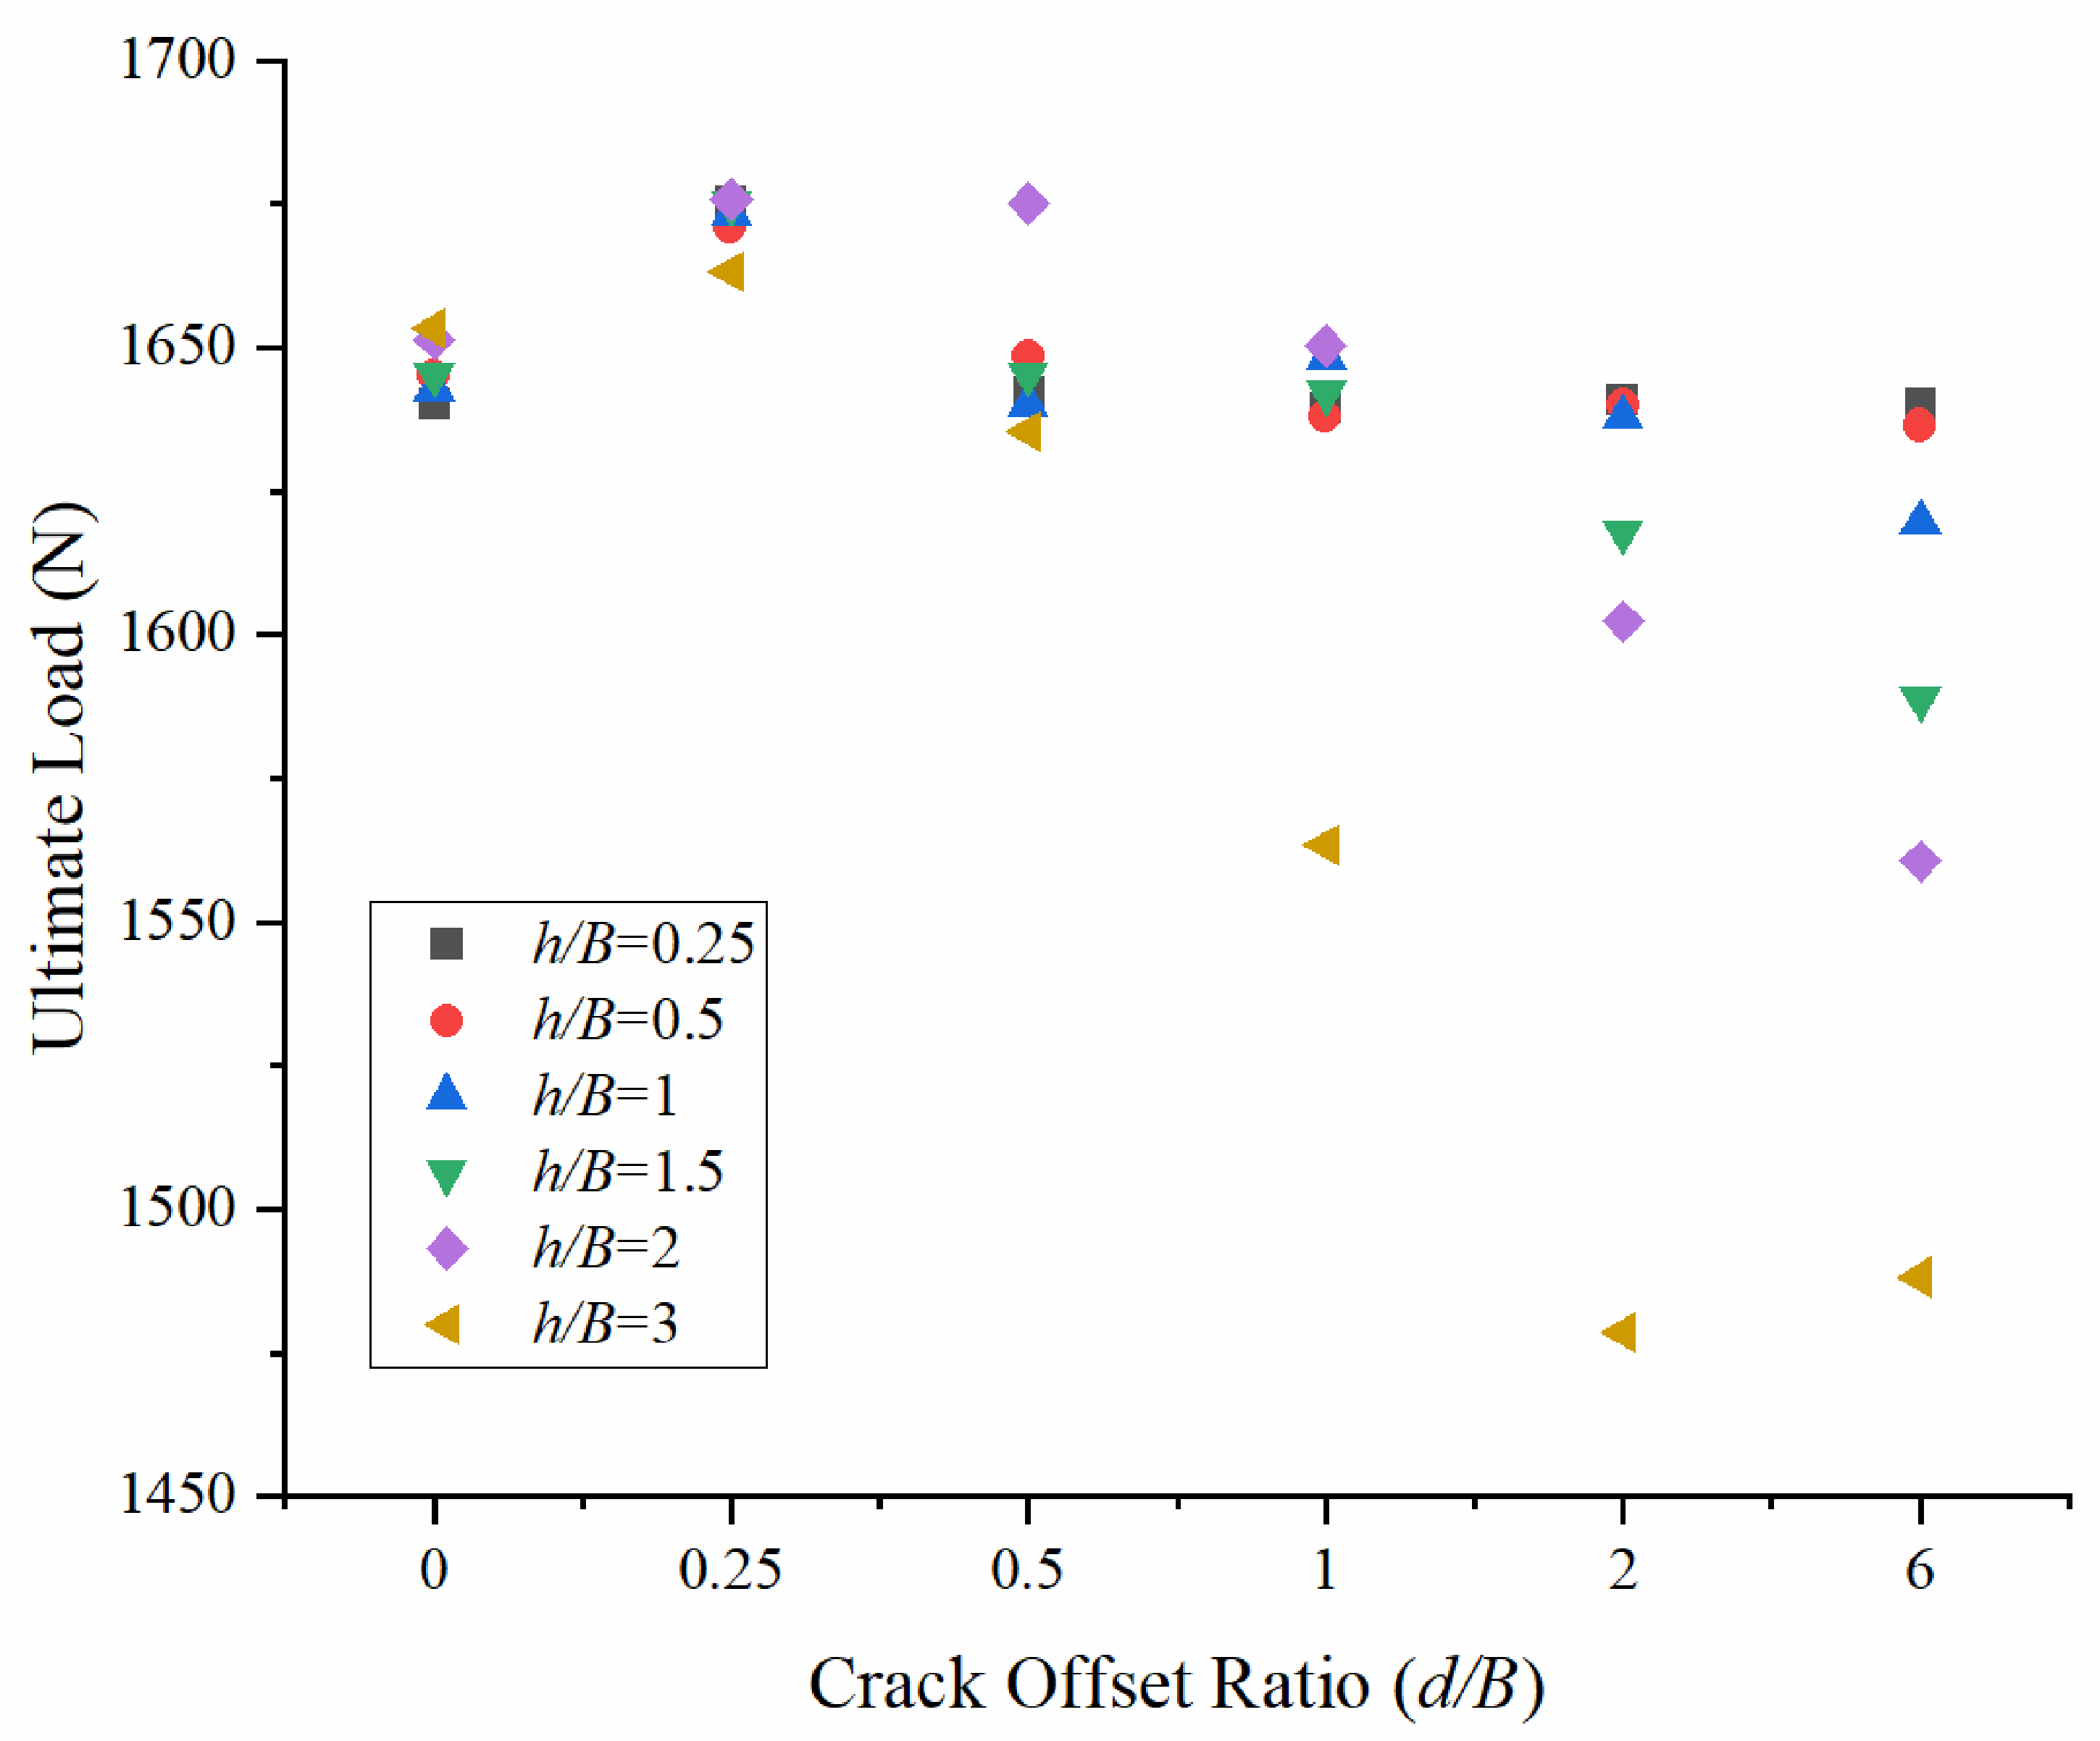
It can be seen from Figure 14 that the change in ultimate bearing capacity of red clay with the increase in crack offset d/B under the condition of deep burial (H/B = 8) is divided into three categories according to the crack spacing h/B: h/B = 0.25 is consistent with the law of 0.5, h/B = 1 is consistent with the law of 1.5 and h/B = 2 is similar to the law of 3. The curves for h/B = 0.25 and 0.5 are basically completely coincident, and the bearing capacity is the highest and most stable. At d/B = 0.25, it rises slightly and then falls back (the fluctuation range is about 30 N), and the overall bearing capacity remains in the range of 1636~1675 N. The trend in the two groups, h/B = 1 and 1.5, is highly similar. Similarly, there is a rise and fall at d/B = 0.25, and the downward trend at d/B = 1 is significantly increased. The bearing capacity decreases from about 1650~1675 N at d/B = 1 to about 1588~1619 N at d/B = 6, a decrease of about 56~62 N; the change patterns for the two groups of h/B = 2 and 3 are similar. The bearing capacity in the early stage is slightly lower than that of the first two groups. There is no rise and fall at d/B = 0.25, and then it shows a continuous downward trend as d/B increases. However, the bearing capacity decreases; for h/B = 3, it is lower than that for h/B = 2 overall, ultimately decreasing to about 1560 N and 1488 N, respectively.
Figure 14.
Effect of Crack Offset Ratio (d/B) on ultimate load under different Crack Depth Ratios (h/B).
From Figure 15, it can be seen that the microscopic mechanism of the above macroscopic trend should be proved at the same time: for (I) h/B = 0.25, regardless of d/B (a~f), the sliding surface is a complete deep elliptical arc, and the interaction between the crack and the sliding surface is very weak. Only when d/B = 0.25 (b), there is a slight local contact, corresponding to the slight rise and fall in each group at d/B = 0.25; in (II) h/B = 1.5, d/B = 0.25~0.5 (a,b), the sliding surface maintains high integrity. When d/B = 1~1.5 (c,d), the transfixion surface is obviously developed at d/B = 1; the sliding surface morphology is degraded, the high-strain zone is segmented and intensified, and the corresponding downward trend at d/B = 1 is significantly increased. When d/B = 2~3 (e,f), the range of the penetration surface is large, and the radius of the sliding surface decreases. In (III) h/B = 3, d/B = 0.25~0.5 transfixion surface is the smallest; d/B = 1~1.5 development of the transfixion surface is significant; d/B = 2~3 transfixion surface is the most obvious; and the strength of the high-strain zone is the lowest, which directly corresponds to the law of the lowest bearing capacity. The evolutionary characteristics of the three groups of cloud images strongly confirm the macroscopic differences in the three groups in Figure 14.
Figure 15.
Equivalent Strain Contours under varying crack depth (h/B) and Crack Offset Ratio (d/B = 0, 0.25, 0.5, 1, 2, 6 for Subplots (a–f), respectively).
The findings apply to two embedment ratios, prescribed vertical cracks, fixed soil properties, a smooth plate interface, and plane-strain loading. They do not include suction, transient seepage, moisture-dependent strength, crack initiation or healing, strain softening, three-dimensional end effects, or cyclic and inclined loading. Extrapolation to other crack geometries, soils, or anchor systems requires recalibration and independent validation. Intact undrained-clay solutions [13,19] provide a useful mechanism context, but cannot quantitatively validate the present frictional-soil model without matched constitutive, interface, and normalization assumptions.
5. Conclusions
Based on Optum G2 numerical simulation software, the vertical uplift bearing characteristics of horizontal strip anchor plates with double surface cracks in red clay foundation are systematically studied in this paper. The control effect of buried depth ratio (shallow buried H/B = 3, deep buried H/B = 8) on the sensitivity and failure mode of double crack parameters (crack depth h/B, spacing s/B, offset d/B) is analyzed. Through a quantitative analysis of parametric scatter plots and the meso-mechanism analysis of von Mises equivalent strain cloud diagrams, the evolution of crack interaction under different buried depths is revealed. The main conclusions are as follows:
- (1)
- The buried depth ratio has a significant regulatory effect on the sensitivity of crack parameters. When the buried depth is shallow (H/B = 3), the influence of crack parameters is strong, and the bearing capacity loss is large (the maximum decrease can reach 81.6%). When buried deep (H/B = 8), the sliding surface is larger and the buried depth is deeper. The interaction between the crack and the sliding surface is effectively suppressed, and the bearing capacity loss is greatly reduced (the maximum reduction is generally less than 15%). The overall bearing capacity is maintained at a high level of 1400~1750 N.
- (2)
- There is an obvious critical turning point under shallow buried conditions. In the crack spacing group, s/B = 1 is the key turning point, and when h/B > 1, the formation of the through surface leads to the accelerated decline of the bearing capacity; in the crack-depth group, the s/B = 1 group decreased fastest and earliest, and the curves tended to overlap when h/B = 3. In the crack offset group, d/B = 1 is the main turning point. When d/B > 1, the bearing capacity rises significantly, and the sliding surface gradually recovers from the symmetrical penetrating surface to the complete arc.
- (3)
- The influence law of crack parameters under deep buried conditions is significantly different from that under shallow buried conditions. In the crack spacing group, h/B = 0.25~1.5 was positively correlated at the later stage, h/B = 2 turned into negative correlation, and h/B = 3 began to fall sharply from s/B = 0.5. In the crack-depth group, s/B = 0.25~0.5 increases after h/B = 2, s/B = 1~1.5 decreases slightly at h/B = 2, and s/B = 3 decreases at h/B = 1. In the crack migration group, h/B = 0.25~0.5 is the most stable, h/B = 1~1.5 decreases faster at d/B = 1, and h/B = 2~3 continues to decline but remains overall lower than the first two types.
- (4)
- The evolution mechanism of the failure mode shows that the crack is easy to form a penetrating surface with the sliding surface when buried shallowly, which leads to the segmentation of the high-strain zone and the degradation of the sliding surface morphology. When deep buried, the sliding surface is mostly a complete deep elliptical arc, the development of the penetrating surface is limited, and only large spacing/depth cracks produce local disturbance.
This paper quantifies the regulation mechanism of the coupling effect of double cracks on the pull-out resistance of anchor plates under different buried depths for the first time, which fills the theoretical gap of the influence of red clay cracking on the pull-out foundation, and has significant innovation and engineering guidance value.
Author Contributions
Conceptualization, J.L. and S.L.; methodology, S.L.; software, B.X.; validation, J.L., W.H. and S.L.; formal analysis, B.X.; investigation, J.L.; resources, W.H.; data curation, S.L.; writing—original draft preparation, J.L.; writing—review and editing, J.L., S.L., W.H., M.A. and C.L.; visualization, W.H.; supervision, C.L.; project administration, S.L.; funding acquisition, W.H. All authors have read and agreed to the published version of the manuscript.
Funding
The authors are grateful for the financial support given by the National Natural Science Foundation of China (Grant number 52178332); and the Scientific Research Project of the Hunan Provincial Education Department (25B0449).
Data Availability Statement
The data presented in this study are available on request from the corresponding author as the data are not publicly available due to privacy or ethical restrictions.
Conflicts of Interest
Author C.L. was employed by the company Power China Fujian Engineering Co., Ltd. The remaining authors declare that the research was conducted in the absence of any commercial or financial relationships that could be construed as a potential conflict of interest. The company Power China Fujian Engineering Co., Ltd and the companies in affiliation and funding had no role in the design of the study; in the collection, analyses, or interpretation of data; in the writing of the manuscript, or in the decision to publish the results.
References
- Robinson, J.D.; Vahedifard, F. Weakening mechanisms imposed on California’s levees under multiyear extreme drought. Clim. Change 2016, 137, 1–14. [Google Scholar] [CrossRef] [Scilit]
- Zhang, C.; Luo, Y.; Ma, B.; Jiang, F.; Zhu, D.; Lou, A. Influence of discontinuous gradation and surface morphology on the shear behavior of soil rock mixtures-bedrock interface. Bull. Eng. Geol. Environ. 2026, 85, 544. [Google Scholar] [CrossRef] [Scilit]
- Zhang, C.; Zhu, Z.; Ma, B.; Su, G.; Zhu, D.; Zhou, H.; Cao, W. Generalized damage constitutive model for rock based on residual strength characteristics subjected to multi-environmental factors cycles and loading. Cold Reg. Sci. Technol. 2026, 247, 104909. [Google Scholar] [CrossRef] [Scilit]
- Zhang, C.; Hu, Y.; Ma, B.; Zhu, D.; Zhou, H.; Cao, W. Improved damage constitutive modeling of post-peak random failure behavior in quasi-brittle rocks. Eng. Fract. Mech. 2026, 332, 111750. [Google Scholar] [CrossRef] [Scilit]
- Tang, C.S.; Zhu, C.; Cheng, Q.; Zeng, H.; Xu, J.-J.; Tian, B.-G.; Shi, B. Desiccation cracking of soils: A review of investigation approaches, underlying mechanisms, and influencing factors. Earth-Sci. Rev. 2021, 216, 103586. [Google Scholar] [CrossRef] [Scilit]
- Luo, Y.; Zhang, J.M.; Zhou, Z.; Aguilar-Lopez, J.P.; Greco, R.; Bogaard, T. Effects of dynamic changes of desiccation cracks on preferential flow: Experimental investigation and numerical modeling. Hydrol. Earth Syst. Sci. 2023, 27, 783–808. [Google Scholar] [CrossRef] [Scilit]
- Ren, Z.; Lu, Q.; Liu, K.; Ni, P.; Mei, G. Model-scale tests to examine water pressures acting on potentially buoyant underground structures in clay strata. J. Rock Mech. Geotech. Eng. 2022, 14, 861–872. [Google Scholar] [CrossRef] [Scilit]
- Xie, Y.; Zhang, B.; Liu, B.; Zeng, Z.; Zhang, Y.; Zheng, Y. Shrinkage cracking and strength deterioration of red clay under cyclic drying and wetting. Alex. Eng. J. 2022, 61, 2574–2588. [Google Scholar] [CrossRef] [Scilit]
- Péron, H.; Hueckel, T.; Laloui, L.; Hu, L. Fundamentals of desiccation cracking of fine-grained soils: Experimental characterisation and mechanisms identification. Can. Geotech. J. 2009, 46, 1177–1201. [Google Scholar] [CrossRef] [Scilit]
- Tang, C.S.; Shi, B.; Liu, C.; Zhao, L.; Wang, B. Influencing factors of geometrical structure of surface shrinkage cracks in clayey soils. Eng. Geol. 2008, 101, 204–217. [Google Scholar] [CrossRef] [Scilit]
- Tang, C.S.; Cui, Y.J.; Shi, B.; Tang, A.-M.; Liu, C. Desiccation and cracking behaviour of clay layer from slurry state under wetting-drying cycles. Geoderma 2011, 166, 111–118. [Google Scholar] [CrossRef] [Scilit]
- Zeng, L.; Yu, H.-C.; Gao, Q.-F.; Zhang, Y.-H.; Bian, H.-B. Characterization of volumetric crack rate and its influence on unconfined compressive strength of red clay. J. Mater. Civ. Eng. 2023, 35, 04023418. [Google Scholar] [CrossRef] [Scilit]
- Cañizal, F.; Castro, J.; Cañizal, J.; Sagaseta, C. Pull-out capacity and failure mechanisms of strip anchors in clay. Energies 2020, 13, 3853. [Google Scholar] [CrossRef] [Scilit]
- Sloan, S.W. Geotechnical stability analysis. Géotechnique 2013, 63, 531–572. [Google Scholar] [CrossRef] [Scilit]
- Makrodimopoulos, A.; Martin, C.M. Lower bound limit analysis of cohesive-frictional materials using second-order cone programming. Int. J. Numer. Methods Eng. 2006, 66, 604–634. [Google Scholar] [CrossRef] [Scilit]
- Ye, X.J.; Wei, W.C.; Zhang, H.; Ji, Z.; Tang, H.; Zhao, X. Finite element analysis for pullout resistance and progressive failure of strip anchors in strain-softening marine soils. Sci. Rep. 2025, 15, 5543. [Google Scholar] [CrossRef] [Scilit] [PubMed]
- Xu, J.J.; Tang, C.S.; Cheng, Q.; Vahedifard, F.; Liu, B.; Shi, B. Monitoring and early detection of soil desiccation cracking using distributed fibre optical sensing. Géotechnique 2024, 74, 431–442. [Google Scholar] [CrossRef] [Scilit]
- Pei, H.F.; Zhao, Y.; Zhang, S.Q. An early warning model for desiccation-induced cracking of clay based on OFDR monitoring. Catena 2025, 257, 109190. [Google Scholar] [CrossRef] [Scilit]
- Merifield, R.S.; Sloan, S.W.; Yu, H.S. Stability of plate anchors in undrained clay. Géotechnique 2001, 51, 141–153. [Google Scholar] [CrossRef]
- Tiutkin, O.; Radkevych, A.; Dubinchyk, O.; Kharchenko, V. Parametric analysis of a strain state of a soil base strengthened with vertical elements. Min. Miner. Depos. 2024, 18, 104–112. [Google Scholar] [CrossRef] [Scilit]
- Petlovanyi, M.; Sai, K. Numerical modelling of critical conditions for the onset of a limit state in the rock mass surrounding unfilled underground voids in iron ore deposits. Eng. J. Satbayev Univ. 2026, 148, 38–47. [Google Scholar] [CrossRef] [Scilit]

Disclaimer/Publisher’s Note: The statements, opinions and data contained in all publications are solely those of the individual author(s) and contributor(s) and not of MDPI and/or the editor(s). MDPI and/or the editor(s) disclaim responsibility for any injury to people or property resulting from any ideas, methods, instructions or products referred to in the content. |
© 2026 by the authors. Licensee MDPI, Basel, Switzerland. This article is an open access article distributed under the terms and conditions of the Creative Commons Attribution (CC BY) license.