


Abstract
Mitigating climate change requires greater attention to non-carbon dioxide (non-CO2) greenhouse gas (GHG) emissions from the transportation sector, particularly methane (CH4) and nitrous oxide (N2O), which remain considerably less investigated than CO2. This study presents a Well-to-Wheels (WTW) assessment of CH4 and N2O emissions from road transportation in Türkiye using the Greenhouse Gases, Regulated Emissions, and Energy Use in Technologies (GREET) model. Historical vehicle fleet data covering the period 2013–2023 were used to characterize WTW emission intensities, while hypothetical scenarios for 2040 and 2050 were evaluated under alternative electricity generation pathways representing distinct energy-generation conditions. The analysis encompasses passenger cars, sport utility vehicles, and heavy-duty vehicles with internal combustion, hybrid, plug-in hybrid, battery electric, and hydrogen fuel-cell powertrains. The results demonstrate that WTW CH4 and N2O emission intensities vary among vehicle technologies and energy pathways over the study period. The lowest emission intensities are generally obtained for battery electric and fuel-cell vehicles under electricity-generation pathways based on renewable and nuclear energy sources. The findings further indicate that hybrid technologies can provide measurable short- to medium-term mitigation benefits, although their WTW CH4 and N2O emission intensities remain dependent on the corresponding vehicle and energy pathways. This study provides a Türkiye-specific Well-to-Wheels assessment of CH4 and N2O emission intensities from road transport across the historical period and hypothetical future electricity-generation scenarios, providing a basis for evaluating non-CO2 greenhouse gas emissions associated with alternative transportation technologies and energy pathways.
1. Introduction
The transportation sector is one of the largest contributors to global anthropogenic greenhouse gas (GHG) emissions and remains a major obstacle to achieving long-term climate neutrality [1]. Rapid urbanization, increasing vehicle ownership, and continued dependence on fossil fuels have intensified the environmental impacts of road transportation worldwide [2]. Although carbon dioxide (CO2) accounts for the largest share of transport-related greenhouse gas emissions, increasing scientific attention has shifted toward non-carbon dioxide (non-CO2) greenhouse gases, particularly methane (CH4) and nitrous oxide (N2O), because of their important contribution to climate forcing [3]. Despite being emitted in considerably smaller quantities than CO2, CH4 and N2O possess substantially greater global warming potential and therefore make a disproportionate contribution to climate change when expressed as carbon dioxide equivalents (CO2-eq) [4]. Consequently, reducing non-CO2 greenhouse gas emissions from the transportation sector has become an increasingly important objective of international climate policies and national decarbonization strategies [5,6]. The relationship between GHG emissions, green investment, and renewable energy development has also been examined in the broader context of climate mitigation, highlighting the importance of considering different greenhouse gases when evaluating energy-transition pathways [7].
CH4 and N2O differ fundamentally from CO2 in terms of their formation mechanisms, atmospheric behavior, and climate impacts, making their separate evaluation indispensable for comprehensive GHG assessments [3]. CH4 is emitted through incomplete combustion and fuel losses associated with natural gas production, processing, transmission, and utilization, whereas N2O can be generated during combustion and catalytic after-treatment processes in internal combustion engines [8]. Although CH4 and N2O are emitted in considerably smaller quantities than CO2, their markedly higher global warming potentials (GWP) substantially increase their contribution to climate change when expressed as CO2-eq, highlighting the importance of controlling even relatively low emission rates [3]. In addition to its direct greenhouse effect, CH4 contributes to the formation of tropospheric ozone, whereas N2O is recognized as both a long-lived GHG and the most significant ozone-depleting substance emitted during the twenty-first century, further emphasizing their environmental significance [9]. Research in other sectors, particularly agriculture, has also demonstrated the importance of CH4 and N2O emissions, with agricultural soil management, fertilizer application, rice cultivation, and farming practices representing relevant emission-related factors [10,11,12,13]. Consequently, accurate quantification of CH4 and N2O emissions has become increasingly important for evaluating the WTW emission performance of alternative vehicle technologies and supporting evidence-based transportation decarbonization strategies [1,4].
Road transportation represents an important source of CH4 and N2O emissions, although their magnitudes vary considerably depending on vehicle technology, fuel characteristics, engine operating conditions, and emission control systems [8]. In conventional gasoline and diesel vehicles, CH4 emissions are primarily associated with incomplete combustion, whereas N2O formation is strongly influenced by catalyst type, combustion temperature, and exhaust after-treatment efficiency [14]. The increasing deployment of hybrid electric vehicles (HEVs), plug-in hybrid electric vehicles (PHEVs), battery electric vehicles (BEVs), and fuel cell vehicles (FCVs) has substantially altered the emission profiles of these non-CO2 GHGs by reducing or eliminating direct combustion processes while shifting a greater proportion of emissions to upstream energy production pathways. Consequently, the WTW emission performance of alternative vehicle technologies cannot be reliably assessed using tailpipe emissions alone, particularly when electricity and hydrogen are produced through energy systems with different characteristics [15]. These considerations highlight the necessity of adopting WTW approaches that account for both direct vehicle emissions and upstream energy-related emissions when comparing current and future transportation technologies.
The environmental impacts of road transportation extend well beyond vehicle operation, making tailpipe emissions alone insufficient for evaluating the WTW emission performance of different vehicle technologies [16]. Substantial GHG emissions may occur during fuel extraction, processing, refining, transportation, electricity generation, and hydrogen production before energy reaches the vehicle, depending on the characteristics of the underlying energy system [1]. Consequently, the WTW methodology provides an established framework for assessing transportation-related emissions because it integrates both upstream fuel production and vehicle operation within a defined WTW boundary [15]. This perspective enables comparisons among conventional fuels, electricity, hydrogen, and alternative energy pathways while avoiding conclusions based solely on exhaust emissions. Therefore, WTW analysis provides a scientific basis for evaluating transportation technologies under different energy-generation conditions [15].
Among the available assessment tools, the GREET model has become one of the most extensively applied platforms for evaluating transportation energy use and environmental impacts [15]. Developed by Argonne National Laboratory, GREET estimates energy consumption together with GHG and air pollutant emissions throughout fuel-cycle pathways for a wide range of vehicle technologies and fuel production pathways [17]. Its flexible structure allows researchers to incorporate country-specific electricity generation mixes, fuel characteristics, technological efficiencies, and future energy scenarios, thereby providing regionally representative WTW assessments [15]. For this reason, GREET has been widely adopted in studies comparing conventional vehicles with hybrid, battery electric, and hydrogen fuel-cell technologies under diverse energy systems [17].
LCA has become an important methodology for evaluating the environmental performance of road transportation systems under different fuel pathways and energy scenarios. An early comprehensive study was conducted by Delucchi [18], who demonstrated that transportation-related GHG emissions should be evaluated across the fuel life cycle, including fuel processing, electricity generation, and vehicle operation, rather than relying solely on tailpipe emissions. Subsequent investigations further confirmed that the environmental performance of alternative vehicle technologies is strongly influenced by regional energy infrastructures. Nanaki and Koroneos [19] reported that EVs achieved the lowest life-cycle emissions among the vehicle technologies evaluated in Greece. In contrast, Wang et al. [20] showed that the environmental benefits of EVs in China were considerably reduced because electricity production remained heavily dependent on coal-fired power plants. Likewise, Huo et al. [21] concluded that although vehicle electrification could decrease overall GHG emissions, upstream electricity generation could simultaneously increase emissions of several air pollutants. More recent studies have reached similar conclusions, emphasizing that WTW emission performance depends not only on vehicle technology but also on electricity generation pathways and regional energy characteristics [17,22,23]. Despite these important advances, most previous studies have primarily focused on total GHG emissions or aggregated CO2-eq values, whereas the individual contributions and long-term evolution of CH4 and N2O have received comparatively limited attention, particularly under country-specific transportation and electricity transition scenarios.
The existing literature also reveals a notable lack of studies examining the long-term WTW emission intensities of CH4 and N2O associated with road-transport vehicle technologies in Türkiye. Previous studies have generally concentrated on fuel consumption, conventional air pollutants, or total GHG emissions, while detailed assessments of individual non-CO2 GHGs within a consistent WTW framework remain limited. Furthermore, historical WTW emission intensities have rarely been evaluated together with hypothetical future electricity-generation scenarios using a unified analytical framework. This limitation restricts a detailed understanding of how vehicle technologies and energy-generation pathways may influence CH4 and N2O emission intensities in Türkiye.
To address these research gaps, this study presents a Türkiye-specific WTW assessment of CH4 and N2O emission intensities associated with road-transport vehicle technologies using the GREET model. Historical vehicle fleet data covering the period from 2013 to 2023 are analyzed to characterize changes in WTW emission intensities associated with evolving vehicle technologies and fuel-use patterns. Hypothetical scenarios for 2040 and 2050 are subsequently evaluated under alternative electricity-generation pathways to examine the influence of distinct energy-generation conditions on the WTW emission intensities of conventional, hybrid, battery electric, and hydrogen fuel-cell vehicles. These scenarios represent specific electricity-generation conditions rather than forecasts of the actual future electricity mix or future fleet composition. By separately quantifying CH4 and N2O across different vehicle categories, fuel pathways, and hypothetical future energy-generation scenarios, this study addresses the following research question: How do WTW CH4 and N2O emission intensities vary among different road-transport vehicle technologies and energy pathways in Türkiye during the historical period and under the considered hypothetical future electricity-generation scenarios? The results provide a Türkiye-specific basis for understanding non-CO2 GHG emission characteristics associated with alternative transportation technologies and energy pathways.
2. Methodology
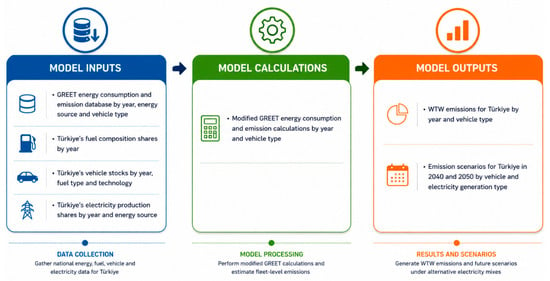
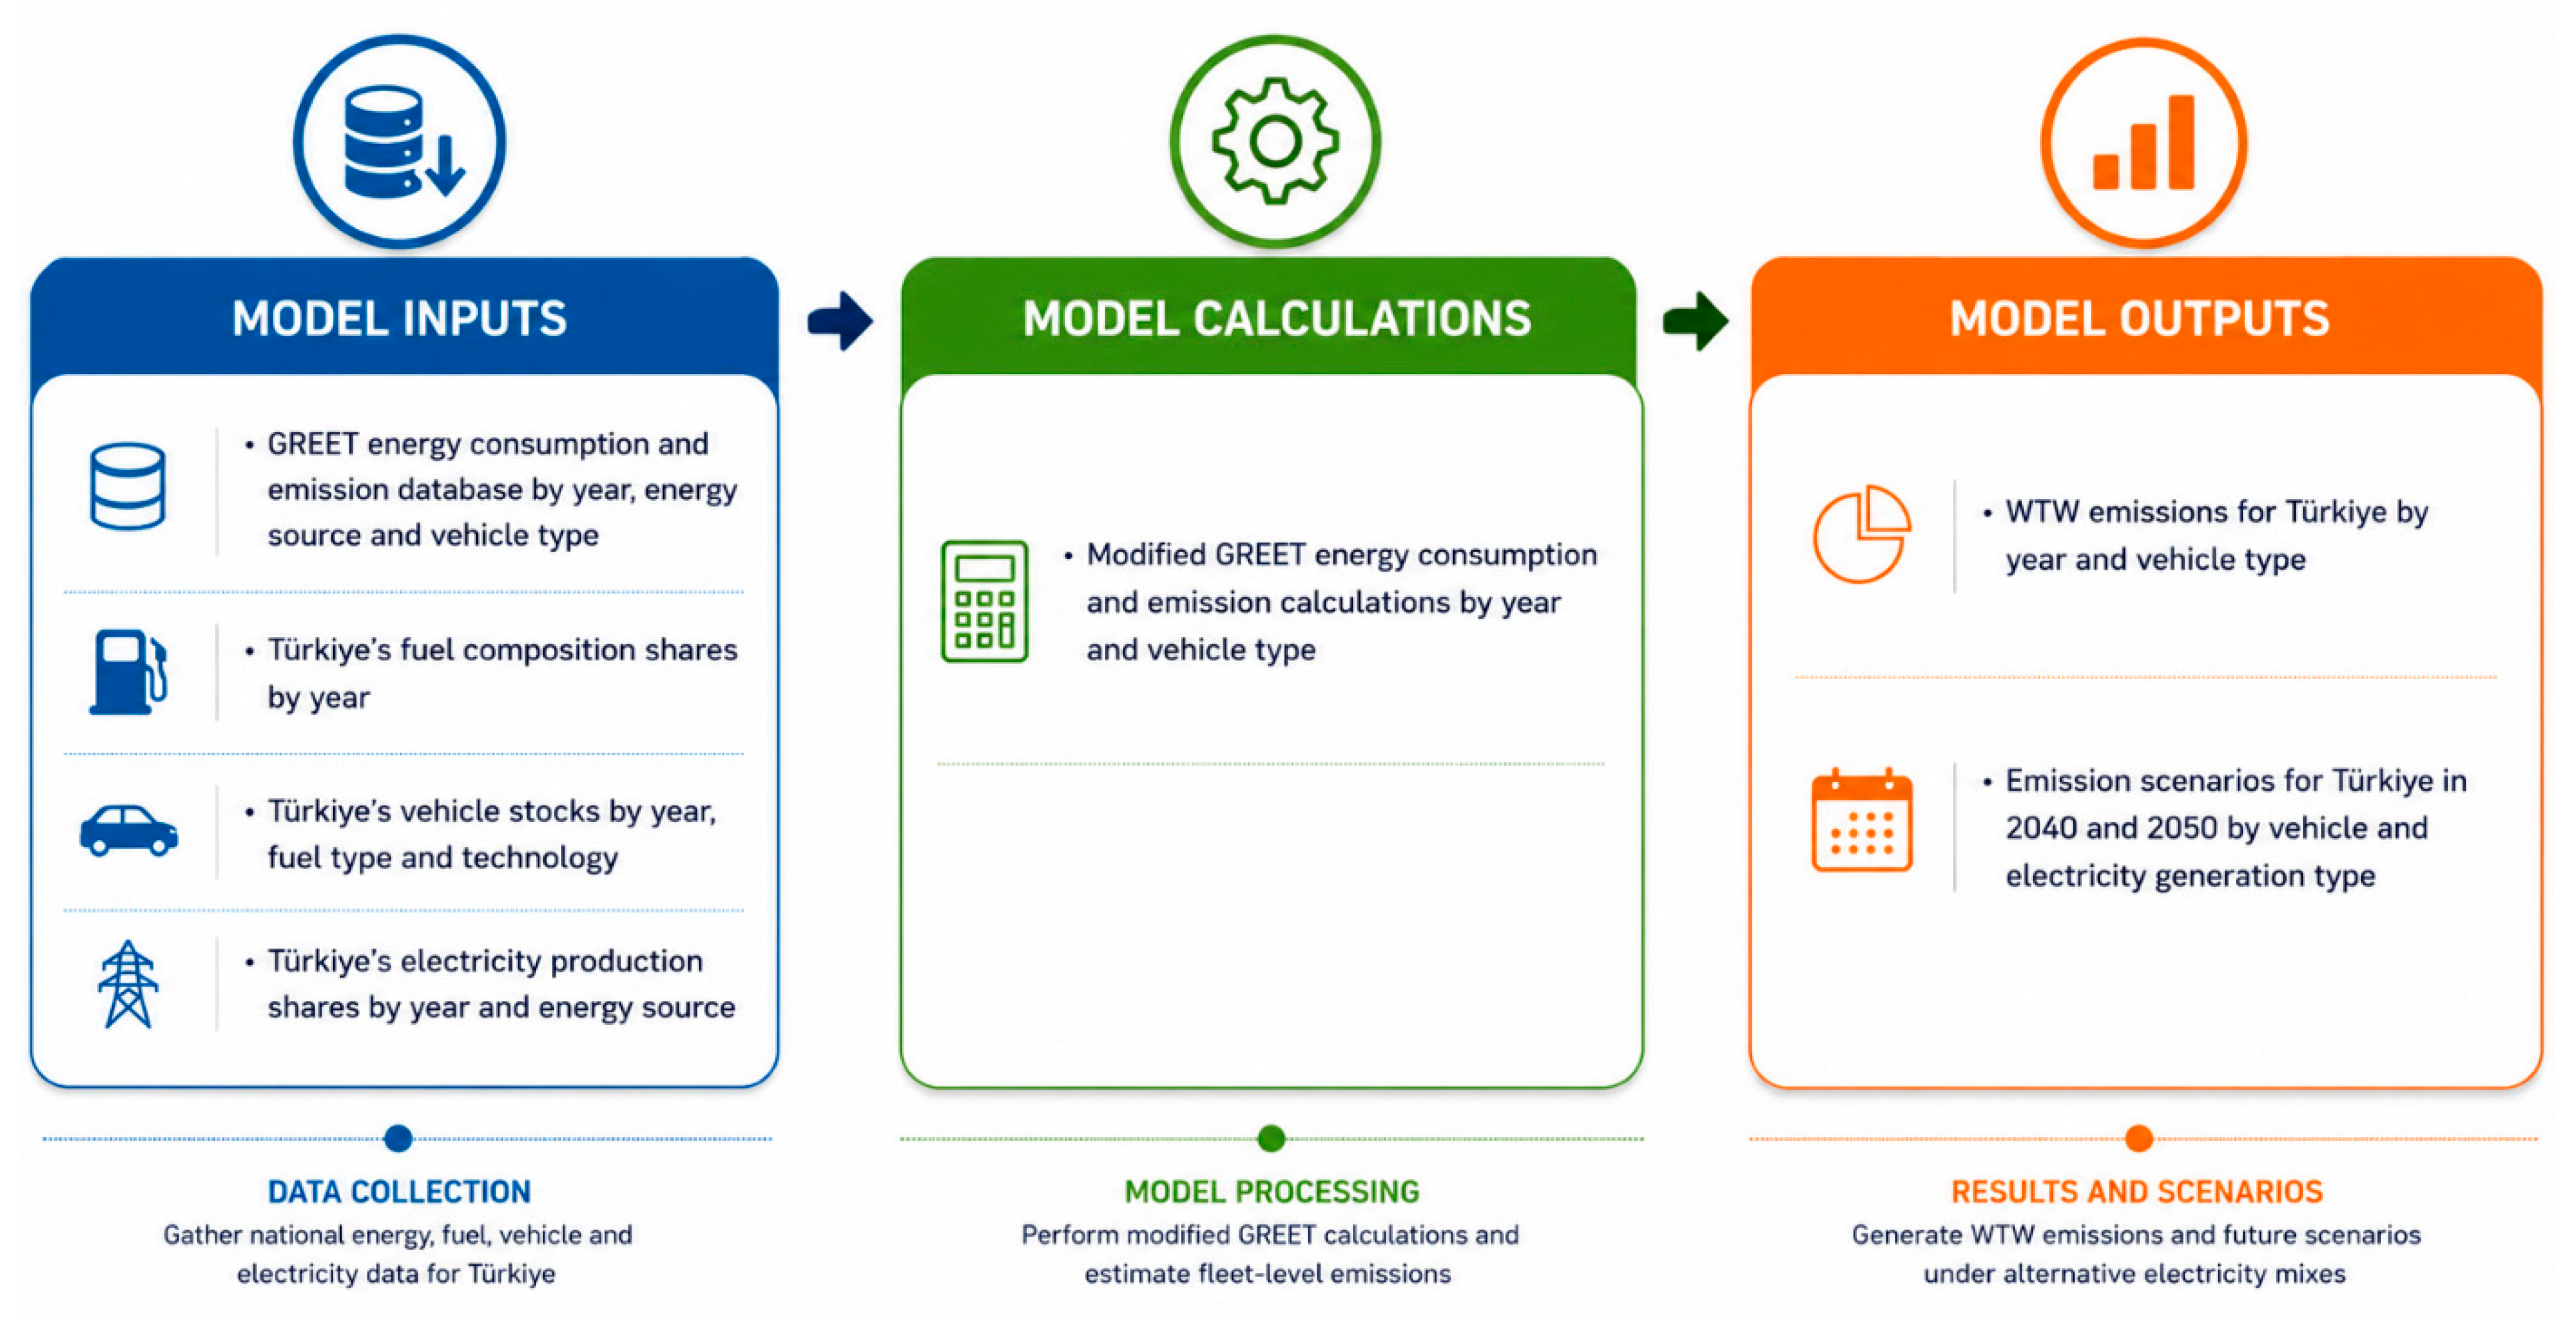
Figure 1 presents the overall methodological framework adopted in this study for assessing WTW emission intensities associated with road-transport vehicle technologies in Türkiye. The analysis is based on four principal input datasets: the GREET energy and emission database [24], annual fuel composition data, historical vehicle fleet statistics categorized by fuel type and technology, and annual electricity generation shares by energy source. These datasets provide the basis for estimating the energy consumption and emission characteristics of the vehicle technologies considered in the analysis over time. Within the computational stage, the original GREET framework was configured to incorporate Türkiye-specific transportation and energy data. Using the integrated input datasets, annual energy consumption and emission factors were calculated for each vehicle category and powertrain technology, enabling the estimation of WTW emission intensities for the years included in the analysis. The model produces WTW emission intensities for individual vehicle technologies and vehicle categories rather than annual national emission inventories. In addition to the historical assessment covering the period from 2013 to 2023, hypothetical scenarios for 2040 and 2050 were evaluated by considering alternative electricity-generation pathways and different vehicle technology configurations. These scenarios represent specific electricity-generation conditions for examining their effects on WTW emission intensities and are not intended to represent forecasts of the actual future electricity mix or future fleet composition.
Figure 1.
Methodological Framework of the WTW Assessment of CH4 and N2O Emission Intensities Associated with Road-Transport Vehicle Technologies in Türkiye.
The WTW methodology adopted in this study follows the principles of fuel-cycle assessment by accounting for emissions associated with both upstream energy production and vehicle operation. The upstream component, referred to as the Well-to-Pump (WTP) stage, includes energy resource extraction, fuel processing, electricity generation, hydrogen production, transportation, storage, and fuel distribution. The downstream component, known as the Pump-to-Wheel (PTW) stage, represents the direct use of fuels or electricity during vehicle operation. The combination of these two stages provides a consistent assessment of WTW emissions and enables comparisons among different fuel pathways and vehicle technologies. Based on this framework, the study quantifies WTW CH4 and N2O emission intensities for internal combustion engine vehicles (ICEVs), HEVs, PHEVs, BEVs, and hydrogen FCVs. The resulting WTW emission intensities are used to evaluate historical variations and to examine the effects of different vehicle technology configurations and electricity-generation pathways on non-CO2 greenhouse gas emissions.
The WTW boundary adopted in this study covers upstream energy production and vehicle operation. Accordingly, vehicle manufacturing, battery production, infrastructure construction, maintenance, and end-of-life processes are outside the defined WTW boundary. Therefore, the reported values represent WTW emission intensities rather than full LCA results. For the same reason, values of 0.00 reported for certain BEV pathways indicate zero WTW CH4 or N2O emissions within the adopted WTW boundary and should not be interpreted as zero environmental impact across the entire vehicle life cycle.
The emission calculations performed in this study were based on the computational framework of the GREET model, which estimates energy consumption and emissions by integrating both upstream energy production and vehicle operation. Compared with earlier transportation emission models, GREET provides a comprehensive representation of fuel production pathways, electricity generation technologies, vehicle powertrains, and energy conversion efficiencies within a unified WTW framework [15,25]. The version used in this study was configured with Türkiye-specific datasets, including annual vehicle fleet statistics, fuel composition, and electricity generation shares, allowing the original framework to represent the transportation and energy conditions considered in Türkiye. The mathematical formulation used to estimate emissions is summarized in Equations (1)–(5). The total emission of pollutant i associated with the considered energy pathways is calculated as the sum of direct combustion emissions and upstream emissions resulting from the production and delivery of each energy source. Direct emissions are determined from pollutant-specific emission factors and the corresponding energy consumption associated with each combustion technology, whereas upstream emissions are estimated through the recursive energy balance calculations implemented in the GREET framework. Accordingly, the calculated WTW emissions account for energy conversion requirements and fuel production processes throughout the defined WTW pathway. The emission factors adopted in this study were obtained from the GREET database, which incorporates values compiled from the U.S. Environmental Protection Agency [26] together with additional datasets documented by Wang [27]. These factors describe pollutant-specific emissions for different energy carriers, combustion technologies, and vehicle powertrains. Energy consumption for each WTW stage is subsequently determined by considering process efficiencies, technology shares, and energy source distributions. The framework updates these parameters according to the corresponding historical year or hypothetical future electricity-generation scenario included in the analysis. Following the calculation of stage-specific energy consumption and emissions, the GREET framework aggregates the results over the complete fuel cycle to obtain WTW emission intensities for each vehicle technology. In the present study, the framework was parameterized separately for each year between 2013 and 2023 using Türkiye-specific transportation and energy statistics. It was subsequently applied to the hypothetical electricity-generation scenarios considered for 2040 and 2050 to quantify the WTW emission intensities of CH4 and N2O for different vehicle technologies. The formulation in Equations (1)–(5) represents the calculation of direct and upstream emissions based on energy consumption, emission factors, energy-source shares, technology/process shares, and conversion efficiency. In particular, (ECj,k) represents the energy consumption associated with energy source (j) and process or technology (k), which is calculated from the total energy consumption, the corresponding energy-source share, and the technology/process share. The conversion-efficiency terms (Ein) and (PES) are calculated from the corresponding conversion efficiency (η). The symbols and units used in each equation are provided directly below the corresponding equation and are also included in the Nomenclature section. The resulting values represent WTW CH4 and N2O emission intensities within the defined WTW boundary rather than national annual emission inventories.
ECj,k = EC × ESSj × CTSk,j
Ein = 1/η
PES = 1/η − 1
The GREET model estimates WTW emissions by accounting for fossil fuel consumption and energy requirements throughout fuel production, processing, transportation, and vehicle operation. Since upstream energy demand varies according to fuel production technologies and transportation pathways, emissions are calculated separately for each stage of the fuel cycle before being aggregated within the WTW framework. In the present study, CH4 and N2O emissions were selected as the target pollutants and were reported in g/hkm for all vehicle categories to ensure a consistent basis for comparison. The simulations were performed under the default urban driving conditions implemented in the GREET model. To ensure that differences in emission results reflected changes in vehicle technology, fuel characteristics, and energy supply pathways, equivalent vehicle classes were evaluated throughout the historical and hypothetical future analyses. Fuel quantities were converted to energy using lower heating values (LHV), while the corresponding vehicle technologies and energy conversion efficiencies were assigned according to the selected simulation year. Türkiye-specific datasets were incorporated into the configured GREET framework by replacing the default electricity generation mix with annual national electricity production shares. Historical electricity generation data covering the period from 2009 to 2023 were introduced to represent the evolution of the Turkish power sector and to calculate annual WTW emission intensities for the 2013–2023 analysis period. Because electricity generation affects not only BEVs but also the upstream production of conventional transportation fuels, annual changes in the electricity mix were consistently reflected in the WTW emission calculations. The production pathways for conventional gasoline and diesel fuels were retained as defined in the original GREET database because their underlying refining and distribution processes were considered representative for the purposes of this study. In contrast, the blending ratios of ethanol and biodiesel were revised using the annual values specified in the relevant Turkish fuel regulations, thereby reflecting the historical evolution of renewable fuel utilization in the national transportation sector. Hypothetical scenarios were evaluated for the years 2040 and 2050 by considering alternative electricity-generation pathways based on oil, coal, natural gas, biomass, hydropower, geothermal, wind, solar, and nuclear energy. Each electricity source was independently assumed to supply the national grid to examine its effect on WTW CH4 and N2O emission intensities for different vehicle technologies. This scenario-based approach enables a systematic comparison of vehicle technologies under distinct hypothetical electricity-generation conditions rather than representing forecasts of the actual future electricity mix or future fleet composition.
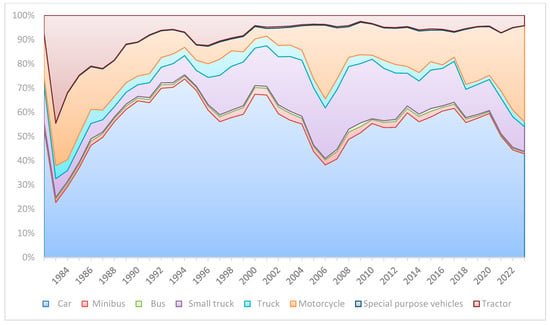
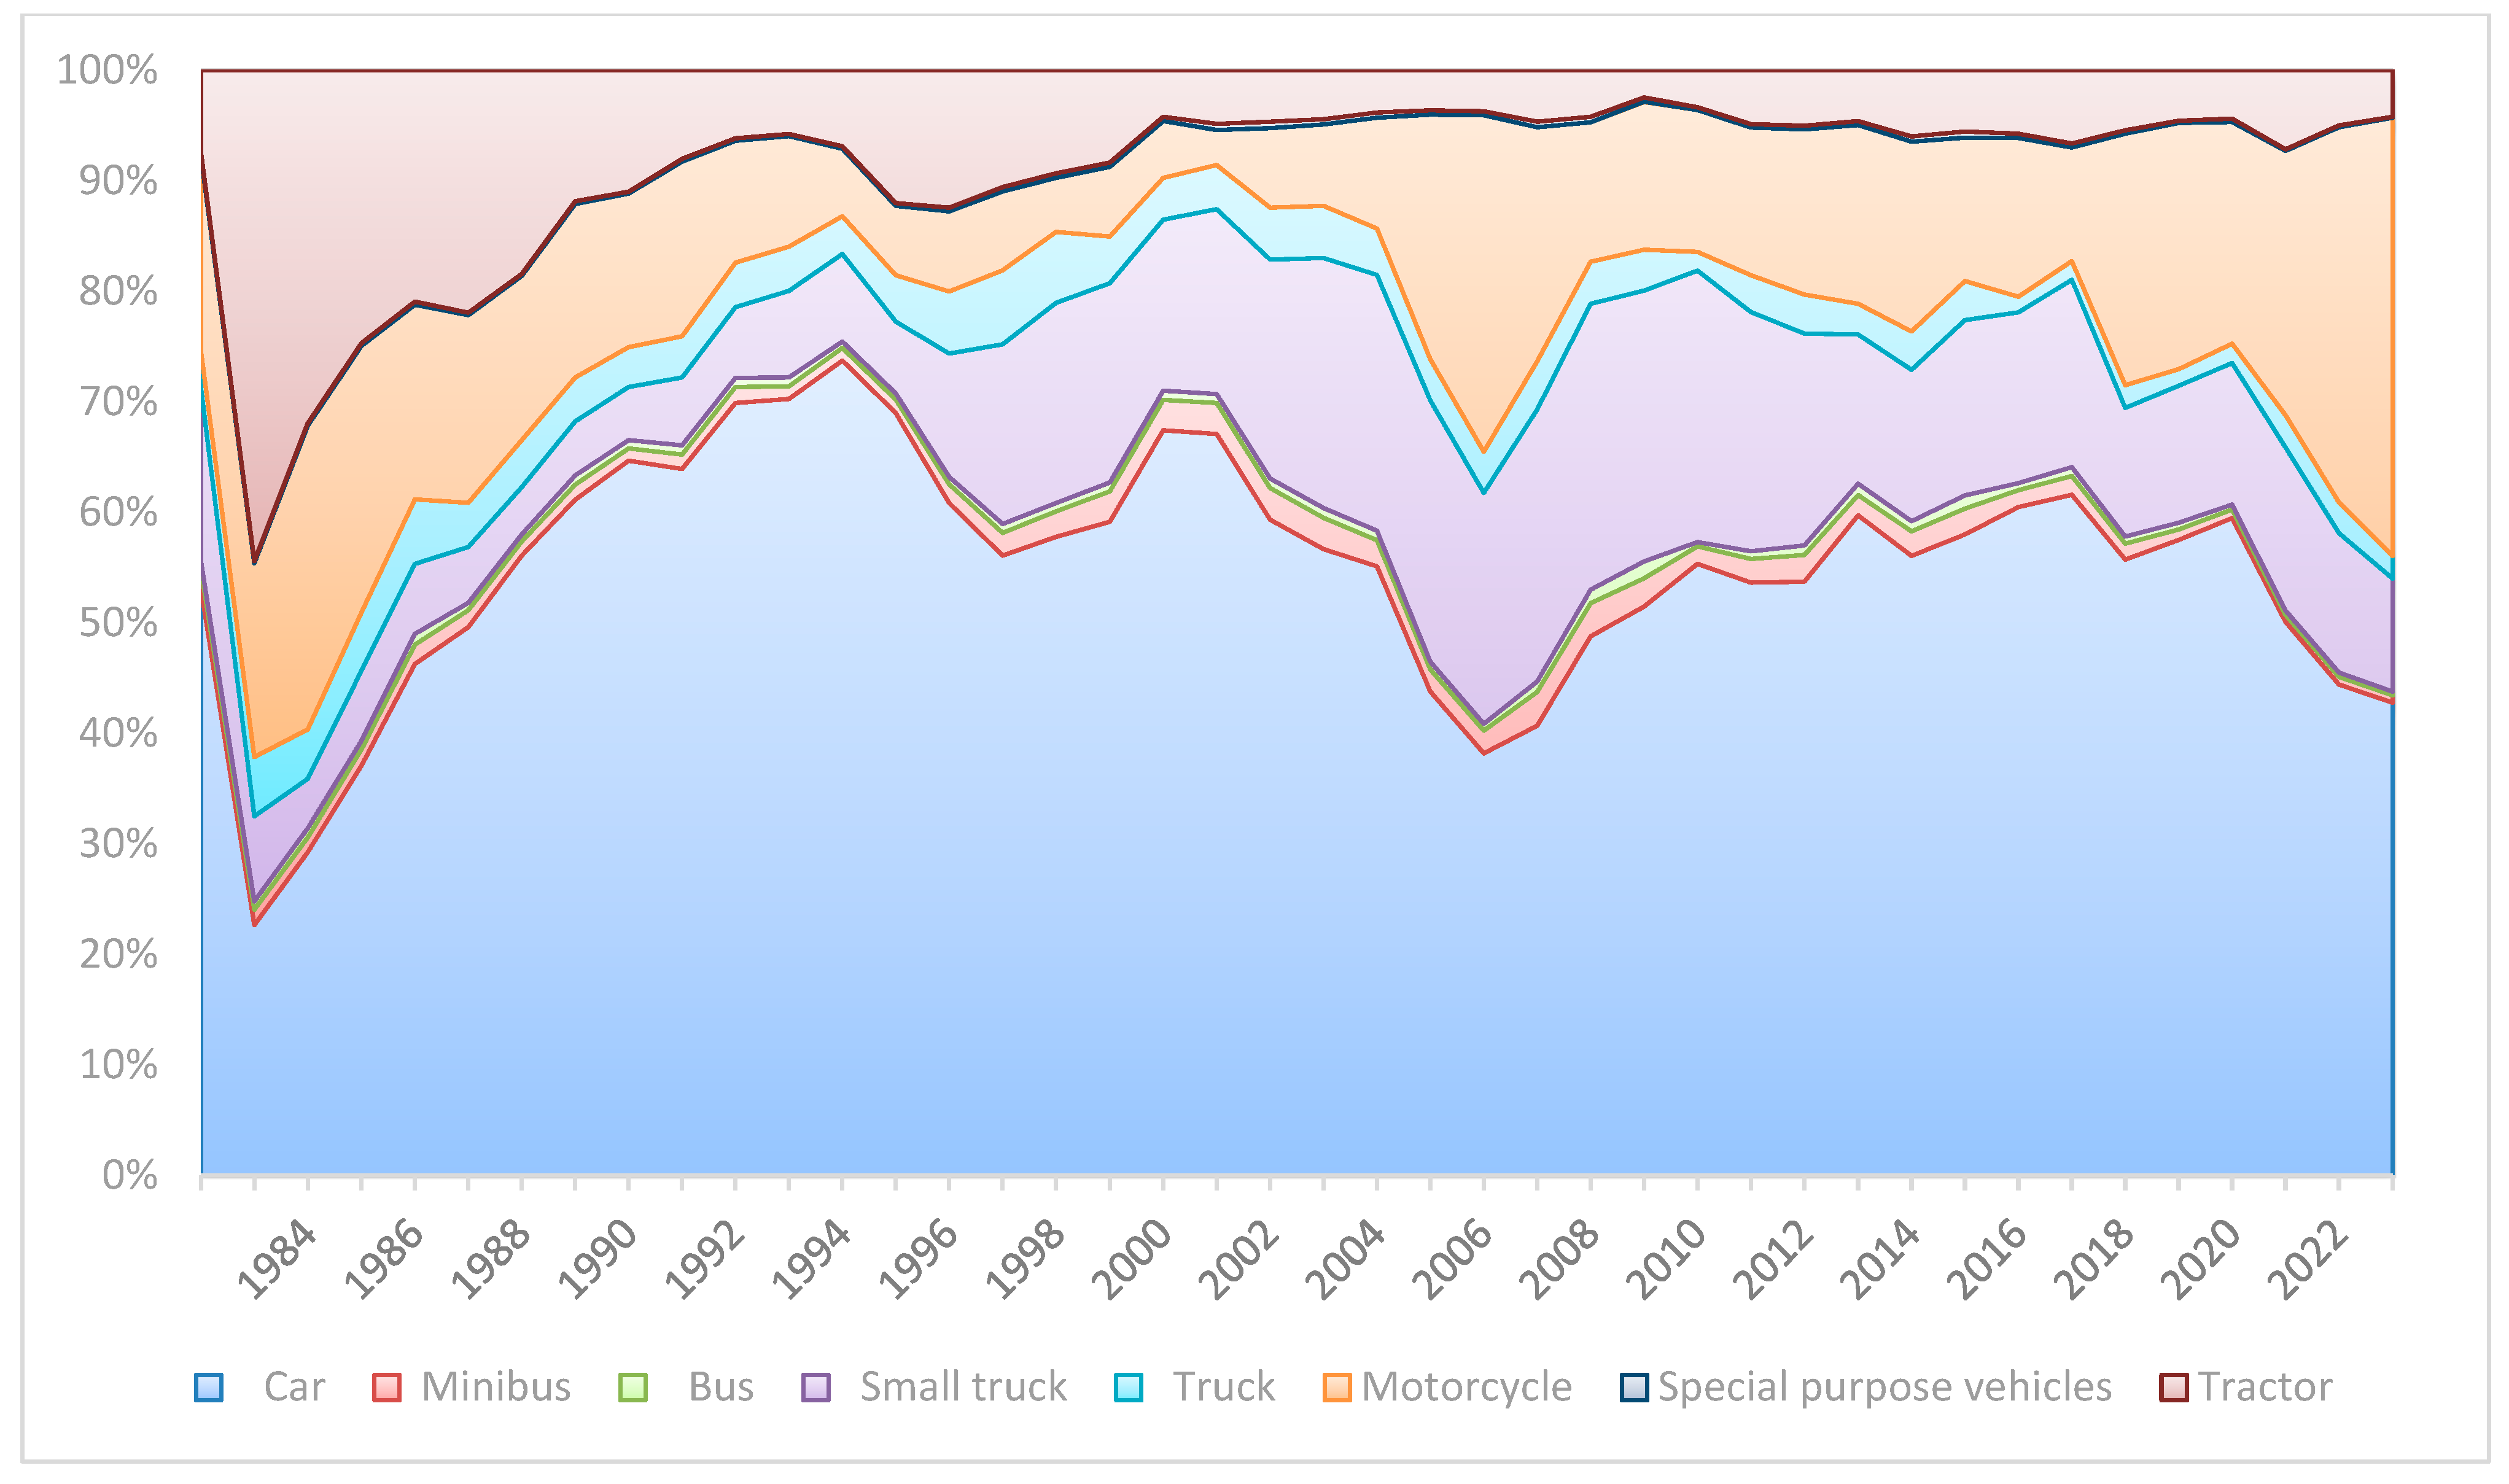
Table 1 summarizes the historical development and structural composition of the road vehicle fleet in Türkiye, whereas Figure 2 presents the proportional distribution of each vehicle category over the study period. Together, these datasets illustrate changes in the composition of the Turkish vehicle fleet over time. Passenger cars remained the largest vehicle category throughout the analysis, accounting for the highest proportion of registered vehicles in almost every year. Their numerical growth accelerated particularly after the late 1980s, reflecting the expansion of private vehicle ownership and urbanization. Although passenger cars continued to dominate the fleet, their relative contribution declined during the most recent years of the dataset. Between 2021 and 2023, the share of passenger cars decreased noticeably as motorcycle registrations increased at a considerably faster rate than other vehicle categories. This trend indicates a gradual diversification of the Turkish vehicle fleet, with motorcycles becoming an increasingly important component of the registered vehicle population. Agricultural tractors exhibited the opposite long-term behavior. Their relative share was comparatively high during the early years of the analysis but gradually decreased as the overall number of registered road vehicles expanded. In contrast, buses, minibuses, trucks, and special-purpose vehicles maintained relatively stable proportions throughout the study period, with only modest year-to-year variations. Year-to-year changes in vehicle registrations may also have been influenced by economic conditions, changes in vehicle purchasing costs, and regulatory or fiscal incentives affecting vehicle ownership and sales in Türkiye. These observations indicate that the overall fleet composition evolved primarily through changes in passenger cars and motorcycles, while the remaining vehicle categories experienced comparatively limited structural changes. The vehicle categories included in this study were selected according to their representation within the Turkish vehicle fleet and the availability of corresponding vehicle technologies in the GREET framework. The historical fleet data were used to characterize the vehicle categories and their relative representation in the study period, while the technology-specific calculations were performed for the vehicle configurations available in the GREET framework. This approach maintains consistency between the Turkish fleet structure and the vehicle technologies represented in the analysis. Consequently, the selected vehicle configuration provides a basis for evaluating WTW CH4 and N2O emission intensities under the historical period and the considered hypothetical future electricity-generation scenarios.
Table 1.
Number of road motor vehicles by year in Türkiye [28,29].
Figure 2.
Percentages of road motor vehicles in Türkiye by model year [28,29].
Table 2 presents the distribution of registered road vehicles in Türkiye according to fuel type between 2004 and 2023, illustrating the long-term evolution of fuel use within the registered vehicle fleet. During the early years of the study period, gasoline-powered vehicles represented the largest share of the fleet. However, their relative contribution declined steadily over time as the distribution of vehicle technologies and fuel types became more diversified. Although gasoline vehicles remained an important component of the fleet, their dominance diminished considerably by the end of the analysis period. In contrast, diesel-powered vehicles exhibited a sustained increase throughout the first half of the study period and became the predominant fuel type for several years. This expansion can be associated with the increased use of diesel vehicles and their fuel-economy characteristics. Nevertheless, after reaching its maximum share, the diesel fleet began to contract gradually, coinciding with changes in emission regulations, vehicle technologies, and the increasing availability of electrified vehicle technologies. Liquefied petroleum gas (LPG) has maintained a distinctive position within the Turkish transportation sector compared with many other countries. Its market share increased substantially until the mid-2010s, primarily associated with the widespread conversion of gasoline vehicles to LPG systems and the economic advantages associated with lower fuel prices. Although the relative proportion of LPG vehicles declined slightly in subsequent years, LPG continued to account for a considerable fraction of the registered vehicle fleet throughout the study period. The most notable structural change occurred in the adoption of electrified vehicle technologies. HEVs began to appear in measurable numbers after 2012, while BEVs experienced rapid market expansion during the final years of the dataset. Although their overall market shares remained relatively modest by 2023, their increasing representation indicates a growing presence of electrified vehicle technologies in the registered fleet. Vehicles with unidentified fuel types represented a progressively smaller proportion of the fleet over time, suggesting improvements in the completeness of vehicle registration records. The fuel-type distributions presented in Table 2 were incorporated into the WTW analysis to represent the annual distribution of fuel and vehicle technologies during the 2013–2023 historical period. Together with the vehicle-category data presented in Table 1, these distributions provide Türkiye-specific inputs for configuring the GREET framework and evaluating WTW CH4 and N2O emission intensities.
Table 2.
Distribution of vehicles in Türkiye according to fuel types.
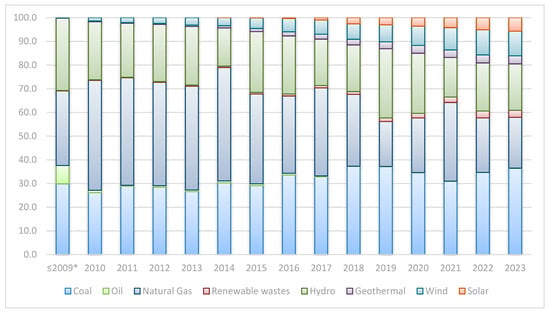
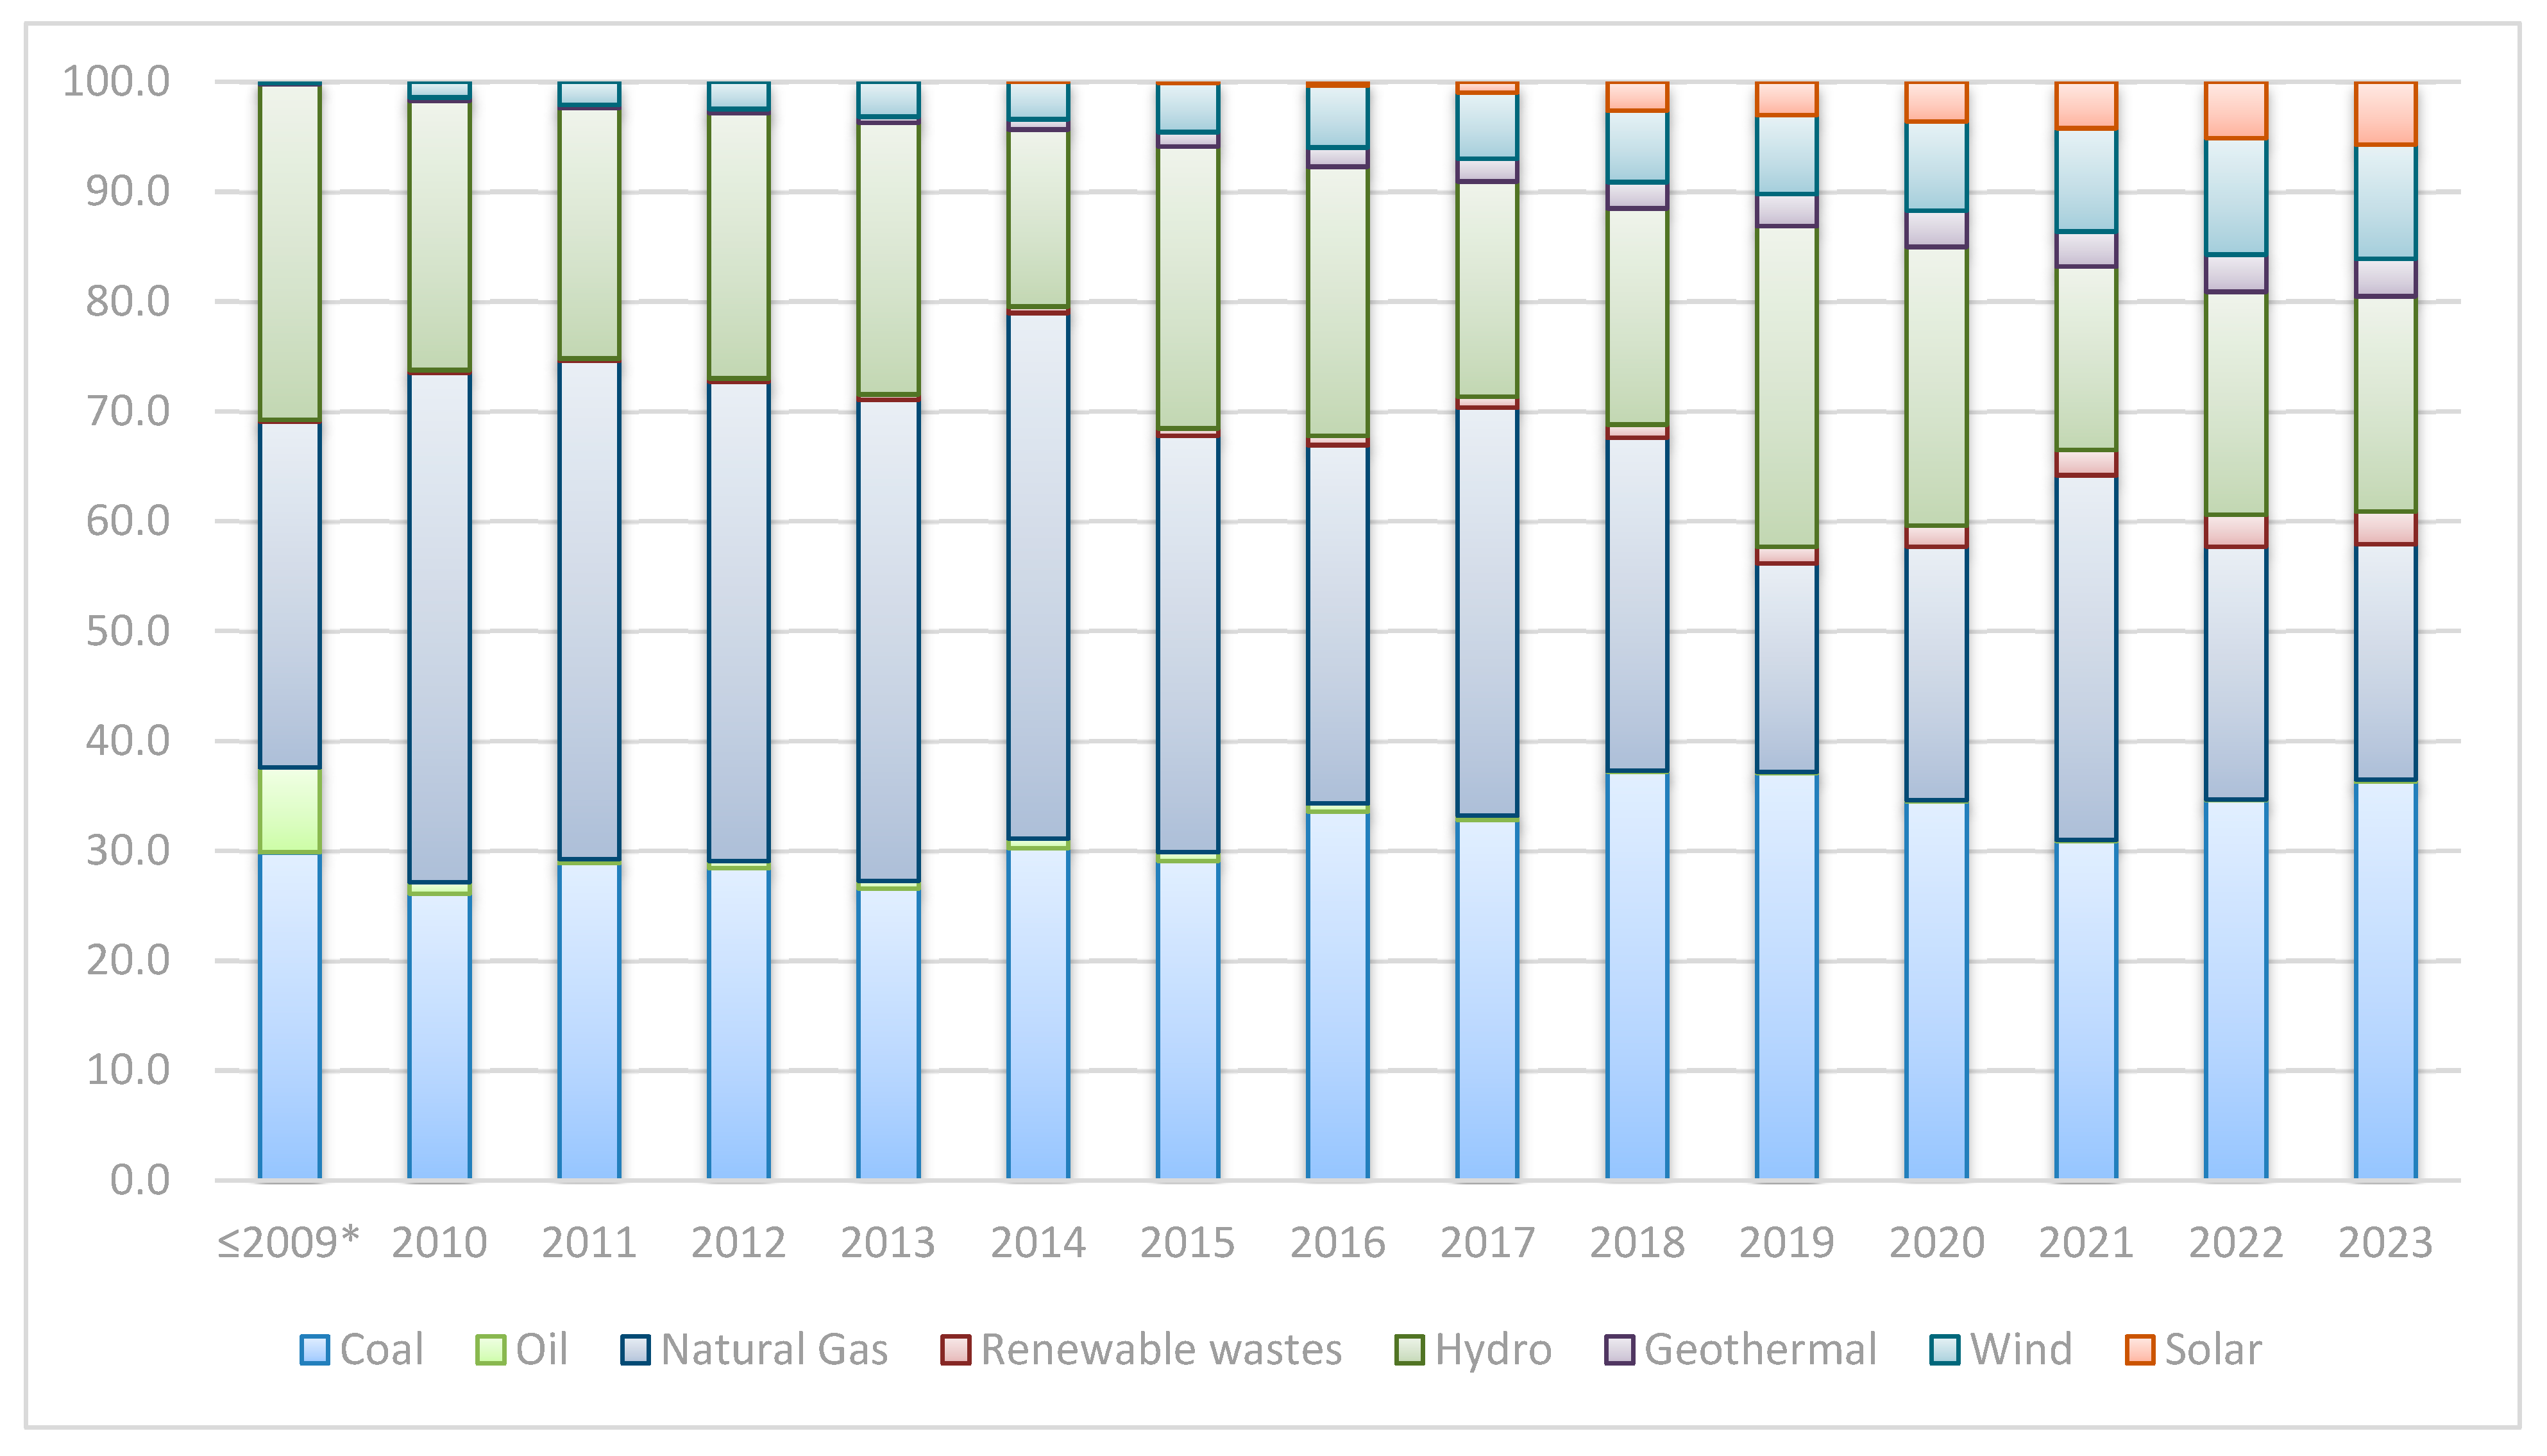
Figure 3 illustrates the structural transformation of Türkiye’s gross electricity generation mix from the historical baseline in 2009 through 2023. Throughout the evaluated period, fossil fuels remained important contributors to national electricity generation, although their internal composition changed over time. Coal-fired generation remained a major component, generally accounting for approximately 30% to 35% of annual electricity generation and reaching approximately 36% by 2023. Conversely, natural gas exhibited a strong increase in the early 2010s, accounting for nearly 48% of electricity generation in 2014, before declining to approximately 21% by 2023. Concurrently, oil-fired generation, which represented about 8% of the electricity generation mix before 2009, was substantially reduced, falling to less than 1% in recent years. The most notable trend illustrated in the figure is the increasing contribution of renewable electricity-generation pathways. Hydroelectric power remained the largest renewable component, although its share exhibited considerable year-to-year variation, ranging from approximately 16% to 29%. In parallel, non-hydro renewable sources experienced notable growth. Wind power, which had a limited contribution before 2009, increased to approximately 10% of the total generation mix by 2023. Solar energy emerged after 2015 and increased rapidly, reaching nearly 6% by the end of the study period. In addition, geothermal energy and renewable wastes showed gradual increases, each reaching approximately 3% by 2023. These changes illustrate the increasing diversification of Türkiye’s electricity generation mix and provide the historical electricity-generation inputs used in the WTW emission-intensity calculations for the 2013–2023 period.
Figure 3.
Gross electricity generation by primary energy resources in Türkiye by year [32,33]. Mean values and percentages of electricity production by energy sources in the years between 1975–2009.
3. Results and Discussion
The analysis of vehicle emission trends from 2013 to 2023 in Table 3 demonstrates a general decline in both CH4 and N2O emission intensities across most light-duty vehicle categories, reflecting continuous advancements in engine technology and exhaust after-treatment efficiency. Light-duty passenger vehicles, particularly SI HEV and EV, consistently exhibited relatively low WTW emission intensities throughout the decade, with EV CH4 emissions decreasing from 22.20 g/hkm in 2013 to 16.40 g/hkm by 2023. Conversely, HDVs maintained substantially higher absolute WTW emission intensities; nevertheless, significant reductions were achieved in specific heavy-duty segments, most notably in transit buses (HDV: Transit Bus CIDI), where CH4 emissions decreased from 245.70 g/hkm in 2013 to 121.40 g/hkm in 2023. The year-to-year variations observed for some vehicle categories, including the changes in CH4 emissions for transit buses and short-haul trucks, should be interpreted as outcomes of the year-specific parameterization of the GREET framework rather than as direct measurements of annual on-road emissions. For example, the increase in CH4 emissions for short-haul trucks (HDV: Combination Short-Haul Truck CIDI) from 154.20 g/hkm in 2019 to 210.60 g/hkm in 2023 indicates that WTW emission intensities may vary according to the corresponding vehicle, fuel, and energy-pathway parameters used for each year. These results therefore demonstrate that reductions are not uniform across all vehicle categories and that the WTW emission intensity of heavy-duty technologies remains dependent on the specific technology and energy pathway considered.
Table 3.
Vehicle CH4 and N2O emissions by year in Türkiye.
The findings obtained from the analysis are broadly consistent with the established literature concerning the relative emission characteristics of different vehicle and fuel pathways, while the present results specifically represent WTW CH4 and N2O emission intensities rather than annual national emission inventories. The lower CH4 and N2O intensities observed for some light-duty passenger platforms, particularly SI HEVs and BEVs, are consistent with studies by Ke et al. [34] and Yang et al. [35], which reported lower emissions for hybrid and electric configurations compared with conventional ICEVs under the conditions considered in those studies. Furthermore, the moderate emission profile of alternative fuels such as SI ICEV-LPG is generally consistent with the findings reported by Choi et al. [36]. The substantial reduction observed for heavy-duty transit buses is consistent with the influence of improved combustion control and exhaust after-treatment technologies on vehicle emissions, as reported for modern commercial road vehicles [37]. However, the results should not be interpreted solely in terms of tailpipe performance because the present assessment covers the complete WTW boundary. Accordingly, residual CH4 and N2O emissions for electric vehicles can originate from upstream electricity-generation pathways, while variations observed for conventional and heavy-duty technologies can also reflect upstream fuel-production processes [38]. The results therefore demonstrate the importance of considering both vehicle technology and the associated energy pathway when comparing WTW CH4 and N2O emission intensities [39].
The hypothetical electricity-generation scenarios for 2040 and 2050 presented in Table 4 further demonstrate the influence of energy-generation pathways on the WTW CH4 and N2O emission intensities of different vehicle technologies. These scenarios represent individual electricity-generation pathways applied independently to the national grid and are intended to isolate the effects of alternative energy-generation conditions; they do not represent forecasts of Türkiye’s actual future electricity mix or future fleet composition. Across the evaluated scenarios, conventional gasoline and diesel vehicles generally exhibit relatively stable WTW emission intensities, reflecting the treatment of their corresponding fuel-production pathways and vehicle technologies within the configured GREET framework. In contrast, BEVs show substantially greater sensitivity to the electricity-generation pathway because their upstream WTW emissions depend directly on the electricity used for vehicle operation. Under fossil-fuel-dominated pathways, including oil-, coal-, and natural-gas-based electricity generation, BEVs may exhibit increased CH4 and N2O emission intensities because of upstream electricity-generation emissions. Conversely, under renewable and nuclear electricity-generation pathways, BEVs generally exhibit substantially lower WTW emission intensities, with some pathways resulting in values of 0.00 g/hkm for CH4 or N2O. Such 0.00 values indicate zero emissions within the defined WTW boundary and the adopted GREET pathway assumptions; they should not be interpreted as zero emissions over the complete vehicle life cycle because vehicle manufacturing, battery production, infrastructure, maintenance, and end-of-life processes are outside the adopted WTW boundary. Hydrogen FCVs present a different pathway-dependent behavior. While gaseous hydrogen platforms maintain comparatively moderate WTW emission intensities across the evaluated scenarios, liquid hydrogen vehicles (FCV-Liquid H2) exhibit elevated CH4 intensities, reaching up to 44.70 g/hkm under coal-intensive scenarios. This result reflects the upstream energy requirements associated with hydrogen production and conditioning, including the additional energy demand associated with hydrogen liquefaction, together with the corresponding energy-generation pathway. Overall, the results indicate that the WTW CH4 and N2O emission intensities of alternative vehicle technologies depend not only on the vehicle powertrain but also on the upstream energy pathway, and that lower WTW emission intensities for electrified and hydrogen technologies are associated with lower-emission electricity and energy-production pathways.
Table 4.
Vehicle CH4 and N2O emissions scenario of Türkiye in 2040–2050.
4. Conclusions
This study provides a Türkiye-specific assessment of WTW CH4 and N2O emission intensities by combining historical analysis for 2013–2023 with hypothetical electricity-generation scenarios for 2040 and 2050 across different powertrain technologies and energy pathways. The historical results indicate that changes in vehicle technologies, engine efficiency, and vehicle-level after-treatment systems were associated with reductions in WTW CH4 and 22O emission intensities across several light-duty vehicle categories and specific heavy-duty segments, including transit buses. However, these reductions were not uniform across all vehicle technologies and years, and some vehicle categories exhibited increases in emission intensities during specific periods. The hypothetical 2040 and 2050 scenarios further demonstrate that vehicle technology alone does not determine WTW 4H4 and N2O emission intensities, as upstream electricity-generation pathways can substantially affect the resulting values. These findings highlight the importance of considering vehicle technologies together with their associated energy pathways within a consistent WTW boundary.
The results indicate that battery electric vehicles (Car: EV) and spark-ignition hybrid electric vehicles (Car: SI HEV) generally exhibited relatively low WTW CH4 and N2O emission intensities among the evaluated light-duty technologies under the considered conditions. However, the results do not identify a single technology as uniformly lower-emitting across all vehicle categories and energy pathways. Among the heavy-duty technologies, short-haul trucks (HDV: Combination Short-Haul Truck CIDI) exhibited comparatively high emission intensities in several cases, including increases in CH4 emissions after 2019. Liquid hydrogen platforms (FCV-Liquid H2) also exhibited elevated CH4 emission intensities under certain electricity-generation scenarios, reaching up to 44.70 g/hkm under coal-intensive generation. This result reflects the contribution of upstream hydrogen production and conditioning processes, including the additional energy requirements associated with hydrogen liquefaction, together with emissions associated with the corresponding energy-generation pathway. The results therefore demonstrate that the WTW emission characteristics of alternative vehicle technologies depend on both powertrain characteristics and upstream energy pathways.
For Türkiye, the findings provide a quantitative basis for comparing alternative road-transport vehicle and energy pathways in terms of WTW CH4 and N2O emission intensities. In particular, the hypothetical 2040 and 2050 scenarios demonstrate that the WTW emission intensities of electrified and hydrogen-based technologies are strongly dependent on the associated electricity and energy-production pathways. The lower values obtained under renewable and nuclear electricity-generation scenarios indicate the potential importance of changes in the energy supply system for reducing upstream non-CO2 greenhouse gas emissions associated with road transport. At the same time, the 2040 and 2050 results should not be interpreted as forecasts of Türkiye’s future electricity mix or vehicle fleet composition. The reported values represent WTW emission intensities within the defined system boundary; vehicle manufacturing, battery production, infrastructure construction, maintenance, and end-of-life processes are outside the scope of the analysis. Accordingly, the study provides a Türkiye-specific WTW assessment of CH4 and N2O across alternative vehicle technologies and energy pathways, while recognizing that the resulting emission intensities depend on the assumed vehicle, fuel, and electricity-generation conditions.
Funding
This research received no external funding.
Data Availability Statement
The original contributions presented in this study are included in the article. Further inquiries can be directed to the corresponding author.
Conflicts of Interest
The author declares that there are no competing interests in this study.
Nomenclature
| BEV | battery electric vehicle |
| CE | combustion emission |
| CH4 | methane |
| CO2 | carbon dioxide |
| CO2-eq | carbon dioxide equivalents |
| CTS | combustion technology share |
| E | energy |
| EC | energy consumption |
| EF | emission factor |
| ESS | energy source share |
| EV | electric vehicle |
| FCV | fuel cell vehicle |
| GHG | greenhouse gas |
| GREET | greenhouse gases, regulated emissions, and energy use in transportation |
| GWP | global warming potential |
| HEV | hybrid electric vehicle |
| hkm | hundred kilometres |
| ICEV | internal combustion engine vehicle |
| LCA | life-cycle assessment |
| LHV | lower-heating value |
| LPG | liquefied petroleum gas |
| N2O | nitrous oxide |
| PES | process energy source |
| PHEV | plug-in hybrid electric vehicle |
| PTW | pump-to-wheel |
| SI | spark ignition |
| TE | total emission |
| UE | upstream emission |
| WTP | well-to-pump |
| WTW | well-to-wheel |
| Symbols | |
| ∑ | summation |
| η | efficiency |
| Subscripts | |
| i | pollutant of the energy source |
| in | input |
| j | energy source |
| k | combustion technology |
References
- IPCC. Climate Change 2022: Mitigation of Climate Change; Cambridge University Press: Cambridge, UK, 2022; Available online: https://www.ipcc.ch/report/ar6/wg3/ (accessed on 1 July 2026).
- Edenhofer, O.; Pichs-Madruga, R.; Sokona, Y. (Eds.) Climate Change 2014: Mitigation of Climate Change. Contribution of Working Group III to the Fifth Assessment Report of the Intergovernmental Panel on Climate Change; Sims, R.; Schaeffer, R.; Creutzig, F.; Cruz-Núñez, X.; D’Agosto, M.; Dimitriu, D.; Meza, M.J.; Fulton, L.; Kobayashi, S.; Lah, O., Translators; Cambridge University Press: Cambridge, UK, 2014; pp. 599–670. Available online: https://www.ipcc.ch/report/ar5/wg3/ (accessed on 25 October 2026).
- IPCC. Climate Change 2021: The Physical Science Basis; Cambridge University Press: Cambridge, UK, 2021; Available online: https://www.ipcc.ch/report/ar6/wg1/ (accessed on 25 October 2026).
- UNEP; CCAC. Global Methane Assessment: Benefits and Costs of Mitigating Methane Emissions; United Nations Environment Programme: Nairobi, Kenya, 2021; Available online: https://www.unep.org/resources/report/global-methane-assessment (accessed on 25 October 2026).
- IEA. CO2 Emissions in 2023; International Energy Agency: Paris, France, 2024; Available online: https://www.iea.org/reports/co2-emissions-in-2023 (accessed on 25 October 2026).
- Crippa, M.; Guizzardi, D.; Pagani, F.; Banja, M.; Muntean, M.; Schaaf, E.; Monforti-Ferrario, F.; Becker, W.; Quadrelli, R.; Risquez Martin, A.; et al. GHG Emissions of All World Countries—2024 Report; Publications Office of the European Union: Luxembourg, 2024; Available online: https://edgar.jrc.ec.europa.eu/report_2024 (accessed on 25 October 2026).
- Kwilinski, A.; Dobrovolska, O.; Wołowiec, T.; Cwynar, W.; Didenko, I.; Artyukhov, A.; Dluhopolskyi, O. Carbon Dioxide, Nitrous Oxide, and Methane: What Types of Greenhouse Gases Are Most Affected by Green Investments and Renewable Energy Development? Energies 2024, 17, 804. [Google Scholar] [CrossRef] [Scilit]
- IPCC. 2006 IPCC Guidelines for National Greenhouse Gas Inventories, Volume 2: Energy; Institute for Global Environmental Strategies: Hayama, Japan, 2006; Available online: https://www.ipcc-nggip.iges.or.jp/public/2006gl/vol2.html (accessed on 25 October 2026).
- Ravishankara, A.R.; Daniel, J.S.; Portmann, R.W. Nitrous Oxide (N2O): The Dominant Ozone-Depleting Substance Emitted in the 21st Century. Science 2009, 326, 123–125. [Google Scholar] [CrossRef] [Scilit] [PubMed]
- Basheer, S.; Wang, X.; Farooque, A.A.; Nawaz, R.A.; Pang, T.; Neokye, E.O. A Review of Greenhouse Gas Emissions from Agricultural Soil. Sustainability 2024, 16, 4789. [Google Scholar] [CrossRef] [Scilit]
- Arel, C.M.; Brye, K.R.; Della Lunga, D.; Roberts, T.L.; Adams, R. Greenhouse Gas Emissions from Flood-Irrigated Rice as Affected by Phosphorus Fertilizer Source. Agriculture 2025, 15, 815. [Google Scholar] [CrossRef] [Scilit]
- Wang, S.; Wei, X.; Luan, X.; Li, J.; Yang, Y.; Pang, J.; Gao, F. Meta-Analysis of the Effects of Different Farming Measures on Greenhouse Gas Emissions from Farmland in China. Land 2025, 14, 413. [Google Scholar] [CrossRef] [Scilit]
- Huang, H.; Wang, Z.; Ma, Y.; Zhu, P.; Zhang, X.; Chen, H.; Li, H.; Zheng, R. The Impact of Rice–Frog Co-Cultivation on Greenhouse Gas Emissions of Reclaimed Paddy Fields. Biology 2025, 14, 861. [Google Scholar] [CrossRef] [Scilit] [PubMed]
- Huai, T.; Durbin, T.D.; Miller, J.W.; Norbeck, J.M. Nitrous Oxide Emissions from Light-Duty Motor Vehicles. Atmos. Environ. 2004, 38, 6621–6629. [Google Scholar] [CrossRef] [Scilit]
- Wang, M.; Elgowainy, A.; Lee, U.; Baek, K.H.; Bafana, A.; Benavides, P.T.; Burnham, A.; Cai, H.; Cappello, V.; Chen, P.; et al. Summary of Expansions and Updates in GREET® 2022. ANL/ESIA-22/1; Argonne National Laboratory: Lemont, IL, USA, 2022. Available online: https://greet.anl.gov/ (accessed on 1 July 2026).
- ISO 14040:2006; Environmental Management—Life Cycle Assessment—Principles and Framework. International Organization for Standardization: Geneva, Switzerland, 2006. Available online: https://www.iso.org/standard/37456.html (accessed on 1 July 2026).
- Burnham, A.; Lu, Z.; Wang, M.; Elgowainy, A. Regional Emissions Analysis of Light-Duty Battery Electric Vehicles. Atmosphere 2021, 12, 1482. [Google Scholar] [CrossRef] [Scilit]
- Delucchi, M.A. Emissions of Greenhouse Gases from the Use of Transportation Fuels and Electricity: Main Text; ANL/ESD/TM-22; Center for Transportation Research, Argonne National Laboratory: Argonne, IL, USA, 1991; Volume 1. Available online: https://digital.library.unt.edu/ark:/67531/metadc1068598/ (accessed on 1 July 2026).
- Nanaki, E.A.; Koroneos, C.J. Comparative Economic and Environmental Analysis of Conventional, Hybrid and Electric Vehicles—The Case Study of Greece. J. Clean. Prod. 2013, 53, 261–266. [Google Scholar] [CrossRef] [Scilit]
- Wang, D.; Zamel, N.; Jiao, K.; Zhou, Y.; Yu, S.; Du, Q.; Yin, Y. Life Cycle Analysis of Internal Combustion Engine, Electric and Fuel Cell Vehicles for China. Energy 2013, 59, 402–412. [Google Scholar] [CrossRef] [Scilit]
- Huo, H.; Cai, H.; Zhang, Q.; Liu, F.; He, K. Life-Cycle Assessment of Greenhouse Gas and Air Emissions of Electric Vehicles: A Comparison between China and the U.S. Atmos. Environ. 2015, 108, 107–116. [Google Scholar] [CrossRef] [Scilit]
- Hawkins, T.R.; Singh, B.; Majeau-Bettez, G.; Strømman, A.H. Comparative Environmental Life Cycle Assessment of Conventional and Electric Vehicles. J. Ind. Ecol. 2013, 17, 53–64. [Google Scholar] [CrossRef] [Scilit]
- Bieker, G. A Global Comparison of the Life-Cycle Greenhouse Gas Emissions of Combustion Engine and Electric Passenger Cars; International Council on Clean Transportation: Washington, DC, USA, 2021; Available online: https://theicct.org/ (accessed on 1 July 2026).
- Argonne National Laboratory. GREET Model. Available online: https://greet.anl.gov/ (accessed on 1 July 2026).
- Wang, M.Q. GREET 1.5—Transportation Fuel-Cycle Model. Volume 1: Methodology, Development, Use, and Results; Argonne National Laboratory: Argonne, IL, USA, 1999. Available online: https://publications.anl.gov/anlpubs/1999/10/34035.pdf (accessed on 1 July 2026).
- U.S. Environmental Protection Agency. Air Emissions Factors and Quantification. Available online: https://www.epa.gov/air-emissions-factors-and-quantification (accessed on 1 July 2021).
- Wang, M.Q. GREET 1.5—Transportation Fuel-Cycle Model. Volume 2: Appendixes of Data and Results; Argonne National Laboratory: Argonne, IL, USA, 1999. Available online: https://publications.anl.gov/anlpubs/1999/10/34034.pdf (accessed on 1 July 2026).
- General Directorate of Highways of the Republic of Türkiye. Transportation Statistics 2023; Turkish Statistical Institute: Ankara, Türkiye, 2023. Available online: https://www.kgm.gov.tr/Sayfalar/KGM/SiteTr/Trafik/TrafikveUlasimBilgileri.aspx (accessed on 12 February 2025).
- Turkish Statistical Institute (TurkStat). Transportation Statistics 2023. Available online: https://www.tuik.gov.tr (accessed on 12 February 2025).
- Official Gazette of the Republic of Türkiye. Available online: https://www.resmigazete.gov.tr/ (accessed on 12 February 2025).
- European LPG Association. Propane/Butane Mixture in Countries around Europe. Available online: https://www.mylpg.eu/useful/lpg-mixture (accessed on 12 February 2025).
- TEİAŞ. Electricity Generation, Consumption, and Losses Reports. Available online: https://www.teias.gov.tr/aylik-elektrik-uretim-tuketim-raporlari (accessed on 8 February 2025).
- Turkish Energy Market Regulatory Authority (EPDK). Electricity Market Development Report 2023. Available online: https://www.epdk.gov.tr/Detay/Icerik/3-0-24-3/elektrikyillik-sektor-raporu (accessed on 8 February 2025).
- Ke, W.; Zhang, S.; He, X.; Wu, Y.; Hao, J. Well-to-Wheels Energy Consumption and Emissions of Electric Vehicles: Mid-Term Implications from Real-World Features and Air Pollution Control Progress. Appl. Energy 2017, 188, 367–377. [Google Scholar] [CrossRef] [Scilit]
- Yang, L.; Yu, B.; Yang, B.; Chen, H.; Malima, G.; Wei, Y. Life Cycle Environmental Assessment of Electric and Internal Combustion Engine Vehicles in China. J. Clean. Prod. 2021, 285, 124899. [Google Scholar] [CrossRef] [Scilit]
- Choi, W.; Yoo, E.; Seol, E.; Kim, M.; Song, H.H. Greenhouse Gas Emissions of Conventional and Alternative Vehicles: Predictions Based on Energy Policy Analysis in South Korea. Appl. Energy 2020, 265, 114754. [Google Scholar] [CrossRef] [Scilit]
- Williams, R.; Pettinen, R.; Ziman, P.; Kar, K.; Dauphin, R. Fuel Effects on Regulated and Unregulated Emissions from Two Commercial Euro V and Euro VI Road Transport Vehicles. Sustainability 2021, 13, 7985. [Google Scholar] [CrossRef] [Scilit]
- Qian, S.; Li, L. A Comparison of Well-to-Wheels Energy Use and Emissions of Hydrogen Fuel Cell, Electric, LNG, and Diesel-Powered Logistics Vehicles in China. Energies 2023, 16, 5101. [Google Scholar] [CrossRef] [Scilit]
- Wong, E.Y.C.; Ho, D.C.K.; So, S.; Tsang, C.-W.; Chan, E.M.H. Life Cycle Assessment of Electric Vehicles and Hydrogen Fuel Cell Vehicles Using the GREET Model—A Comparative Study. Sustainability 2021, 13, 4872. [Google Scholar] [CrossRef] [Scilit]

Disclaimer/Publisher’s Note: The statements, opinions and data contained in all publications are solely those of the individual author(s) and contributor(s) and not of MDPI and/or the editor(s). MDPI and/or the editor(s) disclaim responsibility for any injury to people or property resulting from any ideas, methods, instructions or products referred to in the content. |
© 2026 by the author. Licensee MDPI, Basel, Switzerland. This article is an open access article distributed under the terms and conditions of the Creative Commons Attribution (CC BY) license.