


Abstract
Stable arching and blockage can occur in raw-coal bunkers containing high-moisture coal. Taking the surface raw-coal bunker at the Panxi Coal Mine as an engineering case, this study adopts a sequential multi-method framework. The DEM, CFD, and SPH are used separately to investigate bunker arching and local destabilization, water-jet propagation and attenuation, and the initial dynamic failure of coal, while field tests assess the engineering feasibility of a blockage-removal procedure combining mechanical drilling and high-pressure water jets. The results show that increased moisture content enhances interparticle friction and adhesion. At 15% moisture content, stable coal arches form mainly about 3–5 m above the discharge outlet. Among the disturbance cases examined, a nominal disturbance radius of 500 mm markedly disrupts the arch load-bearing structure and restores discharge. Among the eight water-jet operating combinations investigated, 46 MPa, a total system flow rate of 44 L/min, and a nozzle diameter of 1.14 mm provide relatively favorable axial propagation, with a nozzle-exit velocity of approximately 303.3 m/s and a centerline dynamic pressure of approximately 38 Mpa at 500 mm. Under the adopted coal parameters and initial millisecond-scale impact conditions, SPH predicts a local failure sequence of surface impact, axial erosion, radial crack propagation, and fractured-zone enlargement. A reference velocity of 300 m/s is used in the incidence-angle analysis, for which angles of 60–90° produce relatively favorable local failure. The main coal arch observed in the field is approximately 3.7 m above the outlet, broadly consistent with the DEM prediction. The combined drilling-assisted high-pressure water-jet procedure, using a 45 Mpa, 44 L/min pump, ultimately restores discharge and releases approximately 1841 t of raw coal.
1. Introduction
Raw-coal bunkers are important storage and transfer facilities in coal production and transportation systems. During discharge, abnormal flow behaviors such as funnel flow, stagnant zones, and arching-induced blockage may occur due to factors including particle-size distribution, moisture content, interparticle adhesion, and bunker geometry [1,2]. Chen et al. [3] investigated the relationship between granular flow patterns and wall pressures through full-scale silo experiments and revealed the influence of discharge-flow transitions on local wall-load distributions. An et al. [4] further examined the characteristics of wall-normal stress in a coal silo and showed that wall stresses exhibit pronounced spatial variations and dynamic changes during coal discharge. Balevičius et al. [5] employed the discrete element method to analyze the effects of friction during hopper filling and discharge, demonstrating that particle–wall friction significantly affects flow behavior and local force transmission. Zhu et al. [6] conducted DEM simulations of coal flow in a bunker and clarified the relationships among mass flow, funnel flow, and pressure-arching structures during filling and discharge. For cohesive particles, Morrissey et al. [7] and related silo-discharge experiments [8] showed that interparticle cohesion and outlet configuration can substantially affect discharge behavior and blockage formation. These studies provide an important basis for analyzing granular flow and arching in coal bunkers. However, for stable coal arches formed under high-moisture conditions, the critical load-bearing locations and the local disturbance scale required to induce destabilization remain insufficiently understood.
The discrete element method has become an important tool for investigating the mesoscopic behavior of granular materials in silos and bunkers, and its reliability is closely related to the calibration of microscopic contact parameters. Coetzee [9] systematically reviewed DEM calibration methods and emphasized that particle contact parameters should be determined through inverse calibration against macroscopic responses. Beakawi Al-Hashemi et al. [10] reviewed the factors affecting the angle of repose and the corresponding measurement methods, providing a basis for using the angle of repose as a calibration target. For industrial-scale granular systems, Coetzee [11] further investigated the influence of particle upscaling on DEM predictions and stressed the need to recalibrate and validate the equivalent contact parameters after coarse graining. More recently, DEM parameter calibration for coal and rock particles has also been performed using macroscopic experimental responses [12]. These studies have established a sound basis for DEM model construction and parameter equivalence. Nevertheless, most existing coal-bunker simulations focus on flow patterns, pressure distributions, and blockage formation, while the influence of local disturbance range on the destabilization of an already formed stable coal arch has received comparatively little attention.
High-pressure water jets are characterized by concentrated energy, non-contact operation, and adjustable impact locations and therefore show considerable potential for coal-rock fragmentation and blockage removal. Early studies demonstrated their strong erosion and fragmentation capability for rock materials [13]. Guha et al. [14] investigated free water-jet cleaning using experiments and numerical simulations and revealed that jet velocity and impact capability decrease with increasing stand-off distance. Industrial-scale studies further showed that stand-off distance significantly affects the jet breakup range and the force exerted on the target [15]. Xiao et al. [16] combined mechanical drilling with high-pressure water jets to repair failed drainage boreholes in underground coal mines, demonstrating the engineering feasibility of using water jets for local fragmentation and removal of deep-seated coal-rock blockages. However, existing studies mainly focus on jet propagation, stand-off effects, and coal-rock fragmentation capability. Further investigation is still required to determine an appropriate local action range according to coal-bunker arching characteristics and to evaluate the engineering applicability of water-jet operating conditions on this basis.
Regarding the mechanism of coal failure under water-jet impact, Xue et al. [17] experimentally investigated microscopic damage in coal induced by pure and abrasive water jets and found that jet-induced damage can propagate inward from the impact surface. They subsequently examined the internal damage field [18] and fragmentation mechanism [19], revealing the development of impact craters and crack propagation. Huang et al. [20] compared coal damage induced by pure water jets, ice-abrasive water jets, and conventional abrasive water jets, further demonstrating that different jet types can significantly influence the extent and characteristics of coal damage. Xiao et al. [21] investigated the fracture response of coal subjected to high-velocity water jets through theoretical analysis and experiments, showing that stress-wave propagation, shear failure, and tensile failure jointly contribute to coal fragmentation. Ge et al. [22] used the smoothed particle hydrodynamics method to study stress-wave propagation and fragmentation in gangue-containing coal under water-jet impact, revealing stress-wave reflection, transmission, and crack development. They later investigated the effect of different triaxial stress conditions on water-jet-induced coal damage [23]. Liu et al. [24] numerically analyzed damage evolution and failure mechanisms of rock impacted by high-pressure water jets under in situ stress, while Ma et al. [25] further investigated damage evolution and fracture characteristics of coal rock subjected to pulsed water jets under different stress-loading conditions. Recent studies have also introduced high temperature and high geostress into the water-jet coal-breaking process to examine dynamic and static fracture behavior under complex environmental conditions [26]. These studies have substantially improved the understanding of the local dynamic failure mechanisms of coal under water-jet impact. However, most of them focus on isolated coal or coal-rock specimens, and knowledge on the connection between local failure behavior and the formation, destabilization, and engineering removal of stable arches in actual coal bunkers remains limited.
In summary, substantial progress has been made in granular flow and arching in coal bunkers, high-pressure water-jet propagation, and the dynamic failure of coal. Nevertheless, most studies focus on individual physical processes, and relatively little attention has been paid to the connection among arch location identification, local destabilization-scale assessment, jet propagation evaluation, local coal failure, and engineering validation during actual bunker blockage removal. In particular, under stable arching conditions involving high-moisture raw coal, further study is needed on how to determine a reasonable local arch-breaking range based on the load-bearing characteristics of the coal arch and how to evaluate the engineering applicability of high-pressure water-jet operating conditions accordingly.
Accordingly, this study examines the surface raw-coal bunker at the Panxi Coal Mine. First, the DEM is used to analyze force-chain evolution, stable arch locations, and local load-bearing characteristics under different moisture contents, and equivalent local disturbances are applied to assess how disturbance range affects arch destabilization. Next, CFD is used to investigate high-pressure water-jet propagation and attenuation, supplemented by impact tests to assess jet action at different stand-off distances. An SPH model is then used to investigate stress-wave propagation, damage accumulation, and crack growth in a local equivalent coal body subjected to jet impact, including the effects of jet velocity and incidence angle. Finally, the principal arching location observed in the field is compared with the DEM prediction, and a field trial of mechanical drilling assisted by high-pressure water jets is used to assess the engineering feasibility of the combined procedure.
2. Theory and Methods
2.1. Stress Transfer and Arching Mechanical Model of the Raw-Coal Bunker
Raw coal in the bunker is subjected to gravity, interparticle contact forces, and wall friction. Part of the vertical load is transferred to the bunker wall, resulting in a pronounced silo effect within the stored coal. Treating the raw coal as an equivalent continuum, the vertical stress at a depth z below the material surface in the cylindrical section can be expressed according to Janssen’s theory as:
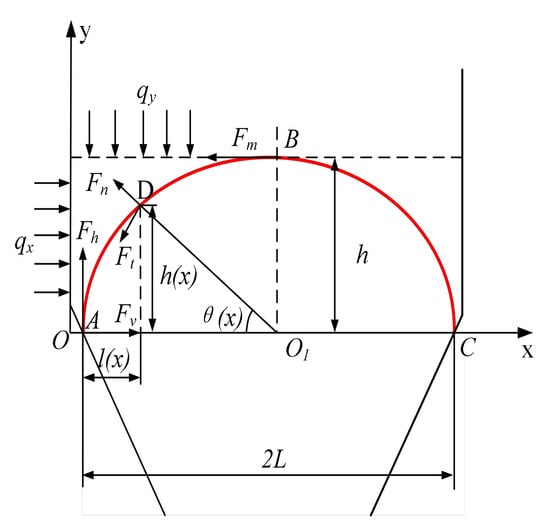
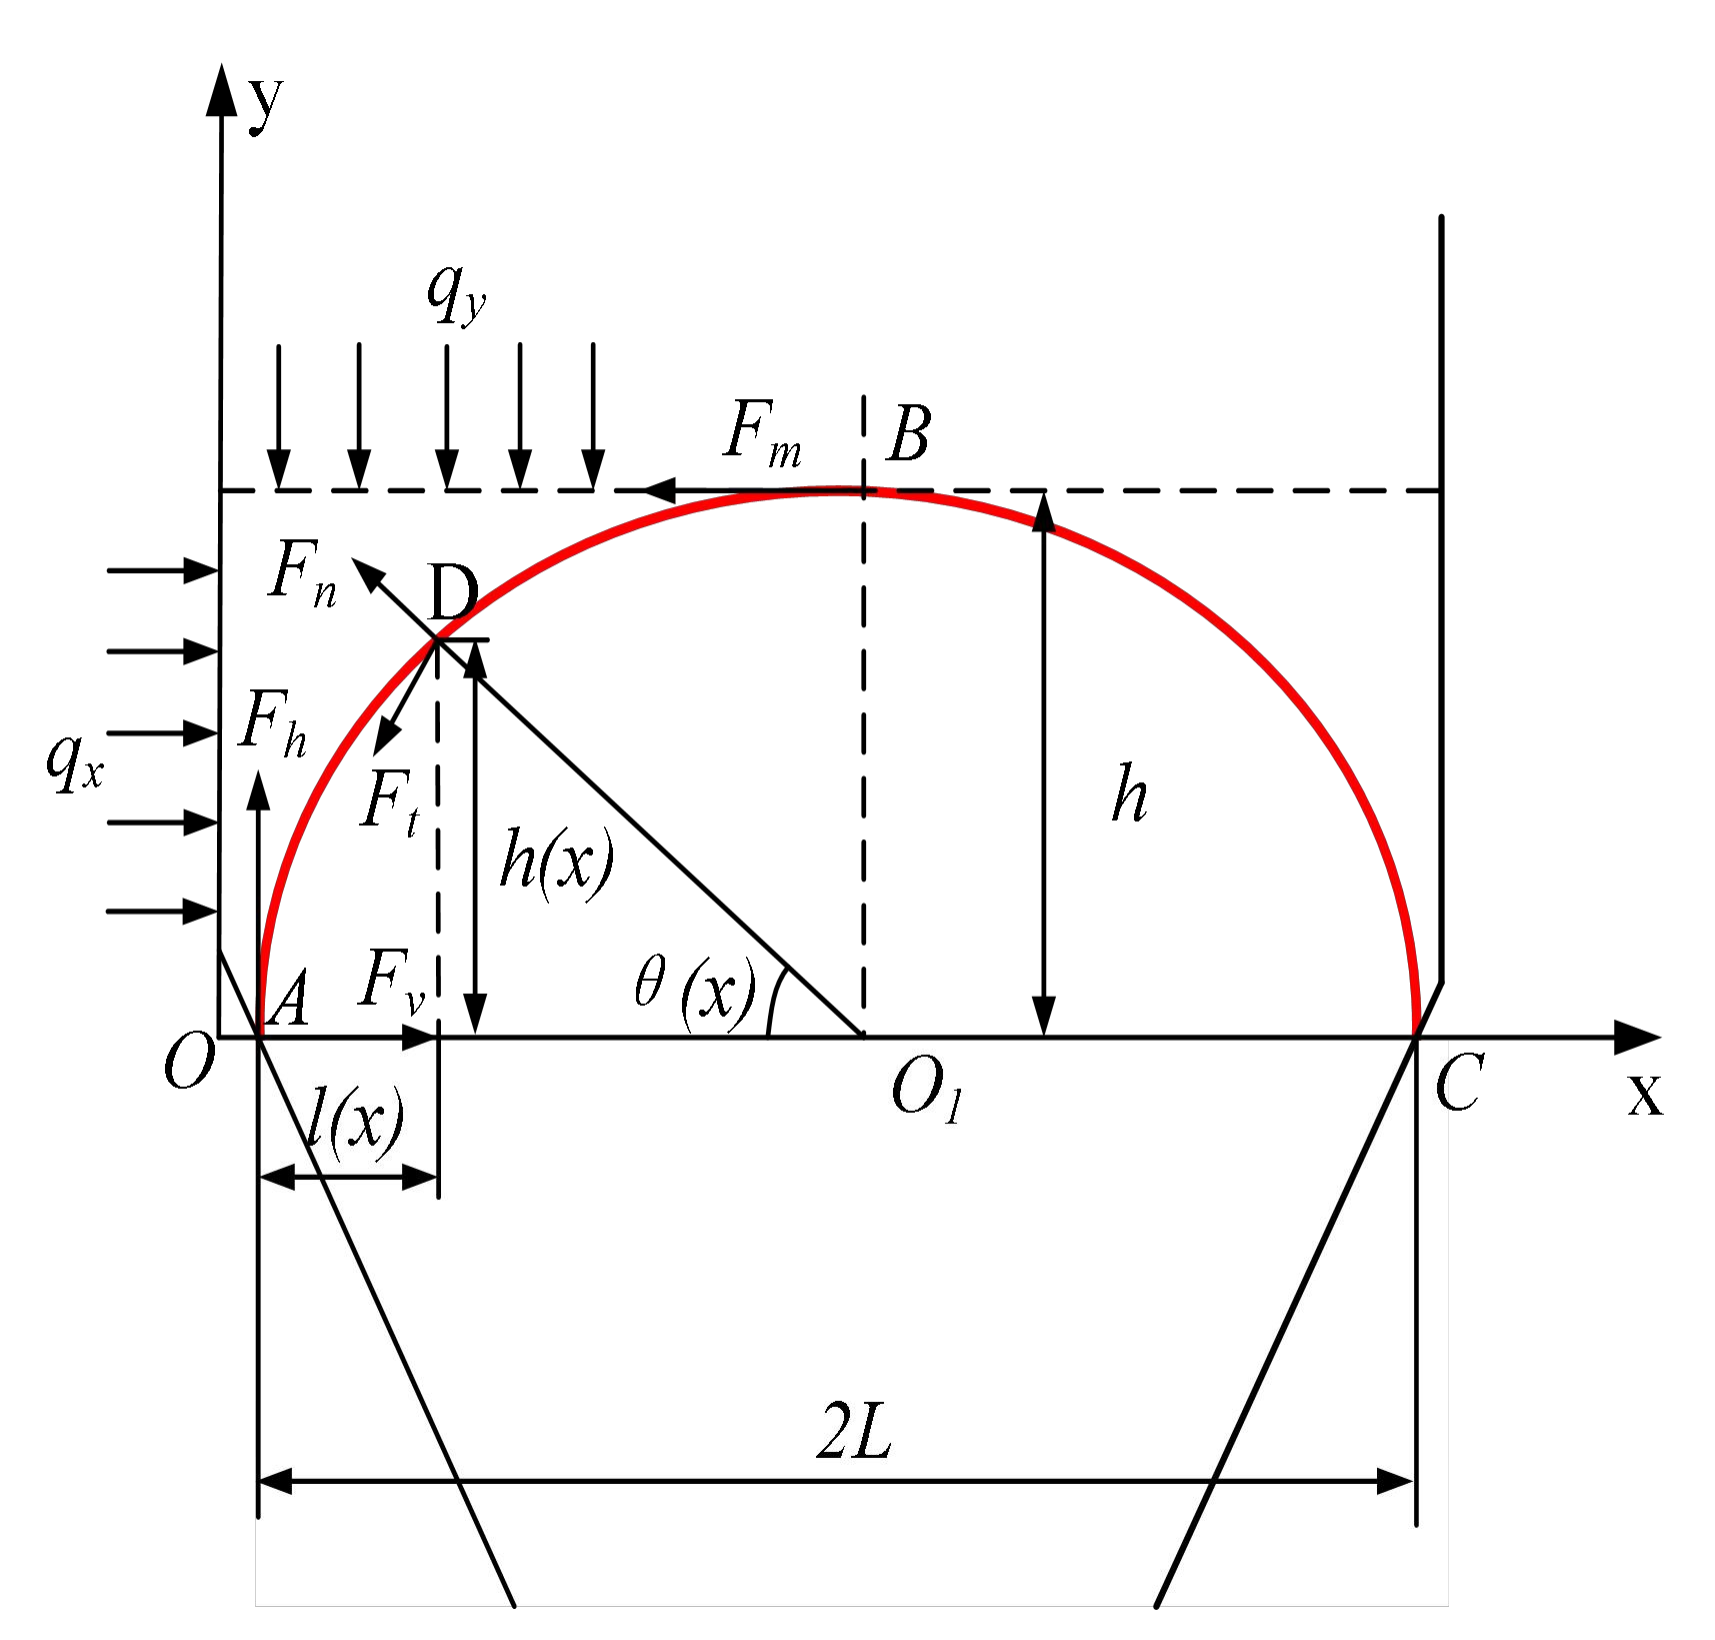
where ρ is the bulk density of raw coal, D0 is the bunker diameter, φw is the friction angle between the coal and the bunker wall, and K is the lateral pressure coefficient. With increasing material depth, wall friction progressively transfers part of the vertical load to the bunker wall. In the conical hopper, the shrinking cross-section further changes particle motion and load-transfer paths, making the cylindrical-to-conical transition region susceptible to stress redistribution and strong force-chain concentration. To characterize the local load-bearing features of a stable coal arch, it is idealized as a planar loaded arch, as illustrated in Figure 1.
Figure 1.
Schematic diagram of force equilibrium in the arch structure. The red line indicates the boundary of the coal arch.
Let the reactions at the arch foot be Fx and Fy, and let the angle between the tangent direction at an arbitrary point on the arch and the horizontal axis be α. The local normal and tangential forces can then be expressed as:
Fn = Fx sin α + Fy cos α, Ft = Fx cos α − Fy sin α
Here, Fn and Ft denote the equivalent normal and tangential internal-force components defined in the planar arch model. They describe the local force state under the specified loads and support conditions rather than the ultimate bearing capacity or sliding resistance of coal. Fu [27] reported relatively pronounced force concentrations near the arch foot in an illustrative local arch-path calculation.
An actual coal arch is supported by a three-dimensional network of interparticle contacts. Its load paths intersect in space and are affected by nonuniform loading and bunker-wall constraints. The planar arch in Figure 1 is used only to qualitatively illustrate the local load-bearing relationship in the selected plane; it excludes out-of-plane load transfer, spatial force-chain rearrangement, and spatial variations in boundary constraints. It therefore cannot fully represent the stress state of a three-dimensional coal arch and is not used to quantitatively predict its ultimate bearing capacity or an arch-breaking threshold. The bunker-scale arch morphology and local disturbance response are instead discussed using the three-dimensional DEM results.
During discharge, particle motion continuously disturbs the force-chain network, causing arch-shaped load-bearing paths to undergo repeated formation, breakage, and reconstruction. This process exhibits a dynamic pattern of “arching–failure–re-arching”. The DEM is therefore subsequently employed to further analyze the force-chain distribution and evolution of stable coal arches in these critical regions.
2.2. Theoretical Basis of Coal-Arch Failure Induced by High-Pressure Water Jets
After being discharged from the nozzle at high velocity, a high-pressure water jet propagates through air and gradually attenuates. When the jet impacts the coal surface, its kinetic energy is converted into a high-amplitude impact pressure within a very short period, generating stress waves inside the coal. The transient water-hammer pressure generated during the initial contact stage can be expressed as [21]:
where v denotes the jet impact velocity; ρw and ρc denote the densities of water and coal, respectively; and cw and cc denote the respective stress-wave propagation velocities. The transient impact initially induces localized compressive failure at the impact center and generates stress waves propagating into the coal. As the impact approaches a quasi-steady state, a stagnation region forms near the target surface. The steady impact pressure can be approximated as:
This relationship indicates that the jet impact capacity is proportional to the square of the jet velocity, making jet velocity an important parameter governing the extent of coal failure.
After impact, the coal initially undergoes localized compressive-shear damage at the impact center. Stress waves subsequently propagate into the coal and are reflected at cracks and free surfaces, further inducing tensile cracks. As high-pressure water penetrates the initial fractures, the water-wedge effect promotes continued crack propagation. Consequently, the failure process evolves continuously through “transient impact–stress-wave propagation–local damage–crack propagation–fractured-zone enlargement” [19,20,21,22]. In the subsequent analysis, CFD is used to characterize jet propagation and attenuation, whereas SPH is employed to investigate local damage and crack evolution within the coal.
2.3. Numerical Models and Parameter Settings
A sequential multi-method research framework is adopted, with DEM, CFD, and SPH models developed separately. The DEM first identifies the main arching region and examines the mechanical response to different nominal disturbance radii. CFD then investigates the propagation and attenuation of a high-pressure water jet; its reported nozzle-exit velocity serves as a reference for selecting the baseline impact velocity in the SPH model, which is subsequently used to analyze local coal damage. The three models describe different physical processes at different scales. Particle states, pressure fields, and damage variables are not directly transferred between the models; accordingly, this is not a directly coupled multiphysics simulation.
2.3.1. DEM Model of the Coal Bunker and Particles
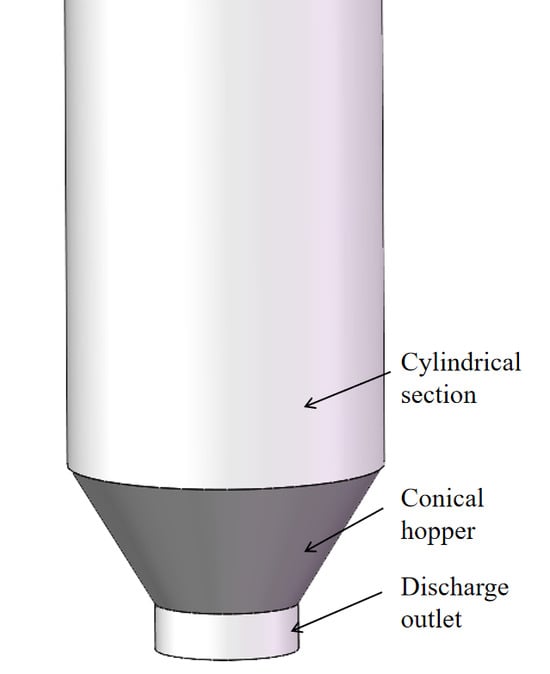
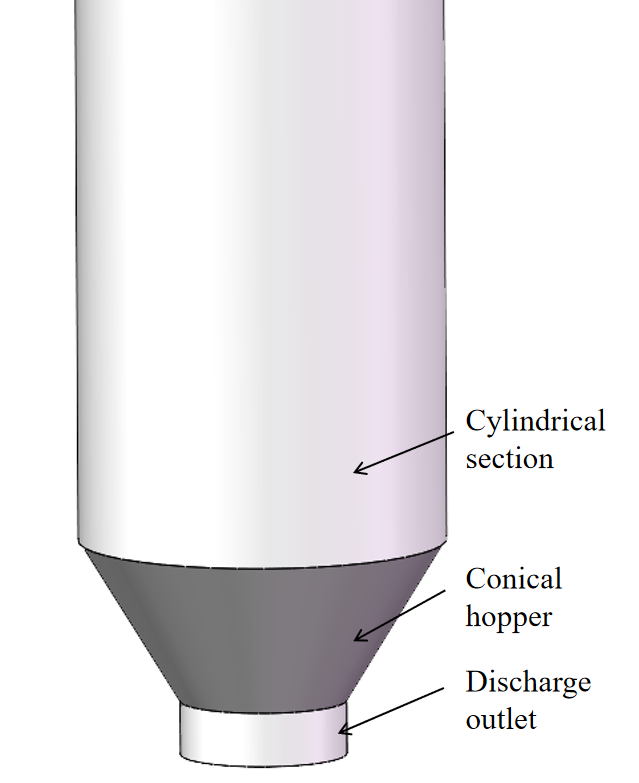
A full-scale DEM model was established using EDEM 2024 based on the surface raw-coal bunker at Panxi Coal Mine, as shown in Figure 2. The actual bunker has a diameter of 12 m and a height of 25 m, with four conical discharge outlets at the bottom. The model retains the main structural features, including the cylindrical section, conical hopper, and discharge outlets.
Figure 2.
Structure of the raw-coal bunker DEM model.
Based on the particle-size distribution obtained from screening tests, the raw coal was simplified into three representative size classes: small, medium, and large particles. The corresponding representative particle sizes were 15 mm, 35 mm, and greater than 50 mm, with mass fractions of 50%, 48%, and 2%, respectively. A uniform coarse-graining factor of 2.5 was applied to all three particle classes. The coarse-grained particles were treated as equivalent representations of groups of actual coal particles, and their contact parameters were recalibrated using macroscopic responses.
To reduce the computational cost of simulating an industrial-scale bunker, a particle coarse-graining factor of 2.5 was used, and the contact parameters were recalibrated for this particle representation to match the measured angles of repose. Coetzee [11] and Lommen et al. [28] showed that suitably scaled and calibrated coarse-grained models may preserve certain macroscopic material responses, although their applicability depends on the response metrics and material–equipment interactions. Accordingly, this study focuses on bunker-scale overall arching and local disturbance responses rather than failure at the individual-particle scale.
With the bunker geometry held constant, increasing the particle size changes particle-to-outlet and particle-to-disturbance-component size ratios and may alter the contact network and local rearrangement. These changes may affect force-chain transmission paths and contact-force magnitudes, arch location and stability, and disturbance-induced destabilization. The available data do not include verifiable comparisons across coarse-graining factors, so these effects cannot be quantified. The force-chain results are therefore used primarily to interpret the load-bearing characteristics of the present model. The 500 mm case is treated as a candidate scale under the adopted particle representation and disturbance mode, not as a precise particle-size-independent arch-breaking threshold.
To represent friction and adhesion in moist coal, coal–coal contacts were modeled using the Hertz–Mindlin with JKR model, and coal–wall contacts using the Hertz–Mindlin model [29]. Model parameters were determined by combining basic material tests, literature values, and staged angle-of-repose calibration.
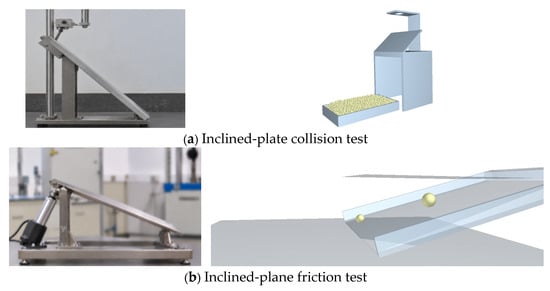
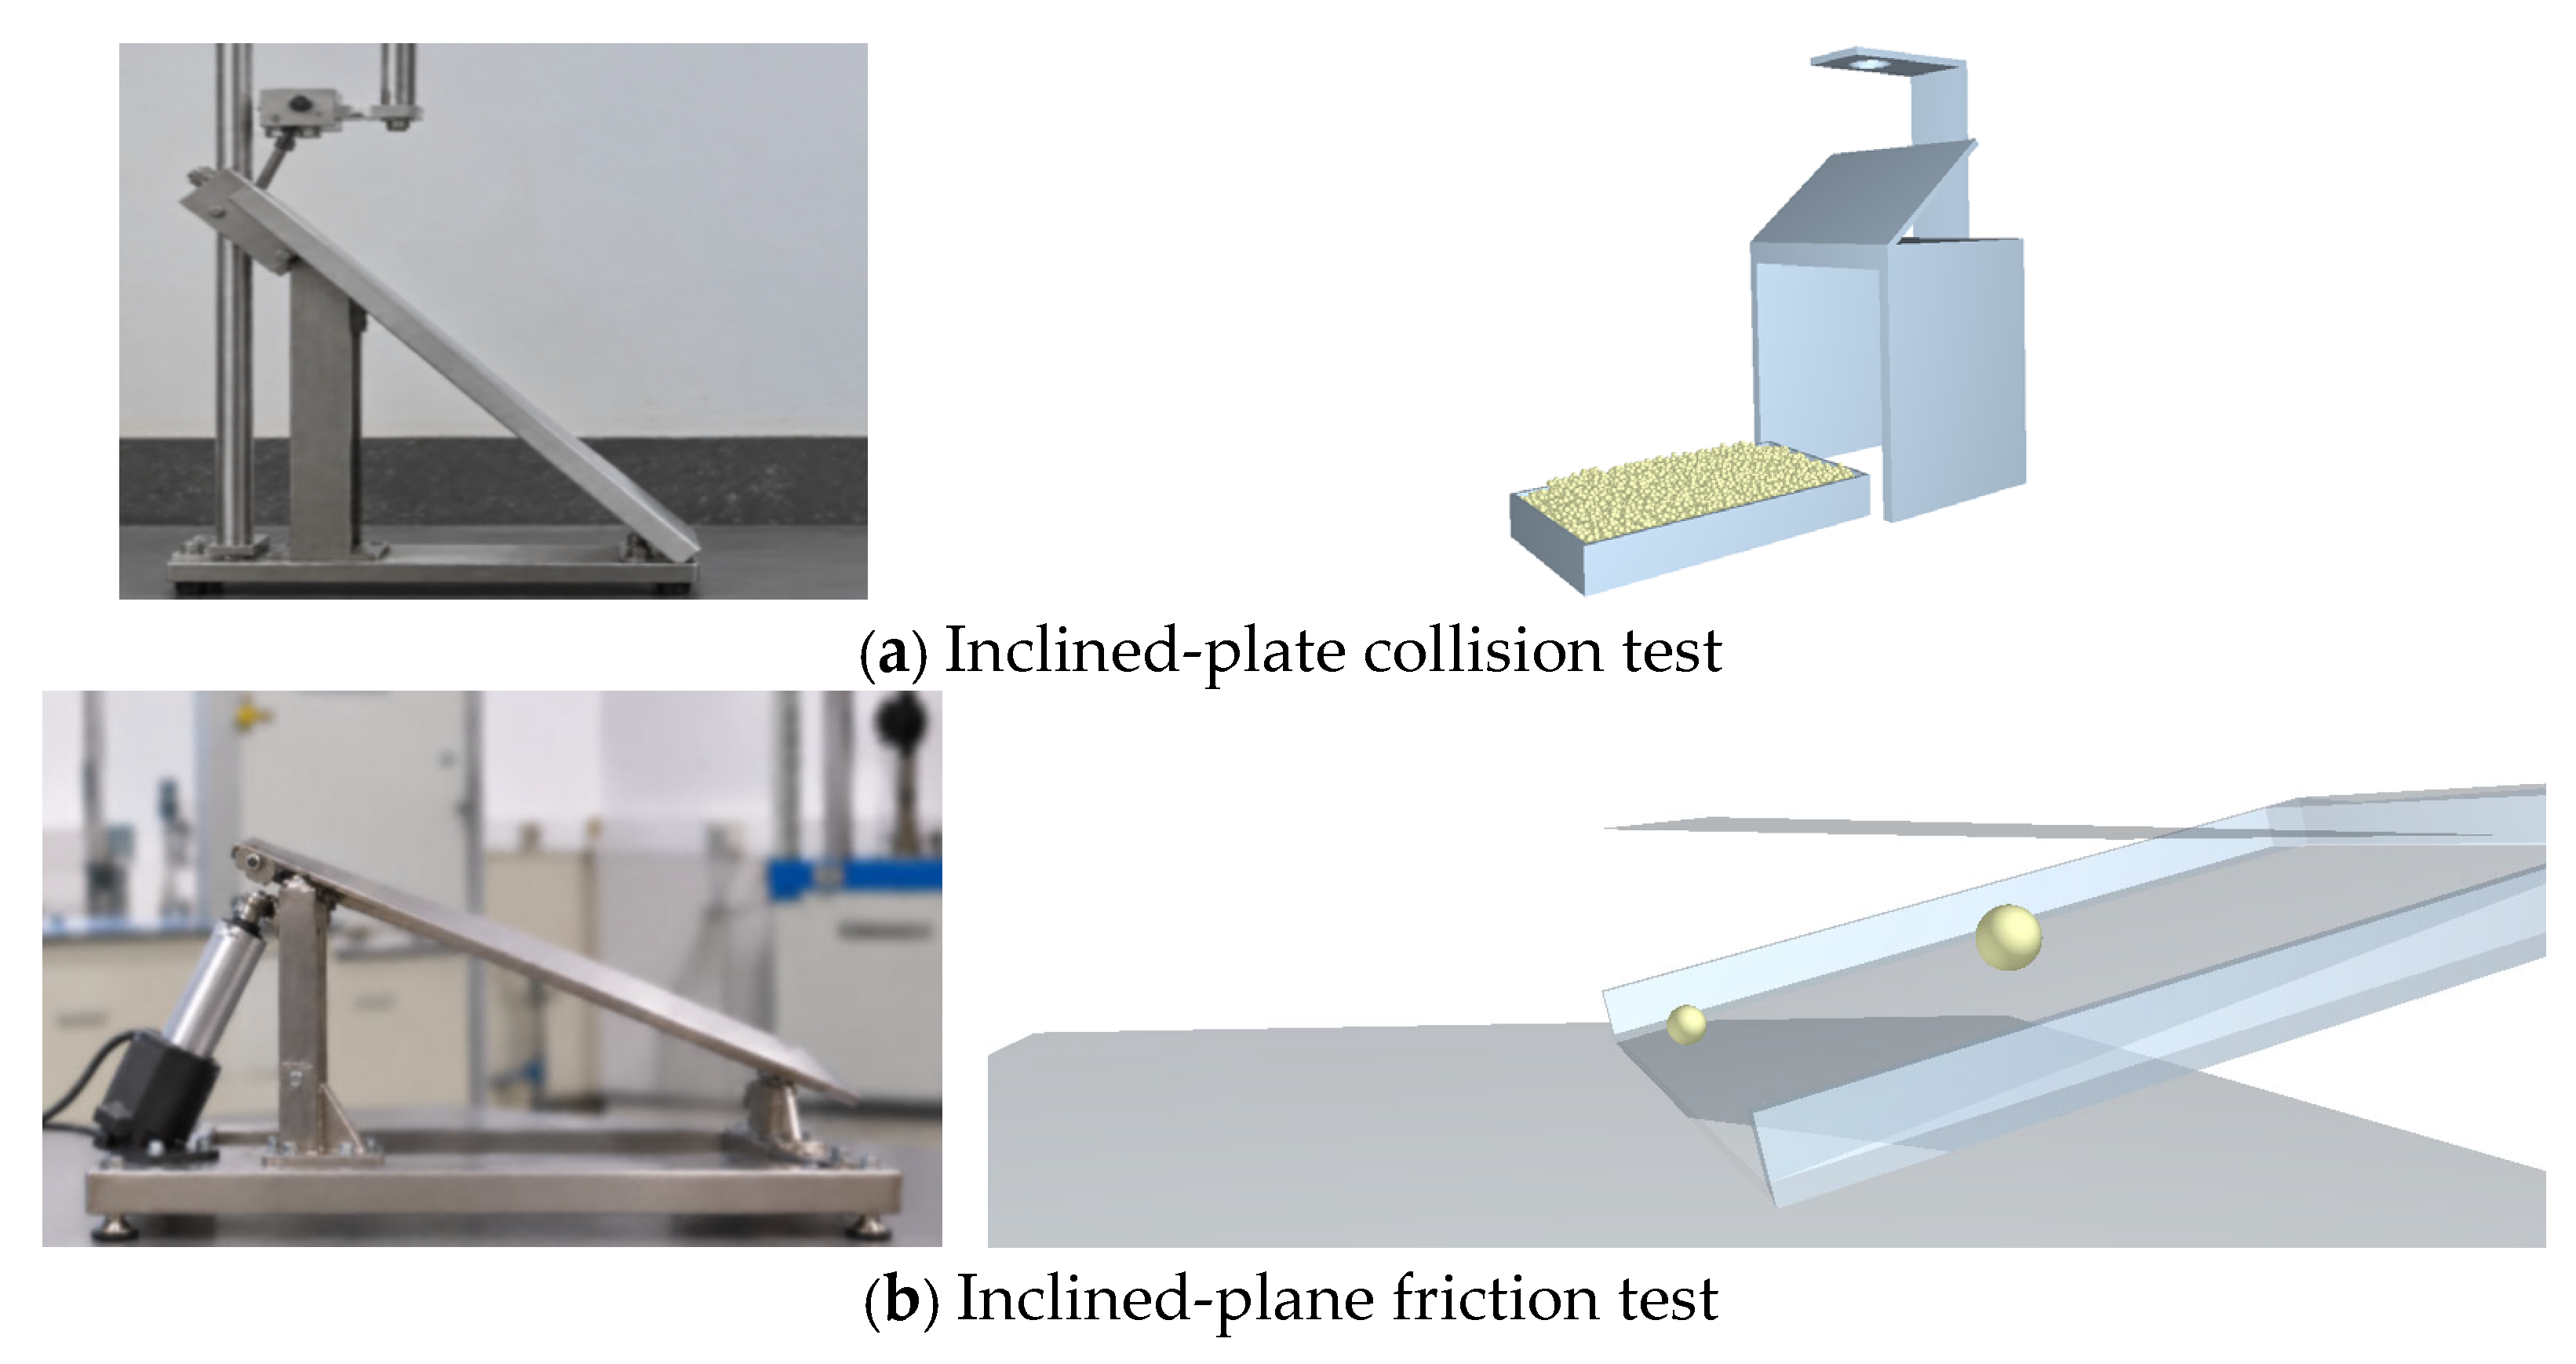
Coal particle-size distribution and material condition were characterized by screening and moisture measurements. Inclined-plate collision tests were used to determine the coal–wall coefficient of restitution, whereas the coal–coal restitution coefficient was obtained with reference to the literature. Inclined-plane tests were used to determine coal–wall static friction. The basic tests are illustrated in Figure 3.
Figure 3.
Basic material tests.
The inclined-plane tests yielded a baseline coal–wall static-friction coefficient of 0.3, which was used for the 0% and 10% moisture cases. Jiang et al. [30] reported that the interface friction angle generally increased with moisture content within the range examined in their raw-coal–concrete shear tests. Following this trend, a higher coal–wall static-friction coefficient was trialed for the 15% moisture case, and a value of 0.4 was selected by comparing simulated and measured angles of repose. These coal–wall friction coefficients were then held constant during subsequent adjustment of the equivalent JKR surface energy.
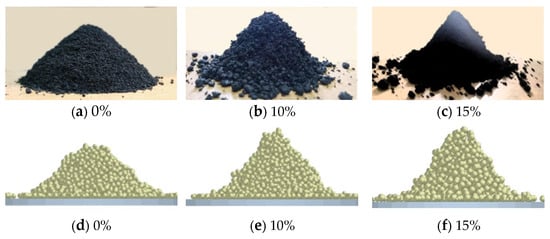
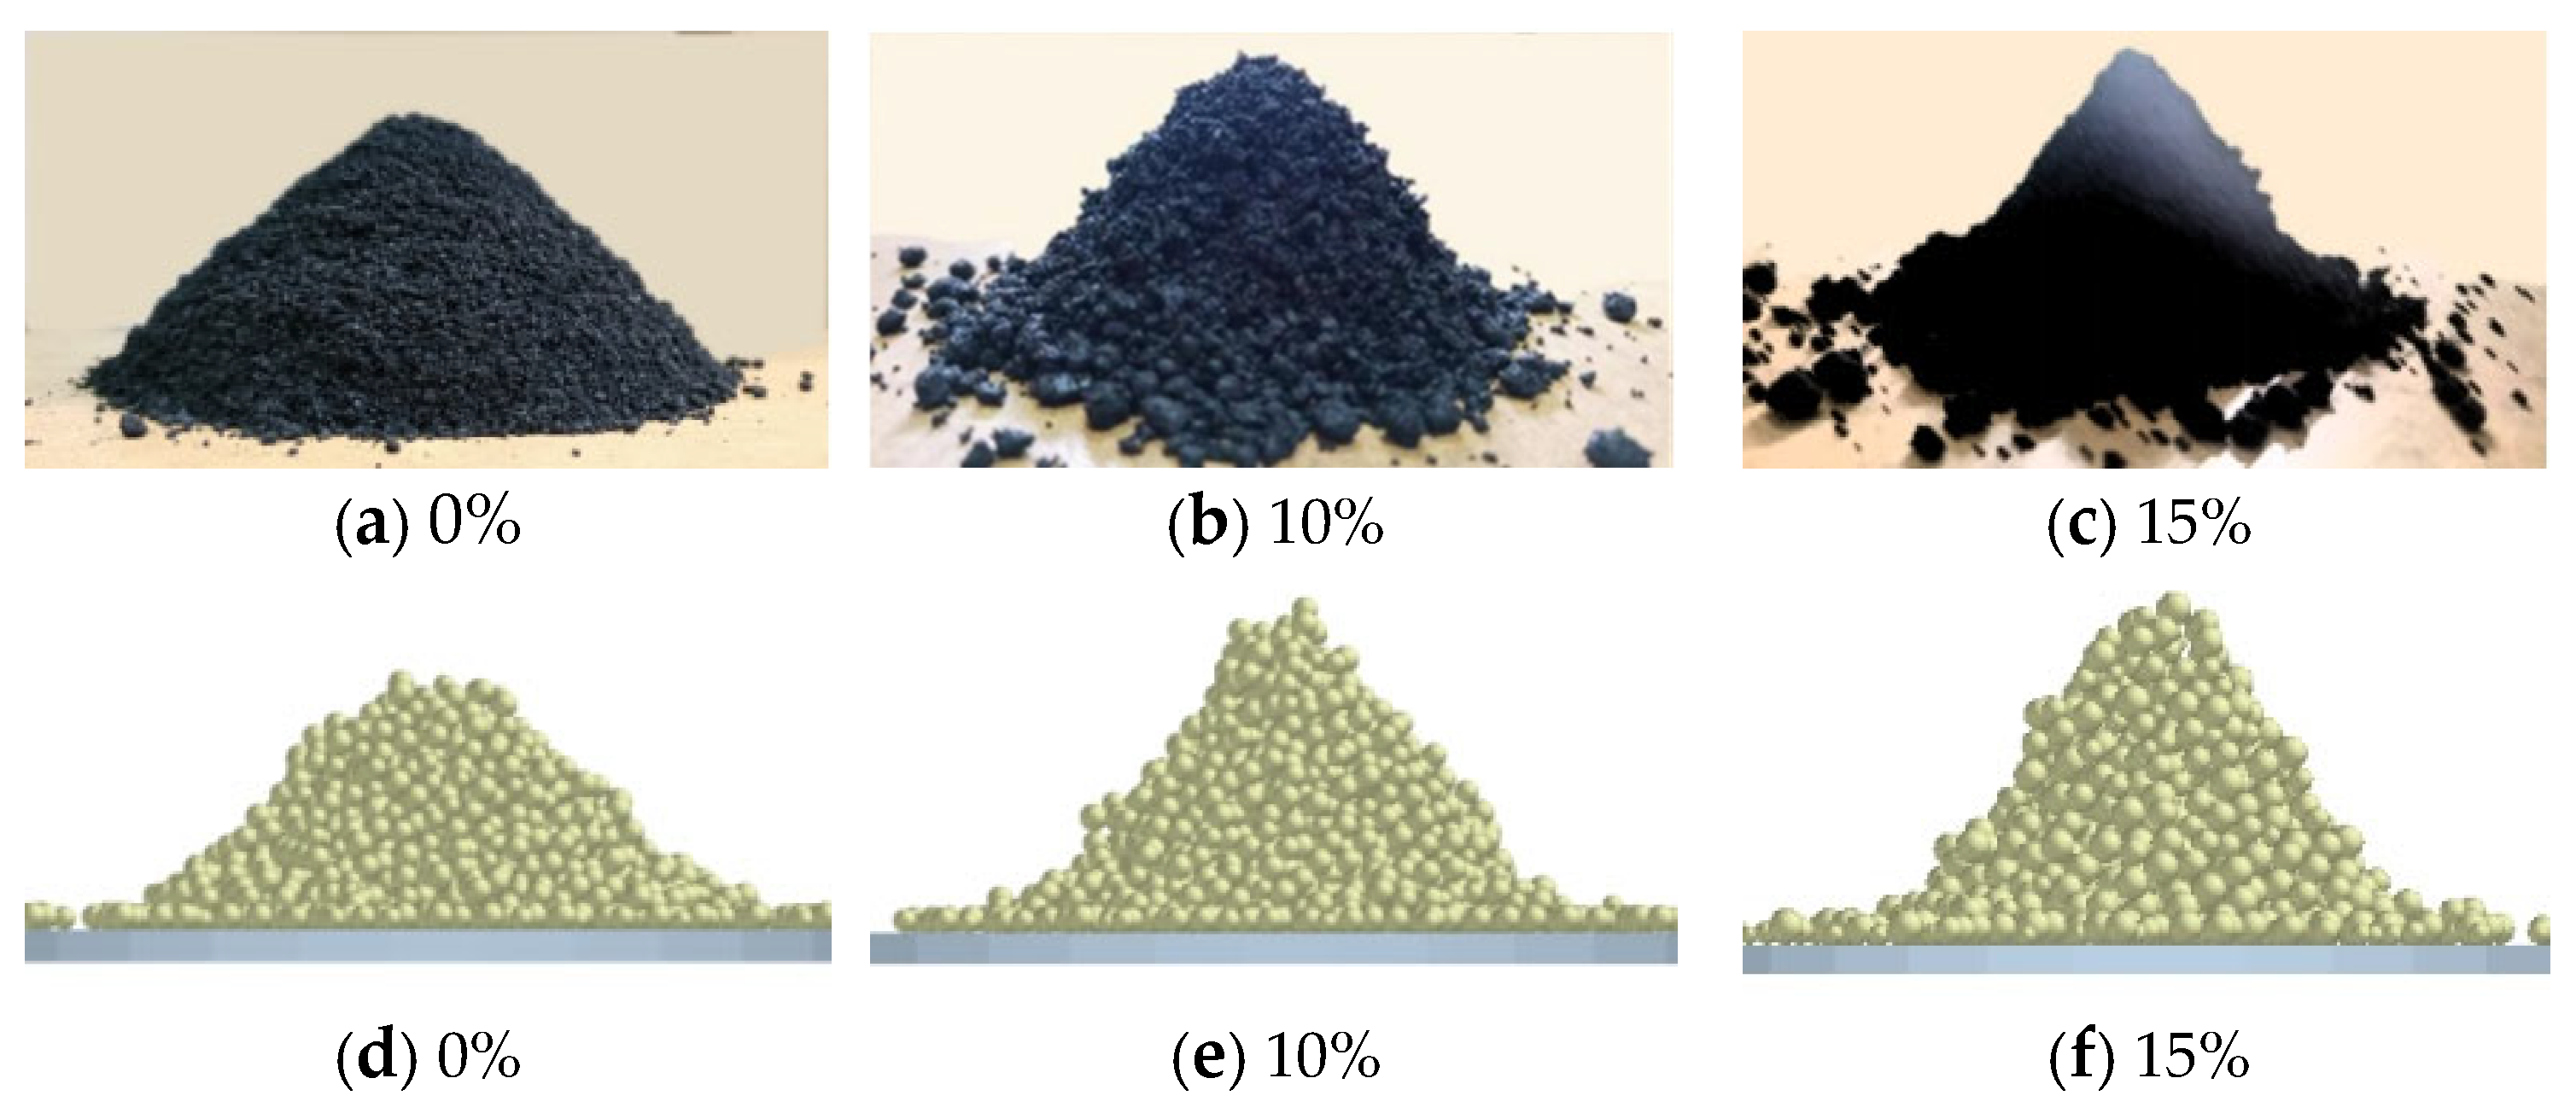
The measured static angles of repose for coal samples with moisture contents of 0%, 10%, and 15% were 42°, 50°, and 54°, respectively. Contact parameters were calibrated in stages under the adopted particle coarse-graining factor of 2.5. For dry coal, the equivalent JKR surface energy was first set to zero, and coal–coal static and rolling friction coefficients were adjusted to reproduce the measured angle. For the 10% and 15% moisture cases, friction parameters were selected first and then held fixed, while the equivalent JKR surface energy was adjusted. The final equivalent JKR surface energies were 0, 3, and 5 J/m2 for the 0%, 10%, and 15% moisture conditions, respectively; the complete parameter set is presented in Table 1. The relative differences between measured and simulated angles of repose were within 5% for all cases, as shown in Figure 4.
Table 1.
Main material and contact parameters used in the DEM simulations.
Figure 4.
Comparison of repose-angle experiments and DEM simulations at different moisture contents.
The angle of repose depends jointly on static friction, rolling friction, and JKR surface energy, and compensation among these parameters can allow multiple parameter combinations to fit the same target within a specified tolerance. Thus, staged calibration defines an adjustment sequence but does not guarantee a unique parameter set. The resulting contact parameters are equivalent values applicable to the present coarse-graining factor of 2.5, moisture conditions, and contact models. Matching the angle of repose constitutes calibration, not independent validation against other macroscopic mechanical responses. As an additional macroscopic check, the field-observed arch position was compared with the DEM prediction: the major stable arch was predicted about 3–5 m above the outlet, while the observed position was approximately 3.7 m, within that interval (Section 3.1.2 and Section 4.2). This supports the identification of the main arching region under the present engineering conditions but does not establish uniqueness of the contact parameters or quantitative accuracy of the force-chain magnitudes.
The main material and contact parameters adopted after angle-of-repose calibration are listed in Table 1 for each moisture condition.
To investigate possible particle destabilization and discharge following local arch failure, a planar component was placed below the stable coal arch in the DEM model to represent the local arch-breaking action through simplified mechanical contact disturbance. The component rotated at 5°/s and moved vertically upward at a constant 3 m/s, inducing local particle rearrangement and destabilization of the load-bearing structure through contact. The geometric radius R of the component is defined here as the nominal disturbance radius. Cases with R = 300, 400, 500, and 600 mm were compared using the same component motion. Changing R varied the spatial scale of mechanical contact disturbance so that particle destabilization and discharge could be examined under different local action ranges. This method does not directly simulate water-jet impact, coal erosion, or crack propagation, and no quantitative correspondence has been established between the component radius and the actual jet-erosion range.
Table 2 indicates partial agreement between the DEM simulation and Janssen theory in the overall trend of lateral wall pressure, although local pressure magnitudes differ. This is mainly because Janssen theory assumes a continuum with a relatively uniform stress distribution, whereas the DEM captures local stress variations arising from the particle contact network. The comparison provides a plausibility check of the macroscopic pressure distribution but cannot replace independent experimental validation.
Table 2.
Parameter values of lateral pressure on the bunker wall at different heights.
2.3.2. CFD Model of the Water Jet and Boundary Conditions
A two-dimensional axisymmetric CFD model was established using ANSYS Fluent 2024 based on a cylindrical nozzle. The volume-of-fluid (VOF) method was used to represent the water–air interface [32], and the standard k–ε model was used to calculate the Reynolds-averaged turbulent flow. The model was selected to balance the computational cost against the primary objectives: comparing mean jet velocity, dynamic pressure, and streamwise attenuation across operating conditions.
The standard k–ε model relies on Reynolds averaging and the eddy-viscosity hypothesis and has limitations in representing transient turbulent structures and local turbulence anisotropy. The two-dimensional axisymmetric approximation also cannot describe three-dimensional asymmetric disturbances. VOF interface resolution is limited by mesh size and time step. The ability of the present model to predict fine-scale breakup and atomization has not been validated, and the effects of cavitation and water compressibility have not been assessed separately. No comparison between alternative turbulence models was performed. CFD results are therefore used primarily to compare mean propagation and attenuation characteristics, not to predict peak transient water-hammer pressures during initial impact.
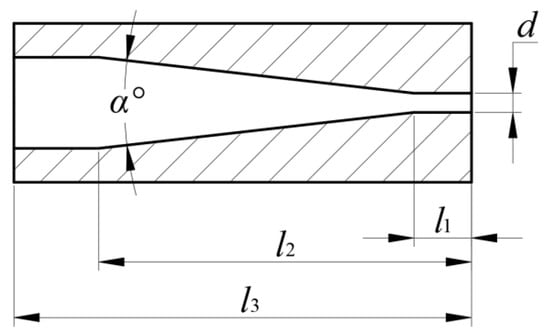
The nozzle consists of an inlet straight section, a converging section, and an outlet straight section, as illustrated in Figure 5. Here, d is the outlet orifice diameter; l1 is the outlet straight-section length; l2 is the axial distance from the start of the converging section to the nozzle exit; l3 is the total nozzle length; and α denotes the converging angle. The total nozzle length was 22 mm. In the baseline case, the outlet diameter was 1.14 mm, corresponding to a geometric outlet area of approximately 1.02 mm2. The two-dimensional axisymmetric model was used to examine the propagation of a single-nozzle jet.
Figure 5.
Nozzle structure.
A pressure-inlet boundary was applied at the nozzle inlet, and the external outlet was set to atmospheric pressure. The mesh was locally refined around the nozzle exit and jet centerline. The computational domain and mesh are shown in Figure 6.
Figure 6.
Computational domain of the high-pressure water-jet CFD model.
The computational domain was discretized using a two-dimensional axisymmetric mesh, with local refinement near the nozzle exit and jet centerline. To evaluate the sensitivity of computed results to mesh density, coarse, medium, and fine meshes containing approximately 4200, 6500, and 8800 cells, respectively, were constructed. The same local refinement settings were used at the nozzle exit for all three meshes. With other calculation settings held constant, the axial velocity and dynamic pressure were compared, as summarized in Table 3.
Table 3.
Effect of mesh density on water-jet simulation results.
Taking the fine-mesh results as reference, the relative differences between the medium and fine meshes were 1.08% for axial velocity and 2.63% for dynamic pressure. These results indicate relatively low sensitivity of the compared quantities to further mesh refinement within the investigated range.
A transient solution method was adopted, and the normalized residual criterion for each governing equation was set to 10−3. During the calculation, the velocity and turbulence-equation residuals generally exhibited a decreasing trend, with turbulence-equation residuals remaining below the specified threshold during most iterations.
The actual system is equipped with three nozzles. The flow rates listed in Table 4 represent the total high-pressure-pump system flow rate, not the flow rate through one nozzle. CFD used a single-nozzle two-dimensional axisymmetric model with the relevant pressure-inlet and nozzle-geometry settings. The total system flow rate is listed only as an equipment operating parameter; it was neither imposed as a single-nozzle mass-flow boundary condition nor independently specified as a CFD input. The single-nozzle flow rate is determined by the applied pressure, nozzle geometry, and resulting flow solution. Because the complete supply-pipe network and flow distribution between nozzles were not resolved, no quantitative relationship has been established between total system flow rate and the actual flow rate through an individual nozzle. Accordingly, this section compares jet propagation across the pressure–geometry combinations without separately evaluating the effect of system flow rate.
Table 4.
Operating conditions for the high-pressure water-jet CFD simulations.
Water and air properties were taken at room temperature. Centerline velocity, dynamic pressure, and their streamwise attenuation were compared under different pressure-inlet and nozzle-geometry combinations to evaluate axial jet propagation and select a baseline case for further analysis. The axial propagation distance of the jet and the nominal DEM disturbance radius describe, respectively, a streamwise jet length scale and a mechanical-component dimension; no direct numerical equivalence is assumed between them.
2.3.3. SPH Model of Water-Jet Impact on Coal and Material Constitutive Model
Using the approximately 303.3 m/s nozzle-exit velocity reported by CFD for the 46 MPa pressure-inlet case as a reference, a baseline velocity of 300 m/s was selected for SPH. A water-jet/local-equivalent-coal-body SPH model was developed in LS-DYNA 2024 to analyze large deformation, damage, and crack propagation in coal under high-velocity jet impact.
Both the water-jet column and the local coal body were discretized using SPH particles with a nominal spacing of 0.25 mm. For the 2 mm diameter jet, the spacing-to-diameter ratio is 0.125, corresponding to eight nominal particle intervals across the jet diameter. This resolution is used to represent the jet geometry and its local interaction with coal. The same particle spacing was retained for all velocity and incidence-angle cases to compare damage evolution and crater morphology under consistent numerical conditions.
A fixed discretization scale was adopted for the operating-condition comparisons, with a baseline SPH particle spacing of 0.25 mm. To assess the influence of coal-particle discretization, spacings of 0.50, 0.25, and 0.125 mm were compared under identical jet and constitutive parameters. The maximum crater depth, surface crater diameter, crater longitudinal-section area, and high-damage-area extent at t = 1.0 ms were used as evaluation measures, with the 0.125 mm case serving as the refinement reference. For spacings of 0.25 and 0.125 mm, maximum crater depths were 56 and 58 mm, respectively, and surface crater diameters were 44.1 and 45.6 mm, corresponding to relative differences of 3.45% and 3.29%. The respective differences in crater longitudinal-section area and high-damage-region area were 3.91% and 3.85%. The corresponding deviations of the 0.50 mm case were approximately 11–19%. Within the investigated baseline case and spacing range, the geometric and damage-extent indicators at 0.25 mm were relatively insensitive to further refinement; this spacing was therefore adopted for subsequent comparisons, as summarized in Table 5.
Both area measures were evaluated in the central longitudinal cross-section of the coal model. The initial reference sectional area was S0 = 300 mm × 200 mm = 60,000 mm2. The relative crater sectional area is defined as s/S0 × 100%, where s is the crater area in that section. The relative high-damage area is A(D ≥ 0.9)/S0 × 100%, where D is the RHT historical damage variable and A(D ≥ 0.9) is the area in which D is at least 0.9.
Table 5.
Influence of SPH particle spacing on crater geometry and damage extent.
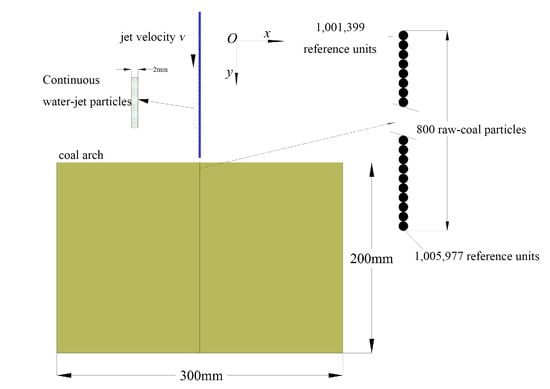
The local equivalent coal body measured 300 mm × 200 mm, and the jet column measured Φ2 mm × 1000 mm, as illustrated in Figure 7. Under the baseline normal-incidence arrangement, the impact center is approximately 150 mm from each lateral boundary and 200 mm from the back (lower) boundary. These distances describe the geometric relationship between the impact center and computational boundaries, not the clearance between the damaged-zone edge and those boundaries.
Figure 7.
SPH model of high-pressure water-jet impact on coal.
No sensitivity comparison was performed for domain size, boundary distance, or boundary conditions. Their effects on stress-wave propagation, crack development, and damage extent therefore cannot yet be quantified. These results should be interpreted under the adopted local-model conditions; neither the geometric clearance from the impact center to the boundaries nor the particle-spacing comparison establishes boundary independence.
The local model represents the material response of coal in an arching region subjected to water-jet impact and is used to analyze the initial stress-wave propagation, damage accumulation, and crack development. The porosity and heterogeneous contacts of an actual granular coal arch, as well as support from the surrounding coal, were not directly reconstructed. These differences may influence crack paths, crater size, and damaged area, so the findings must be interpreted in the context of this local model.
Coal was modeled with the RHT constitutive relation, with parameters established from basic coal-sample mechanical tests and previously used model values. Uniaxial compression tests and stress–strain analysis yielded a uniaxial compressive strength of 5.61 MPa and Young’s modulus of 2.67 GPa. Coal density was set to 1700 kg/m3, Poisson’s ratio to 0.3, and shear modulus to 1.03 GPa. These elastic parameters satisfy G = E/[2(1 + ν)]. An equivalent shear strength of 1.36 MPa was adopted from the pre-existing model.
The RHT failure-surface formulation and the method for selecting failure-strength parameters are discussed in [33]. The equivalent shear strength and tabulated empirical constitutive coefficients were adopted from the existing coal-arch water-jet impact model [27], including failure-surface parameters A and N, Lode-angle-related parameters Q0 and B, and coefficients associated with yielding, strain rate, and damage. CSLH, HMIN, and HMAX likewise follow the SPH numerical settings of that earlier model and are distinguished here from the material constitutive parameters (Table 6). These parameters serve as baseline inputs for comparing jet conditions. The uniaxial compression tests constrain the basic strength and stiffness of coal, but the predicted crater geometry and damage extent under these parameters have not been quantitatively validated against an independent water-jet impact test on coal.
Table 6.
RHT material parameters for coal and SPH numerical control parameters.
The SPH model focuses on the initial dynamic response of coal during the first 0–1 ms of impact and compares the influence of jet speed and incidence angle under fixed initial material parameters. The RHT damage variable evolves during impact, but no material property update driven by moisture content or wetting duration was included. Accordingly, the model describes impact damage at a specified initial state rather than the evolution of stiffness and strength caused by continued water absorption.
During sustained jet action, water entering pores and cracks may soften coal, while fluid pressure within cracks may promote their extension [34]. If prolonged wetting further reduces coal strength, a fixed-initial-parameter model may underestimate subsequent damage accumulation and failure extent. Water may also alter granular contacts and fragmented-coal transport through lubrication or liquid-bridge adhesion, depending on moisture condition and material properties [30,34]. Greater ease of local coal fragmentation therefore does not necessarily imply a higher overall discharge rate. The initial-impact results presented here are not used to predict the final cleaned area or completion time under prolonged continuous jetting.
This work uses a multi-method framework connected through characteristic-parameter references and mechanistic interpretation. The DEM identifies the principal arching region and compares destabilization and discharge under different nominal disturbance radii, whereas CFD evaluates streamwise propagation and attenuation of a single-nozzle jet. Specifically, 500 mm in the DEM is the radius of a mechanical component, while 500 mm in CFD is the distance measured along the jet axis. These represent different geometric and propagation scales, and no numerical mapping is imposed between them.
CFD and SPH are linked primarily through a reference velocity. The approximately 303.3 m/s nozzle-exit velocity reported by CFD provides the order-of-magnitude basis for selecting 300 m/s in SPH; the numerical difference is about 1.1%. However, SPH uses an idealized 2 mm diameter jet column, whereas the CFD baseline nozzle diameter is 1.14 mm. The jet cross-section, water-volume-fraction distribution, and pressure history are not directly transferred. Similar velocities therefore do not imply equal momentum or energy inputs. Likewise, the equivalent material strength in Table 6 does not represent a direct transfer of the DEM contact-force or initial-stress field.
These simplifications allow each model to address a different physical problem and scale. Treating a granular coal arch as a local continuum coal body may alter the roles of porosity, contact heterogeneity, and confinement in the impact response. SPH damage results are not fed back into the DEM to update the particle load-bearing structure. Thus, the SPH crater size and damage area cannot be directly converted into the nominal DEM disturbance radius. The models are used to assess arching location, compare jet operating conditions, and interpret local damage mechanisms, not to sequentially predict an actual clearing radius or total discharged mass.
3. Numerical Simulation Results
3.1. Arching Characteristics of the Raw-Coal Bunker
Based on the calibrated DEM model, the filling and discharge of raw coal at different moisture contents were simulated, focusing on force-chain distributions, arching locations, and the effects of local disturbances on discharge.
3.1.1. Force-Chain Distribution During Filling
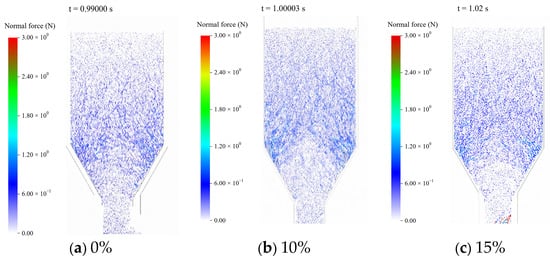
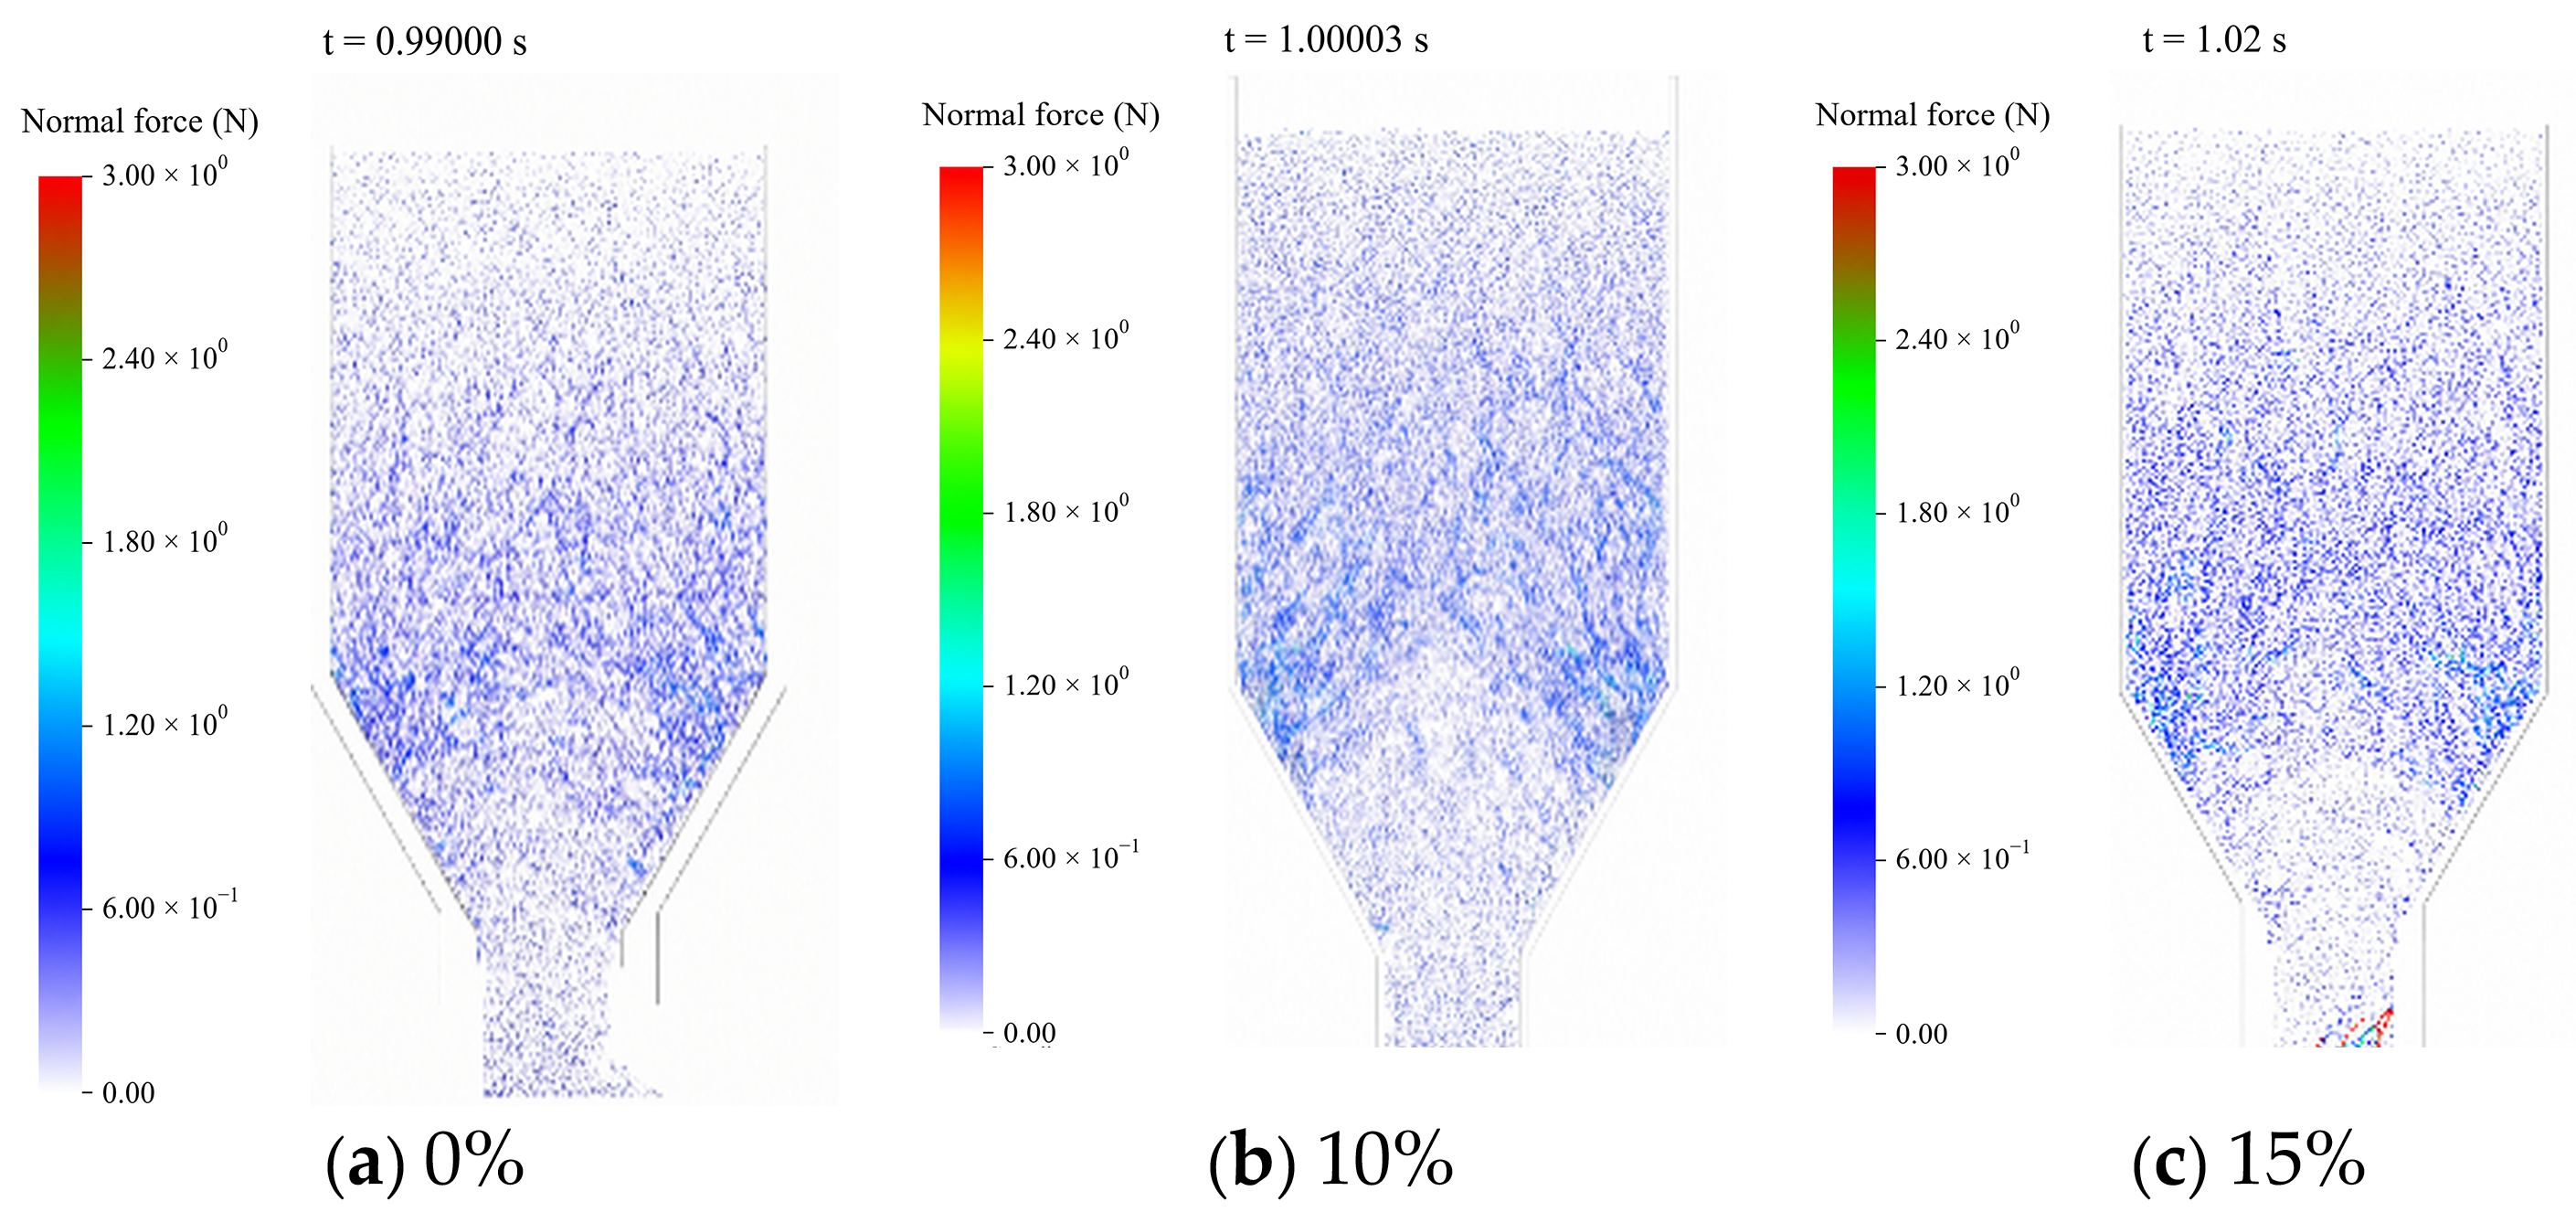
As coal accumulated in the bunker, the particle contact network developed and became concentrated toward the lower region. Force-chain distributions at the end of filling for different moisture contents are shown in Figure 8.
Figure 8.
Force-chain distributions at the end of filling under different moisture contents. (a) 0%; (b) 10%; and (c) 15%.
Figure 8 shows that strong force chains were generally concentrated in the lower cylindrical section and at the cylindrical-to-conical transition under all moisture conditions, with locally continuous arch-shaped load-bearing paths. Increasing moisture strengthened interparticle friction and adhesion, leading to greater continuity and concentration of strong force chains in the transition region.
3.1.2. Coal-Arch Evolution and Arching Locations
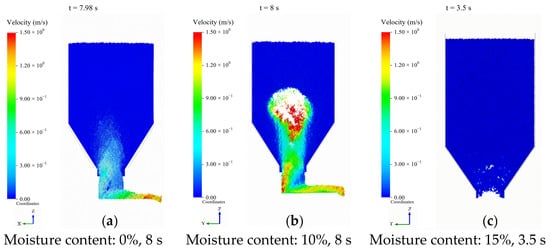
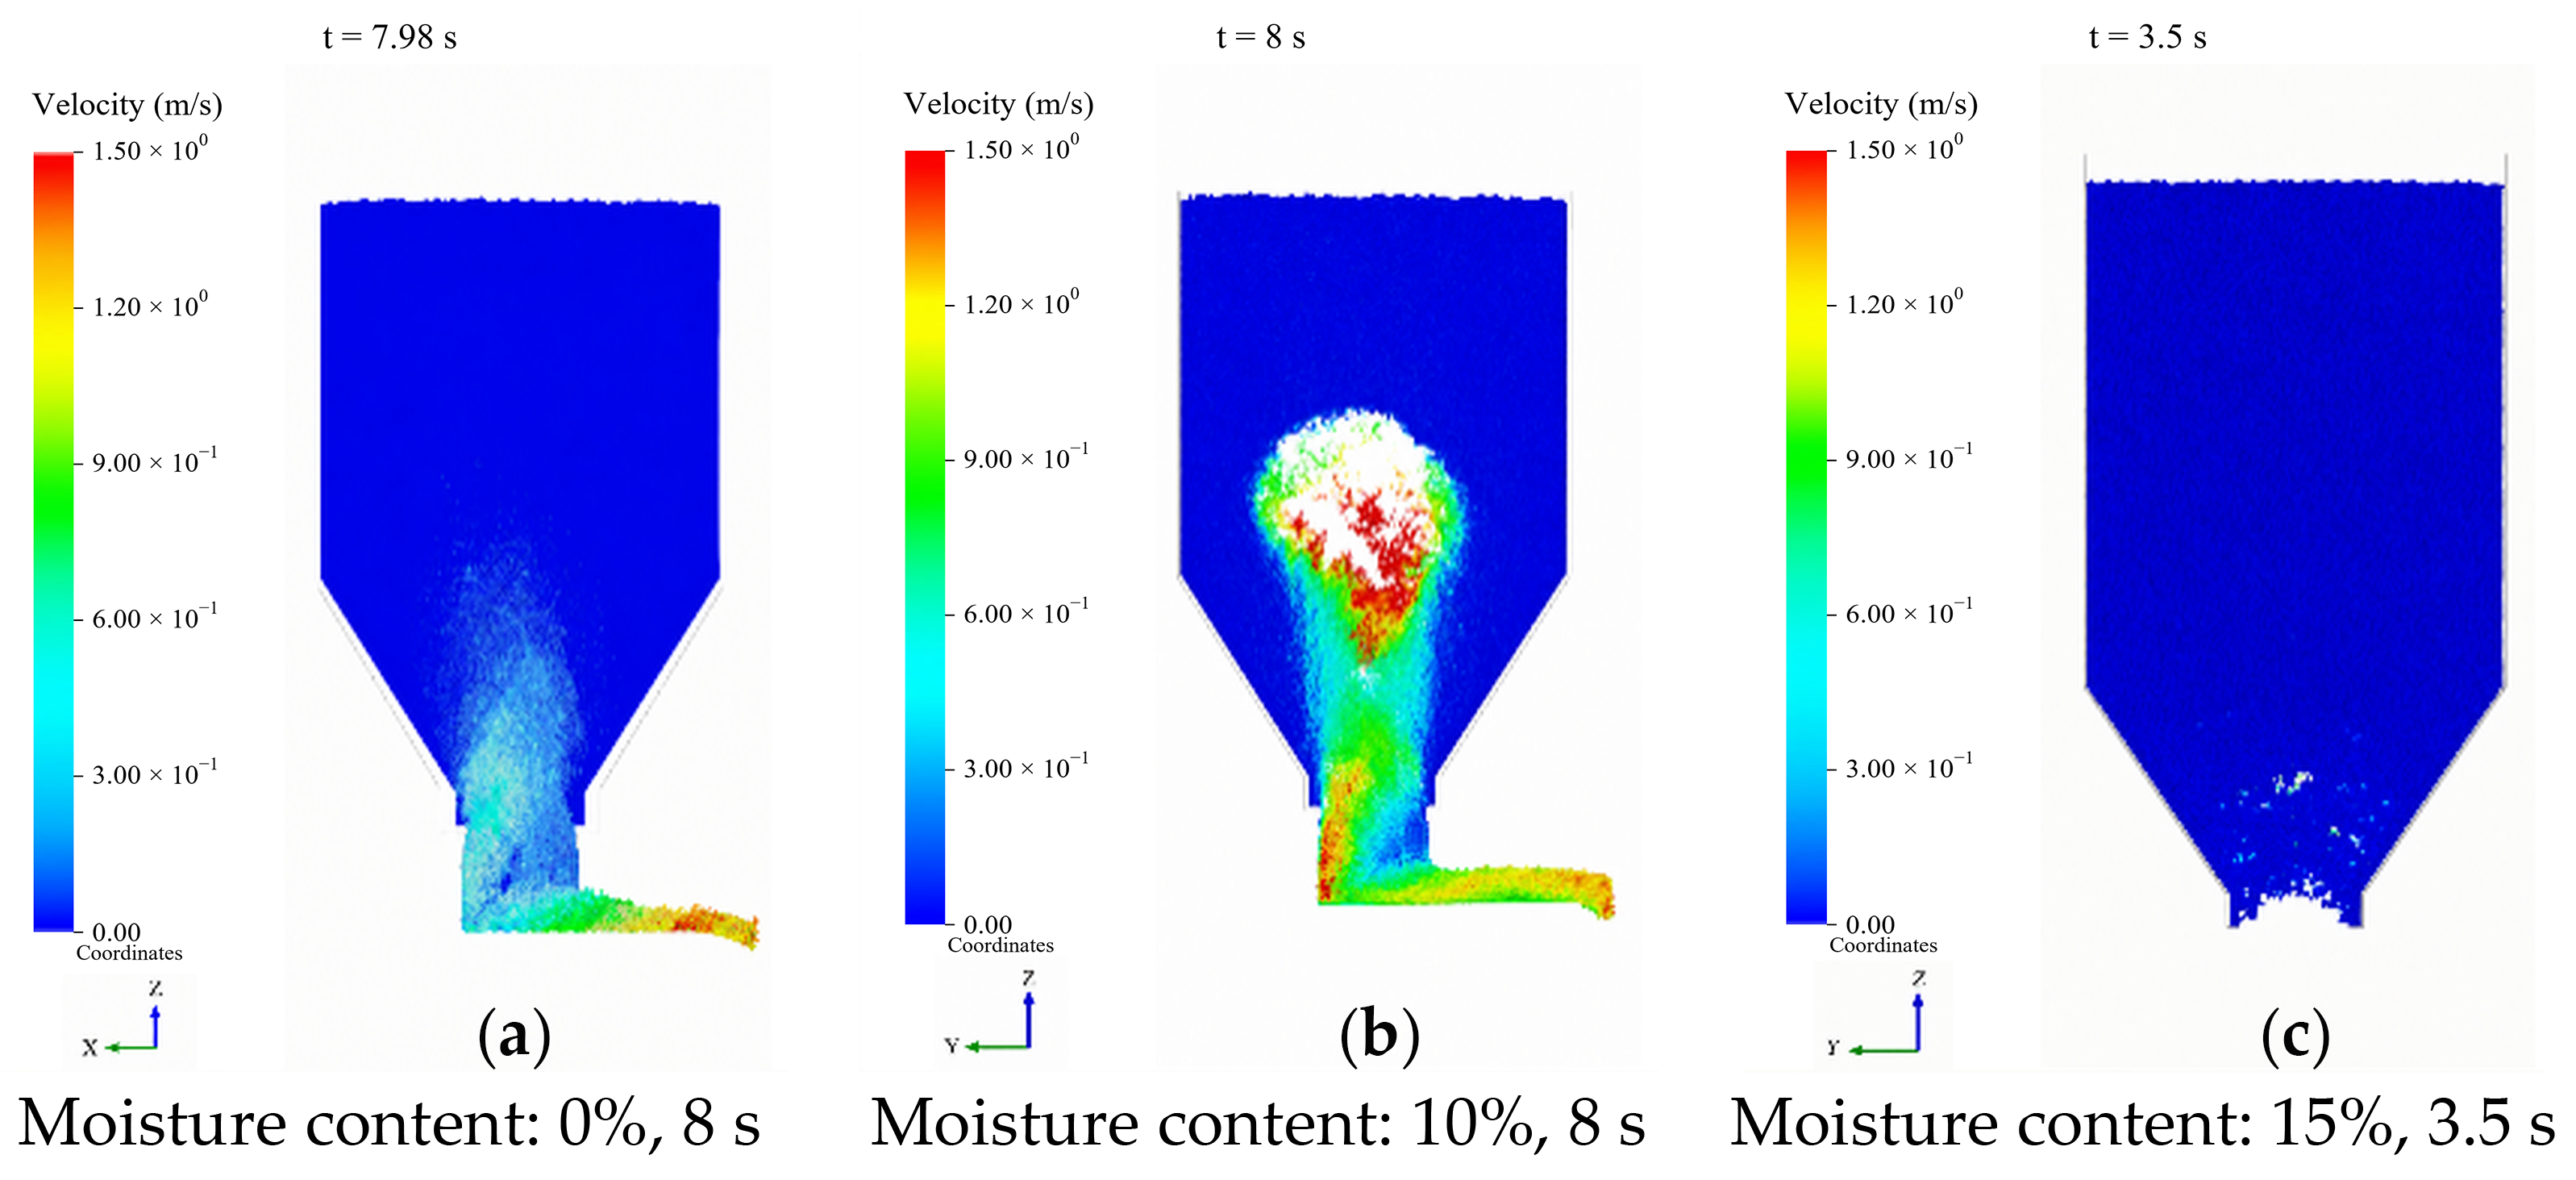
Representative discharge states differed markedly with moisture content, as shown in Figure 9.
Figure 9.
Representative discharge states under different moisture conditions. (a) Moisture content: 0%; Time: 8 s; (b) Moisture content: 10%; Time: 8 s; (c) Moisture content: 15%; Time: 3.5 s.
Figure 9 presents representative discharge states for qualitative comparison. The 0% and 10% moisture cases show material that was still discharging at approximately 8 s, whereas the 15% case shows arching-induced blockage and cessation of discharge at 3.5 s. Different time instants were chosen to illustrate the typical contrast between continuing discharge and stable blockage, as well as the associated particle-flow morphologies. These images are therefore used for qualitative comparison only; they are not used to quantitatively compare discharge rates, arching times, or force-chain magnitudes between moisture cases.
Combining the velocity and force-chain fields, the major stable arch was predicted approximately 3–5 m above the outlet, consistent with the observed position of about 3.7 m. This comparison supports arch location identification for the current engineering conditions, but it does not establish uniqueness of the DEM contact parameters or quantitative accuracy of force-chain magnitudes.
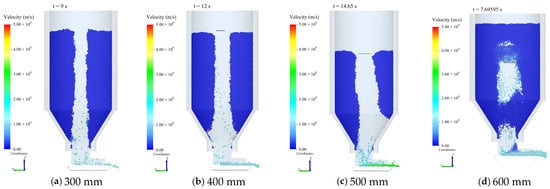
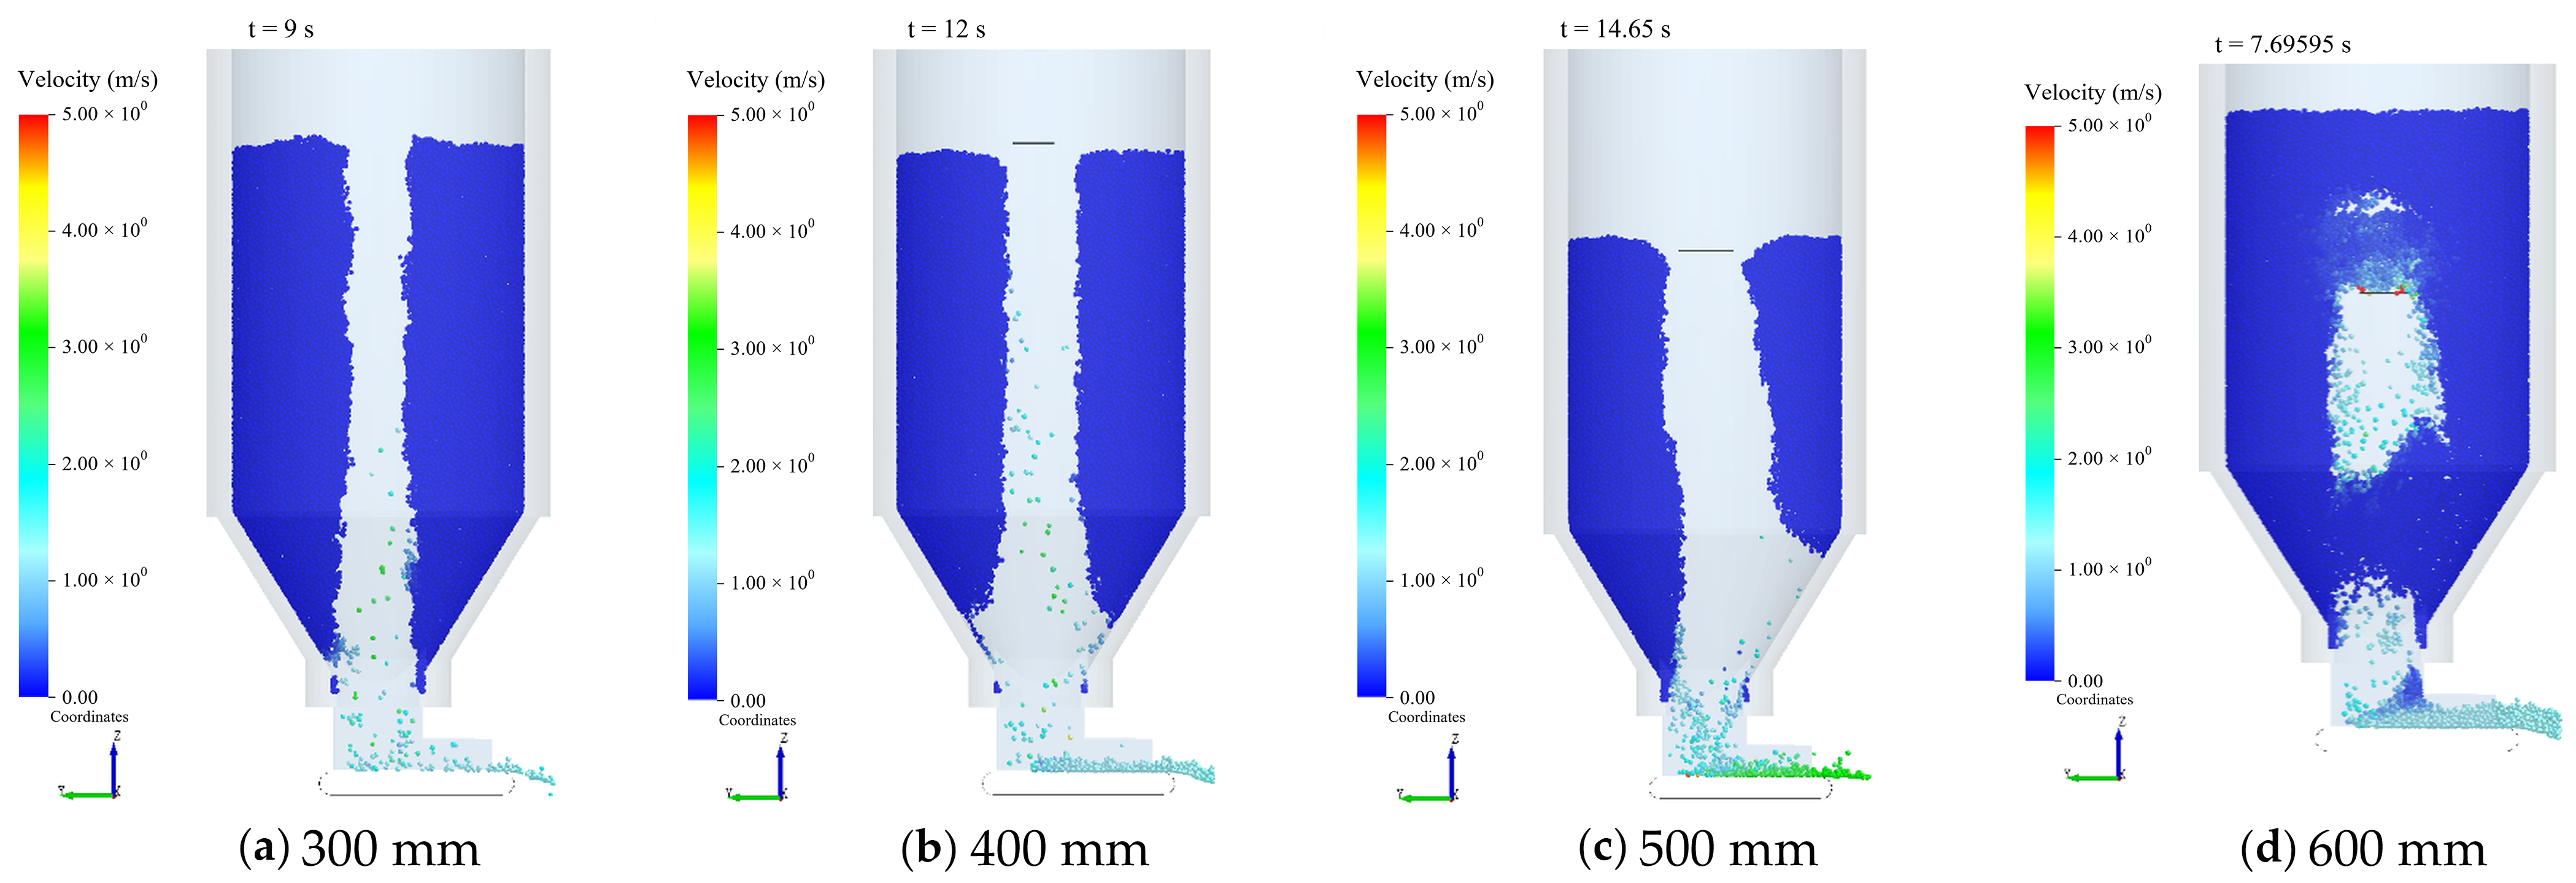
3.1.3. Effect of Arch-Breaking Range on Discharge Behavior
The stable arch formed at 15% moisture content was used as the initial state, and a planar arch-breaking component was used to disturb the critical region. By rotating at 5°/s and moving upward at 3 m/s, the component disrupted the local particle load-bearing structure. Four nominal disturbance radii, R = 300, 400, 500, and 600 mm, were examined with the same component motion. The resulting arch destabilization and discharge states are shown in Figure 10.
Figure 10.
Arch destabilization and discharge at different nominal disturbance radii. (a) 300 mm, (b) 400 mm, (c) 500 mm, and (d) 600 mm.
For each case, t = 0 s was defined as the time at which the outlet gate opened and discharge began. The cumulative discharged mass and peak discharge rate were measured over 0–15 s. In the R = 500 mm case, the component had risen completely above the material pile by t = 15 s. The cumulative mass and peak rate were obtained from EDEM outputs, and the mean discharge rate was calculated by dividing the 15 s cumulative mass by 15 s (Table 7).
Table 7.
DEM discharge results under different disturbance radii.
Figure 10 shows the final particle distributions after disturbance in the four cases. Considerable coal remained in the 300 and 400 mm cases; the 500 mm case exhibited pronounced downward material movement and formation of a discharge channel, whereas the 600 mm case showed renewed accumulation near the cleared channel. Over the common 15 s interval (Table 7), the R = 500 mm case discharged 350 t, exceeding the 300, 400, and 600 mm cases by 20.7%, 11.1%, and 14.8%, respectively, and its mean discharge rate was 23.33 t/s. The 600 mm case attained a higher peak rate (45.6 t/s) than the 500 mm case (40.2 t/s), but its cumulative discharged mass was lower (305 t). Considering both cumulative discharge and final channel morphology, 500 mm is a relatively favorable disturbance radius among the four cases under the current model and local disturbance conditions.
Coal properties affect arching and clearing responses at both the granular-contact and local-material-failure levels. In the DEM, contact stiffness affects particle deformation and load transmission; interparticle friction and adhesion affect coal flow and adhesive blockage [30] and, together with rolling resistance, alter load-bearing-network rearrangement. In SPH, coal stiffness influences stress-wave propagation and impact response, whereas coal strength defines the local failure condition: stronger coal generally requires greater local applied stress to fail. Local coal fragmentation and destabilization of a granular coal arch must therefore be assessed separately; RHT strength parameters cannot be treated as the ultimate bearing capacity of the DEM coal arch.
Bunker diameter and outlet geometry influence arching through stress transfer and support configuration. Equation (1) indicates that, for unchanged lateral pressure coefficient and wall-friction conditions, the characteristic length of stress development increases with bunker diameter, reflecting a longer length scale for load transfer from the material column to the wall. Actual arch position and load paths are also affected by the cylindrical-to-conical transition, outlet size, and particle-to-local-channel size ratio. Arch height or disturbance radius therefore cannot simply be scaled in direct proportion to bunker diameter.
The predicted main arching region of approximately 3–5 m and candidate nominal disturbance radius of 500 mm apply to the stable arching case at 15% moisture content in a bunker 12 m in diameter and 25 m in height, subject to the adopted particle representation, contact parameters, and component motion. The 500 mm value denotes the nominal radius of a mechanical component, not the erosion radius of an actual water jet. Application to other coals or bunker geometries requires re-evaluation of the necessary disturbance range according to material properties, discharge configuration, and operating conditions.
3.2. Water-Jet Propagation Characteristics and Effective Working Distance
3.2.1. Jet Velocity and Dynamic-Pressure Distributions
Centerline velocity, dynamic pressure, and their streamwise attenuation are used to characterize axial jet propagation. The jet-diameter expansion ratio and mean spreading half-angle are additionally introduced to quantify lateral spreading and jet coherence. The diameter expansion ratio is defined as the ratio of downstream jet diameter to nozzle-exit diameter. The mean spreading half-angle is calculated as the arctangent of the increase in jet diameter divided by twice the axial propagation distance.
The baseline nozzle-exit diameter is 1.14 mm. At 500 mm downstream, the jet diameter is approximately 15 times the exit diameter, or approximately 17.1 mm, corresponding to a mean spreading half-angle of about 0.91°. These measures, considered with the attenuation of centerline velocity and dynamic pressure, are used to evaluate propagation and spreading within the investigated conditions.
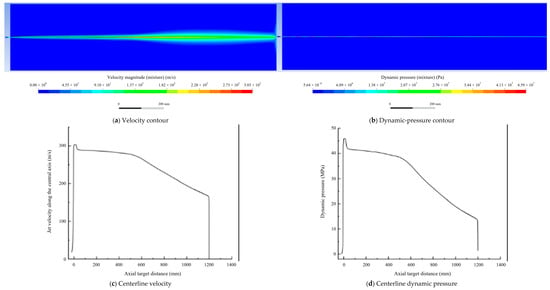
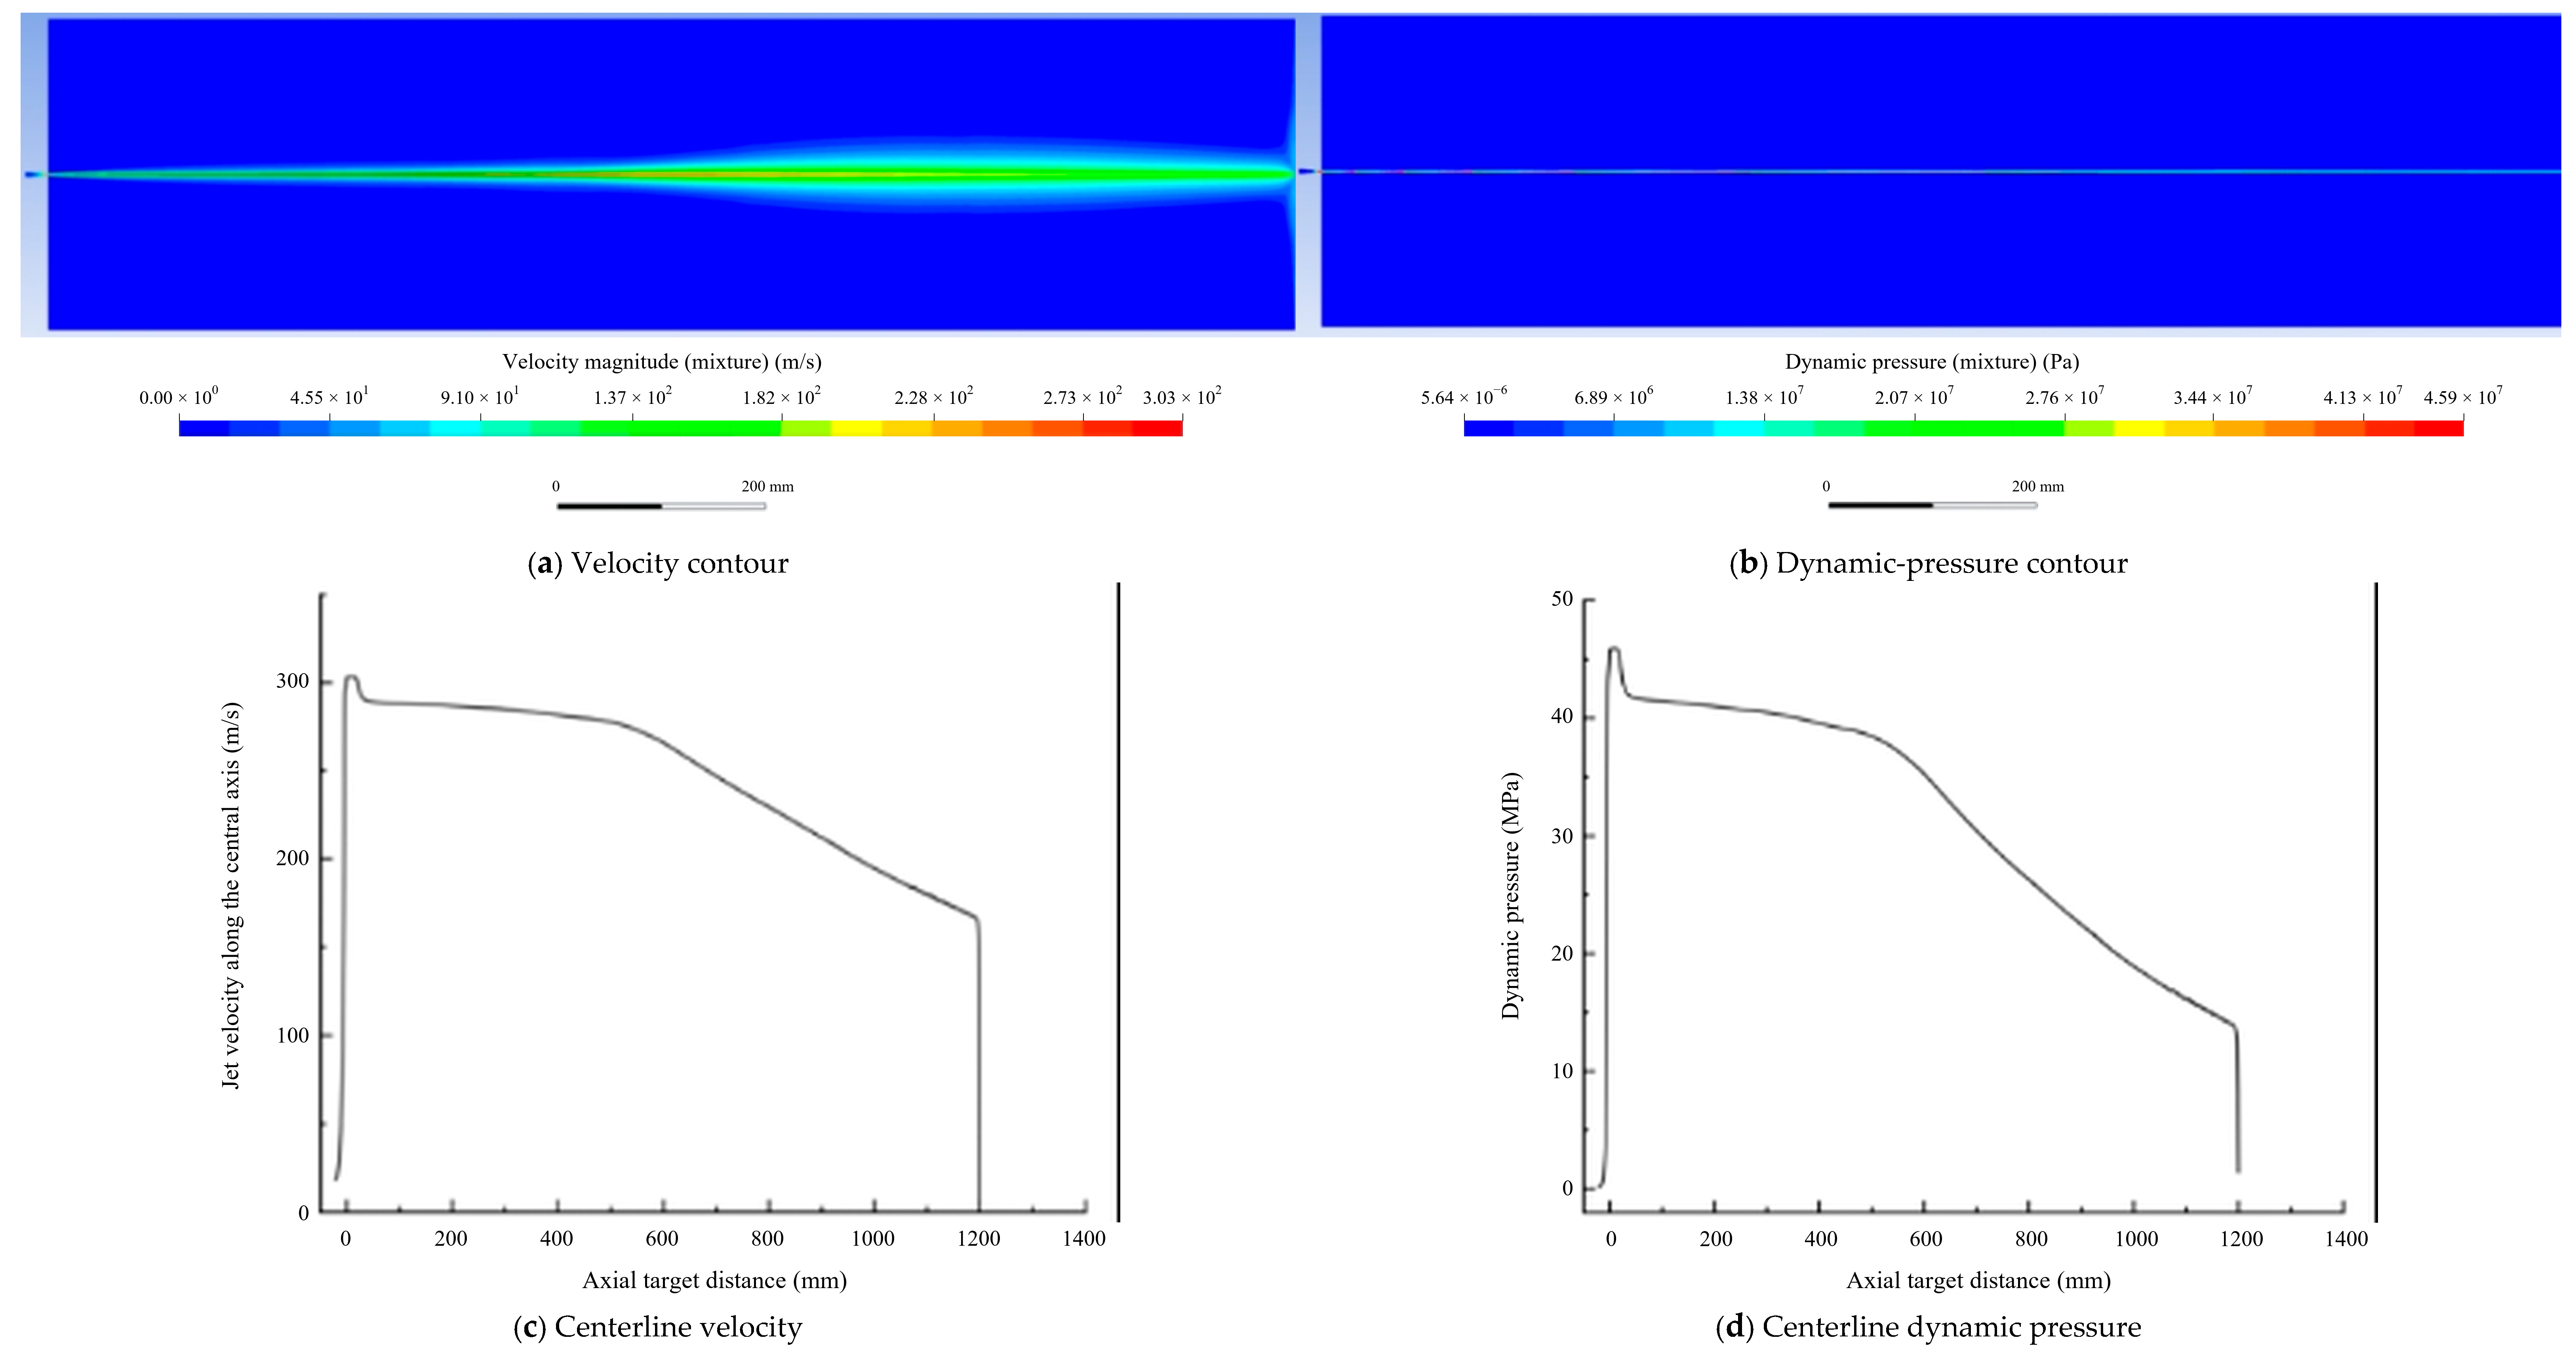
For the case with a system operating pressure of 46 MPa, total flow rate of 44 L/min, and nozzle diameter of 1.14 mm, the streamwise jet-velocity and dynamic-pressure distributions are shown in Figure 11.
Figure 11.
Jet velocity and dynamic-pressure distributions under the baseline operating condition.
Figure 11 shows a nozzle-exit velocity of about 303.3 m/s and a centerline dynamic pressure of about 38 MPa at 500 mm for the baseline case. Beyond 600 mm, centerline velocity and dynamic pressure decrease more rapidly, with centerline dynamic pressure dropping to about 18 MPa at 1000 mm. Between 500 and 1000 mm, centerline dynamic pressure decreases by approximately 52.6%, indicating a decline in the kinetic energy retention of the jet core with propagation distance. These results characterize axial propagation and attenuation; centerline dynamic pressure is not equated directly with the distribution of normal pressure on a target surface.
The nozzle-exit orifice diameter is a geometric dimension, whereas the lateral extent of a downstream jet depends on propagation distance and the adopted phase-interface, velocity, or pressure criterion. The effective impact area must also be assessed in conjunction with target-surface pressure distributions and material failure conditions. Hole diameter following plywood penetration reflects cumulative damage in a particular material over a particular exposure time and is not equivalent to the effective jet diameter. Hence, nozzle diameter, penetration-hole diameter, and nominal DEM disturbance radius refer to distinct physical processes and cannot be directly equated numerically.
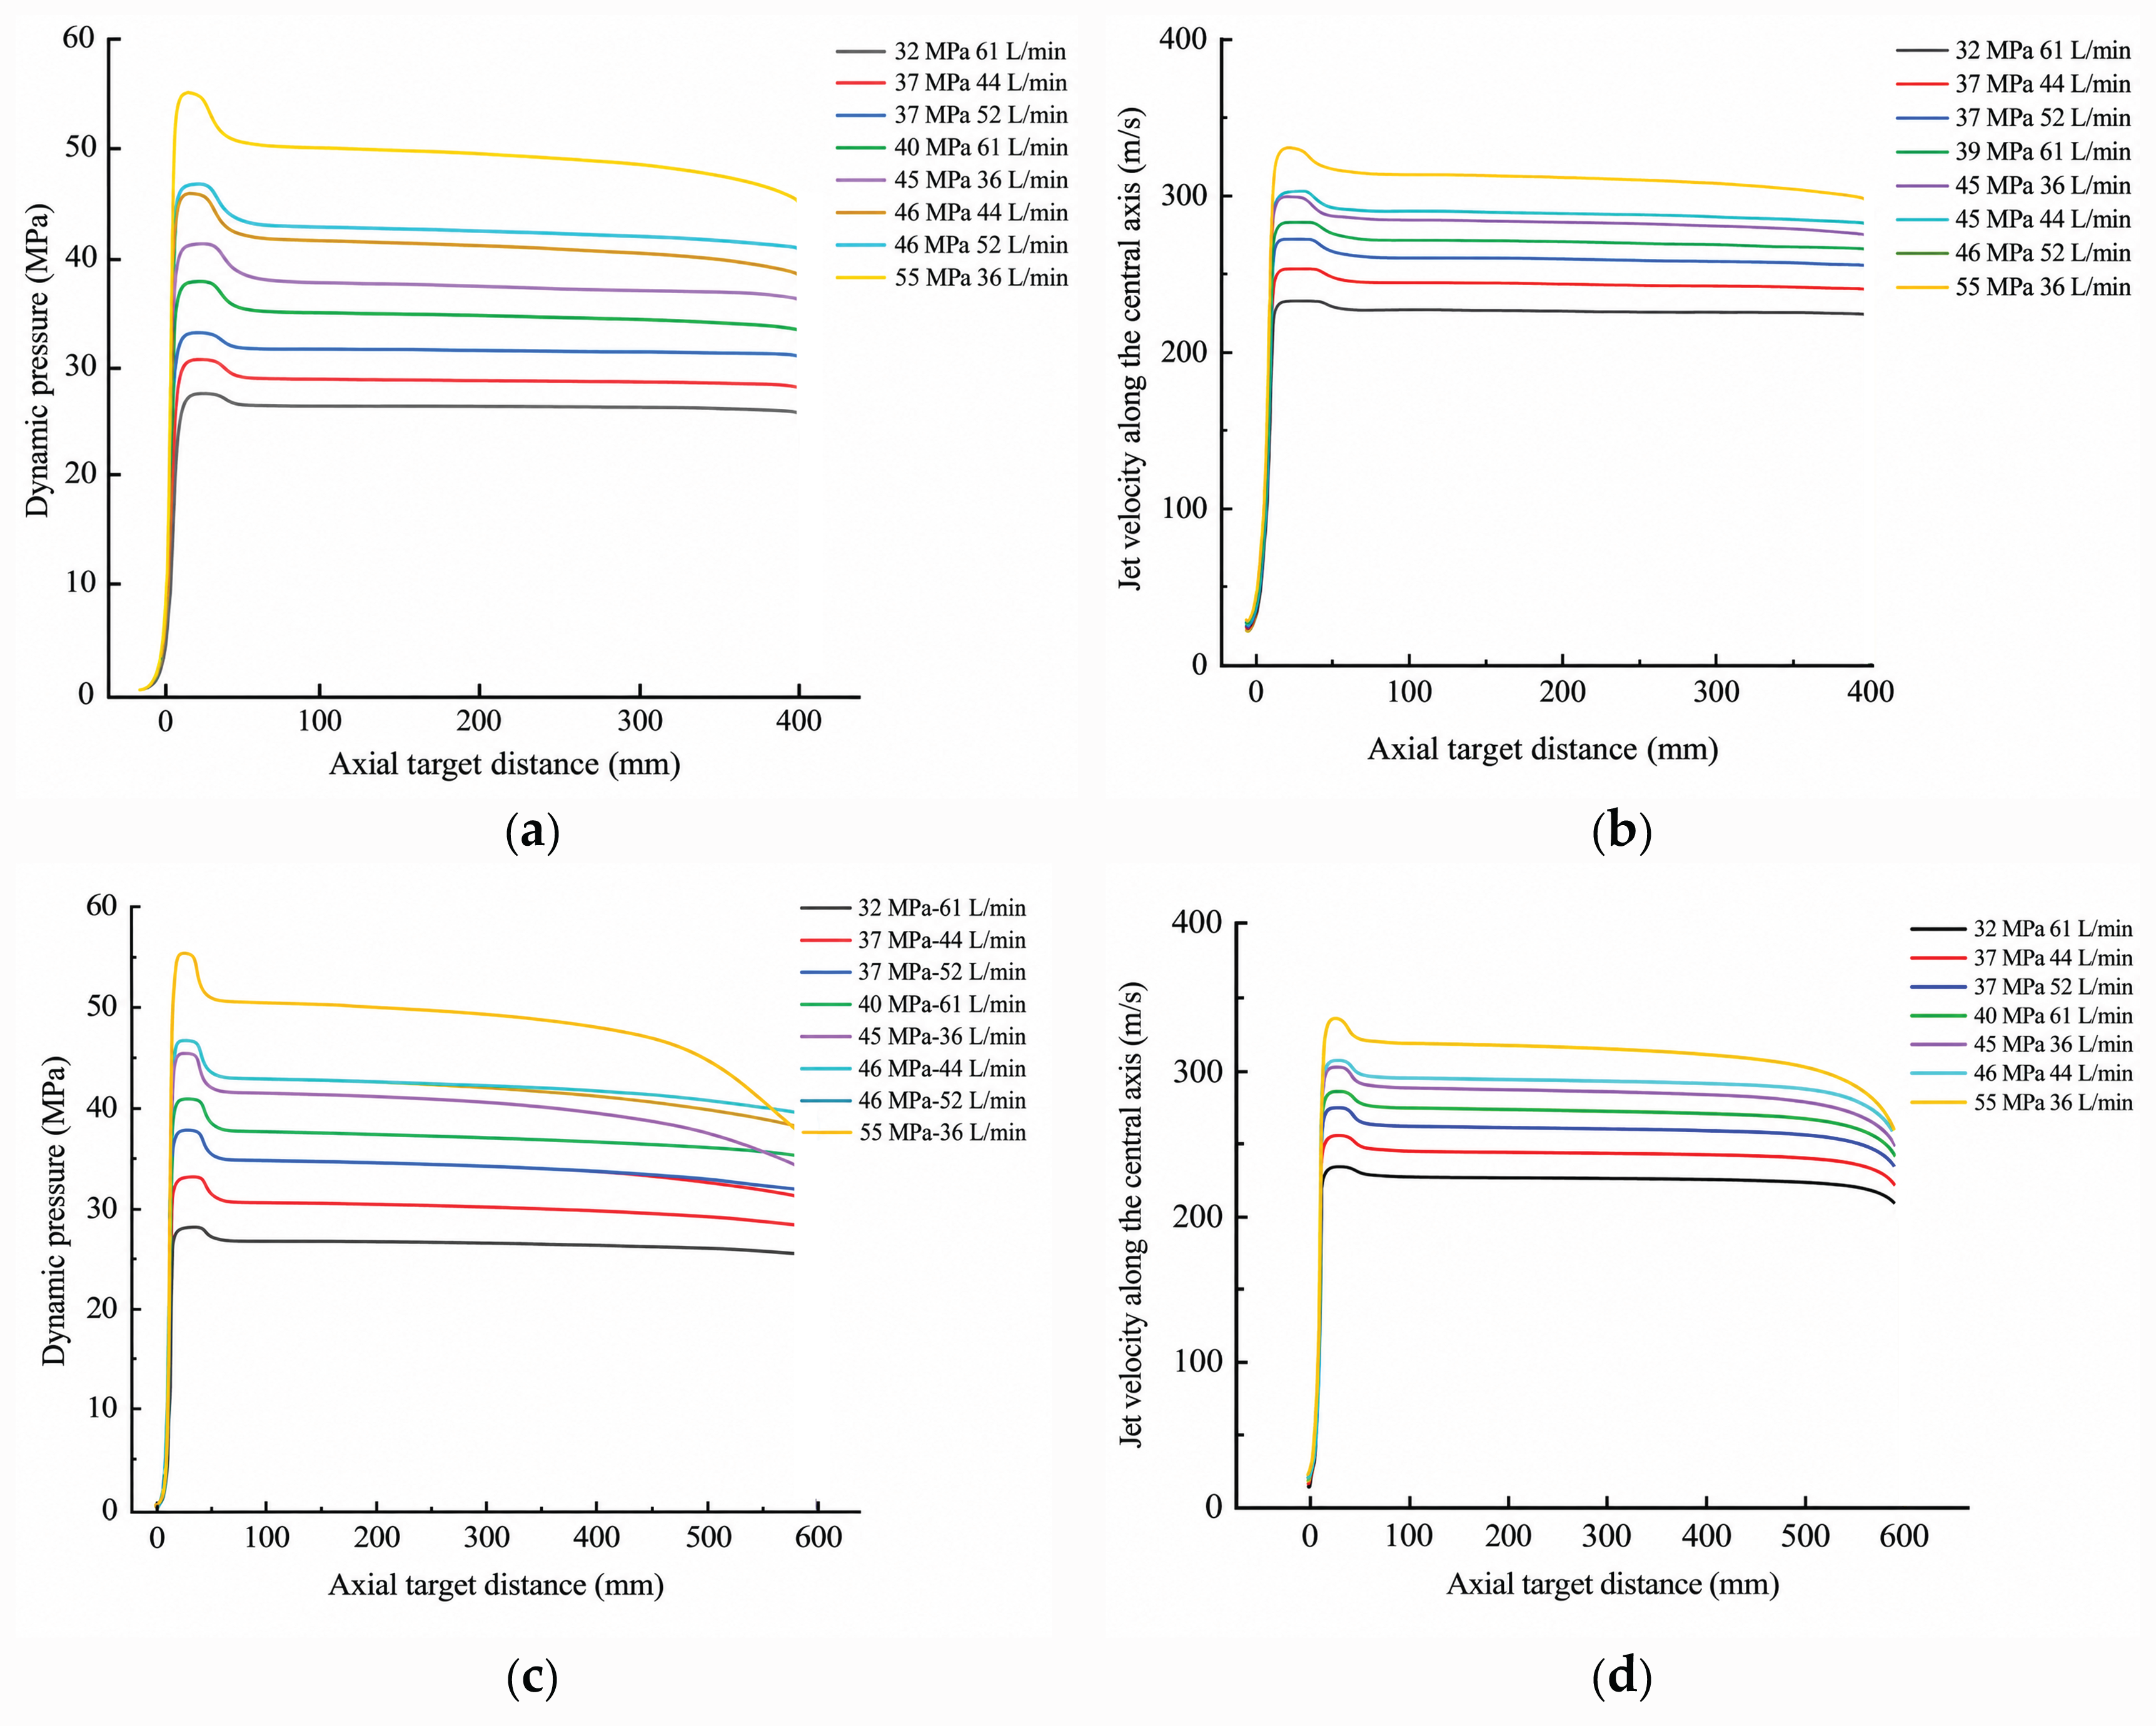
The variation of axial velocity and dynamic pressure among the combined operating conditions at stand-off distances of 400 and 600 mm is shown in Figure 12.
Figure 12.
Jet dynamic-pressure and velocity distributions at 400 and 600 mm stand-off distances. (a) Dynamic pressure at 400 mm; (b) velocity at 400 mm; (c) dynamic pressure at 600 mm; (d) velocity at 600 mm.
Figure 12 indicates that, considering axial velocity, dynamic pressure, and streamwise attenuation across the eight cases, the 46 MPa–44 L/min–1.14 mm combination exhibits relatively favorable overall propagation and was selected as the baseline for subsequent analysis. Because pressure, total system flow rate, and nozzle diameter were varied simultaneously rather than through an independent-factor experimental design, this combination is a preferred choice only among those examined and does not represent a globally optimal parameter set.
3.2.2. Plywood Penetration Tests at Different Stand-Off Distances
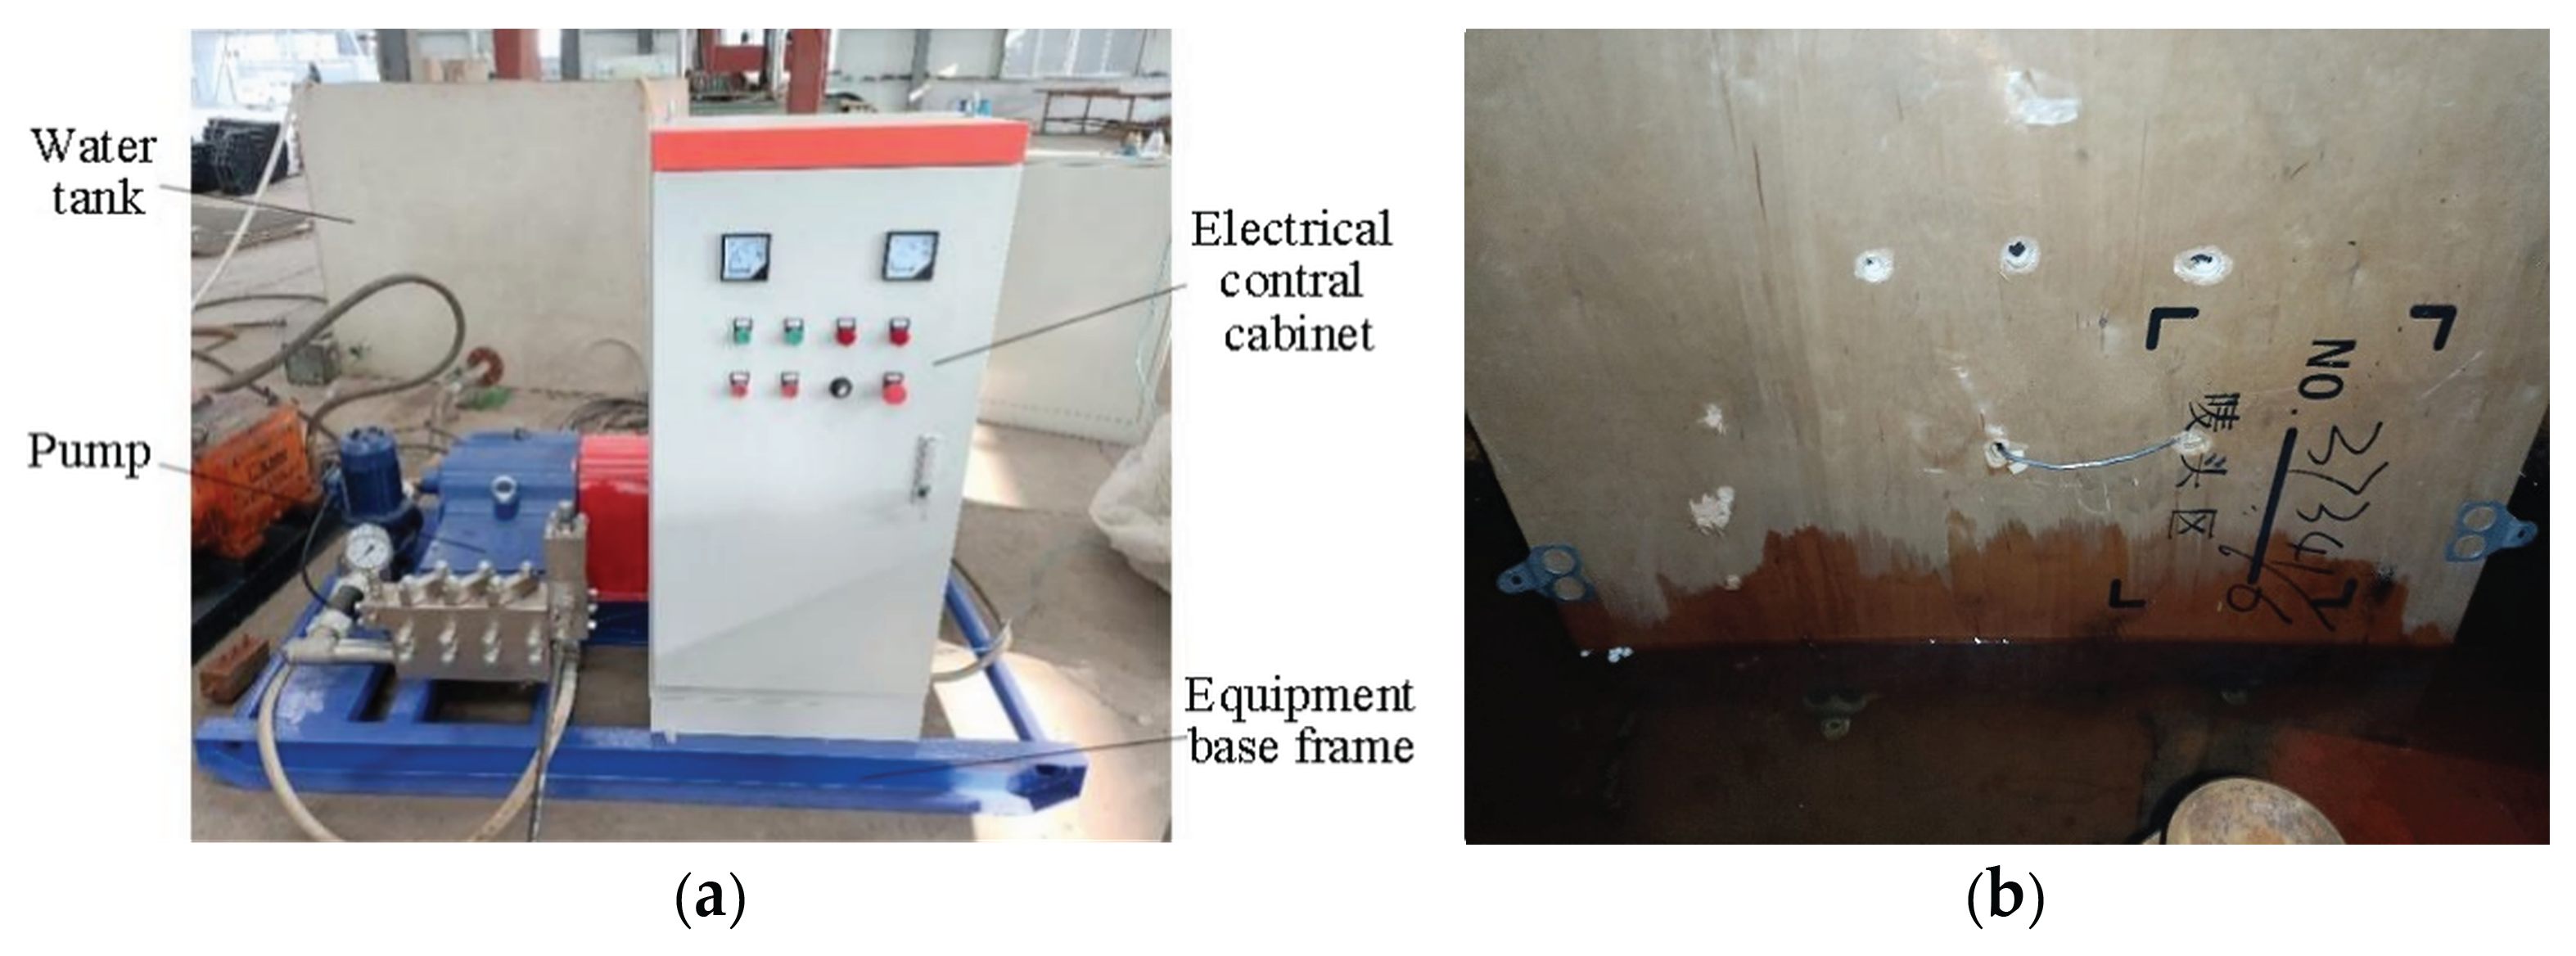
To compare water-jet penetration at different stand-off distances, a 7 mm thick five-ply wood plywood panel was used as the test target. Fixed-point impact tests were conducted at 46 MPa with stand-off distances of 400, 500, and 600 mm, and penetration times and hole diameters were recorded. The responses of panels made of the same material and thickness were compared to examine the stand-off effect and provide supporting evidence for jet propagation attenuation. Plywood differs from coal in composition, pore structure, and fracture mechanisms and is therefore not treated as mechanically equivalent to coal. Nor are these tests used to quantitatively validate coal failure or the SPH model. The test equipment and representative results are shown in Figure 13.
Figure 13.
Water-jet impact test equipment and representative impact results. (a) High-pressure water-jet equipment; (b) water-jet impact test results.
Penetration time increased from 7 to 24 s, and hole diameter decreased from 11 to 3 mm with increasing stand-off distance. At 500 mm, penetration took 12 s and produced a hole approximately 7 mm in diameter.
With increasing stand-off distance, penetration of the plywood took longer, and the resulting hole became smaller. These trends are qualitatively consistent with the streamwise jet attenuation predicted by CFD and thus provide a supplementary reference for changes in jet action with distance. The panel could still be penetrated at 500 mm, supporting consideration of that stand-off distance for the present equipment. However, because no erosion-similarity relationship has been established between plywood and coal, the results are not used to establish the optimal stand-off distance for coal or to quantitatively validate coal failure.
3.3. Dynamic Damage Mechanism of Coal Under Water-Jet Impact
The local dynamic damage of coal under high-pressure water-jet impact was analyzed with the equivalent-coal-body SPH model in terms of representative-point responses, stress-wave propagation, and crater evolution.
3.3.1. Damage Evolution and Stress-Wave Propagation
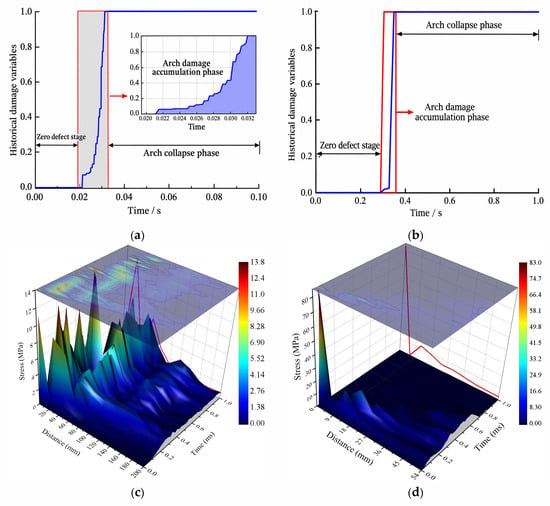
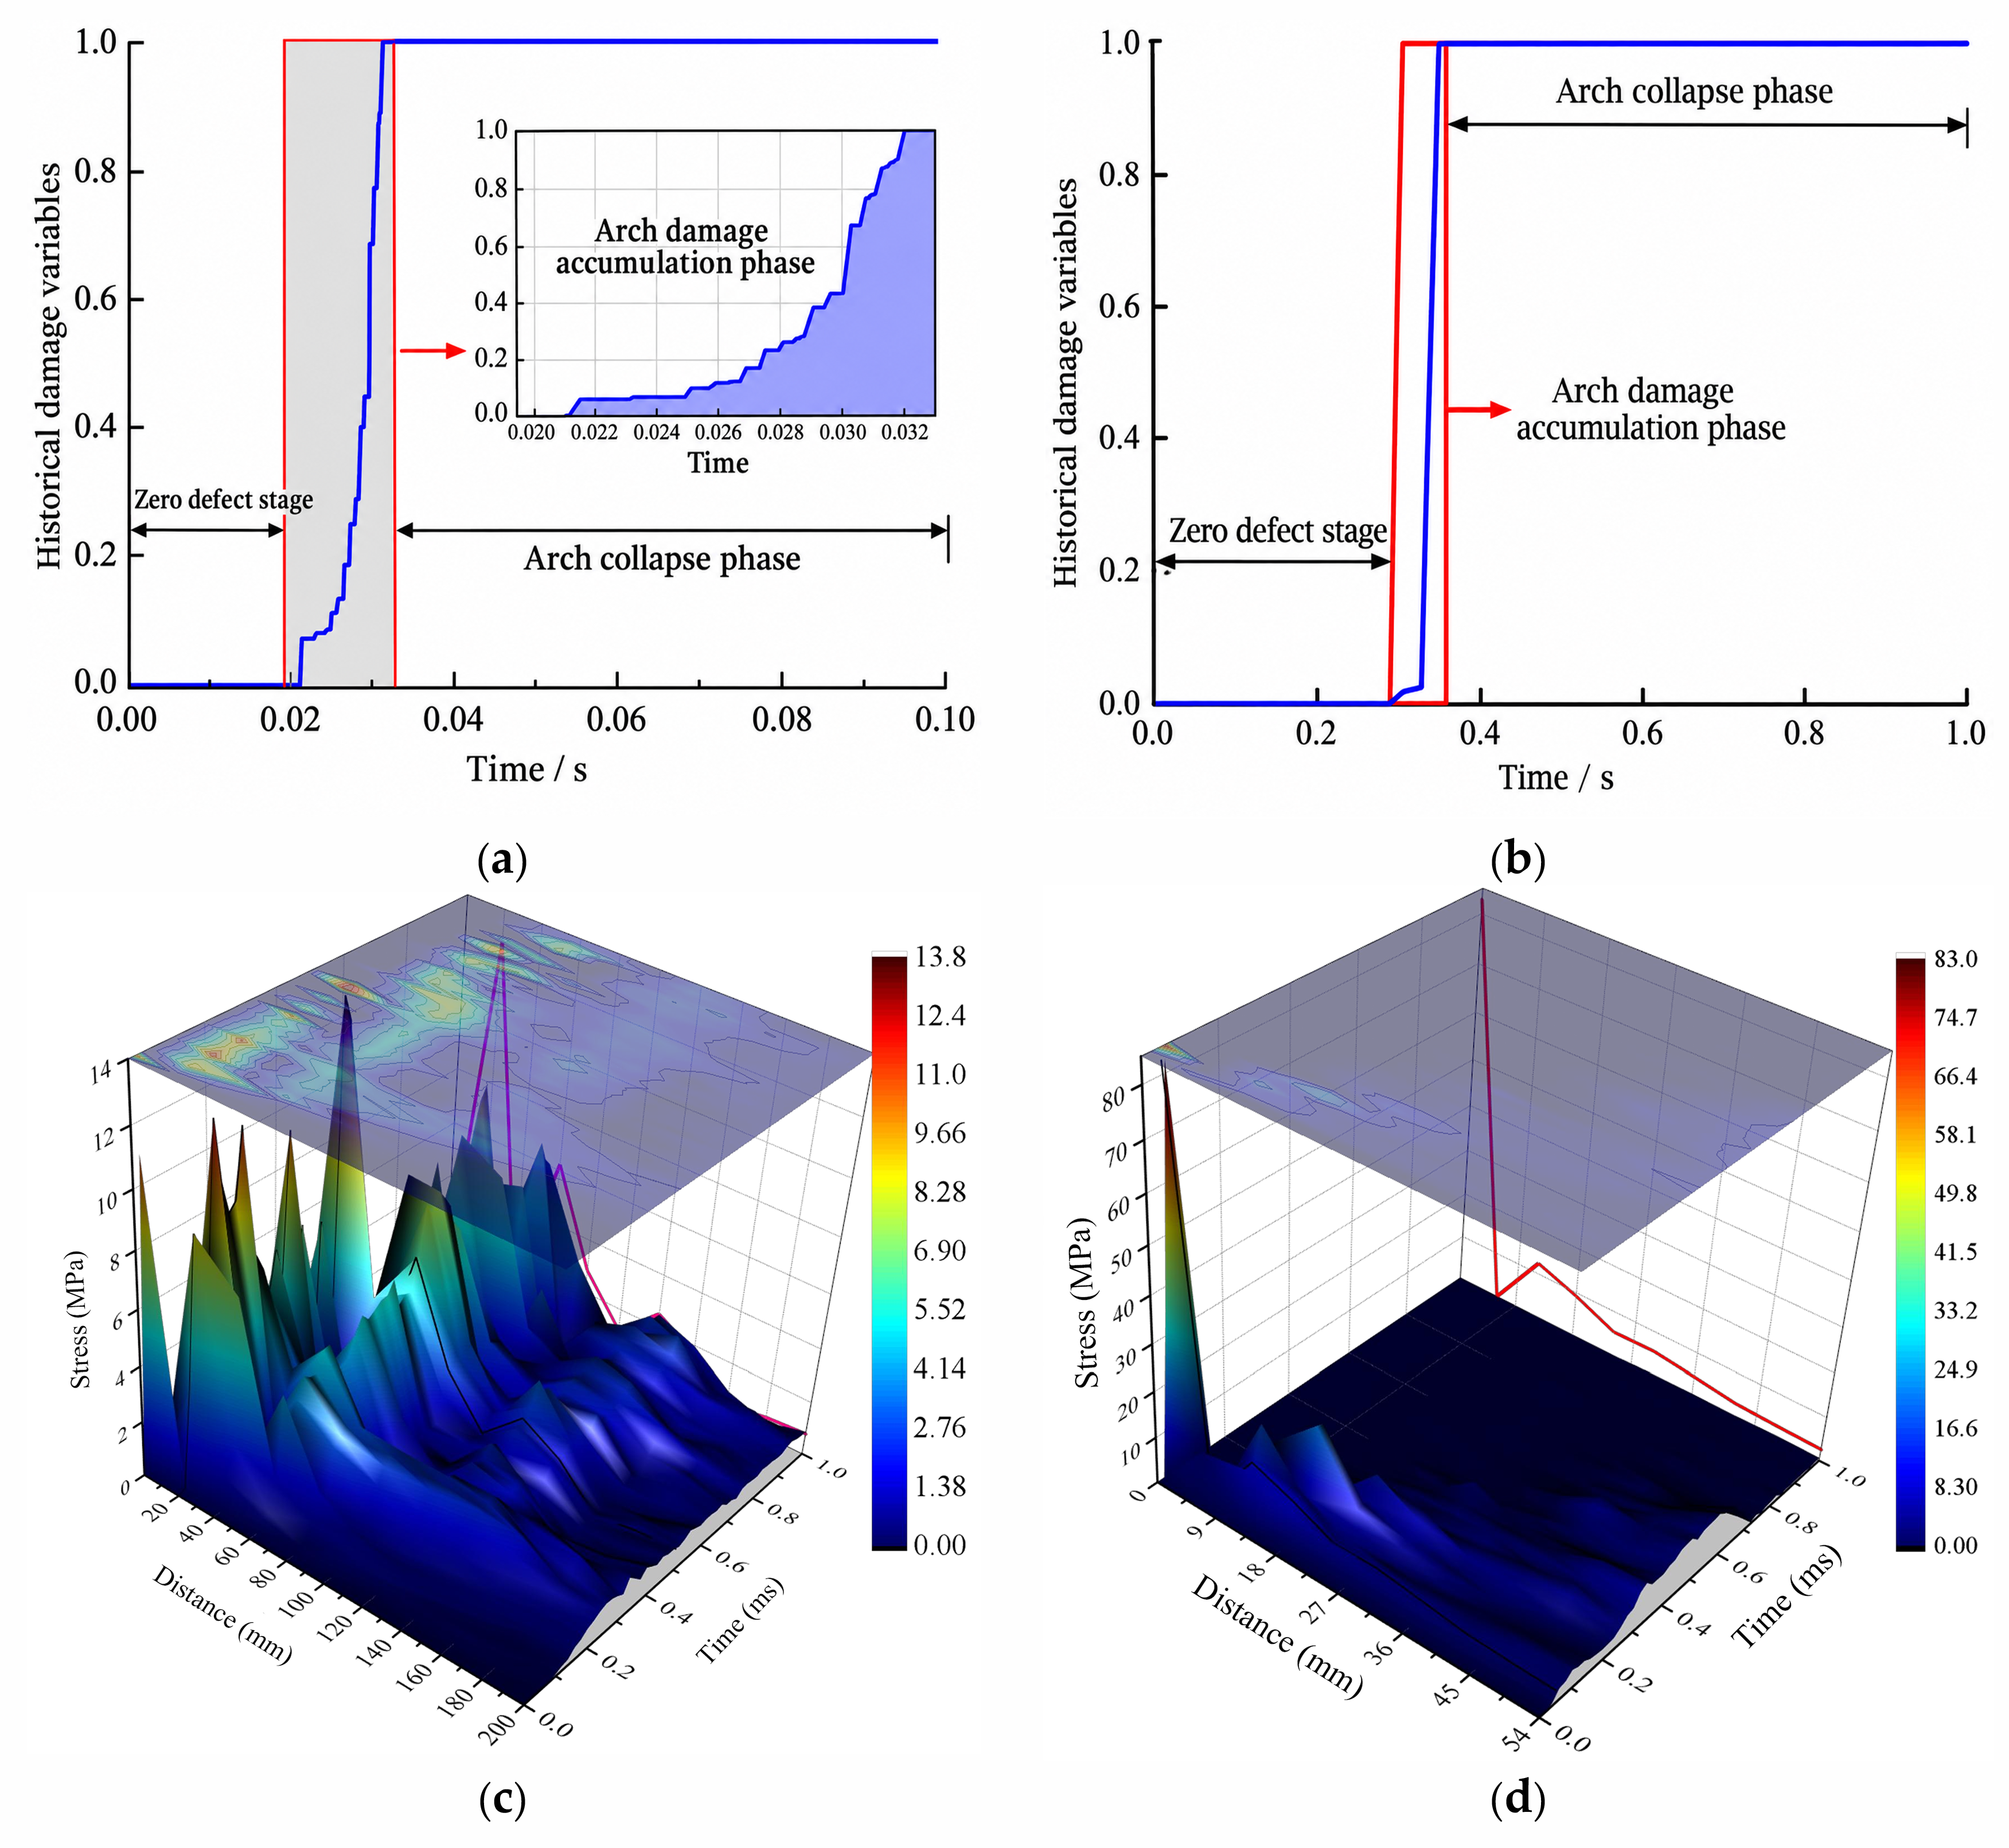
To examine damage accumulation and stress-wave propagation within coal during impact, damage variables at representative locations and dynamic responses along axial and radial paths were extracted, as shown in Figure 14.
Figure 14.
Damage response at representative locations and stress-wave propagation. (a) Damage variable of Element 1; (b) damage variable of internal Element 2; (c) spatiotemporal evolution of the axial stress wave; (d) spatiotemporal evolution of the radial stress wave.
Figure 14 shows that damage first appears near the coal surface and then propagates inward and accumulates. Elements close to the impact surface respond earlier, while deeper points show delayed pressure fluctuations and local tensile response. The water jet therefore not only causes surface erosion but also transmits stress waves into the coal. Equivalent stress generally attenuates with distance along both axial and radial paths. A local peak of about 12.9 MPa occurs at an axial distance of approximately 20 mm, indicating that impact energy is transmitted predominantly deeper along the jet axis and then spreads radially.
3.3.2. Crater Formation and Crack Propagation
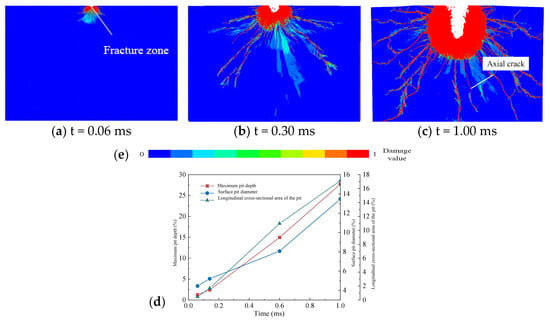
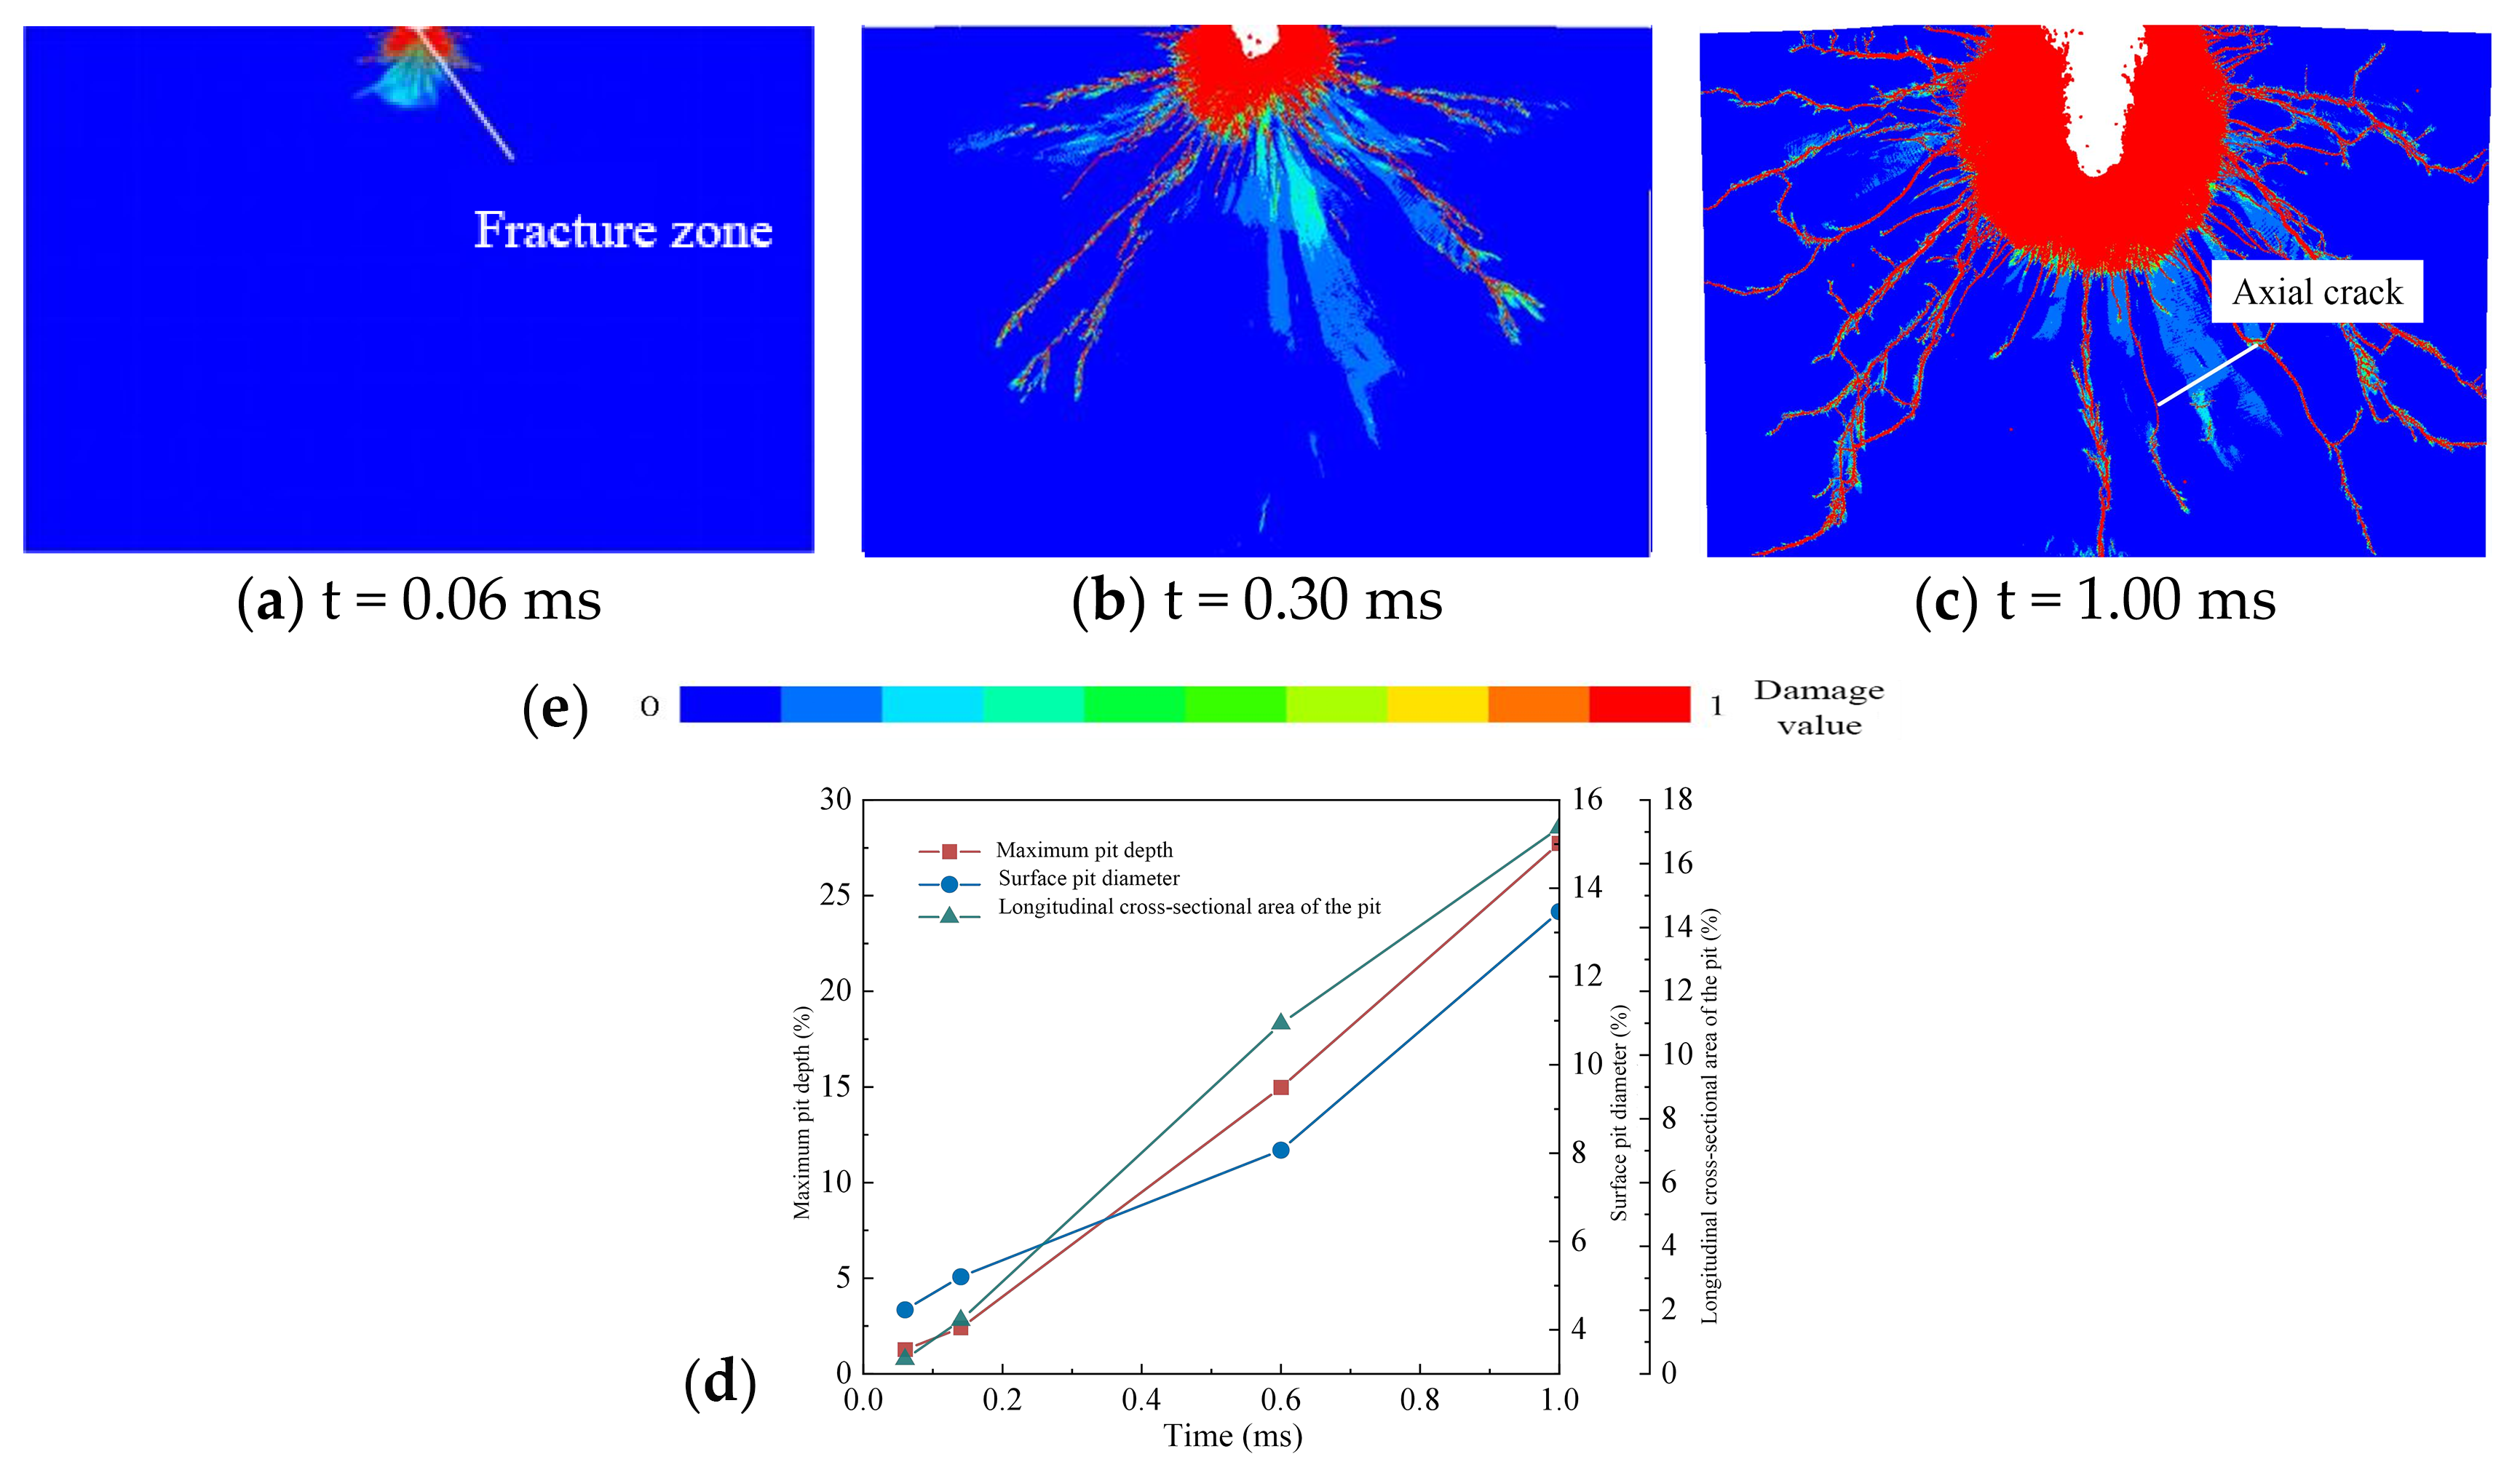
Figure 15 shows the evolution of the coal damage field, crater morphology, and geometric parameters during the initial jet-impact stage.
Figure 15.
Coal damage fields and crater evolution during the initial jet-impact stage. (a) t = 0.06 ms, showing the initial fractured zone; (b) t = 0.30 ms; (c) t = 1.00 ms, showing the development of an axial crack; (d) temporal variations in maximum pit depth, surface pit diameter, and longitudinal cross-sectional area of the pit; and (e) color bar indicating the damage value, ranging from 0 to 1.
A local crater first forms at the impact center. The fractured zone subsequently extends into the coal along the jet axis, with radial cracks spreading outward from the crater walls. As impact continues, crater depth, diameter, and fractured area progressively increase; axial damage advances more rapidly than radial damage. This indicates a local failure sequence of surface impact, axial erosion, radial crack propagation, and fractured-zone enlargement.
The SPH simulation focuses on the local dynamic response during the first 0–1 ms after impact, including stress-wave propagation, damage initiation, and crack development. By contrast, the penetration test records the time required for a continuous jet to pass through plywood, reflecting cumulative erosion over seconds. Because the target materials, time scales, and evaluation measures differ, the penetration tests are used only to examine attenuation of jet impact capability with stand-off distance and cannot directly validate the coal-fracture time predicted by SPH. The present SPH results are primarily relevant to the local damage mechanism in the initial impact stage; prolonged erosion and accumulated fragmentation are not included.
3.4. Factors Affecting Arch-Breaking Performance
Under the baseline conditions, jet velocity and incidence angle were further examined as influences on local coal failure, using crater depth, crater diameter, and damage extent as the main evaluation measures.
3.4.1. Effect of Jet Velocity
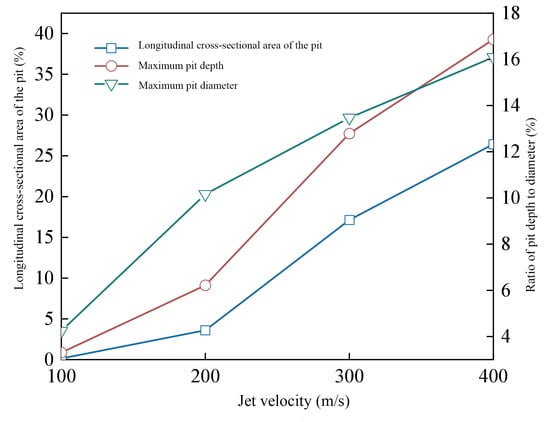
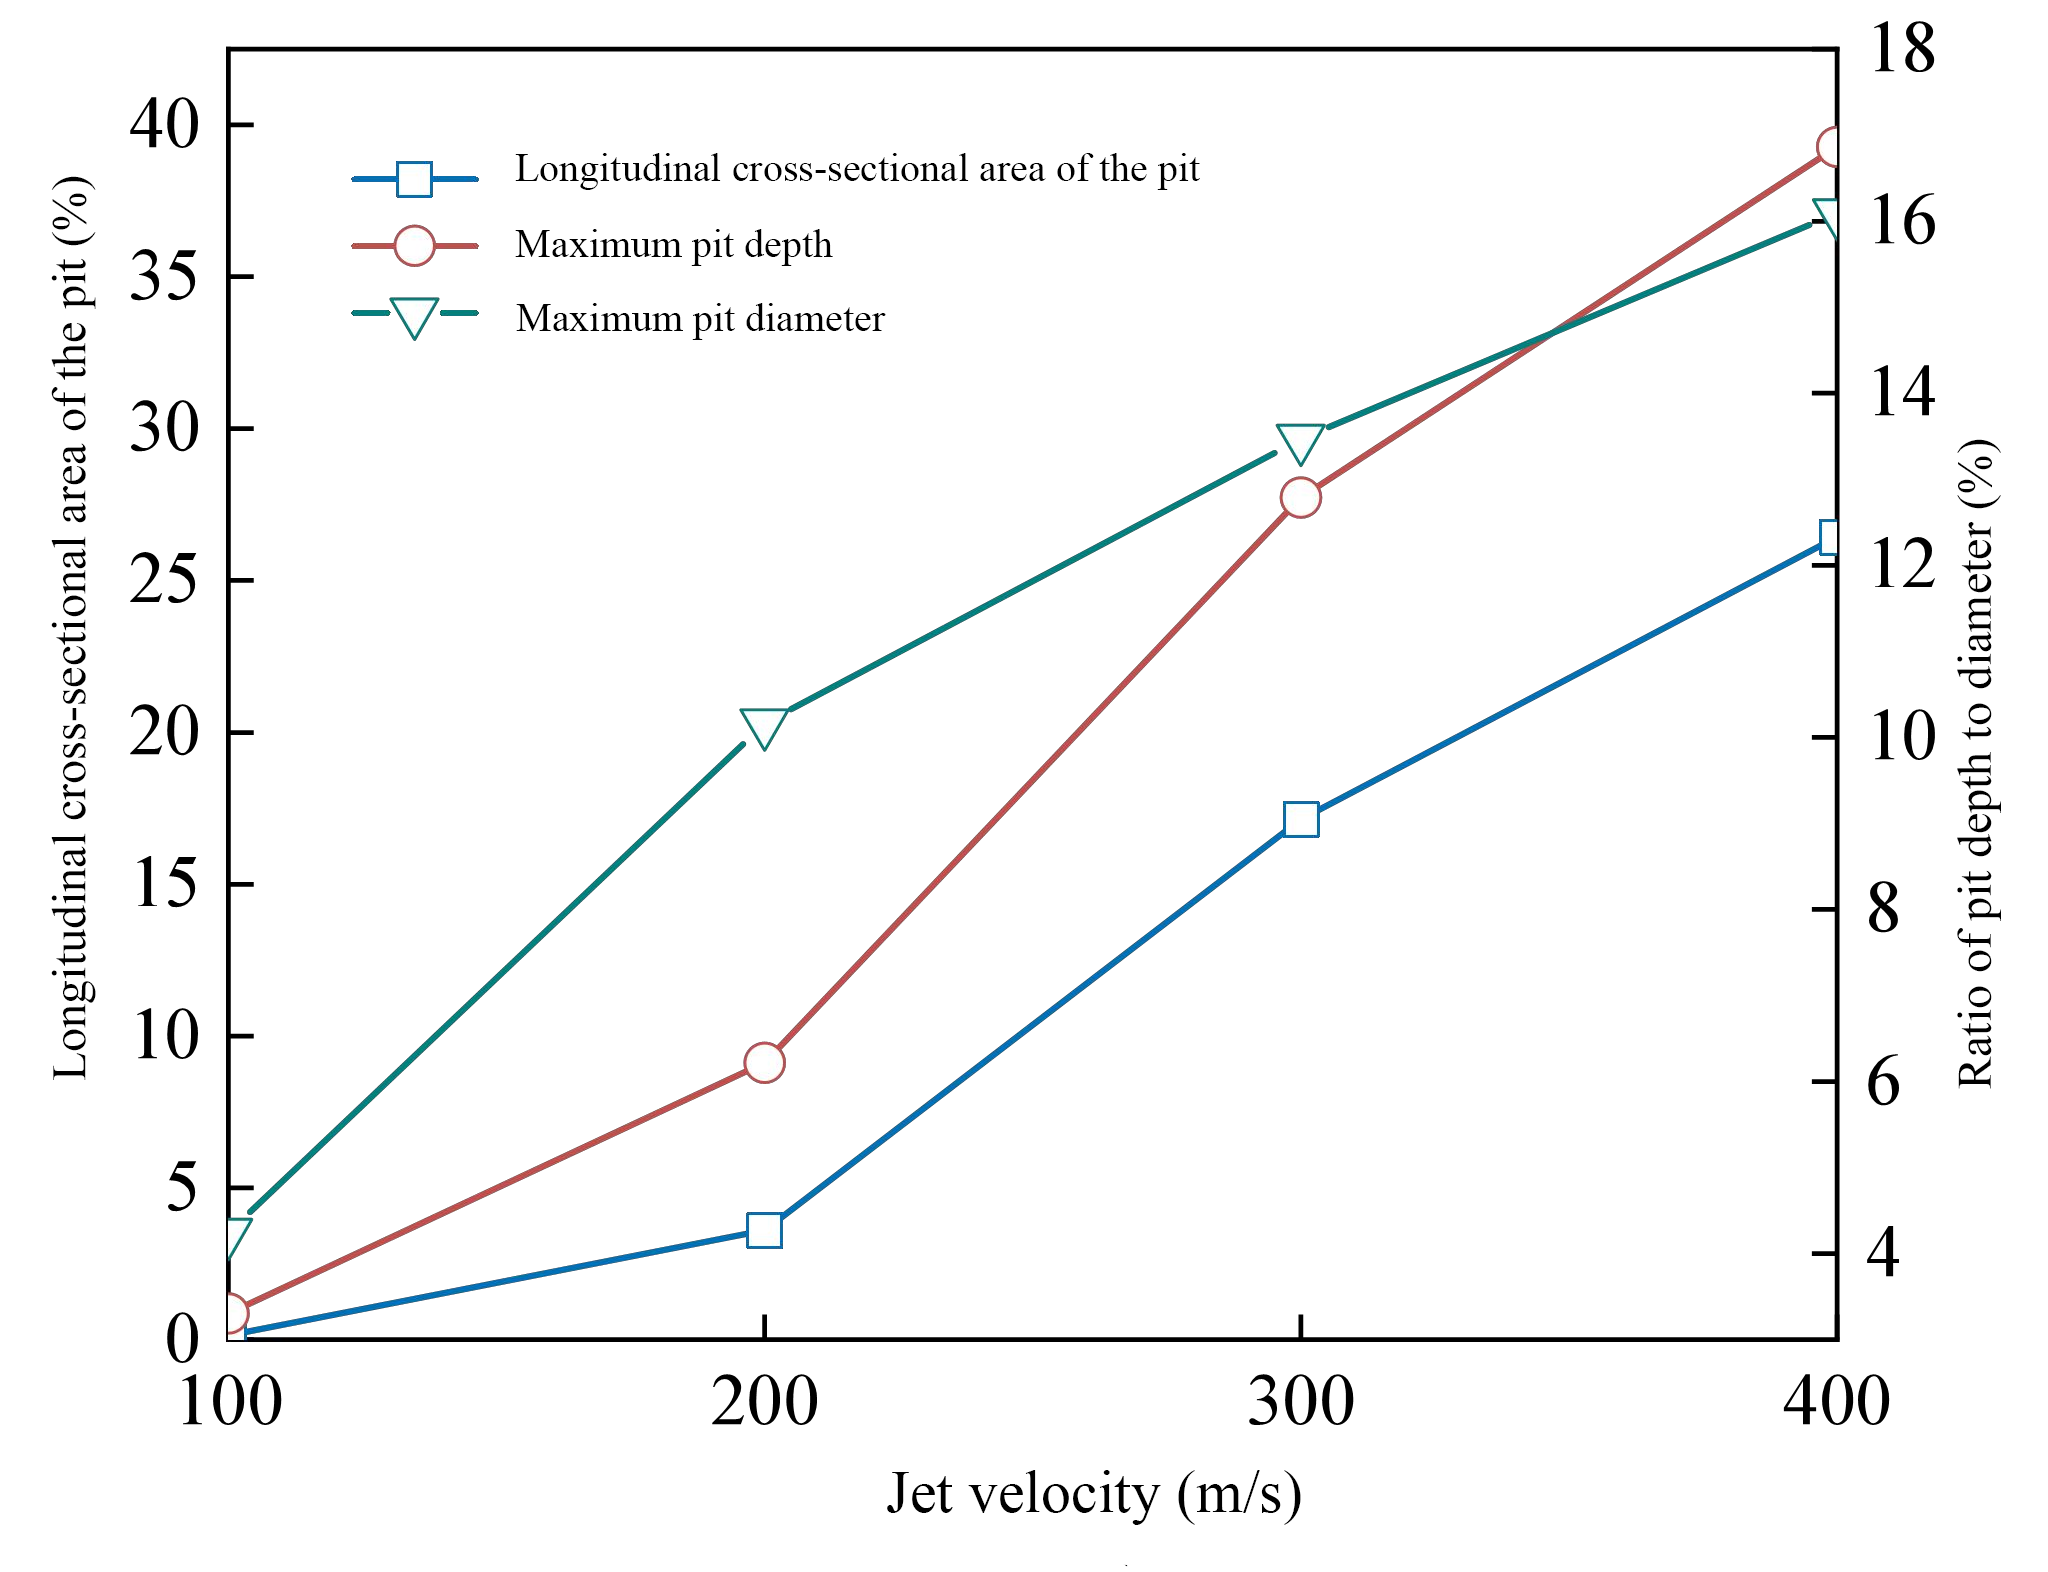
Jet velocities of 100, 200, 300, and 400 m/s were considered with other parameters unchanged. The resulting changes in coal failure indicators are shown in Figure 16.
Figure 16.
Variation in coal failure indicators with jet velocity.
As shown in Figure 16, increasing the jet velocity markedly increases the crater depth, diameter, and damaged area, although these gains diminish at higher velocities. The order of magnitude of the nozzle-exit velocity obtained by CFD was used to select 300 m/s as the baseline for the following incidence-angle analysis.
3.4.2. Effect of Incident Angle
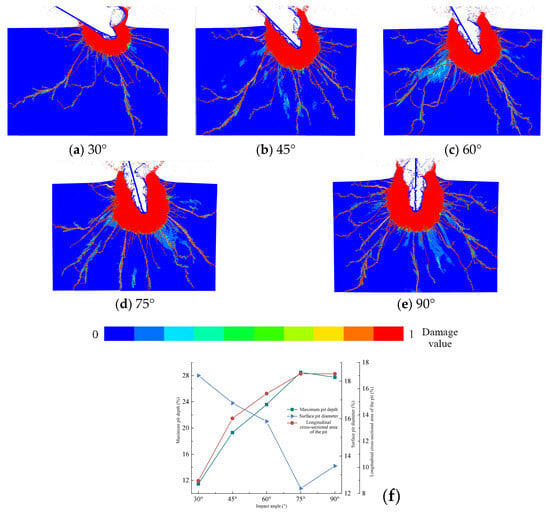
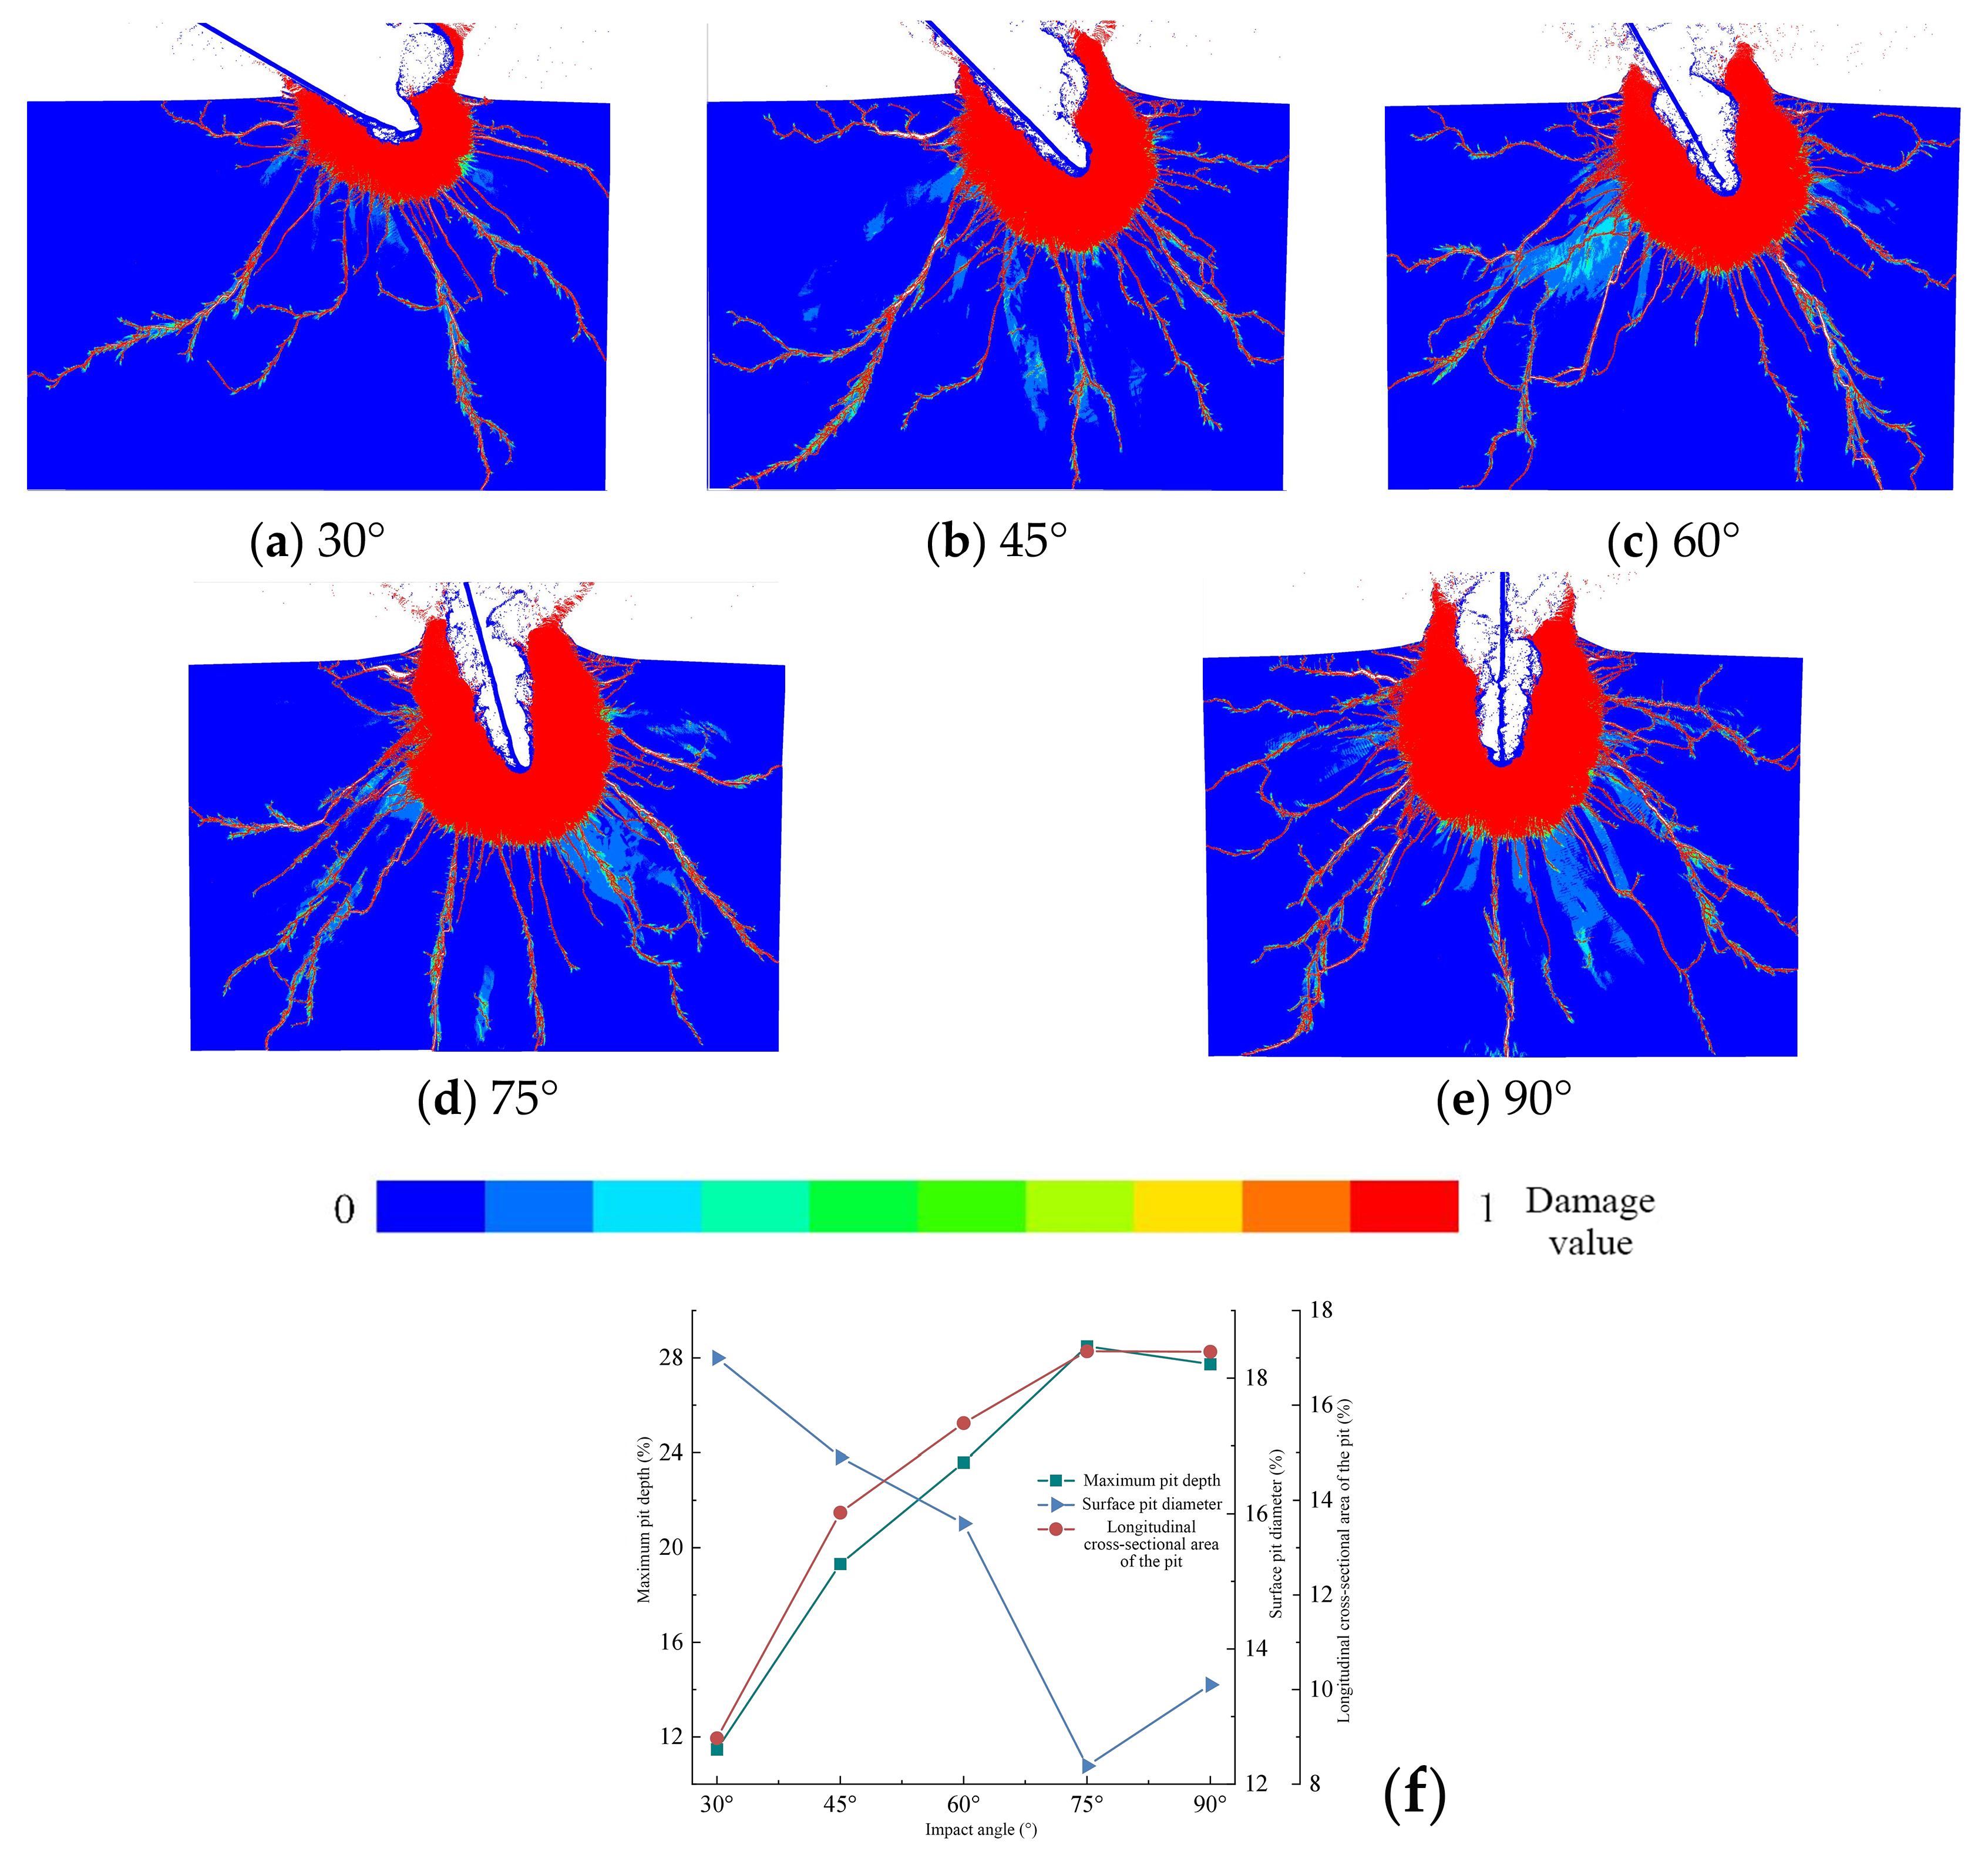
At 300 m/s, incidence angles of 30°, 45°, 60°, 75°, and 90° were examined. Corresponding coal damage fields and failure indicators are shown in Figure 17.
Figure 17.
Coal damage fields and failure indicators at different incidence angles. Coal damage fields and failure indicators at different incidence angles: (a) 30°; (b) 45°; (c) 60°; (d) 75°; (e) 90°; (f) variations in maximum pit depth, surface pit diameter, and longitudinal cross-sectional area of the pit with incidence angle. The color bar at the bottom indicates the damage value, ranging from 0 (blue) to 1 (red).
Figure 17 shows that increasing the incidence angle strengthens the normal component of jet impact. Crater depth and damage extent generally increase and tend to level off at larger angles. With the current coal RHT parameters and a 300 m/s baseline jet speed, angles of 60–90° produce relatively favorable local failure. This finding applies to the SPH model considered here and should not be presented as a universally optimal angle range for other coals or engineering conditions.
4. Engineering Validation
Field blockage-removal tests were conducted at the Panxi Coal Mine surface raw-coal bunker using mechanical drilling assisted by high-pressure water jets. The bunker is 12 m in diameter, 25 m in height, and equipped with four conical discharge outlets; it has a history of coal adhesion and blockage. The tests assessed the engineering feasibility of the combined clearing process and compared the field-detected primary arch position with the DEM prediction.
4.1. Field Test System and Blockage-Removal Procedure
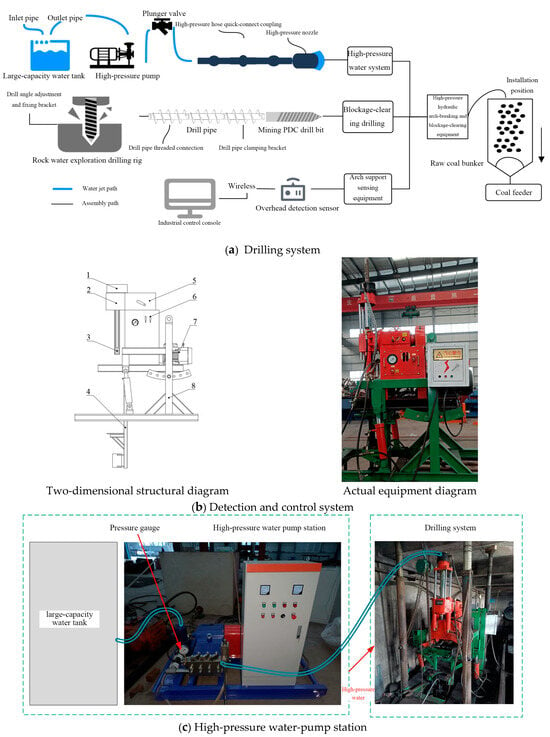
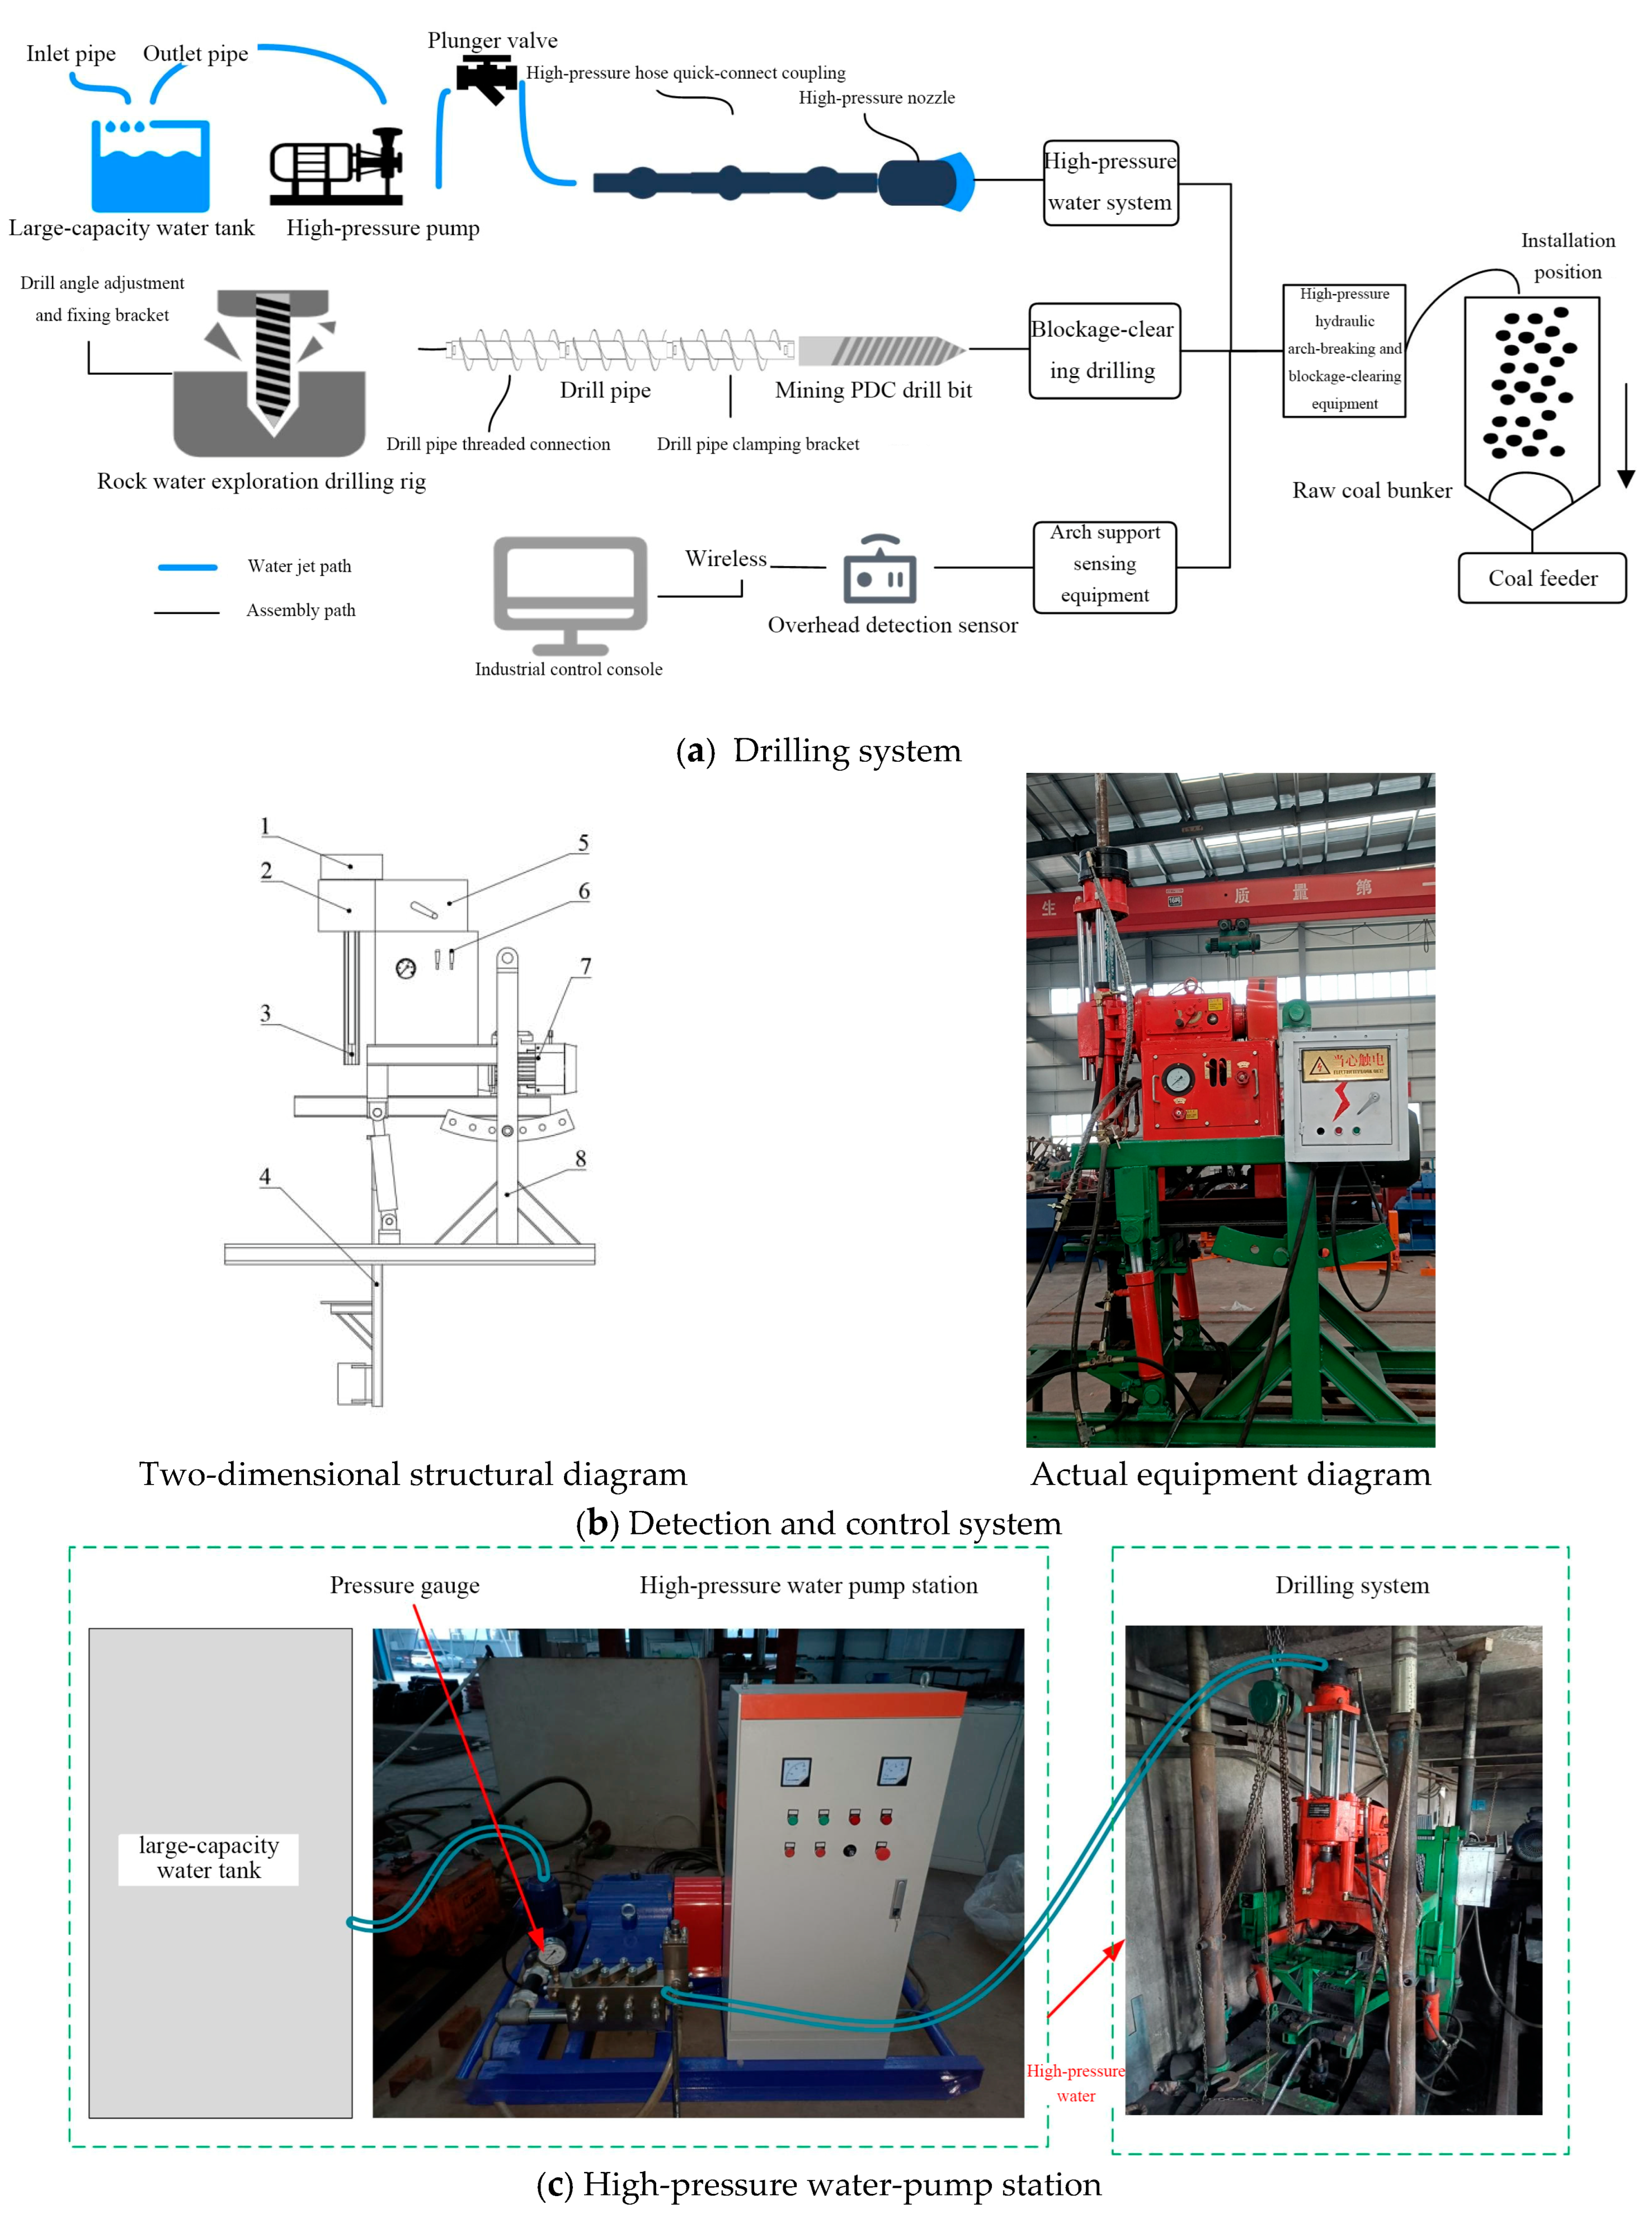
The field clearing system consists of drilling equipment, a high-pressure water-jet system, and a void-detection system. Its layout and main equipment are shown in Figure 18.
Figure 18.
Field test system for water-jet-assisted bunker blockage removal. Note: 1. Hydraulic clamping device; 2. rotating device; 3. vertical shaft; 4. machining frame; 5. transmission system; 6. control lever; 7. electric motor; 8. fixed support for drill-frame angle adjustment.
The high-pressure pump had a rated pressure of 45 MPa and an operating flow rate of 44 L/min, close to the equipment conditions selected in the CFD analysis. During operation, the drill rod established a passage to the blockage, while the detection system helped locate voids and the coal arch. After the bit penetrated the arch, high-pressure jetting was activated, and rod rotation and withdrawal changed the impact position, progressively weakening the local load-bearing structure until bunker discharge resumed.
4.2. Blockage-Removal Results and Model Validation
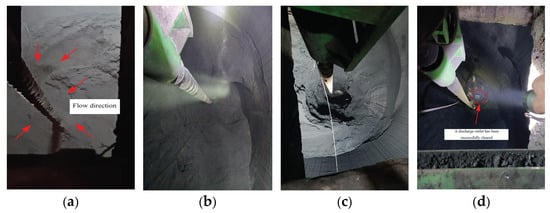
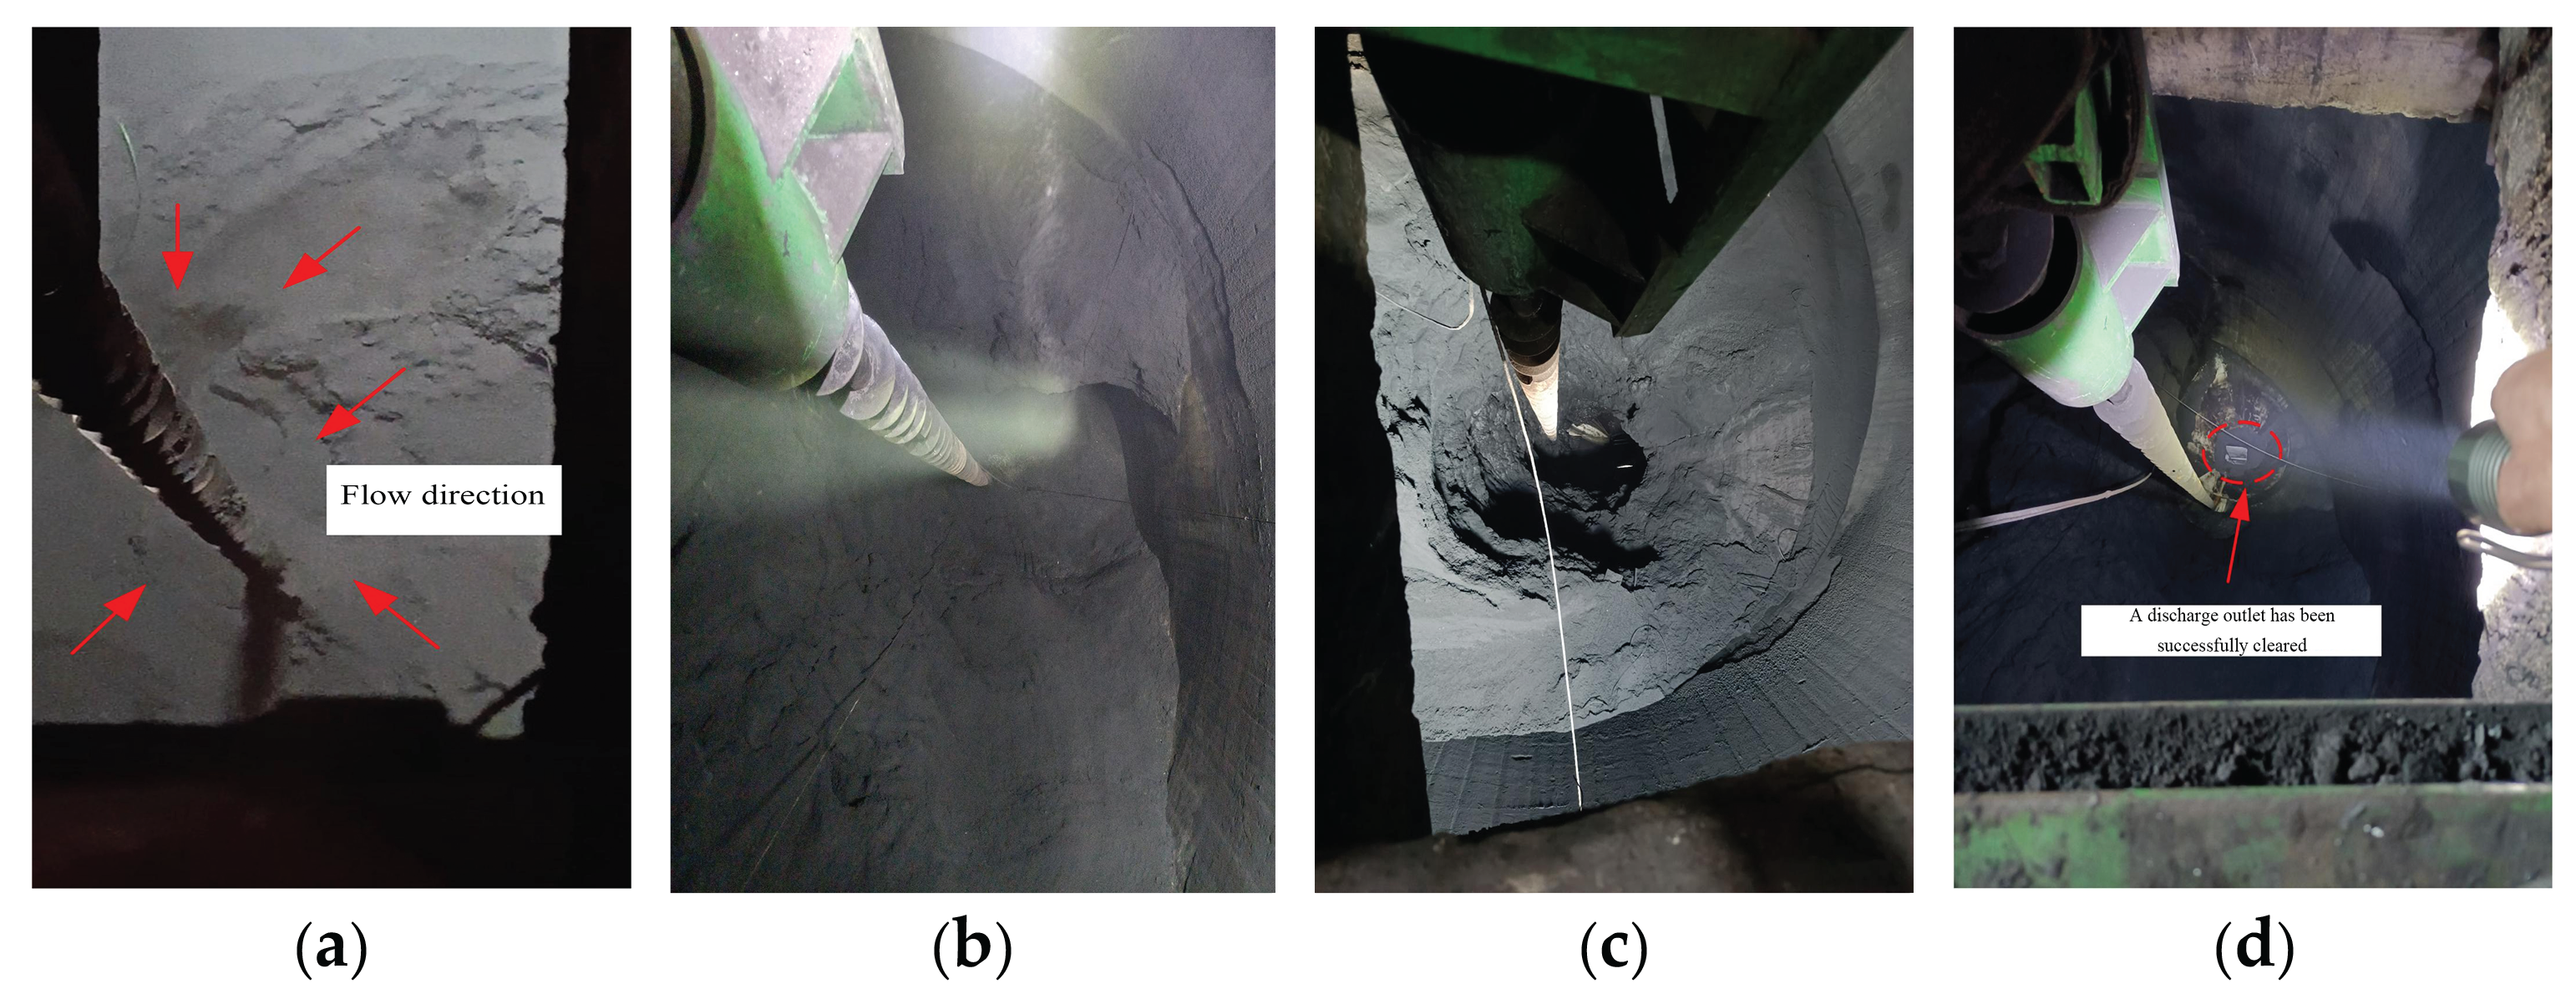
After the drill bit penetrated the stable arch, coal around the hole gradually loosened and detached. With progressive drill-rod withdrawal, a continuous discharge channel formed. Representative discharge states are shown in Figure 19.
Figure 19.
Evolution of raw-coal discharge during blockage removal. (a) Initial state; (b) after retracting one drill rod; (c) after retracting five drill rods; (d) after retracting eight drill rods.
Void detection during field operations located the main coal arch about 3.7 m above the outlet (Figure 19), within the primary arching region of 3–5 m predicted by the DEM. This supports identification of the main arch position under the present engineering conditions.
As the rods were progressively withdrawn, coal loosened and moved toward the discharge outlet, and the discharge channel expanded. Based on rod counts, detected void-zone heights, and discharged-coal records, the void-zone height increased along with cumulative coal discharge. Selected operational statistics are listed in Table 8.
Table 8.
Raw-coal bunker clearing results.
Table 8 records the clearing of the first discharge outlet. As the number of rods decreased from 20 to 12, the detected void-zone height increased from 3749.2 to 13,756.5 mm, while cumulative discharged mass increased from 0.7 to 646 t. Each row records cumulative mass at a different stage of the operation. The complete clearing operation released approximately 1841 t of raw coal.
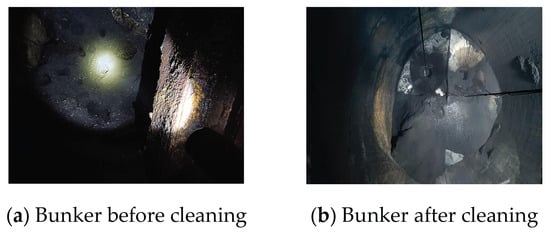
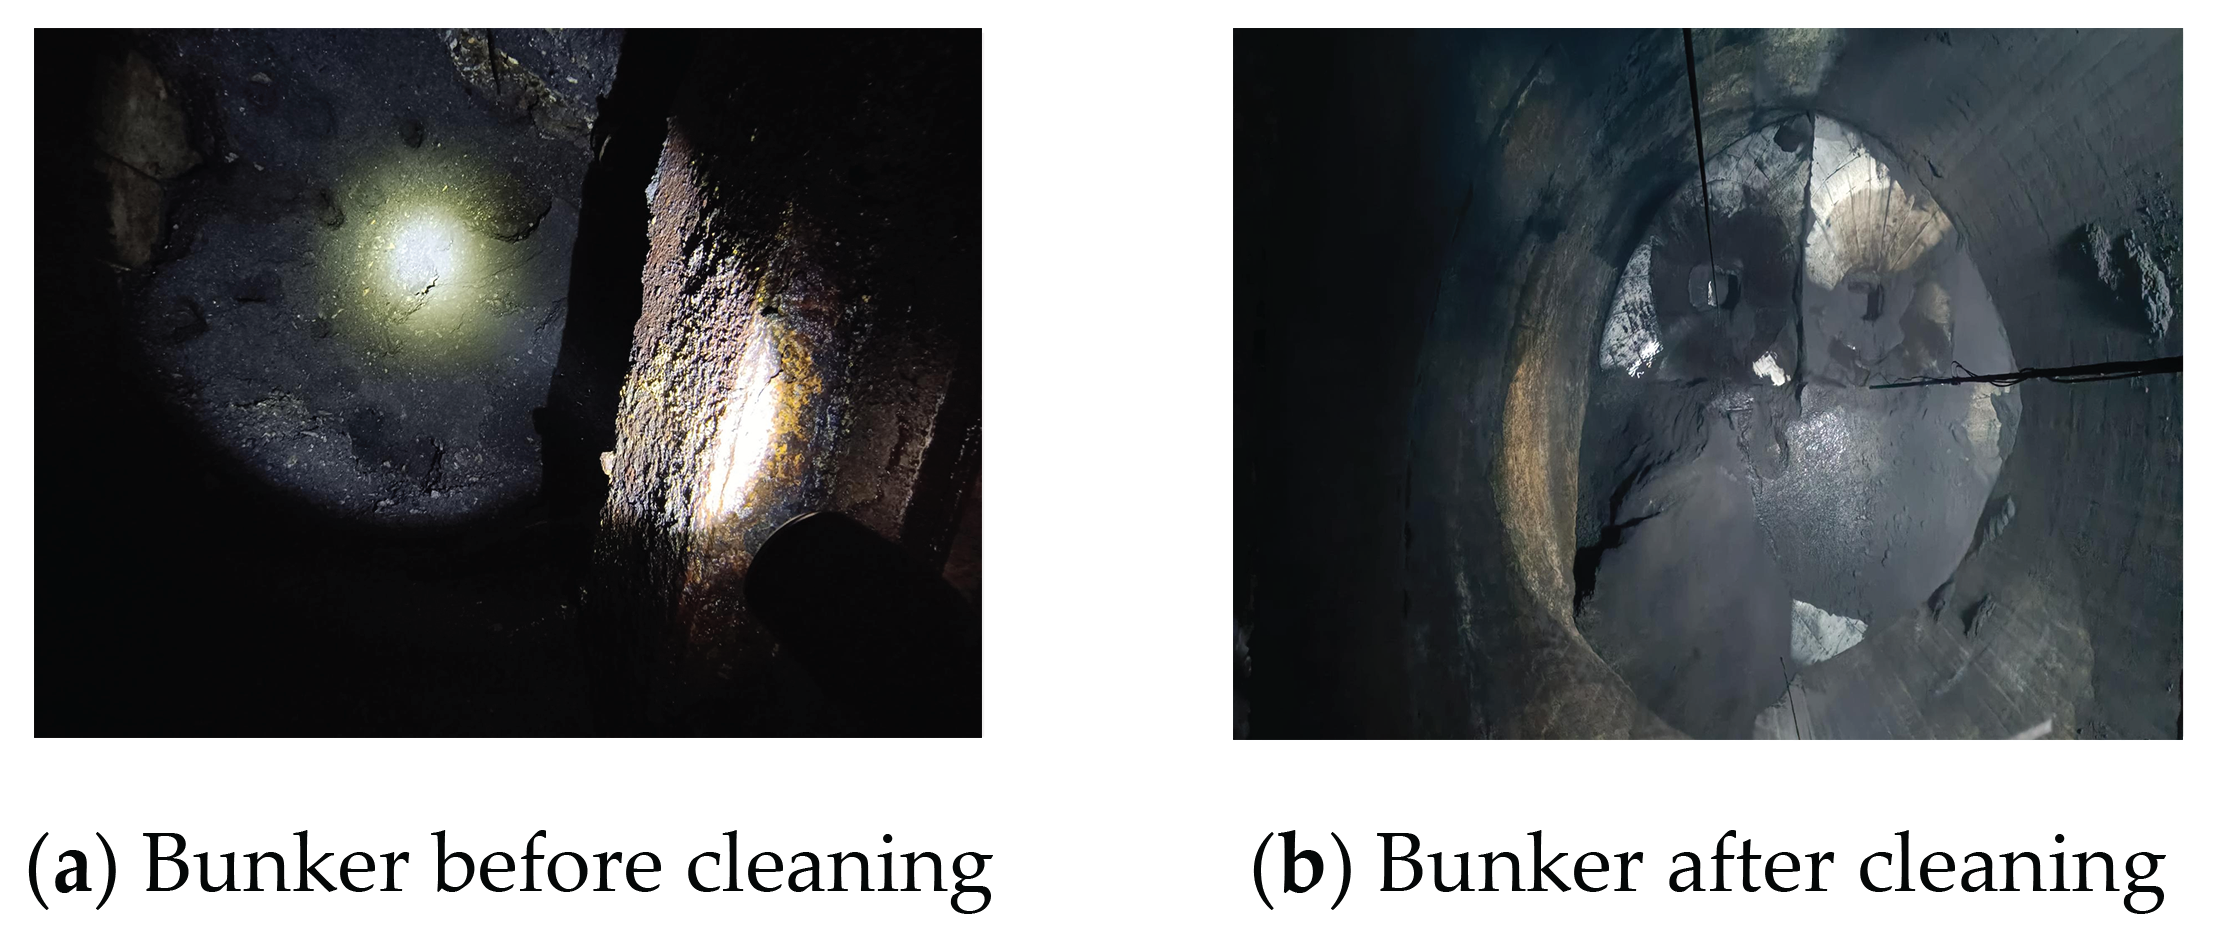
As the arch and adjacent bonded coal progressively failed, normal discharge was eventually restored. Figure 20 compares bunker conditions before and after clearing.
Figure 20.
Bunker conditions before and after clearing. (a) Bunker before cleaning (b) Bunker after cleaning.
The field tests used a 45 MPa, 44 L/min pump, with pressure and flow ratings close to the 46 MPa, 44 L/min baseline equipment condition selected in the CFD study. The main arch was found approximately 3.7 m above the outlet, broadly agreeing with the DEM-predicted 3–5 m interval and supporting the arch location assessment. However, field clearing involved mechanical drilling, drill-rod rotation and withdrawal, and high-pressure water-jet impact acting together. The 1841 t released cannot be attributed solely to the jet. Thus, the field trial primarily demonstrates the engineering feasibility of the combined drilling-assisted water-jet clearing process rather than independently and quantitatively validating the CFD or SPH predictions.
5. Conclusions
This study investigated coal-bunker arching and local failure under high-pressure water jets using theoretical analysis, DEM, CFD, and SPH simulations, and field tests. The main findings regarding arch location, local disturbance scale, jet propagation, and dynamic coal damage are as follows:
- (1)
- Load transfer in the raw-coal bunker is influenced by both wall friction and geometric contraction. The cylindrical-to-conical transition is particularly susceptible to force-chain concentration and stable arch formation. The DEM indicates that increased moisture strengthens interparticle friction and adhesion and promotes more continuous and concentrated strong force chains. Stable blockage forms at 15% moisture content, with the major arch approximately 3–5 m above the discharge outlet.
- (2)
- Under the examined bunker geometry, 15% moisture content, particle coarse-graining factor of 2.5, and component motion, substantial coal remains in the 300 and 400 mm cases. The 500 mm case produces the greatest cumulative discharge among the four cases and a clearer discharge channel, whereas the 600 mm case shows renewed particle accumulation near the channel. Thus, 500 mm is a relatively favorable nominal disturbance radius among the cases examined, not the erosion radius of the actual water jet.
- (3)
- CFD indicates that the combination of 46 MPa pressure, 44 L/min total system flow rate, and a 1.14 mm nozzle diameter has relatively favorable axial propagation among the eight combinations investigated. The nozzle-exit velocity is approximately 303.3 m/s, and centerline dynamic pressure at 500 mm is about 38 MPa; centerline velocity and dynamic pressure attenuate more rapidly beyond 600 mm. In plywood penetration tests, increasing the stand-off distance from 400 to 600 mm increases the penetration time and decreases the hole diameter, providing supplementary evidence for jet attenuation. Together, the CFD and plywood results suggest approximately 500 mm as a reference jet stand-off distance under the present pressure, nozzle geometry, and test conditions. This distance is distinct from the 500 mm DEM nominal disturbance radius and is not a universally optimal stand-off distance for other clearing conditions.
- (4)
- SPH indicates that local coal failure during the initial millisecond-scale impact follows surface impact, axial erosion, radial crack propagation, and fractured-zone enlargement, with impact energy penetrating mainly along the jet axis and then spreading radially. Increasing jet velocity intensifies coal failure, but the additional benefit diminishes at high velocities. A baseline velocity of 300 m/s was used to examine incidence angle; angles of 60–90° were relatively favorable under that speed and the current coal parameters. These values apply to the specified model and require re-evaluation for actual coals and operations. The field-observed main arch at about 3.7 m agrees broadly with the DEM-predicted 3–5 m region. A 45 MPa, 44 L/min pump used with mechanical drilling, rotation, and withdrawal restored bunker discharge and released approximately 1841 t of coal. This demonstrates the feasibility of the combined process under the field conditions but does not independently quantify the contribution of water jetting.
Author Contributions
Conceptualization, J.Z.; methodology, J.Z.; software, J.Z.; formal analysis, J.Z.; visualization, J.Z.; investigation, X.C., X.S., and C.G.; writing—original draft preparation, J.Z.; writing—review and editing, H.W. and T.Y.; supervision, H.W. and T.Y. All authors have read and agreed to the published version of the manuscript.
Funding
This research received no external funding.
Data Availability Statement
The raw data supporting the conclusions of this article will be made available by the authors on request.
Acknowledgments
During the preparation of this manuscript, the authors used ChatGPT (GPT-6, OpenAI, San Francisco, CA, USA) for English translation and language editing. The authors have reviewed and edited the output and take full responsibility for the content of this publication.
Conflicts of Interest
The authors declare no conflicts of interest.
References
- Saleh, K.; Golshan, S.; Zarghami, R. A review on gravity flow of free-flowing granular solids in silos—Basics and practical aspects. Chem. Eng. Sci. 2018, 192, 1011–1035. [Google Scholar] [CrossRef] [Scilit]
- Golshan, S.; Zarghami, R.; Saleh, K. Modeling methods for gravity flow of granular solids in silos. Rev. Chem. Eng. 2021, 37, 449–479. [Google Scholar] [CrossRef] [Scilit]
- Chen, J.F.; Rotter, J.M.; Ooi, J.Y.; Zhong, Z. Correlation between the flow pattern and wall pressures in a full scale experimental silo. Eng. Struct. 2007, 29, 2308–2320. [Google Scholar] [CrossRef] [Scilit]
- An, H.; Wang, X.; Fang, X.; Liu, Z.; Liang, C. Wall normal stress characteristics in an experimental coal silo. Powder Technol. 2021, 377, 657–665. [Google Scholar] [CrossRef] [Scilit]
- Balevičius, R.; Kačianauskas, R.; Mróz, Z.; Sielamowicz, I. Discrete-particle investigation of friction effect in filling and unsteady/steady discharge in three-dimensional wedge-shaped hopper. Powder Technol. 2008, 187, 159–174. [Google Scholar] [CrossRef] [Scilit]
- Zhu, D.; Ji, X.; Huo, Y.; Wang, Z.; Yu, B.; Wang, D. Numerical investigation of particles flow pattern and pressure distribution of coal bunker. J. Geophys. Eng. 2023, 20, 841–853. [Google Scholar] [CrossRef] [Scilit]
- Morrissey, J.P.; Ooi, J.Y.; Chen, J.F.; Tano, K.; Horrigmoe, G. A DEM study of silo discharge of a cohesive solid. In Proceedings of the 3rd International Conference on Particle-Based Methods—Fundamentals and Applications (PARTICLES 2013), Stuttgart, Germany, 18–20 September 2013; International Center for Numerical Methods in Engineering: Barcelona, Spain, 2013; pp. 298–309. [Google Scholar]
- Dai, L.; Yuan, Z.; Fan, F.; Gu, C. Experimental investigation on the gravity driven discharge of cohesive particles from a silo with two outlets. Particuology 2024, 89, 11–21. [Google Scholar] [CrossRef] [Scilit]
- Coetzee, C.J. Review: Calibration of the discrete element method. Powder Technol. 2017, 310, 104–142. [Google Scholar] [CrossRef] [Scilit]
- Beakawi Al-Hashemi, H.M.; Baghabra Al-Amoudi, O.S. A review on the angle of repose of granular materials. Powder Technol. 2018, 330, 397–417. [Google Scholar] [CrossRef] [Scilit]
- Coetzee, C.J. Particle upscaling: Calibration and validation of the discrete element method. Powder Technol. 2019, 344, 487–503. [Google Scholar] [CrossRef] [Scilit]
- Wang, Y.; Lin, G.; Liu, X.; Zhao, L.; Jia, B.; Wang, Y.; He, J. Research on coal rock parameter calibration based on discrete element method. Sci. Rep. 2024, 14, 26507. [Google Scholar] [CrossRef] [Scilit] [PubMed]
- Hood, M.; Nordlund, R.; Thimons, E.D. A study of rock erosion using high-pressure water jets. Int. J. Rock Mech. Min. Sci. Geomech. Abstr. 1990, 27, 77–86. [Google Scholar] [CrossRef] [Scilit]
- Guha, A.; Barron, R.M.; Balachandar, R. An experimental and numerical study of water jet cleaning process. J. Mater. Process. Technol. 2011, 211, 610–618. [Google Scholar] [CrossRef] [Scilit]
- Fuchs, E.; Kricke, S.; Schöhl, E.; Majschak, J.P. Effect of industrial scale stand-off distance on water jet break-up, cleaning and forces imposed on soil layers. Food Bioprod. Process 2019, 113, 129–141. [Google Scholar] [CrossRef] [Scilit]
- Xiao, S.; Ren, Q.; Cheng, Y.; Wang, H.; Zhang, L.; Liao, Y.; Chen, B.; Jin, H.; Meng, X.; Qin, H. Research and application of high-pressure water jets drilling and repairing failure drainage borehole for enhancing coalbed methane recovery in underground coal mines. Geomech. Geophys. Geo-Energy Geo-Resour. 2022, 8, 191. [Google Scholar] [CrossRef] [Scilit]
- Xue, Y.; Si, H.; Xu, D.; Yang, Z. Experiments on the microscopic damage of coal induced by pure water jets and abrasive water jets. Powder Technol. 2018, 332, 139–149. [Google Scholar] [CrossRef] [Scilit]
- Xue, Y.; Si, H.; Yang, Z.; Xu, D. Microscopic damage field in coal induced by water jets. J. Loss Prev. Process Ind. 2018, 56, 300–315. [Google Scholar] [CrossRef] [Scilit]
- Xue, Y.; Si, H.; Chen, G. The fragmentation mechanism of coal impacted by water jets and abrasive jets. Powder Technol. 2020, 361, 849–859. [Google Scholar] [CrossRef] [Scilit]
- Huang, F.; Mi, J.; Li, D.; Wang, R.; Zhao, Z. Comparative investigation of the damage of coal subjected to pure water jets, ice abrasive water jets and conventional abrasive water jets. Powder Technol. 2021, 394, 909–925. [Google Scholar] [CrossRef] [Scilit]
- Xiao, S.Q.; Ren, Q.; Guan, R.; Liu, J.; Wang, H.; Cheng, Y.; Xie, W. Theoretical and experimental investigation on fracture response of coal impacted by high-velocity water jet. Energy Rep. 2021, 7, 3210–3224. [Google Scholar] [CrossRef] [Scilit]
- Ge, Z.; Zhang, D.; Lu, Y.; Liu, W.; Xiao, S.; Cao, S. Propagation of stress wave and fragmentation characteristics of gangue-containing coal subjected to water jets. J. Nat. Gas Sci. Eng. 2021, 95, 104137. [Google Scholar] [CrossRef] [Scilit]
- Ge, Z.; Cao, S.; Lu, Y.; Gao, F. Fracture mechanism and damage characteristics of coal subjected to a water jet under different triaxial stress conditions. J. Pet. Sci. Eng. 2022, 208, 109157. [Google Scholar] [CrossRef] [Scilit]
- Liu, F.; Wang, Y.; Song, G. Damage evolution law and failure mechanism of rock impacted by high-pressure water jet under in-situ stress condition. Sci. Prog. 2023, 106, 00368504231188618. [Google Scholar] [CrossRef] [Scilit] [PubMed]
- Ma, H.; Wan, W.; Xu, D.; Zhao, P.; Wu, J.; Chen, Y.; Wang, Y. Damage evolution and fracture characteristics of coal rock impacted by self-excited pulse water jet under different stress loading conditions. Energy Sci. Eng. 2024, 12, 3743–3763. [Google Scholar] [CrossRef] [Scilit]
- Feng, X.; Cao, S.; Shen, Z.; Hu, H. Study on the dynamic and static fracture characteristics of coal subject to water jets under high temperature and high geo-stress conditions. ACS Omega 2025, 10, 10340–10351. [Google Scholar] [CrossRef] [Scilit] [PubMed]
- Fu, J. Research and Application of High-Pressure Hydraulic Arch Breakage and Blockage Clearance Methods for Ground Raw Coal Silos. Doctoral Dissertation, Shandong University of Science and Technology, Qingdao, China, 2023. [Google Scholar] [CrossRef]
- Lommen, S.; Mohajeri, J.; Lodewijks, G.; Schott, D. DEM particle upscaling for large-scale bulk handling equipment and material interaction. Powder Technol. 2019, 352, 273–282. [Google Scholar] [CrossRef] [Scilit]
- Johnson, K.L.; Kendall, K.; Roberts, A.D. Surface energy and the contact of elastic solids. Proc. R. Soc. Lond. A 1971, 324, 301–313. [Google Scholar] [CrossRef] [Scilit]
- Jiang, C.; Wang, L.; Pan, Z.; Guo, J.; Wang, S. Study on the Adhesion Properties of Raw Coal and Adhesive Clogging Characteristics of Underground Coal Bunkers. Appl. Sci. 2025, 15, 684. [Google Scholar] [CrossRef] [Scilit]
- Li, T.; Wang, X.; Li, B.; Li, J.; Yang, Z. Optimization method for coal particle model parameters based on discrete element method. China Powder Sci. Technol. 2018, 24, 6–12. [Google Scholar] [CrossRef]
- Hirt, C.W.; Nichols, B.D. Volume of fluid (VOF) method for the dynamics of free boundaries. J. Comput. Phys. 1981, 39, 201–225. [Google Scholar] [CrossRef] [Scilit]
- Zhang, R.Q.; Ding, Y.Q.; Tang, W.H.; Ran, X.W. Failure-strength parameters of HJC and RHT constitutive models for concrete. Chin. J. High Press. Phys. 2011, 25, 15–22. (In Chinese) [Google Scholar] [CrossRef]
- Zhou, K.; Dou, L.; Song, S.; Ma, X.; Chen, B. Experimental Study on the Mechanical Behavior of Coal Samples during Water Saturation. ACS Omega 2021, 6, 33822–33836. [Google Scholar] [CrossRef] [Scilit] [PubMed]



Disclaimer/Publisher’s Note: The statements, opinions and data contained in all publications are solely those of the individual author(s) and contributor(s) and not of MDPI and/or the editor(s). MDPI and/or the editor(s) disclaim responsibility for any injury to people or property resulting from any ideas, methods, instructions or products referred to in the content. |
© 2026 by the authors. Licensee MDPI, Basel, Switzerland. This article is an open access article distributed under the terms and conditions of the Creative Commons Attribution (CC BY) license.