


Abstract
During CO2 geological storage in deep saline aquifers, pore pressure fluctuations induced by supercritical CO2 (SCCO2) injection alter the local stress state of the reservoir, thereby affecting the seepage and deformation behavior of the surrounding rock. To investigate the mechanisms by which different deviatoric stress paths govern SCCO2 seepage characteristics in sandstone, this study focused on sandstone from the Liujiagou Formation in the Ordos Basin. Using a self-developed multi-field coupled experimental system, SCCO2 seepage–deformation experiments were conducted under two axial-to-confining pressure ratios (η = σ_axial/σ_confining, where η = 1.1 represents a compressive stress path with the axial stress as the maximum principal stress, and η = 0.9 represents a low-deviatoric-stress path with the axial stress as the minimum principal stress) and three injection pressures (10, 12, and 14 MPa). COMSOL Multiphysics 4.1 numerical simulations were further performed to analyze the dynamic responses of effective stress, porosity, and permeability under different stress states. The results indicate that (1) permeability exhibits a three-stage evolution pattern with increasing confining pressure, characterized by rapid decline, gradual decline, and residual stabilization, and follows a negative exponential relationship with effective stress. Under the stress paths investigated, permeability at η = 0.9 consistently exceeds that at η = 1.1 under the same confining pressure. (2) During loading, the specimens generally undergo volumetric compression, with radial compression typically exceeding axial compression. The axial compression rate is relatively lower along the η = 0.9 stress path, indicating that the low-deviatoric-stress path suppresses axial compaction. (3) An empirical exponential relationship between effective stress and permeability was established based on the experimental data, reproducing the main trends of the measured permeability and volumetric strain within the investigated experimental conditions. The model-predicted strain agrees well with the experimental results. These findings demonstrate that the stress state and injection pressure jointly control the SCCO2 seepage–deformation behavior of sandstone. Within the investigated stress-path range, permeability under the low-deviatoric-stress path, where the axial stress is the minimum principal stress, consistently remains higher than that under the compressive stress path, where the axial stress is the maximum principal stress.
1. Introduction
Carbon dioxide capture and storage (CCS) is one of the key technologies for achieving China’s dual-carbon goals [1]. Deep saline aquifers are regarded as one of the most promising geological storage formations due to their widespread distribution and enormous storage potential [2,3,4,5,6,7,8,9]. Taking the Ordos Basin as an example, its estimated CO2 storage capacity in deep saline aquifers reaches 33.56 billion tons [5,7,8], making it one of the strategically important regions for future CCS projects at the scale of hundreds of millions of tons. In practical geological storage projects, large-scale and long-term high-pressure injection of supercritical CO2 (SCCO2) inevitably disturbs the original mechanical equilibrium of the reservoir, leading to substantial increases in pore pressure and redistribution of the in-situ stress field [10,11,12,13,14,15]. These changes directly affect CO2 injectivity and migration extent and may further induce deformation of the reservoir rock skeleton, fault reactivation, and even CO2 leakage through connected microfractures [16,17,18,19,20,21,22,23,24,25]. Therefore, understanding the seepage and deformation characteristics of deep reservoir rocks under complex stress conditions is essential for ensuring the safety of CO2 geological storage projects.
The seepage–deformation response of reservoirs induced by SCCO2 injection has long been a research focus at the intersection of rock mechanics and geosciences. Extensive studies have investigated the interactions among pore pressure fluctuations, effective stress evolution, and rock deformation [14,15,16,20,23,26]. Previous findings have demonstrated that the intrinsic permeability of rocks is highly sensitive to changes in effective stress [26,27,28,29,30] and generally decreases exponentially with increasing effective stress [30]. An increase in effective stress also enhances rock deformation [28,29], while injection pressure affects permeability, typically resulting in a nonlinear increase in permeability with increasing injection pressure [29,30,31,32]. However, existing studies have primarily focused on seepage–deformation behavior under constant stress conditions or a single loading path. Systematic experimental investigations and mechanistic understanding of the effects of injection-induced changes in stress state, particularly different deviatoric stress conditions, on the coupled seepage–deformation behavior of SCCO2 remain limited. During CO2 injection, stress paths may differ significantly across different regions of the reservoir. Near the injection well, increasing pore pressure may cause the horizontal principal stresses to increase more rapidly than the vertical principal stress, potentially transforming the local stress state from an initially compressive regime into an extensional or shear-dominated regime. Such stress-state transitions directly affect the opening and closure of microfractures and the connectivity of seepage pathways, thereby controlling CO2 migration directions and storage efficiency [10,32]. Considerable research has examined the effects of deviatoric stress and stress paths on rock permeability [32,33,34,35,36,37]. Early studies were mainly conducted under hydrostatic pressure or conventional triaxial compression (η > 1), generally reporting an exponential decrease in permeability with increasing effective stress [32,35,36]. More recent true triaxial experiments have further demonstrated that the magnitude of deviatoric stress and the orientation of the intermediate principal stress significantly influence fracture opening and closure as well as permeability anisotropy [33,34,37]. In abnormally pressured reservoirs, increased pore pressure reduces effective stress and is often accompanied by a nonlinear recovery in permeability [36,37]. Nevertheless, most existing experimental data have been obtained under compressive stress paths with η ≥ 1. Systematic experimental observations of coupled SCCO2 seepage–deformation behavior under stress paths with η < 1, where the axial stress becomes the minimum principal stress due to injection-induced pore pressure increases and horizontal stresses exceeding vertical stress near the injection well, remain scarce [37].
To address this research gap, the axial-to-confining pressure ratio (η) is introduced to quantitatively characterize different stress states. When η > 1, the specimen is subjected to a compressive stress state in which the axial stress is the maximum principal stress. When η < 1, the specimen is subjected to a deviatoric stress state in which the axial stress is the minimum principal stress. By simultaneously increasing the axial stress and confining pressure while maintaining a constant axial-to-confining pressure ratio, the seepage–deformation responses of rocks under different deviatoric stress conditions can be systematically compared. In this study, coarse-grained sandstone from the deep Liujiagou Formation in the Ordos Basin was selected as the experimental material. Using a self-developed multi-field coupled experimental system, SCCO2 injection experiments and coupled numerical simulations were conducted under two axial-to-confining pressure ratios (0.9 and 1.1) and three injection pressures (10, 12, and 14 MPa). The objectives are to reveal the permeability evolution and deformation response characteristics of sandstone under different deviatoric stress paths and to elucidate the joint control mechanisms of injection pressure and stress state.
2. Experimental Samples, Apparatus, and Methods
2.1. Pore Size Distribution and Mineral Composition of the Samples
The specimens were obtained from coarse-grained sandstone of the Liujiagou Formation in a deep borehole located in Otog Banner, Ordos Basin, at depths ranging from 3202.25 to 3209.75 m. The rock cores were prepared into standard cylindrical specimens with a diameter of 50 mm and a height of 100 mm. The P-wave velocities of the specimens were measured using an ultrasonic testing instrument (MC-6310 Type, Nanjing Mingchuang Measurement and Control Technology Co., Ltd., Nanjing City, China), and cores exhibiting visible differences or P-wave velocity variations exceeding 5% were excluded. The basic physical properties of the specimens are presented in Table 1.
Table 1.
Basic physical properties of the sandstone specimens.
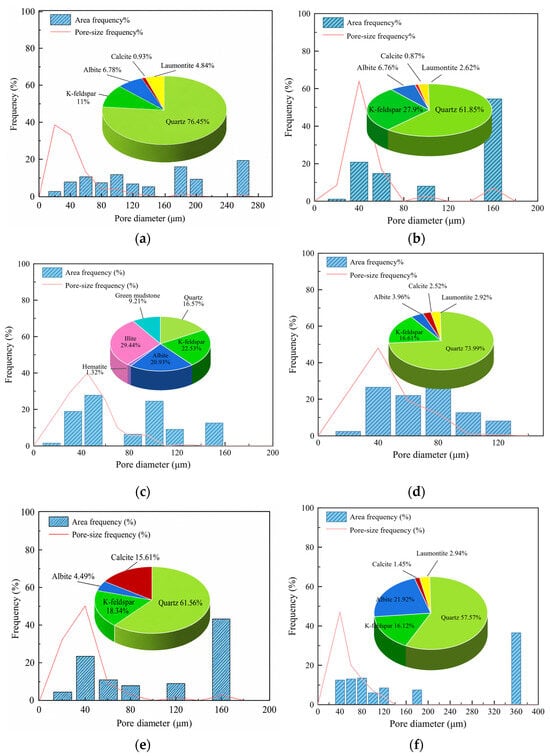
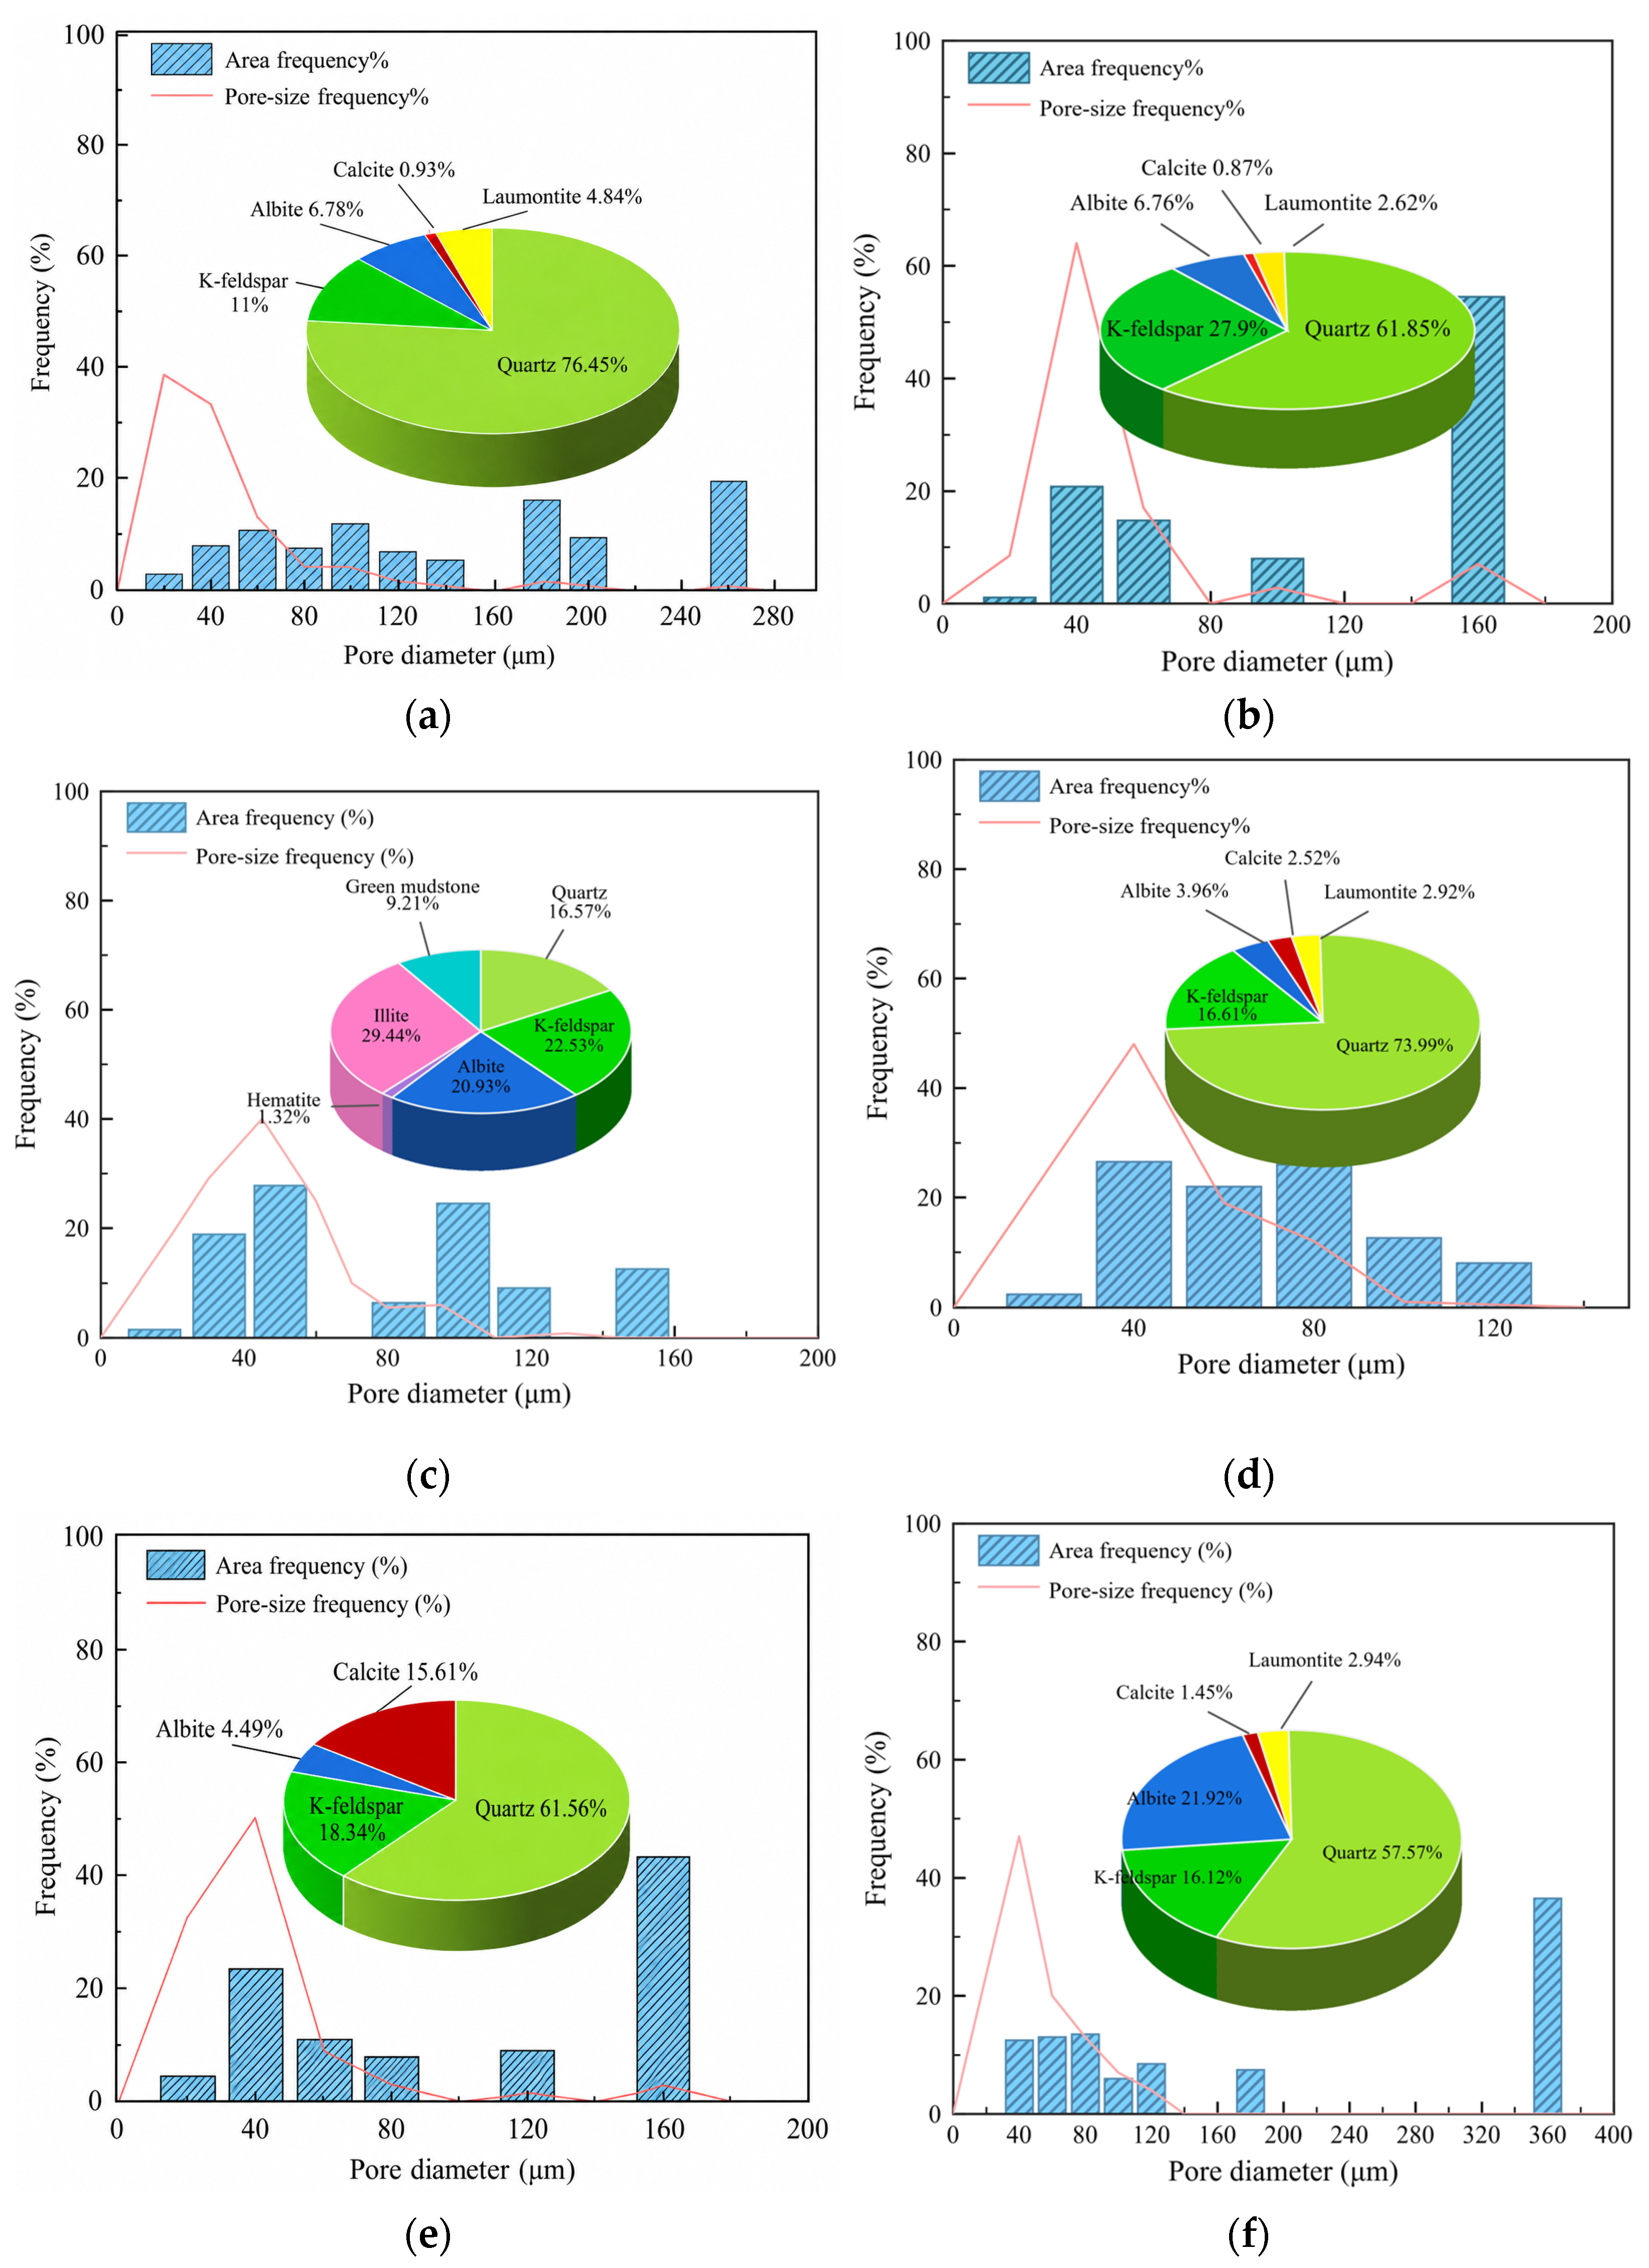
The mineral composition of the sandstone specimens was determined by X-ray diffraction (XRD, DX-27mini Type, Dandong Haoyuan Instrument Co., Ltd., Dandong City, China), while their pore size distribution was analyzed using the cast thin-section method. The results are presented in Figure 1. The coarse-grained sandstone specimens, except for SY3, are mainly composed of quartz, feldspar, calcite, and laumontite, whereas SY3 consists primarily of feldspar, quartz, clay minerals, and a small amount of hematite. Overall, the pore diameters range from 1 to 360 μm, the pore throat diameters range from 1.33 to 99.44 μm, and the areal porosity ranges from 0.63% to 2.57%.
Figure 1.
Pore size distribution and mineral composition of specimens: (a) SY1; (b) SY2; (c) SY3; (d) SY4; (e) SY5; (f) SY6.
2.2. Experimental Methods
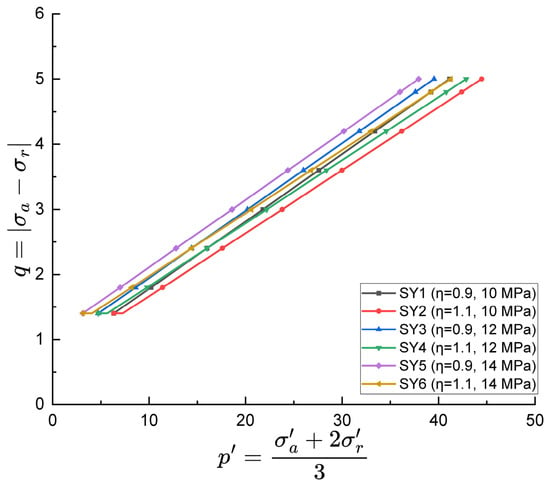
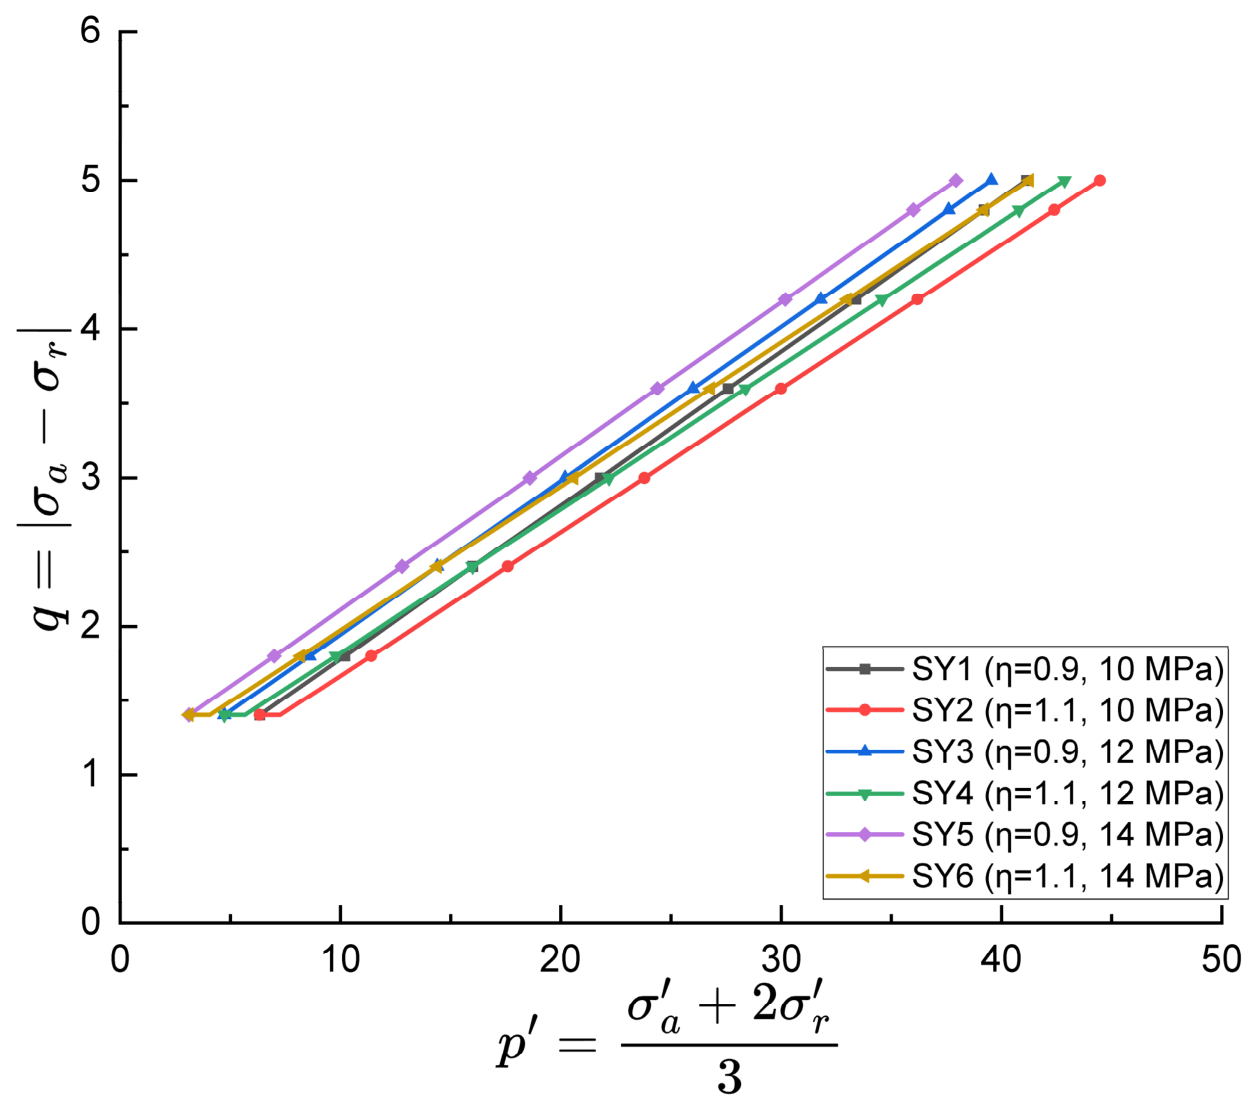
The experiments were conducted at a temperature of 40 °C and a pressure above 8 MPa to ensure that CO2 remained in a supercritical state and to eliminate the influence of temperature gradients on the seepage–deformation response. The experiments involved single-phase SCCO2 seepage through dry sandstone specimens. Prior to testing, the specimens were oven-dried at 105 °C to constant mass, evacuated, and then placed in the pressure chamber. Axial stress and confining pressure were first applied simultaneously at a loading rate of 0.5 MPa/min until a stable hydrostatic stress state of 12.6 MPa was reached. SCCO2 was subsequently injected until the specimens were fully saturated. The experiments were then conducted according to the stress loading schemes and paths presented in Table 2, with the corresponding stress paths illustrated in Figure 2.
Table 2.
Experimental conditions for specimen permeability testing.
Figure 2.
Stress paths of the loading schemes.
It should be noted that, according to the measured in situ stress gradients in the deep Ordos Basin [38,39], the in situ vertical stress is approximately 73–83 MPa (stress gradient of approximately 0.023–0.026 MPa/m), while the horizontal principal stresses are approximately 54–67 MPa (stress gradient of approximately 0.017–0.021 MPa/m). The confining pressures of 14–50 MPa adopted in this study represent the local effective stress unloading stage following injection-induced pore pressure increases, approximately simulating the elevated pore pressure conditions near the injection well.
Permeability was measured using the steady-state method. Loading to the next stress level was initiated only after the outlet flow-rate fluctuation remained below 2% and the upstream and downstream pressures became stable. Assuming steady-state and isothermal fluid flow through the specimen, the permeability was calculated according to the law of mass conservation using the volumetric flow rate measured at the outlet, as follows:
where K is the SCCO2 permeability of the specimen (10−3 μm2); P0 and P1 are the outlet and inlet pressures (MPa), respectively; q0 is the volumetric flow rate measured at the outlet by the flowmeter (cm3/s); A is the cross-sectional area of the specimen (cm2); L is the specimen length (cm); and μ is the dynamic viscosity of SCCO2 at the experimental temperature and corresponding pressure (MPa·s). The viscosity was obtained from NIST REFPROP 9.1 at 40 °C and the mean of the inlet and outlet pressures. Given that the pressure difference across the specimen was only 2 MPa, variations in fluid properties along the flow path were considered small, making the mean-pressure approximation acceptable. The measurement accuracies of the pressure sensor, outlet flowmeter, and extensometer were ±0.05 MPa, ±0.1 mL/min, and ±1 × 10⁻⁶, respectively. Based on error propagation analysis, the combined relative uncertainty in permeability was estimated to be approximately ±6–9%.
The volumetric expansion or contraction of the specimen is determined by strains in different directions. Based on the radial and axial strains measured after permeability equilibrium was reached under each stress condition, the volumetric strain, εV, was calculated as follows:
where εV is the volumetric strain, εₐ is the axial strain and εᵣ is the radial strain.
εV = εa + 2εr
2.3. Experimental Apparatus
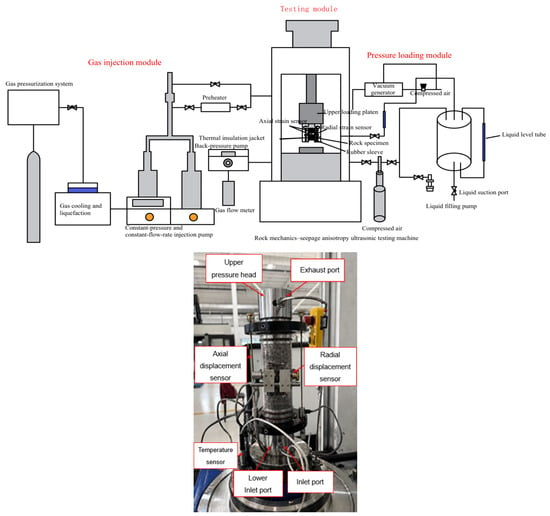
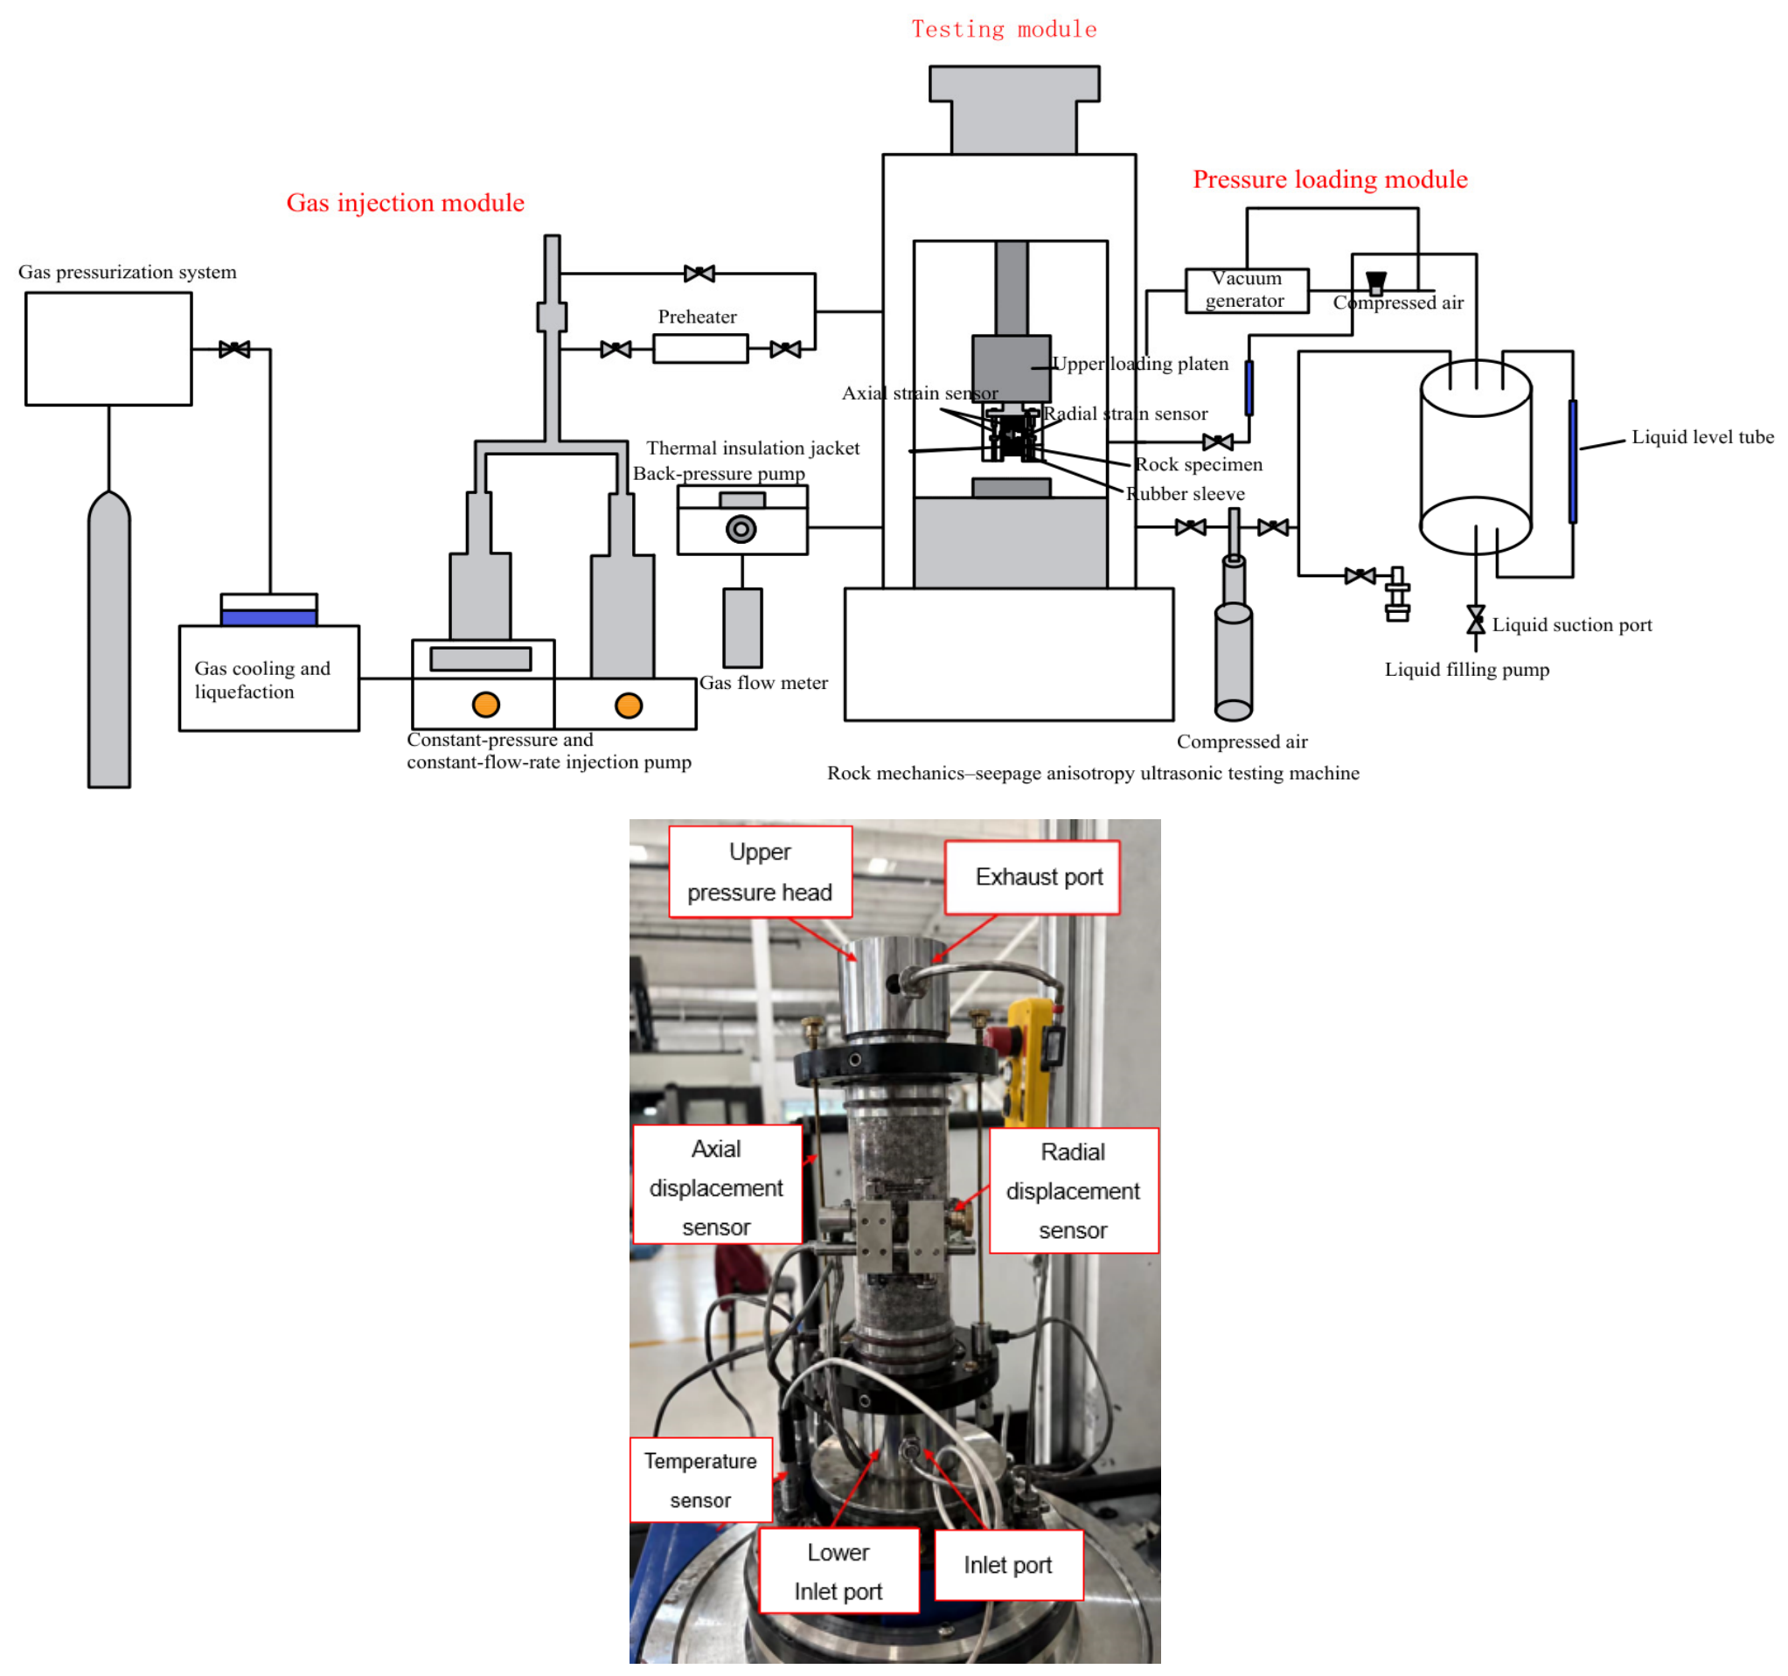
The experiments were conducted using a self-developed rock mechanics–seepage–temperature multiphysics coupling experimental system (Figure 3). The system enables measurements of specimen permeability and stress–strain characteristics under various pressure and temperature conditions and different injection-fluid pressures, thereby providing a realistic simulation of the in-situ conditions of rocks in deep geological formations.
Figure 3.
Schematic diagram of the permeation test apparatus.
3. Experimental Results and Discussion
3.1. Effects of Axial-to-Confining Pressure Ratio and Injection Pressure on Permeability
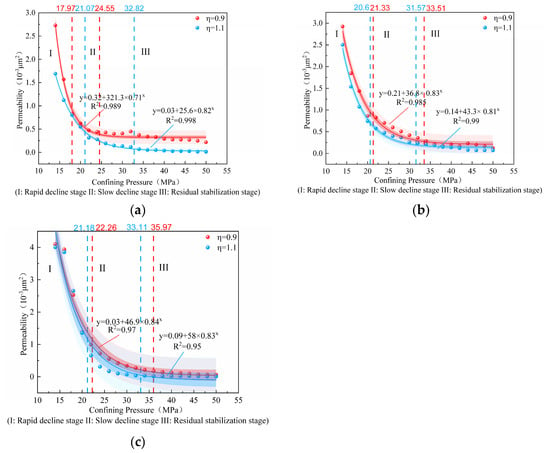
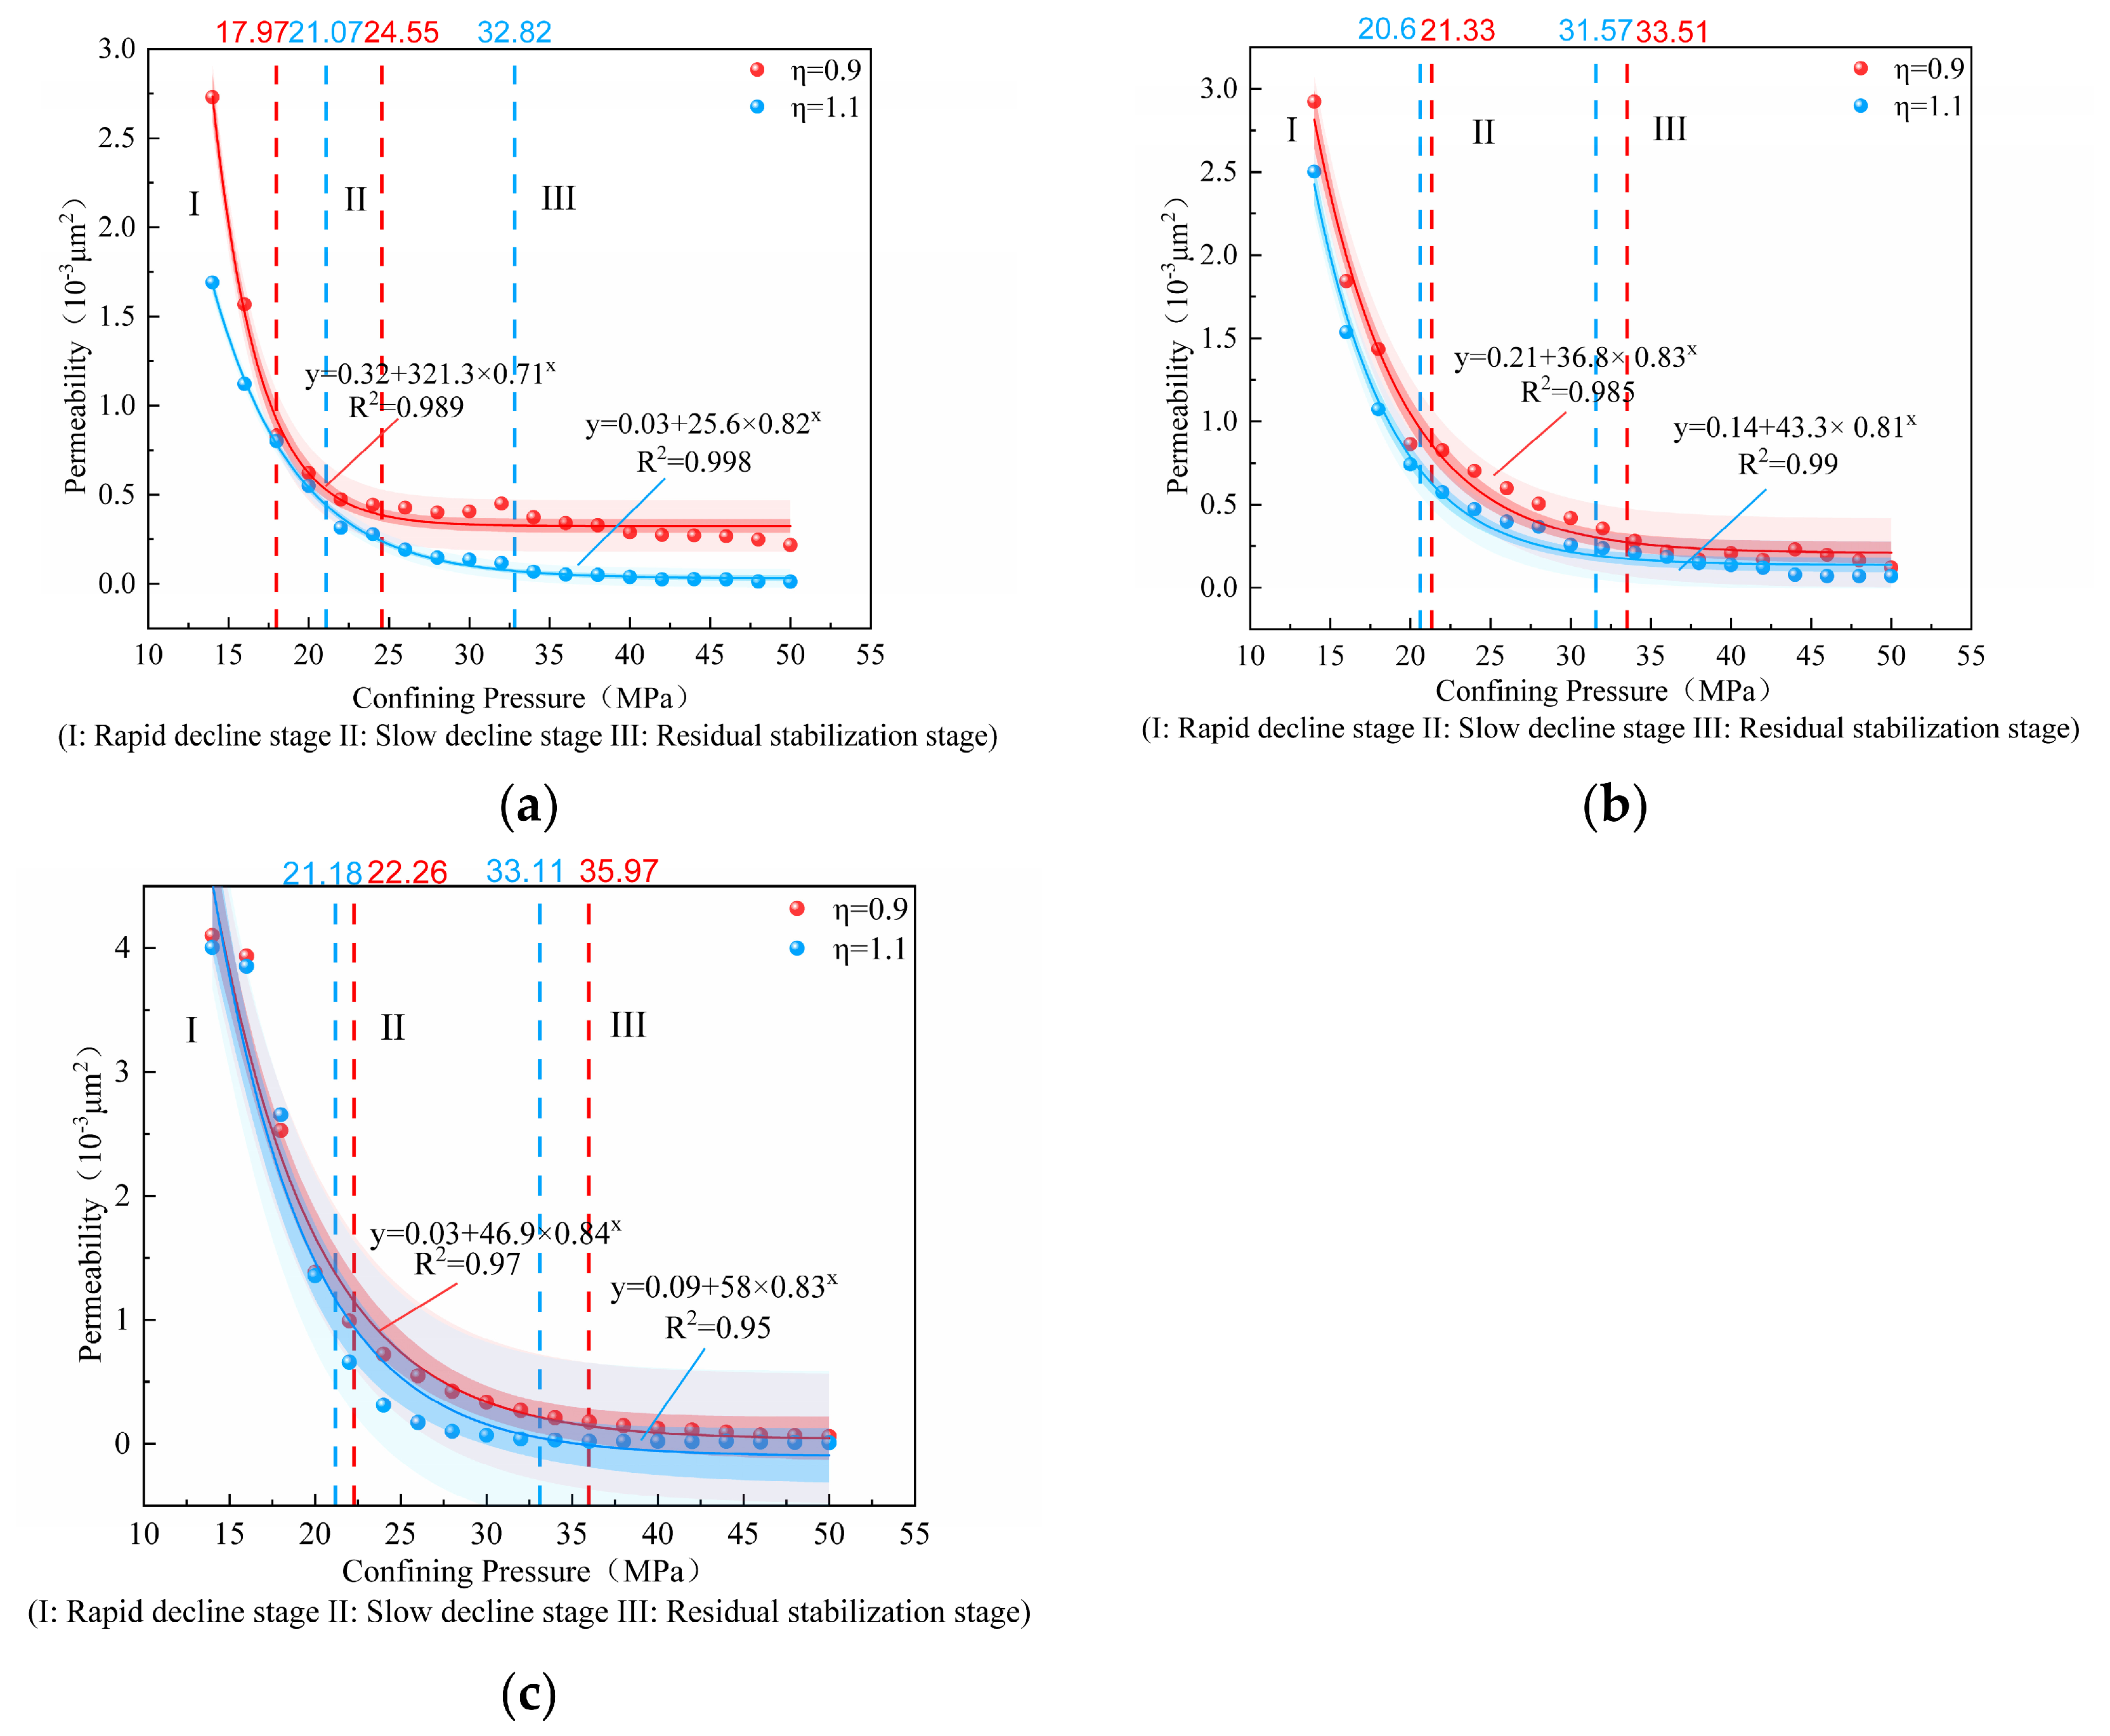
Figure 4 presents the permeability–confining pressure curves of the sandstone specimens under different axial-to-confining pressure ratios at the same injection pressure. The permeability of the coarse-grained sandstone is on the order of 10−3 μm2, indicating a certain potential for CO2 geological storage. However, the suitability of a reservoir for CO2 storage also requires a comprehensive evaluation of factors such as reservoir thickness, porosity, lateral continuity, caprock integrity, pressure limits, fault development, and geochemical compatibility. With increasing confining pressure, permeability decreases progressively. According to the normalized first derivative of the negative exponential permeability–confining-pressure function, with 25% and 2.5% of its magnitude at 14 MPa defined as the two stage-boundary thresholds, the permeability evolution can be broadly divided into three stages. ① Rapid decline stage (Stage I): Pre-existing microfractures and pores within the rock close rapidly under effective stress. Consequently, permeability is highly sensitive to changes in confining pressure and decreases markedly as confining pressure increases. ② Gradual decline stage (Stage II): As most of the readily closable fractures become compacted, the rock enters the elastic compaction stage, during which the rate of permeability reduction gradually decreases. ③ Residual stabilization stage (Stage III): The rock skeleton approaches a densely compacted state, and permeability tends toward a residual value (approaching 10−4 μm2), exhibiting low sensitivity to further changes in confining pressure. The transition confining pressures between Stages I and II range from 17.5 to 22.5 MPa, whereas those between Stages II and III range from 24.5 to 36 MPa. The relatively wide range of the Stage II–III transition is mainly attributed to specimen SY1, which exhibits a transition confining pressure of 24.55 MPa. In contrast, the remaining five specimens show relatively small variations in transition confining pressure, with values ranging from approximately 31.5 to 36 MPa.
Figure 4.
Permeability–confining pressure curves for different axial-to-confining pressure ratios at fixed injection pressures: (a) 10 MPa; (b) 12 MPa; (c) 14 MPa.
Comparison of the effects of different axial-to-confining pressure ratios reveals that, under the same injection pressure and within the stress paths investigated, the permeability at η = 0.9 is consistently higher than that at η = 1.1, with the difference being particularly pronounced at low confining pressures. This difference can be attributed to the distinct axial loading conditions under the same confining pressure loading path. At η = 1.1, the axial stress exceeds the confining pressure, and the higher axial load acts parallel to the seepage direction, reducing the aperture of internal pores and microfractures along the axial direction, thereby narrowing the seepage pathways and decreasing permeability. In contrast, at η = 0.9, the axial stress is lower than the confining pressure, and the reduced axial load alleviates the direct compression of axial seepage pathways. Meanwhile, the higher confining pressure induces radial contraction of the specimen and relatively slows the rate of axial compression, which favors the maintenance or slight opening of axial seepage pathways, resulting in higher permeability. These findings suggest that, during CO2 geological storage in deep formations under high confining pressures, attention should be paid not only to confining pressure but also to the stress state, as variations in deviatoric stress conditions can significantly affect rock permeability. It should be noted that changes in η in the present experiments were accompanied by simultaneous changes in the mean principal stress, resulting in some degree of confounding between the effects of stress ratio and absolute stress magnitude. Strict separation of these effects requires further comparative experiments under constant mean stress or constant deviatoric stress.
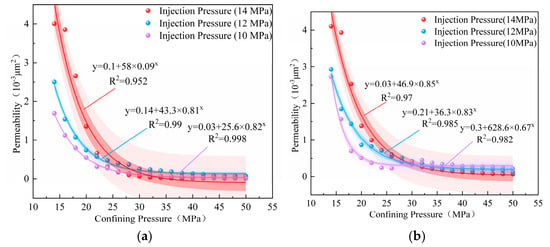
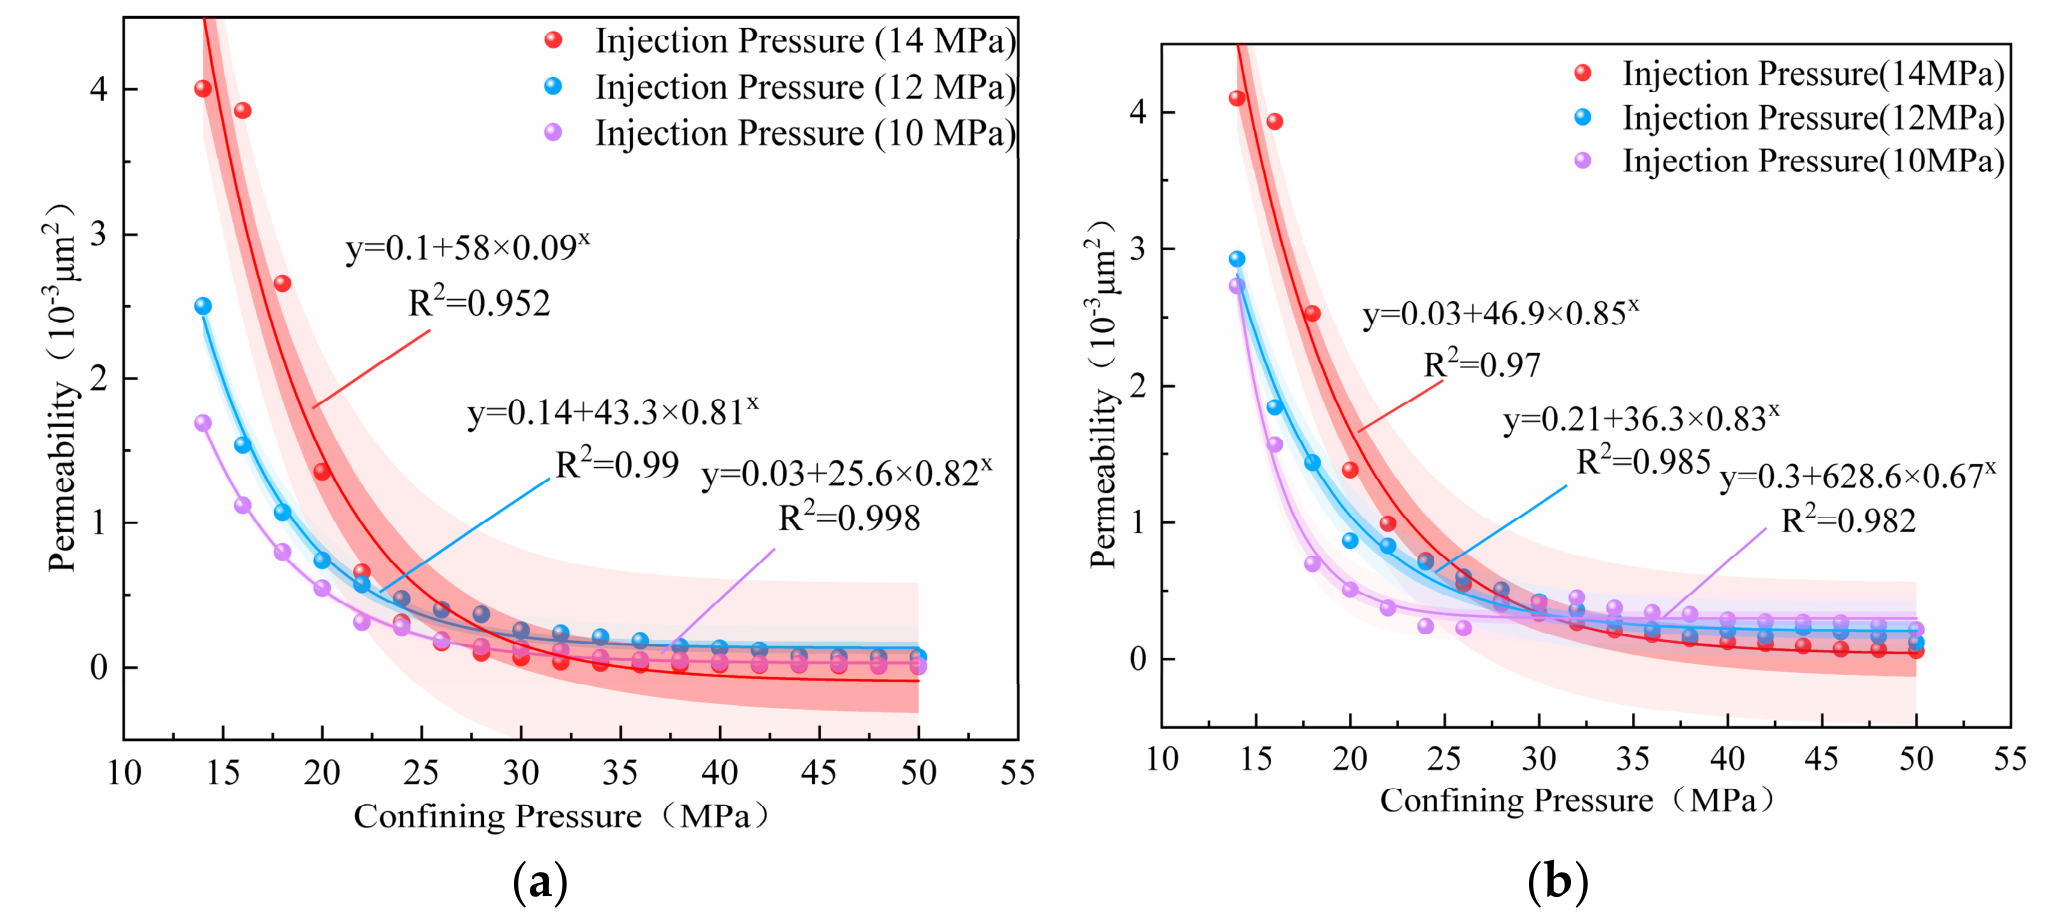
Figure 5 presents the permeability–confining pressure curves under different injection pressures at the same axial-to-confining pressure ratio. Overall, regardless of whether η is 0.9 or 1.1, permeability exhibits pronounced stress sensitivity at relatively low confining pressures (below 30 MPa). At a given confining pressure, higher injection pressures result in higher permeability, consistent with the effective stress principle. Increasing injection pressure reduces the effective confining stress acting on the rock skeleton, allowing microfractures and pore pathways within the specimen to remain open or partially reopen, thereby increasing permeability. Furthermore, the enhancing effect of injection pressure on permeability exhibits a distinctly nonlinear characteristic. Specifically, at the same confining pressure, the increase in permeability from an injection pressure of 10 to 12 MPa is considerably smaller than that from 12 to 14 MPa. This behavior may be attributed to the dominance of internal microfractures in controlling SCCO2 flow through sandstone under low confining pressures, as permeability is nonlinearly related to fracture aperture. As the confining pressure increases beyond approximately 30–34 MPa, the rock skeleton becomes increasingly compacted, and the overall permeability decreases to a relatively low level.
Figure 5.
Permeability curves under different injection pressures for axial-to-confining pressure ratios of (a) 1.1 and (b) 0.9.
The decrease in specimen permeability with increasing confining pressure is primarily governed by changes in effective stress. Therefore, the mean effective stress can be used to establish an empirical relationship between effective stress and permeability. The mean effective stress is calculated as follows:
where is the mean effective stress (MPa); σₐ and σc are the axial stress and confining pressure applied during the experiments (MPa), respectively; α is the Biot–Willis coefficient (taken as 0.8, consistent with the numerical model presented later); and P0 and P1 are the outlet and inlet pore pressures (MPa), respectively.
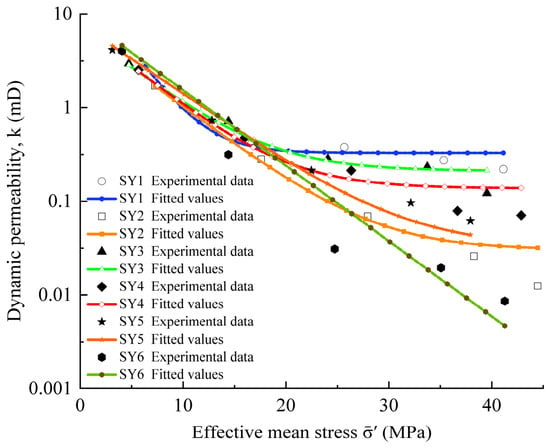
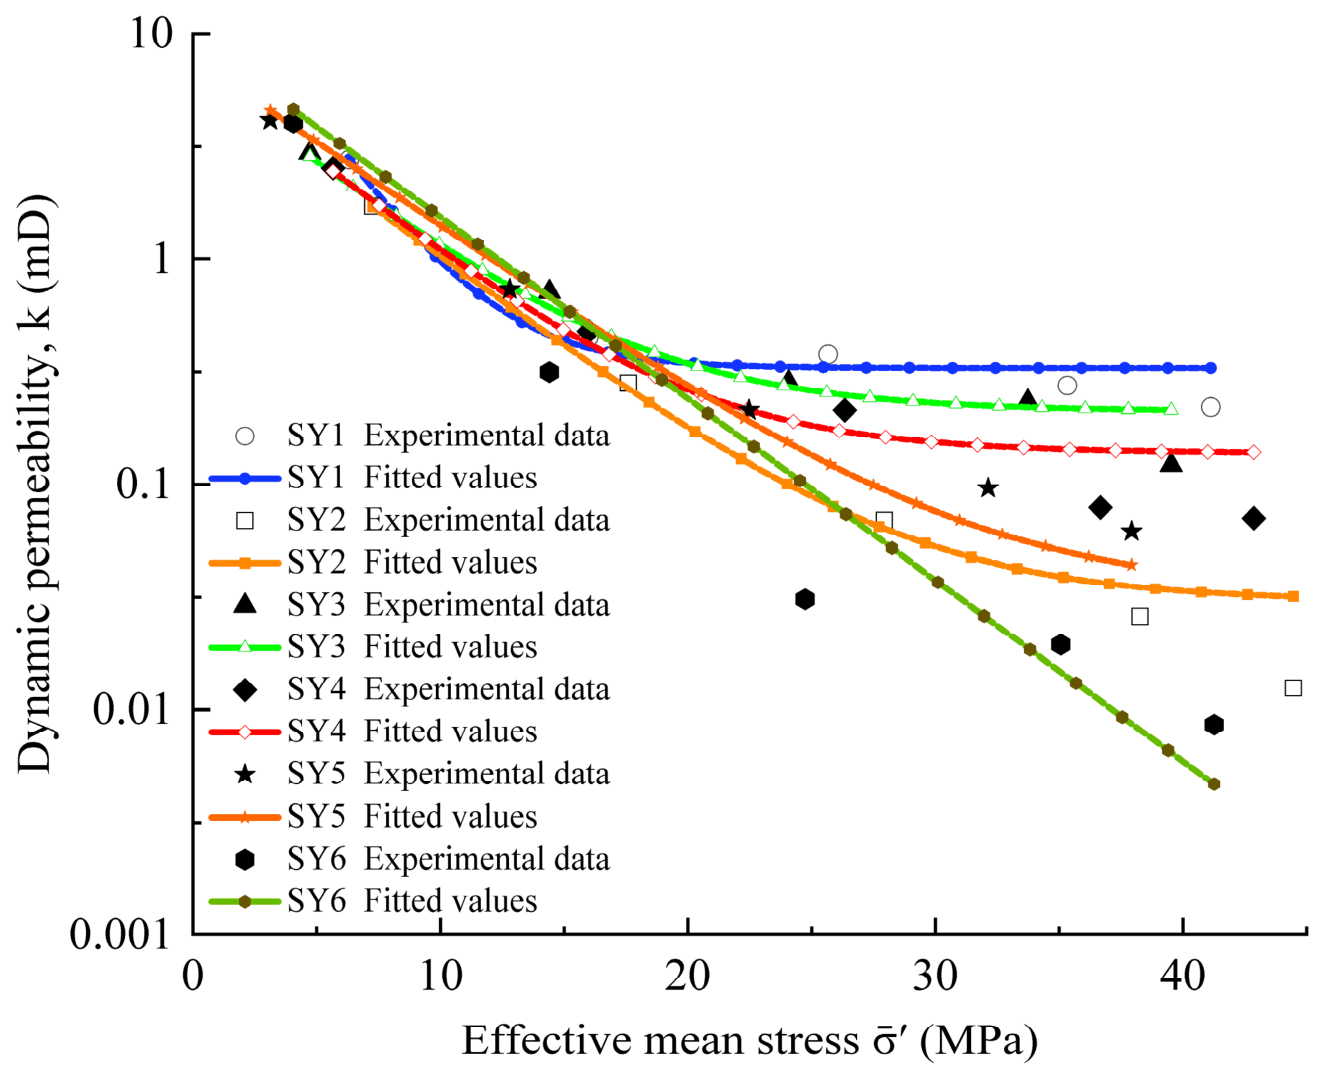
The fitting results for the relationships between mean effective stress and permeability of the six specimens are presented in Figure 6, showing good agreement with a negative exponential relationship expressed as follows:
where k is the dynamic permeability (mD); k0 and kᵣ are the initial and residual permeabilities (mD), respectively; σe0 is the initial effective stress (MPa); and β is the stress sensitivity coefficient (MPa−1).
Figure 6.
Fitted relationships between mean effective stress and permeability.
The fitting errors and confidence intervals of the parameters are presented in Table 3. Overall, the fitting results for all six specimens are satisfactory, with R2 values exceeding 0.950. For specimens SY5 and SY6, the confidence intervals of the residual permeability include zero, indicating that their residual permeability values are not statistically significantly different from zero. At high confining pressures (38–50 MPa), the measured permeabilities of these two specimens decrease to (1–3) × 10−3 μm2 and tend to stabilize. However, the limited number of data points in the plateau region and their relatively large scatter lead to a trade-off between the stress sensitivity coefficient β and the residual permeability kᵣ during nonlinear fitting, making the estimated kᵣ statistically indistinguishable from zero. The negative lower bounds of the confidence intervals are mathematical outcomes of the fitting procedure and do not imply physically negative permeability. For SY5 and SY6, a simplified exponential decay model with kᵣ = 0 can therefore be adopted without affecting the main conclusions of this study.
Table 3.
Fitting parameters, confidence intervals, and errors for the mean effective stress–permeability relationships.
3.2. Stress–Strain Characteristics Under Different Conditions
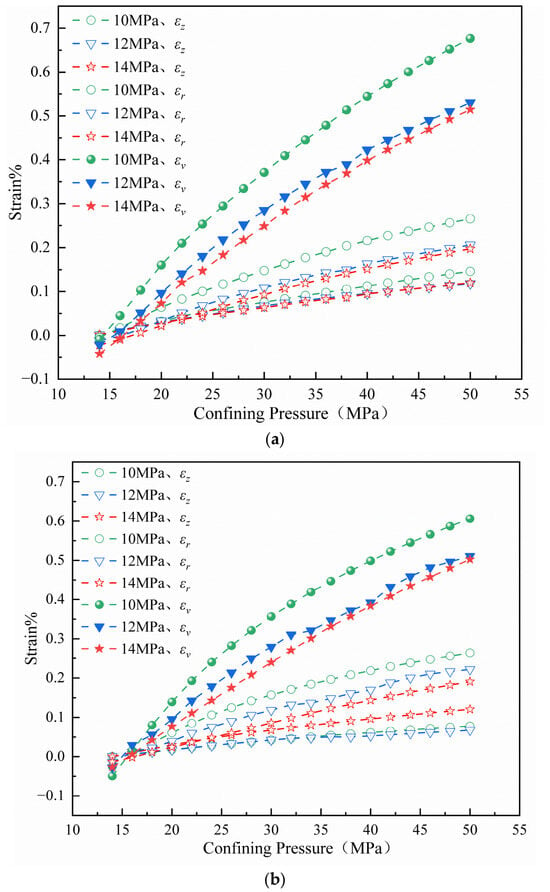
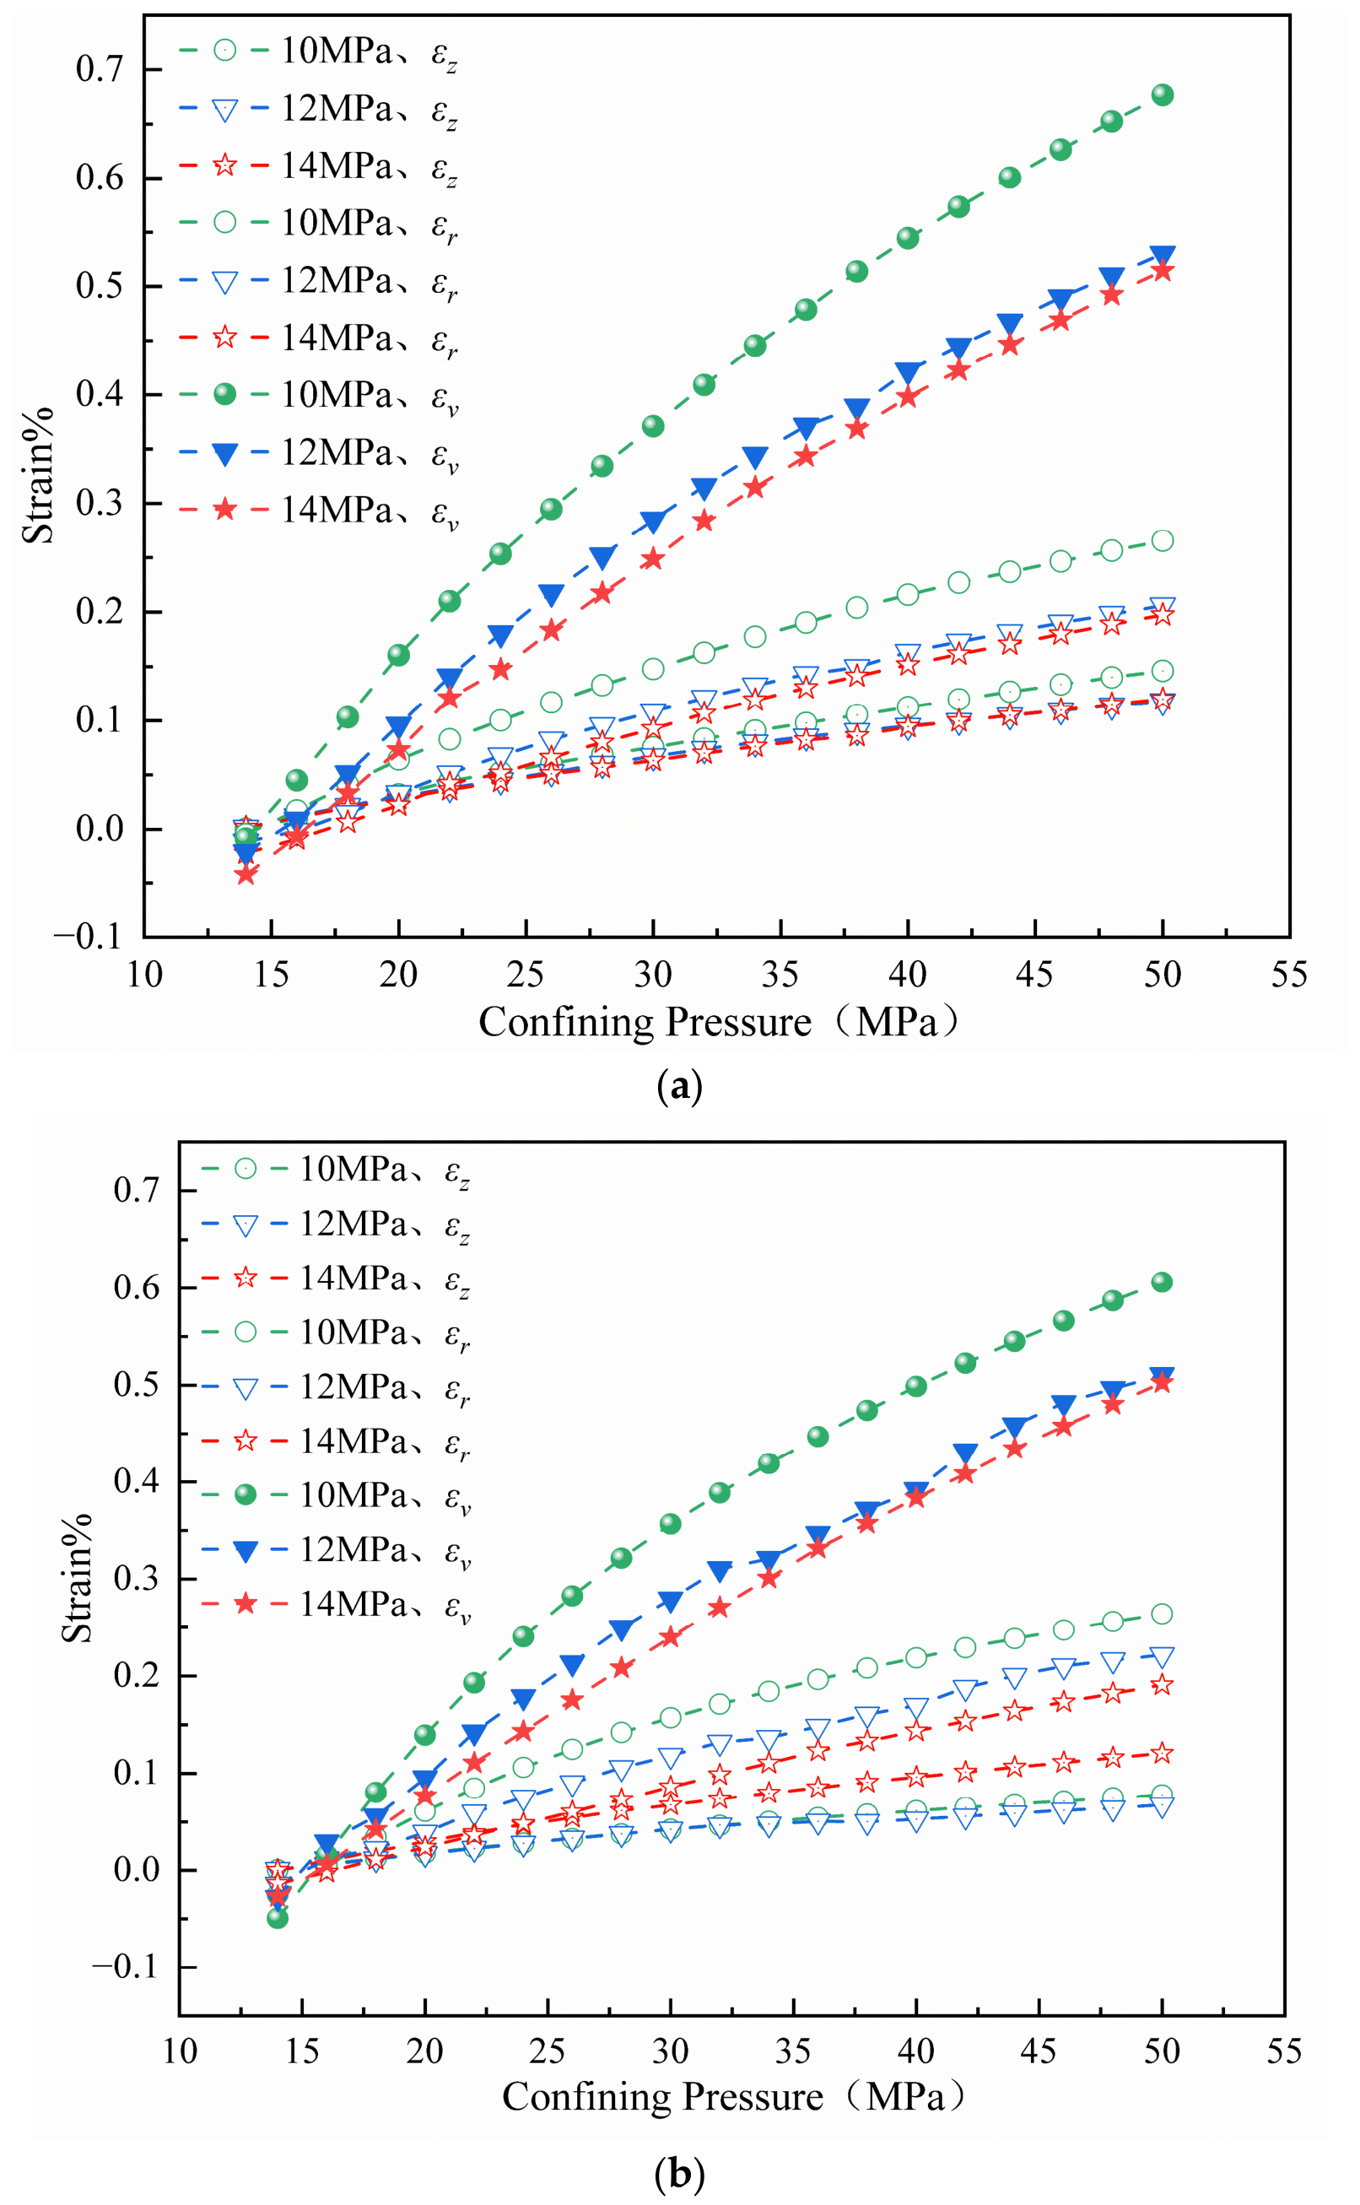
Figure 7 presents the experimental strain–confining pressure curves under different injection pressures at the same axial-to-confining pressure ratio. The results show that, under both stress paths (η = 0.9 and η = 1.1), the reduction in strain induced by increasing injection pressure exhibits a distinctly nonlinear trend. Specifically, at the same confining pressure, the decrease in strain as the injection pressure increases from 10 to 12 MPa is considerably greater than that from 12 to 14 MPa. This phenomenon is consistent with the previously observed nonlinear effect of injection pressure increments on permeability. The influence of injection pressure on strain is more pronounced at η = 1.1 than at η = 0.9. This may be attributed to the higher deviatoric stress level associated with the larger axial-to-confining pressure ratio, which increases the heterogeneity of the internal stress distribution within the rock. Consequently, the effects of pore pressure variations on stress redistribution are more readily amplified, making the macroscopic strain response more sensitive to injection pressure. In contrast, at η = 0.9, the specimen is subjected to a stress state dominated by lateral confinement and compaction, resulting in a relatively moderate response to pore pressure variations. Furthermore, the radial strain εᵣ consistently exceeds the axial strain εₐ under both η = 0.9 and η = 1.1, indicating a more pronounced lateral confinement effect. This suggests that radial compression is the dominant component of deformation under both stress paths when the axial stress and confining pressure are relatively close in magnitude. At η = 0.9, the increment in axial strain (or axial compression rate) is significantly smaller than that at η = 1.1, which directly indicates that a deviatoric stress state in which the axial stress acts as the minimum principal stress suppresses axial compression. The root cause of this difference lies in the essentially different stress states corresponding to the two paths: under η = 0.9, the axial compression rate is markedly lower, whereas under η = 1.1, the axial stress dominates and lateral confinement is weaker, so the rock is more prone to axial compression.
Figure 7.
Strain–confining pressure curves under different injection pressures at fixed axial-to-confining pressure ratios: (a) η = 1.1; (b) η = 0.9.
A combined analysis of the permeability–confining pressure and strain–confining pressure curves reveals that, as confining pressure increases, both axial and radial strains of the specimens progressively increase, accompanied by a continuous decrease in permeability. This indicates a gradual reduction in the effective aperture and connectivity of seepage pathways. Among these responses, radial strain is more sensitive to changes in confining pressure and exhibits a stronger correlation with permeability reduction. At η = 0.9, axial compression is relatively weak, allowing the seepage pathways to remain more open and resulting in generally higher permeability. In contrast, at η = 1.1, more pronounced axial compression leads to greater closure of seepage pathways and consequently lower permeability. These findings further demonstrate that permeability depends not only on the magnitude of deformation but also on its direction and the corresponding effects on the primary seepage pathways.
3.3. Analysis of Experimental Limitations
The present study has several limitations that warrant further investigation. (1) Only one specimen was tested under each experimental condition, without repeated experiments. Although variations in P-wave velocity and appearance were controlled during specimen selection, differences in mineral composition and pore structure, particularly those of specimen SY3, may confound the effects of the axial-to-confining pressure ratio. Therefore, the observed differences associated with η and injection pressure should be regarded as indicative trends, and their statistical significance requires confirmation through repeated experiments. (2) The study was conducted using laboratory-scale specimens (50 mm in diameter and 100 mm in height), without considering reservoir-scale heterogeneity, fault and fracture networks, boundary conditions, or scale effects. Therefore, the derived quantitative relationships cannot be directly extrapolated to larger scales. (3) The experiments involved short-term (6–12 h) thermo-hydro-mechanical (THM) processes, without considering long-term CO2–brine–rock geochemical interactions. (4) Changes in η were accompanied by simultaneous changes in the mean principal stress, and the effects of the stress ratio and absolute stress magnitude were not strictly decoupled. (5) The experiments were conducted on dry specimens, measuring the single-phase steady-state permeability of SCCO2. Therefore, the experiments did not fully reproduce SCCO2–brine two-phase flow or the effects of bound water in deep saline aquifers, and the measured permeability does not represent the dynamic behavior of two-phase relative permeability.
4. Numerical Simulation Results and Discussion
Laboratory experiments effectively revealed the seepage–deformation response of the specimens. However, owing to limitations in experimental measurements, it is difficult to directly characterize the internal redistribution of effective stress, the spatial evolution of porosity and permeability, and deformation localization within the specimens. In addition, specimen-to-specimen variability cannot be completely eliminated. Therefore, a numerical specimen was constructed based on the experimental results for coupled hydro-mechanical analysis, aiming to further elucidate the multiphysics coupling mechanisms from the perspective of internal field evolution.
4.1. Numerical Model Development and Constitutive Model Implementation
Based on the physical and mechanical properties and seepage–deformation responses of sandstone obtained from the laboratory experiments, a two-dimensional axisymmetric single-phase fluid–solid coupled model was established in COMSOL Multiphysics 4.1 for specimen SY6. The model is based on fluid mass conservation, Darcy’s law, and the solid equilibrium equation, with Biot’s effective stress formulation employed to couple pore pressure and deformation of the rock skeleton. Both stationery and time-dependent study steps were included in the model. The stationary solutions were used for comparison with the experimental curves, while permeability and elastic modulus were updated according to the mean effective stress.
The model represents a homogeneous axisymmetric medium with a diameter of 50 mm and a height of 100 mm under the small-deformation assumption. The pore space is saturated with a single fluid phase, and the fluid density and dynamic viscosity are assumed to be constant. Mass source terms, inertial effects, and gravitational effects are neglected under the stationary fitting conditions. The solid skeleton is described using an isotropic elastic constitutive model, in which the elastic modulus varies with mean effective stress, while Poisson’s ratio remains constant at 0.18. Plastic yielding and damage evolution are not considered. The tensor equations follow the COMSOL Multiphysics® 4.1 (COMSOL AB, Stockholm City, Sweden) sign convention, in which tensile stress is positive. For comparison with the experimental data, axial, radial, and volumetric compressive strains are consistently expressed as positive values.
(1) Fluid mass conservation equation
Under linear small-strain poroelastic coupling, the general mass conservation equation for single-phase fluid flow in a porous medium is expressed as:
where ρf is the fluid density; Sp is the poroelastic storage coefficient; q is the Darcy velocity; and Qm is the mass source term per unit volume of the porous medium. The remaining symbols have the same meanings as defined previously. For the stationary validation conditions considered in this study, both time-dependent accumulation terms vanish, and Qm is also zero. Therefore, the mass conservation equation is simplified to:
∇⋅(ρfq) = 0
(2) Darcy’s law
The fluid velocity is determined by Darcy’s law:
where μf is the dynamic viscosity of the fluid, and the remaining symbols are as previously defined.
(3) Solid equilibrium equation
When inertial effects are neglected, the solid skeleton satisfies the static equilibrium equation. Pore pressure acts on the solid skeleton through the Biot coupling term, and the stress–strain relationship can be expressed as:
where σ is the total stress tensor; ε is the infinitesimal strain tensor; C is the fourth-order isotropic elasticity tensor; E and ν are Young’s modulus and Poisson’s ratio, respectively; α is the Biot–Willis coefficient; p is the pore pressure; and I is the second-order identity tensor. The remaining symbols have the same meanings as previously defined.
σ = C(E, ν): ε − αpI
(4) Coupled parameter updating
The mean effective stress is determined using Equation (3). Based on the constitutive relationship for porous media, porosity is updated according to volumetric strain as follows:
where φ is the dynamic porosity; φ0 is the initial porosity; and cφ is the porosity evolution coefficient. In the present model, φ0 = 0.0865 and cφ = 10. This relationship is physically meaningful only when 0 < φ < 1, and the lower bound of porosity should be examined under large compressive volumetric strains.
φ = 1 − (1 − φ0) ⋅ exp(−cφεV)
To characterize the dynamic interaction between deformation of the rock skeleton and its seepage capacity, the experimentally derived effective stress–permeability relationship is incorporated as the governing equation for permeability updating, using the fitted expression presented in Table 3. Thus, permeability is updated independently as a function of effective stress, while porosity is not included in the permeability fitting relationship.
The elastic modulus is updated during the coupled calculation according to the following expression:
where E0 is the reference elastic modulus; αE is the elastic modulus growth coefficient; and the mean effective stress increment is defined in Equation (10).
Constant pressures are prescribed at the inlet and outlet as flow boundary conditions. The confining pressure σc is applied to the lateral surface of the specimen, while the axial stress σa is applied to the axial end face. Axisymmetric constraints are imposed along the symmetry axis, and axial rigid-body displacement is restrained at the opposite end. The main parameters used in the numerical simulations are listed in Table 4. The model consists of 1492 triangular mesh elements and is solved under stationary conditions.
Table 4.
Key Parameters Used in the Numerical Simulations.
It should be noted that each experimental condition lasted approximately 6–12 h, and the model only represents short-term thermo-hydro-mechanical (THM) coupled behavior. Geochemical processes, such as mineral dissolution/precipitation, salt precipitation, and changes in surface properties, were not considered. Therefore, the findings cannot be directly extrapolated to timescales of years to decades.
4.2. Model Validation and Applicability Analysis
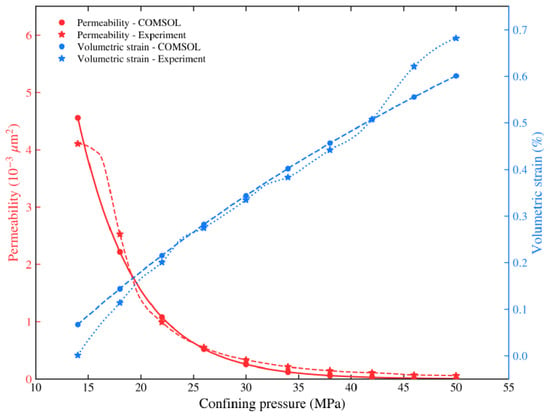
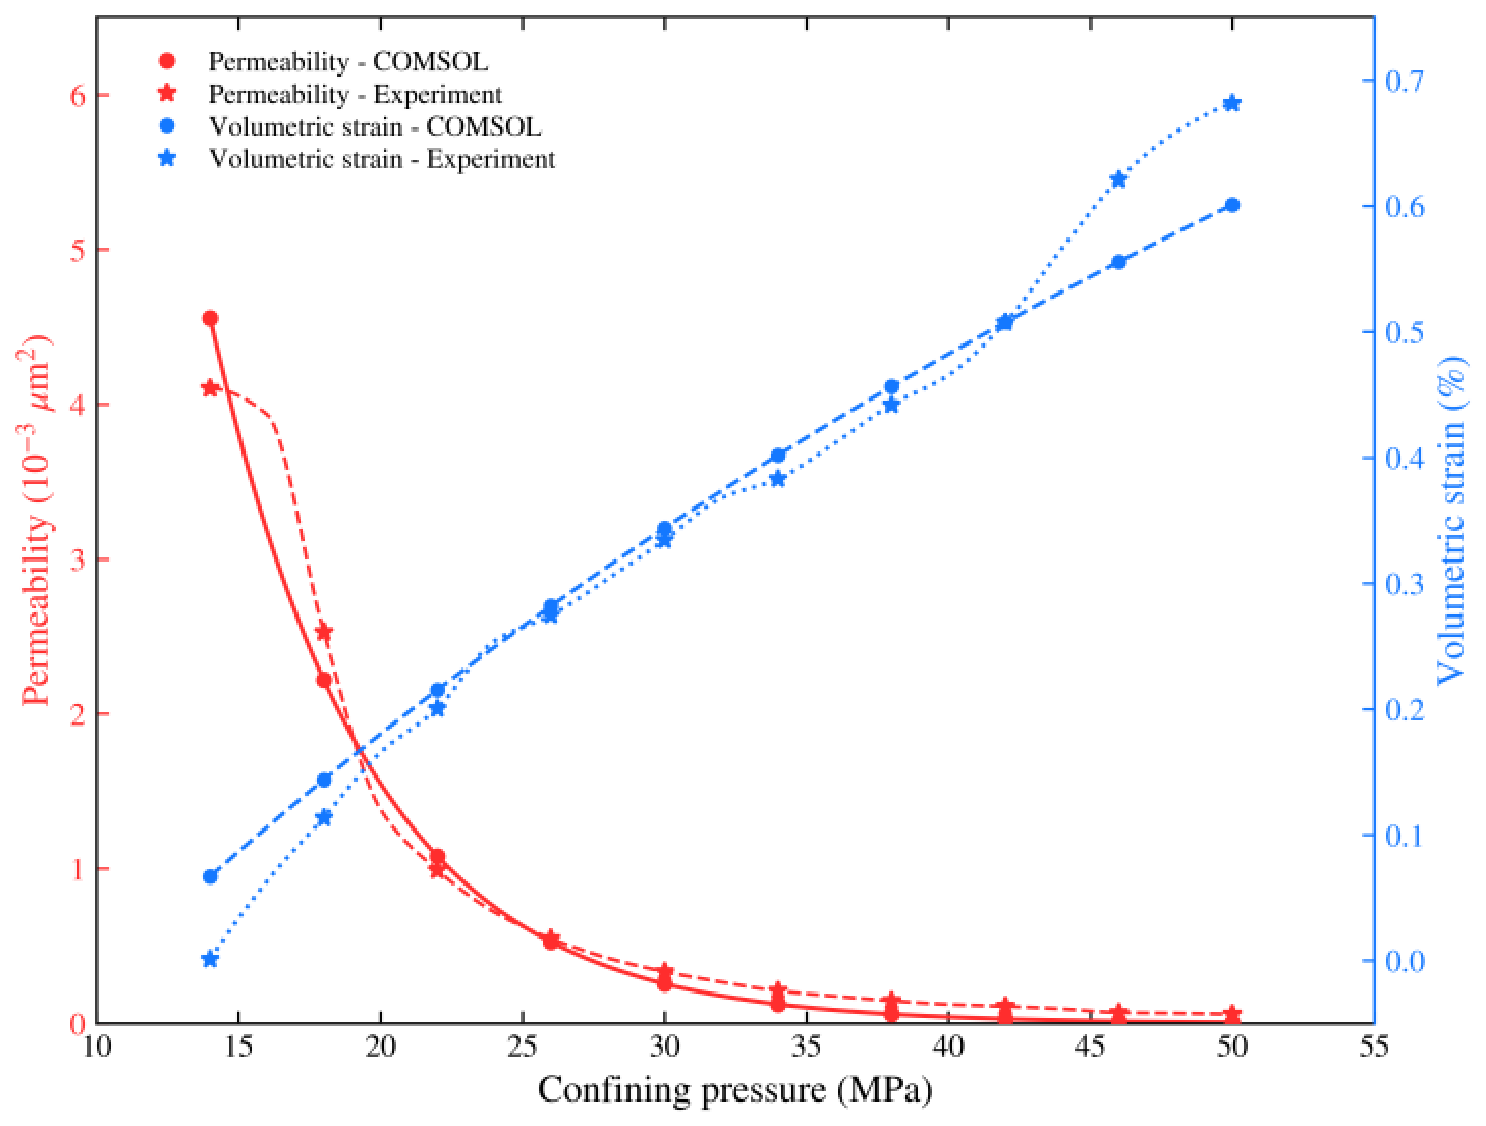
To evaluate the model’s ability to reproduce the experimental results, the numerical simulation results under an injection pressure of 14 MPa and an axial-to-confining pressure ratio of 1.1 were compared with the laboratory experimental results of specimen SY6, as shown in Figure 8. The simulated permeability and volumetric strain exhibit overall trends consistent with the experimental measurements. For permeability, the coefficient of determination (R2) is 0.966, the root mean square error (RMSE) is 0.227 × 10⁻³ μm2, and the mean absolute error (MAE) is 0.143 × 10⁻³ μm2. For volumetric strain, R2 is 0.961, while the RMSE and MAE are 0.038% and 0.028%, respectively. The simulation results agree well with the experimental measurements within the intermediate confining pressure range, whereas discrepancies are mainly observed during the initial low-confining-pressure stage and the residual high-confining-pressure stage. These discrepancies may be attributed to the actual pore and fracture structures of the specimens, local heterogeneity, and end effects. Overall, the model adequately captures the fundamental trends of permeability reduction and volumetric strain increase, providing a basis for analyzing the coupled seepage–deformation characteristics of sandstone specimens under different stress conditions.
Figure 8.
Comparison of permeability and volumetric strain curves between specimen SY6 and the numerical specimen.
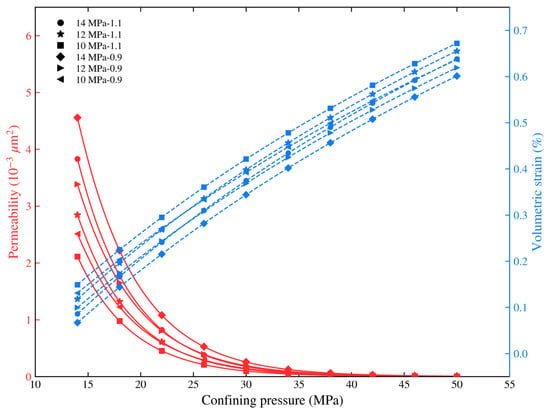
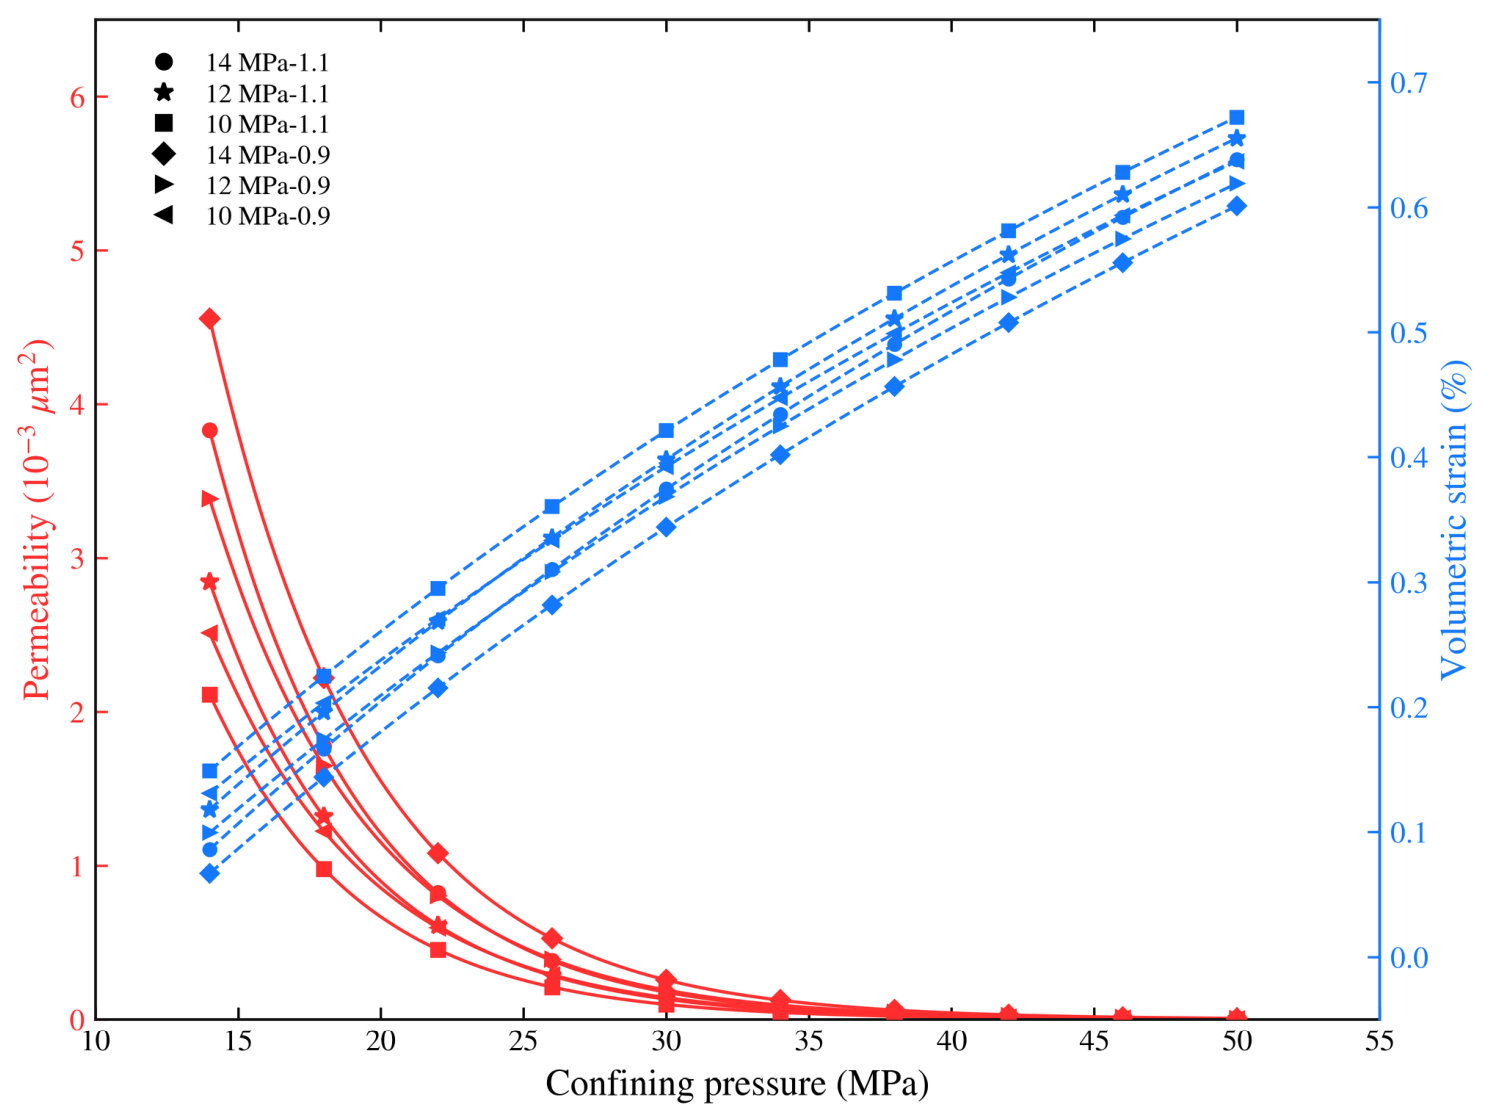
Using the same numerical specimen, the injection pressure and axial-to-confining pressure ratio were adjusted according to the experimental scheme described above to investigate the variations in permeability and volumetric strain under different conditions while eliminating the influence of interspecimen heterogeneity. Figure 9 presents the simulated permeability and volumetric strain results under six different conditions. Under all conditions, permeability gradually decreases with increasing confining pressure, whereas volumetric strain increases. At a constant axial-to-confining pressure ratio, higher injection pressures generally result in higher permeability and lower volumetric strain. At the same injection pressure, permeability at η = 0.9 is generally higher than that at η = 1.1, while the corresponding volumetric strain is relatively smaller. Overall, the highest permeability is observed at an injection pressure of 14 MPa and η = 0.9, whereas the lowest permeability occurs at an injection pressure of 10 MPa and η = 1.1. These results indicate that both injection pressure and the axial-to-confining pressure ratio significantly influence the coupled seepage–deformation behavior of the specimens. Overall, the simulated results show good agreement with the experimental observations, supporting the model’s ability to predict general trends within the investigated experimental conditions.
Figure 9.
Permeability and volumetric strain curves under different injection pressures and axial-confining pressure ratios.
A parametric sensitivity analysis was performed on the initial porosity φ0, with values of 0.080, 0.0865, 0.100, and 0.120 used in separate simulations. The results show that the variation in steady-state outlet permeability is less than 3%, while the overall shape of the permeability–effective stress (k–σ′) curves remains essentially unchanged. The variations in the stress–strain curves are less than 8%, without affecting the main conclusions of this study. As described by the governing equations in Section 4.1, permeability is independently updated using the effective stress–permeability relationship, and porosity is not directly involved in permeability fitting. Therefore, variations in initial porosity have a relatively limited influence on the overall simulation results.
4.3. Spatial Characteristics of Effective Stress and Porosity
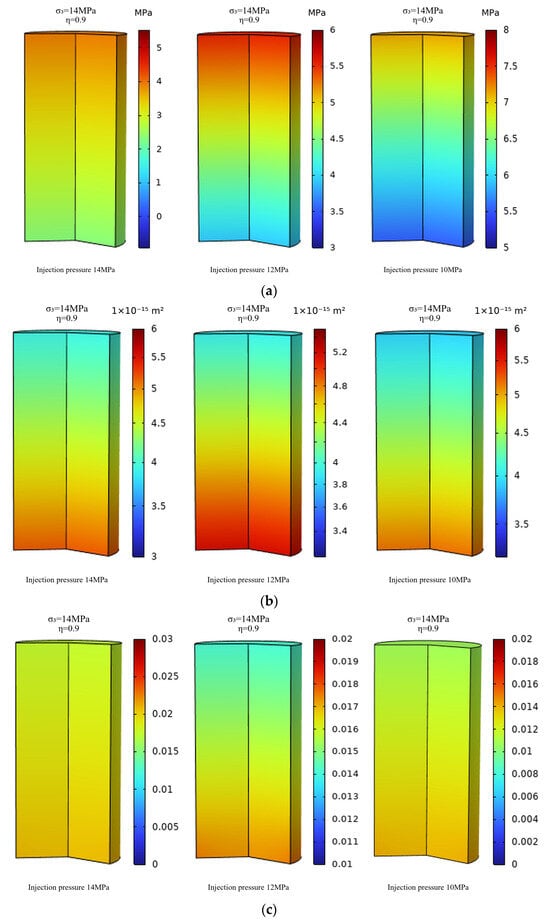
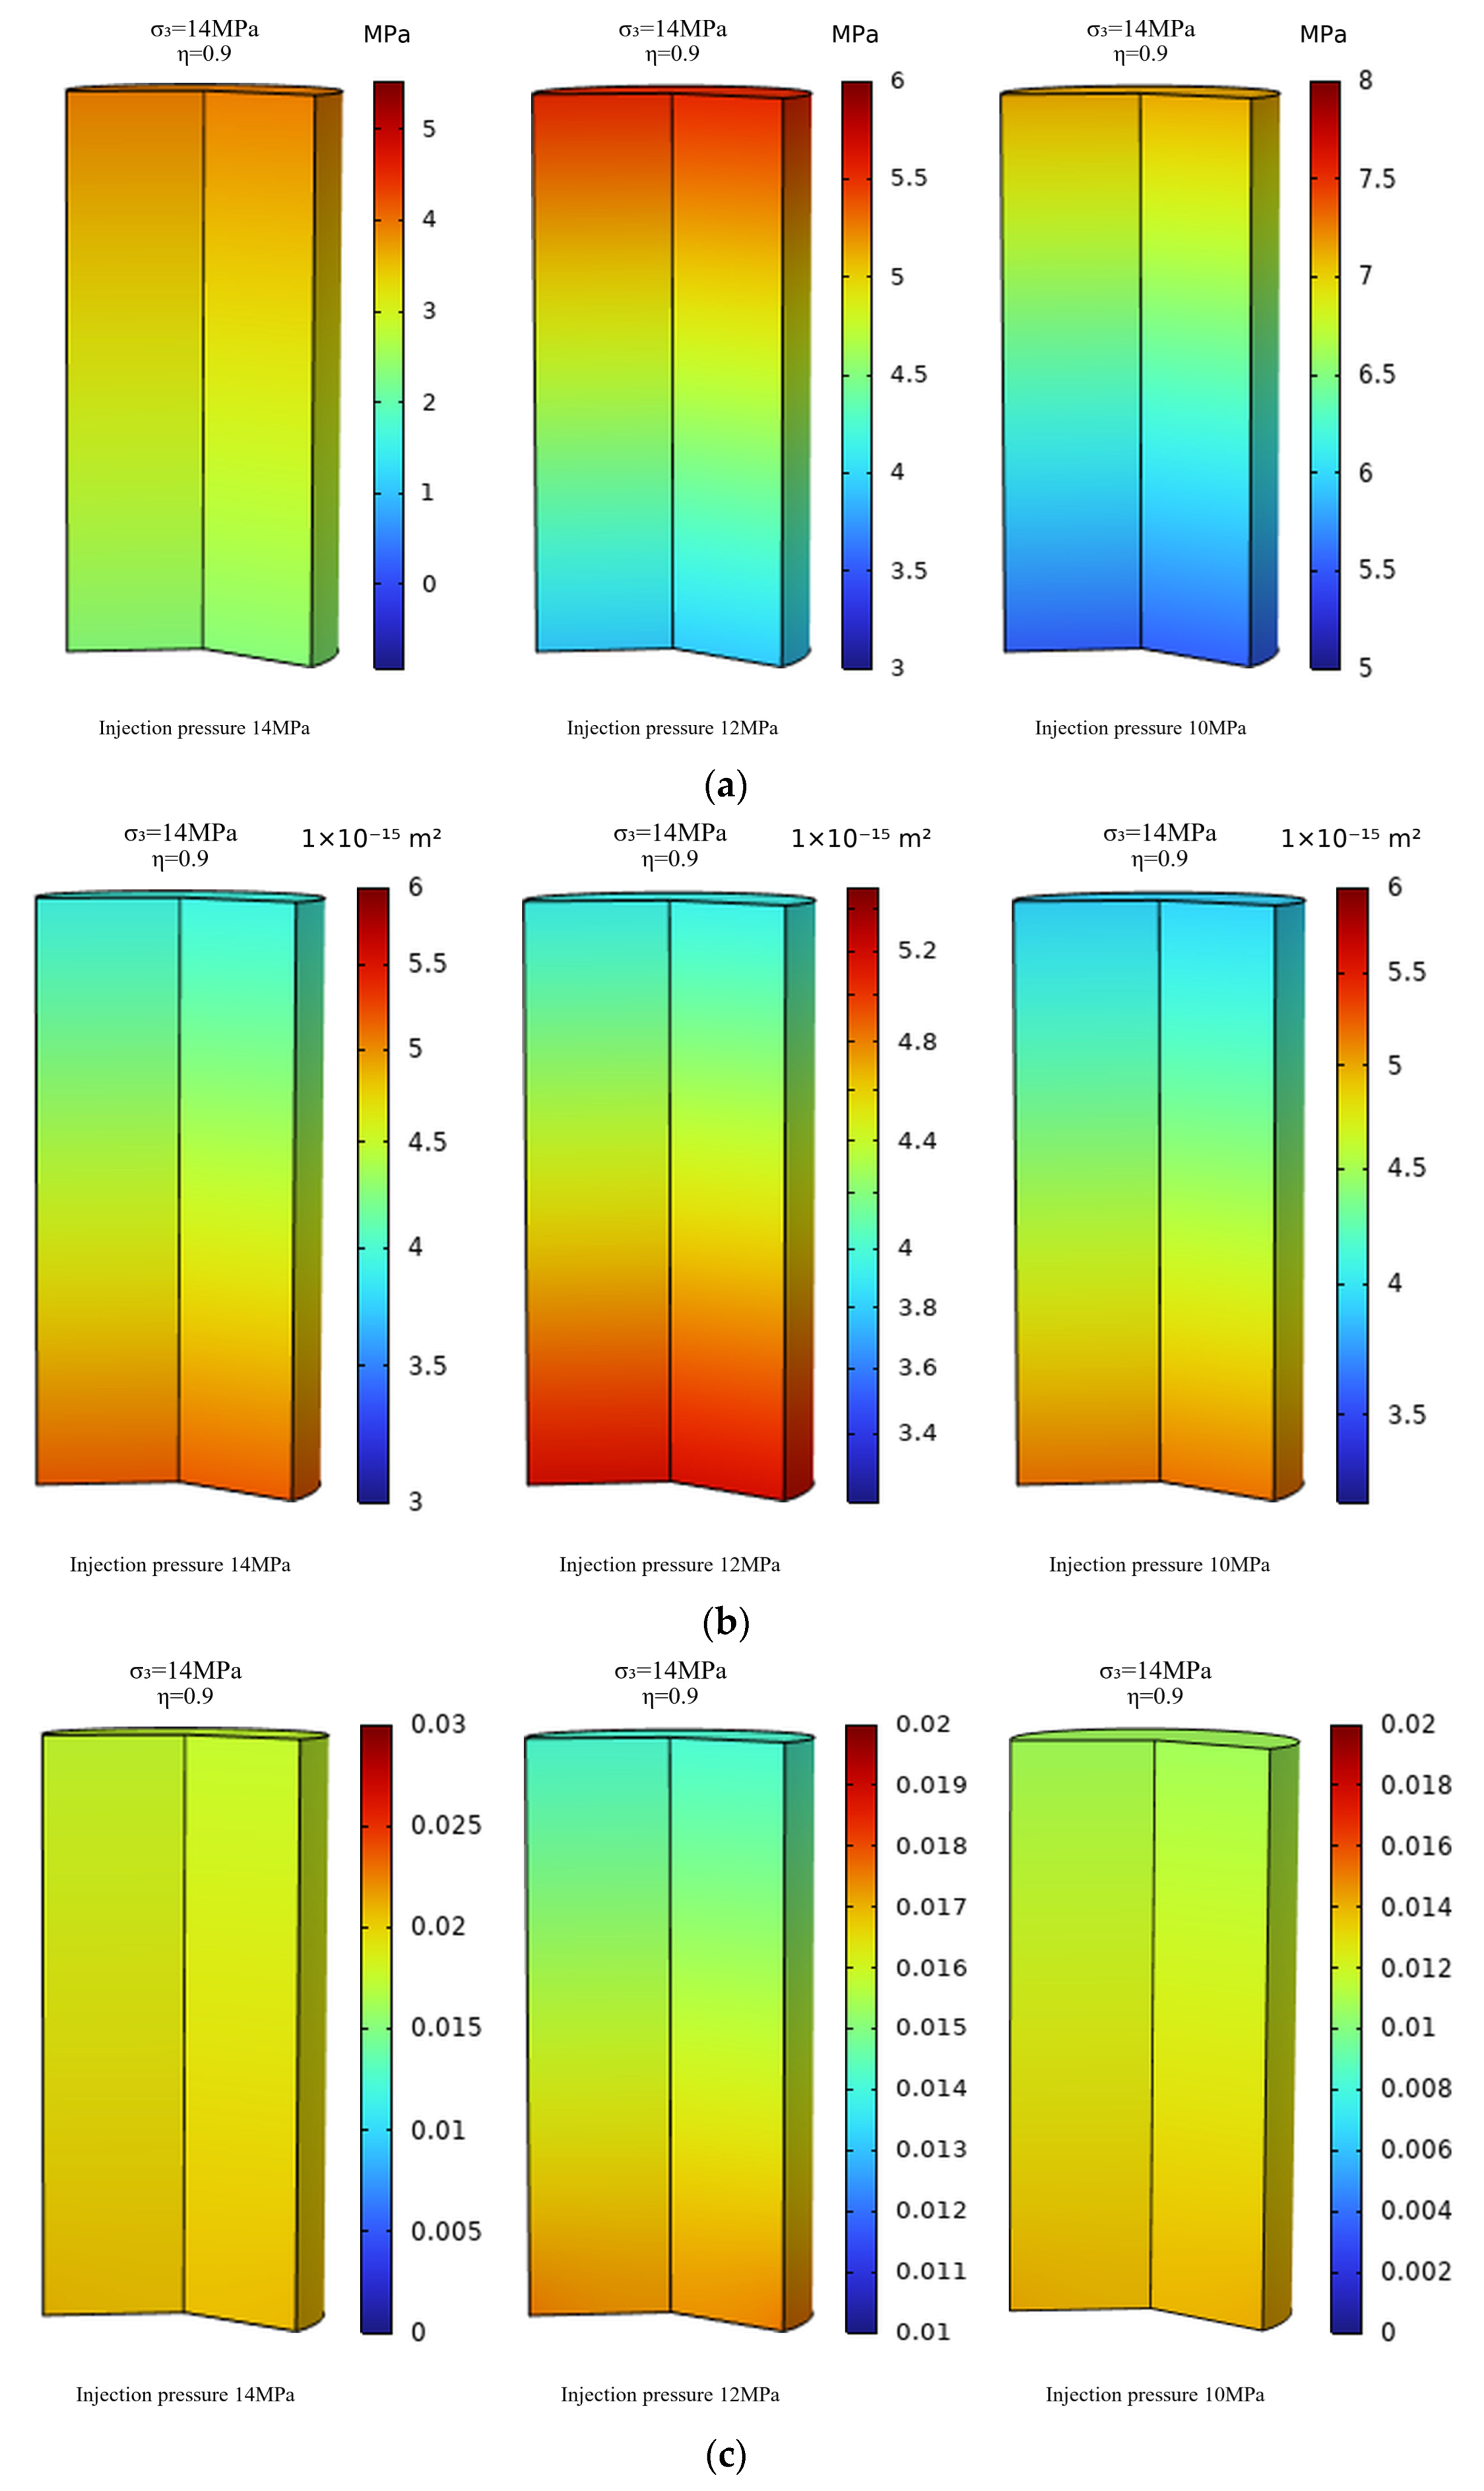
Laboratory experiments characterize the overall equivalent permeability of the specimen, whereas during actual SCCO2 injection, the internal stress and flow fields exhibit pronounced spatial heterogeneity. As shown in Figure 10, the spatial distributions of effective stress, permeability, and porosity are presented sequentially for specimens subjected to the same confining pressure but different combinations of injection pressure and axial-to-confining pressure ratio. Because SCCO2 is injected from the bottom of the specimen, fluid pressure accumulates locally near the injection end, resulting in substantially lower effective stress at the bottom than at the outlet end. Governed by this effective-stress gradient, both porosity and permeability exhibit pronounced spatially heterogeneous distributions, with higher values at the injection end and lower values toward the outlet end. The increase in porosity is closely associated with the reduction in effective stress caused by increasing injection pressure. Following SCCO2 injection, the increase in pore-fluid pressure reduces the degree of compaction of the rock skeleton, inducing local elastic expansion accompanied by the opening of microfractures. The resulting increase in pore volume is manifested macroscopically as an increase in porosity. From a rock-mechanics perspective, the injection-induced stress response is governed by the combined effects of pore pressure and stress carried by the rock skeleton. With increasing SCCO2 injection pressure, the elevated pore pressure progressively reduces the effective stress, facilitating the opening of pores and microfractures and consequently increasing both porosity and permeability. A continued increase in injection pressure may further intensify localized deformation and promote fracture propagation.
Figure 10.
Spatial distributions of (a) effective stress, (b) permeability, and (c) porosity under injection pressures of 10, 12, and 14 MPa at η = 0.9.
4.4. Control of the Axial-to-Confining Pressure Ratio on Permeability and Deformation Localization
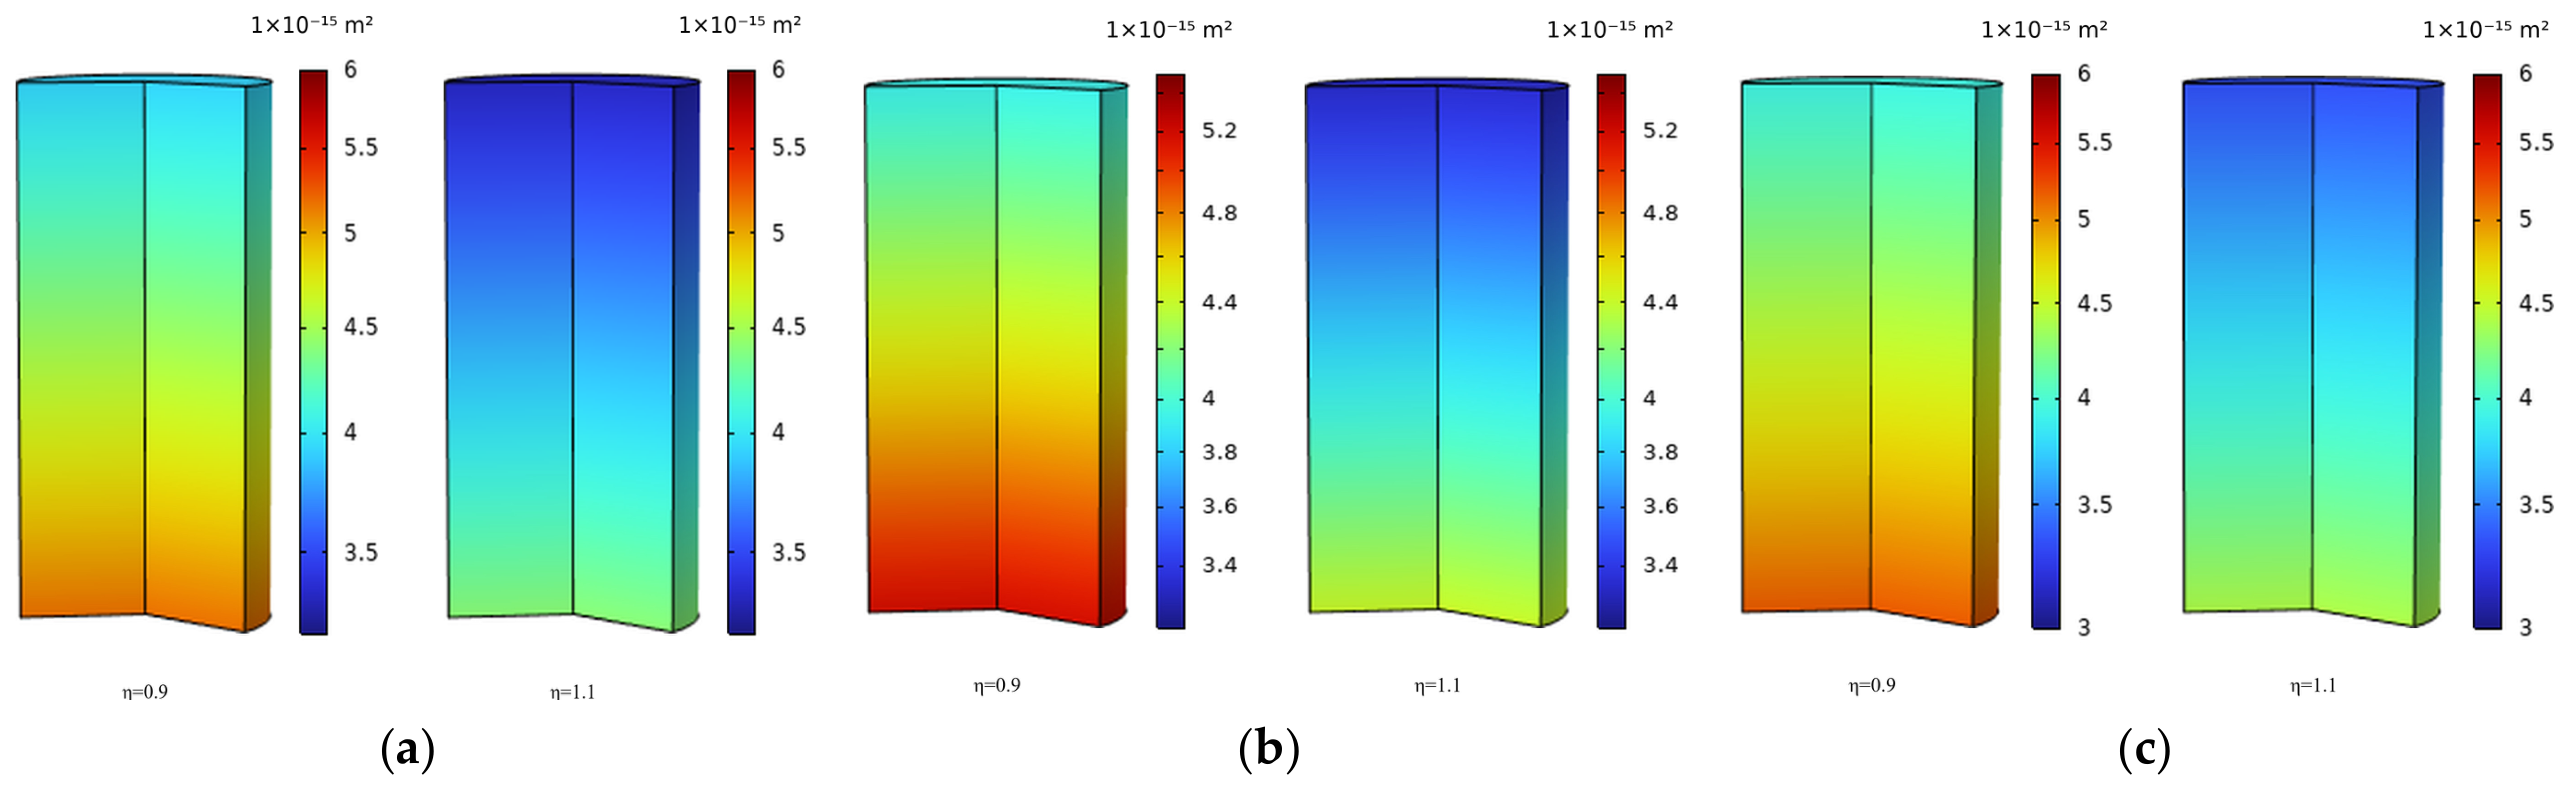
Comparison of the permeability contour plots under different stress states (Figure 11) reveals that, at the same injection pressure, permeability is higher at an axial-to-confining pressure ratio of η = 0.9 than at η = 1.1, and decreases significantly with increasing axial stress. This indicates that the η = 0.9 stress path, characterized by a lower axial load, effectively reduces compaction along the SCCO2 migration direction, resulting in a more uniform permeability distribution and generally higher permeability throughout the specimen. This also explains the consistently higher permeability observed at η = 0.9 in the preceding laboratory experiments. Furthermore, as the injection pressure increases from 10 to 14 MPa, the permeability reduction along the flow path gradually decreases under both axial-to-confining pressure ratios. At η = 0.9, the reduction is approximately 24.13%, whereas at η = 1.1, it is approximately 24.10%. In terms of the relative reduction, the decrease in permeability from the inlet to the outlet is slightly smaller at η = 1.1. Comparison of the numerical simulation results with the laboratory experimental results presented in Figure 4 reveals a high degree of consistency in their overall trends. At the same injection pressure, the permeability at η = 0.9 consistently exceeds that at η = 1.1, further indicating that the η = 0.9 stress path is more favorable for maintaining seepage pathways than the η = 1.1 stress path.
Figure 11.
Contour maps of permeability under different injection pressures and axial-to-confining pressure ratios: (a) 10 MPa; (b) 12 MPa; (c) 14 MPa. Each panel compares η = 0.9 and η = 1.1.
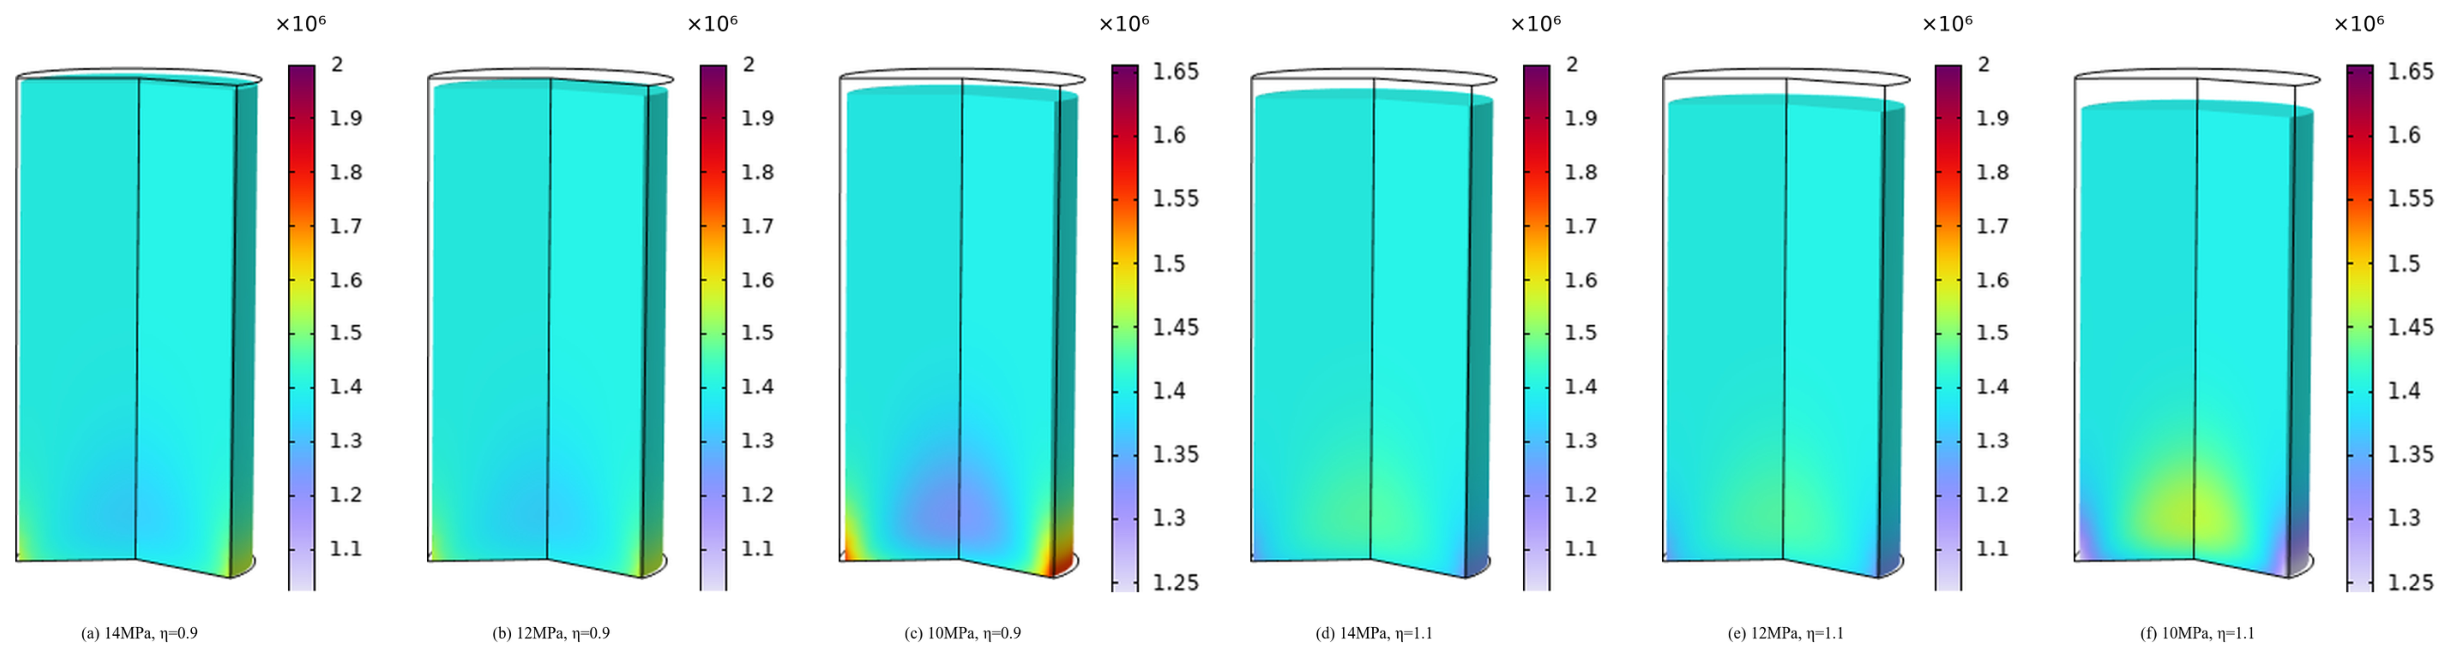
Figure 12 illustrates the stress–deformation responses of the numerical specimen under different combinations of axial-to-confining pressure ratios and injection pressures. The results show that radial contraction is more pronounced at η = 0.9 than at η = 1.1, whereas the overall axial deformation patterns are similar. However, at η = 1.1, the stress at the bottom of the specimen is relatively low, while at η = 0.9, stress concentrations are observed at the bottom and along both lateral sides of the specimen. Furthermore, at η = 0.9 and an injection pressure of 14 MPa, the specimen exhibits radial contraction accompanied by axial expansion. As the injection pressure decreases, the specimen undergoes contraction in both the radial and axial directions, indicating that the supporting effect of pore pressure gradually weakens while external stresses regain dominance. Consequently, the overall deformation behavior transitions from axial expansion with slight radial compaction to compression in both the axial and radial directions. Meanwhile, radial contraction is more pronounced at an injection pressure of 12 MPa than at 10 MPa. The numerical simulations clearly reveal the fundamental differences between the two stress paths. Under the η = 0.9 stress path, the numerical model exhibits a tendency toward axial expansion, whereas the specimens in the laboratory experiments consistently undergo axial compression, with only a reduction in the axial compression rate. This discrepancy is attributed to the hydrostatic preloading applied before proportional loading in the laboratory experiments, which induced irreversible compaction that was not explicitly reproduced in the numerical model. Nevertheless, both results indicate that the low-deviatoric-stress path suppresses axial compaction.
Figure 12.
Stress-deformation contour maps under different injection pressures and axial-confining pressure ratios.
4.5. Mechanistic Interpretation of the Macroscopic Experimental Observations Based on Numerical Simulations
The numerical simulations not only reproduce the characteristic curves observed in the laboratory experiments at the macroscopic scale but also provide further insights into the underlying mechanical mechanisms from the perspective of multi-field coupling. The three-stage permeability evolution observed in the laboratory experiments with increasing confining pressure, characterized by “rapid decline–gradual decline–residual stabilization”, can be interpreted as corresponding to three successive processes: reduction in pore and microfracture apertures (effective stress-sensitive stage), elastic compaction of the rock matrix (constitutive response stage), and stabilization of residual pore spaces (skeletal densification stage). The experimental results indicate that strain is highly sensitive to injection pressure at low confining pressures, whereas deformation is predominantly controlled by confining pressure at high confining pressures. The simulated contour plots further indicate that, during the low-confining-pressure stage, variations in pore pressure can significantly affect local pore contact conditions, thereby amplifying the deformation response. In contrast, during the high-confining-pressure stage, progressive densification of the rock skeleton limits the influence of pore pressure, and confining pressure gradually becomes the dominant factor governing the overall deformation behavior.
In summary, the numerical simulations and laboratory experiments provide complementary validation through macroscopic responses and spatial field distributions. The developed multi-field coupled model can reproduce the main trends of sandstone seepage–deformation behavior under different stress paths and injection pressures within the investigated experimental conditions. However, the model represents a linear elastic porous medium and does not explicitly incorporate fracture structures or damage evolution. Furthermore, only single-phase SCCO2 flow was simulated, without accounting for SCCO2–brine two-phase flow or the effects of bound water in deep saline aquifers. Therefore, the quantitative relationships obtained in this study are applicable only to the short-term behavior of Liujiagou Formation sandstone within the investigated temperature, pressure, and stress-ratio ranges. Optimization of injection strategies at the field scale requires further evaluation integrating reservoir geological models and long-term monitoring data.
5. Conclusions
(1) Under different axial-to-confining pressure ratios and injection pressures, permeability exhibits a three-stage evolution pattern with increasing confining pressure, characterized by rapid decline, gradual decline, and stabilization, and shows a pronounced negative exponential relationship with effective stress. Within the investigated stress-path range, permeability under the η = 0.9 stress path is consistently higher than that under the η = 1.1 stress path.
(2) The negative exponential relationship between effective stress and permeability established from the experimental data enables the numerical model to reproduce the main trends of the measured permeability and volumetric strain within the investigated experimental conditions. The simulation results further reveal the spatial distribution characteristics of effective stress, porosity, and permeability within the sandstone specimens under different stress paths.
(3) The deformation behavior of sandstone under SCCO2 injection is significantly influenced by the stress path. In the laboratory experiments, the specimens generally exhibit volumetric compression, with radial compression typically exceeding axial compression. As injection pressure increases, both axial and radial deformations increase significantly. Under η = 0.9, the axial compression rate is markedly lower than that under η = 1.1. The numerical simulations further reveal fundamental differences in the deformation mechanisms associated with the two stress paths: the sandstone exhibits a tendency toward axial expansion under η = 0.9, whereas axial compression predominates under η = 1.1.
Author Contributions
Conceptualization, X.L. and R.L.; methodology, W.L., X.L. and R.L.; software, R.L.; validation, X.L., R.L., X.D. and X.Q.; formal analysis, X.L. and R.L.; investigation, X.Q., B.L. and J.L.; resources, B.L. and J.L.; data curation, Y.G., X.D. and X.Q.; writing—original draft preparation, X.L. and R.L.; writing—review and editing, W.L., Y.G., X.D., X.Q., B.L. and J.L.; visualization, X.L. and R.L.; supervision, Y.G., X.D. and X.Q.; project administration, W.L.; funding acquisition, X.L. and W.L. All authors have read and agreed to the published version of the manuscript.
Funding
This research was funded by the Deep Earth Probe and Mineral Resources Exploration-National Science and Technology Major Project of China, grant number 2024ZD1004200.
Data Availability Statement
The original contributions of this study are included in the article. Further inquiries can be directed to the corresponding author.
Acknowledgments
The authors gratefully acknowledge the experimental and computational resources provided by the Advanced Analysis & Computation Center at China University of Mining and Technology.
Conflicts of Interest
Authors Bin Li and Junxiao Li were employed by the Inner Mongolia Coal Geological Exploration (Group) No. 153 Co., Ltd. The remaining authors declare that the research was conducted in the absence of any commercial or financial relationships that could be construed as a potential conflict of interest.
Abbreviations
The following abbreviations are used in this manuscript:
| SCCO2 | Supercritical CO2 |
| η | Axial-to-confining pressure ratio |
| CCS | Carbon capture and storage |
| CI | Confidence interval |
| CV | Coefficient of variation |
References
- Osman, A.I.; Hefny, M.; Abdel Maksoud, M.I.A.; Elgarahy, A.M.; Rooney, D.W. Recent advances in carbon capture storage and utilisation technologies: A review. Environ. Chem. Lett. 2021, 19, 797–849. [Google Scholar] [CrossRef] [Scilit]
- Sang, S.; Liu, S.; Zhu, Q.; Han, S.; Zhang, S.; Tan, K.; Zhou, X.; Zheng, S.; Wang, X.; Liu, T. Research progress on technical basis of synergy between CO2 geological storage potential and energy resources. J. China Coal Soc. 2023, 48, 2700–2716. [Google Scholar]
- Hurlbert, M.; Osazuwa-Peters, M. Carbon capture and storage in Saskatchewan: An analysis of communicative practices in a contested technology. Renew. Sustain. Energy Rev. 2023, 173, 113104. [Google Scholar] [CrossRef] [Scilit]
- Li, W.; Cao, D.; Qiao, W.; Zhou, Z.; Chang, Q.; Zhang, S.; Liu, S.; Shen, Y.; Li, W.; Fu, X.; et al. Key technologies for exploration and geological evaluation of deep carbon storage spaces. J. China Coal Soc. 2025, 50, 2333–2354. [Google Scholar]
- Liu, D.; Li, Y.; Agarwal, R. Evaluation of CO2 Storage in a shale gas reservoir compared to a deep saline aquifer in the Ordos Basin of China. Energies 2020, 13, 3397. [Google Scholar] [CrossRef] [Scilit]
- Gunter, W.D.; Bachu, S.; Benson, S. The role of hydrogeological and geochemical trapping in sedimentary basins for secure geological storage of carbon dioxide. Geol. Soc. Lond. Spec. Publ. 2004, 233, 129–145. [Google Scholar] [CrossRef] [Scilit]
- Deng, Y.; Wang, Y.; Zhao, Y.; Gu, P.; Xiao, J.; Zhou, J.; Li, Z.; Yu, Z.; Peng, P. Carbon dioxide storage in China: Current status, main challenges, and future outlooks. Earth Sci. Front. 2023, 30, 429–439. [Google Scholar]
- Zhao, Y.; Yang, X.; Chen, X.; Chang, J.; Wei, H.; Liu, Z.; Liu, H. Advances in research on the policies, technologies, and demonstration projects of geologic CO2 sequestration in China. Coal Geol. Explor. 2025, 53, 49–63. [Google Scholar]
- Diao, Y.; Ma, X.; Li, X.; Zhang, C.; Liu, T. Evaluation methods of underground space utilization for CO2 geological storage in deep saline aquifers. Geol. Surv. China 2021, 8, 87–91. [Google Scholar]
- Birkholzer, J.T.; Oldenburg, C.M.; Zhou, Q. CO2 migration and pressure evolution in deep saline aquifers. Int. J. Greenh. Gas. Control 2015, 40, 203–220. [Google Scholar] [CrossRef] [Scilit]
- Vilarrasa, V.; Makhnenko, R.; Gheibi, S. Geomechanical analysis of the influence of CO2 injection location on fault stability. J. Rock Mech. Geotech. Eng. 2016, 8, 805–818. [Google Scholar] [CrossRef] [Scilit]
- Song, Y.; Jun, S.; Na, Y.; Kim, K.; Jang, Y.; Wang, J. Geomechanical challenges during geological CO2 storage: A review. Chem. Eng. J. 2023, 456, 140968. [Google Scholar] [CrossRef] [Scilit]
- Khan, S.; Khulief, Y.; Juanes, R.; Bashmal, S.; Usman, M.; Al-Shuhail, A. Geomechanical modeling of CO2 sequestration: A review focused on CO2 injection and monitoring. J. Environ. Chem. Eng. 2024, 12, 112847. [Google Scholar] [CrossRef] [Scilit]
- Sarris, E.; Gravanis, E. Flow regime analysis of the pressure build-up during CO2 injection in saturated porous rock formations. Energies 2019, 12, 2972. [Google Scholar] [CrossRef] [Scilit]
- Wang, X.; Yang, P.; Liang, B.; Sun, W.; Xu, J.; Wang, F.; Yang, X. Study on the thermal-flow-stress coupling effects of CO2 storage in deep saline aquifers based on an improved homogeneous model. J. China Univ. Min. Technol. 2025, 54, 399–412. [Google Scholar]
- Berrezueta, E.; González-Menéndez, L.; Breitner, D.; Luquot, L. Pore system changes during experimental CO2 injection into detritic rocks: Studies of potential storage rocks from some sedimentary basins of Spain. Int. J. Greenh. Gas. Control 2013, 17, 411–422. [Google Scholar] [CrossRef] [Scilit]
- Xie, J.; Wei, N.; Wu, L.; Zhang, K.; Xu, M. Progress in leakage study of geological CO2 storage. Rock Soil Mech. 2017, 38, 181–188. [Google Scholar]
- Zappone, A.; Rinaldi, A.P.; Grab, M.; Wenning, Q.C.; Roques, C.; Madonna, C.; Obermann, A.C.; Bernasconi, S.M.; Brennwald, M.S.; Kipfer, R.; et al. Fault sealing and caprock integrity for CO2 storage: An in situ injection experiment. Solid Earth 2021, 12, 319–343. [Google Scholar] [CrossRef] [Scilit]
- Cheng, Y.; Liu, W.; Xu, T.; Zhang, Y.; Zhang, X.; Xing, Y.; Feng, B.; Xia, Y. Seismicity induced by geological CO2 storage: A review. Earth-Sci. Rev. 2023, 239, 104369. [Google Scholar] [CrossRef] [Scilit]
- Yogendra Narayanan, S.; Singh, D.N. Geological storage of CO2 in deep saline sandstone aquifers: A geomechanical perspective. J. Rock Mech. Geotech. Eng. 2025, 17, 6054–6078. [Google Scholar] [CrossRef] [Scilit]
- Xie, M.; Wang, S.; Feng, S.; Xu, C.; Li, X.; Sun, X.; Ma, Y.; Gan, Q.; Wang, T. A Stability assessment of fault-caprock trapping systems for CO2 storage in saline aquifer layers using a coupled THMC model. Energies 2025, 18, 900. [Google Scholar] [CrossRef] [Scilit]
- Qi, S.; Zheng, B.; Wang, Z.; Zhao, H.; Cui, Z.; Huang, T.; Guo, S.; Fu, L.; Dong, P. Geological evaluation for the carbon dioxide geological utilization and storage (CGUS) site: A review. Sci. China Earth Sci. 2023, 66, 1917–1936. [Google Scholar] [CrossRef] [Scilit]
- Chen, B.; Li, Q.; Tan, Y.; Yu, T.; Li, X.; Li, X. Experimental measurements and characterization models of caprock breakthrough pressure for CO2 geological storage. Earth-Sci. Rev. 2024, 252, 104732. [Google Scholar] [CrossRef] [Scilit]
- Eyitayo, S.I.; Watson, M.C.; Ispas, I.; Kolawole, O. Geochemical interactions of supercritical CO2-brine-rock under varying injection strategies: Implications for mechanical integrity in aquifers. Rock Mech. Rock Eng. 2025, 58, 7181–7202. [Google Scholar] [CrossRef] [Scilit]
- Nooraiepour, M.; Polański, K.; Masoudi, M.; Kuczyński, S.; Derluyn, H.; Nogueira, L.P.; Bohloli, B.; Nagy, S.; Hellevang, H. Potential for 50% Mechanical Strength Decline in Sandstone Reservoirs Due to Salt Precipitation and CO2–Brine Interactions During Carbon Sequestration. Rock Mech. Rock Eng. 2025, 58, 1239–1269. [Google Scholar] [CrossRef] [Scilit]
- Luo, R. Experimental characteristics of stress-strain of tectonically deformed coal reservoirs in Huainan Mining Area and evaluation of their modifiability. China Univ. Min. Technol. 2025. [Google Scholar] [CrossRef]
- Wang, W.; Xu, W.; Wang, R.; Cao, Y.; Wang, H.; Feng, S. Permeability of dense rock under triaxial compression. Chin. J. Rock Mech. Eng. 2015, 34, 40–47. [Google Scholar]
- Chai, Z.; Wu, X.; Liu, X.; Liu, X.; Shen, Y.; Xin, Z. Study on mechanics and permeability evolution of sandy mudstone during full stress-strain loading. J. China Coal Soc. 2024, 49, 772–781. [Google Scholar]
- Teng, T.; Wang, W.; Shi, F.; Zhan, P. Experimental study of the seepage behavior of CO2 in raw coal under coupled pressures & temperature condition. J. China Univ. Min. Technol. 2019, 48, 760–767. [Google Scholar]
- Yao, H.; Liang, W.; Wei, J. Supercritical CO2 phase transition and permeability variation characteristic under coupling effect of temperature and confining stress. J. China Coal Soc. 2025, 50, 3566–3578. [Google Scholar]
- Wang, Q.; Yang, S.; Han, H.; Wang, L.; Qian, K.; Pang, J. Experimental Investigation on the Effects of CO2 Displacement Methods on Petrophysical Property Changes of Ultra-Low Permeability Sandstone Reservoirs Near Injection Wells. Energies 2019, 12, 327. [Google Scholar] [CrossRef] [Scilit]
- Walsh, J.B. Effect of pore pressure and confining pressure on fracture permeability. Int. J. Rock Mech. Min. Sci. Geomech. Abstr. 1981, 18, 429–435. [Google Scholar] [CrossRef] [Scilit]
- Shi, L.; Zeng, Z.; Bai, B.; Shi, H.; Xing, Y. Effect of the intermediate principal stress on the evolution of mudstone permeability under true triaxial compression. Greenh. Gases Sci. Technol. 2017, 7, 1064–1078. [Google Scholar] [CrossRef] [Scilit]
- Yu, B.; Zhang, D.; Xu, B.; Li, M.; Chao, L.; Xiao, W. Experimental study on the effective stress law and permeability of damaged sandstone under true triaxial stress. Int. J. Rock Mech. Min. Sci. 2022, 156, 105193. [Google Scholar] [CrossRef] [Scilit]
- Cheng, Y.; Guo, C.; Tan, C.; Chen, P.; Shi, H.; Xing, Y. Experimental analysis and deliverability calculation of abnormally pressured carbonate gas reservoir considering stress sensitivity. J. Pet. Explor. Prod. Technol. 2022, 12, 3105–3115. [Google Scholar] [CrossRef] [Scilit]
- Connell, L.D. A new interpretation of the response of coal permeability to changes in pore pressure, stress and matrix shrinkage. Int. J. Coal Geol. 2016, 162, 169–182. [Google Scholar] [CrossRef] [Scilit]
- Takahashi, M.; Park, H.; Takahashi, N.; Fujii, Y. True triaxial tests—Using permeability and extensional stress parameters to simulate geological history in rocks. Geosystem Eng. 2013, 16, 75–82. [Google Scholar] [CrossRef] [Scilit]
- Gao, Y.; Lin, L.; Yin, S.; Hu, G.; Ma, R. Characteristics of in situ stress of tight oil reservoirs and its influence on petrophysical properties, a case study of Upper Triassic Yanchang Formation in Ordos Basin. Pet. Geol. Exp. 2021, 43, 250–258. [Google Scholar]
- Zhang, J.; Chen, J.; Lei, J.; Xiong, J.; Nie, X.; Gong, D.; Ning, P.; Shi, R. Kaiser acoustic emission ground stress testing study on shale oil reservoir in Y block of Ordos basin, China. Sci. Rep. 2025, 15, 12038. [Google Scholar] [CrossRef] [Scilit]

Disclaimer/Publisher’s Note: The statements, opinions and data contained in all publications are solely those of the individual author(s) and contributor(s) and not of MDPI and/or the editor(s). MDPI and/or the editor(s) disclaim responsibility for any injury to people or property resulting from any ideas, methods, instructions or products referred to in the content. |
© 2026 by the authors. Licensee MDPI, Basel, Switzerland. This article is an open access article distributed under the terms and conditions of the Creative Commons Attribution (CC BY) license.