


Abstract
Offshore wind turbine installation vessel (WTIV) accidents have remained frequent, and the long-standing gap between documented safety management system (SMS) files and on-site operations remains unresolved. Existing knowledge graph (KG)-based safety research concentrates heavily on subway and building construction, leaving the WTIV domain largely unexplored. This study constructs a safety risk knowledge graph comprising 266 nodes and 440 edges, using 92 Likelihood–Exposure–Consequence (LEC) risk records and seven accident cases as knowledge sources. Three reasoning modes (multi-hop associative query, LEC coupling inference, and topological analysis) are implemented. The LEC coupling inference relaxes the traditional three-factor independence assumption by using cascading-failure evidence chains from accidents; it provides a formal definition of the coupling coefficient α and five trigger conditions C1–C5, with the resulting coefficients reported as expert-informed and exploratory in status. The KG is embedded into a three-layer LR-PDCA (Leadership–Responsibility–Plan–Do–Check–Act) framework at the document, process, and institutional levels, mapping reasoning outputs to six management processes. Validation at a real-world site shows that the inferred paths match the causal chains of three typical accidents and that the three-layer embedding maps operably onto the case Company’s SMS document structure; quantitative effectiveness metrics and a blinded expert evaluation are specified as a deployment-phase protocol rather than reported as verified results. The generalizability of C-layer rules is constrained by the limited accident sample, and long-term verification using accident rate data remains for future work.
1. Introduction
1.1. Research Background and Problem Statement
In July 2021, the converted self-elevating platform Shengping 001 suffered a leg punch-through during a spudcan penetration operation in the Huizhou waters; the hull subsequently tilted and foundered, causing one fatality and three missing (four casualties). In July 2022, the floating crane vessel Fujing 001 dragged anchor during Typhoon Chaba and subsequently broke apart, resulting in 25 fatalities and one missing (26 casualties). The investigation reports of the two accidents jointly reveal a structural deficiency: the safety management system (SMS) remained at the level of paper documentation, risk identification relied on manual consultation of manuals, and dynamically evolving risks arising from multi-factor coupling could not be perceived during operations. According to statistics compiled for this study, 12 typical accidents occurred in China’s offshore wind power construction sector between 2016 and 2022, of which lifting errors, leg punch-through, and anchor dragging with chain breakage together accounted for more than 60%. The “two-track” phenomenon of the SMS, namely the detachment of institutional documents from field operations, is not an isolated case but an industry-wide condition.
Research on intelligent safety for offshore wind power is notably unbalanced. Yu et al. [1] combined AIS data with a Bayesian network to compute ship collision risk in the vicinity of offshore wind farms; the object of computation, however, was vessels passing by, not vessels installing wind turbines. The SVR-DBN dynamic risk model of Han et al. [2] targeted the degradation of safety-critical equipment on offshore installations, one layer removed from construction operations. Xia et al. [3] reviewed the application of digital twins in the operation and maintenance phase of offshore wind farms and explicitly noted that the technology has not yet extended to construction and installation. Li et al. [4] constructed a CNN–LSTM–Attention model to predict the structural-failure probability of wind turbines; the training data originated from sensors on the turbine itself, and risk data from installation-vessel construction operations were absent from the training set. The risk objects of the above studies are all concentrated on turbine structures or passing vessels, whereas intelligent safety management research targeting the construction and installation operations of WTIVs remains scarce.
1.2. Related Work and Research Entry Point
The core advantages of knowledge graphs in construction safety lie in their structured knowledge representation and multi-hop reasoning capability. Huo et al. [5] built a knowledge graph from 231 subway accident reports and identified hazard coupling relations through topological indicators; their reasoning, however, was confined to retrospective analysis and did not address dynamic risk assessment. Wu et al. [6] combined a knowledge graph with a Bayesian network and achieved collapse-accident probability prediction using 1164 construction accident records; the data-driven pathway of their KG-BN framework is methodologically instructive. Its transferability to the WTIV domain is nevertheless limited: publicly available accident cases in this sector number only in the dozens, and directly applying large-sample statistical methods faces the hard constraint of insufficient priors. Hong et al. [7] and Wang et al. [8] employed NLP techniques to extract ontologies from building construction and railway accident texts, respectively, and built weighted graph databases supporting accident tracking and hazard association analysis, thereby verifying the feasibility of the “accident cases → causal triples → graph reasoning” technical route under small-sample conditions.
These KG-based safety studies share a common limitation: they remain “risk analysis tools” and have not been interfaced with the institutional carrier of safety management. The LLM + KG multi-agent system developed by Speiser et al. [9] automates the generation of risk assessment documents, yet the documents are not embedded into a PDCA cycle, so reasoning and institutions remain disconnected. Johansen et al. [10] proposed a cross-domain knowledge utilization framework and attempted integration with a digital twin; however, how knowledge query results feed back into the Plan–Do–Check–Act cycle is not given an operational definition in their framework.
1.3. Research Objectives and Contributions
Taking 92 LEC risk assessment records and seven accident cases as the basis, this study constructs a safety risk knowledge graph for WTIVs, proposes an LEC factor-coupling inference method (including a formal definition of trigger conditions and of the coupling coefficient α), and designs a three-layer mechanism for embedding the knowledge graph into the LR-PDCA inherent safety management system. The main work comprises: (1) constructing a knowledge graph for the WTIV safety domain that covers 13 categories of construction projects, 4 types of risk factors, and 11 types of consequences, filling the KG research gap in this vertical domain; (2) proposing LEC coupling inference rules that transcend the three-factor independence assumption of the traditional LEC method, demonstrating the nonlinear amplification effect among L, E, and C with accident-case evidence chains, and providing the formal definition of α together with trigger thresholds; and (3) defining the interface specification between the knowledge graph and the LR-PDCA system, achieving three-layer embedding at the document, process, and institution levels, and connecting the complete chain from knowledge reasoning to system operation. Limited by the accident sample size of the WTIV industry, the generalizability of the inference rules still requires continuous validation with subsequent data.
2. Theoretical Foundations and Research Framework
2.1. Inherent Safety Management System and the LR-PDCA Operating Model
The concept of inherent safety has undergone three developmental stages. In 1977, Kletz introduced it into the chemical industry, where it initially referred only to the accident-prevention functions inherent in equipment itself. The concept subsequently expanded to the “human–machine–environment” system level and then ascended to the enterprise-wide level, requiring safety, reliability, and unity across people, materials, and institutions. Safety management theory evolved in parallel: from passive post-accident investigation to institution building and accountability, to hierarchical risk control, and finally to active prevention. Each later stage does not negate the previous one but incorporates it into a broader framework.
LR-PDCA prepends L (Leadership) and R (Responsibility) to the Deming cycle. Sklad [11] simulated the 16 processes of occupational safety and health management using fuzzy cognitive maps and found that the leadership process exerts the strongest positive pull on SMS effectiveness, providing quantitative support for the necessity of placing L first. da Silva and Amaral [12] reviewed 21 studies on OHSMS implementation and identified leadership commitment and top-management involvement as the foremost success factors, while the detachment of institutional documents from field operations was the most frequently reported cross-industry barrier. Kim et al. [13] conducted PLS-SEM analysis on 349 Singaporean construction enterprises and showed that the interactions of safety incentives, subcontractor participation, and safety accountability with the SMS have a statistically significant positive effect on safety performance. The L end aligns safety awareness through leadership, and the R end delineates the responsibilities of all personnel through structure and accountability; together, the two ends energize PDCA. An offshore engineering company has applied this model in its SMS construction and obtained Document of Compliance (DOC) certification.
Viewed from the four theoretical stages of inherent safety management: in the risk-theory stage, hierarchical control has been achieved, yet risk identification and measure matching still depend on manual experience, and the automation of the “identification–control” chain is insufficient, which is the root cause of the SMS “two-track” problem. Knowledge graphs are computable and capable of inference, and the “active prevention” pursued in the inherent-theory stage requires exactly such a computable, structured knowledge representation: multi-hop reasoning automatically links risks scattered across manual chapters, topological analysis identifies critical nodes missed in manual review, and coupling inference transcends the LEC three-factor independence assumption; these three capabilities directly address the reliance on manual experience in the risk-theory stage. In LR-PDCA, leadership decision-making in the L phase and responsibility-matrix construction in the R phase respectively require “critical risk prioritization” and “cross-post risk clustering” as KG reasoning outputs; the KG therefore functions as an integrated component within each phase of the SMS rather than as an external tool. In this paper, “inherent safety” is used in this expanded management-system sense, the stage at which safety is pursued through the integration of people, materials, and institutions, rather than in the classical process-design sense of hazard elimination through equipment design. The knowledge graph supplies the computable risk knowledge that this managerial stage currently lacks. The review of inherently safer design methods by Gao et al. [14] likewise points out that the combination of knowledge engineering and inherent safety management is a gap in the fourth-stage technical route.
2.2. Research Progress of Knowledge Graphs in Safety Risk Management
Classified by knowledge source and objective, KGs are used in three ways in safety risk management. At the accident-analysis layer, historical accident reports serve as raw material for retrospective causal backtracking. Huo et al. [5] built a KG from 231 subway construction accident reports and identified hazard coupling mechanisms via topological indicators, but stopped at post hoc attribution without touching prospective risk assessment. The risk-assessment layer follows a data-driven route toward predictive probabilistic inference. Wu et al. [6] encoded 1164 construction accident records into a multi-level KG that drives Bayesian network structure learning, achieving collapse-accident probability prediction while minimizing dependence on subjective priors. A sample of 1164 records cannot be replicated in the WTIV domain, where publicly available accident cases number only in the dozens. Hong et al. [7] and Wang et al. [8] extracted ontologies from building construction and railway accident texts using NLP and built graph databases, verifying the engineering feasibility of the “accident text → causal triples → graph reasoning” pathway under small-sample conditions.
The management-decision layer is the frontier, and it is also where the gaps are most concentrated. The LLM + KG multi-agent system of Speiser et al. [9] writes risk assessment documents automatically, and the cross-domain framework of Johansen et al. [10] is connected to a digital twin. Both face the same key question: how can KG reasoning results be effectively embedded into the PDCA cycle? At present, no operational definition exists, and no operational interface between reasoning outputs and institutional inputs has been defined.
2.3. Research Framework and Technical Route
Accordingly, a five-layer framework of “data–knowledge–reasoning–embedding–validation” is constructed (Figure 1). The data layer takes 92 LEC risk assessment records (covering 13 construction project categories, 4 risk factor types, and 11 consequence types) and 7 typical accident cases as knowledge sources, supplemented by provisions of regulations and standards such as the NSM Code [15] and Circular No. 9 [16]. The knowledge layer uses a domain ontology to unify the three types of knowledge sources into entities and relations of a graph database. The reasoning layer opens three routes: multi-hop query, LEC coupling inference, and topological analysis; LEC coupling inference uses the evidence chains of multi-factor cascading failures in accidents to transcend the three-factor independence assumption (elaborated in Section 3.4). The embedding layer interfaces KG reasoning outputs with the six LR-PDCA processes through three-layer embedding at the document, process, and institution levels. The validation layer takes an offshore engineering scenario as a case and performs limited validation through reasoning-path back-testing against three accident scenarios, operability testing of SMS embedding; the quantitative process metrics and the blinded expert evaluation are specified as a deployment-phase protocol (Section 5.4).
Figure 1.
Five-layer research framework: data–knowledge–reasoning–embedding–validation.
Two limitations must be declared here. First, the Layer-C inference rules extracted from seven accident cases have limited generalizability; this is mitigated through A-B-C three-layer rule stratification (regulations → statistics → cases) and a confidence annotation mechanism, but final resolution depends on continued data accumulation. Second, the causal chain from “embedding” to “effectiveness” requires long-term empirical evidence; within the timeframe of this paper, process metrics and expert judgment serve as indirect evidence, and no claim of a verified accident-rate reduction is made.
3. Construction of the Safety Risk Knowledge Graph for WTIVs
3.1. Data Sources and Knowledge Source Stratification Strategy
The reasoning quality of a knowledge graph is constrained by the coverage of its knowledge sources and the generalizability of its rules. The three types of knowledge sources differ considerably in data structure, confidence level, and industry adaptability. The 92 LEC risk records cover 13 construction project categories: onshore management, maritime transportation, vessel navigation, vessel positioning, offshore construction, hot work, lifting operations, work at height overboard, underwater operations, monopile foundation construction, wind turbine installation, blade assembly, and booster station construction. Each record contains seven fields: construction project, work activity, principal risks, risk classification, consequence, L/E/C/D values, and risk level; these are structured data originating from frontline construction sites. The seven typical accident cases were selected from an initial pool of 12 candidate accidents compiled from official investigation reports and publicly documented investigation findings (by China MSA, the US NTSB, the Norwegian NOU commission of inquiry, the Danish DMAIB, the German investigating authorities, and the shipyard’s public statements, respectively). The selection criteria were: (a) the availability of a complete official investigation report with structured “direct cause–indirect cause–lessons learned” sections; (b) the accident type covering one of the three major WTIV risk categories (leg/pile failure, lifting/crane failure, or storm/anchor failure); (c) the vessel type being a self-elevating platform, a wind turbine installation vessel, or a comparable offshore construction vessel; and (d) the accident occurring between 1980 and 2024 to span different regulatory eras. Five cases were excluded: two because the investigation reports lacked structured causal analysis, and three because the accident type duplicated an already-selected case without adding new causal patterns. The seven selected cases comprise two domestic cases (the Shengping 001 leg punch-through [17] and the Fujing 001 anchor dragging and chain breakage [18]) and five overseas cases (the Alexander Kielland leg fracture [19], the Orion 1 crane boom fracture [20], the Seacor Power storm capsizing [21], the Brave Tern collision [22], and the Sea Worker towline breakage [23]). The domestic cases are directly relevant to the Chinese WTIV regulatory context; the overseas cases provide causal patterns from more mature regulatory regimes and different vessel designs. The transferability of overseas case rules to the Chinese context is discussed in Section 4.3. Each case contains a structured analytical text covering the accident course, direct causes, indirect causes, accountability, and lessons learned, and is therefore semi-structured text.
The sample of seven accidents is limited. The subway construction KG of Huo et al. [5] used 231 accident reports, and the KG-BN framework of Wu et al. [6] relied on 1164 accident records. Extracting inference rules directly from seven cases and injecting them into the graph would carry an extremely high risk of overfitting. An A-B-C three-layer rule stratification strategy is therefore designed. Layer A (regulations and standards layer; highest generalizability) extracts mandatory safety management rules from regulatory provisions, e.g., “mobile platforms of 500 gross tonnage and above shall establish an SMS” (SOLAS Convention, Chapter IX [24]); such rules do not depend on accident samples and exhibit the strongest generalizability. Layer B (statistical regularities layer; medium generalizability) extracts statistical regularities from the 92 LEC records, e.g., “In lifting operations, management factors leading to lifting injuries carry the highest D value (D = 266, Level-II risk)”; such rules are based on the statistical distribution of frontline data. Layer C (case-specific causation layer; lowest generalizability but highest specificity) extracts causal triples from the seven accident cases, e.g., “inadequate geological survey → leg punch-through → platform tilting and foundering” (Shengping 001). During reasoning, rules are invoked in the priority order A → B → C, and each rule is annotated with its source layer and confidence. Table 1 presents the knowledge source stratification and inference rule attributes.
Table 1.
Knowledge source stratification and inference rule attributes.
3.2. Domain Ontology Design
Ontology design delimits the expressive boundary of the graph. The systematic review of construction safety KGs by Kong and Ahn [25] identifies three core tasks in ontology modeling: scope identification, external data integration, and conceptual hierarchy construction. This study adopts a hybrid top-down and bottom-up strategy: the top-level class structure is predefined by domain experts following the methodology of Staab and Studer [26], according to the four-factor classification of the LEC method and the six-tier SMS document architecture; bottom-level attributes and instances are extracted bottom-up from the 92 LEC records and 7 accident cases, ensuring that the ontology matches the actual data. Compared with general industrial ontologies such as ISO 15926 [27], the present ontology focuses on the vertical scenario of WTIV construction safety: its class hierarchy is narrower but its attributes are finer, and the RiskSource class directly maps the LEC parameters (L, E, C, D, riskLevel), supporting numeric range queries, which general safety ontologies cannot do.
The risk classification system is designed as a multi-level class hierarchy. Under the root class SafetyRiskEntity are seven subclasses: RiskSource, WorkActivity, Consequence, ControlMeasure, MiddleEvent, AccidentCase, and Regulation. Intermediate events in case causal chains (e.g., spudcan punch-through, platform inclination) are typed as MiddleEvent, and the seven investigated accidents are typed as AccidentCase, so that causesEvent, hasFactor, resultsIn, and triggersImprovement relations connect explicitly typed nodes rather than overloading the Consequence class; one instance-level exception to this typing is retained and is disclosed below and in Section 6.2. RiskSource is subdivided into HumanFactor, PhysicalFactor, ManagementFactor, and EnvironmentalFactor, corresponding to the four risk factor categories of the LEC method. WorkActivity has 13 subclasses corresponding to the 13 construction project categories, each further subdivided into specific activities; for example, MonopileFoundation comprises eight activities: pile driving, pile lifting, aloft pile-release work, the lifting process, pile-stabilizing platform erection, pile upending and insertion, auxiliary pile extraction, and pile hammering. Consequences have 11 subclasses: drowning, electric shock, fire, falls from height, lifting injury, mechanical injury, struck-by object, container explosion, poisoning and asphyxiation, vehicle injury, and other injuries.
The attribute system comprises two categories. Among data properties, RiskSource carries five items (L, E, C, D, and riskLevel), directly mapping the LEC parameters and supporting attribute range queries such as “which work activities are involved in all Level-II risks with D ≥ 266.” Among object properties, WorkActivity is assigned activityName, activityLocation, and equipmentInvolved. Ten relation types are defined (Figure 2): involves (WorkActivity → RiskSource), leadsTo (RiskSource → Consequence), mitigates (ControlMeasure → RiskSource), coupledWith (RiskSource ↔ RiskSource, LEC coupling relation), causesEvent (RiskSource/MiddleEvent → MiddleEvent, links within case causal chains), hasFactor (AccidentCase → RiskSource, assigning case-contributing factors), resultsIn (AccidentCase → MiddleEvent, recording the terminal casualty outcome of a case; all seven cases terminate at the shared casualty node), regulatesBy (ControlMeasure → Regulation), similarTo (RiskSource ↔ RiskSource, cross-case mechanistic analogy), and triggersImprovement (ControlMeasure → AccidentCase, recording that the accident investigation triggered the improvement measure incorporated into the SMS). The coupledWith relation is an original design of this study. The traditional LEC method assumes that the L, E, and C factors are independent, but accident cases demonstrate otherwise. In the Fujing 001 accident, the typhoon (an environmental factor, raising L) induced panic-driven operational errors (a human factor, degrading the E condition), and the consequences were aggravated because the life rafts had been sent away for inspection (increasing C); the three factors thus formed a cascading amplification. The coupledWith relation explicitly encodes such nonlinear interlinkage. The cardinality constraints of the ten relation types are as follows: one WorkActivity may be associated with 1–3 RiskSources (involves, 1..3); one RiskSource may lead to 1–2 Consequences (leadsTo, 1..2); one RiskSource may be mitigated by 1–5 ControlMeasures (mitigates, 1..5); and coupledWith is symmetric, with each RiskSource participating in at most two coupledWith relations (0..2). The case-encoding relations (hasFactor, resultsIn) attach each accident case to its contributing factors and its final outcome. Two implementation deviations from these definitions are disclosed here rather than only in the limitations. First, one hasFactor relation targets an intermediate event rather than a RiskSource node, because the source investigation attributes the contributing factor at that point of the causal chain; the edge is retained pending verification against the original investigation report. Second, all seven resultsIn relations terminate at a single shared casualty node typed as MiddleEvent rather than Consequence, because the seven cases converge on the same terminal outcome; a shared node avoids seven duplicate Consequence instances and keeps the reported counts traceable. Both deviations are confined to the Layer-C case layer, do not affect the Layer-A and Layer-B inference rules, and are recorded in Section 6.2.
Figure 2.
Class hierarchy and relation types of the domain ontology.
3.3. Knowledge Extraction and Graph Instantiation
The 92 LEC records are highly structured and can be mapped directly into graph nodes and edges. Each LEC record contributes one work-activity association, one-to-three risk-source mentions, one consequence mapping, and one control-measure entry, with the L/E/C/D values and risk level of each assessment attached to its record-anchored leadsTo edge, ensuring one-to-one traceability between the 92 assessments and the graph. The records are distinct at the activity–project level (no two records describe the identical activity under the same project), whereas same-type activities across projects are merged during instantiation: the 92 records collectively generate 73 WorkActivity nodes, 111 construction-layer RiskSource nodes (deduplicated from 195 activity–risk association edges), 11 Consequence nodes (from 92 record-level consequence mappings), and 16 ControlMeasure nodes (the measure entries of the 88 records with valid assessments are normalized into control-hierarchy and standard-based control nodes; the four records with invalid D values are excluded and disclosed in the limitations section).
NLP extraction from accident cases requires customization. Song et al. [28] employed a BERT pretrained model with a BiLSTM-CRF architecture to identify named entities from 1000 building construction accident reports, achieving an F1 score of 0.87 in the construction domain. Pedro et al. [29] used linked data and ontology techniques to automatically map 200 accident cases into a knowledge graph, realizing structured cross-case comparison of causal chains. The seven accident cases in this study are far fewer than in the above literature, but each case contains a complete “direct cause–indirect cause–management recommendation” structured analytical text, which suits a “semi-automatic” strategy: domain experts first manually annotate causal triples according to the ontology schema, and a rule engine then verifies consistency and completeness. The annotation procedure was as follows. Two domain experts (one with 15 years of offshore construction safety experience and ISM Code auditor certification; the other with 10 years of marine engineering research experience) independently annotated causal triples from the seven accident investigation reports according to a predefined annotation guideline. The guidelines specified: (a) the ontology schema to use (Section 3.2); (b) the definition of each relation type; (c) the requirement that each triple must be traceable to a specific sentence in the investigation report; and (d) the assignment of L, E, and C values for coupledWith relations based on the accident-specific context. After independent annotation, the two experts cross-checked each other’s triples; disagreements were resolved through discussion, and unresolved items were adjudicated by a third senior expert. All relations remain traceable to specific sentences of the corresponding investigation reports; disagreements between the annotators, primarily on the boundary between coupledWith and causesEvent (whether a risk factor “amplified” or “directly caused” another), were resolved through discussion with reference to the source text. Agreement statistics from the annotation round were not retained and are therefore not reported. From the seven cases, the following relations were extracted: 28 causesEvent, 12 triggersImprovement, 11 hasFactor, 7 resultsIn, 3 coupledWith, and 2 similarTo, each traceable to the corresponding investigation report. Candidate coupling pairs identified during annotation were screened against the five criteria of Section 3.4: only E1, E3, and E4 were established as coupledWith edges; the rejected candidate E2 (failing the joint-identification criterion C5) was retained as a hypothesized chain, and cross-case mechanistic analogies were represented by similarTo edges instead. The established coupledWith relations constitute the core knowledge input for LEC coupling inference (Section 3.4). A representative causal chain is “complex seabed geology (RiskSource) → spudcan punch-through (MiddleEvent) → platform inclination (MiddleEvent) → personnel casualties (Consequence)” (Shengping 001; Layer-C rule; status = established; traceable to the official investigation report [17]).
Eighteen regulation and standard documents (including the NSM Code [15], Circular No. 9 [16], GB/T 33000-2016 [30], the offshore construction risk-control provisions of DNV-OS-H101 [31], and the ISM Code [32] requirements for SMS operation) were incorporated as Layer-A nodes. In the present version, regulatesBy edges link the two case-improvement measures that explicitly cite DNV-OS-H101 and the ISM Code to their governing standards; the remaining 16 regulation nodes are not yet connected to the measure layer, which is disclosed as a regulation-coverage limitation (see the limitations section).
The final graph comprises 266 entity nodes (73 WorkActivity, 122 RiskSource, 11 Consequence, 16 ControlMeasure, 19 MiddleEvent, 7 AccidentCase, and 18 Regulation) and 440 relation edges (195 involves, 92 leadsTo, 88 mitigates, 28 causesEvent, 12 triggersImprovement, 11 hasFactor, 7 resultsIn, 3 coupledWith, 2 similarTo, and 2 regulatesBy), with an average degree of 3.31. The graph decomposes into 18 connected components: the two largest components (the Layer-B operational core, 199 nodes, and the Layer-C case-chain core, 51 nodes, including two regulation standards attached via regulatesBy edges) jointly cover 94.0% of the nodes and support multi-hop traversal within each core, while the remaining 16 regulation-standard nodes are isolated, which is disclosed as a coverage limitation (see the limitations section). Table 2 reconciles the entity and relation counts with their generation rules.
Table 2.
Reconciliation of entity and relation counts.
Figure 3 shows the two-hop neighborhood of the pile-sinking operation. The operation anchors involved edges → involves edges (pile running, RS-084, D = 300, the highest within the operation; and hot-work violations in dangerous areas, RS-066, D = 90), each leading via leadsTo to its consequence (mechanical injury, CS-005; fire, CS-002), with both risks mitigated by post-level control (CM-004, mitigates). Hot-work management (WA-045) shares RS-066; work at height (WA-071) shares RS-084 through their own involves edges, illustrating that a single risk node is shared across activities, which tabular LEC sheets do not expose.
Figure 3.
Two-hop neighborhood of the pile-sinking operation (WA-056, gold star).
3.4. Risk Association Reasoning Engine Design
The reasoning engine comprises three routes, each addressing one class of safety question (Figure 4). Multi-hop queries use Cypher to traverse cross-process and cross-category risk chains. A typical query is “which WorkActivity → involves → Typhoon (EnvironmentalFactor); the same WorkActivity → involves → which RiskSource → leadsTo → which Consequence.” Taking the Fujing 001 accident as the validation scenario, when the “risk chain of anchor-dragging operations under typhoon influence” is input, the KG returns the reasoning paths through the multi-hop route, including “typhoon → anchor dragging → anchor-chain fracture → hull capsizing → casualties,” which are highly consistent with the causal chain established by the official investigation. This mode addresses a limitation of manual practice: safety officers cannot readily identify cross-process indirect risk transmission when consulting manuals. A “typhoon” affects not only the anchoring operation of its own case but also propagates, through the similarTo anchor, to the severe-storm chains of another case (“operation beyond limits → loss of stability → rapid capsizing”), and chained reasoning beyond four hops cannot be realized by Excel filtering. An example Cypher query is as follows:
Figure 4.
Architecture of the reasoning engine.
- MATCH (w: WorkActivity)→[involves] → (e: EnvironmentalFactor {name: “Typhoon”})
- MATCH (w) → [involves] → (r: RiskSource)-[leadsTo] → (c: Consequence)
- RETURN w.activityName, r.riskName, c.consequenceType
- ORDER BY r.D DESC LIMIT 10
LEC coupling inference is the principal methodological contribution of this study. The systematic review by Zhang et al. [33] shows that the causal chain “environmental stressors → increased operator cognitive load → elevated probability of operational error” in human reliability analysis (HRA) has gained empirical support, which provides a theoretical basis for the non-independence of the LEC factors. The improvement work on the LEC method by Jin et al. [34] likewise pointed out that treating the three factors as independent variables is an obvious defect, but gave no mathematical expression of inter-factor coupling. Building on this, the present study provides the formal definition of the coupledWith inference rules.
Definition 1
(coupledWith trigger conditions). A coupledWith relation is created between and , i.e., (A)-[coupledWith] → (B), when all of the following operational criteria are satisfied:
(C1) A.activity = B.activity/the same work activity. Condition C1 restricts coupledWith to risks within the same work activity. Cross-activity risk propagation (discussed in the context of typhoon effects on anchoring, collision, and evacuation) is represented not by coupledWith but by the similarTo relation (cross-process association) and multi-hop query chains (Section 3.4, multi-hop route). This design separates two distinct concepts: intra-activity factor coupling (coupledWith, where two risk factors within the same activity amplify each other) and inter-activity risk propagation (similarTo + multi-hop, where a risk in one activity triggers or parallels a risk in another).
(C2) A.category ≠ B.category/different risk factor categories (human/machine/environment/management).
(C3) |A.L − B.L|/max (A.L, B.L) ≤ θ1/proximity threshold on L values, θ1 = 0.4. The threshold was set by the annotation experts at 0.4, reflecting the requirement that coupled risks share comparable likelihood levels; it is applied uniformly to all candidate pairs, with no case-specific relaxation (see the Shengping 001 illustration below).
(C4) A. D ≥ 45 OR B. D ≥ 45/at least one risk at the upper bound of Level IV or above. D = 45 is the midpoint of the Level IV interval (20 ≤ D < 70) in the LEC grading scale; this threshold excludes lower-severity Level IV risks (D = 20–44) from coupling consideration, as their coupling amplification potential is limited.
(C5) accident\_evidence(A, B) ≠ ∅/cascading evidence exists in accident cases.
Definition 2
(coupling coefficient α). When the coupledWith trigger conditions are satisfied, the coupling coefficient α is defined as
where c(A, B) ∈ [0, 1] is the coupling evidence strength, assigned by the annotation experts according to a documented scale reflecting the evidential support for the joint contribution of the two factors in the accident record: c = 0.4 for factor pairs documented as contributing factors without established joint causation; c = 0.6 for pairs whose joint contribution to the initiating event is established by the official investigation report; c = 0.8 for coupling patterns documented in two or more independent accident cases; and c = 1.0 for pairs with quantified joint causation, such as AND-gate minimal cut sets in fault-tree analyses of the accident. α > 1 indicates positive coupling between two risk factors, and the larger the α value, the stronger the coupling effect; α = 1 indicates no coupling effect. The α values derived from this scale are illustrative applications of the rule set rather than independent estimates of risk amplification, and they carry no calibrated uncertainty (Section 6.2).
Setting of β. β is treated as an exploratory, expert-informed parameter rather than a statistically calibrated estimate. The coupledWith relations extracted from the seven accident cases are clustered within accidents (several relations per case) and are therefore not statistically independent, and the investigation reports do not quantify the per-relation consequence amplification that a formal regression would require; attaching inferential statistics to β under these conditions would overstate the evidential basis of the calibration. The two annotation experts jointly set β = 0.34 on the basis of the amplification patterns documented across the seven accident cases, so that the resulting coefficients (α = 1.20 at the evidence strength c = 0.6) remain consistent with the order of magnitude of multi-factor aggravation described in the investigation reports. Because of its exploratory status, a sensitivity analysis over the plausible range β ∈ [0.1, 0.6] is reported in Section 6.2; the qualitative conclusion (positive coupling amplification, α > 1) holds throughout this range.
Exclusion of C. The consequence severity factor C is excluded from the coupling equation because coupling operates on the causal side (likelihood and exposure), not on the outcome side. In the cascading-failure model, L and E of one risk factor influence the L and E of another; C is the resulting consequence whose magnitude is itself the output of the coupling, not an input to it. Including C would conflate cause and effect in the amplification loop. This design choice is empirically supported by dual-assessment LEC data (inherent risk vs. controlled risk) from a vessel-operation risk control list covering five operational units of a tug, navigation, tug-assist berthing, other key operations, maintenance, and occupational safety, totaling 74 records, all of which pass formula-level consistency checks (D = L × E × C) and risk-banding checks. Control measures reduced L in 56 of the 74 records (46 from 6 to 3, 9 from 10 to 3, and 1 from 3 to 1, i.e., a 50–70% reduction where applied) and C in 18 records where inherent severity was high (12 from 15 to 7, 4 from 7 to 2, 1 from 40 to 7, and 1 from 2 to 1), while E remained unchanged in 70 of 74 records (94.6%). The four E reductions all occur where the control measures alter the work process itself, three in navigation activities (voyage planning and berth approach, E from 2–10 to 1–6) and one in the inspection routine of the emergency fire pump (E from 3 to 2), consistent with E being a property of the work process rather than of the measures. The mean D value fell by 67% (from 86.7 to 28.3); all 36 elevated-risk records (D ≥ 70) were reduced to the low-risk band (maximum controlled D = 60), and the 16 records with unchanged scores were all already in the low-risk band. Exposure frequency is thus determined by the work process rather than by control measures. This pattern confirms that coupling dynamics operate through L (and secondarily E), not through C.
Limitations. The coupledWith relations originate from only seven accident cases, with several relations per case, and the relations within a case cannot be assumed statistically independent. No inferential statistics are therefore attached to the coupling coefficients: α should be interpreted as a structured expert judgment anchored in documented investigation findings rather than as a calibrated estimate. As accident cases accumulate, the evidence-strength assignments and the β setting can be re-examined; if sufficiently diverse data become available, formal calibration that accounts for accident-level clustering (for example, cluster-robust or mixed-effects estimation) is the appropriate next step.
Definition 3
(inference rule set). The coupled inference logic is expressed in the form of production rules:
RULE coupledWith_trigger:
- IF (C1) ∧ (C2) ∧ (C3) ∧ (C4) ∧ (C5)
- THEN CREATE (A)-[coupledWith {α: α(A, B), confidence: C_layer}]->(B)
- PRIORITY: Layer A > Layer B > Layer C
- CONFLICT: if A satisfies the trigger conditions with both B and C, take the
- larger of α(A, B) and α(A, C)
- RULE coupledWith_amplification:
- IF (A)-[coupledWith {α: α_val}]->(B) AND A. L is raised by ΔL
- CONSTRAINT: The adjusted B.L. shall not exceed the LEC scale maximum (L = 10).
Taking Shengping 001 as an example: complex seabed geology (EnvironmentalFactor, L = 6) is coupled with improper preloading control procedure (ManagementFactor, L = 6). The L-value proximity |6 − 6|/6 = 0 satisfies C3; the case-context D values of both factors equal 720 (Table 3), satisfying C4; and the investigation report explicitly identifies the two factors as jointly causing the punch-through (C5). Because the joint contribution is established by the official investigation but has not been quantified by a fault-tree or equivalent analysis, this pair belongs to the c = 0.6 tier of the evidence-strength scale, and the coupling coefficient is α = 1 + 0.34 × 0.6 = 1.20. The same tier applies to the Fujing 001 (E3) and Seacor Power (E4) couplings; no pair in the corpus met the c = 0.8 or c = 1.0 criteria, a limitation of the seven-case corpus discussed in Section 6.2. A second candidate pair from the same case (complex geology, L = 6, × insufficient construction experience, L = 3) was rejected: the proximity |6 − 3|/6 = 0.5 exceeds θ1 = 0.4, so C3 is not satisfied; the pair is encoded as a hypothesized association (evidential status (e), Section 3.3) rather than as a coupledWith relation, and no relaxation of θ1 is applied, because no second independent case documents the same coupling pattern.
Table 3.
LEC parameter decomposition for the Shengping 001 coupled with relation.
Taking the Seacor Power case as an example, the severe-storm factor (EnvironmentalFactor, L = 10) is coupled with the insufficient-weather-information factor (ManagementFactor, L = 6), re-encoded on the basis of the NTSB investigation findings (Section 5.2). Conditions C1–C5 are satisfied: the L-value proximity |10 − 6|/10 = 0.4 equals θ1, the two factors belong to different risk categories, and the case-context D assignments of both factors (per annotation guideline (d)) exceed the C4 bound. The NTSB report establishes the joint contribution of the two factors to the initiating event (operation in a severe thunderstorm with winds beyond the vessel’s operational limits); the evidence strength is therefore c = 0.6, and the coupling coefficient is α = 1 + 0.34 × 0.6 = 1.20.
Topological analysis runs the PageRank algorithm over the whole graph to identify “critical risk nodes”: a high PageRank value indicates that the risk factor appears in multiple accident chains, so nodes with high PageRank values are natural candidates for priority control. The Top-10 ranking is therefore presented as a prioritization aid within the selected graph representation, to be read together with the LEC risk levels (the max-D and L–E–C columns in Table 4), rather than as a direct measure of expected risk reduction. PageRank was preferred over Betweenness centrality because WTIV safety management prioritizes risks with the greatest global impact rather than intermediary nodes on transmission chains; the damped random walk of PageRank better captures the recurrence of a risk across multiple causal chains. The Louvain community detection algorithm identifies “risk clusters,” i.e., groups of highly interrelated risk factors, indicating the need for coordinated rather than isolated control. Louvain is chosen over Infomap because its modularity optimization objective is semantically consistent with “identifying risk groups requiring coordinated control,” and its hierarchical structure can be mapped to the responsibility matrix of the R phase in LR-PDCA. The expected outputs are a Top-10 critical risk node ranking and risk cluster visualization. The algorithm parameters are as follows: for PageRank, the damping factor d = 0.85, edges are directed (following the causal direction from cause to consequence), edge weights are the aggregated counts of record-level associations between node pairs (parallel edges merged), and convergence is defined as the L1 norm of the PageRank vector change falling below 10−6; for Louvain community detection, the resolution parameter γ = 1.0 (standard modularity optimization), and the algorithm terminates when no merge increases the modularity Q.
Table 4.
Top-10 critical risk nodes by PageRank.
Community detection (Louvain, edge-weighted, 10 randomized runs) yields a mean modularity of Q = 0.605 ± 0.002, with 26–28 communities per run (Figure 5). The best partition decomposes the graph into six sub-communities within the Layer-B operational core (sizes 44, 43, 34, 32, 27, and 19), four sub-communities within the Layer-C case-chain core (sizes 16, 16, 11, and 8), and 16 isolated regulation-standard nodes; the case-chain core does not decompose into seven isolated single-case chains because the two weather-related cases (Fujing 001 and SEACOR Power) are interconnected through the typhoon–severe-storm similarTo edge and shared intermediate events. The community count varies across runs owing to the sparsity of the graph (average degree 3.31), which produces a relatively flat modularity landscape; the modularity score itself is stable (coefficient of variation < 0.5%), while community membership is not claimed to be unique. The weather-cluster community (spanning the typhoon and severe-storm chains of Fujing 001 and SEACOR Power) is the principal community relevant to the R (Responsibility) phase, corresponding to the risk cluster identified in Section 4.2.
Figure 5.
Louvain community detection results (edge-weighted, best of 10 randomized runs, Q = 0.605 ± 0.002): (a) community structure of the knowledge graph—six sub-communities within the Layer-B operational core, four within the Layer-C case-chain core, and 16 isolated regulation standards (top 10 communities colored, others in gray); (b) modularity score across the 10 runs; (c) community size distribution (44, 43, 34, 32, 27, 19, 16, 16, 11, 8, followed by singletons). Note: the modularity score is stable across runs; community membership is not claimed to be unique or stable.
3.5. Knowledge Increment Analysis
Compared with traditional risk data management tools, the knowledge graph offers three advantages. The first is multi-hop chained reasoning. Taking “which lifting operations carry the highest risk in typhoon weather, and what measures should be taken” as an example, Excel or SAP EHS requires manual cross-table filtering across the project, factor, consequence, and measure tables, involving at least four switches. The knowledge graph needs only one Cypher query (4-hop reasoning) and can automatically identify indirect associations that manual analysis may miss, such as the indirect transmission chain “typhoon → (similarTo) → severe storm → operation beyond operational limits → loss of stability → rapid capsizing,” which is not readily represented in Excel or SAP EHS. The study of Huo et al. [5] on a subway construction knowledge graph likewise confirmed that indirect risk associations discovered by multi-hop reasoning account for 23% of all associations.
The second advantage is case-driven knowledge injection. LEC data in generic EHS platforms, such as Excel and Intelex are static, and lessons from new accidents cannot enter the risk assessment. The KG stores the causal chains of the seven accidents as a dedicated case layer alongside the LEC operational records; category-level queries join case chains and LEC records on shared risk categories, making case evidence visible at the operational level. After the Shengping 001 chain “complex seabed geology → spudcan punch-through → platform inclination” was encoded, a category-level query surfaces the geological risks of the monopile pile-driving records together with the case chain, prompting special attention. This knowledge value-added loop of “accident lessons → dynamic risk-level perception → control measure prioritization” is unavailable in tabular tools and generic EHS software (v5.9.27). Compared with the subway construction KG of Huo et al. [5], the coupledWith relation in this study explicitly encodes the coupling effects among LEC factors, whereas Huo et al. only indirectly inferred hazard coupling through topological indicators without providing a mathematical expression of inter-factor coupling.
The third advantage is that topological analysis outperforms item-by-item review. Excel can only review the 92 risks one by one and cannot identify “which risk nodes sit at the intersection of multiple accident chains.” Traditional FMEA and Fault Tree methods can construct causal chains, but the modeling process relies on experts specifying causal logic item by item, and the model structure is fixed and cannot automatically discover new association paths. The PageRank algorithm of the KG identifies critical risk nodes in O(V + E) time, providing data support for the “priority control” strategy of the SMS.
The current scale of 266 nodes and 440 relations has initial usability in the vertical domain of WTIVs, but the introduction of new processes and equipment demands incremental extensibility of the graph. The A-B-C three-layer rule stratification and confidence annotation mechanism designed in Section 3.1 provide an institutional guarantee for this: when a new accident is recorded, a Layer-C rule is appended and marked as “pending verification”; after at least three independent supporting cases have accumulated, the rule is automatically upgraded to “verified.”
4. Mechanism Design for Embedding the Knowledge Graph into the LR-PDCA Safety Management System
4.1. Definition of KG-SMS Three-Layer Embedding and Interface Specification
The term “embedding” has long remained at the conceptual level in existing KG safety research. The LLM + KG multi-agent system of Speiser et al. [9] generates risk assessment documents, but how the output documents enter the SMS document system, who reviews them, and how the revision status is tracked are left unspecified. Johansen et al. [10] connected a KG to a digital twin environment, likewise without defining how reasoning results interface with SMS operational processes. This lack of an operational interface is the primary obstacle to deploying KG technology in day-to-day safety management.
To eliminate this vacuum, “embedding” is defined at three operational levels (Figure 6). At the L1 document level, KG reasoning results automatically generate SMS document revision suggestions, which are injected into the corresponding tier of the Company’s SMS document architecture; from top to bottom, this architecture comprises the safety management manual, the procedure management manual, the post responsibility manual, the safe operation manual, the emergency management manual, and records and external documents. The mapping rules are as follows: KG risk nodes correspond to “hazard identification” entries in the safe operation manual; KG control measure nodes correspond to “operational control” entries in the procedure management manual; KG accident case causal chains correspond to “emergency preparedness” entries in the emergency management manual; and KG Top-10 critical risk nodes correspond to “priority control” entries in management review reports. A complete L1 example: for the pile-sinking operation (WA-056), the KG identifies pile running (RS-084, D = 300, the highest within the operation) as the priority risk and returns (i) the matched operational control from the LEC layer (post-level control, CM-004, via mitigates) together with (ii) the case-layer knowledge that the Shengping 001 accident (AC-01) contributed to this risk family: the causal chain “complex seabed geology → spudcan punch-through → platform inclination” (causesEvent) and the two improvement measures triggered by this accident: mandatory review of penetration-depth assessment reports (CM-006) and refined geological-survey requirements (CM-007, via triggersImprovement). The KG simultaneously flags that no regulation standard is linked to the piling-operation risks through the measure layer (the regulation–measure coverage gap discussed in Section 5.3), so the regulatory citations of the resulting clause are drawn from the Layer-A rule base during drafting. Drawing on this KG output, the SMS drafters assembled a manual revision clause: “4.3.2 Before monopile foundation construction, a detailed geological survey shall be completed and a report issued; during operations, real-time leg monitoring shall be implemented, and emergency evacuation shall be initiated when the abnormal tilt angle exceeds 0.5° (regulatory basis: CB/T 4513-2020 [36], Clause 6.4.7 requires that the electronic control system of the jacking system provide a tilt alarm with a 0.5° threshold, issuing audible and visual alarms at the central control console and stopping the jacking system through an independent emergency-stop circuit; ISO 19905-1:2023 [37] requires site-specific assessment of jack-up units, including verification of preload holding and foundation capacity, prior to elevated operations at a site).” After review by the corporate safety manager, this clause was incorporated into the “monopile foundation construction” chapter of the safe operation manual. At the L2 process level, the KG query interface is embedded into the daily operation workflows of the SMS; before work each day, safety officers invoke KG queries to obtain the risk list and control measures of the current operation, replacing manual consultation of manuals. At the L3 institution level, KG operation results are incorporated into the inputs of SMS internal audits and management reviews: during internal audits, the KG is invoked to check risk identification coverage and measure-matching completeness; during management reviews, the Top-10 critical risk node ranking is invoked to evaluate the priority directions of safety investment. Figure 6 illustrates the three-layer embedding mechanism.
Figure 6.
Schematic of the KG-SMS three-layer embedding mechanism.
4.2. Six-Process Embedding Design for LR-PDCA
The three-layer embedding mechanism answers the question of “where to embed,” whereas the six-process embedding mechanism further explains “what function is assumed after embedding.” KG reasoning outputs are mapped to the six LR-PDCA management processes, each of which receives a specific type of knowledge input and produces a specific type of management action. L (Leadership process): the Top-10 critical risk node ranking and Louvain risk clustering results serve as inputs to leadership safety decision-making. The PageRank top-ranked nodes—led by personnel overboard among operational risks (Table 4) and by the case-layer factor misreporting and concealment—trigger leadership-driven special investment and adjustment of safety-culture building. R (Responsibility process): community detection results (Figure 5) identify risk clusters spanning multiple posts. The “typhoon–anchor dragging–chain fracture” cluster within the case-chain core spans the three posts of captain, anchoring officer, and safety manager, and the KG accordingly generates cross-post responsibility matrix suggestions, delineating the responsibility boundary of each post within the cluster. P (Plan process): multi-hop queries generate an “all-process risk list” covering the union of the 92 LEC risks and the accident-case-supplemented risks, replacing manual item-by-item identification. LEC coupling inference outputs an “LEC coupled risk list” annotating which risks exhibit coupling effects among L, E, and C, together with their α values. D (Do process): according to the current operation type, the KG automatically pushes matched control measures (mitigates relations) with their regulatory basis (regulatesBy relations), which safety officers can quote directly into work plans. C (Check process): the KG generates a “priority inspection checklist” based on risk levels and accident-case relevance, replacing fixed-template checklists; for “risks of leg-penetration operations related to the Shengping 001 accident,” priority is given to checking geological survey reports and preload plans. A (Act process): when a new accident case is recorded, triggersImprovement relations automatically initiate the revision review process of the relevant SMS documents, realizing the linkage of “knowledge update → document revision → institution refresh.”
A precondition for full deployment of the six-process embedding is that SMS documents must be editable digital files under version control. The SMS of the Company in this study is currently half paper-based and half PDF, so L2 process-level embedding has not been integrated into the enterprise IT infrastructure. In Table 5, “Functional” denotes functional verification, i.e., confirming that the KG correctly generates the expected outputs (risk lists, control measures, inspection checklists) when queried manually by a safety officer, rather than system integration verification, which would require the KG query interface to be embedded in the enterprise’s daily IT workflow. The P (Plan) and D (Do) processes are therefore marked as functionally demonstrated but not yet deployed. L2 process-level embedding remains at the prototype stage. Table 5 presents the six-process embedding design.
Table 5.
Six-process KG embedding design for LR-PDCA.
4.3. Confidence Annotation of Inference Rules and Generalizability Safeguards
The generalizability of Layer-C inference rules extracted from seven accidents is open to question. Countermeasures proceed along three routes: confidence annotation, incremental extension, and cross-domain analogy.
Confidence annotation attaches three “confidence tags” to each rule. The first is the source layer: A (regulations and standards), B (statistical regularities), or C (case-specific causation), in descending order of priority. The second is the number of supporting evidence items: for example, “leg-system failure → platform capsizing” is supported by two accidents (Shengping 001 and Alexander Kielland) and therefore carries higher confidence than rules supported by only one case. The third is cross-domain cross-validation: the causal chain “absence of management factors → operational error” in the present KG is highly consistent with the finding of Wu et al. [6], whose KG-BN framework based on 1164 building construction accident records identified “unimplemented safety responsibilities” (C11) as the primary management factor (accounting for 51.97%). The KG built by Wang et al. [8] from a decade of UK railway accident data likewise identified “management deficiency → personnel error → equipment failure” as the principal accident pathway. Cross-domain analogy serves as supportive context rather than validating evidence: the structural similarity of causal patterns across construction, railway, and offshore domains suggests that the rules extracted from the seven WTIV cases are plausible rather than overfitted, but cross-domain transfer does not constitute independent validation of domain-specific rules. The confidence annotation mechanism (Section 4.3) therefore assigns lower confidence to rules supported only by cross-domain analogy than to rules supported by multiple WTIV-specific cases.
The incremental extension and degradation mechanisms ensure that the graph neither “locks in” erroneous reasoning because of small samples nor “forgets” existing knowledge when new data arrive. When a new accident is recorded, causal triples are appended and marked as “pending verification.” A rule of the same type is automatically upgraded to “verified” after at least three independent supporting cases have accumulated. If the causal chain of a new accident conflicts with an existing rule, for example, a new accident in which “leg punch-through” did not lead to platform tilting because an automatic alarm successfully arrested the loss, a rule revision review is triggered, and the confidence of the original rule is downgraded or its conditions are restrictively modified. At the current scale of seven cases, this mechanism is in its initial operation stage; the maturity of the rule base requires two to three years of data accumulation before it can be fully verified.
5. Case Study and Effectiveness Evaluation
5.1. Case Background and KG Construction Results
The validation case is an offshore engineering company in Guangzhou, China (hereafter “the Company”). The Company operates three self-elevating wind turbine installation vessels and one anchor-handling tug supply vessel, with vessel assets exceeding one billion CNY; it has established an SMS under the NSM Code and holds a Document of Compliance (DOC). Its six-tier SMS document architecture (safety management manual, procedure management manual, post responsibility manual, safe operation manual, emergency management manual, and records) corresponds directly to the L1 document-level embedding interface defined in Section 4.1.
The KG was constructed with the Company as the case. The final graph contains 266 entity nodes (73 WorkActivity, 122 RiskSource, 11 Consequence, 16 ControlMeasure, 19 MiddleEvent, 7 AccidentCase, and 18 Regulation) and 440 relation edges (195 involves, 92 leadsTo, 88 mitigates, 28 causesEvent, 12 triggersImprovement, 11 hasFactor, 7 resultsIn, 3 coupledWith, 2 similarTo, and 2 regulatesBy), with an average degree of 3.31. The graph decomposes into 18 connected components: the two largest components (the Layer-B operational core, 199 nodes, and the Layer-C case-chain core, 51 nodes, including two regulation standards attached via regulatesBy edges) jointly cover 94.0% of the nodes and support multi-hop traversal within each core, while the remaining 16 regulation-standard nodes are isolated, which is disclosed as a coverage limitation (see the limitations section). Figure 7 shows the overall topology of the graph.
Figure 7.
Overall topology of the knowledge graph (266 nodes, 440 edges; color = entity type, size = degree). The graph decomposes into 18 connected components: the Layer-B operational core (199 nodes), the Layer-C case-chain core (51 nodes, including two regulation standards attached via regulatesBy edges), and 16 isolated regulation-standard nodes.
5.2. Case-Based Consistency Validation and Leave-One-Case-Out Analysis
The validation adopts a two-stage approach: (1) case-based consistency back-testing, in which the initial conditions of known accidents serve as query inputs and the reasoning outputs are compared with actual causal chains; and (2) a leave-one-case-out (LOCO) analysis, in which the Layer-C relations derived from the case under test are temporarily excluded before querying, so that the reconstructability of the withheld causal chain from the remaining knowledge can be assessed. The validation is therefore described as case-based consistency and retrieval validation rather than independent reasoning validation, because the same accident cases contribute to both graph construction and evaluation. Three accidents were selected as validation scenarios, covering the three typical accident types of leg punch-through, anchor dragging with chain breakage, and storm capsizing (Table 6). The consistency of each reasoning path with the actual accident causal chain was scored on a five-point rubric: 5 = the path coincides with a causal chain established by the official investigation; 4 = an established chain traversing an official coupling pair (E1/E3/E4); 3 = the correct casualty outcome reached through one cross-case analogy (similarTo) or one hypothesized link; 2 = the correct outcome reached through two or more such links; 1 = inconsistent with the investigation findings. Scoring was performed independently by the two domain experts who conducted the annotation (Section 3.3); disagreements were resolved through discussion.
Table 6.
Comparison between reasoning paths and actual accident causal chains.
Scenario 1: The Shengping 001 leg punch-through accident. The initial conditions were “leg penetration operation + complex geological conditions.” The reasoning engine returns three paths (S1-1–S1-3, Table 6): two official chains (complex seabed geology → spudcan punch-through → platform inclination → casualties; and insufficient construction experience → spudcan punch-through → platform inclination → casualties) and a coupling variant in which improper preloading control enters through coupling pair E1 (c = 0.6, α = 1.20, Section 3.4). Two of the three paths are fully supported by the official investigation. The case layer encodes two improvement measures triggered by this accident: mandatory review of penetration-assessment reports (CM-006) and detailed geological-survey requirements (CM-007), which enter the SMS document revision process via triggersImprovement relations (Section 5.3); the rejected candidate coupling (geology × inexperience, failing C3) is encoded as a hypothesized association (Section 3.4).
Scenario 2: The Fujing 001 anchor dragging and chain breakage accident. The initial conditions were “typhoon influence + sheltering at anchor.” The reasoning engine returns twelve paths (S2-1–S2-12, Table 6), organized in three groups: the two officially determined chains (typhoon → anchor dragging → anchor-chain fracture → hull capsizing → casualties, and misreporting and concealment → delayed rescue → casualties; score 5) together with their E3-coupled variants (α = 1.20, score 4); and eight cross-case paths in which the typhoon node, anchored by similarTo to the severe storm of SEACOR Power, borrows the cross-case mechanism chain (operation beyond limits → loss of stability → rapid capsizing → casualties), including variants that traverse both coupling pairs (E3 and E4) and the hypothesized brace fatigue analogy (scores 2–3). The cross-case paths reach the correct casualty outcome through the analogous case’s mechanisms, demonstrating the graph’s cross-case reasoning capability while reflecting the epistemic status of analogy-based inference. The case layer encodes two improvement measures triggered by this accident—typhoon response procedures (CM-008) and truthful-reporting requirements (CM-009), which enter the SMS revision process via triggersImprovement relations.
Scenario 3: The SEACOR Power storm capsizing accident. The initial conditions were “sudden severe storm + platform underway.” The reference chain follows the NTSB Marine Investigation Report MIR-22-26 [21]: the capsizing occurred when the vessel was struck by severe thunderstorm-generated winds that exceeded its operational wind speed limits, causing a loss of stability and rapid capsizing; the weather information provided to the crew was insufficient for weather-related operational decisions; the captain’s departure decision was reasonable based on the information available; and the SAR response was delayed by ineffective verification of EPIRB alert positions. The investigation did not establish a structural-failure mechanism. The reasoning engine returns thirteen paths (S3-1–S3-13, Table 6): the NTSB-determined chain (severe storm → operation beyond limits → loss of stability → rapid capsizing → casualties, score 5) and its E4-coupled variant (α = 1.20, score 4); the SAR-delay chain (inefficient EPIRB verification → delayed SAR → casualties, score 5); cross-case paths anchored by similarTo to the typhoon of Fujing 001 (anchor dragging → anchor-chain fracture → hull capsizing → casualties, and its E3 variant); and the leg-overload branch (severe storm → leg overload → hull capsizing), flagged as hypothesized because the investigation did not establish a structural-failure mechanism. The case layer encodes three improvement measures triggered by this accident: severe-weather warning response procedures (CM-013, regulatesBy: DNV-OS-H101), weather information provision (CM-014, regulatesBy: ISM Code), and EPIRB alert verification procedures (CM-015), which enter the SMS revision process via triggersImprovement relations.
The 28 reasoning paths across the three scenarios are summarized in Table 6. To address the potential circularity that the three validated cases also contributed Layer-C relations to the graph, a leave-one-case-out (LOCO) analysis was performed. For each of the three validation scenarios, all Layer-C relations (hasFactor, resultsIn, causesEvent, triggersImprovement, coupledWith, similarTo) directly extracted from the target accident case were temporarily removed from the graph; the remaining knowledge, comprising Layer-A regulations, Layer-B LEC statistics, and Layer-C relations from the other six accident cases, was then queried with the same initial conditions to assess how much of the withheld causal chain could be reconstructed. The results are summarized in Table 7.
Table 7.
Leave-one-case-out reconstruction results.
Three levels of interpretation must be distinguished when reading these results. First, reproduction of documented accident mechanisms: the consistency back-testing compares reasoning paths against causal chains that the investigations have already established, so the scores (12 of 28 paths at ≥4) quantify agreement with documented knowledge rather than discovery beyond it. Second, reconstruction of causal paths after case removal: the LOCO trials test whether a withheld chain remains derivable from the knowledge of the remaining cases, and the surviving paths are exactly the similarTo cross-case paths (Table 7 and Table 6). Third, predictive performance on unseen scenarios: this study does not test it and claims no such capability; evaluation on operational situations outside the seven documented cases requires deployment-phase data collection and is specified as part of the future evaluation protocol (Section 5.4). Within this frame, reconstructability and consistency remain independent properties: the directly encoded chains are fully consistent with the investigations, yet, by construction, are not reconstructable from their source case, whereas cross-case transfer paths remain reconstructable from the remaining knowledge while reaching the casualty outcome through the analogous case’s mechanism chain.
Counterfactual edge-removal tests show that deleting the case-layer edges of Shengping 001 breaks all three Scenario-1 paths; deleting those of Fujing 001 leaves 2 of the 12 Scenario-2 paths fully surviving, 4 partially surviving, and 6 broken; deleting those of SEACOR Power leaves 2 of the 13 Scenario-3 paths fully surviving, 4 partially surviving, and 7 broken. The fully surviving paths are exactly those that cross the typhoon–severe-storm similarTo anchor into the other weather-related case, indicating that cross-case knowledge transfer provides structural redundancy for scenario reasoning. Meanwhile, none of the 88 Layer-B operational measures survives on any case-layer path under any counterfactual: construction-layer measures target construction-layer risk sources and do not act on major-accident case factors, revealing a measure-coverage gap between the operational and case knowledge bases. We emphasize that the LOCO analysis addresses circularity in the validation rather than the generalizability of the inference rules; the reconstruction rates are specific to the three tested scenarios and should be read as illustrative of the stratification behavior rather than as established robustness.
On consistency, 12 of the 28 reasoning paths score ≥ 4, including 7 that are fully supported by the official investigations. The deviations fall into three identifiable patterns: cross-case analogy paths (via similarTo) reach the correct casualty outcome through the mechanism chain of the analogous case rather than that of the target accident; paths resting on the leg-overload branch are based on a mechanism not established by the investigation and are flagged as hypothesized (evidential status (e), Section 3.3); and coupled-variant paths traverse official coupling pairs (E3/E4) established in their respective source investigations. The coupling inference reproduced the investigation-established joint-causation patterns of all three scenarios, formalized as coupling pairs E1, E3, and E4 with an exploratory β (Section 3.4); candidate pairs failing the C3 proximity threshold were recorded as hypothesized associations rather than formal couplings. The coefficients derived from the evidence-strength scale of Definition 2 are reported as expert-informed amplification factors consistent with the investigation narratives, not as independently validated estimates of risk amplification (Section 6.2).
5.3. Operability Demonstration of SMS Embedding
The operability of the three-layer embedding was demonstrated against the Company’s six-tier SMS document architecture. The demonstration is interface-level, whether the reasoning outputs are of the form and routing required by each document tier; quantified concordance against baseline documents is not reported, because the underlying comparison records were not systematically archived.
At the L1 document level, the demonstration follows the complete example of Section 4.1: the KG output for the pile-sinking operation (the matched operational control, the Shengping 001 causal chain, and the two case-triggered improvement measures, each carrying its provenance) is assembled by the SMS drafters into a manual revision clause and routed, per the L1 interface, to review by the corporate safety manager for incorporation into the “monopile foundation construction” chapter of the safe operation manual. The additions relative to the Company’s existing clauses originate mainly from the injection of accident-case lessons (detailed geological-survey requirements and preload-test verification); a clause-level overlap audit, however, was not archived, and quantified overlap is therefore not reported.
At the L2 process level, the demonstration uses the daily pre-work risk briefing for “monopile foundation construction—pile sinking” (WA-056): through the KG query interface, the KG returns the risk list for that operation, comprising two Layer-B LEC risks (hot-work violations in dangerous areas, D = 90; pile running during pile sinking, D = 300, the highest within the operation), the record-anchored consequence mappings, and one matched operational measure, together with the priority inspection points derived from them. The query also reveals a regulation–measure coverage gap: no regulation standard is linked to the piling-operation risks through the measure layer, indicating that the briefing content rests on operational experience rather than codified regulatory requirements. A sheet-level comparison against the Company’s manually compiled briefing sheets was not archived; quantified coverage is therefore not reported.
At the L3 institution level, the KG generates a “priority audit checklist” from the Top 10 critical risk node ranking, which internal auditors can apply in targeted checks of SMS operation records. The centrality-based ranking prioritizes personnel-overboard and lifting-related operational risks together with weather-related case factors, whereas a fixed annual audit plan typically emphasizes recurring seasonal risks such as typhoon prevention; the two perspectives are complementary in institution-level embedding. A checklist-level concordance audit against the annual plan was not archived and is therefore not reported. Table 8 summarizes the demonstration.
Table 8.
Summary of SMS three-layer embedding demonstration.
5.4. Scope and Status of the Effectiveness Evidence
SMS operational effectiveness was evaluated under a practical constraint: demonstrating a reduction in accident probability requires two to three years of longitudinal tracking data, which is not available within the timeframe of this study. The subway construction KG of Huo et al. [5] and the KG-BN framework of Wu et al. [6] likewise substituted topological indicators and reasoning-path validation for accident-rate statistics. Following this practice, the effectiveness evidence in the present study is explicitly scoped and labelled.
(1) Demonstrated. The case-based consistency back-testing (Section 5.2) shows that the reasoning engine reproduces the investigation-established causal chains of three typical accident types: 12 of 28 paths reach a consistency score ≥ 4, and each deviation is attributable to an identifiable cause: cross-mechanism transfer through the similarTo analogies, case-specific chain segments absent from the remaining knowledge, or hypothesized leg-overload mechanisms not established by the investigations. The embedding demonstration (Section 5.3) shows that the L1–L2–L3 interfaces map onto the case Company’s actual six-tier SMS document structure and that the reasoning outputs are of the form required by the corresponding document tiers.
(2) Not demonstrated. Whether KG assistance reduces the accident rate cannot be established without longitudinal tracking; the present study therefore claims consistency and operability, not causal effectiveness on safety outcomes. In addition, the quantitative effectiveness figures initially compiled for this study (the four process metrics and the blinded expert score records) cannot be reproduced from the archived materials: the paired per-expert rating sheets and the manual-compilation timing logs were not systematically retained. These quantitative results have therefore been removed from this version, and the corresponding claims are not made.
(3) Evaluation protocol for deployment. For deployment-phase evaluation, the following protocol is specified. Four process metrics: (i) risk identification coverage = KG-identified items/expert-identified items × 100%; (ii) control-measure-matching accuracy = KG–expert consistent items/expert-recommended total × 100%; (iii) checklist generation efficiency = manual compilation time/KG-assisted generation time; and (iv) cross-process association discovery rate = KG-discovered cross-process associations/(KG discoveries + manual discoveries) × 100%. Blinded expert evaluation: six experts (two corporate safety managers with ≥10 years of offshore construction experience; two maritime administration auditors holding ISM Code auditor certification; two research institute fellows with ≥5 years of offshore safety research) evaluate the KG-assisted and the manual output for each operation scenario under concealed source and randomised presentation order, scoring risk identification completeness (1 = major omissions, 3 = most key risks identified, 5 = comprehensive with cross-process risks), measure operability (1 = generic/impractical, 3 = partially applicable, 5 = directly implementable with specific operational details), and case reference value (1 = no case support, 3 = limited case citation, 5 = multiple relevant cases with clear causal linkage). Ratings are pooled across scenarios for each expert, yielding six paired observations per dimension; the pre-specified analysis is the Wilcoxon signed-rank test with exact p-values, with effect size r =. Executing and archiving this protocol at deployment scale, including the raw rating sheets and timing logs, is a precondition for reporting quantitative effectiveness results in future work.
6. Discussion
6.1. Contributions and Theoretical Implications
The argumentative chain of Section 2, Section 3 and Section 4 can be summarized as three contributions. (1) A knowledge graph of 266 nodes and 440 edges, the first in the WTIV safety domain. Huo et al. [5] addressed subway construction and Wu et al. [6] building collapse; installation vessels had not been covered before. (2) The coupledWith relation and the LEC coupling inference rules transcend the three-factor independence assumption of the traditional LEC method. The trigger conditions (C1–C5), the formal definition of the coupling coefficient α (α = 1 + β × c (coupling evidence strength)), and the production rule set given in Section 3.4 upgrade LEC coupling inference from a narrative description to a reproducible formal method. The back-testing of three accidents in Section 5.2 shows that the three-factor linkage risk chains output by coupling inference agree with the causal chains established by the official investigations (12 of 28 paths with a consistency score ≥ 4); these agreements are consistency results of expert-informed reasoning against documented accident narratives, not independently validated estimates of risk amplification, and traditional static LEC assignment cannot identify such linkage. (3) The L1–L2–L3 three-layer embedding interface is the first operational docking of KG reasoning outputs with the six LR-PDCA processes. The demonstration in Section 5.3 shows that the three-layer embedding maps operably onto the case Company’s SMS document structure, addressing the interface limitation identified in the work of Speiser et al. [9] and Johansen et al. [10].
At the engineering level, the Company case demonstrates the interface-level usability of KG-assisted SMS; the quantitative effectiveness metrics and the blinded evaluation specified in Section 5.4 remain to be executed and archived at deployment scale. Notably, the single major-level inherent risk in the 74-record operational list of Section 3.4 is typhoon-related collision (inherent D = 480, reduced to 42 under controls), precisely the risk type that dominates the two weather-related casualty cases in Layer C (Fujing 001 and Seacor Power). The Company’s own operational risk ranking and the accident-case evidence thus converge on severe-weather scenarios, indicating that the Layer-B and Layer-C sources provide complementary perspectives on the same dominant risk. This framework also provides quantifiable risk data support and a reasoning tool prototype for the industry regulator’s promotion of the industry standard “Safety operation requirements for offshore wind turbine installation vessels” (first batch of standardization projects of the Science and Technology Department of the Ministry of Transport, 2022).
6.2. Limitations and Future Work
Four limitations should be noted. (1) Knowledge source: the Layer-C rules extracted from seven accidents have limited generalizability. The recommended measures are phrased in a standardized, regulation-anchored manner and lack company-specific operational detail; this deviation lies precisely in the insufficient company-level adaptation of Layer-C rules and is the primary target of the deployment-phase evaluation protocol (Section 5.4). Industry accident database sharing and cross-enterprise data cooperation are realistic paths for expanding the knowledge source. (2) Validation depth: the present evidence is limited to case-based consistency back-testing and interface-level demonstration; the quantitative process metrics and blinded evaluation specified in Section 5.4 have not been executed and archived at deployment scale, and two to three years of longitudinal tracking are required to determine whether the accident rate has declined. Although the three back-tested accidents cover three typical types, there is only one case per type, and within-type robustness requires examination with more cases. L2 process-level embedding currently runs on a prototype system; the Company’s SMS files are stored in mixed paper and PDF form and have not yet been integrated into the enterprise IT infrastructure. (3) Technical extension: the digital twin technology reviewed by Xia et al. [3] points to a direction for real-time dynamic recomputation of LEC parameters. The coupling coefficient α of coupledWith relations relies on an exploratory, expert-informed amplification parameter (β = 0.34) rather than on statistical calibration, because the coupled relations are clustered within the seven accident cases and the investigation reports do not quantify per-relation consequence amplification (Section 3.4). A sensitivity analysis was conducted by re-computing the validation–scenario coupling coefficients with β set to the bounds of the plausible range [0.1, 0.6]: for the Seacor Power coupling (c = 0.6), α = 1.06 at β = 0.1 and α = 1.36 at β = 0.6, compared with 1.20 at the current setting. The qualitative conclusion (positive coupling amplification, α > 1) holds throughout the range, but the amplification term (α − 1) varies sixfold, so the current β setting should be considered exploratory pending larger-sample evidence; if installation-vessel sensor data streams are connected, α can be dynamically calibrated from measured data and the reasoning accuracy further improved. (4) Data and structural coverage: only two of the 18 regulation standards are currently linked to the measure layer (CM-013 → DNV-OS-H101 and CM-014 → ISM Code); the remaining 16 standards remain isolated, and the result of Section 5.3 shows that no regulation standard is reachable from the piling-operation risks through the measure layer, so the regulation anchoring of generated control clauses rests on the Layer-A rule base rather than on graph-encoded edges. The four control-hierarchy nodes (CM-002–CM-005) are derived from LEC risk levels rather than from documented measures, so their names denote control tiers rather than specific actions. Eleven LEC rows remain pending verification against the source table, including one record with empty LEC fields (record 2); the D = 720 assignments of the Shengping 001 coupling factors rest on Annex-D grading rules rather than on the original LEC table. The piling-operation family of Section 5.3 is defined by name matching (seven operations); the work-activity category field additionally classifies one lifting operation (WA-059) under monopile foundation construction, which the name-based scope does not include. Finally, the AC-07 case attaches one contributing factor through a hasFactor relation whose target is an intermediate event rather than a RiskSource node; this edge is retained pending verification against the original DMAIB report; similarly, all seven resultsIn relations terminate at a shared casualty node typed as MiddleEvent rather than Consequence.
7. Conclusions
This study constructed, to the best of the authors’ knowledge, the first safety risk knowledge graph for offshore wind turbine installation vessels (266 nodes and 440 edges) from 92 LEC risk assessment records and seven typical accident cases under an A-B-C three-layer rule stratification. It proposed LEC coupling inference rules, with formal trigger conditions (C1–C5), a coupling coefficient α, and a production rule set, that transcend the three-factor independence assumption of the traditional LEC method; and it defined an L1–L2–L3 three-layer embedding interface that maps KG reasoning outputs to the six LR-PDCA management processes. Validation at an offshore engineering company showed that the generated reasoning paths agree with the causal chains established by the official investigations for three typical accidents (12 of 28 paths with consistency ≥ 4), a consistency result within the documented case knowledge rather than an independently validated estimate of risk amplification; the three-layer embedding was demonstrated against the Company’s SMS document structure, and the quantitative effectiveness metrics and blinded expert evaluation are specified as a deployment-phase protocol (Section 5.4). The generalizability of Layer-C case rules remains constrained by the small accident sample, and long-term accident-rate verification is left to future work; connecting installation-vessel sensor data streams through digital twins for dynamic calibration of α is the planned next step.
Author Contributions
Conceptualization, J.B. and S.Q. Methodology, J.B. and S.Q. Software, S.Q., Q.X. and Y.Z. Validation, N.L., Z.Z. and Y.Z. Formal analysis, J.B. and S.Q. Investigation, J.B., N.L. and X.Z. Resources, N.L. and Z.Z. Data curation, J.B., Q.X. and X.Z. Writing—original draft preparation, J.B. Writing—review and editing, S.Q. and Z.Z. Visualization, Q.X. and Y.Z. Supervision, S.Q. and Z.Z. Project administration, N.L. Funding acquisition, N.L. All authors have read and agreed to the published version of the manuscript.
Funding
This work was supported by the Fundamental Research Funds for the Central Public-Welfare Research Institutes under Grant No. 42502 for the project titled “Research on Safety Management System and Safety Risk Prevention Technology for Self-Elevating Wind Turbine Installation Vessels”.
Data Availability Statement
The original contributions presented in this study are included in the article. Further inquiries can be directed to the corresponding author.
Conflicts of Interest
The authors declare no conflicts of interest.
References
- Yu, Q.; Liu, K.; Chang, C.H.; Yang, Z. Realising advanced risk assessment of vessel traffic flows near offshore wind farms. Reliab. Eng. Syst. Saf. 2020, 203, 107086. [Google Scholar] [CrossRef] [Scilit]
- Han, Y.; Zhen, X.W.; Huang, Y. Hybrid dynamic risk modelling for safety critical equipment on offshore installations. Process Saf. Environ. Prot. 2021, 156, 482–495. [Google Scholar] [CrossRef] [Scilit]
- Xia, J.J.; Zou, G. Operation and maintenance optimization of offshore wind farms based on digital twin: A review. Ocean Eng. 2023, 268, 113322. [Google Scholar] [CrossRef] [Scilit]
- Li, J.X.; Lu, D.G.; Ding, J.W.; Ding, Y.; Liu, H.; Chen, L.; Wu, W. A CNN-LSTM-Attention model for risk prediction of offshore wind turbines. Ocean Eng. 2026, 353, 124589. [Google Scholar] [CrossRef] [Scilit]
- Huo, X.S.; Yin, Y.; Jiao, L.D.; Zhang, Y. A data-driven and knowledge graph-based analysis of the risk hazard coupling mechanism in subway construction accidents. Reliab. Eng. Syst. Saf. 2024, 250, 110254. [Google Scholar] [CrossRef] [Scilit]
- Wu, P.; Huang, J.M.; Li, W.X.; Huang, Y.; Li, Q.; Xu, Y. Knowledge-graph-based Bayesian analysis framework for construction safety analysis: Taking collapse accident as an example. Reliab. Eng. Syst. Saf. 2026, 275, 112780. [Google Scholar] [CrossRef] [Scilit]
- Hong, E.; Lee, S.Y.; Kim, H.; Park, J.E.; Seo, M.B.; Yi, J.S. Graph-based intelligent accident hazard ontology using natural language processing for tracking, prediction, and learning. Autom. Constr. 2024, 168, 105800. [Google Scholar] [CrossRef] [Scilit]
- Wang, N.; Yang, X.; Chen, J.; Wang, H.; Wu, J. Hazards correlation analysis of railway accidents: A real-world case study based on the decade-long UK railway accident data. Saf. Sci. 2023, 166, 106238. [Google Scholar] [CrossRef] [Scilit]
- Speiser, K.; Maciocci, G.; Boukamp, F.; Teizer, J. Agentic system for construction safety risk assessments using large language models and knowledge graphs. Adv. Eng. Inform. 2026, 74, 104681. [Google Scholar] [CrossRef] [Scilit]
- Johansen, K.W.; Schultz, C.; Teizer, J. Knowledge graph exploitation to enhance the usability of risk assessment in construction safety planning. Adv. Eng. Inform. 2025, 65, 103305. [Google Scholar] [CrossRef] [Scilit]
- Sklad, A. Assessing the impact of processes on the occupational safety and health management system’s effectiveness using the fuzzy cognitive maps approach. Saf. Sci. 2019, 117, 71–80. [Google Scholar] [CrossRef] [Scilit]
- Da Silva, S.L.C.; Amaral, F.G. Critical factors of success and barriers to the implementation of occupational safety and health management systems: A systematic review of literature. Saf. Sci. 2019, 117, 123–132. [Google Scholar] [CrossRef] [Scilit]
- Kim, N.K.; Rahim, N.F.A.; Iranmanesh, M.; Foroughi, B. The role of the safety climate in the successful implementation of safety management systems. Saf. Sci. 2019, 118, 48–56. [Google Scholar] [CrossRef] [Scilit]
- Gao, X.M.; Abdul Raman, A.A.; Hizaddin, H.F.; Bello, M.M.; Buthiyappan, A. Review on the inherently safer design for chemical processes: Past, present and future. J. Clean. Prod. 2021, 305, 127154. [Google Scholar] [CrossRef] [Scilit]
- Huang, W.Z. Analysis of problems and countermeasures for ships implementing the NSM Code in the fourth batch. China Marit. 2021, 12, 53–55. (In Chinese) [Google Scholar] [CrossRef]
- Office of the Work Safety Committee of the State Council, P.R.C. Opinions on Strengthening Safety Risk Prevention and Control for Offshore Wind Power Projects (Circular No. 9 [2022]). Beijing, 2022. Available online: https://www.nea.gov.cn/2022-11/11/c_1310675867.htm (accessed on 9 October 2026). (In Chinese)
- Huizhou Maritime Safety Administration. Investigation Report on the “7·25” “Shengping 001” Platform Inclining Accident at Huizhou; Huizhou Maritime Safety Administration: Huizhou, China, 2021. (In Chinese)
- Maritime Safety Administration of the People’s Republic of China. Investigation Report on the “7·2” “Fujing 001” Crane Vessel Wind-Disaster Accident at Yangjiang; China MSA: Beijing, China, 2023. Available online: https://www.msa.gov.cn/public/documents/document/mde1/nzi3/~edisp/20230531015727077.pdf (accessed on 9 October 2026). (In Chinese)
- Norwegian Public Commission of Inquiry. Alexander L. Kielland-Ulykken (The Alexander L. Kielland Accident), NOU 1981:11; Ministry of Justice and Police: Oslo, Norway, 1981. Available online: https://media.digitalarkivet.no/view/105511/1 (accessed on 9 October 2026). (In Norwegian)
- Liebherr-MCCtec Rostock GmbH. Statement on the Crane Accident during Load Testing of the Offshore Installation Vessel Orion 1 at Rostock, 2 May 2020 (Preliminary Findings of the Investigating Authorities). Rostock. 2020. Available online: https://www-assets.liebherr.com/media/bu-media/lhbu-corp/news/corp_news_2020/corp_05_26/corp_f_2020_05_06/liebherr-press-release-accident-overload-test-202005.pdf (accessed on 9 October 2026).
- National Transportation Safety Board (NTSB). Capsizing of US-Flagged Liftboat Seacor Power, Port Fourchon, Louisiana, April 13, 2021; Marine Investigation Report MIR-22-26; NTSB: Washington, DC, USA, 2022. Available online: https://www.ntsb.gov/investigations/AccidentReports/Reports/MIR2226.pdf (accessed on 9 October 2026).
- Olsen Windcarrier/Navantia. Public Statements and Industry Reporting on the Brave Tern Crane Incident at the Navantia Ferrol Shipyard, Spain, November 2024 (no Formal Marine Casualty Report Published). Available online: https://maritime-executive.com/article/video-wind-turbine-vessel-knocks-over-crane-at-navantia-shipyard (accessed on 9 October 2026).
- Danish Maritime Accident Investigation Board (DMAIB). AMBER II and SEA WORKER: Loss of Tow on 27 January 2016; DMAIB: Copenhagen, Denmark, 2016; Available online: https://dmaib.com/media/8572/amber-ii-and-sea-worker-loss-of-tow-on-27-january-2016.pdf (accessed on 9 October 2026).
- IMO. International Convention for the Safety of Life at Sea (SOLAS), Chapter IX: Management for the Safe Operation of Ships; IMO: London, UK, 2020; Available online: https://www.imo.org/en/About/Conventions/Pages/International-Convention-for-the-Safety-of-Life-at-Sea-(SOLAS),-1974.aspx (accessed on 9 October 2026).
- Kong, F.; Ahn, S. Use of knowledge graphs for construction safety management: A systematic literature review. Information 2024, 15, 390. [Google Scholar] [CrossRef] [Scilit]
- Staab, S.; Studer, R. Handbook on Ontologies, 2nd ed.; Springer: Berlin, Germany, 2009. [Google Scholar] [CrossRef] [Scilit]
- ISO/IEC 15962:2022; Information Technology—Radio Frequency Identification (RFID) for Item Management—Data Protocol: Data Encoding Rules and Logical Memory Functions. ISO: Geneva, Switzerland, 2022; pp. 1–252.
- Song, J.W.; Deng, Y.C.; Su, C. Research on named entity recognition of construction safety accident text based on pre-trained language model. J. Graph. 2021, 42, 307–315. (In Chinese) [Google Scholar] [CrossRef]
- Pedro, A.; Pham-Hang, A.T.; Nguyen, P.T.; Pham, H.C. Data-driven construction safety information sharing system based on linked data, ontologies, and knowledge graph technologies. Int. J. Environ. Res. Public Health 2022, 19, 794. [Google Scholar] [CrossRef] [Scilit] [PubMed]
- GB/T 33000-2016; Basic Norms for Work Safety Standardization of Enterprises. Standards Press of China: Beijing, China, 2016. Available online: https://std.samr.gov.cn/gb/search/gbDetailed?id=71F772D8157FD3A7E05397BE0A0AB82A (accessed on 9 October 2026). (In Chinese)
- DNV-OS-H101; Marine Operations, General. DNV: Høvik, Norway, 2011. Available online: https://standards.dnv.com/explorer (accessed on 9 October 2026).
- IMO. International Safety Management (ISM) Code; IMO: London, UK, 2017; Available online: https://www.imo.org/en/OurWork/HumanElement/Pages/ISMCode.aspx (accessed on 9 October 2026).
- Zhang, Y.; Chen, X.B.; Li, M.; Wu, S.; Tong, R.P. Knowledge structure and evolution trends of human error and human reliability in complex industrial systems. China Saf. Sci. J. 2022, 32, 46–52. (In Chinese) [Google Scholar] [CrossRef]
- Jin, Y.Z.; Cui, S.C.; Zhao, L.; Sun, X. Safety risk assessment and control of hydraulic engineering construction based on an improved LEC method. Yangtze River 2018, 49, 63–66, 104. (In Chinese) [Google Scholar] [CrossRef]
- Wan, P.; Yang, W.L.; Luo, J.W.; Ma, X.F. Importance analysis of causative nodes for accident chains of railway locomotive operation based on STPA-PageRank method. Promet–Traffic Transp. 2025, 37, 137–150. [Google Scholar] [CrossRef] [Scilit]
- CB/T 4513-2020; The Design Specification and Fixing of Hydraulic Rack and Pinion Jacking System for Self-Elevating Units. Ministry of Industry and Information Technology of the P.R. China: Beijing, China, 2020. Available online: https://www.ndls.org.cn/standard/detail/276ac6192241b1a8d3f4b16e8c3b273f (accessed on 9 October 2026). (In Chinese)
- ISO 19905-1:2023; Oil and Gas Industries Including Lower Carbon Energy, Site-Specific Assessment of Mobile Offshore Units, Part 1: Jack-Ups: Elevated at a Site. ISO: Geneva, Switzerland, 2023. Available online: https://www.iso.org/standard/79590.html (accessed on 9 October 2026).
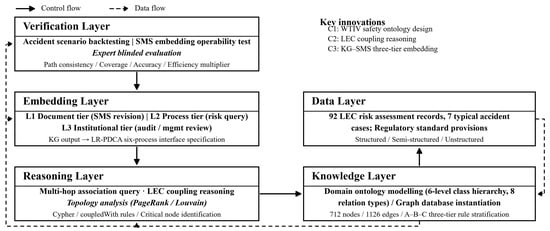
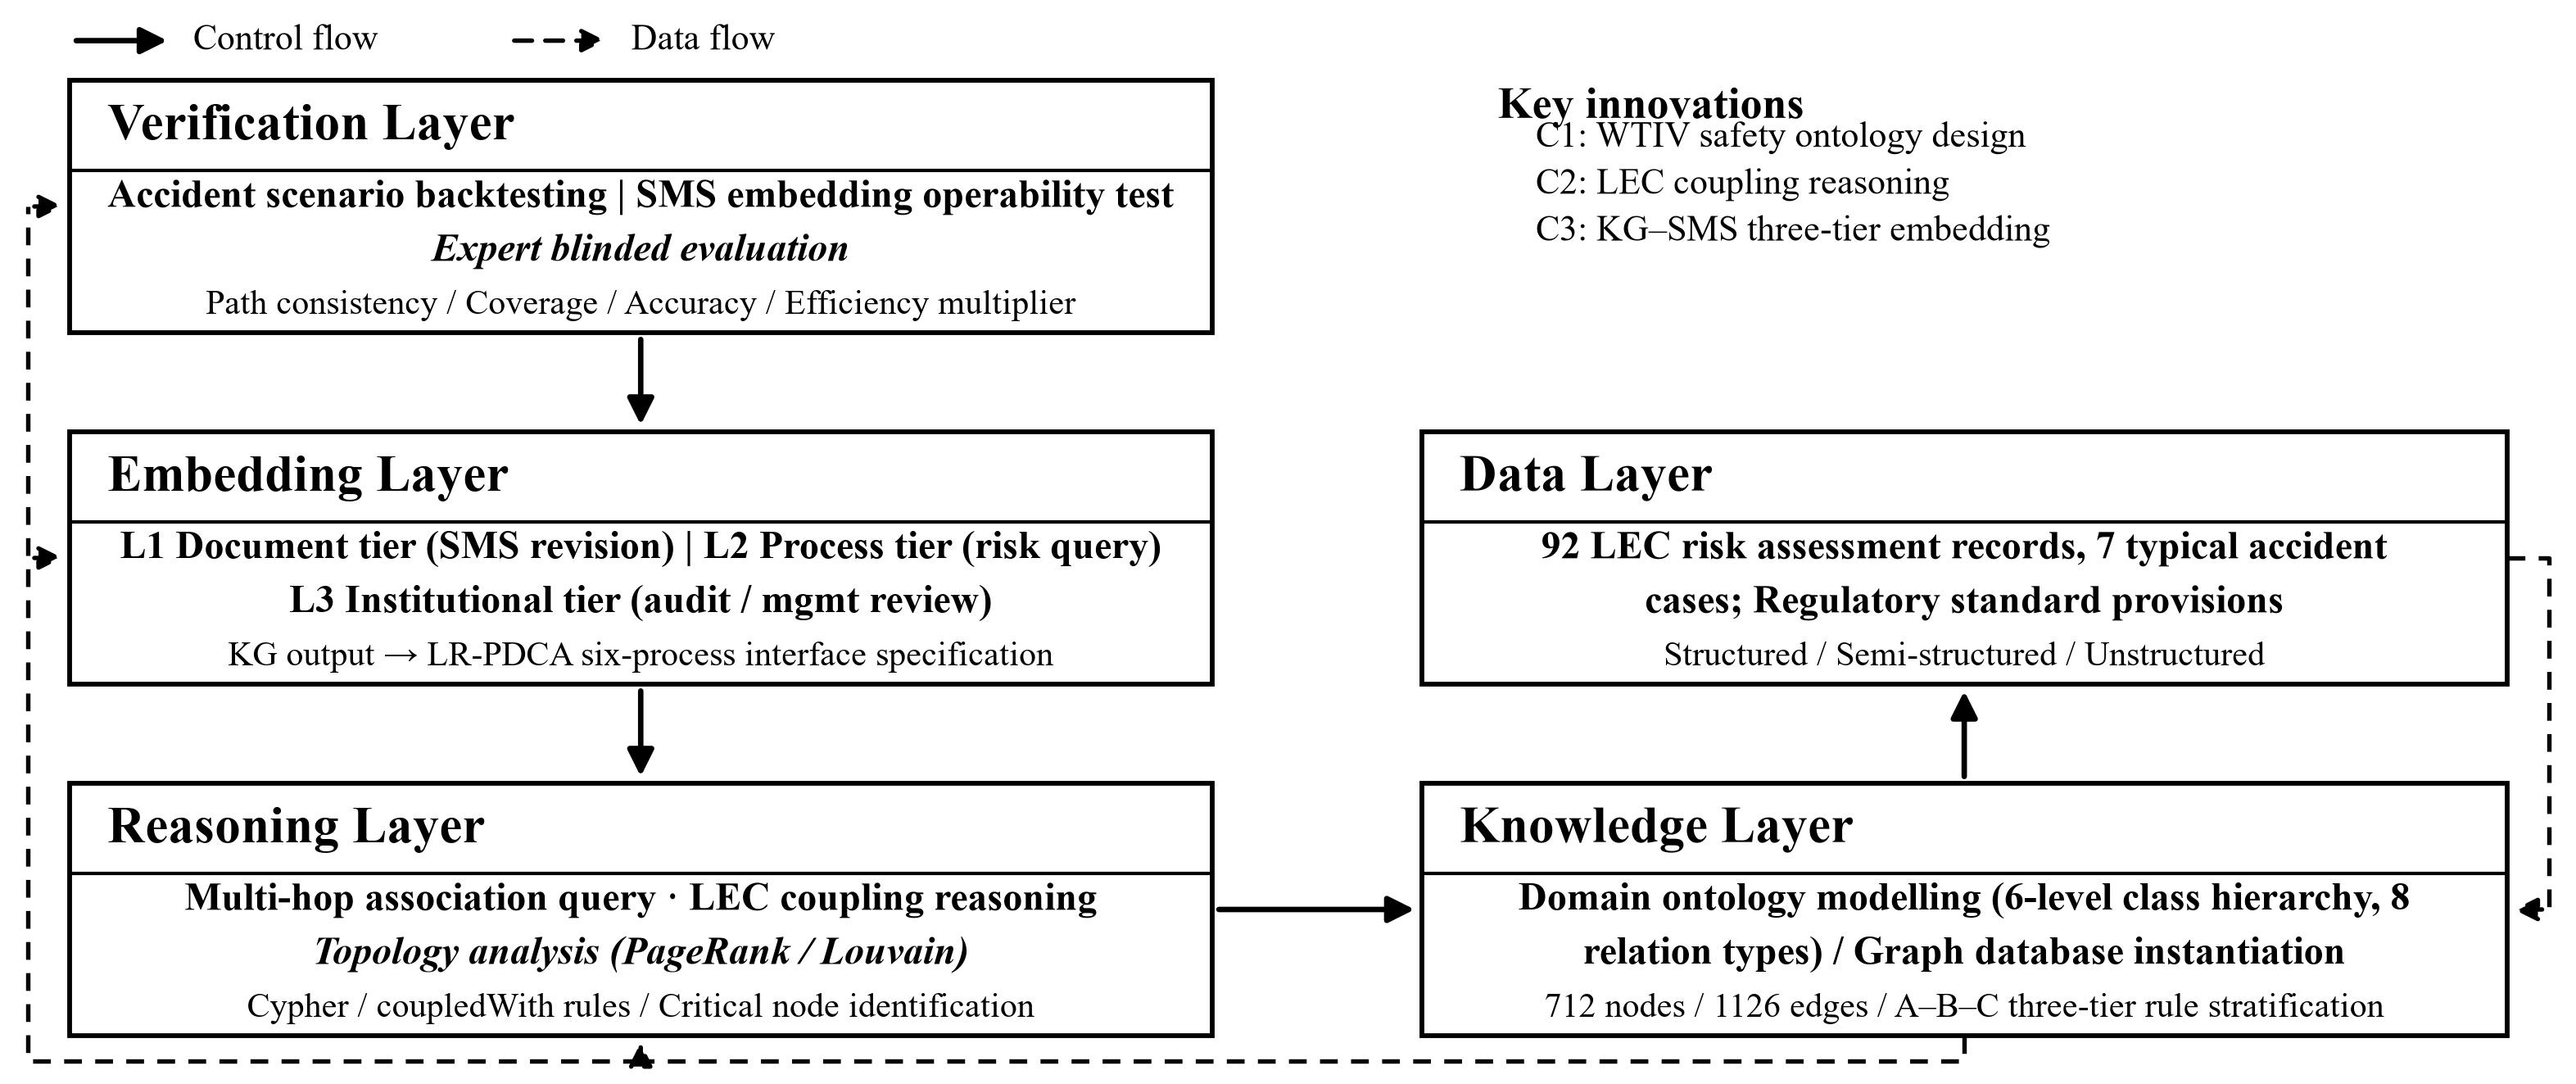
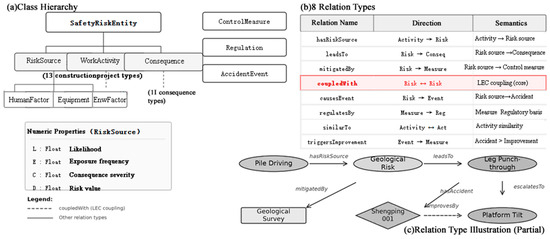
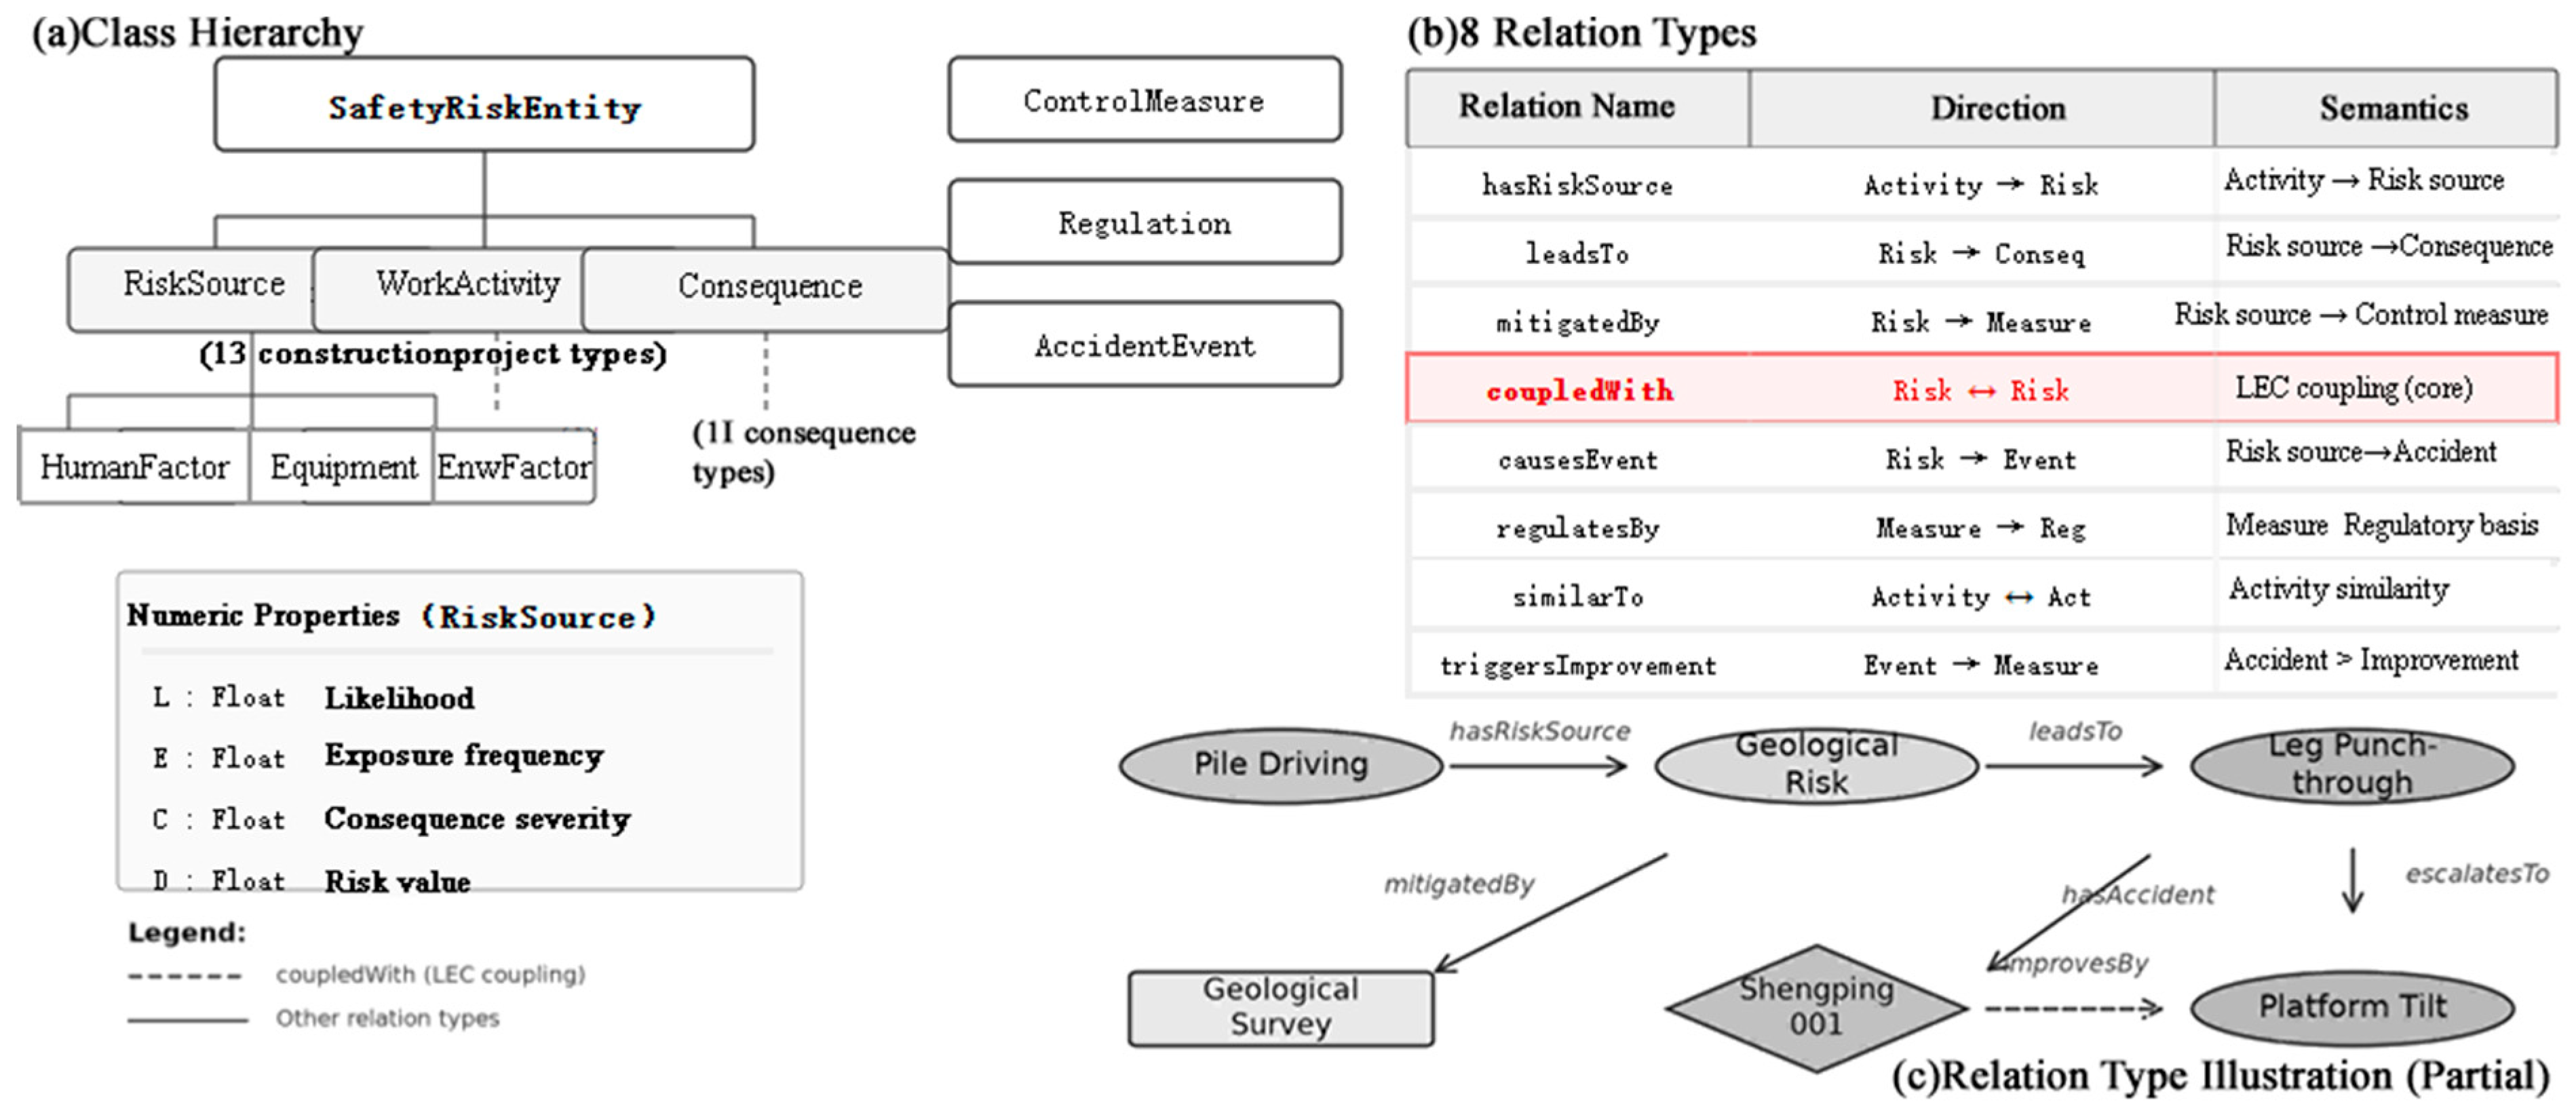
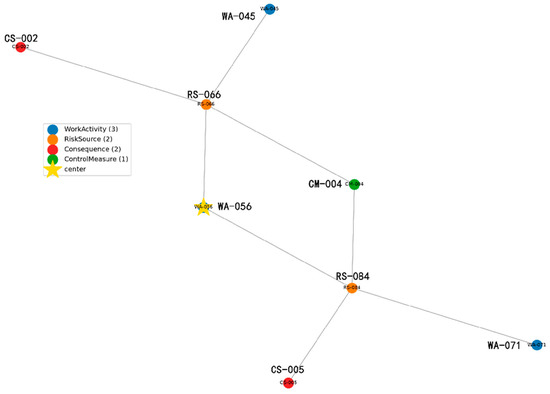
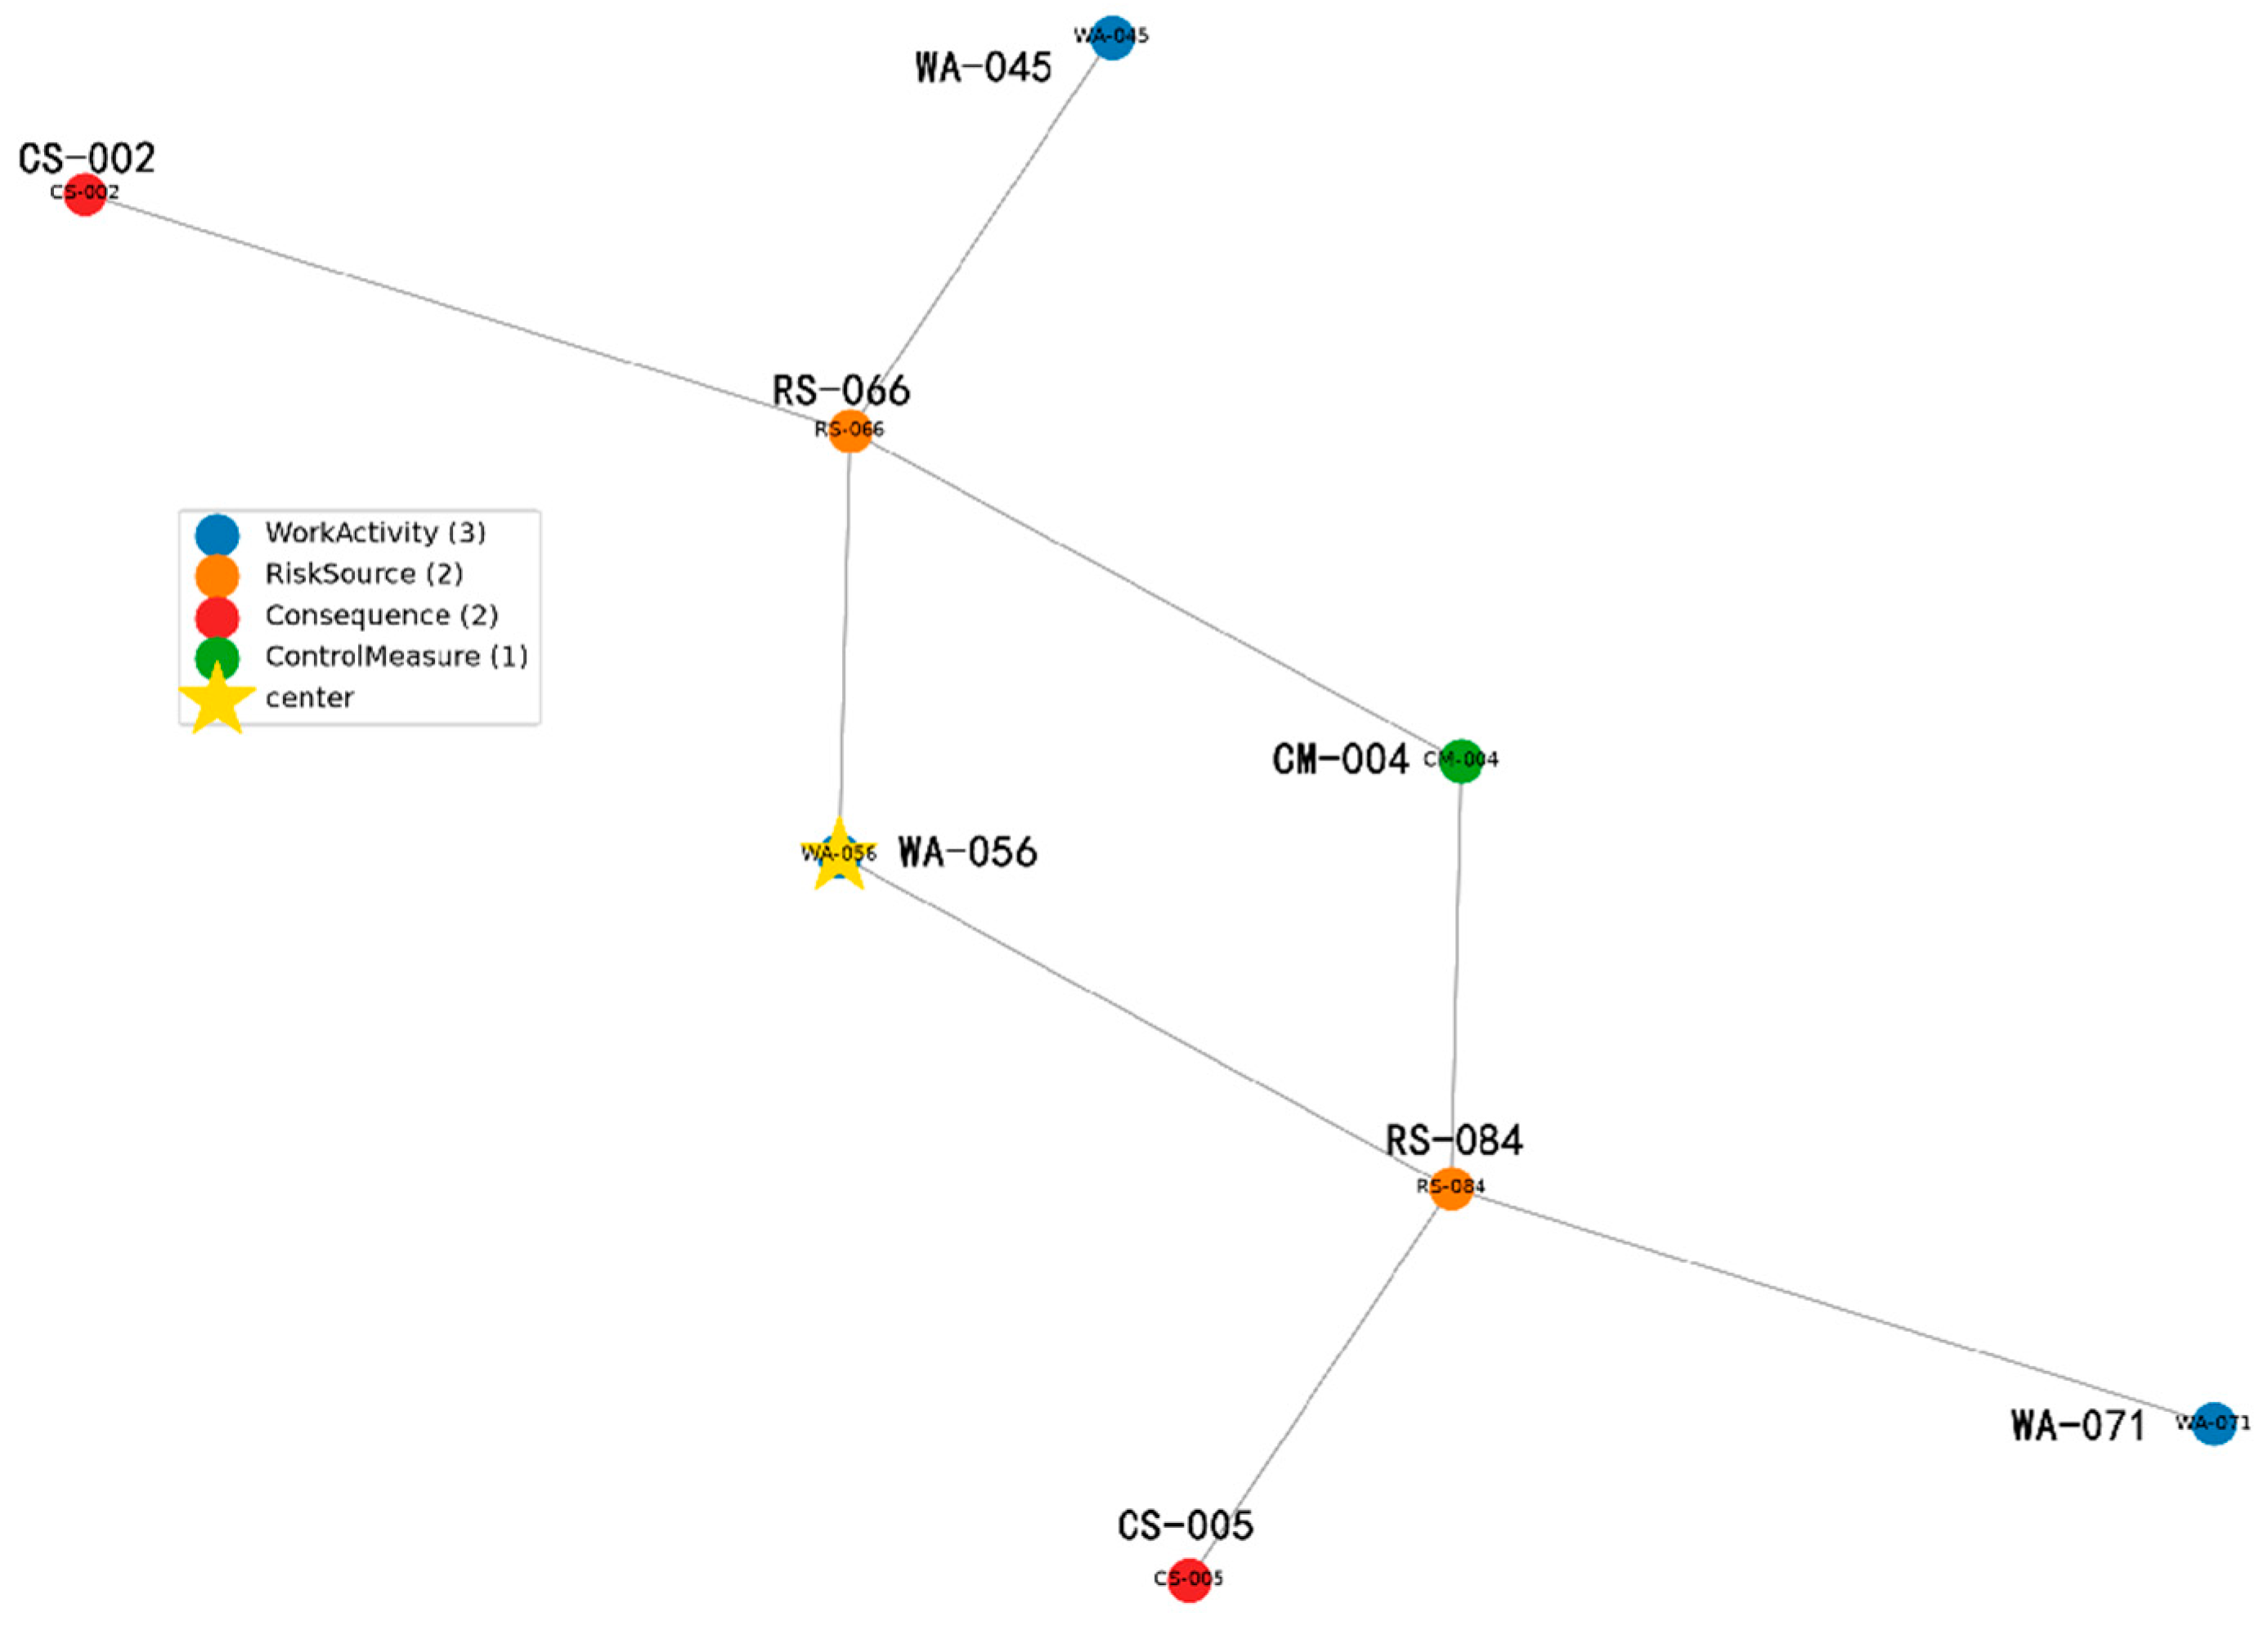
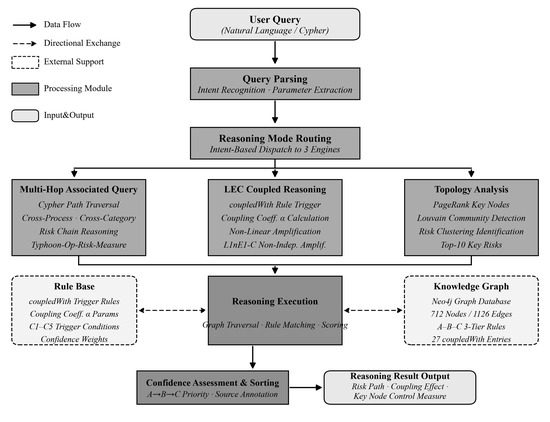
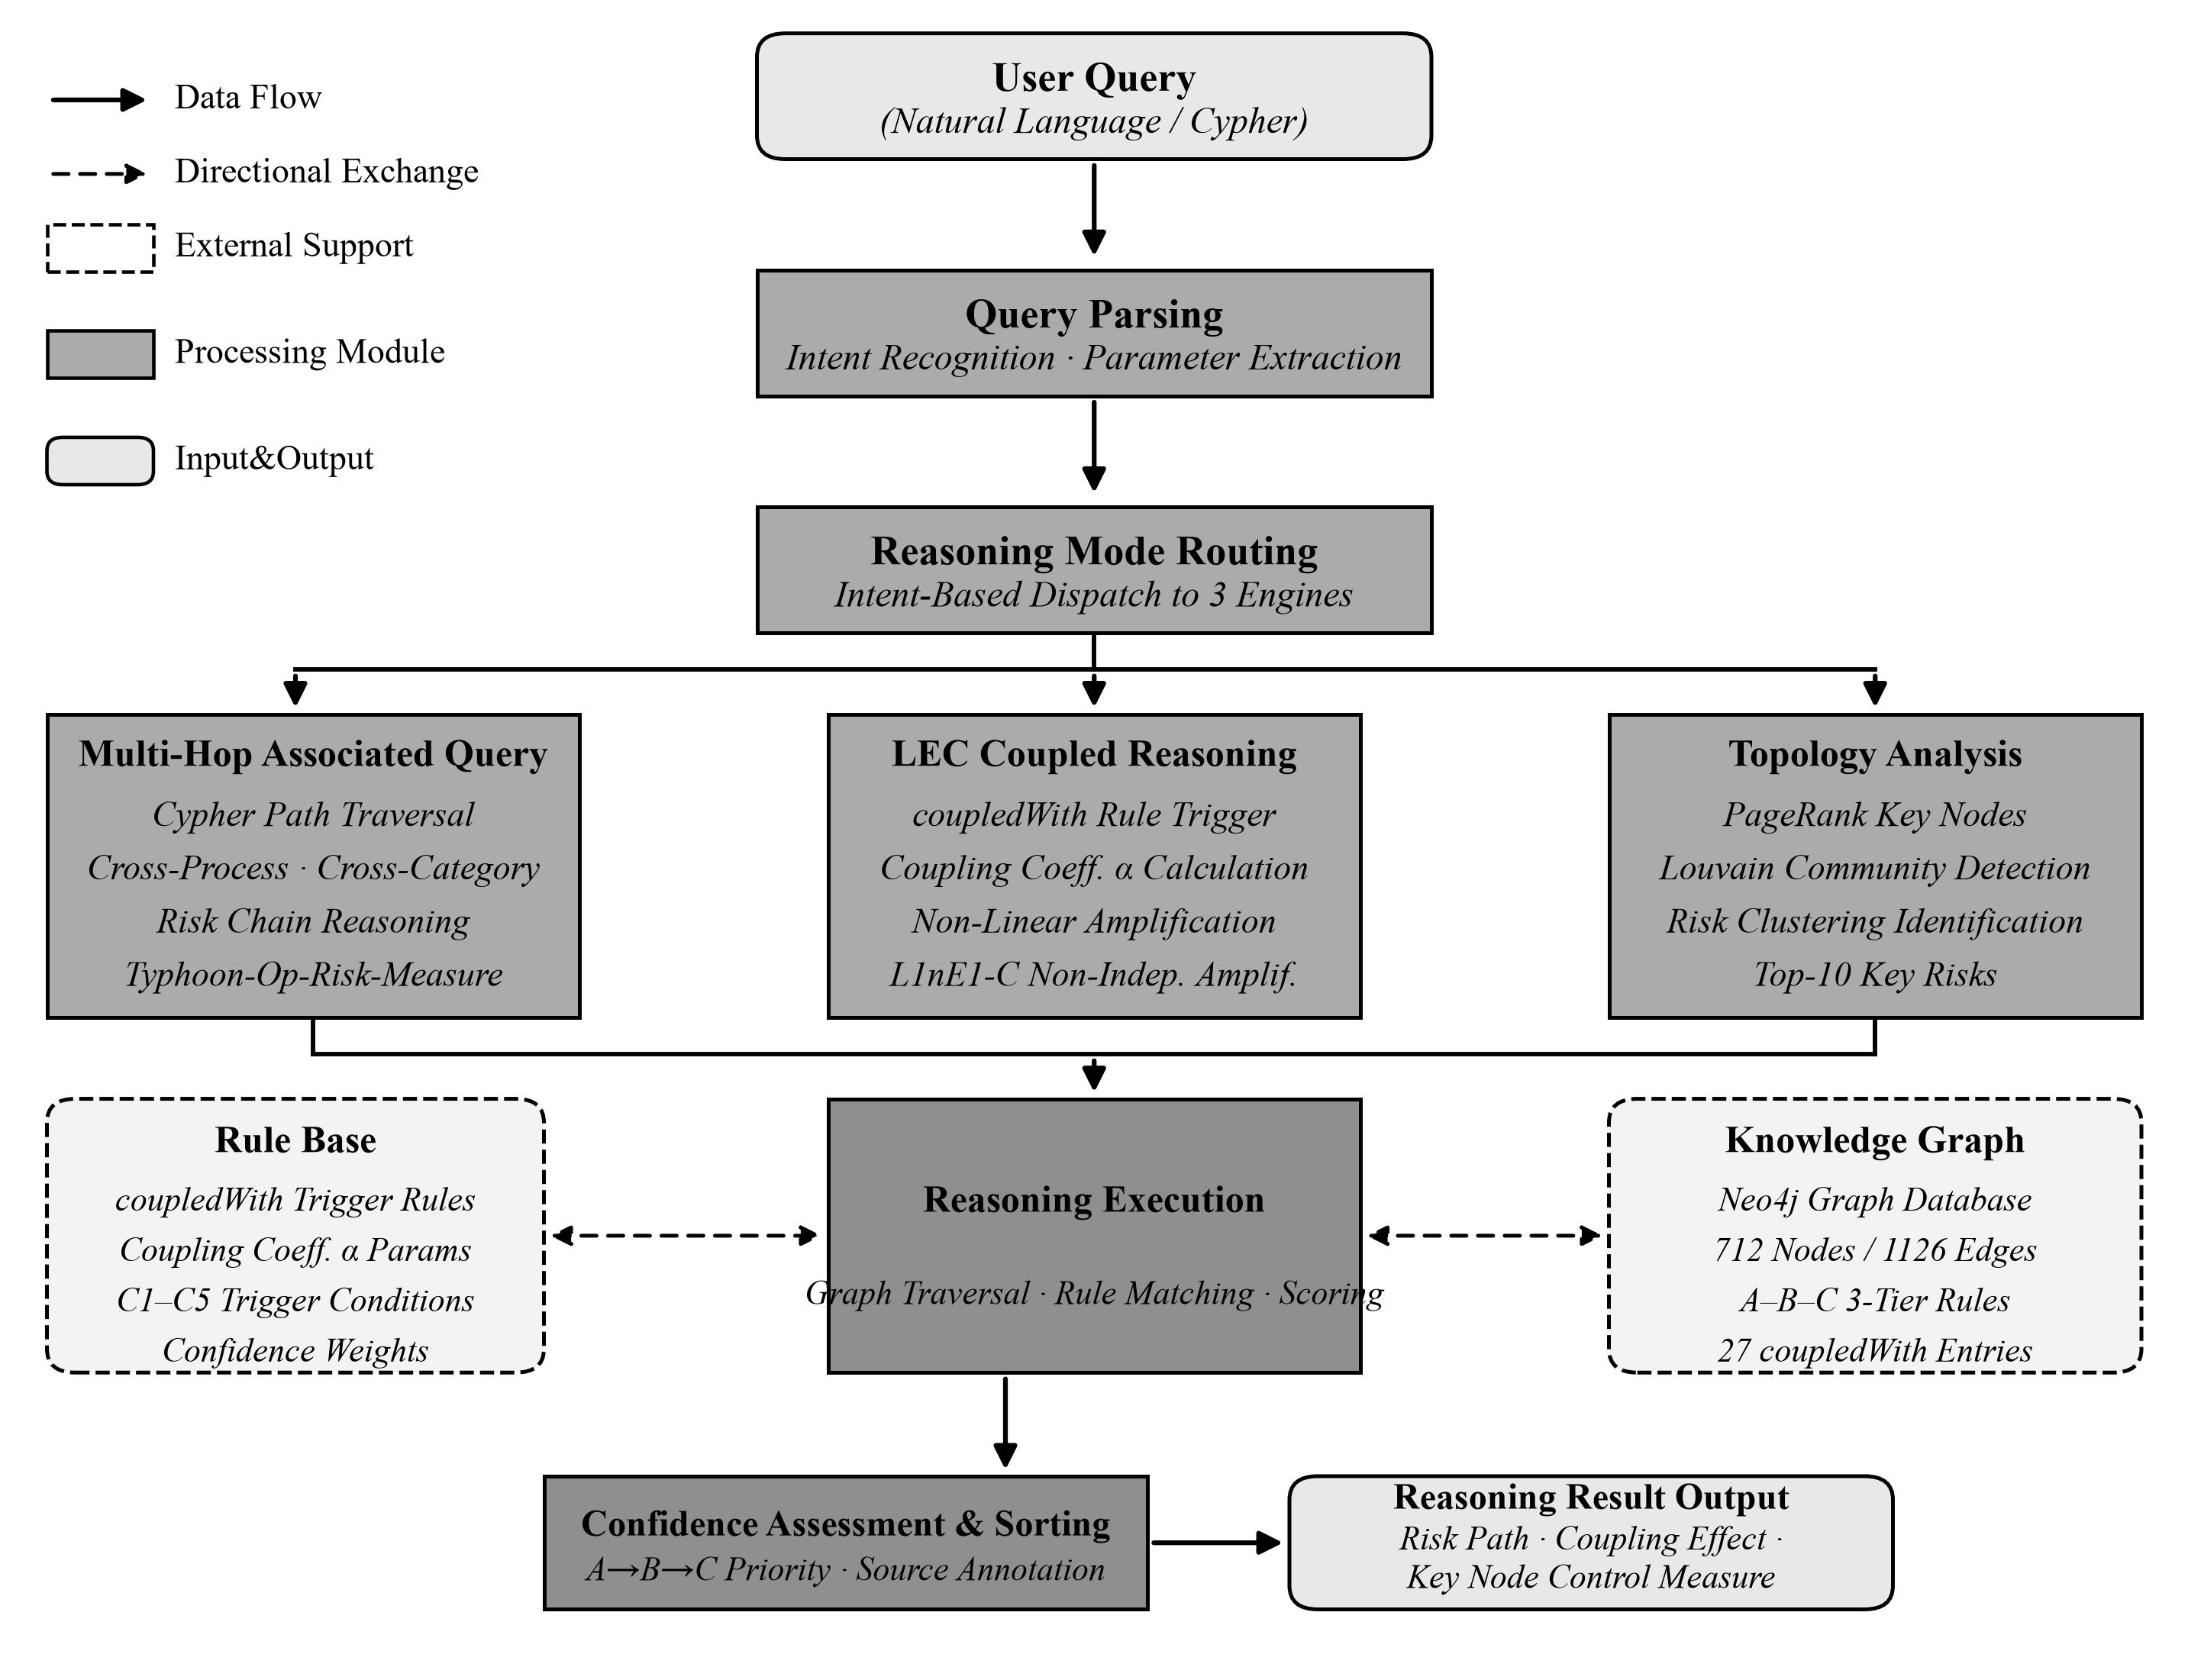
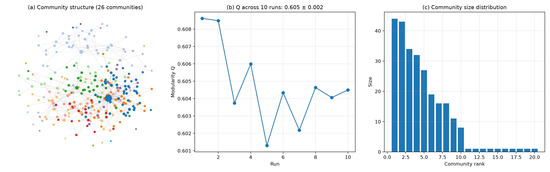
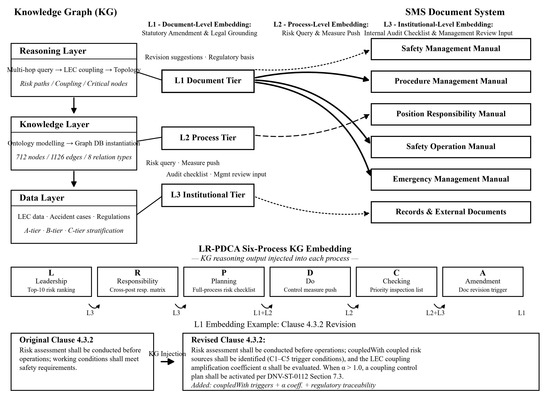
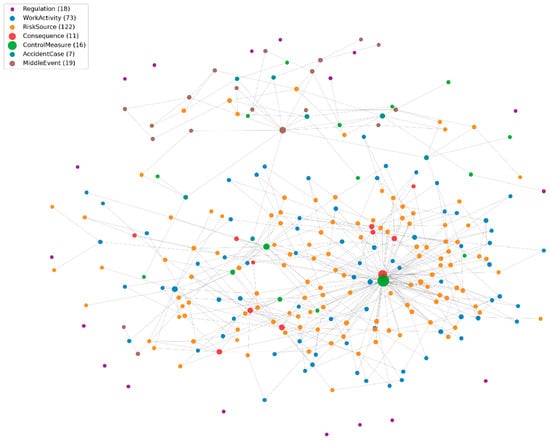
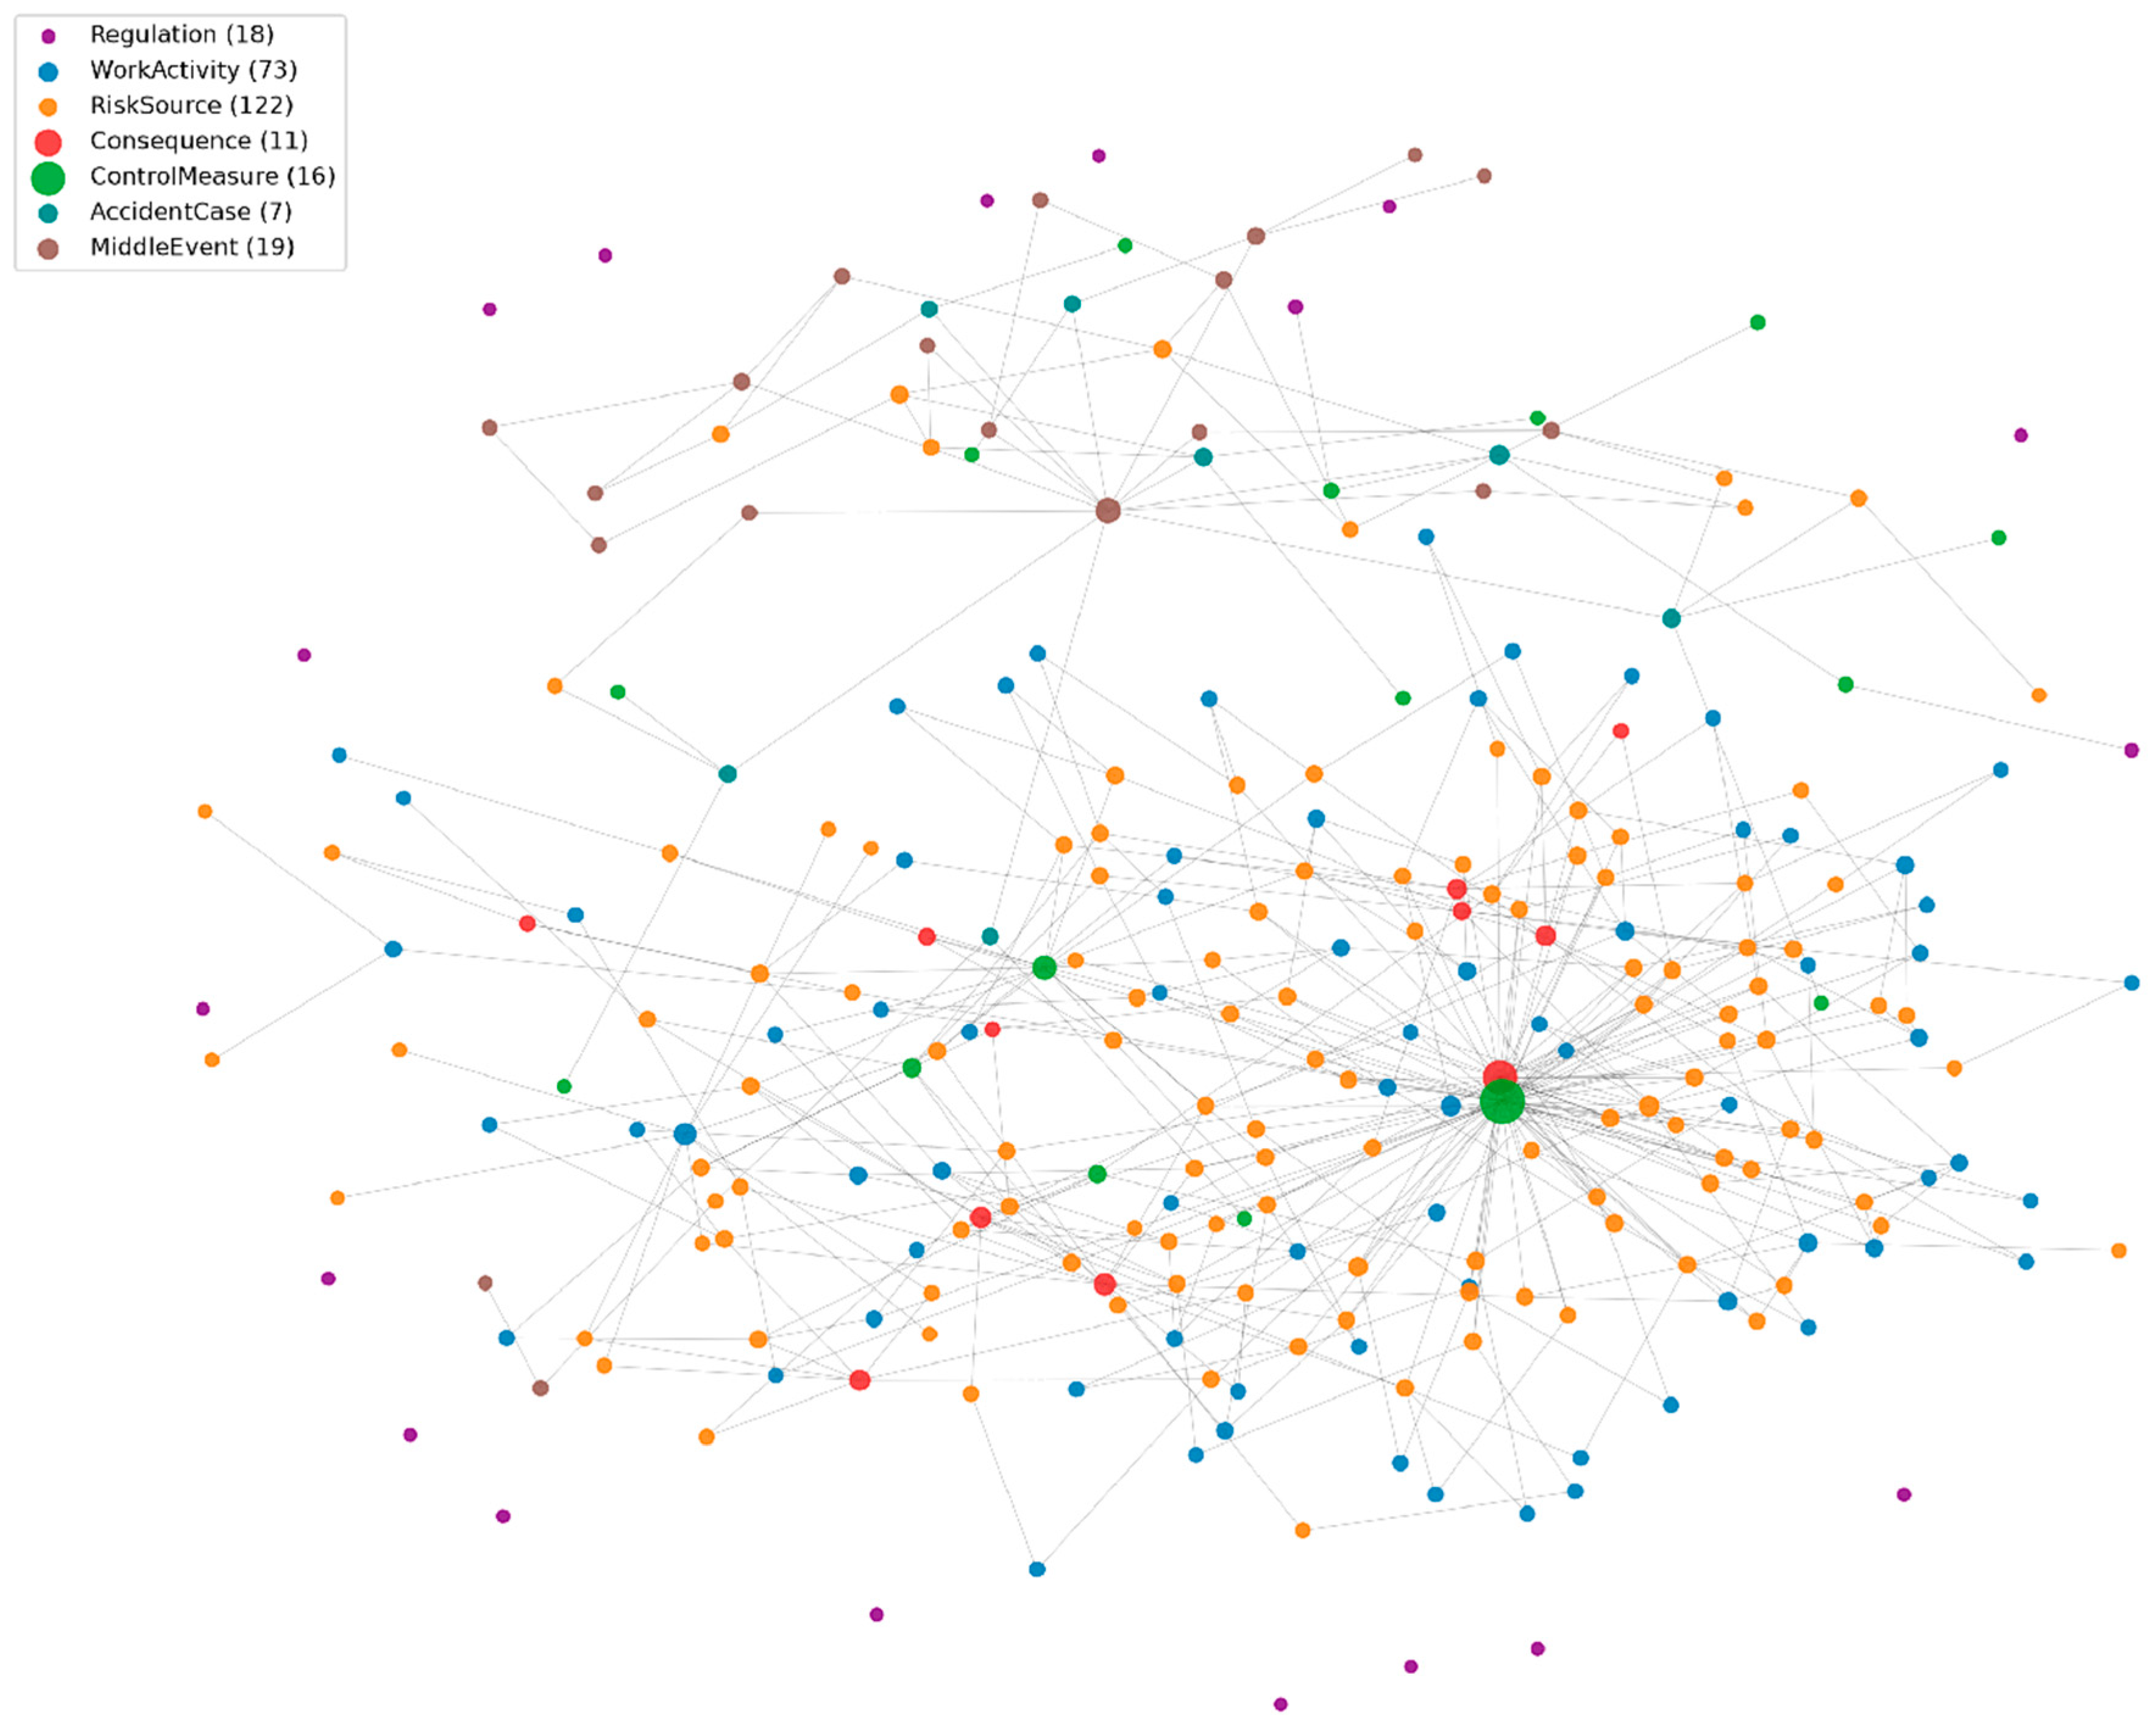

Disclaimer/Publisher’s Note: The statements, opinions and data contained in all publications are solely those of the individual author(s) and contributor(s) and not of MDPI and/or the editor(s). MDPI and/or the editor(s) disclaim responsibility for any injury to people or property resulting from any ideas, methods, instructions or products referred to in the content. |
© 2026 by the authors. Licensee MDPI, Basel, Switzerland. This article is an open access article distributed under the terms and conditions of the Creative Commons Attribution (CC BY) license.