


Abstract
During perforating operations in high-pressure deep wells, detonation-induced pressure waves propagate through the perforating fluid and excite local tubing motion and stress. Previous studies have addressed shock pressure and tubing-string vibration, but the combined effects of fluid density and viscosity on local axial motion and reference yield margin remain insufficiently quantified under consistent loading conditions. A coupled structured arbitrary Lagrangian–Eulerian (S-ALE) fluid–structure model was used to examine 16 density–viscosity combinations at an initial pressure of 96 MPa. Axial displacement and acceleration were evaluated near the equivalent charge, and von Mises stress was evaluated in a tubing element adjacent to the packer. The safety factor of the tubing string was calculated based on the reference yield strength of P110 steel. At fixed viscosity, increasing density from 1.0 to 2.5 g/cm3 increased peak axial displacement, axial acceleration, and equivalent stress by up to 125.13%, 60.66%, and 31.13%, respectively. At fixed density, increasing viscosity from 20 to 110 mPa·s reduced these peaks by up to 24.53%, 46.45%, and 14.86%, respectively. The local reference yield safety factor ranged from 1.21 to 1.79. Within the modeled conditions, lower density and higher viscosity reduced the predicted local axial motion and equivalent stress.
1. Introduction
Perforating is a well-completion operation that establishes hydraulic communication between the reservoir and the wellbore. Shaped-charge jets penetrate the casing, cement sheath, and reservoir rock to create flow paths for formation fluids and subsequent stimulation treatments [1]. In high-pressure deep wells, charge detonation generates pressure waves that propagate through the perforating fluid and load the adjacent tubing and casing, inducing vibration and stress [2,3].
Perforating fluid is an important medium for transferring detonation loads to the tubing string. Previous studies have examined pressure fields, the tubing-string system, and local structural responses. Dou et al. [4] developed a gas–liquid two-phase model to study pressure pulsations when perforating fluid fills the perforating gun; they found that the downward drag force affects the strength of the tubing string and packer mandrel. Liu et al. [5], Deng et al. [6], and Zhang et al. [7] investigated the wellbore pressure field, the action of pressure waves on the packer, and the effects of initial pressure, fluid properties, and charge parameters on shock loading, respectively. Chen et al. [8] examined changes in tubing-conveyed perforating depth caused by fluid density and pressure, while Zhao et al. [9] analyzed the effect of high-pressure gas volume on pressure pulsations in the well-control fluid. Baumann et al. [10,11,12,13] combined transient fluid-pressure prediction with structural load analysis for gunshock risk assessment and mitigation. Jia et al. [14] and Tang et al. [15] investigated local dynamic responses of the perforating gun and casing, respectively. Mao et al. [16] examined coupled longitudinal, transverse, and torsional vibration and failure under explosive loading. Liu et al. [17,18] studied fluid–structure interaction in the vibration of tubing-conveyed perforating strings and developed a three-dimensional impact model for a tubing string in a curved well. Yang et al. [19], Deng et al. [20], and Xi et al. [21] assessed tubing-string safety, optimized structural parameters, and analyzed the damage to wellbore bonding interfaces, respectively. Together, these studies connect the fluid loading with the structural response but do not establish how combinations of fluid density and viscosity affect the local tubing response and yield margin under the same detonation conditions.
For fluid–structure interaction involving large deformations under explosive loading, Liu et al. [22] used an ALE method to investigate shaped-charge jet penetration, Liu [23] used SPH–FEM to analyze perforating-fluid pressure pulsations and tubing-string vibration, and Dou et al. [24] and Wang [25] studied ALE penetration and fluid–structure interaction under complex boundary conditions, respectively. These studies highlight the need to account for the load transfer between fluids undergoing large deformations and structures in fluid–structure interaction models. Zhang et al. [26] and Tian et al. [27] applied S-ALE to underwater explosions and shaped-charge jet penetration. S-ALE’s structured background mesh and volume-fraction-based material initialization can represent the motion of detonation products and perforating fluid while keeping the fluid mesh and initial material arrangement consistent across property cases. S-ALE avoids the particle-neighbor searches required by SPH. Compared with the general ALE model setup, its structured mesh and volume-fraction initialization simplify fluid-domain meshing and material placement and may reduce computational time and memory requirements in large simulations. These features make S-ALE suitable for the present coupled analysis of explosive loading and large perforating-fluid deformation.
Li et al. [28] examined how casing boundaries and high liquid-column pressure affect pressure-wave reflection and attenuation. Li et al. [29] compared measured perforating pressure and tubing-string vibration with ALE simulations, showing the importance of monitoring location and boundary conditions when interpreting a predicted response. The combined effects of perforating-fluid density and viscosity on local tubing motion and strength under consistent detonation conditions remain less well quantified. Accordingly, we use a coupled S-ALE model to compare 16 density–viscosity combinations with identical geometry, charge, initial pressure, and boundaries. We evaluate pressure pulsations, axial displacement, axial acceleration, equivalent stress, and a local reference yield safety factor to inform assessment of the modeled tubing response.
2. Coupled Fluid–Structure Model of Perforating Fluid and Tubing Dynamics in a High-Pressure Deep Well
To examine how perforating-fluid properties affect local tubing dynamics, we developed a coupled S-ALE model of the fluid and tubing string in LS-DYNA. The fluid and detonation products were initialized on a structured background mesh using material volume fractions, while the tubing was discretized with Lagrangian solid elements. Loads were transferred across the fluid–structure interface. Four fluid densities and four viscosities were combined into 16 cases with identical mesh, geometry, and boundary conditions.
2.1. Governing Equations of the Structured Arbitrary Lagrangian–Eulerian Coupled Model
S-ALE permits material motion relative to the mesh and can therefore represent large deformations of the detonation products and perforating fluid. The fluid–structure coupling algorithm transfers fluid-pressure loading to the tubing. In an ALE description, the material derivative of is
Here, is pressure (MPa), t is time (µs), is the mesh reference coordinate (mm), is the material-velocity vector (mm/µs), is the mesh-velocity vector (mm/µs), and − is the material’s convective velocity relative to the mesh (mm/µs).
When the material and mesh velocities differ, ALE represents large fluid deformations by transporting material through the mesh. Conservation of mass and momentum for the perforating fluid and detonation products are given, respectively, by
Here, is the current material density (g/cm3), t is time (µs), is the material-velocity vector (mm/µs), is the stress tensor (MPa), and b is body force per unit mass (mm/µs2). The S-ALE fluid domain is coupled to the Lagrangian structure to represent pressure propagation after detonation and the resulting dynamic load on the tubing.
2.2. Physical Model of the Perforating Fluid and Tubing String
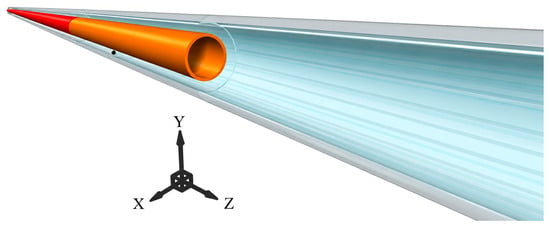
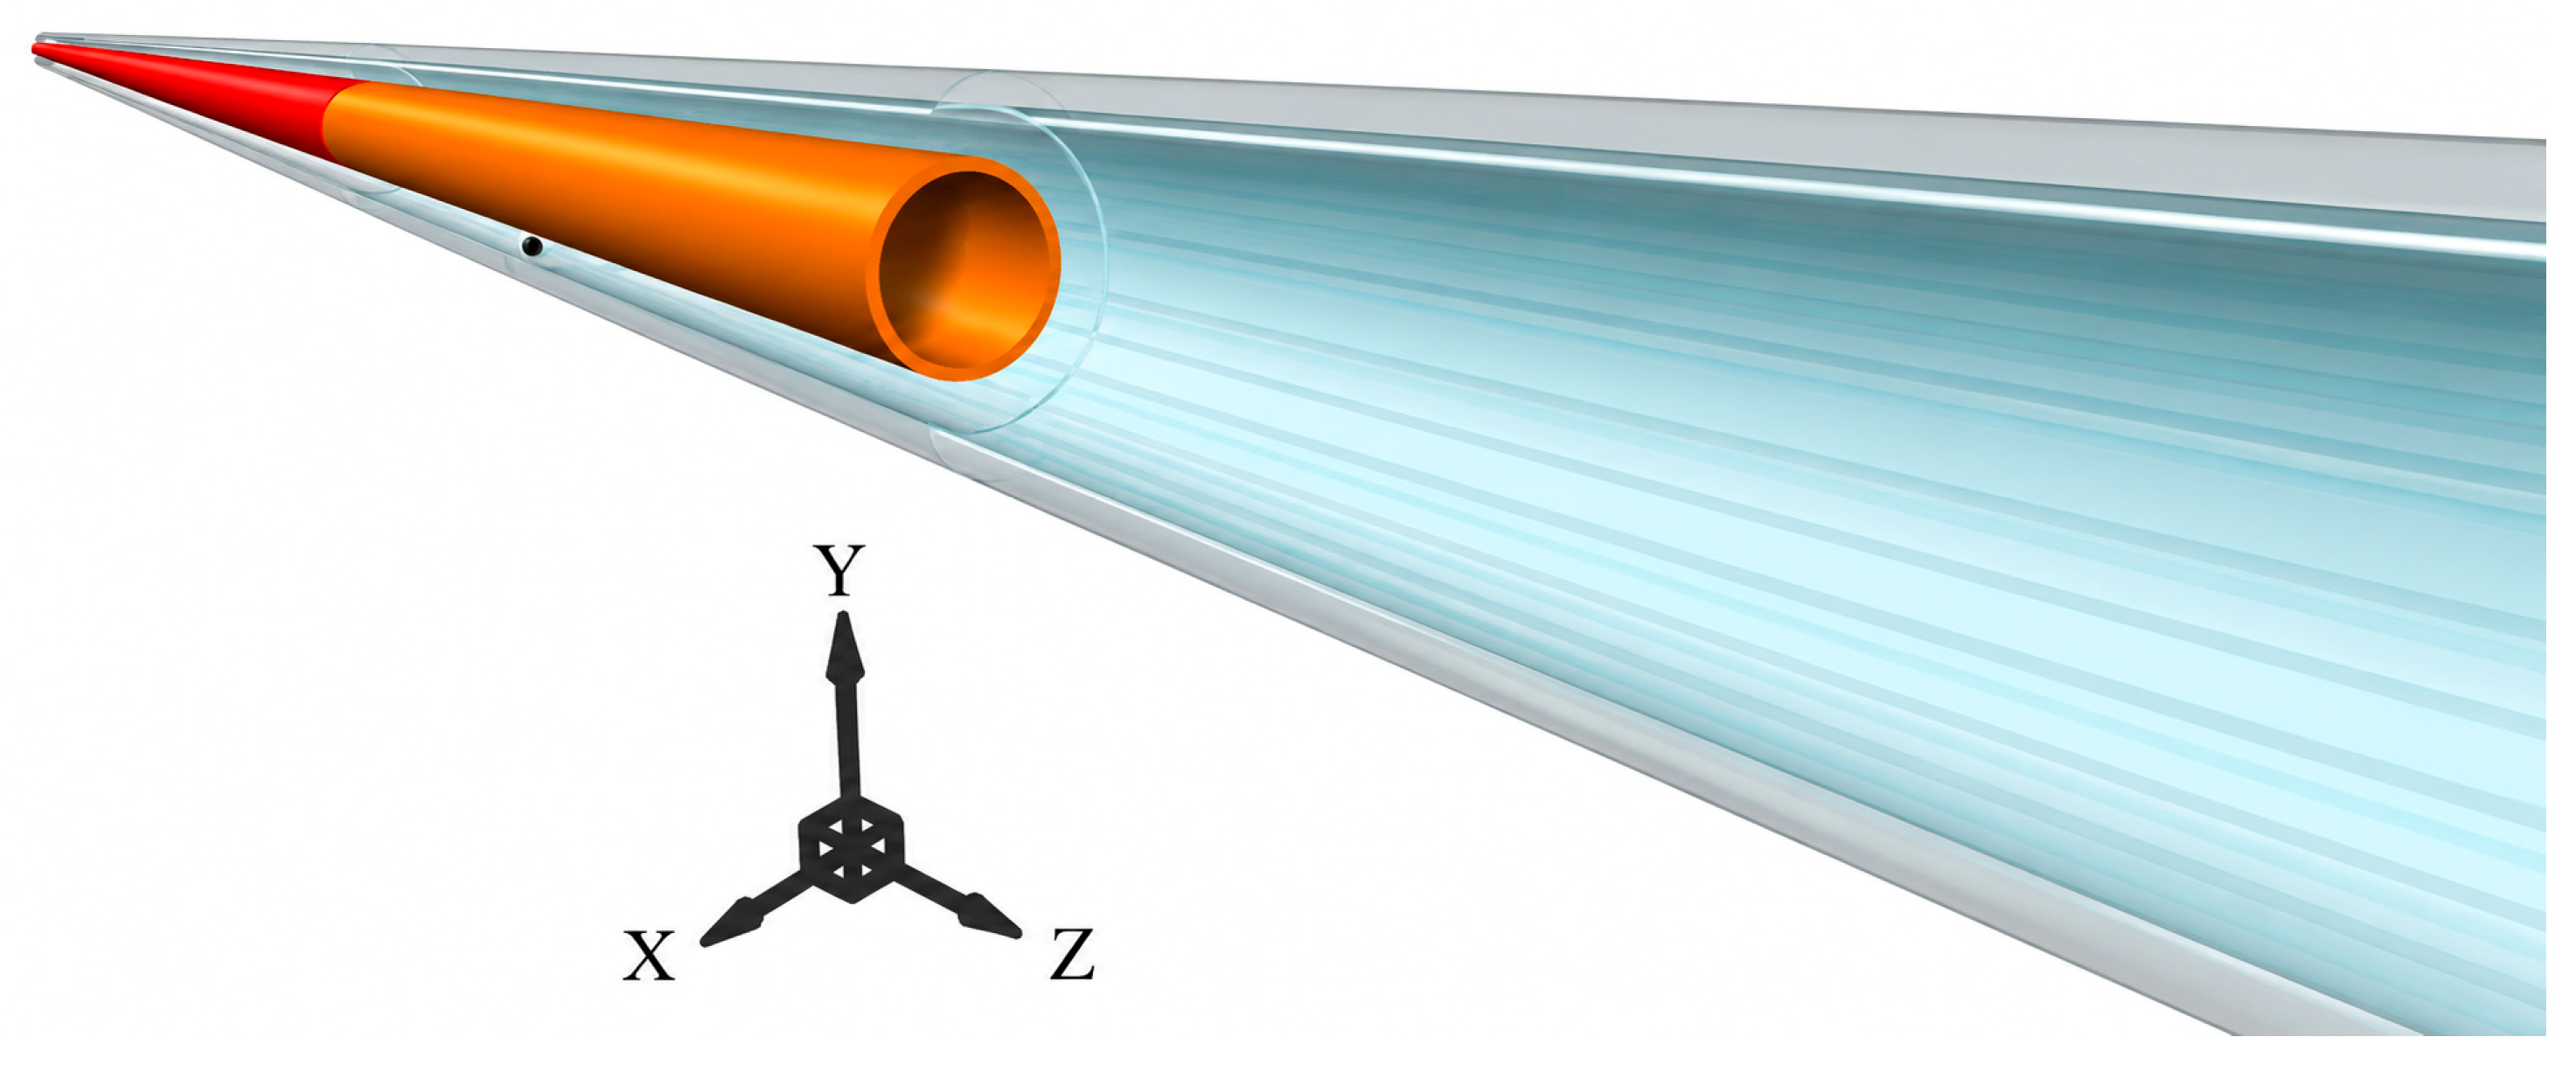
The model comprises the tubing, casing, perforating gun, equivalent explosive charge, perforating fluid, and packer (Figure 1). It represents the transfer of detonation-induced loading through the fluid to the tubing string.
Figure 1.
Composition and spatial arrangement of the downhole perforating system.Gray, orange, black, red, and blue indicate the casing, perforating gun, explosive charge, tubing, and perforating fluid, respectively.
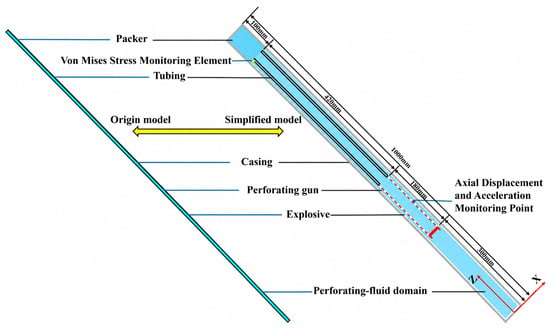
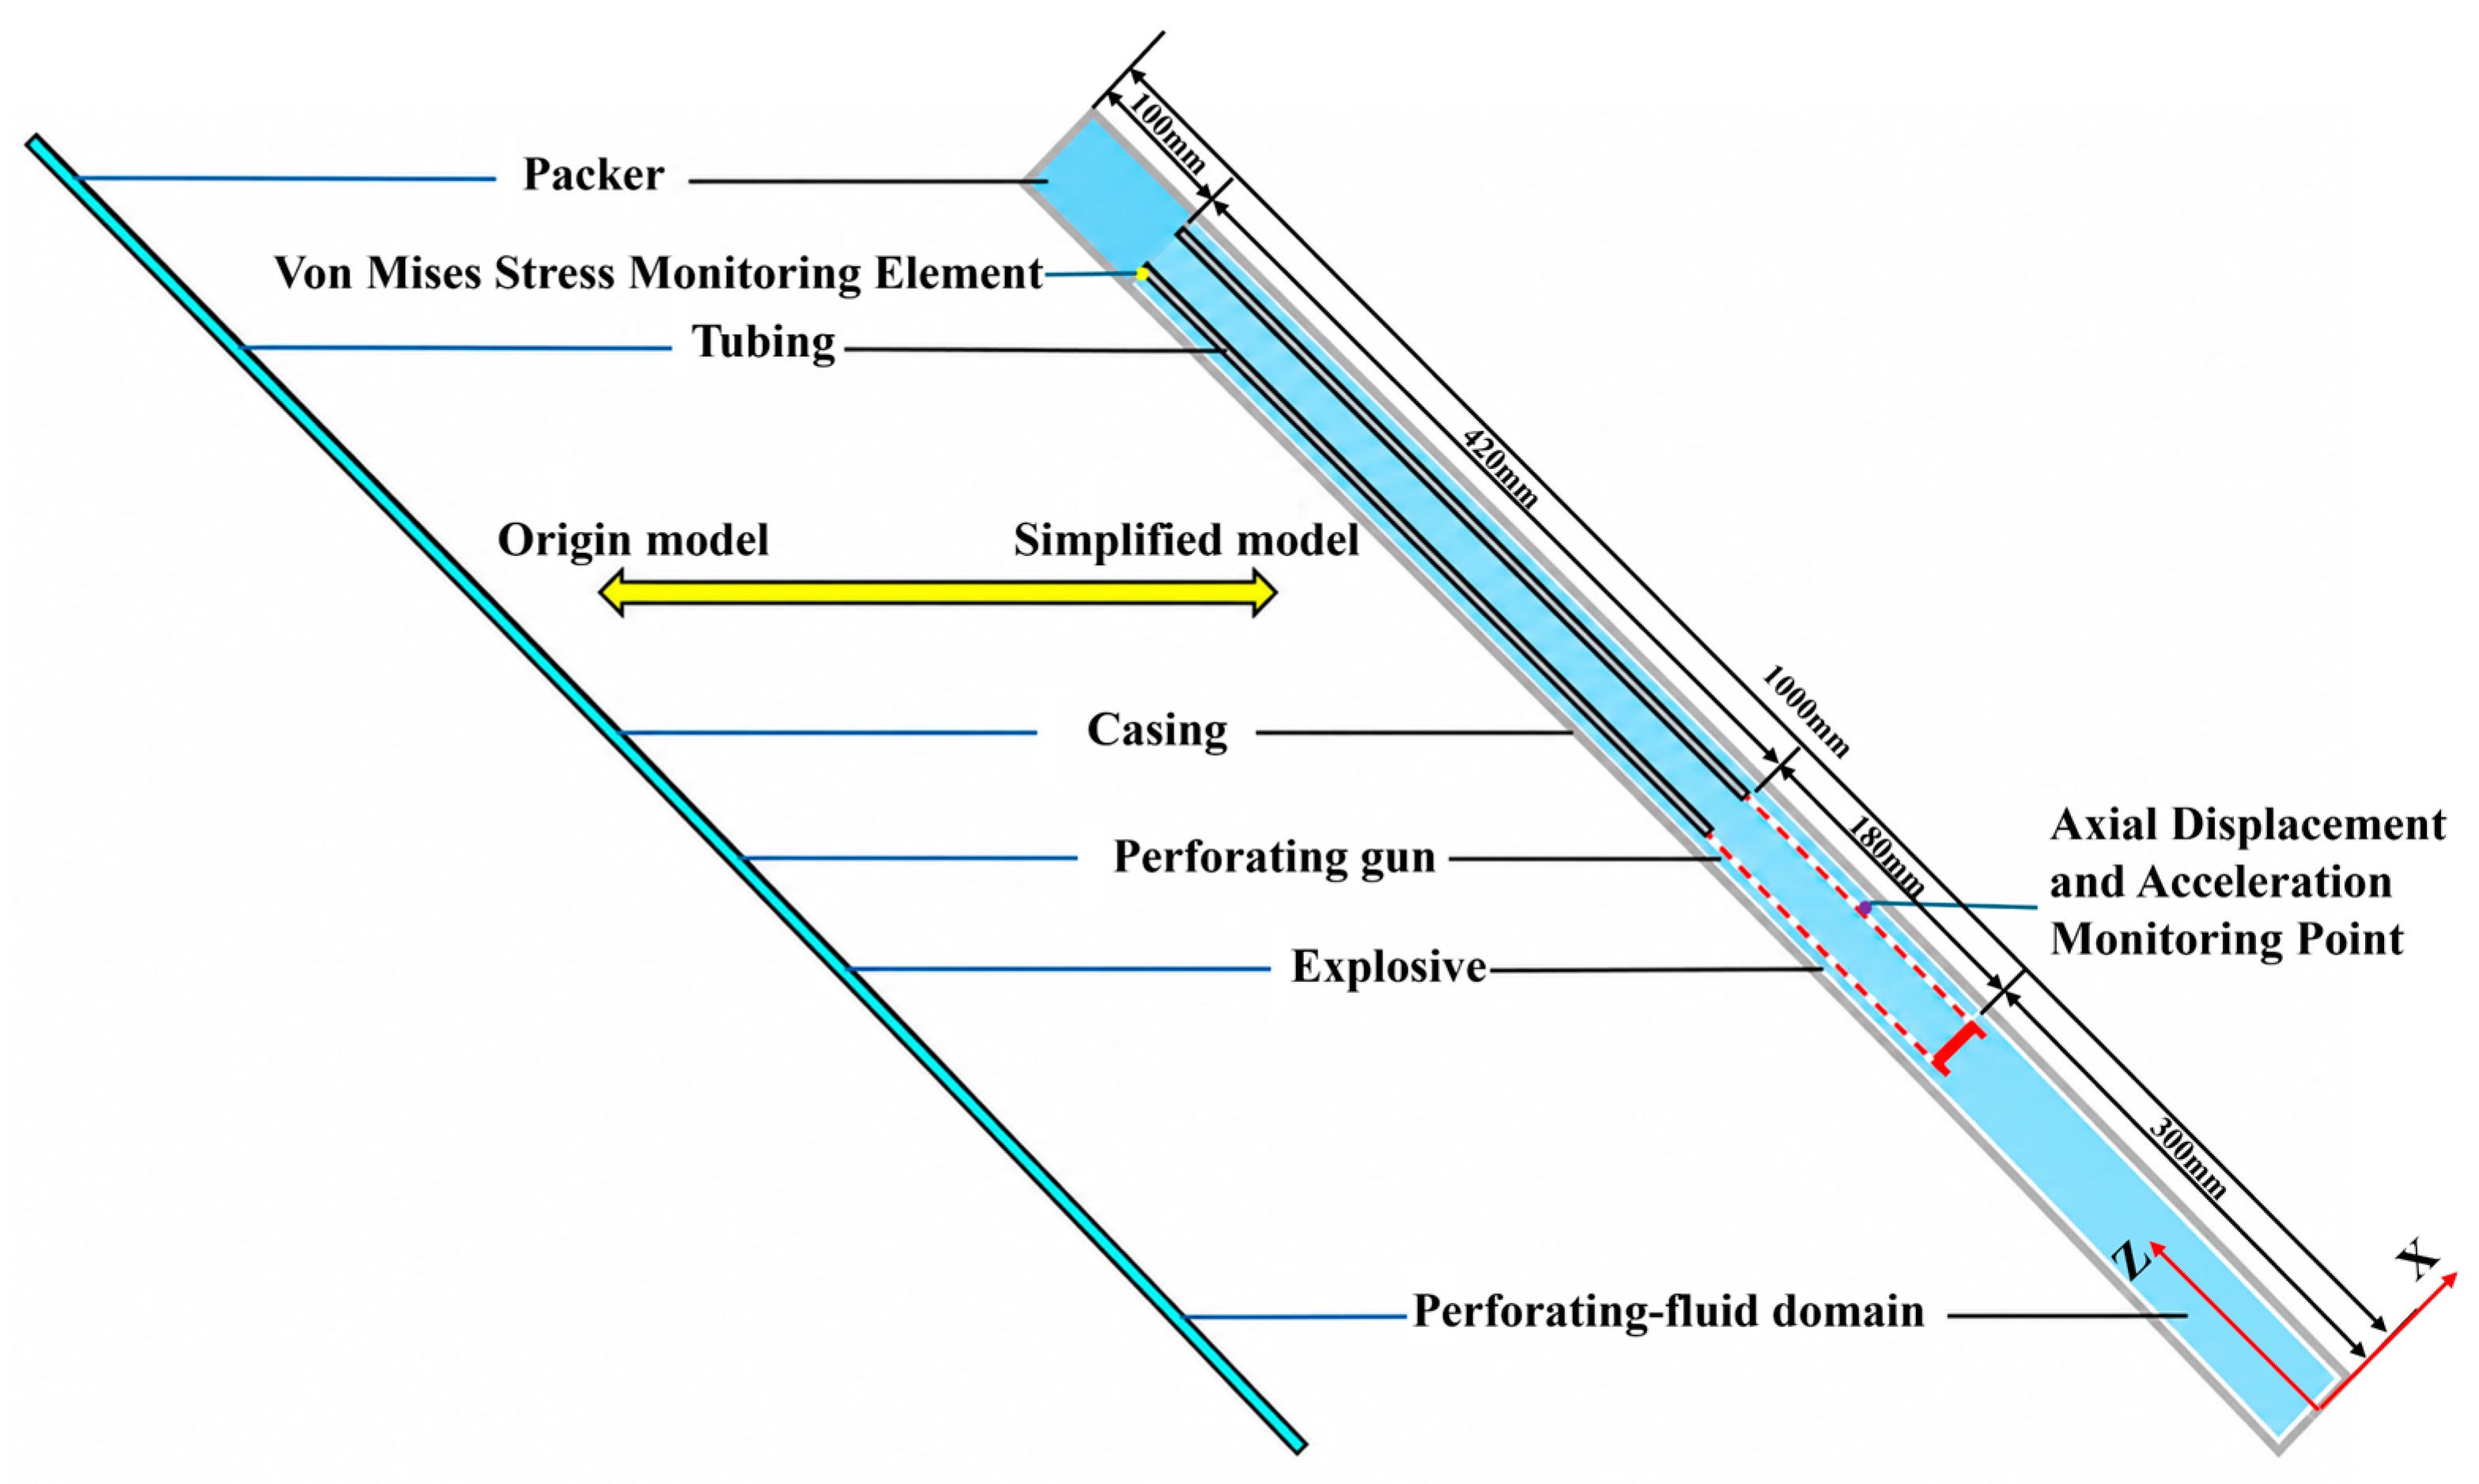
To balance the computational cost and resolution of near-charge dynamics, the axial model length was reduced to 1000.00 mm while preserving the relative positions and principal radial dimensions of the packer, tubing, casing, gun, charge, and fluid (Figure 2). The casing has an outer diameter of 139.70 mm and a wall thickness of 7.72 mm; the tubing has an outer diameter of 73.02 mm and a wall thickness of 7.01 mm. The explosive density is 1.84 g/cm3, and the charge is centered at (0, 0, 390) mm. Initial hydrostatic pressure at the perforating depth is 96.00 MPa, and the simulated duration is 5000 µs.
Figure 2.
Original slender tubing-string model and the axially shortened computational model. Labels identify the packer, tubing, original model, shortened model, casing, perforating gun, charge, fluid domain, equivalent-stress monitoring element, and axial displacement and acceleration monitoring point.
2.3. Material Models and Parameters
In LS-DYNA, the casing, tubing, and packer were assigned P110 steel through MAT_JOHNSON_COOK (*MAT_015). The Johnson–Cook flow-stress relation is given in Equation (4).
Here, σᵧ is instantaneous flow stress (MPa); A is the initial yield stress at the reference state (MPa); B is the strain-hardening coefficient (MPa); εp is the equivalent plastic strain; n is the hardening exponent; C is the strain-rate sensitivity coefficient; is the ratio of equivalent plastic strain rate to its reference value; m is the thermal-softening exponent; T* is the dimensionless temperature; T is the current material temperature (K); and Tr and Tm are the reference and melting temperatures (K), respectively. Table 1 lists the parameters.
Table 1.
Adopted P110 steel properties and Johnson–Cook parameters [30,31].
The explosive is described using RDX material properties through the MAT_HIGH_EXPLOSIVE_BURN material model in LS-DYNA, which captures its detonation process. The relationships among the pressure, relative volume, and internal energy of the detonation products are described using the Jones–Wilkins–Lee (JWL) state equation, as shown in Equation (5).
Here, p is the detonation-product pressure (MPa); A and B are pressure coefficients in the JWL equation of state (MPa); R1 and R2 are dimensionless parameters governing the pressure–relative-volume relationship; is a dimensionless Grüneisen-type coefficient; V is the dimensionless relative specific volume; and E is the internal energy per unit initial volume (MPa). E0 is the initial internal energy (MPa), and V0 is the dimensionless initial relative specific volume. The RDX material and JWL equation-of-state parameters are listed in Table 2.
Table 2.
RDX material and JWL equation-of-state parameters [32].
The perforating fluid is represented by MAT_NULL (*MAT_009) in LS-DYNA. The model provides no shear strength, with its dynamic viscosity defined by the MU parameter. The fluid is treated as Newtonian, so viscous stress varies linearly with the rate of deformation. The Grüneisen equation of state governs its volumetric pressure response. Within each case, the viscosity remains constant and does not vary with the pressure, temperature, or shear rate. The density and viscosity vary across cases, while the other equation-of-state parameters remain fixed. The equation of state is given in Equation (6).
Here, p is the perforating-fluid pressure (MPa); ρ0 and ρ are the initial and current fluid densities (g/cm3); C is the intercept of the shock-velocity–particle-velocity relation (mm/µs); S1 and S2 are its dimensionless coefficients; γ0 is the Grüneisen coefficient; and E is the internal energy per unit initial volume (MPa). The relative compression is η = ρ/ρ0 − 1, with η ≥ 0 for compression and η < 0 for expansion. We set S3 = 0 and a = 0. Table 3 gives the fluid material and equation-of-state parameters used in Equation (6).
Table 3.
Perforating-fluid material and equation-of-state parameters [33].
2.4. Perforation-Fluid Property Cases
As shown in Table 4, four perforating-fluid densities (1.0, 1.5, 2.0, and 2.5 g/cm3) and four dynamic viscosities (20, 50, 80, and 110 mPa·s) were combined in a 4 × 4 factorial design, giving 16 controlled cases [7]. The geometry, charge conditions, initial pressure, all other material parameters, boundary conditions, and output settings were identical across cases. The effect of density on the axial displacement, axial acceleration, and equivalent stress was compared at a fixed viscosity, and the effect of viscosity was compared at a fixed density. The 1.0 g/cm3 and 20 mPa·s case served as the baseline for the analysis of pressure pulsations. Response peaks and safety factors were then used to evaluate the effect of fluid properties on the tubing-string dynamics and strength under dynamic loading.
Table 4.
Perforating-fluid property combinations.
2.5. Boundary Conditions and Response Extraction
The tubular structures were discretized with eight-node hexahedral Lagrangian elements, and the perforating fluid and detonation products were represented on a structured S-ALE mesh. The structural mesh contained 43,328 solid elements and 60,140 nodes, with characteristic edge lengths of approximately 1–4 mm. The S-ALE domain contained 38 × 38 × 263 cells, totaling 379,772 cells and 401,544 nodes. Local S-ALE spacing near the charge was 1 mm and gradually increased to approximately 4 mm outside the refined region. The combined model contained 423,100 elements, including the S-ALE cells, and 461,684 nodes. Mesh-quality checks found no elements with nonpositive Jacobians or duplicate connectivity.
A quarter-symmetry model was used, with symmetry conditions imposed on the x = 0 and y = 0 planes. Nonreflecting boundary conditions were imposed on the outer S-ALE boundaries in the positive x and y directions and at both ends in the z direction [21]. The fluid–structure coupling penalty factor was 0.10.
The results describe the local dynamic response of the tubing string in the perforated interval. The fluid pressure and tubing axial motion were extracted near the charge, whereas the equivalent stress was extracted from a monitored tubing element near the packer. These responses represent different physical quantities and locations. The same monitoring locations and 0–5000 µs time window were used in all cases. The peak axial displacement and acceleration were defined as the maximum absolute values of their respective histories; the peak equivalent stress was the maximum of the monitored element’s stress history.
2.6. Mesh Sensitivity Analysis for the S-ALE Model
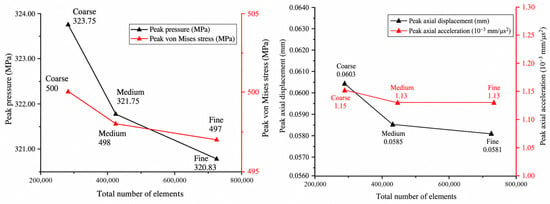
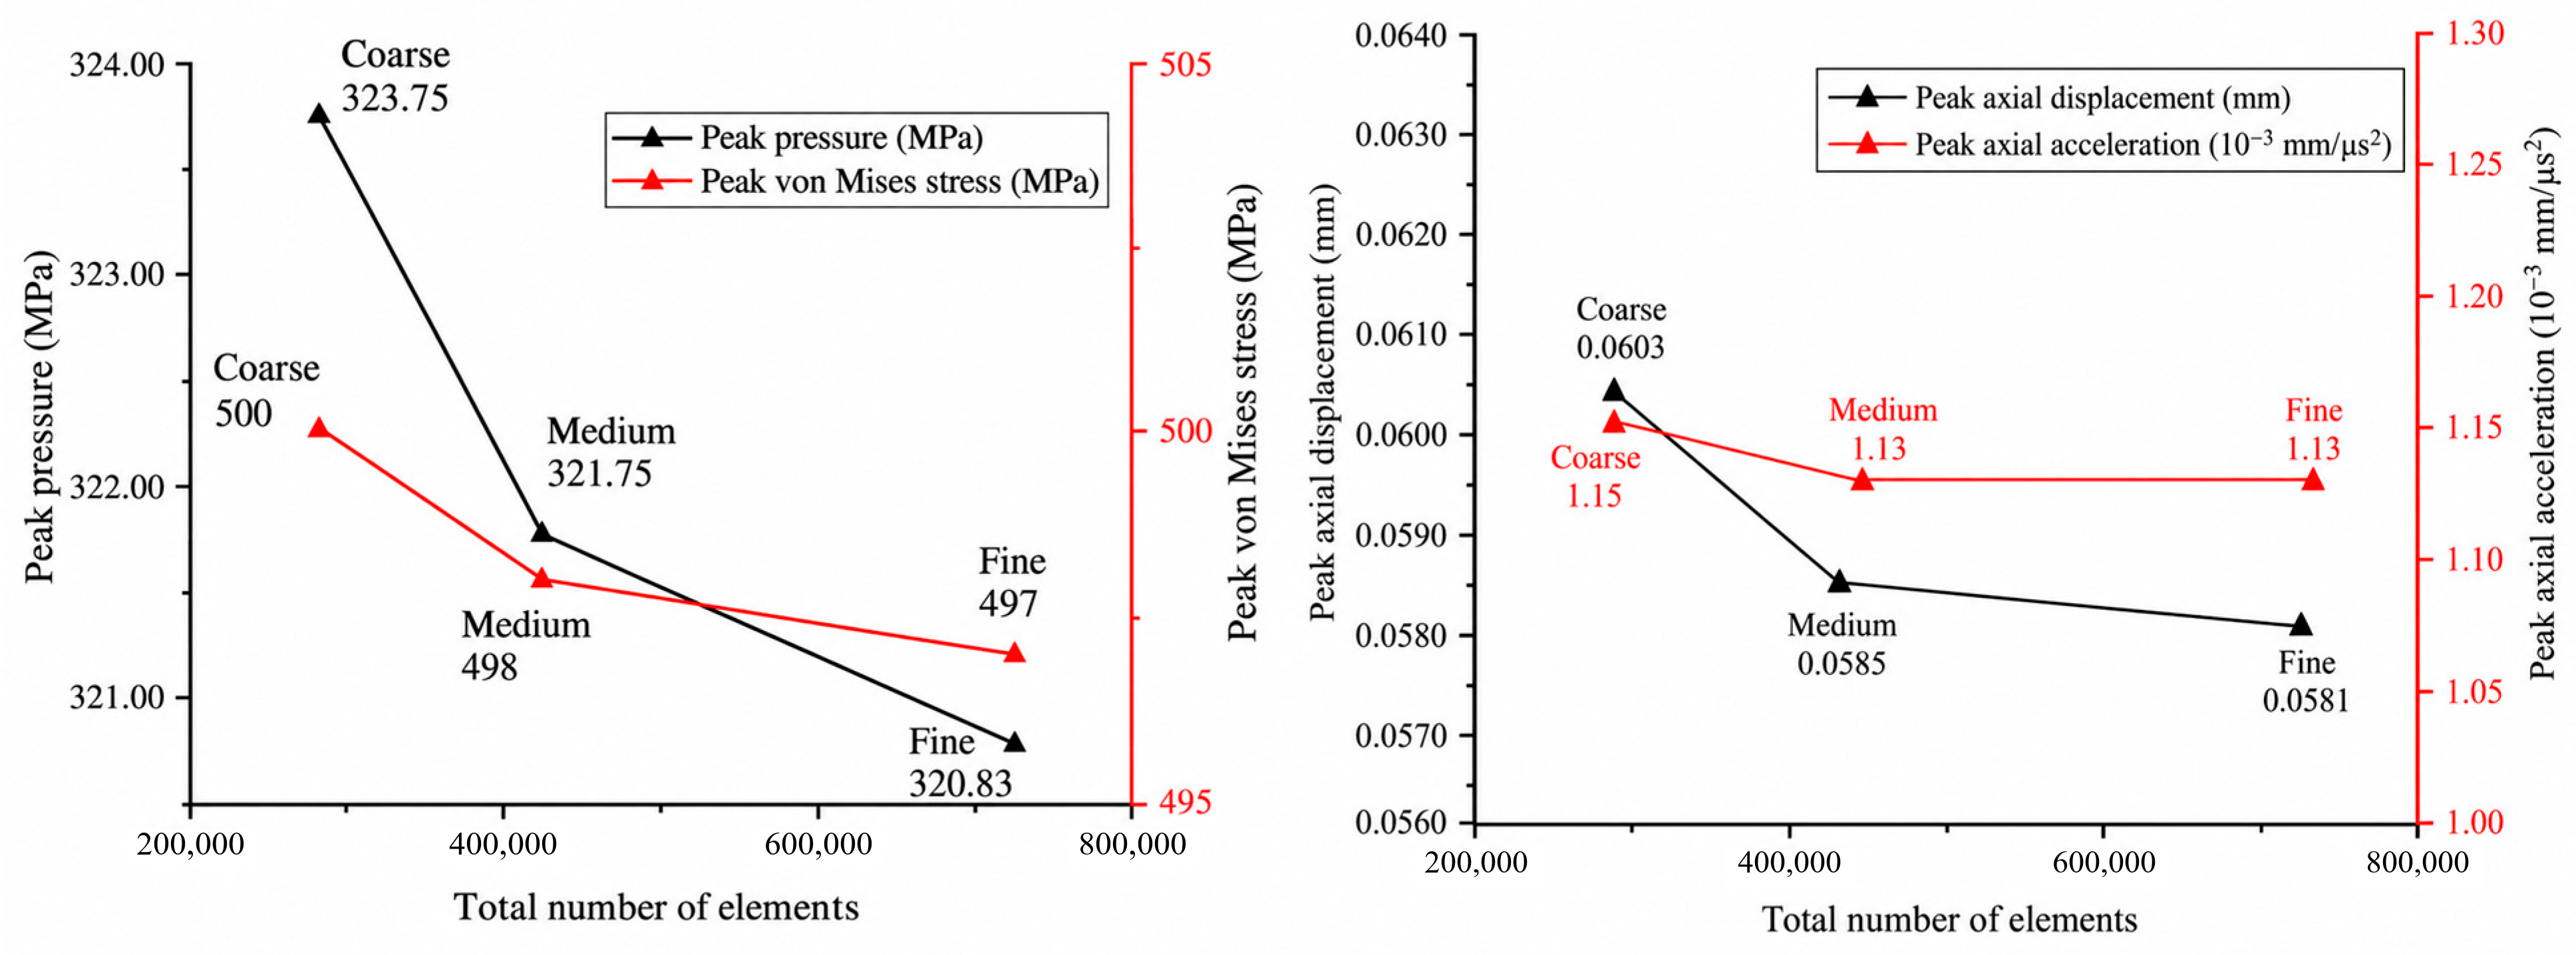
For the baseline case (density 1.0 g/cm3; viscosity 20 mPa·s), we compared three S-ALE meshes. Coarse, medium, and fine meshes had near-charge cell sizes of approximately 1.2, 1.0, and 0.8 mm; their S-ALE cell counts were 237,402, 379,772, and 686,999, and their total model element counts were 280,730, 423,100, and 730,327, respectively. Sensitivity was assessed from the peak fluid pressure, tubing equivalent stress, axial displacement, and axial acceleration (Table 5 and Figure 3).
Table 5.
Mesh sensitivity of the four peak responses in the baseline case.
Figure 3.
Mesh sensitivity of peak pressure, equivalent stress, axial displacement, and axial acceleration in the baseline case. The horizontal axis gives the total model element count; coarse, medium, and fine denote the three meshes.
As shown in Figure 3, the peak pressure decreased from 323.75 MPa on the coarse mesh to 321.75 MPa on the medium mesh and 320.83 MPa on the fine mesh. The corresponding peak equivalent stresses were 500, 498, and 497 MPa. Relative to the fine mesh, the medium-mesh deviations in peak pressure, equivalent stress, and axial displacement were 0.29%, 0.20%, and 0.69%, respectively. The peak axial acceleration was identical at the reported precision.
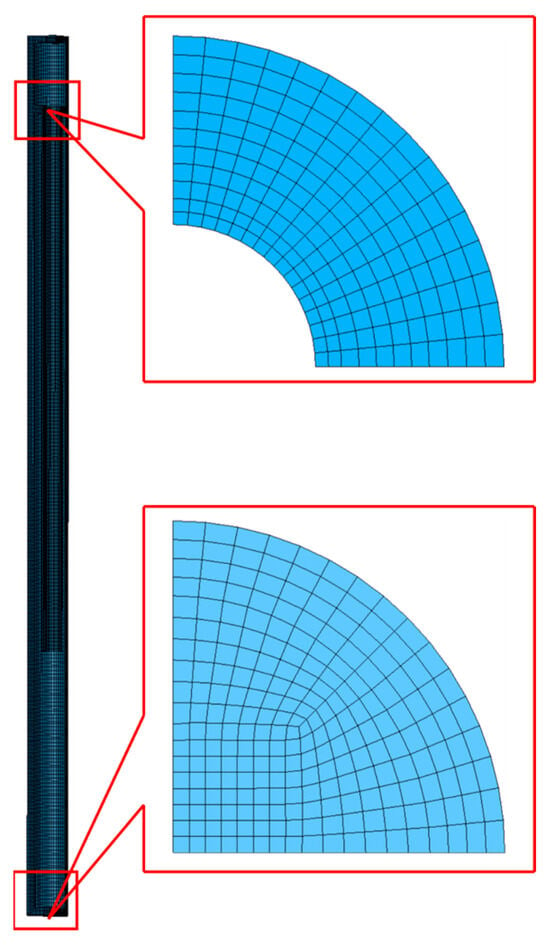
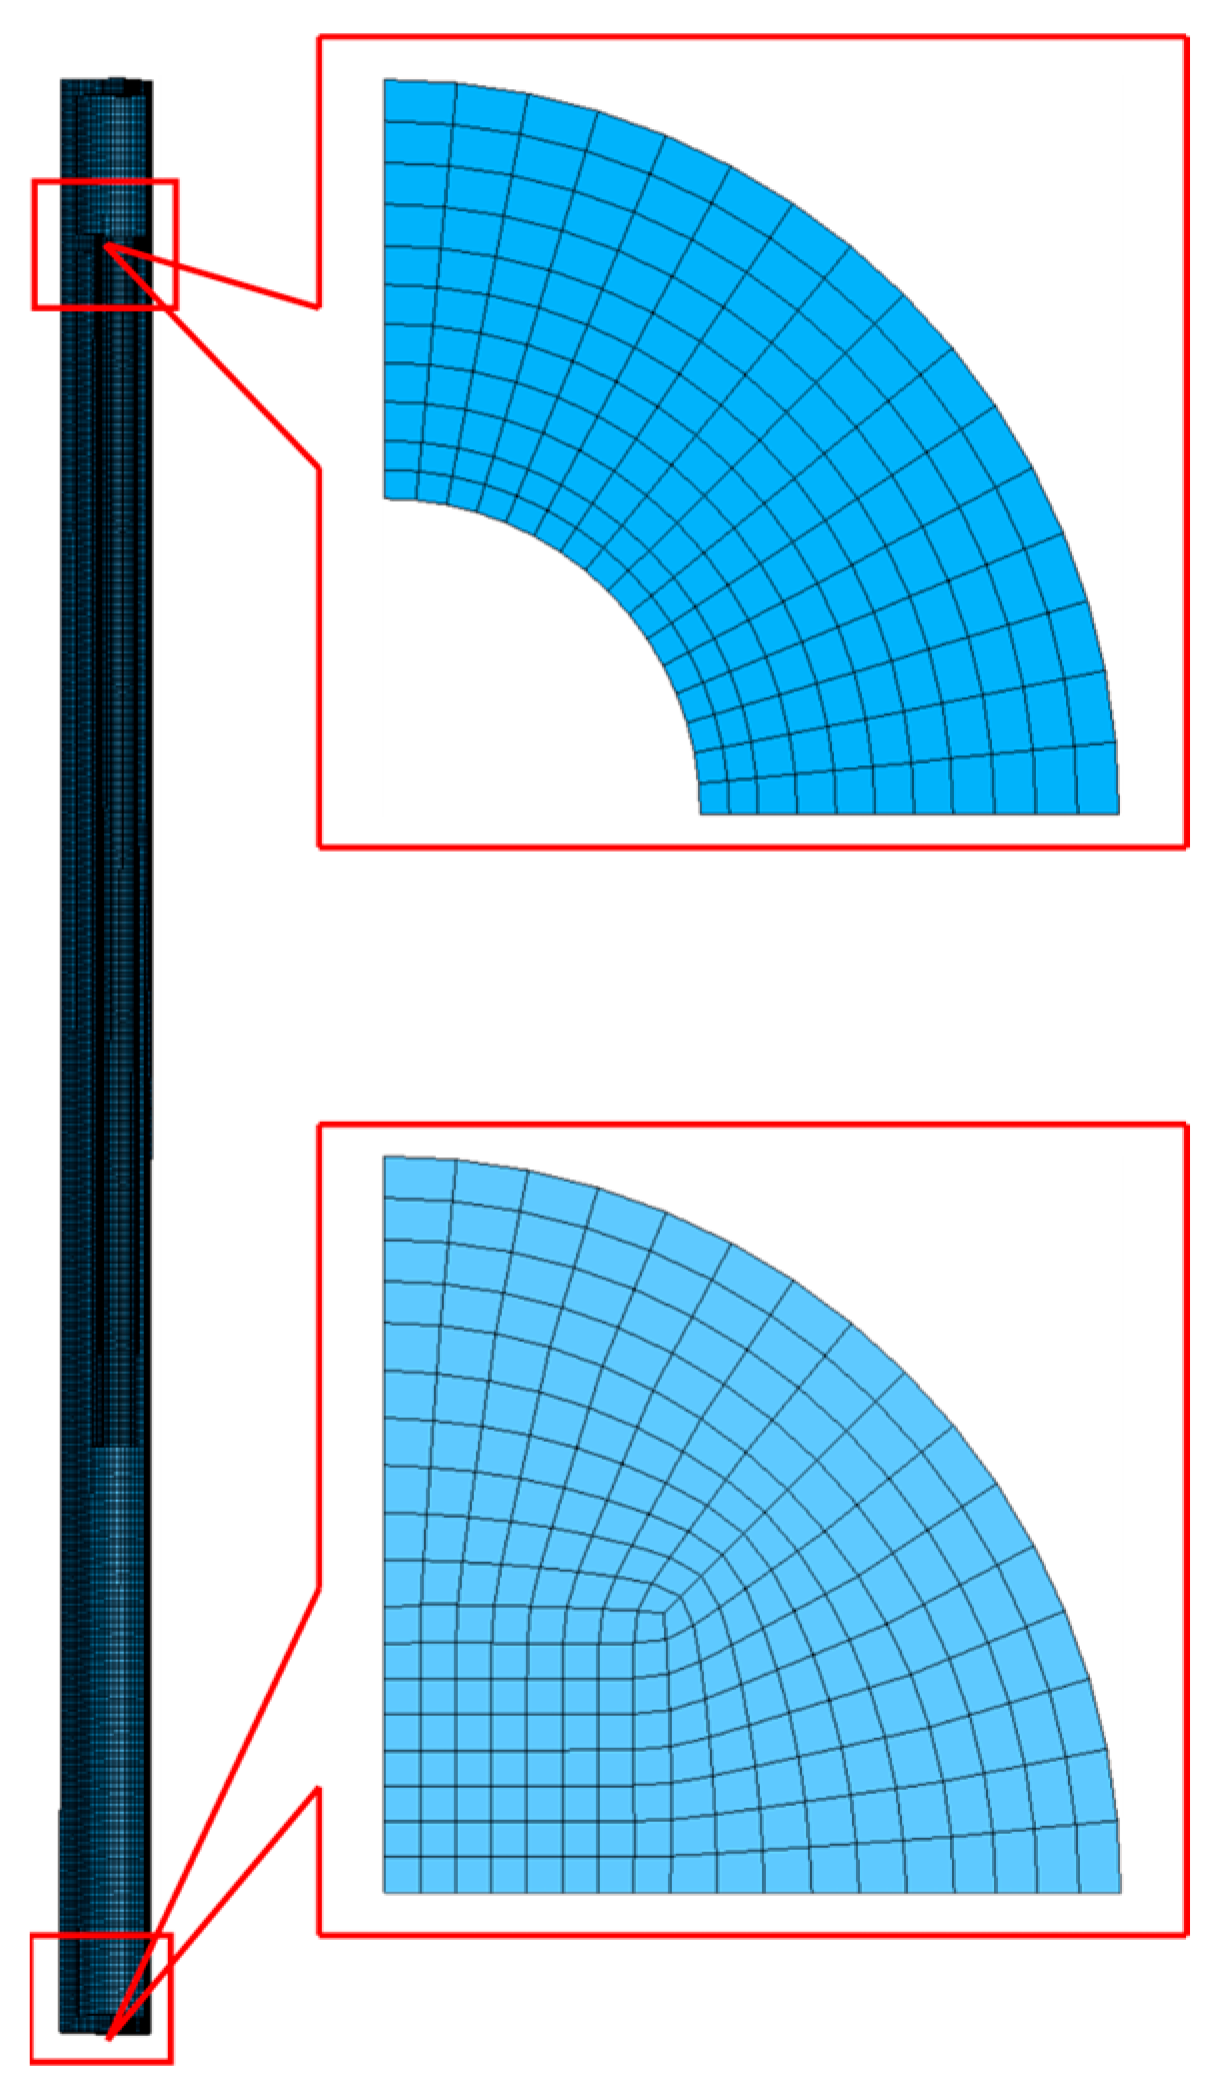
Figure 4 shows the overall tubing and cross-sectional meshes. We selected the medium mesh for the subsequent property study after considering the mesh-sensitivity results and computational cost. Its 423,100 elements are 42.07% fewer than the fine mesh’s 730,327; all four reported baseline peak differences between these meshes were below 1%.
Figure 4.
Overall view of the tubing-string mesh and representative cross-sectional meshes.The blue region represents the local cross-sectional mesh of the tubing-string, while the red boxes indicate the selected region and its corresponding magnified view.
3. Pressure Pulsations in the Perforating Fluid Following Charge Detonation
The baseline case (1.0 g/cm3; 20 mPa·s) was used to examine the spatial and temporal evolution of pressure pulsations after detonation. The pressure near the charge and its propagation through the fluid provide the loading context for the tubing-response and strength analyses.
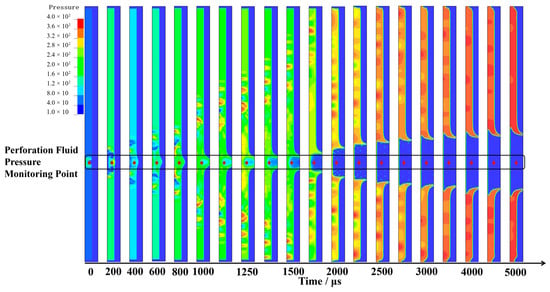
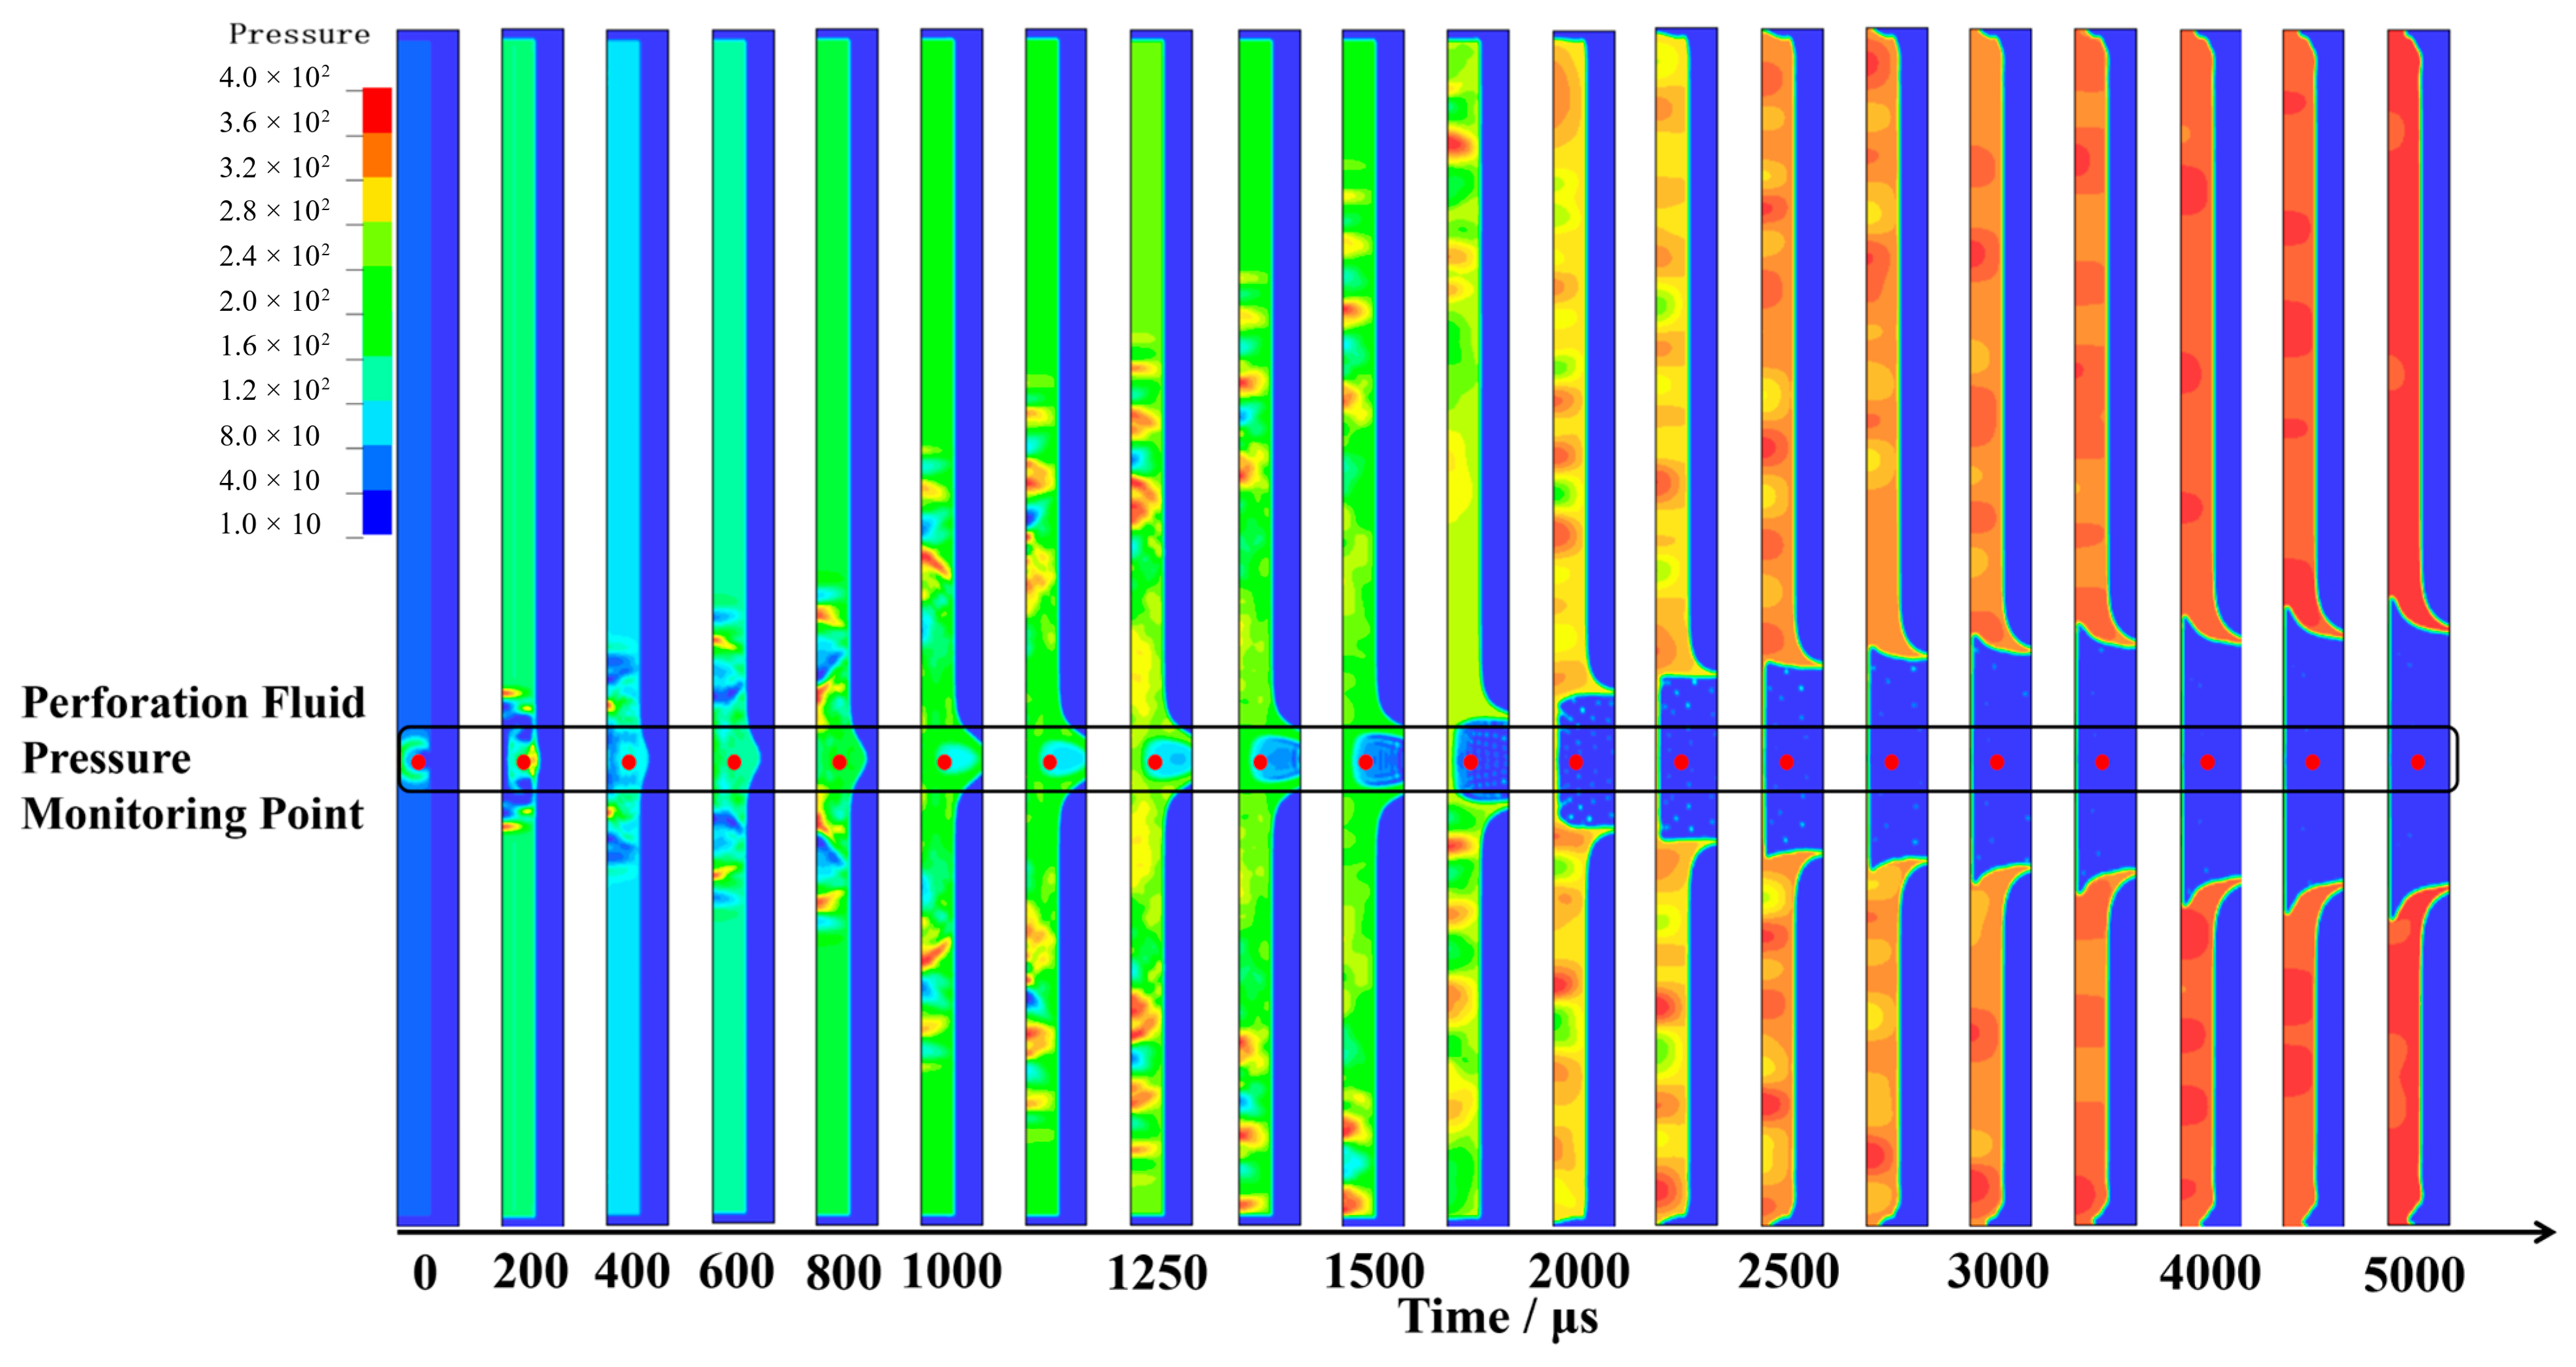
Figure 5 shows the perforating-fluid pressure field for the baseline case. After detonation, a local high-pressure region formed near the charge. Pressure waves then propagated axially through the fluid and underwent reflection and superposition at the interfaces with the tubing, casing, and perforating gun.
Figure 5.
Evolution of the perforating-fluid pressure field in the baseline case. The pressure and monitoring point are indicated; time is in µs.
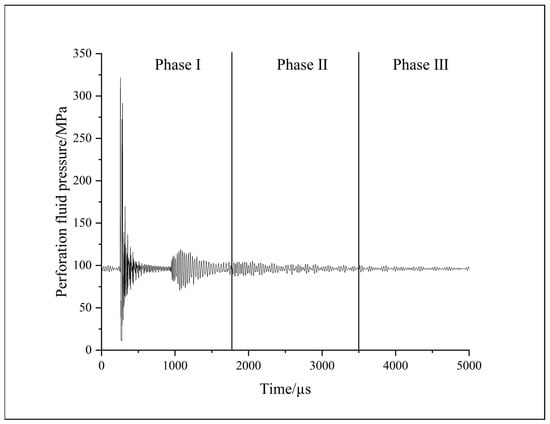
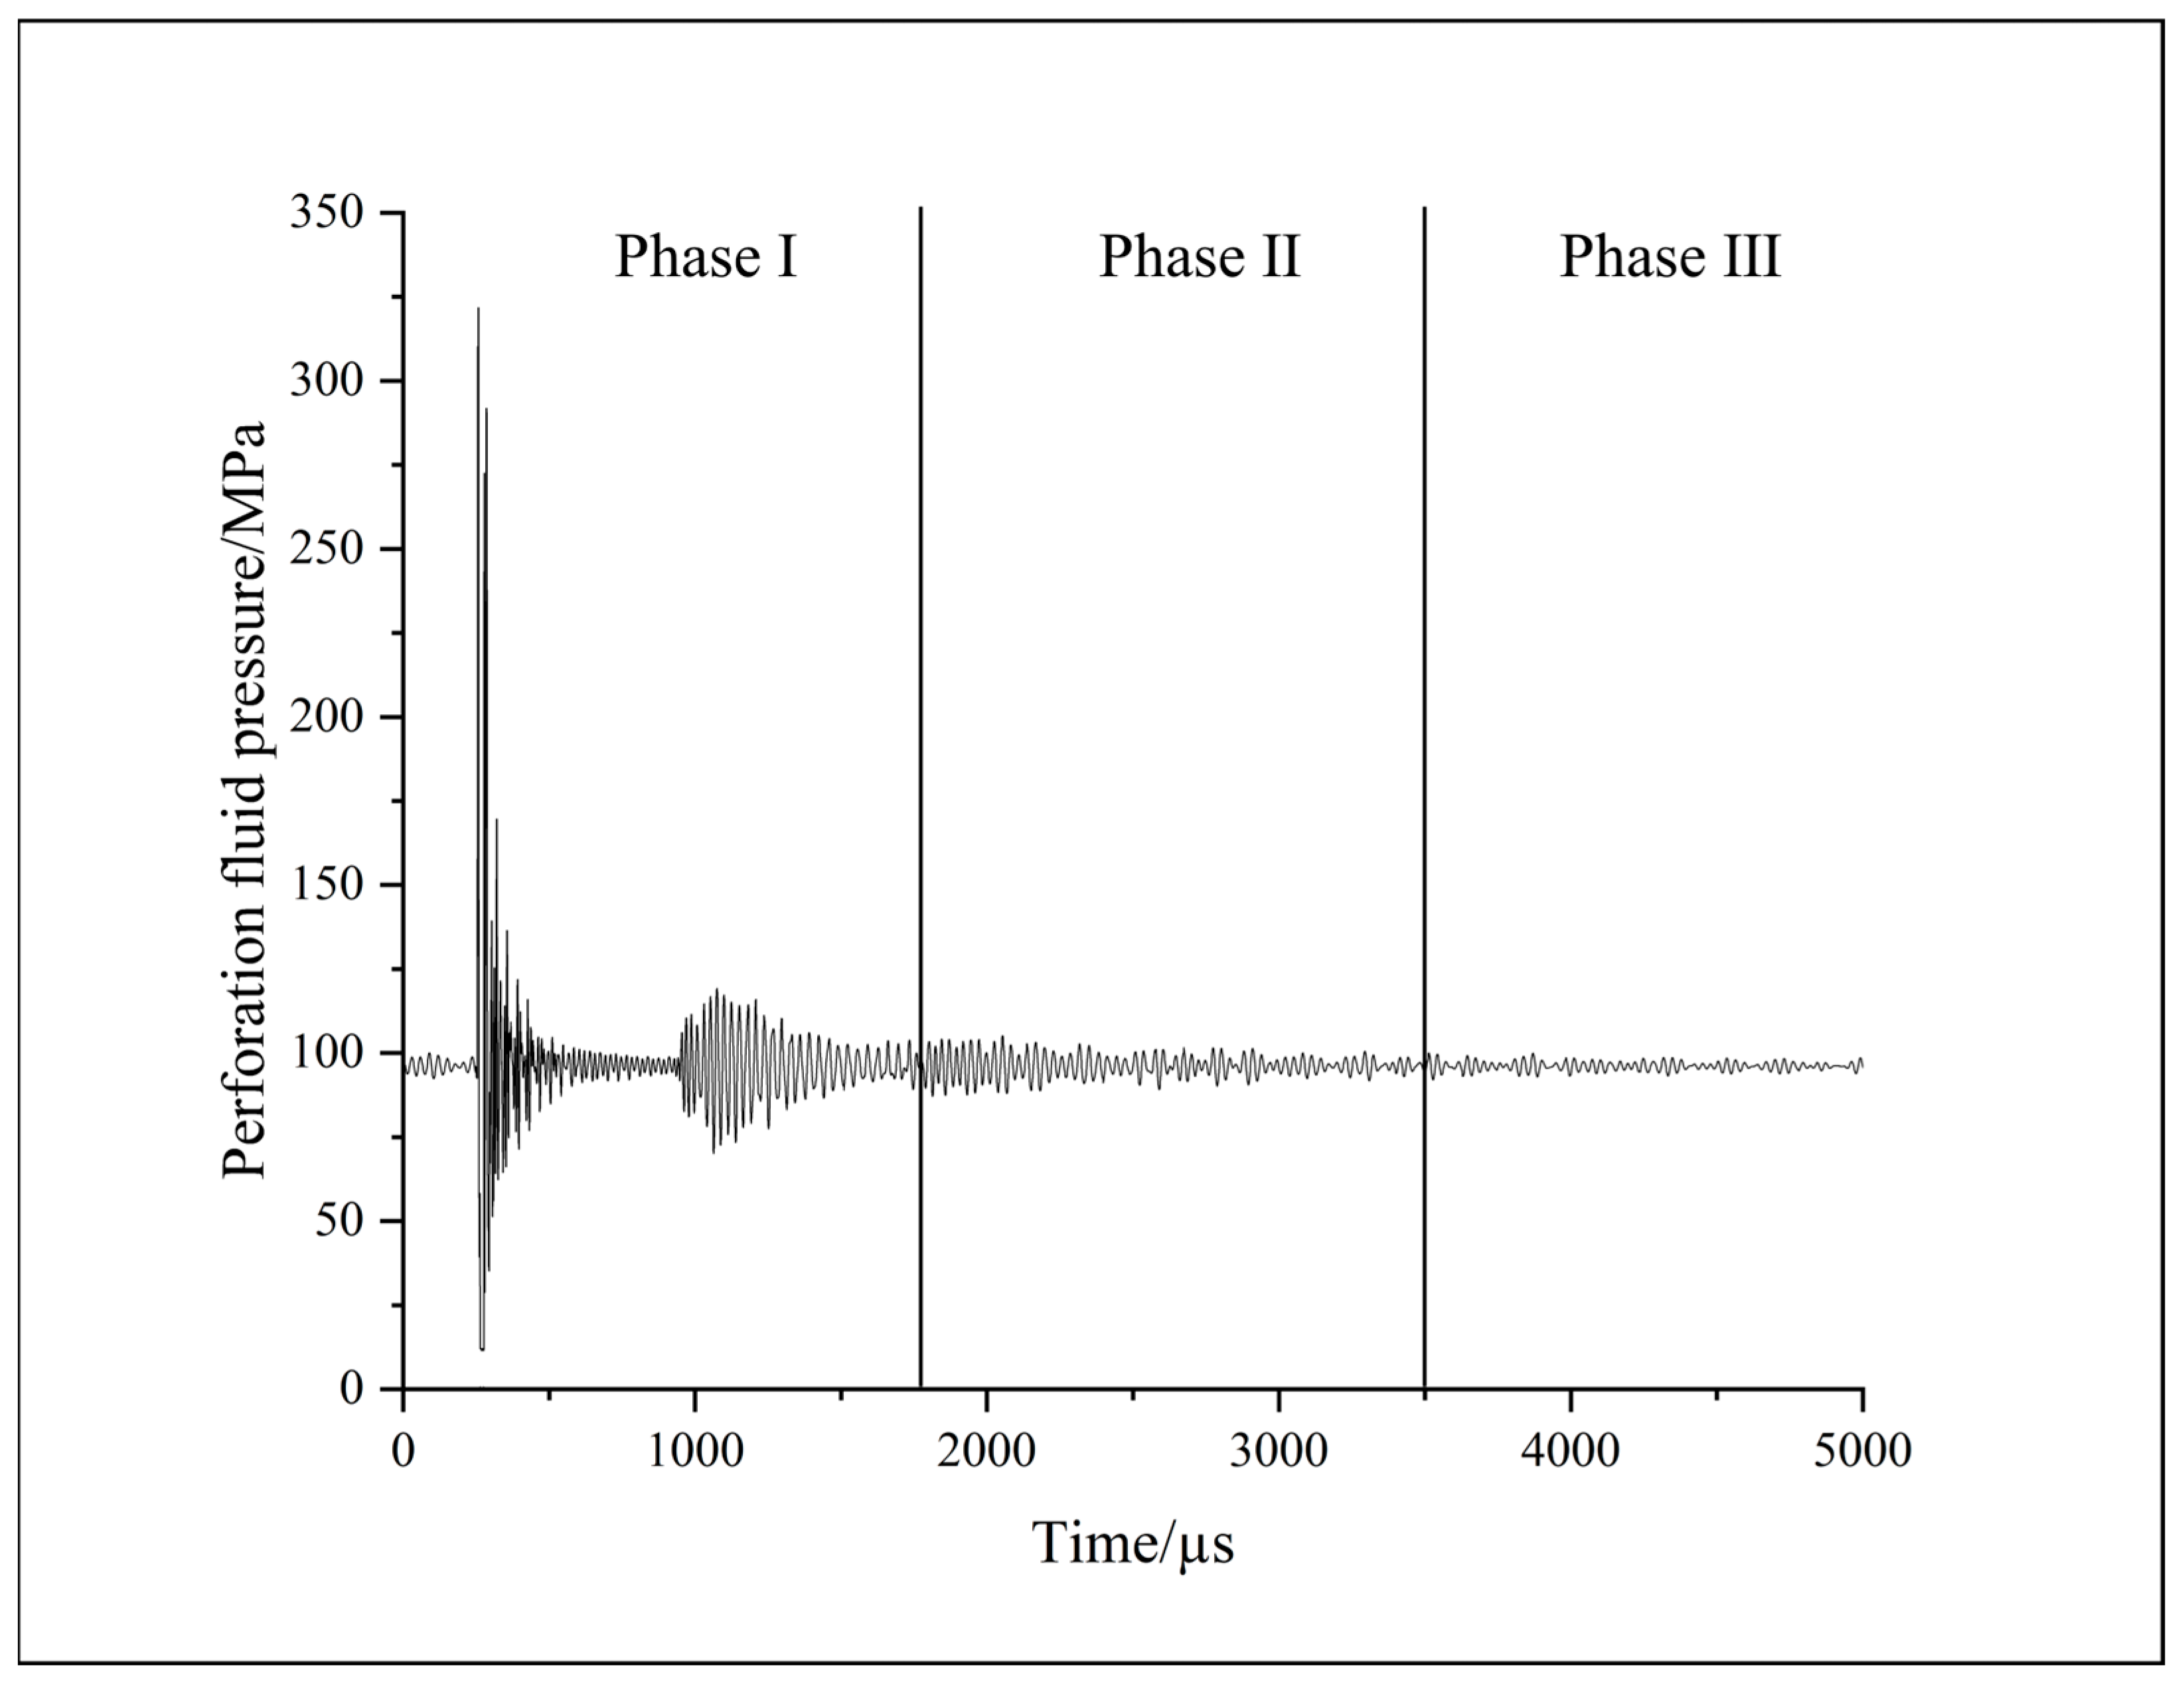
Figure 6 shows the pressure history at the fluid monitoring point near the charge. The baseline case exhibits strong pressure fluctuations early in the perforating event. The pressure falls to 14.50 MPa at 276 µs and rises sharply to 321.75 MPa at 278 µs, indicating a brief, intense local fluid load.
Figure 6.
Perforating-fluid pressure history near the charge. Phases I, II, and III identify the three response stages; the vertical and horizontal axes show pressure (MPa) and time (µs), respectively.
The baseline pressure history near the charge was divided into three descriptive stages according to the evolution of its fluctuation range: strong pulsation, decaying oscillation, and weak fluctuation. During strong pulsation (0–1750 µs), the pressure ranged from 14.50 to 321.75 MPa, a peak-to-peak span of 307.25 MPa. This response reflects the combined action of detonation, pressure-wave propagation, and early reflection and superposition at solid interfaces. During decaying oscillation (1750–3500 µs), pressure ranged from 77.80 to 113.40 MPa, a span of 35.60 MPa. During weak fluctuation (3500–5000 µs), the pressure mainly ranged from 92.90 to 98.60 MPa, a span of 5.70 MPa, and approached the initial 96 MPa. The pressure span in the first stage was approximately 8.63 times that in the second, which in turn was approximately 6.25 times that in the third. The three intervals thus describe the transition from strong pulsation to decaying oscillation and then weak fluctuation.
4. Effects of Perforating Fluid Properties on Tubing Dynamics
To evaluate the effect of fluid properties, the axial displacement and acceleration were extracted at the tubing-motion monitoring point over 0–5000 µs. The responses were referenced to the pre-perforation state at t = 0. The density effects were assessed at a fixed viscosity, and the viscosity effects at a fixed density.
4.1. Effects of Density on Tubing Dynamics
Axial displacement and acceleration histories and their peak values were compared across fluid densities to assess the deformation and inertial responses of the tubing string.
4.1.1. Effects of Density on Axial Displacement
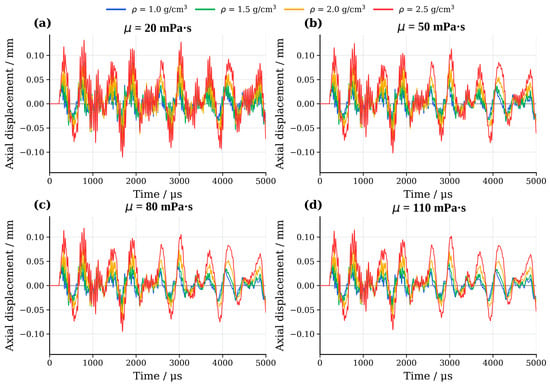
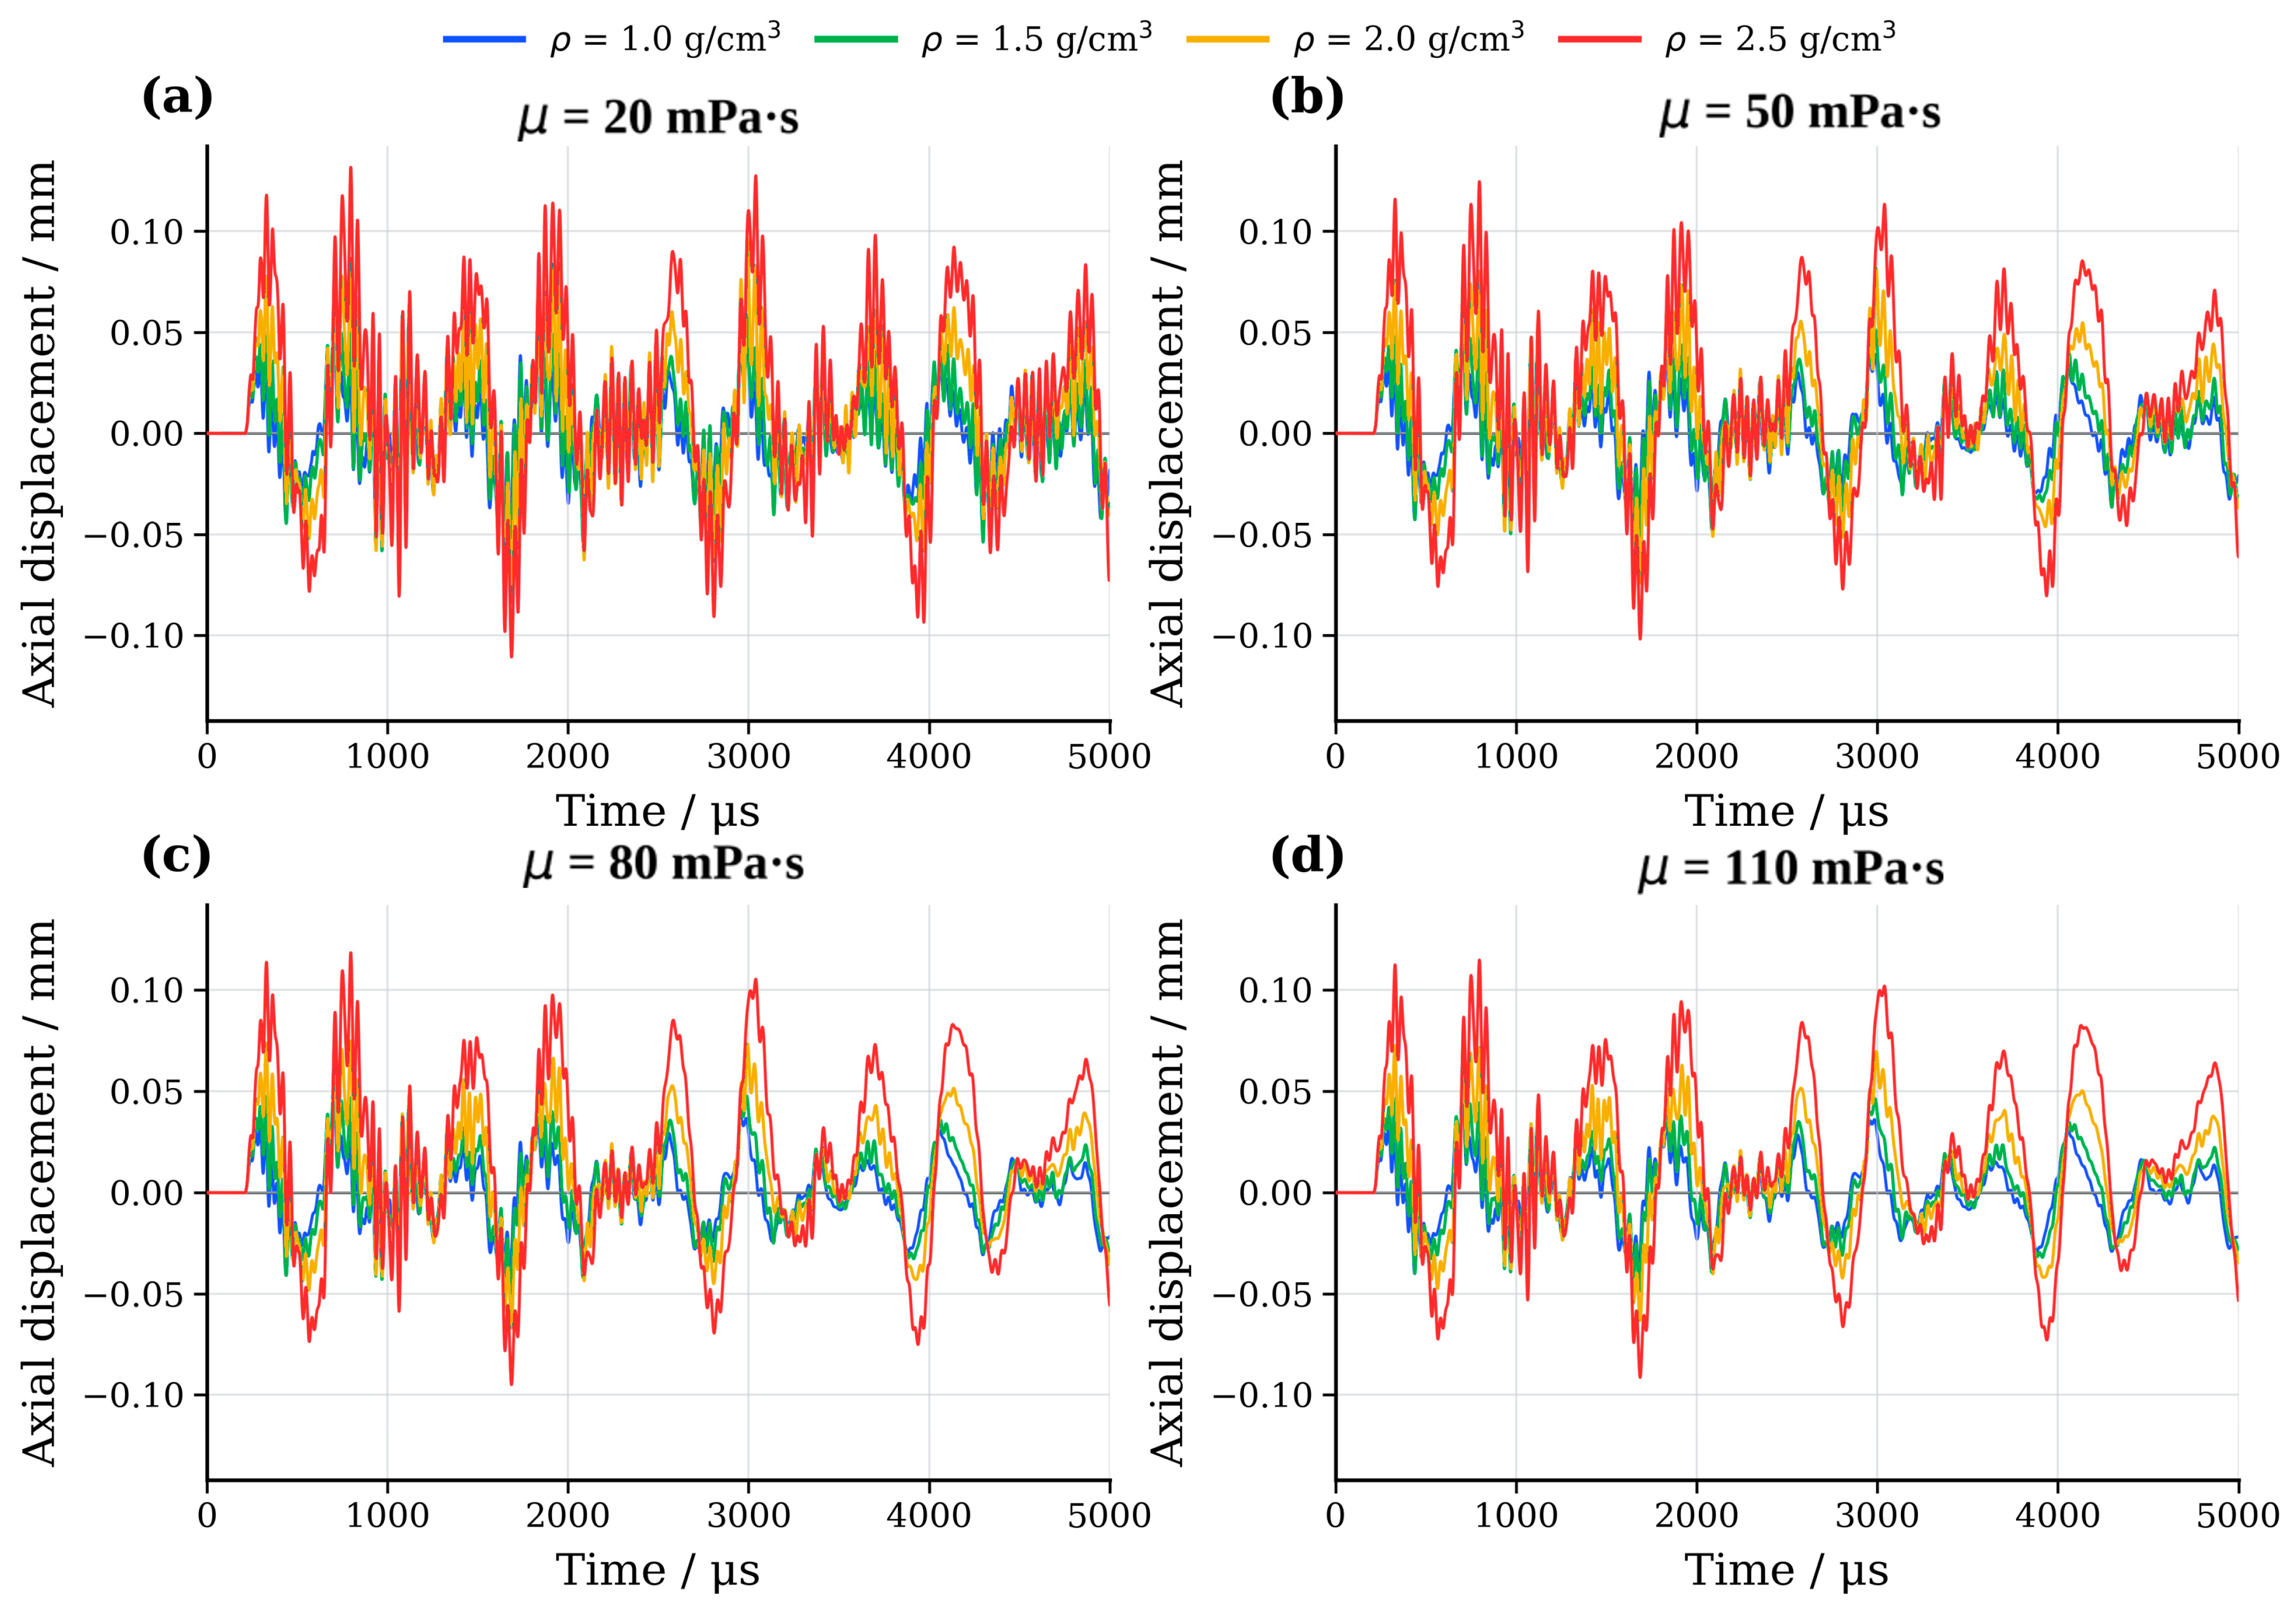
As shown in Figure 7, the monitored tubing point exhibited alternating positive and negative axial displacement in every case. The peak timing and magnitude varied among the fluid-property combinations. At a fixed viscosity, the peak axial displacement increased with density; its highest and lowest values occurred at 2.5 and 1.0 g/cm3, respectively. A higher fluid density therefore amplified axial motion at the selected monitoring point in this model.
Figure 7.
Effect of perforating-fluid density on tubing-string axial displacement at different viscosities: (a) 20 mPa·s; (b) 50 mPa·s; (c) 80 mPa·s; (d) 110 mPa·s. The vertical and horizontal axes show axial displacement (mm) and time (µs), respectively; ρ denotes density and μ denotes viscosity.
Table 6 summarizes the peak axial displacement at the four densities. As the density increased from 1.0 to 2.5 g/cm3, the peak rose monotonically at each viscosity by 118.44–125.13%; the largest increase occurred at 20 mPa·s.
Table 6.
Peak tubing axial displacement at different fluid densities.
4.1.2. Effects of Density on Axial Acceleration
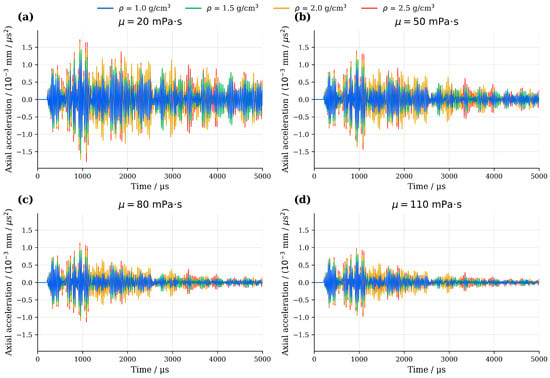
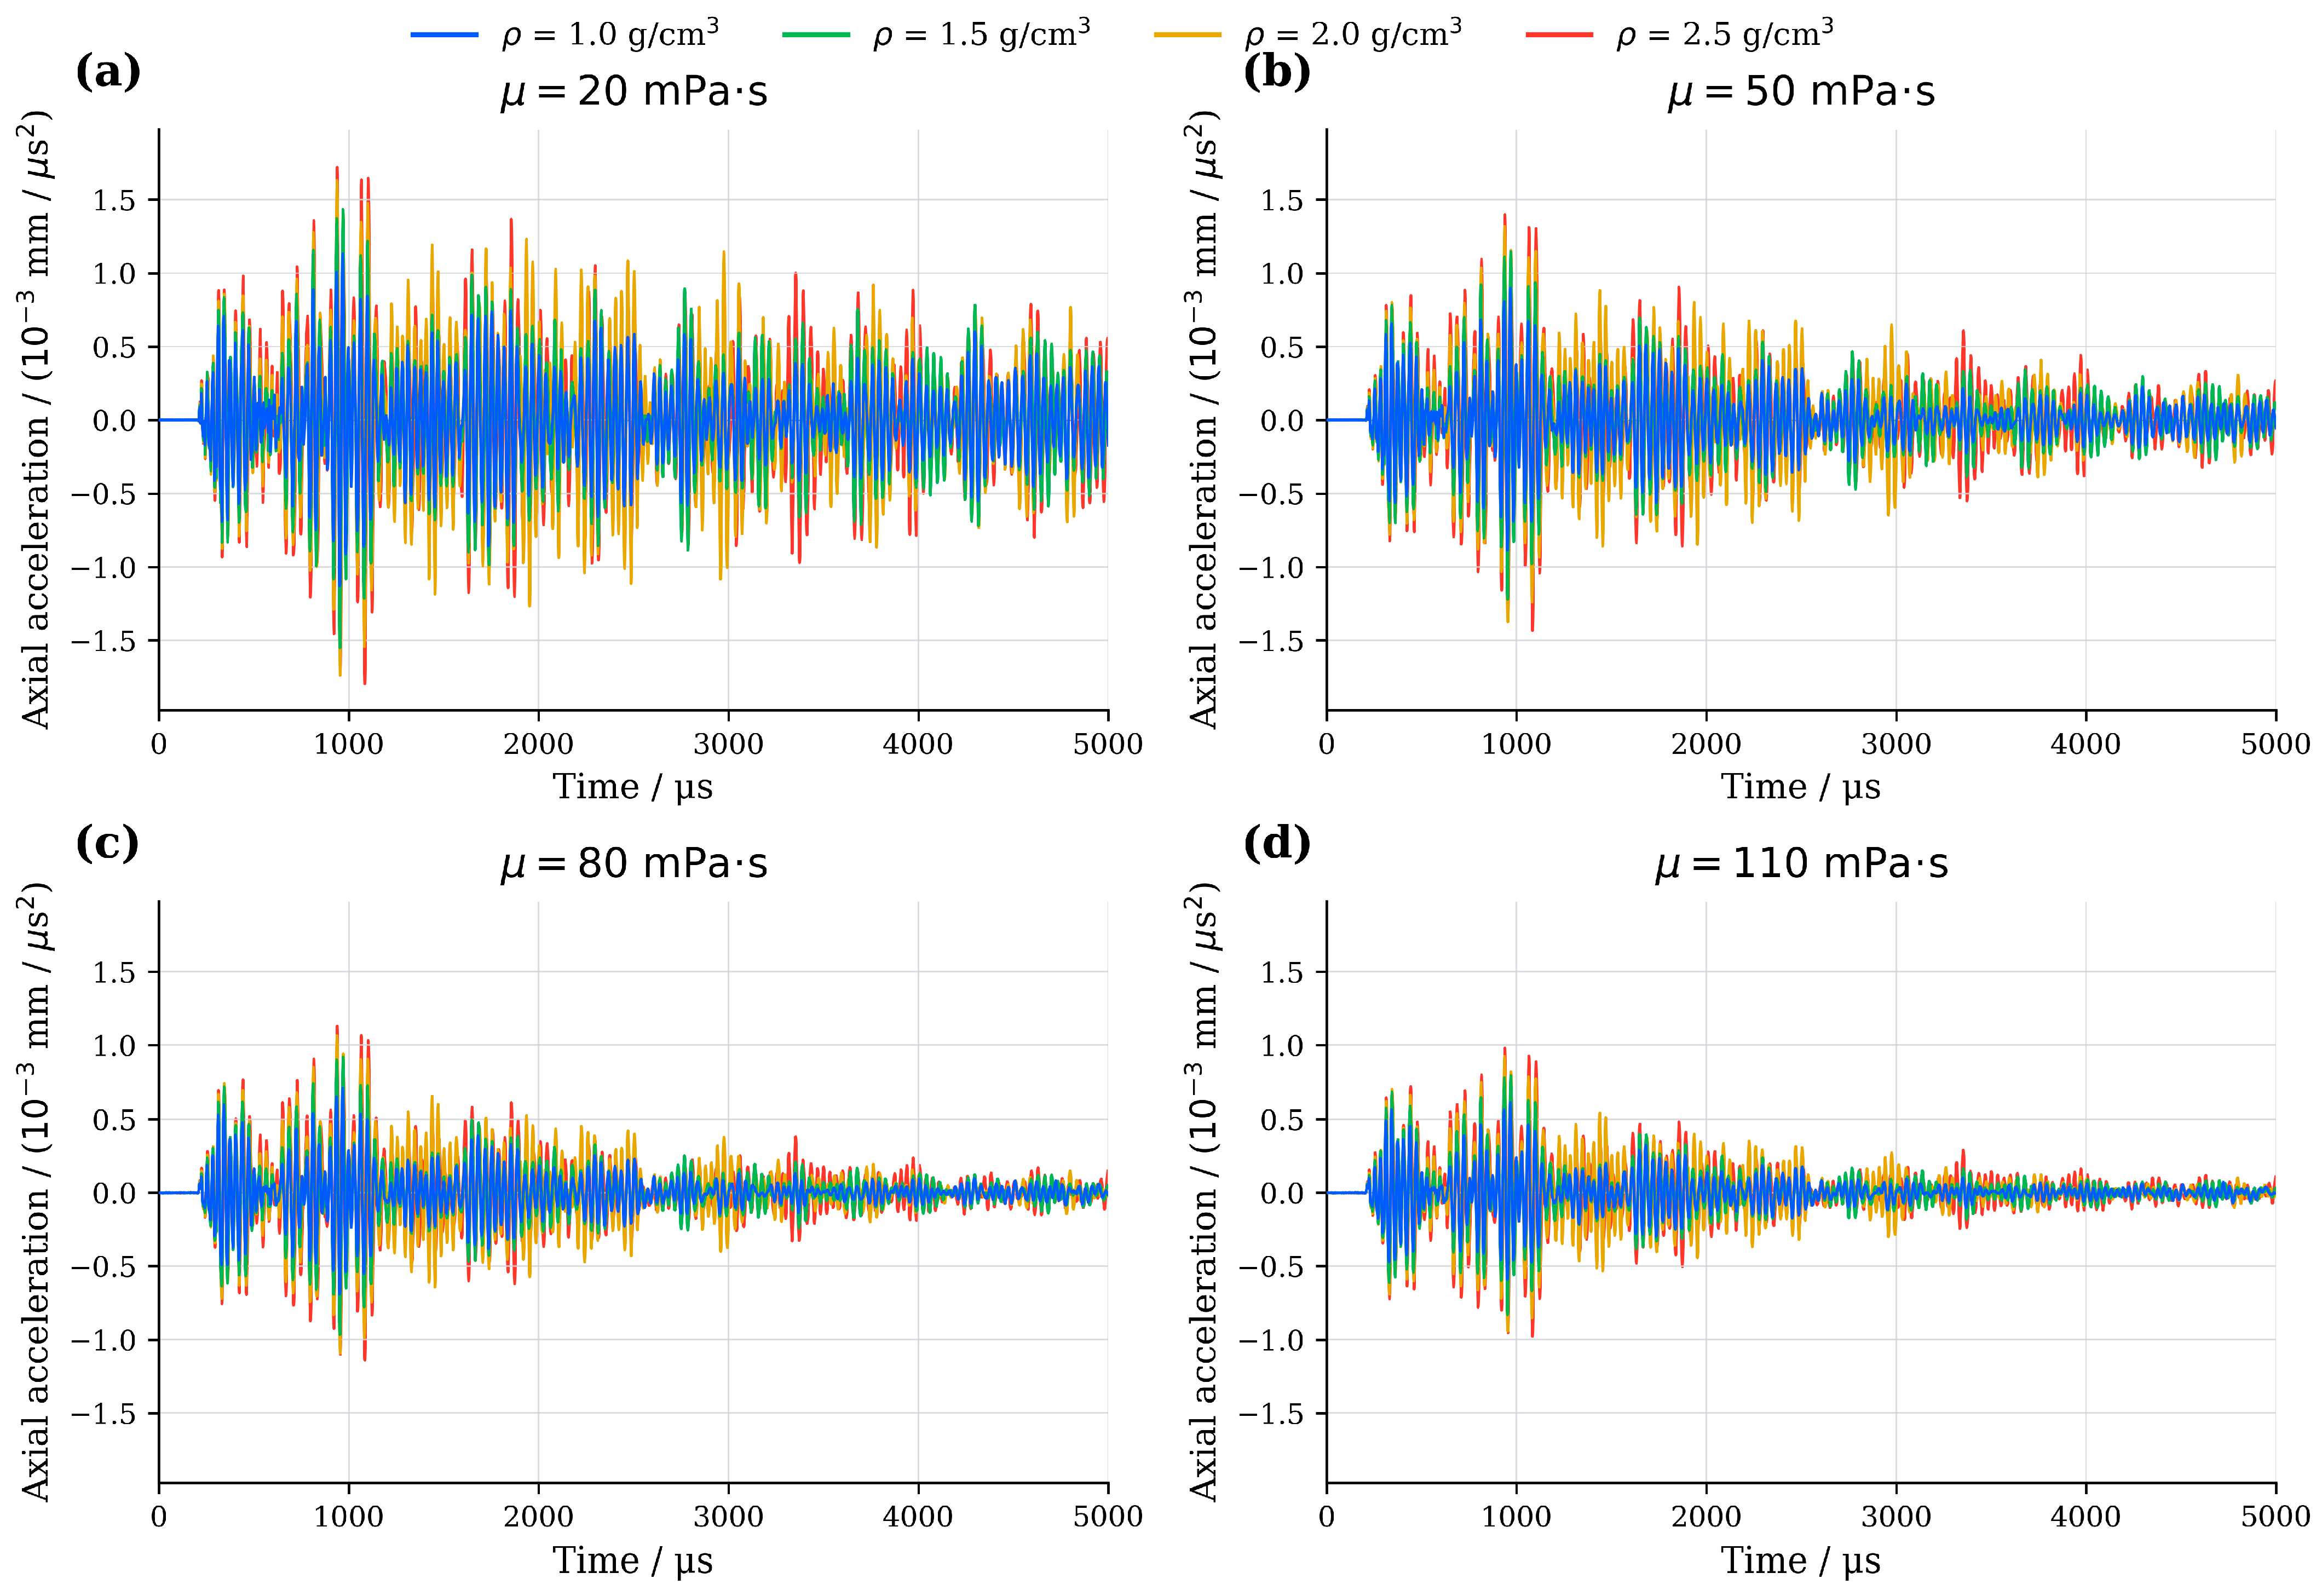
Figure 8 shows alternating, rapid axial acceleration early in the perforating event, followed by continued oscillation. At a fixed viscosity, its amplitude increased with the fluid density.
Figure 8.
Effect of perforating-fluid density on tubing-string axial acceleration at different viscosities: (a) 20 mPa·s; (b) 50 mPa·s; (c) 80 mPa·s; (d) 110 mPa·s. The vertical axis reports axial acceleration (mm/µs2; tick values ×10−3), and the horizontal axis reports time (µs); ρ denotes density and μ denotes viscosity.
Table 7 shows that increasing the density from 1.0 to 2.5 g/cm3 raised the peak axial acceleration monotonically by 58.89–60.66% across the four viscosities.
Table 7.
Peak tubing axial acceleration at different fluid densities.
Figure 7 and Figure 8, together with Table 6 and Table 7, show that with other conditions fixed, an increasing density raises the peak axial displacement and acceleration at the selected monitoring point. The fluid density affects both the inertia and the transfer of pressure-wave loading to the tubing string; the observed trend is consistent with their combined effects.
4.2. Effect of Viscosity on Tubing String Dynamic Response
The axial displacement and acceleration histories and peak values were compared across viscosities to assess their effect on the tubing string’s dynamic response.
4.2.1. Effect of Viscosity on Axial Displacement of the Tubing String
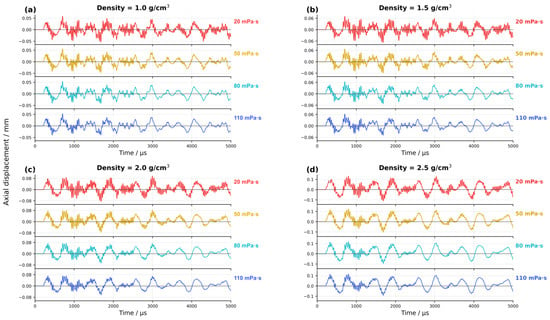
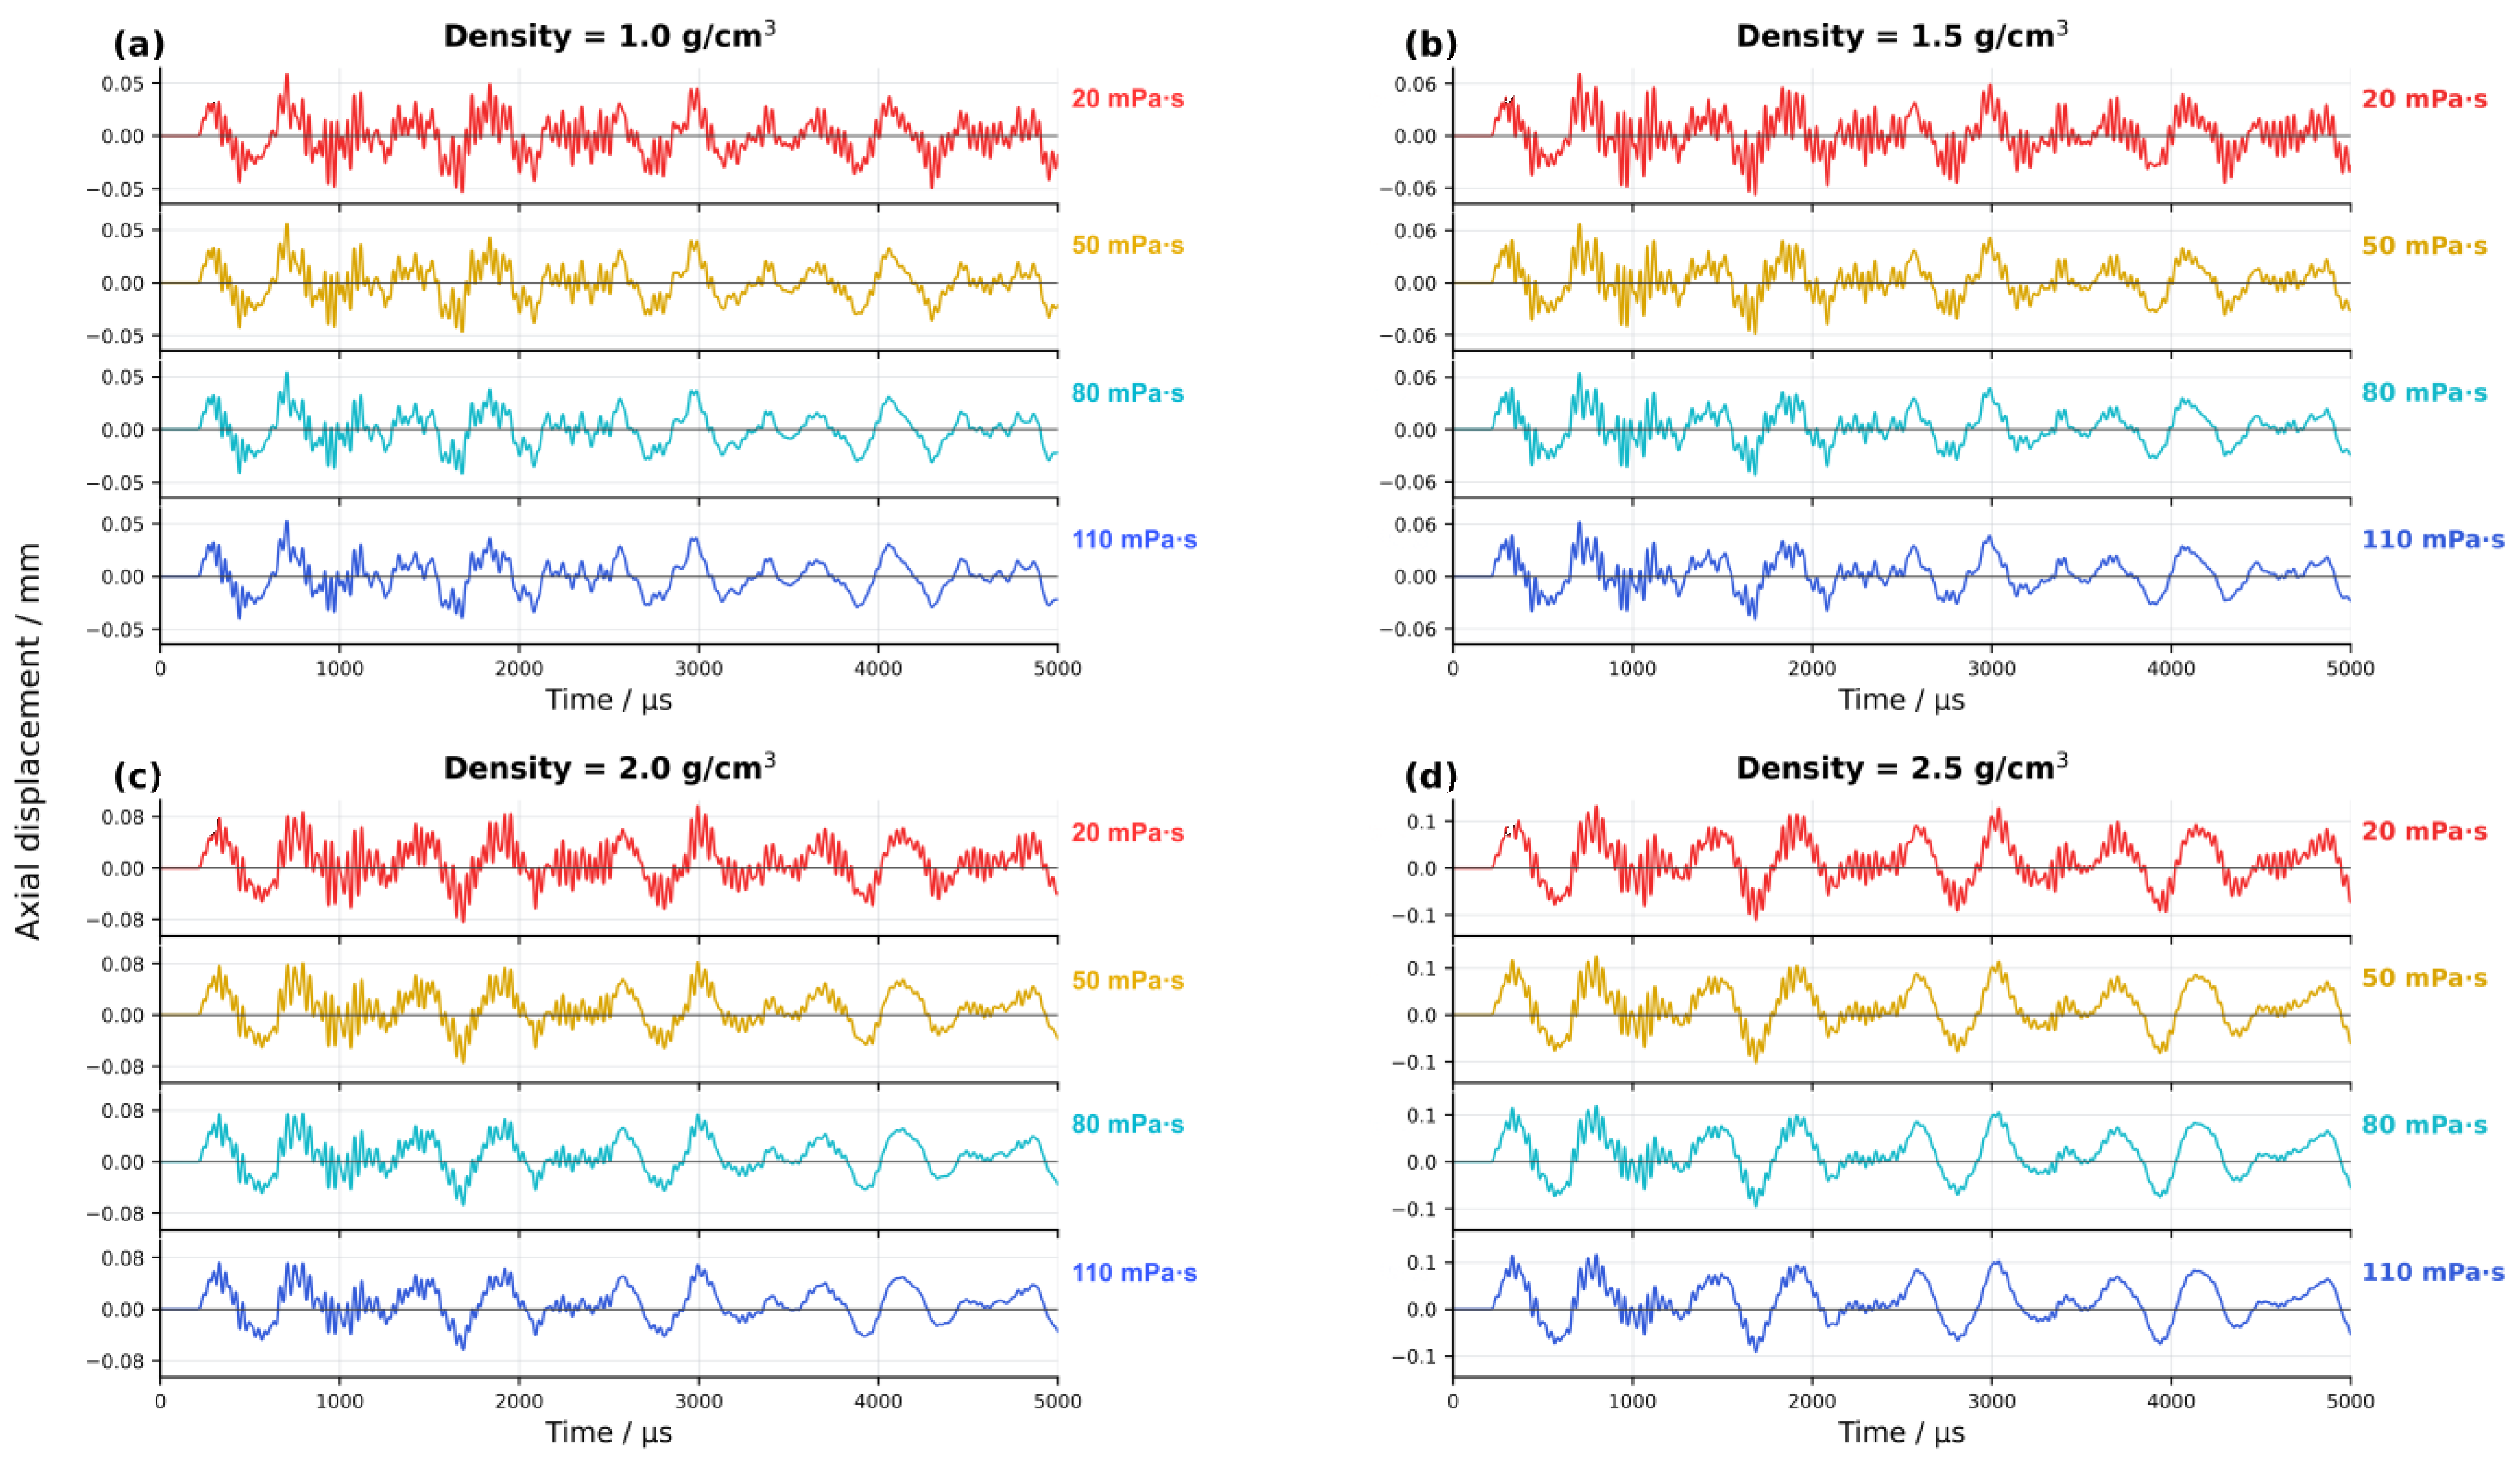
Figure 9 shows reciprocating axial displacement in all cases. At a fixed density, the timing of the principal peaks and troughs was similar across viscosities, while their amplitudes decreased as the viscosity rose. Both early and later oscillations were attenuated in the modeled cases.
Figure 9.
Effect of perforating-fluid viscosity on tubing-string axial displacement at different densities: (a) 1.0 g/cm3; (b) 1.5 g/cm3; (c) 2.0 g/cm3; (d) 2.5 g/cm3. Density is indicated in the figure; the vertical and horizontal axes show axial displacement (mm) and time (µs), respectively.
Table 8 summarizes the peak axial displacement at each density and viscosity. When the viscosity increased from 20 to 110 mPa·s at a fixed density, the peak decreased by 10.09%, 11.69%, 24.53%, and 12.76% at 1.0, 1.5, 2.0, and 2.5 g/cm3, respectively. The largest percentage decrease occurred at 2.0 g/cm3.
Table 8.
Peak tubing axial displacement at different fluid viscosities.
4.2.2. Effect of Viscosity on Axial Acceleration of the Tubing String
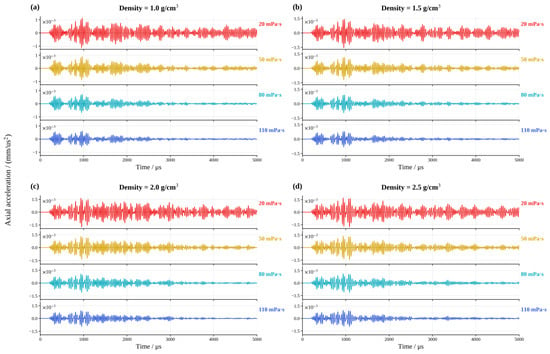
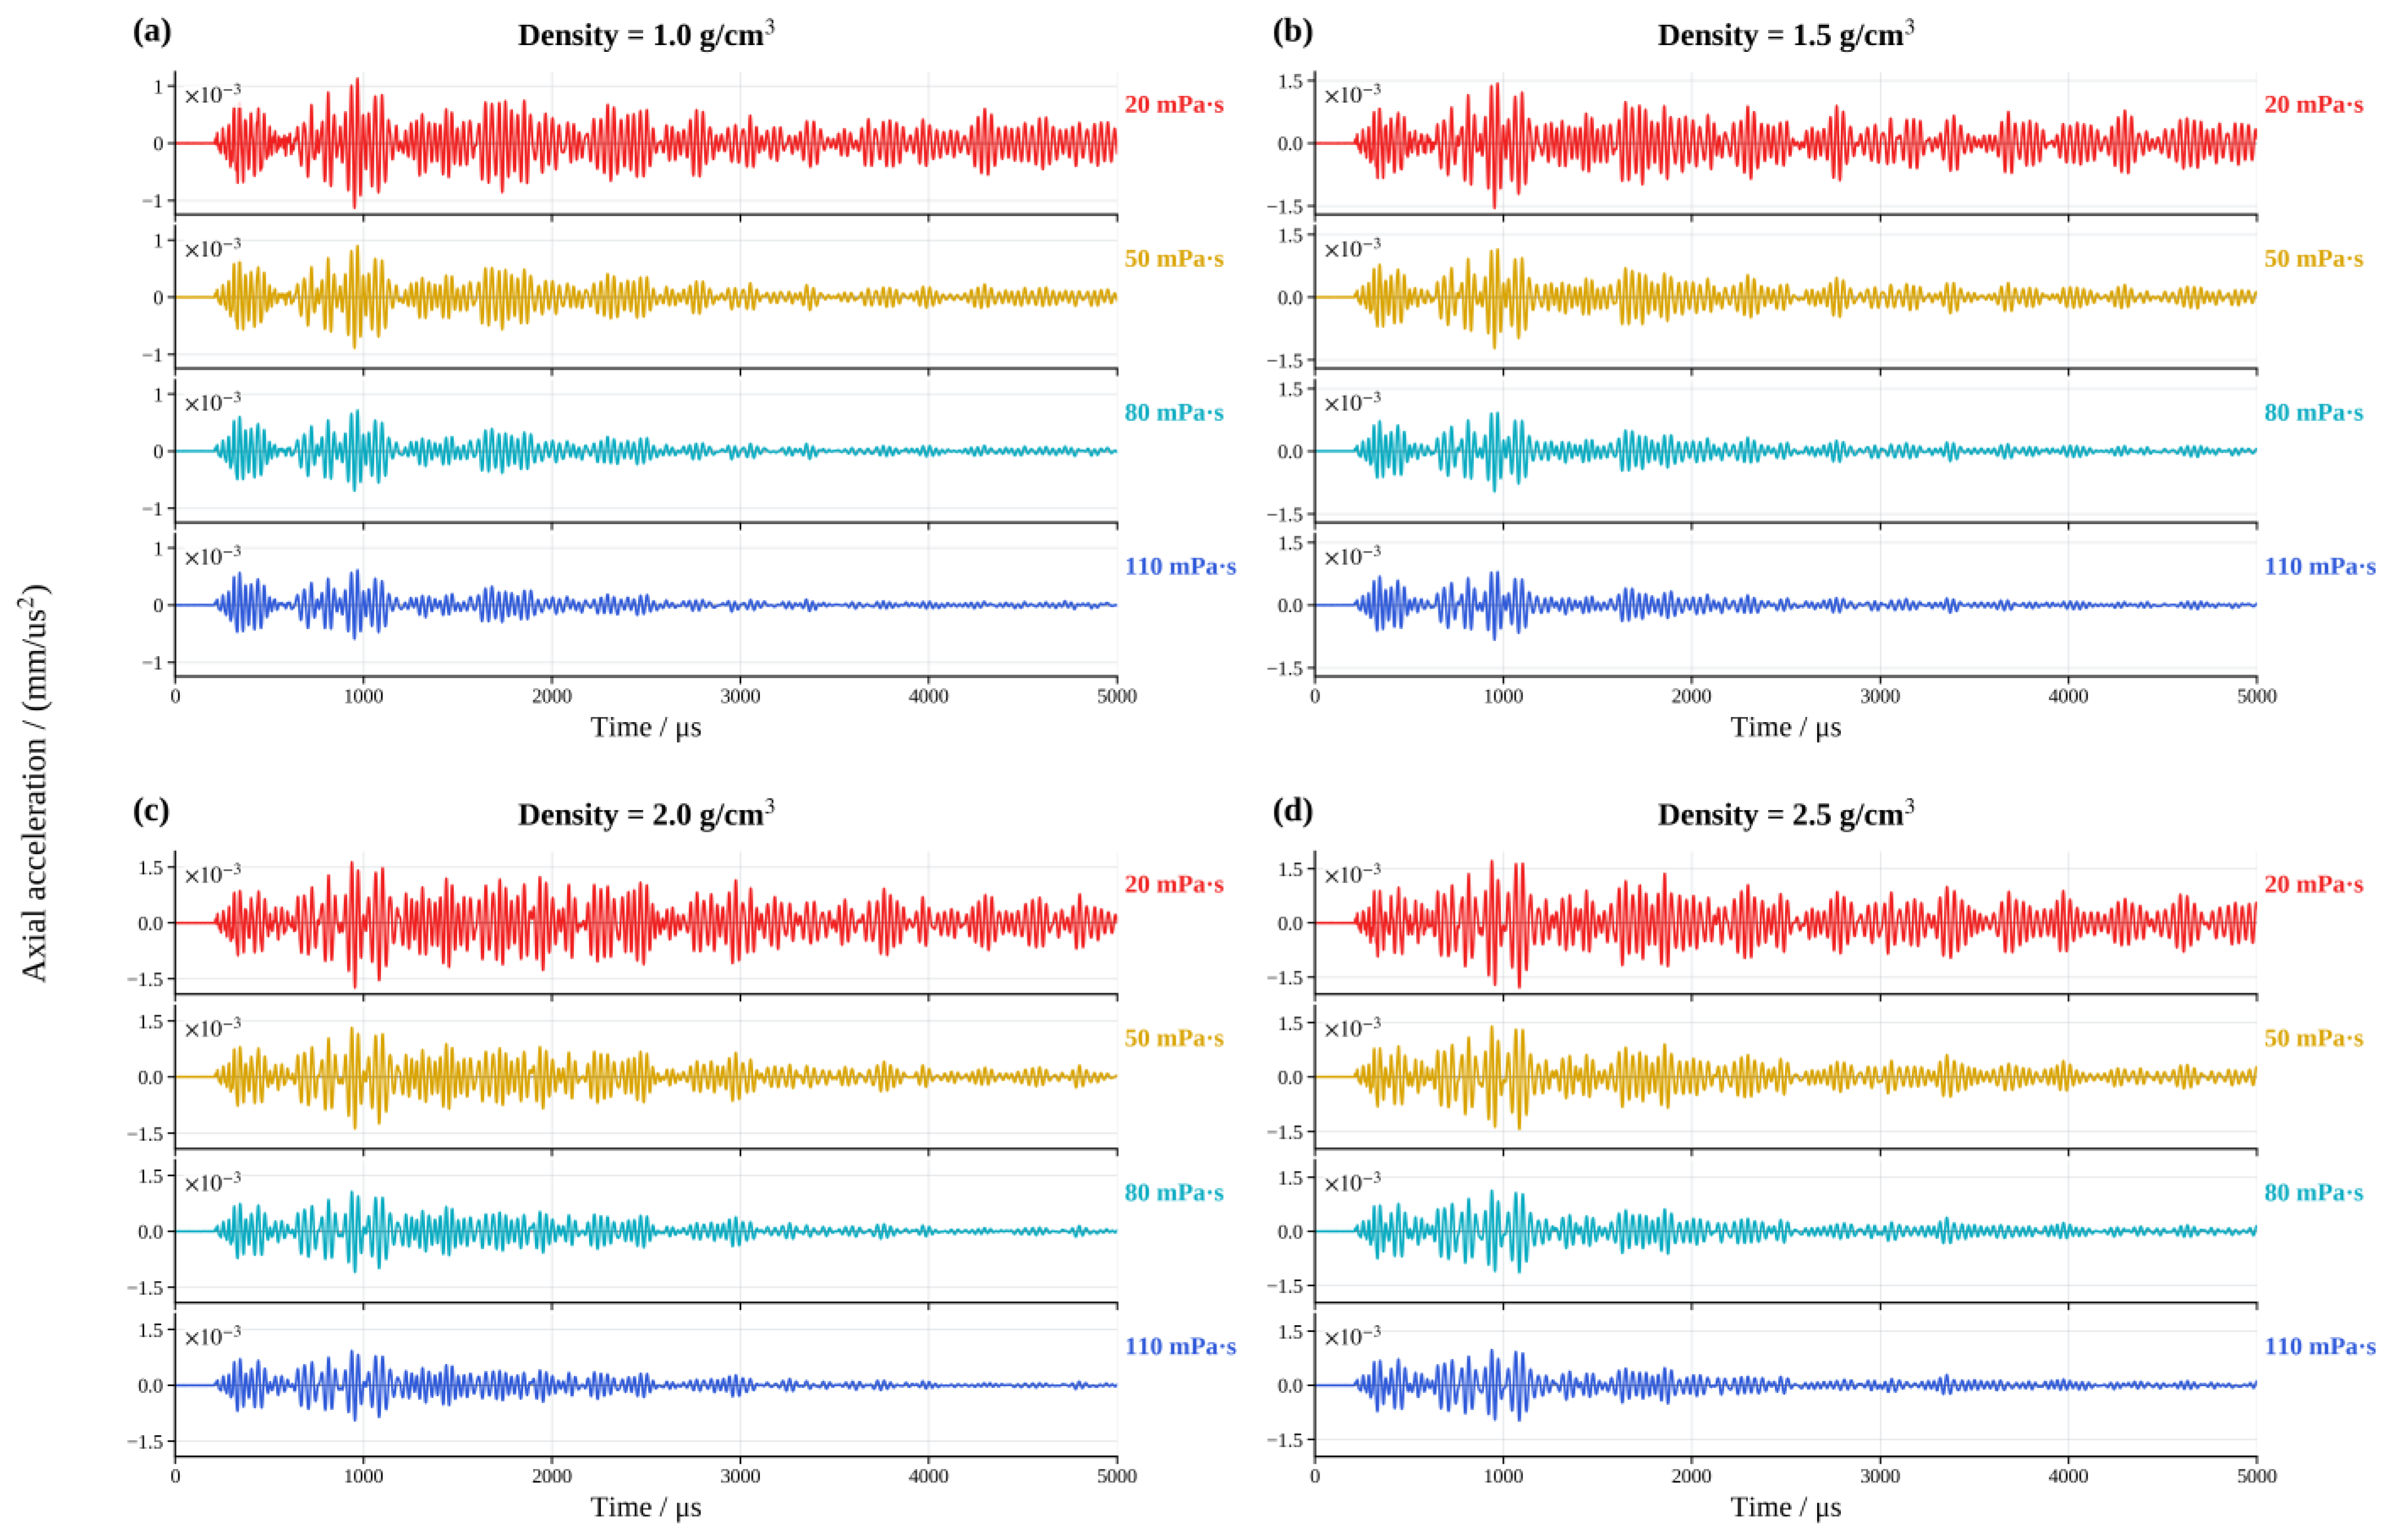
Figure 10 shows the alternating axial acceleration. Increasing viscosity reduced its amplitude across all four densities during both the early and later oscillations.
Figure 10.
Effect of perforating-fluid viscosity on tubing-string axial acceleration at different densities: (a) 1.0 g/cm3; (b) 1.5 g/cm3; (c) 2.0 g/cm3; (d) 2.5 g/cm3. The vertical axis reports axial acceleration (mm/µs2; tick values ×10−3), and the horizontal axis reports time (µs).
The peak axial acceleration values are summarized in Table 9. When the viscosity increased from 20 to 110 mPa·s, the peak axial acceleration values decreased by 45.56% to 46.45% across the four densities.
Table 9.
Peak tubing axial acceleration at different fluid viscosities.
Figure 9 and Figure 10, together with Table 8 and Table 9, show that increasing the viscosity reduces the peak axial displacement and axial acceleration within the set material properties. The viscous stress of Newtonian fluids is determined by both the dynamic viscosity and deformation rate; at the same deformation rate, increasing the viscosity enhances the momentum diffusion and viscous dissipation. The results indicate that the relative reduction in the peak axial acceleration was greater than that in the peak axial displacement when the viscosity increased.
Across the 16 modeled cases, a higher fluid density increased the peak tubing axial displacement and acceleration, whereas a higher viscosity decreased both peaks. From the perspective of reducing the tubing response predicted by this model, a lower density and higher viscosity were more favorable.
5. Effects of Perforating Fluid Properties on Tubing Strength Under Dynamic Loading
Pressure pulsations in the perforating fluid induce tubing-string oscillation and dynamic stress in the loaded region. For all 16 cases, the equivalent stress was extracted from the monitored element over 0–5000 µs. The P110 yield strength was used to calculate a local reference yield safety factor and compare the strength margin across the fluid densities and viscosities.
5.1. Effects of Density on Equivalent-Stress Histories
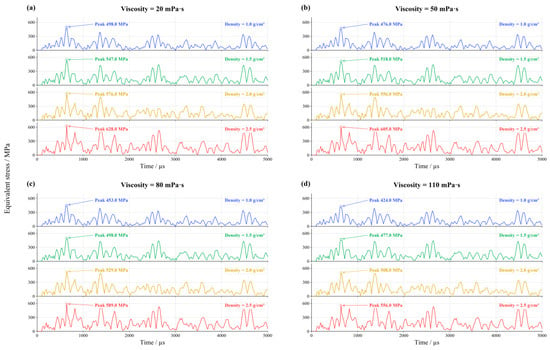
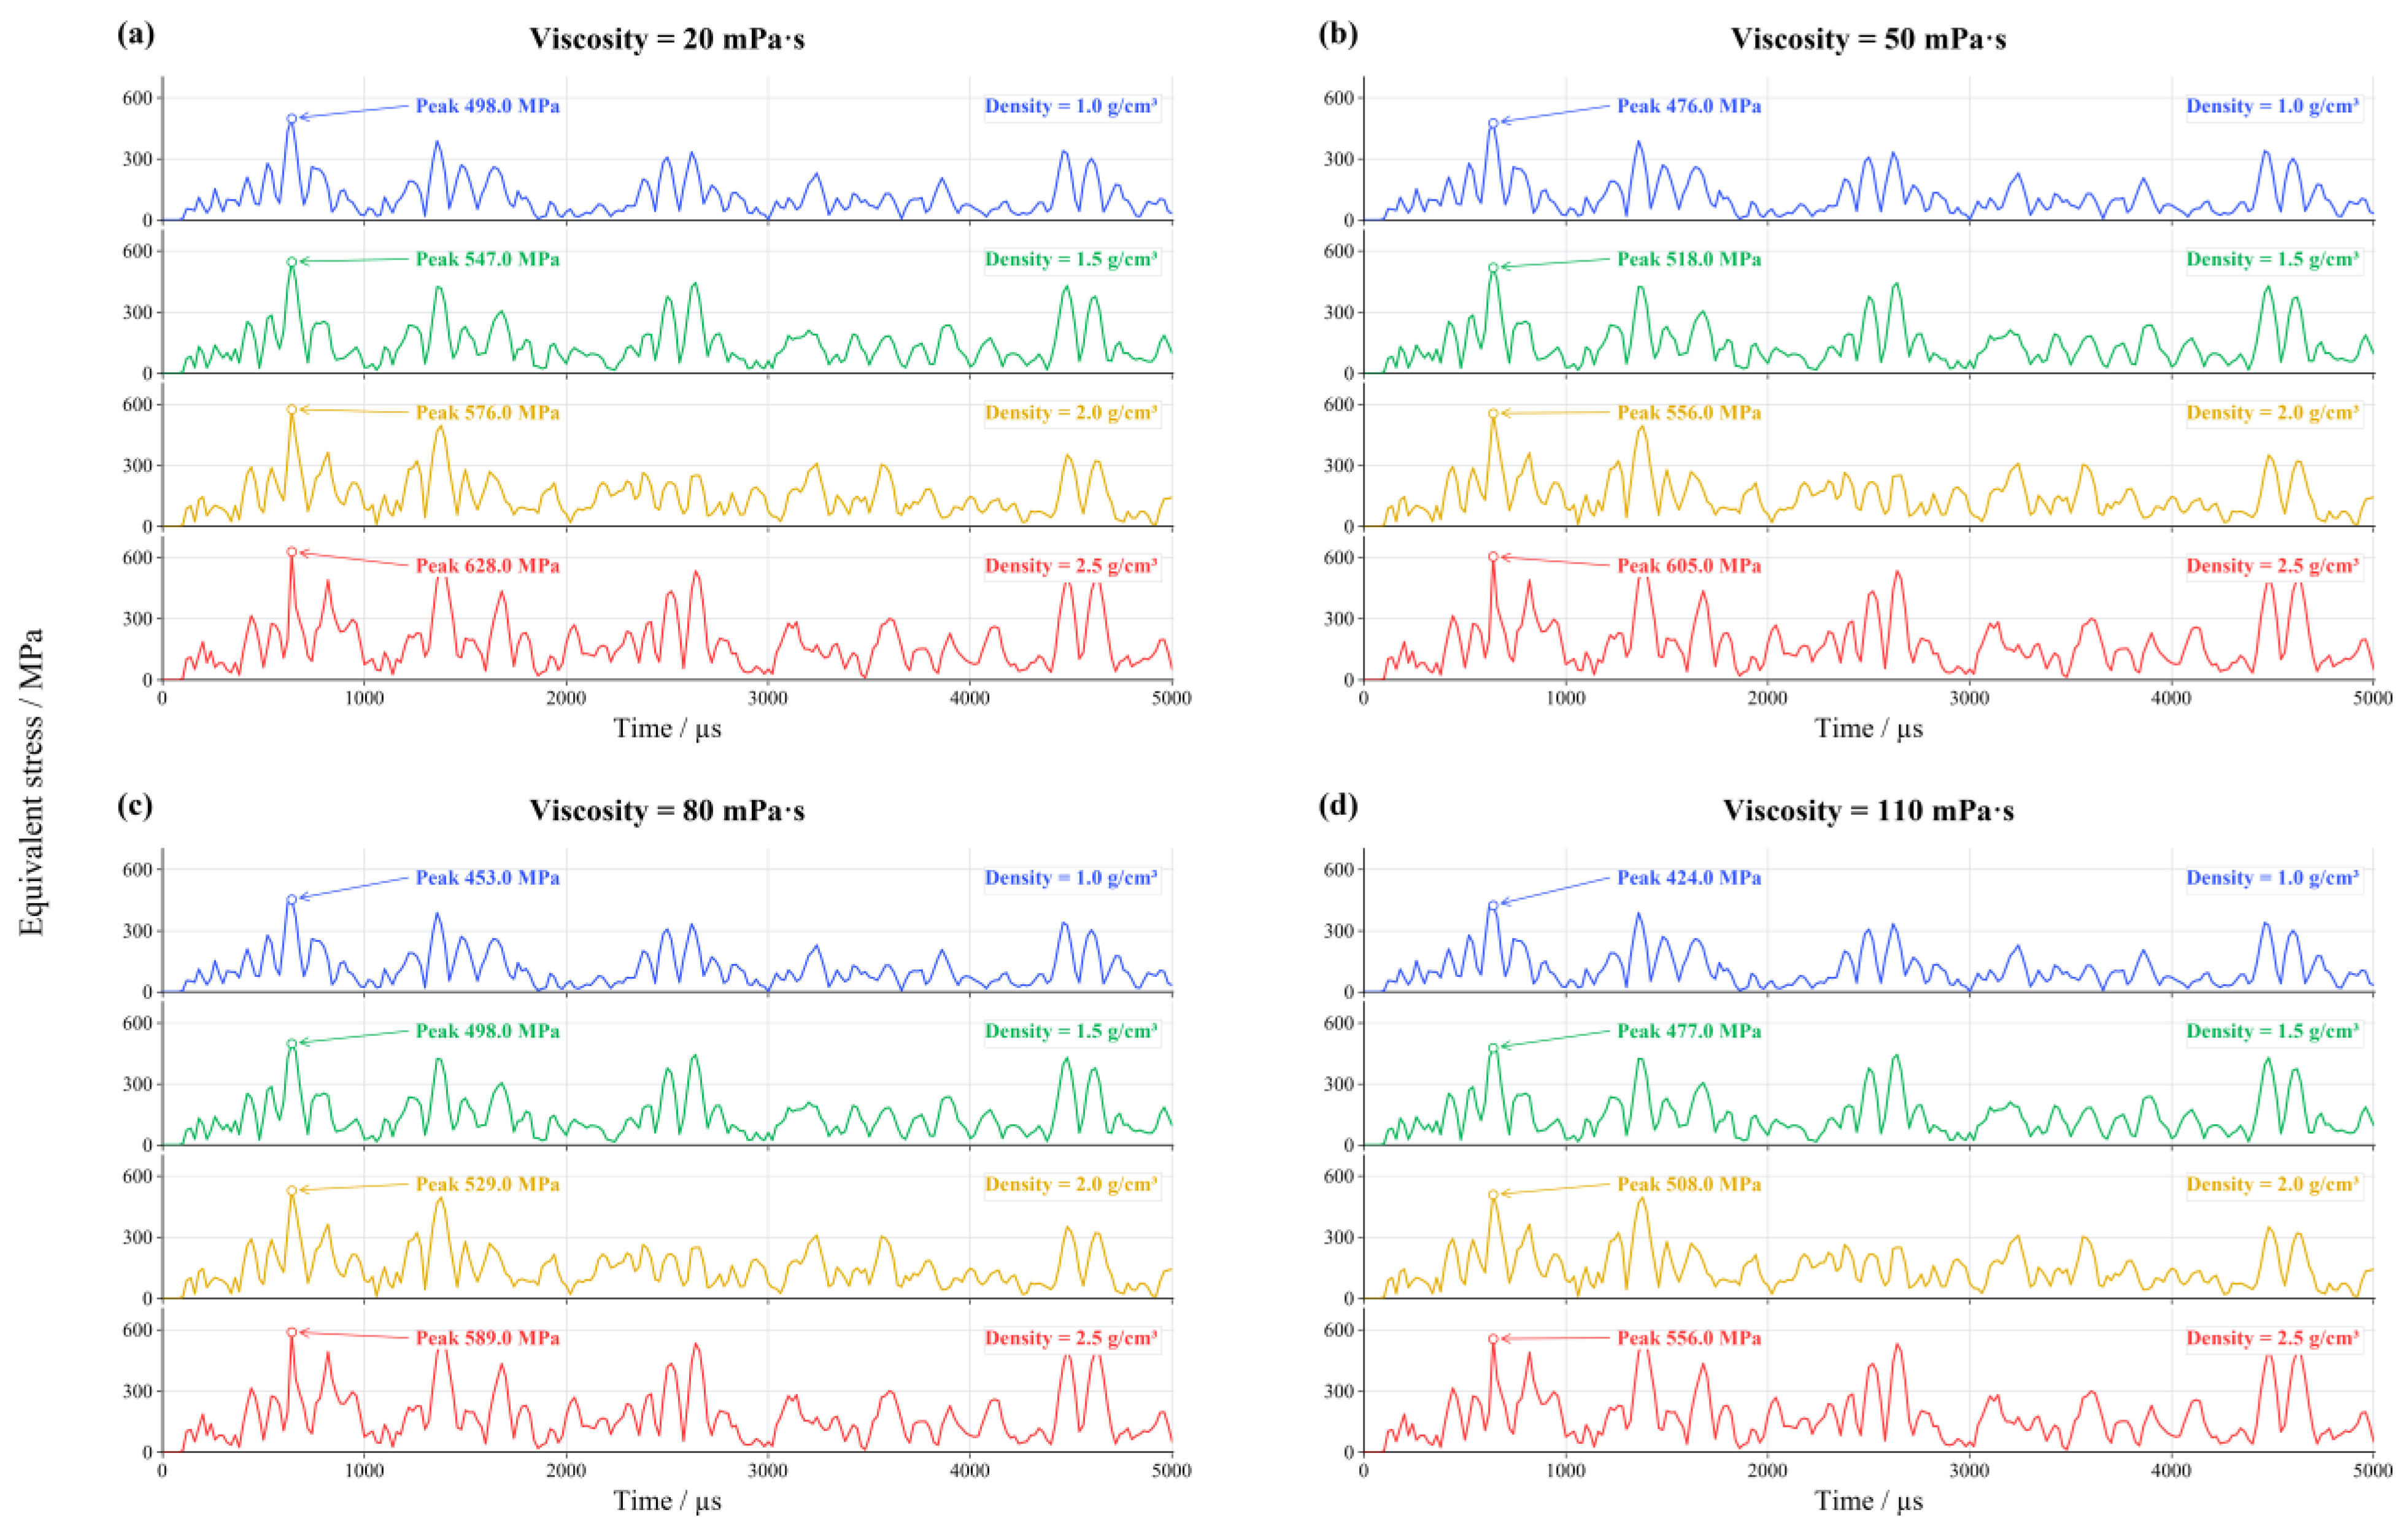
The equivalent stress was used to characterize the tubing-string stress response under dynamic loading. As shown in Figure 11, the main peaks and troughs occurred at similar times for the four density curves, and the main peak occurred at 640 µs. At the four viscosities, the peak-stress ranges across density were 498–628, 476–605, 453–589, and 424–556 MPa. Table 10 summarizes these peaks. Increasing the density raised the peak stress by 129–136 MPa, or 26.10–31.13%, across the four viscosities. The highest peak occurred at a high density and low viscosity.
Figure 11.
Effect of perforating-fluid density on tubing-string equivalent-stress histories at different viscosities: (a) 20 mPa·s; (b) 50 mPa·s; (c) 80 mPa·s; (d) 110 mPa·s. Viscosity, density, and peak values are indicated; the vertical and horizontal axes show equivalent stress (MPa) and time (µs), respectively.
Table 10.
Peak tubing equivalent stress at different fluid densities.
5.2. Effects of Viscosity on Equivalent-Stress Histories
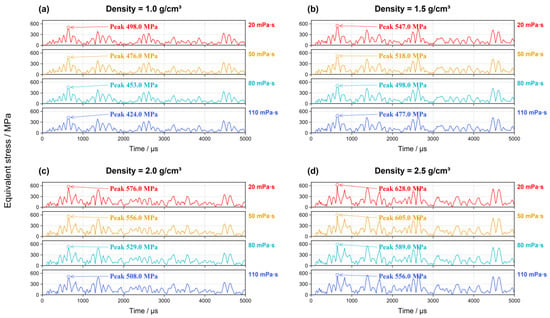
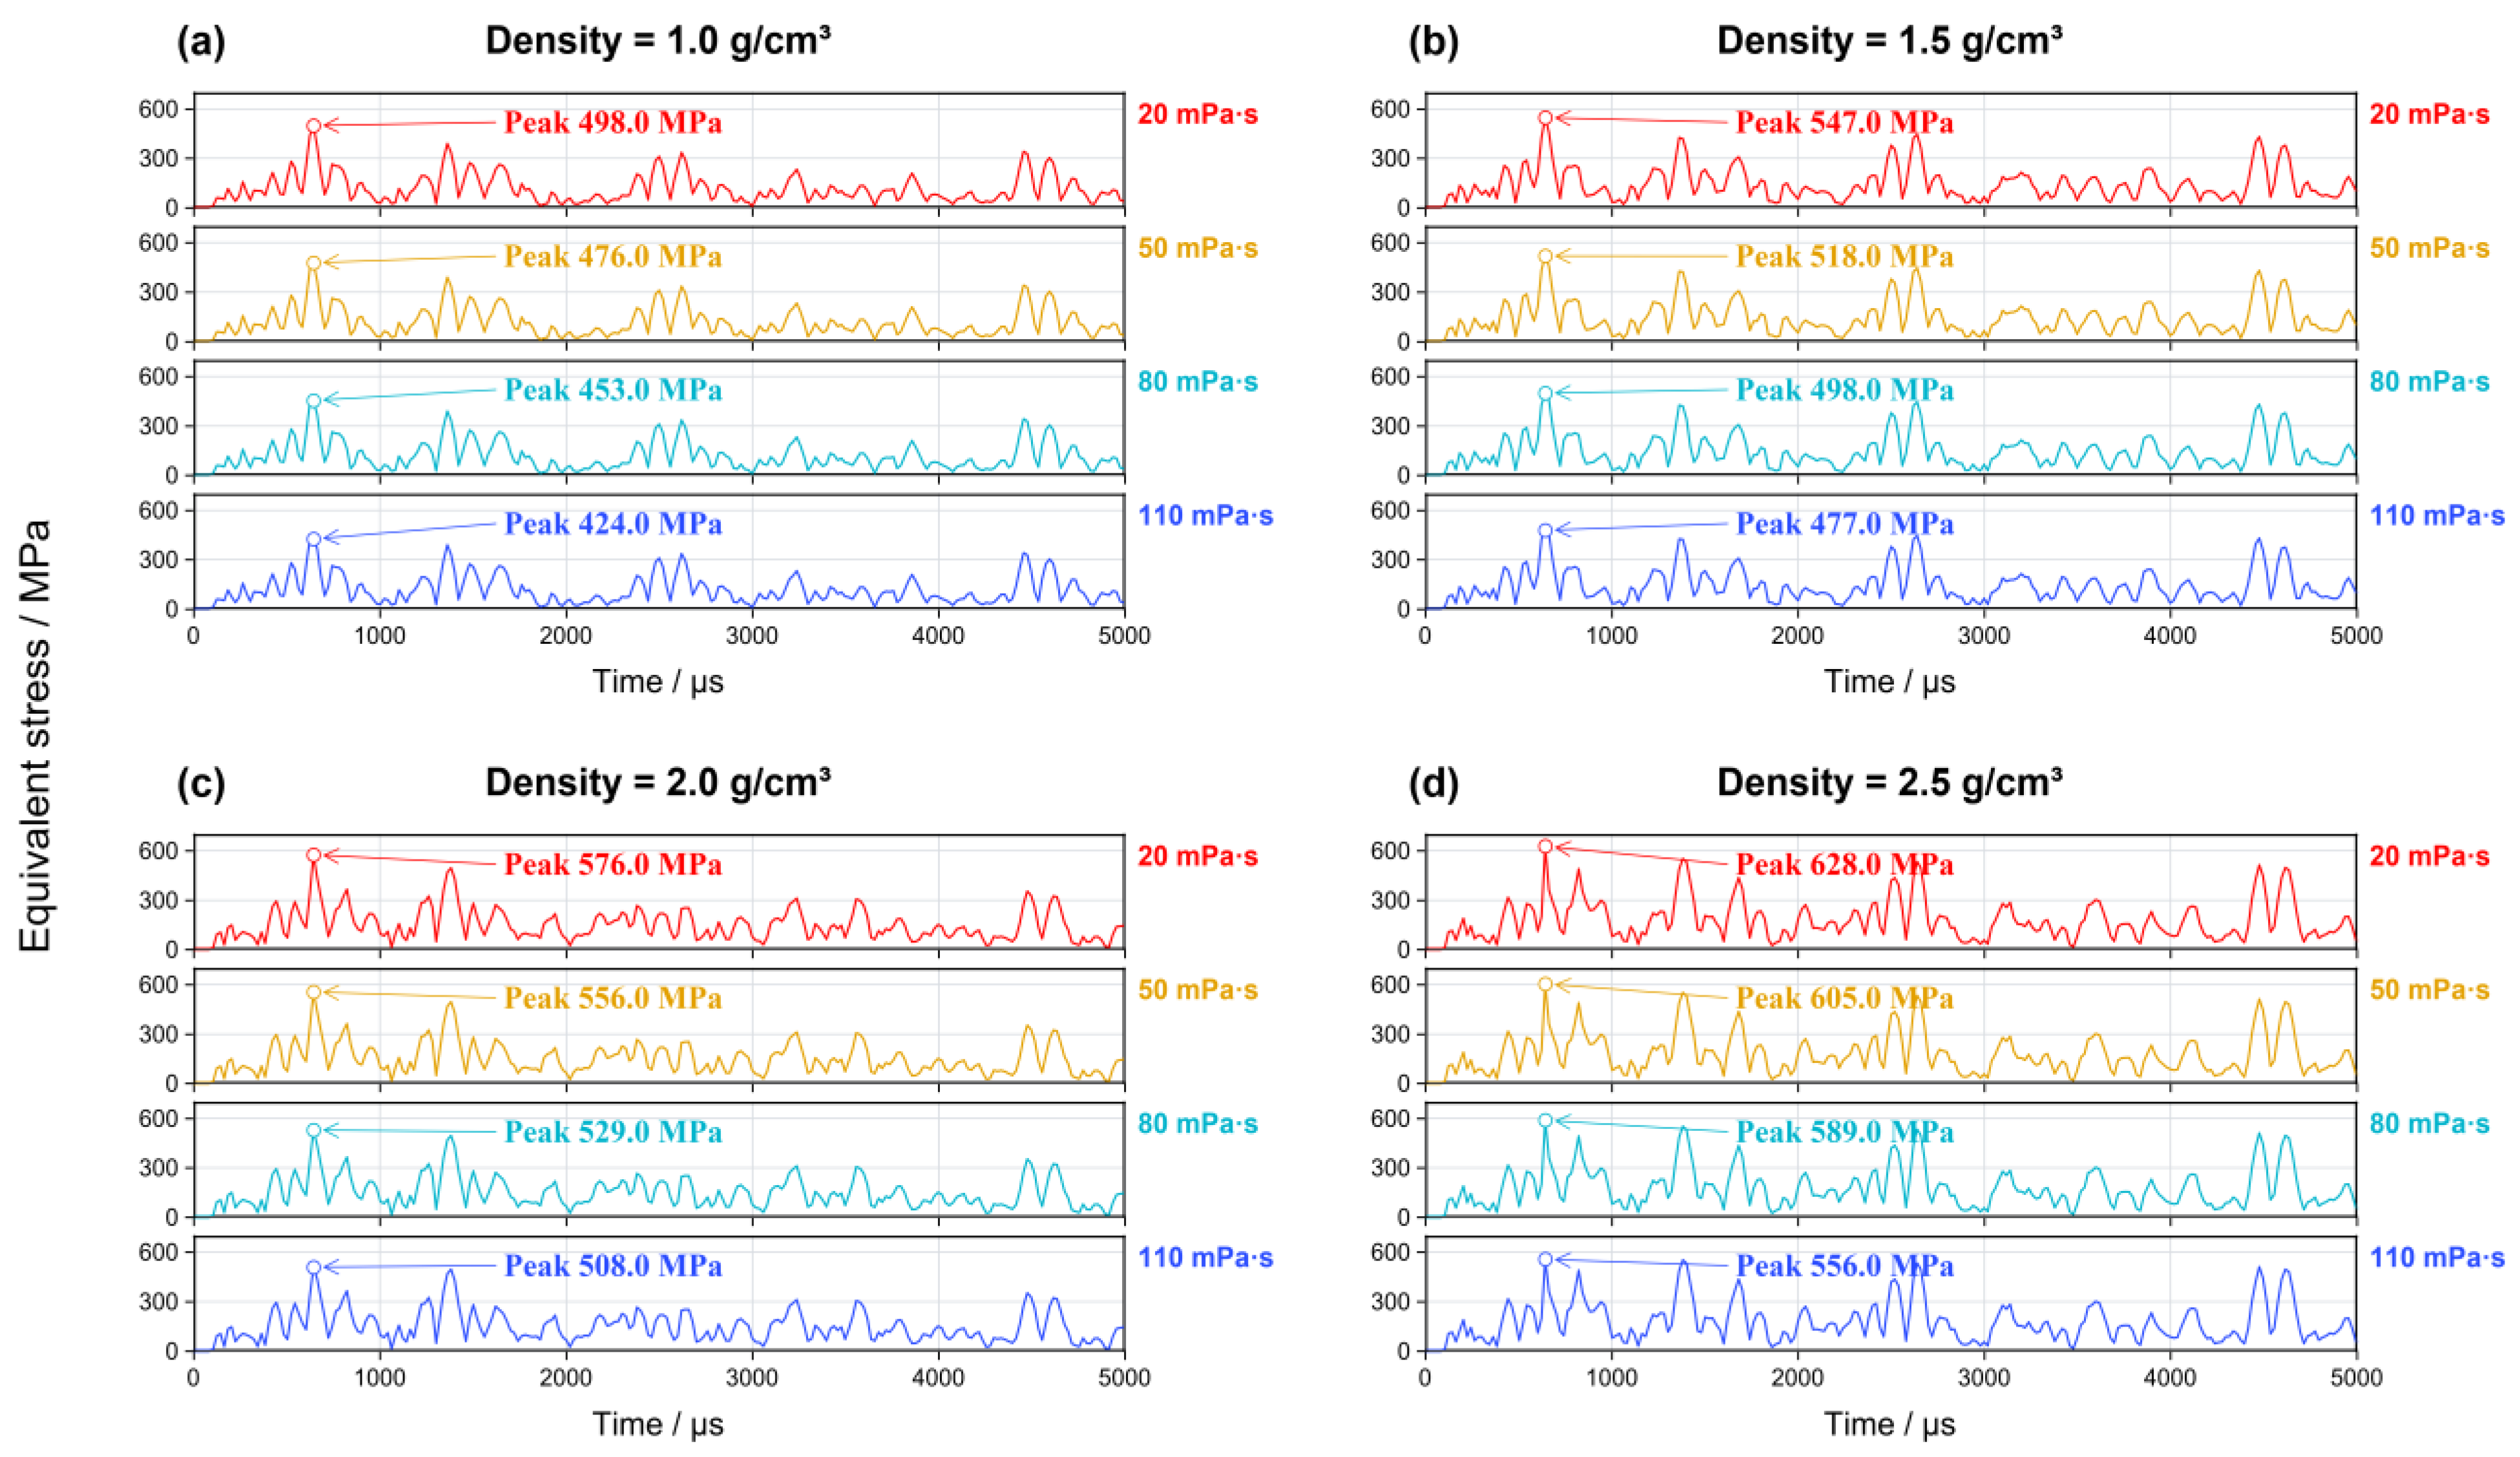
Figure 12 compares the equivalent-stress histories across viscosity levels. The principal peak occurred at 640 µs. At densities of 1.0, 1.5, 2.0, and 2.5 g/cm3, the peak-stress ranges across 20–110 mPa·s were 424–498, 477–547, 508–576, and 556–628 MPa, respectively. Table 11 summarizes the peaks. Raising the viscosity from 20 to 110 mPa·s lowered the selected element’s peak stress by 68–74 MPa, or 11.46–14.86%, across the four density levels. Across all cases, the peak von Mises equivalent stress decreased moderately with increasing viscosity.
Figure 12.
Effect of perforating-fluid viscosity on tubing-string equivalent-stress histories at different densities: (a) 1.0 g/cm3; (b) 1.5 g/cm3; (c) 2.0 g/cm3; (d) 2.5 g/cm3. Density and peak values are indicated; the vertical and horizontal axes show equivalent stress (MPa) and time (µs), respectively.
Table 11.
Peak tubing equivalent stress at different fluid viscosities.
Figure 11 and Figure 12, together with Table 10 and Table 11, show that peak equivalent stress rose with the density at a fixed viscosity and declined moderately with the viscosity at a fixed density. Across the studied ranges, the density-associated peak-stress difference was 129–136 MPa, exceeding the 68–74 MPa difference associated with viscosity. Thus, the peak stress was more responsive to the specified change in density than to the specified change in viscosity.
Table 12 summarizes the effects of the perforating-fluid density and viscosity on the peak axial displacement, axial acceleration, and von Mises equivalent stress of the tubing string. Within the investigated parameter ranges, increasing the fluid density from 1.0 to 2.5 g/cm3 produced the largest relative increase in the peak axial displacement (118.44–125.13%), while the increases in the peak axial acceleration and equivalent stress were smaller. In contrast, increasing the viscosity from 20 to 110 mPa·s resulted in the largest relative reduction in the peak axial acceleration (45.56–46.45%), with smaller reductions in the peak axial displacement and equivalent stress. These results indicate that changes in the perforating-fluid density and viscosity affect the tubing string’s dynamic response metrics to different extents. Specifically, increasing the density has a more pronounced relative effect on the peak axial displacement, whereas increasing the viscosity has a stronger relative effect on reducing the peak axial acceleration.
Table 12.
Changes in peak tubing response across the studied perforating-fluid property ranges.
5.3. Local Reference Yield Safety Factor
For P110 steel with a yield strength of s = 758.00 MPa, the safety factor at the monitoring location was calculated using Equation (7).
Here, s is the tubing-material yield strength used for assessment (MPa), vm,max is the maximum equivalent stress of the monitored element within the simulation time window (MPa), and n is the local reference yield safety factor.
As shown in Table 13, the local reference yield safety factors for the 16 cases ranged from 1.21 to 1.79. At 2.5 g/cm3 and 20 mPa·s, the peak equivalent stress in the monitored element was 628 MPa, giving a local safety factor of 1.21. The safety factor decreased with the density at fixed viscosity and increased moderately with the viscosity at a fixed density.
Table 13.
Local reference yield safety factors for the fluid-property cases.
5.4. Scope and Limitations
This study used a 1000 mm quarter-symmetry model and evaluated local responses over 0–5000 µs. All 16 cases shared an initial wellbore pressure of 96 MPa and fixed values for the other fluid equation-of-state parameters. The perforating fluid was modeled as Newtonian, and the dynamic viscosity was held constant within each simulation case. The safety factor calculated from the equivalent stress serves as a local reference indicator for the selected tubing element near the packer and does not represent the minimum safety factor of the entire tubing string. Comparisons among models of different lengths showed that the axial truncation affects the predicted peak pressure and structural response. The model does not account for asymmetric jet formation, casing penetration, cavitation, or temperature-dependent variations in the fluid properties. Mesh refinement comparisons indicated that the reported peak responses were relatively insensitive to further mesh refinement. Therefore, the findings should be interpreted as trends specific to the present numerical model and may provide a basis for future studies on perforating-fluid selection. Temperature-field studies such as Ilyushin and Novozhilov [34] provide context for extending future models to coupled thermal effects.
6. Conclusions
Using identical geometry, charge mass, initial pressure (96 MPa), and boundary conditions, we analyzed 16 density–viscosity combinations with the coupled S-ALE model and compared their effects on the local tubing axial motion, stress, and reference yield margin. The main conclusions are as follows:
(1) In the baseline case, the pressure at the perforating-fluid monitoring point ranged from 14.50 to 321.75 MPa. Strong initial fluctuations were followed by decaying oscillations around the prescribed initial pressure.
(2) Increasing the density from 1.0 to 2.5 g/cm3 raised the peak axial displacement, axial acceleration, and equivalent stress by 118.44–125.13%, 58.89–60.66%, and 26.10–31.13%, respectively. The density affects both the fluid inertia and pressure-wave load transfer, which jointly influence the structural response. Across the studied property ranges, the absolute peak-stress difference associated with the density exceeded that associated with the viscosity.
(3) Increasing the viscosity from 20 to 110 mPa·s reduced the peak axial displacement, axial acceleration, and equivalent stress by 10.09–24.53%, 45.56–46.45%, and 11.46–14.86%, respectively. The relative reduction was greatest for acceleration, indicating that the viscosity changes affected rapid motion and local stress to different degrees within these cases.
(4) The coupled S-ALE model and 4 × 4 property matrix allowed the local axial motion, equivalent stress, and reference yield margin to be compared under consistent loading and boundary conditions. Safety factors at the selected stress-monitoring element ranged from 1.21 to 1.79. The results indicate that, within the specified ranges, a lower fluid density and higher viscosity are favorable for reducing the local tubing string’s dynamic response predicted by the present model. In practice, a lower density may reduce the hydrostatic well-control margin. These findings suggest that the appropriate adjustment of perforating-fluid properties may help mitigate perforation-induced dynamic loading on the tubing string under the modeled conditions. Future work should examine full-length tubing strings, asymmetric perforating geometries, temperature- and pressure-dependent fluid properties, and validation against experimental or field measurements under matched conditions.
Author Contributions
Conceptualization, S.Y. and Y.D.; methodology, S.Y. and Y.R.; software, S.Y. and Y.R.; validation, Y.R., Z.N. and W.Z.; formal analysis, S.Y. and Z.N.; investigation, W.Z.; resources, Y.D., W.Z. and Z.N.; data curation, S.Y. and Y.R.; writing—original draft preparation, S.Y.; writing—review and editing, S.Y., Y.R. and Y.D.; visualization, W.Z.; supervision, Z.N.; project administration, Y.D.; funding acquisition, Y.D. All authors have read and agreed to the published version of the manuscript.
Funding
This research was funded by the National Natural Science Foundation of China, grant number 51374171. The APC was funded by the same grant.
Data Availability Statement
The original contributions presented in this study are included in the article. Further inquiries can be directed to the corresponding author.
Conflicts of Interest
Author Yiwu Rao was employed by the China National Logging Corporation. Author Wei Zhang was employed by the PetroChina Tarim Oilfield Company. Author Zhanshan Niu was employed by the Well Testing Company of CNPC Xibu Drilling Engineering Company Limited. The remaining authors declare that the research was conducted in the absence of any commercial or financial relationships that could be construed as a potential conflict of interest.
References
- Deng, Q.; Zhang, H.; Li, J.; Hou, X.; Wang, H. Study of downhole shock loads for ultra-deep well perforation and optimization measures. Energies 2019, 12, 2743. [Google Scholar] [CrossRef] [Scilit]
- Dou, Y.; Xu, A.; Zhang, F.; Zhang, S. Remarks on problems with formation testing and well completion of high-pressure and high-temperature deep holes. China Pet. Mach. 2008, 36, 140–142. (In Chinese) [Google Scholar] [CrossRef]
- Chen, H.; Chen, F.; Tang, K.; Ma, F.; Chen, J.; Li, B. Dynamic mechanical study on reservoir casing perforation progress. Well Logging Technol. 2016, 40, 650–653, 658. (In Chinese) [Google Scholar] [CrossRef]
- Dou, Y.; Rao, Y.; Li, M.; Zhang, W.; Zhu, S.; Liang, J. Pressure pulsation of perforating fluid and string stress in filling perforating gun. China Pet. Mach. 2025, 53, 56–63. (In Chinese) [Google Scholar] [CrossRef]
- Liu, J.; Guo, X.; Liu, Z.; Liu, X.; Liu, Q. Pressure field investigation into oil&gas wellbore during perforating shaped charge explosion. J. Pet. Sci. Eng. 2019, 172, 1235–1247. [Google Scholar] [CrossRef] [Scilit]
- Deng, Q.; Zhang, H.; Chen, A.; Li, J.; Hou, X.; Wang, H. Effects of perforation fluid movement on downhole packer with shock loads. J. Pet. Sci. Eng. 2020, 195, 107566. [Google Scholar] [CrossRef] [Scilit]
- Zhang, K.; Zhang, H.; Nie, J.; Deng, Q.; Jiang, J.; He, H. Research on a model for predicting perforating shock loads by numerical simulation in oil and gas wells. Processes 2025, 13, 2556. [Google Scholar] [CrossRef] [Scilit]
- Chen, H.; Yang, D.; Ye, Z.; Luo, M.; Nie, H.; Ma, Z. Analysis and practice of influence of perforation fluid density and pressure change on TCP positioning depth. Drill. Prod. Technol. 2022, 45, 175–178. (In Chinese) [Google Scholar] [CrossRef]
- Zhao, X.; Liu, G.; Zhang, T. Movement mechanism of control fluid in propellant perforation under the action of downhole high-pressure gas. Acta Pet. Sin. 2009, 30, 295–299. (In Chinese) [Google Scholar] [CrossRef]
- Baumann, C.; Lazaro, A.; Valdivia, P.; Williams, H.; Stecchini, P. Perforating gunshock loads—Prediction and mitigation. In Proceedings of the SPE/IADC Drilling Conference and Exhibition, Amsterdam, The Netherlands, 5–7 March 2013. SPE-163549-MS. [Google Scholar] [CrossRef] [Scilit]
- Baumann, C.E.; Guerra, J.P.; William, A.; Williams, H.A. Reduction of perforating gunshock loads. SPE Drill. Complet. 2012, 27, 65–74. [Google Scholar] [CrossRef] [Scilit]
- Baumann, C.; Barnard, K.; Williams, H. Gunshock risk evaluation when perforating high pressure wells. In Proceedings of the SPE Annual Technical Conference and Exhibition, San Antonio, TX, USA, 8–10 October 2012. SPE-159119-MS. [Google Scholar] [CrossRef] [Scilit]
- Baumann, C.; Brinsden, M. Perforating gunshock loads: Simulation and optimization in 2014. In Proceedings of the IADC/SPE Asia Pacific Drilling Technology Conference, Bangkok, Thailand, 25–27 August 2014. SPE-170552-MS. [Google Scholar] [CrossRef] [Scilit]
- Jia, X.-Y.; Lu, X.; Tang, K.; Ma, F. Simulation research into dynamic response of perforating gun with gunshock loads. Trans. Beijing Inst. Technol. 2015, 35, 83–85, 89. (In Chinese) [Google Scholar] [CrossRef]
- Tang, K.; Chen, J.; Zhang, Q.; Ma, F.; Yang, D. Analysis and application of casing structural strength response of transverse perforation. Well Logging Technol. 2017, 41, 485–489. (In Chinese) [Google Scholar] [CrossRef]
- Mao, L.; He, X.; Zhang, J. Dynamic behavior and failure analysis of perforating string under explosive load. Eng. Fail. Anal. 2022, 136, 106222. [Google Scholar] [CrossRef] [Scilit]
- Liu, J.; Jian, Y.; Chen, Y.; Tang, K.; Ren, G.; Chen, J. Shock vibration response characteristic of perforating tubing string in ultra-deep wells. Geoenergy Sci. Eng. 2023, 228, 212008. [Google Scholar] [CrossRef] [Scilit]
- Liu, J.; Guo, X.; He, Y.; Tang, K.; Wang, G.; Zhong, C. A 3D impact dynamic model for perforated tubing string in curved wells. Appl. Math. Model. 2021, 90, 217–239. [Google Scholar] [CrossRef] [Scilit]
- Yang, D.; Deng, Q.; Yuan, M.; Cui, G.; Fan, D.; Jia, B. Safety evaluation of perforated string by simulation modeling and mechanics analysis under shock loading. Appl. Sci. 2025, 15, 7249. [Google Scholar] [CrossRef] [Scilit]
- Deng, Q.; Jiang, J.; Yang, D.; Han, H.; Qi, G. Dynamic analysis and optimization of perforated tubing strings in deep-water wells under diverse operating conditions. Ocean Eng. 2025, 322, 120535. [Google Scholar] [CrossRef] [Scilit]
- Xi, Y.; Sun, W.; Feng, J.; Li, Y.; Jiang, H. Numerical simulation on the dynamic damage evolution law of wellbore bonding interfaces during perforating operation. Appl. Sci. 2025, 15, 11475. [Google Scholar] [CrossRef] [Scilit]
- Liu, S.; Fan, J.; Li, L.; Yang, J.; Lei, P.; Wu, T. Dynamic finite element simulation of perforating jet penetrating perforating gun and casing. Well Test. 2025, 34, 22–30. (In Chinese) [Google Scholar] [CrossRef]
- Liu, W. Safety Evaluation of Perforated Section String Strength Based on SPH Method. Master’s Thesis, Xi’an Shiyou University, Xi’an, China, 2023. (In Chinese) [Google Scholar] [CrossRef]
- Dou, Y.; Xu, H.; Li, M. ALE simulation of ultra deep downhole perforating projectile penetrating super strong sandstone. Chin. J. Appl. Mech. 2022, 39, 901–907. (In Chinese) [Google Scholar] [CrossRef]
- Wang, X. Consider Complex Boundary Injection Fluid and Injection Section Pipe Column Flow-Solid Coupling Analysis. Master’s Thesis, Xi’an Shiyou University, Xi’an, China, 2023. (In Chinese) [Google Scholar] [CrossRef]
- Zhang, L.; Xie, X.; Zhong, M.; Ma, H.Y.; Yang, G. The distribution of shock wave load from a shallow underwater explosion with inline charge. J. Ordnance Equip. Eng. 2024, 45, 149–160. (In Chinese) [Google Scholar] [CrossRef]
- Tian, X.; Zhao, S.; Liang, Z.; Xiong, F.; Xu, X.; Li, Q.; Guo, Y. Numerical simulation of shaped jet penetrating granite based on S-ALE method. J. Ordnance Equip. Eng. 2025, 46, 123–130, 147. (In Chinese) [Google Scholar] [CrossRef]
- Li, M.; Dou, Y.; Cao, Y.; Yu, Y.; Cao, T. Analysis of perforation liquid pressure pulsation law considering complex boundary conditions at the bottom of a well. J. Vib. Shock 2019, 38, 189–196. (In Chinese) [Google Scholar] [CrossRef]
- Li, M.; Xu, F.; Dou, Y. Measurement of perforating column vibration parameters and ALE-based numerical simulation. Chin. J. Appl. Mech. 2019, 36, 458–465. (In Chinese) [Google Scholar] [CrossRef]
- Tang, M.; Li, H.; He, S.; Miao, J.; Huang, B.; He, L.; Zhou, X. Research and development of high-performance section milling tool for Φ139.7-mm casing. Arab. J. Sci. Eng. 2022, 47, 12205–12222. [Google Scholar] [CrossRef] [Scilit]
- Tang, G.; Liu, Q.; Li, X.; Ding, L.; Zhang, L.; Yang, X.; Gong, H. Influence of carbide tooth grinding parameters on shaping efficiency of high steel grade tubing. E3S Web Conf. 2024, 573, 01009. [Google Scholar] [CrossRef] [Scilit]
- Liu, Y.; Yin, J.; Wang, Z.; Zhang, X.; Bi, G. The EFP formation and penetration capability of double-layer shaped charge with wave shaper. Materials 2020, 13, 4519. [Google Scholar] [CrossRef] [Scilit] [PubMed]
- Jiang, J.; Deng, Q.; Yang, D.; Qi, G.; Zhang, F.; Tan, L. Numerical simulation study on the damage mechanism of the combined perforating well testing tubing in ultra-deep wells. Processes 2024, 12, 380. [Google Scholar] [CrossRef] [Scilit]
- Ilyushin, Y.V.; Novozhilov, I.M. Temperature field control of a metal oil-well tubing for producing of high-paraffin oil. In Proceedings of the 2020 XXIII International Conference on Soft Computing and Measurements (SCM), St. Petersburg, Russia, 5–7 May 2020; pp. 149–152. [Google Scholar] [CrossRef] [Scilit]

Disclaimer/Publisher’s Note: The statements, opinions and data contained in all publications are solely those of the individual author(s) and contributor(s) and not of MDPI and/or the editor(s). MDPI and/or the editor(s) disclaim responsibility for any injury to people or property resulting from any ideas, methods, instructions or products referred to in the content. |
© 2026 by the authors. Licensee MDPI, Basel, Switzerland. This article is an open access article distributed under the terms and conditions of the Creative Commons Attribution (CC BY) license.